Article

Identification of Water Contamination Sources Using Hydrochemical and Isotopic Studies—The Kozłowa Góra Reservoir Catchment Area (Southern Poland)

by
Kinga Ślósarczyk
*,
Sabina Jakóbczyk-Karpierz
and
Andrzej Jarosław Witkowski
Institute of Earth Sciences, Faculty of Natural Sciences, University of Silesia in Katowice, 60 Będzińska St., 41-200 Sosnowiec, Poland
*
Author to whom correspondence should be addressed.
Water 2022, 14(6), 846; https://doi.org/10.3390/w14060846
Submission received: 31 January 2022 / Revised: 5 March 2022 / Accepted: 7 March 2022 / Published: 8 March 2022

Abstract

:
The application of combined research methods, such as hydrochemical and isotopic analyses, facilitates understanding of the origin of water constituents and migration of contaminants in the aquatic environment. The presented study attempts to identify contamination sources affecting water quality within the Kozłowa Góra reservoir catchment area (southern Poland). A total of 100 water samples were collected from surface water (the Brynica river, streams, and the reservoir) and groundwater (a Quarternary aquifer) in four time periods. During fieldwork, the physicochemical parameters were measured (temperature, pH, electrical conductivity, redox potential, and dissolved oxygen). The chemical analysis included the determination of major ions (HCO3, SO42−, Cl, Ca2+, Mg2+, Na+, and K+), nutrients (NO3, NO2, NH4+, and PO43−), and total organic carbon. The study was complemented by isotopic analysis of sulphur and oxygen in sulphate, which enabled a more precise identification of stressors affecting water quality in different parts of the catchment area. Chemical and isotopic results (δ34S = 4.38–13.99‰; δ18O 3.59–13.30‰) revealed that wastewater discharges and agricultural activities have a significant influence on the chemistry of the Brynica River and other streams. At some sampling points, a lower quality of water was manifested by elevated concentrations of NO3 (up to 22.6 mg/L) and several other ions (e.g., up to 114 mg/L for Cl, up to 51.52 mg/L for NH4+, and 12.5 mg/L for PO43−). The quality of groundwater was deteriorated mainly by infiltration of sewage from leaky septic tanks. The level of groundwater contamination varied depending on the location, as higher concentrations of major ions and values of electrical conductivity were observed in residential areas. The Brynica river, streams, and groundwater recharge the drinking water reservoir, and thus its quality depends on these sources. A dilution of water and the presence of biochemical processes led to a reduction of contaminant concentrations in the Kozłowa Góra reservoir (down to 3.5 mg/L for NO3, 32 mg/L for Cl, 0.21 mg/L for NH4+, and <0.05 mg/L for PO43−) compared to water in the river and streams supplying the reservoir. The study revealed the role of wastewater discharge and agricultural activities in the evolution of surface water chemistry. The results will be used in further research on the origin and migration of other substances in water, including microcontaminants.

1. Introduction

Safeguarding drinking water resources is one of the key roles of local, regional, and national authorities. It is also one of the major concerns when climate change contributes to a drastic decline in quality water supplies. Additionally, the amount of pollution produced by human activities and emitted into the environment continues to increase. This includes microcontaminants in water, which come from various sources, including wastewater discharge [1], application of manure on arable lands [2], leaky sewer systems and septic tanks [3,4], municipal landfills [5], burial sites [6], and several others [7]. Determination of microcontaminants alone is not sufficient to identify contamination sources. Therefore, other methods should be applied simultaneously in order to define microcontaminants’ origin, such as analysis of other constituents in water (e.g., nitrogen compounds [8]) or stable isotope studies [9]. Basic information on chemical composition and water quality is crucial in further research on microcontaminant migration within a study area and interpreting the monitoring results.
Identification of real and potential contamination sources within a catchment area of a drinking water source is of vital importance for proper water management. In agricultural areas, the potential for surface water and groundwater contamination increases compared to other land-use types. Many studies have focused on groundwater and surface water contamination with SO42− and NO3 [10,11,12,13,14,15,16] in rural and urban areas. Their results often reveal a mixed origin of SO42− and NO3 in water samples, including fertilisation, wastewater, and natural sources like dissolution of evaporitic minerals and sulphides. Comprehensive research conducted in catchment areas is the basis for assessing the nature of the threat and its sources [17,18,19]. Isotope investigations are commonly used for areas of mixed land use [15,20,21,22,23]. They allow researchers to distinguish sulphate originating from agricultural sources, such as artificial fertilisers [24,25] and livestock manure [24], from natural sources such as oxidation of sulphides [26,27] or sulphate minerals [28]. Combining research monitoring water quality with isotopic studies often yields good results in separating the influence of different sources or in refining the obtained results when isotopes indicate an ambiguous source of contamination.
The purpose of the presented study was to investigate sources of pollution of the surface water and groundwater in the catchment area of the dam reservoir Kozłowa Góra, which is an important source of potable water in the Upper Silesia, Poland. Potential anthropogenic contamination sources are natural and artificial fertilisers, wastewater, and increased exhaust emissions associated with the airport. A substantial part of the catchment area is used for agriculture (39.5%), which entails fertilisation of crop fields with both manure and fertiliser. Another potential source of pollution is wastewater leaking from septic tanks and sewage pipes, because the study area includes a number of villages characterised by single-family housing. An international airport, “Katowice-Pyrzowice”, located in the centre of the catchment area, is another potential source of water pollution. Spatial variation of water chemistry across the catchment of the Kozłowa Góra reservoir was investigated by studying the chemical parameters (major ions, nutrients, total organic carbon) and stable isotopes of sulphate present in the surface water and groundwater. Similar studies have been conducted, e.g., by [10]. The basic information on chemical composition and water quality will be crucial in further studies on microcontaminants occurring in the water environment, which were the main subject of the performed project [29].

2. Materials and Methods
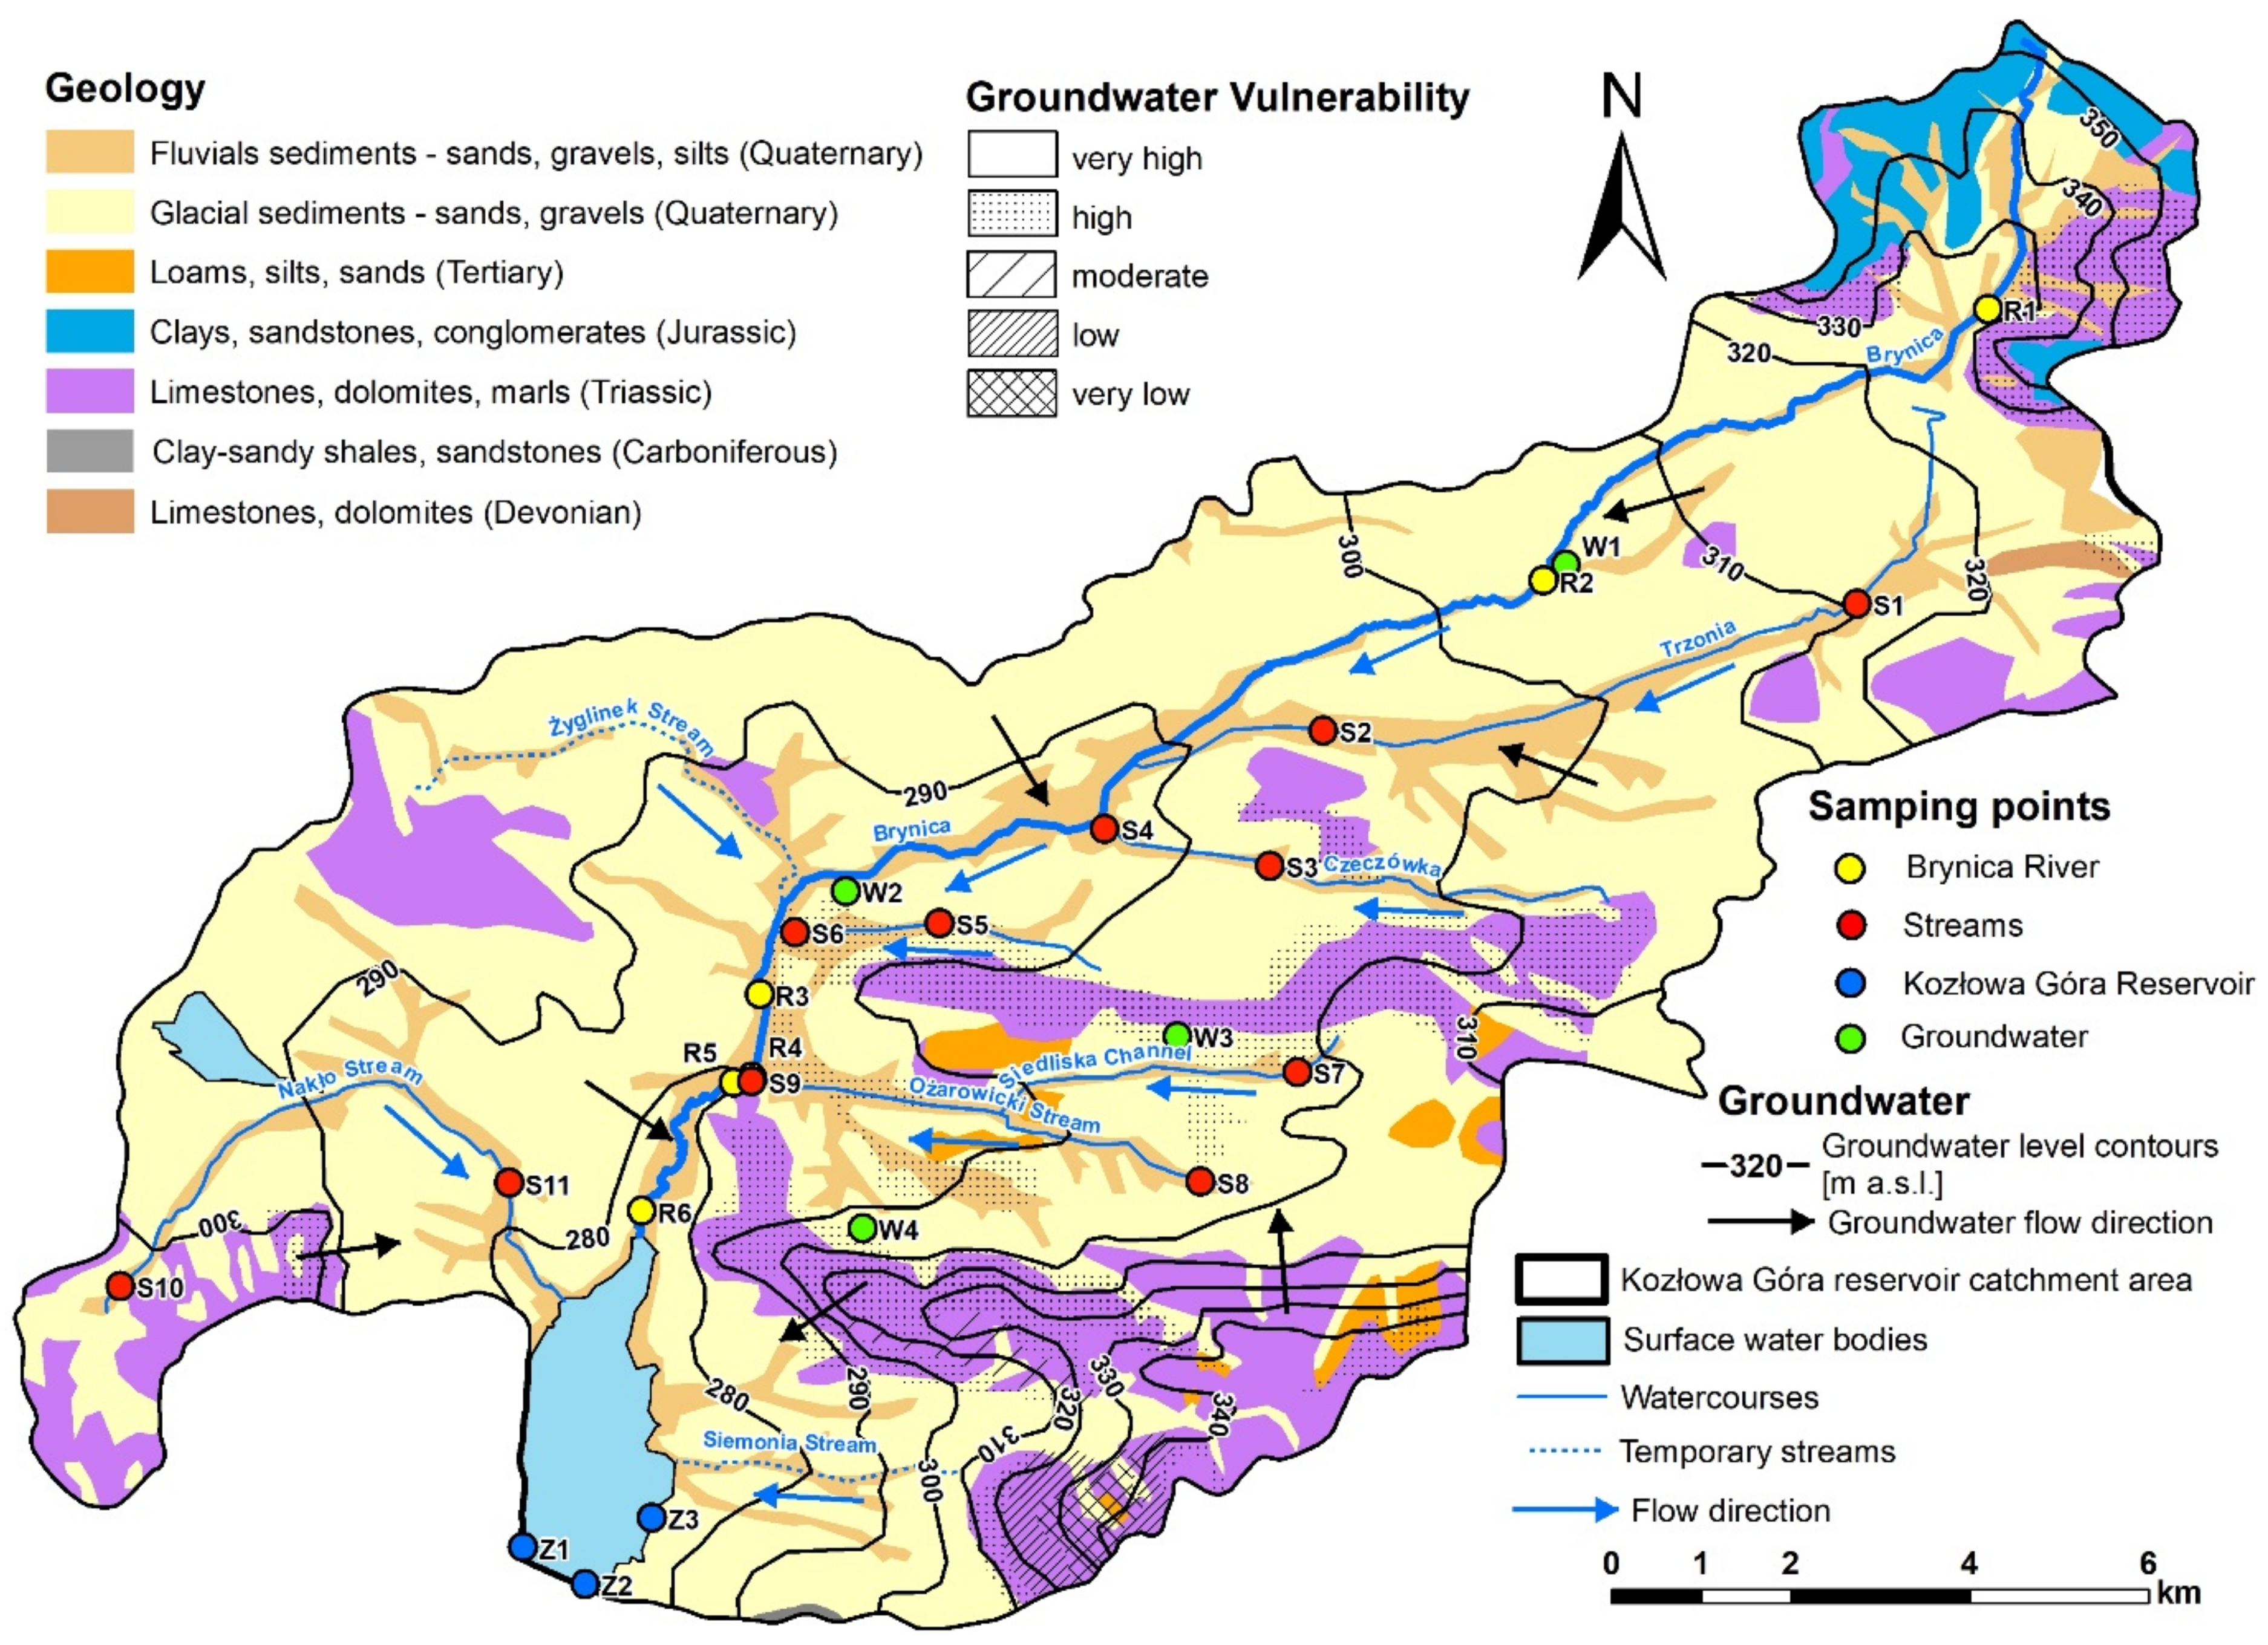
2.1. Study Area

The study was carried out within the catchment area of the Kozłowa Góra reservoir. It is located in southern Poland, in the central part of the Silesian Province (Figure 1). The catchment area covers an area of about 194 km2. In general, five main types of land use can be distinguished, i.e., forests and grassland (approx. 47% of the catchment area), agricultural land (39.5%), artificial surfaces (11%), and water bodies (2.5%). Forests and grassland occur mainly in the eastern and western parts, along the northern boundary and on the west of the Kozłowa Góra reservoir. A significant area is occupied by agricultural land, mainly in the southeast and the northeast. The cultivation of cereals (wheat, rye, oats), rapeseed, and sweetcorn dominates the arable land. Artificial surfaces include the “Katowice-Pyrzowice” airport in the centre-east and residential areas (rural households) situated in the central and south-western areas. The “Katowice-Pyrzowice” airport is one of the largest airports in Poland. In practice, no industrial site is present in the study area. The main water body is the Kozłowa Góra dam reservoir, with a surface area of 5.3 km2 [30].
The Kozłowa Góra reservoir serves as a drinking water supply and flood protection. It is recharged mainly by the Brynica river and its tributaries. Other streams flowing into the reservoir are the Nakło and Siemonia streams, but the latter is a temporary stream. The length of the Brynica river, from its source to the dam reservoir, is approx. 28 km, and its flow rate is 0.5–1.5 m3/s, depending on the season. Apart from the Brynica river, the area is discharged by numerous drainage ditches and Brynica’s tributaries, generally characterised by low flow rates, ranging from several dm3/s in dry seasons to several dozens of dm3/s in wet seasons [33]. The water quality of the Brynica river is of high importance because it is the main river supplying the drinking water reservoir. The chemical composition of Brynica’s water depends on its tributaries; hence other streams must be considered in identifying potential pollution sources.
The area is diversified in terms of geological structure and hydrogeological conditions. Quaternary sediments cover most of the study area and are represented by glacial sands and gravels and fluvial deposits along the watercourses. They form a Quaternary aquifer, discharged by the Brynica river and other streams. Another geological formation within the catchment area is the Triassic multi-aquifer. It consists of two aquifers made up of carbonate deposits (dolomites and limestones) and clastic sediments (gravels and sands underlying the carbonate rocks). Domestic wells draw groundwater from the Quaternary aquifer, the quality of which is affected by anthropogenic activity. Thus, high concentrations of nitrate, sulphate, and chloride are observed locally. The uppermost aquifer is mostly unconfined, and the level of the groundwater table ranges from approx. 280 m a.s.l. in the south to 350 m a.s.l. in the north of the area (Figure 2). Apart from the Quaternary and Triassic deposits, there are also small outcrops of Tertiary, Jurassic, Carboniferous, and Devonian sediments, being of lower significance within the Kozłowa Góra catchment area [34,35,36,37].
Given the land use in the study site, municipal wastewater discharges and farming activities are considered as the main contamination sources of the water environment. There is only one active Wastewater Treatment Plant (“Ożarowice”) in the study area, which has operated since 2015. Treated wastewater from the WWTP “Ożarowice” is discharged to the Brynica river. In the past, prior to the construction of WWTP “Ożarowice”, the WWTP “Pyrzowice” functioned in the south of the airport. Wastewater discharges were directed to the Siedliska channel, which flows to the Ożarowicki stream, i.e., the main tributary of the Brynica. Along with a ditch located on the west of the airport, it is a recipient of stormwater discharges from the airport area. The sewage network is poorly developed in this region; hence, household sewage is mainly directed to septic tanks or, sporadically, directly to watercourses. In the former case, it leads to local groundwater contamination.

2.2. Sampling and Analyses

A total of 100 water samples for chemical and isotopic analyses were taken in June 2020, January 2021, June 2021, and September 2021 within the Kozłowa Góra catchment area. Sampling periods and location of sampling points were selected based on the scope of the microcontaminant monitoring conducted under the same project. Water samples (63) were taken from surface water, including the Brynica river and streams (52) and the Kozłowa Góra drinking water reservoir (11). The Brynica river was sampled at 6 points. Other streams were sampled at 1 or 2 points (Figure 1). Groundwater samples (16) were taken from shallow domestic wells abstracting the Quaternary aquifer. After sampling campaigns, water samples were stored in a cool box at +4 °C and transported to the laboratory for preparation and analysis. All water samples (except for TOC) were filtered through MF-Millipore membrane filters of 0.45 μm pore size.
During fieldwork, the physicochemical parameters of water were measured using portable equipment. Measurements included temperature (T) and pH of water (ELMETRON CP-401), electrical conductivity (EC) (ELMETRON CC-411), redox potential (Eh) (ELMETRON CP-315), and dissolved oxygen (O2) (WTW Oxi 315i). Additionally, inorganic nitrogen compounds were determined in situ using a HACH DR1900 Portable Spectrophotometer. Concentrations of NO3, NO2, and NH4+ were obtained using powder pillows methods for N-NO3 (Cadmium Reduction Method), N-NO2 (USEPA Diazotization Method), and N-NH4 (Salicylate Method).
Each water sample was collected in polyethylene vials of volumes 1000 mL, 500 mL, and 100 mL as well as two 60 mL bottles for chemical analyses. Chemical analyses were performed at an ISO-accredited laboratory, JARS S.A., Poland. Major ions in water comprised HCO3, SO42−, Cl, Ca2+, Mg2+, Na+, and K+. In addition, PO43− and total organic carbon (TOC) were determined. The laboratory methods included titration to the phenolphthalein indicator endpoint (HCO3, based on alkalinity), gravimetric determination in hydrated barium chloride (SO42−), titration with silver nitrate solution in the presence of a potassium chromate indicator (Cl), Inductively Coupled Plasma Optical Emission Spectrometry (ICP-OES; for Ca2+, Mg2+, Na+, and K+), the ammonium molybdate spectrometric method (PO43−), and high-temperature combustion and infrared (IR) detection (TOC). For TOC determination, 60 mL of the samples was acidified by 0.25 mL 18% HCl. Details on precision and detection limits for the applied methods are included in the Supplementary Materials (Table S1).
Isotopic analyses of sulphate were conducted for 15 sampling points, in June 2020, January 2021, and June 2021 (42 samples in total). Surface water samples were taken from 5 points on the Brynica river (R2, R3, R4, R5, and R6), from 5 Brynica tributaries (S4, S6, S7, and S9), from the Nakło stream (S11), and from 3 points at different banks of the Kozłowa Góra reservoir (Z1, Z2, and Z3). The groundwater samples were collected from 2 private wells (W3 and W4). The methodology of SO42− precipitation from water solution was taken in accordance with previous studies, e.g., [21,32]. In order to perform sulphate isotopic analyses, water samples were collected in 1.5 L plastic bottles. After filtration with a 0.45 µm membrane filter, samples were acidified with HCl to a pH around 2. To precipitate BaSO4 for analysis, 10% BaCl2 solution was added. The samples were stored at +4 °C for 24 h. After precipitation of BaSO4, samples were centrifuged to separate the water phase from the precipitate. In order to remove chloride ions, the precipitate was rinsed with distilled water and recentrifuged. The obtained BaSO4 precipitate was dried at +103 °C for 24 h and then placed in 1 mL plastic vials. At least 1.5 mg of BaSO4 was needed for analysis. Isotopic analysis of sulphur and oxygen in sulphate was conducted at the Institute of Geological Sciences, Polish Academy of Sciences, Poland. The analysis was performed using the elemental analysis isotope ratio mass spectrometry (EA-IRMS) method, and the results are presented as δ34SSO4 and δ18OSO4 values.

3. Results

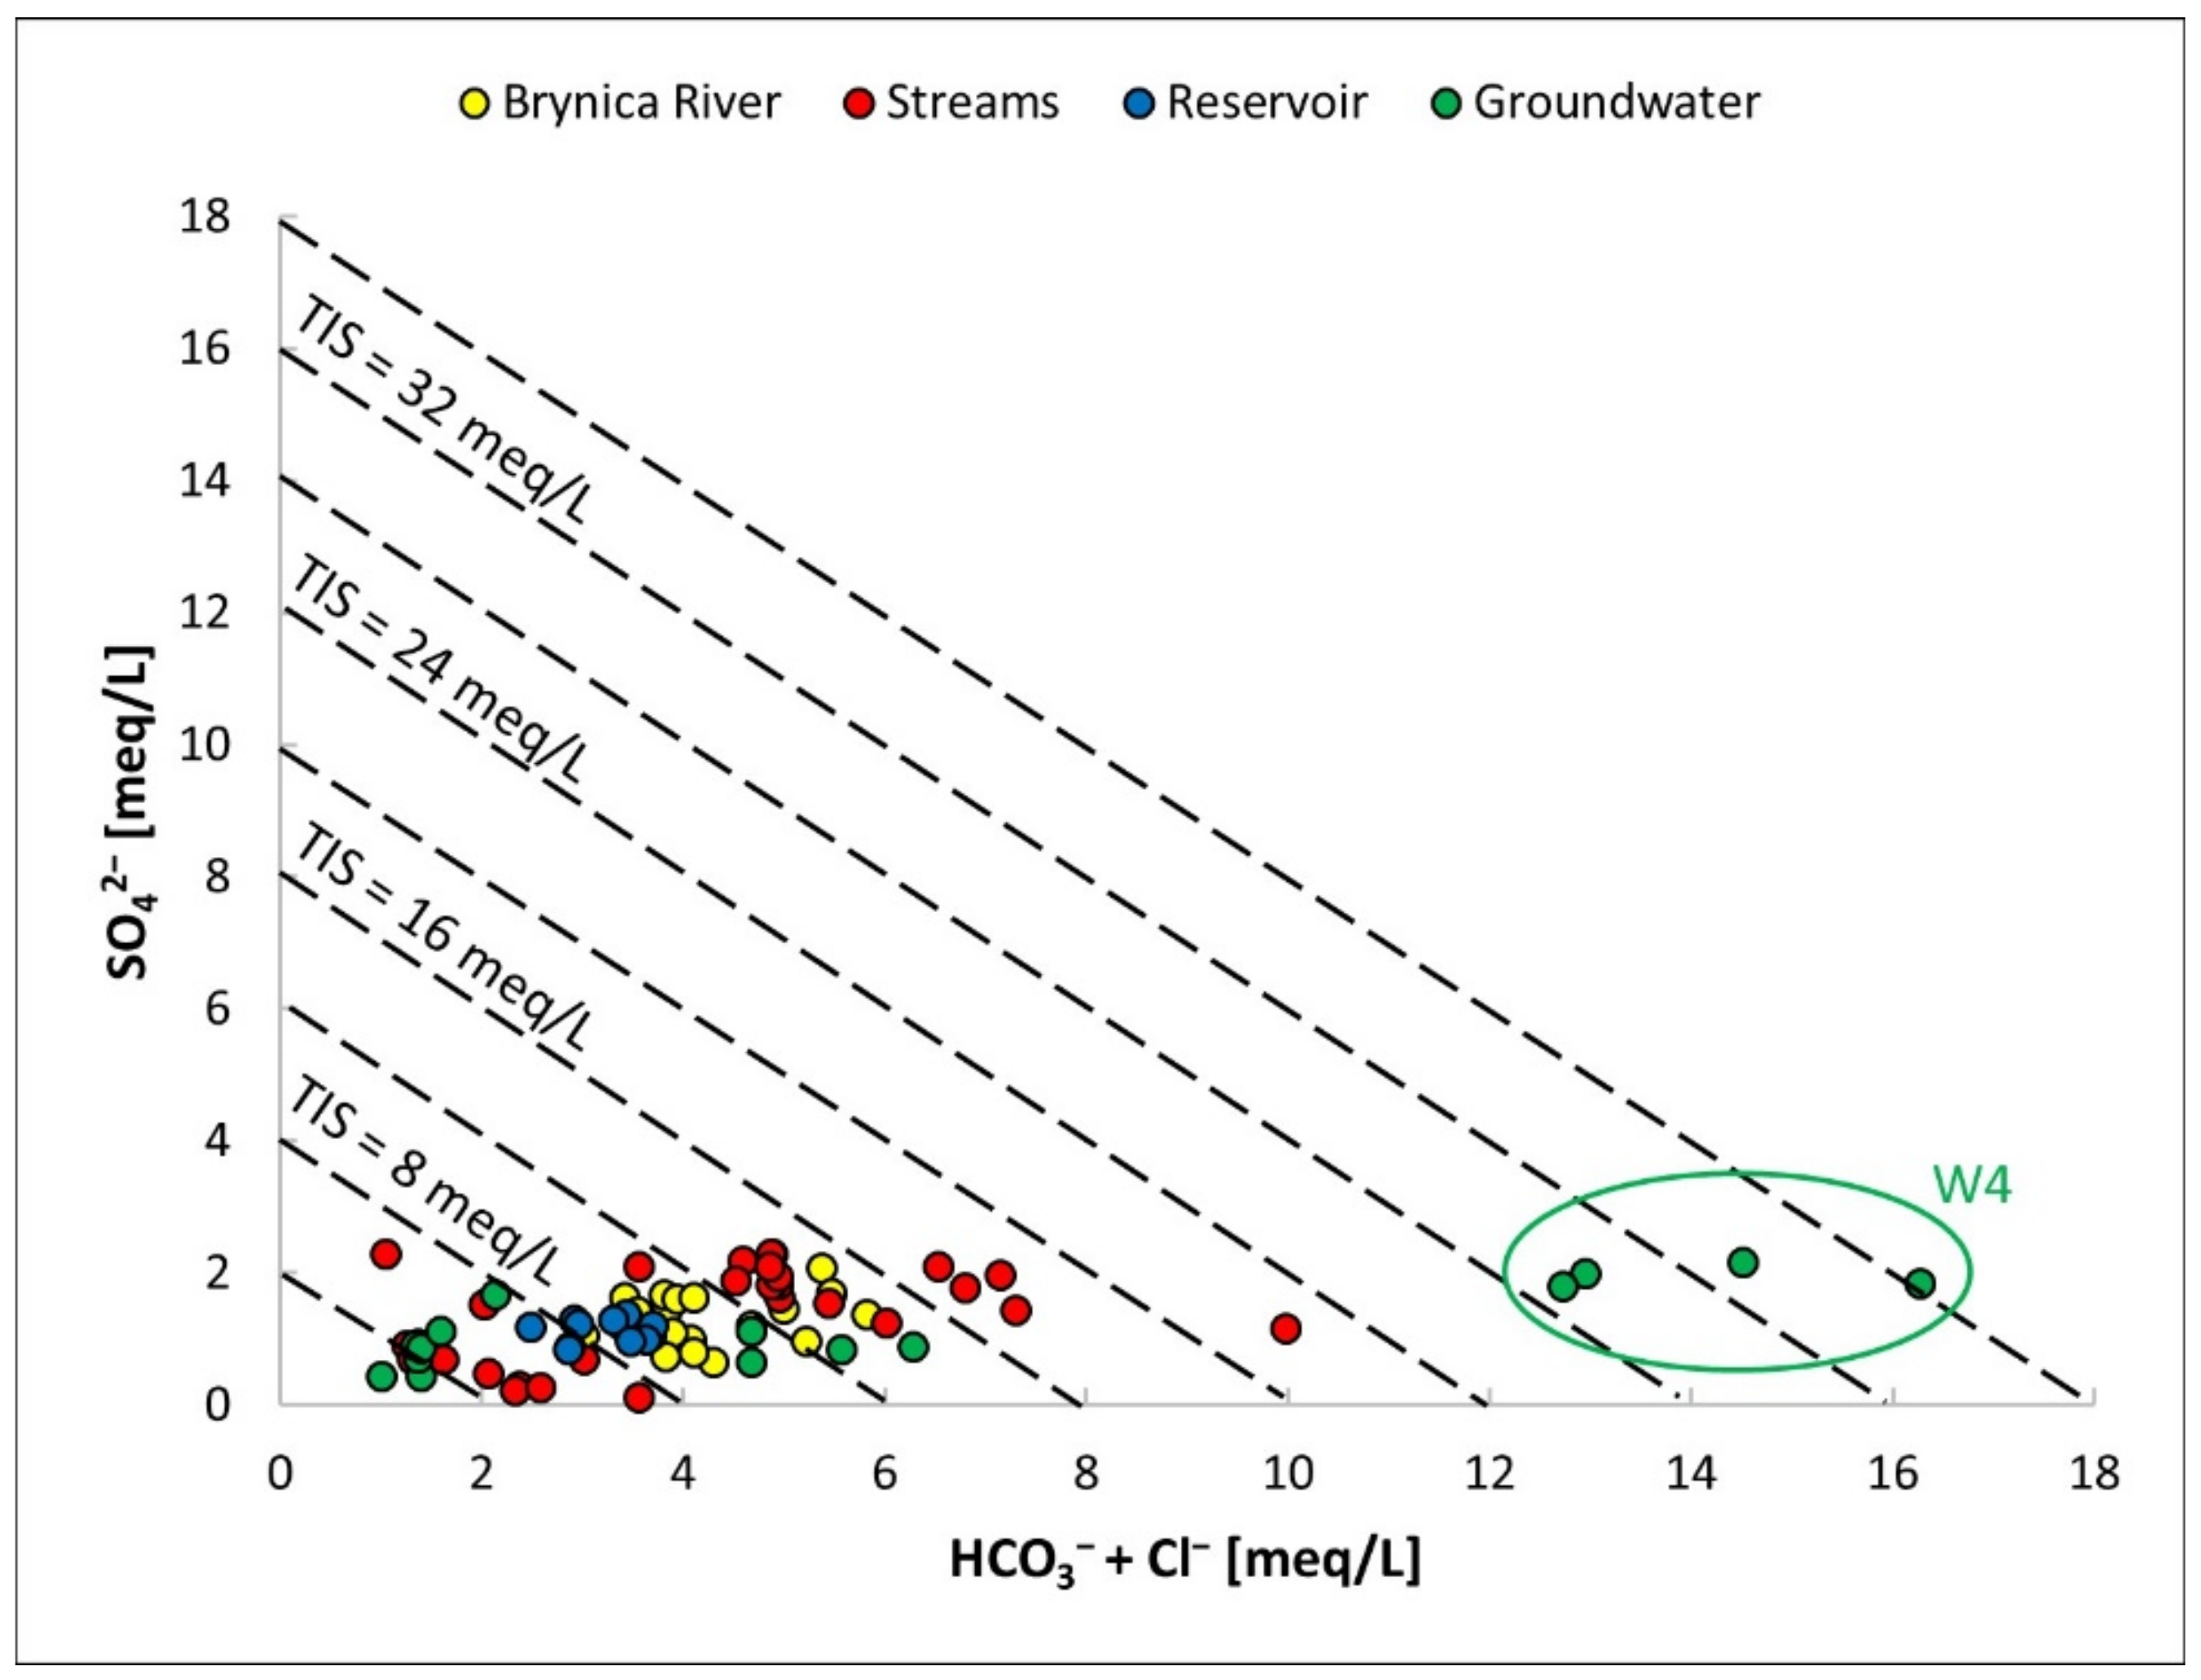
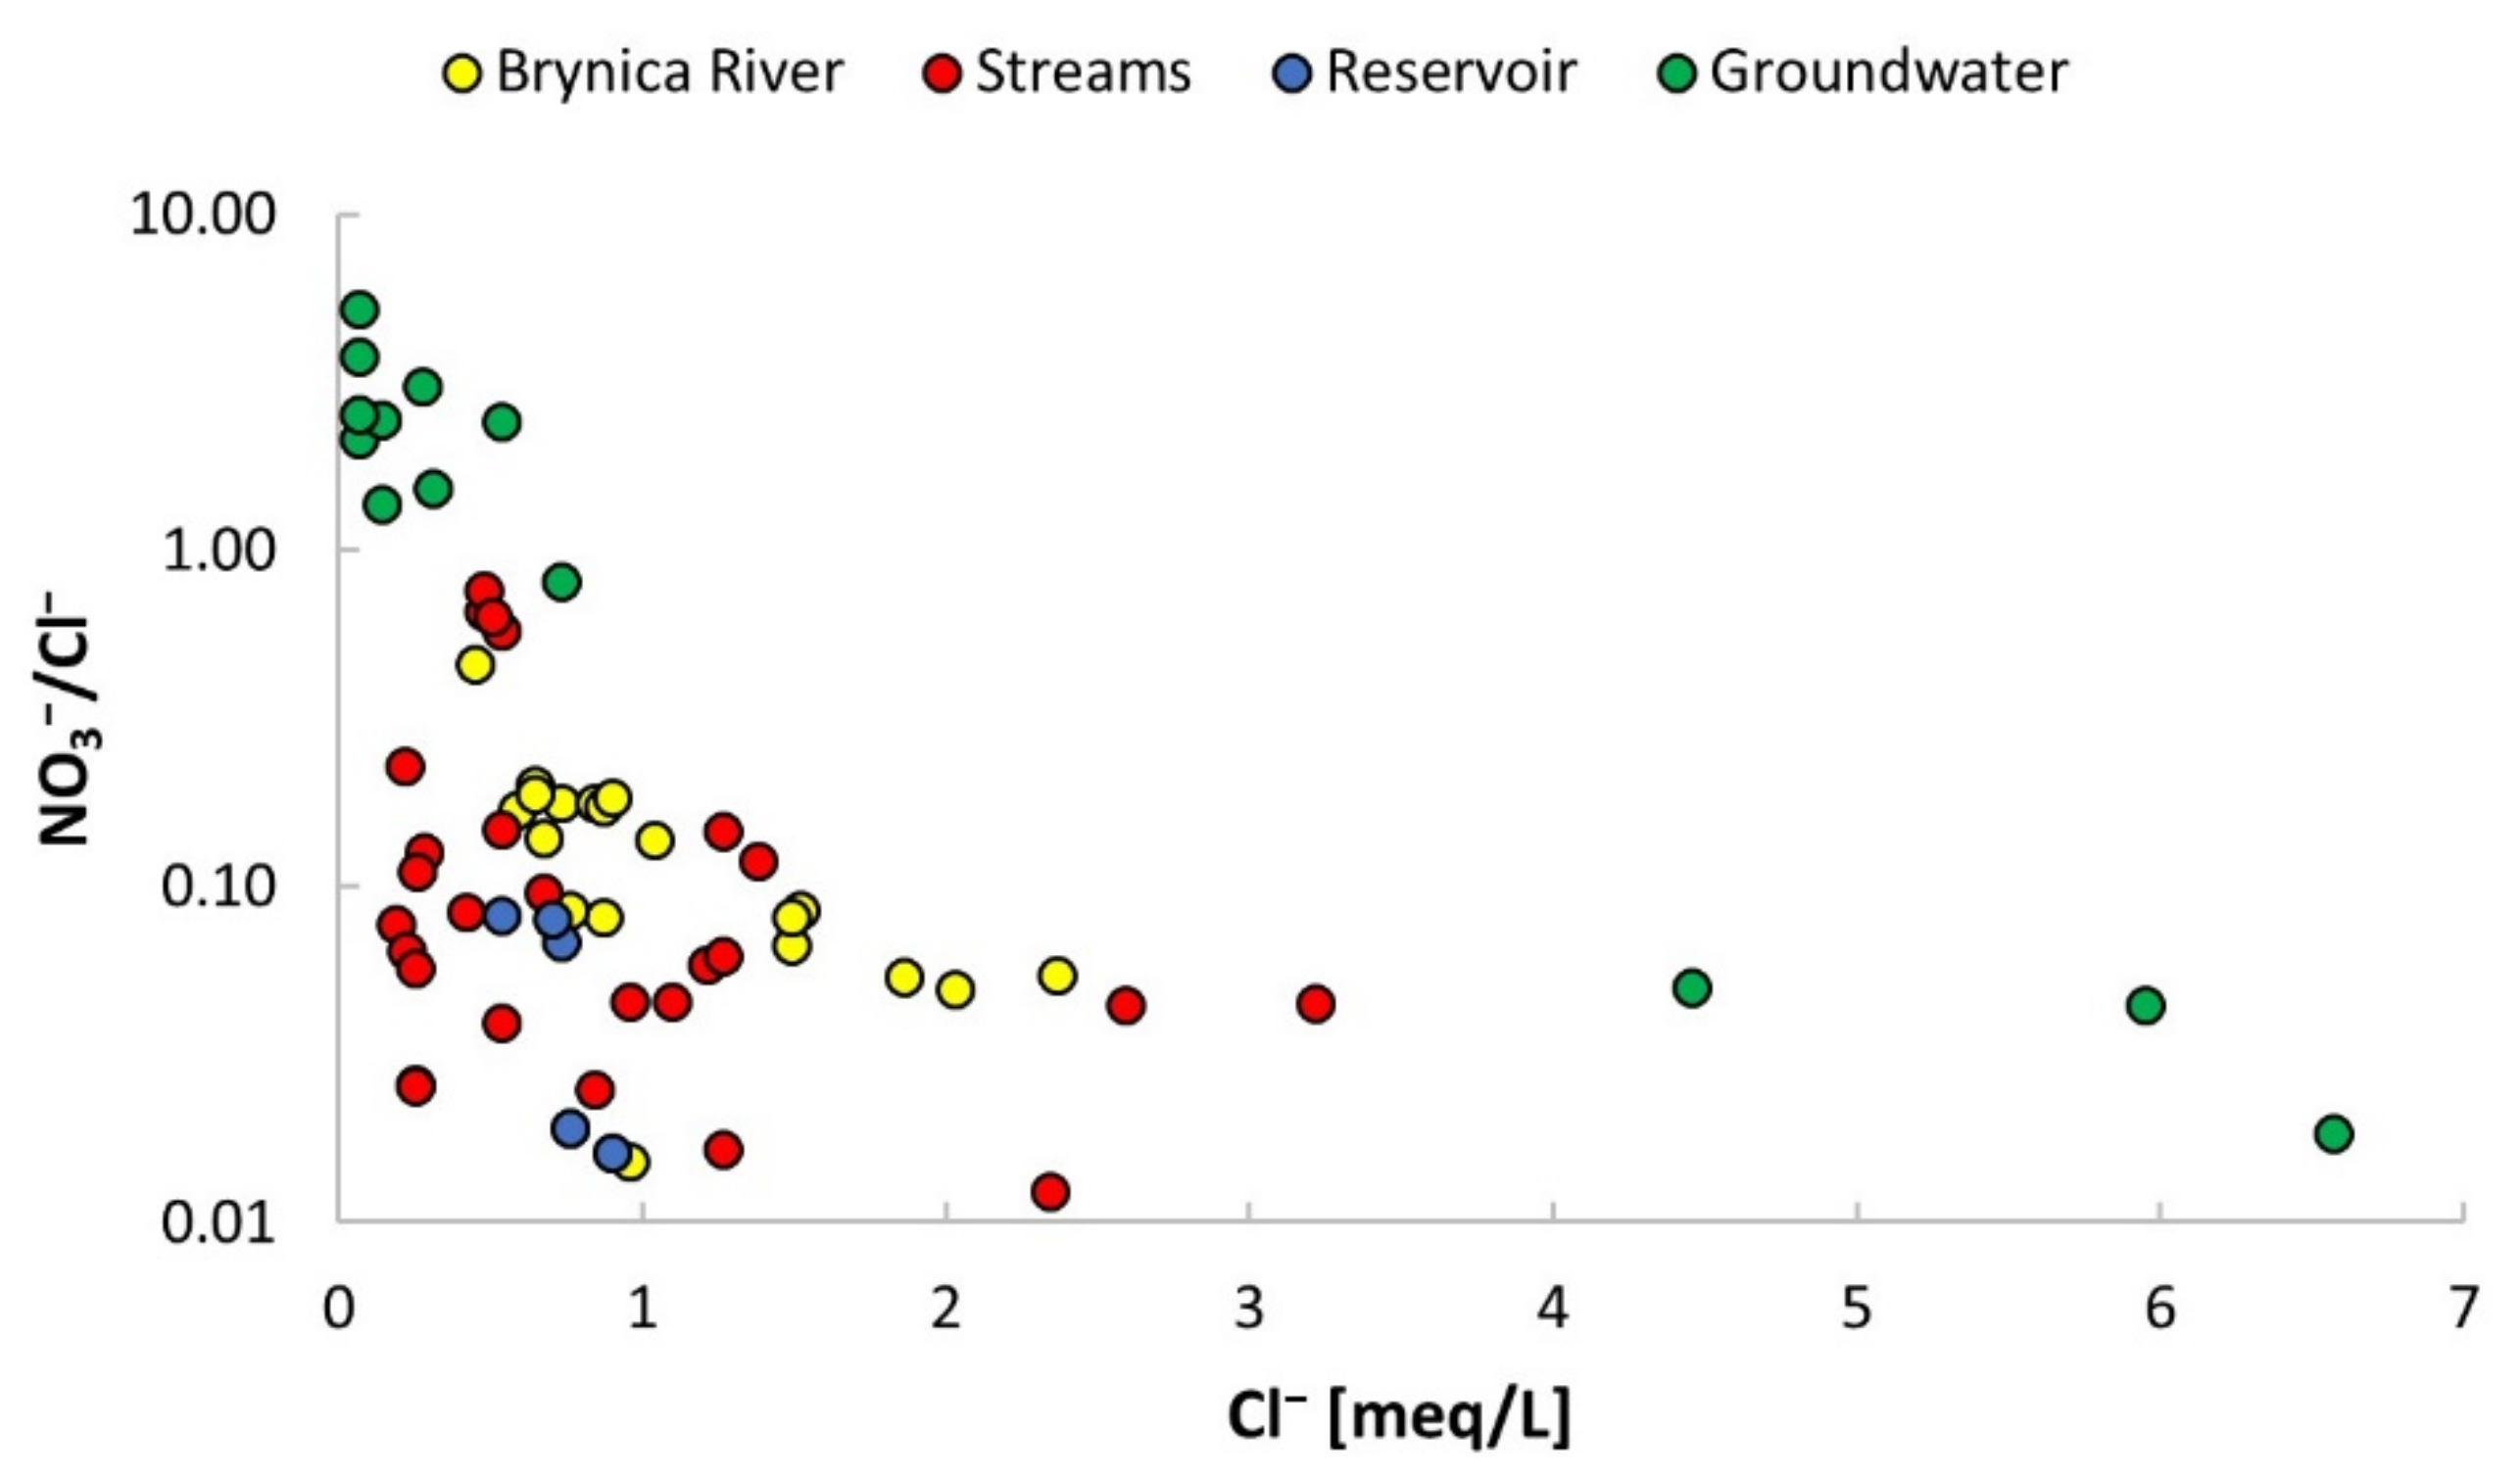
3.1. Water Chemistry

In the sections below, the ranges of measured parameters in different water sample types (the Brynica river, streams, the reservoir, and groundwater) are described. Detailed results of physicochemical, chemical, and isotopic analysis for each sampling campaign are included in the Supplementary Materials (Tables S2–S5).

3.1.1. The Brynica River and Streams

As the field measurements were conducted in different seasons, the temperature of sampled water varied greatly, between 1 °C in winter and 18.8 °C in summer. pH measurements indicated the sampled water as slightly acidic to slightly alkaline, with pH values between 6.55 and 7.94. In the case of electrical conductivity (EC), the results were diversified and ranged from 210 µS/cm to 1010 µS/cm. Redox potential varied from −93 mV to 206 mV. Dissolved oxygen concentration measured in situ was between 2.6 mg/L and 10.5 mg/L (Table 1).
The most abundant ion in the river was HCO3, whose concentrations ranged between 48.2 mg/L and 466 mg/L. The quantities of other anions, i.e., SO42− and Cl, were lower and varied from <10 mg/L to 110 mg/L, and from 6.7 mg/L to 114 mg/L, respectively. Ca2+ was the main cation, and its concentrations in the sampled rivers were between 27 mg/L and 120 mg/L. The rest of the major ions, i.e., Mg2+, Na+, and K+, occurred in lower concentrations and were in the range of 4.1–38 mg/L, 4.2–65 mg/L, and 1.1–90 mg/L, respectively. PO43− was detected only in a few samples, and its concentration reached 12.5 mg/L. In the case of TOC, the values varied from 3.9 mg/L to 120 mg/L.
The concentrations of NO3 in rivers ranged from 0.4 mg/L to 22.6 mg/L. The concentrations of NO2 were significantly lower, i.e., between <0.002 mg/L and 0.394 mg/L. The observed values of NH4+ were usually below or slightly above the detection limit (0.01 mg/L), but in several river samples, significantly higher results were observed, reaching 51.5 mg/L.

3.1.2. The Kozłowa Góra Reservoir

The temperature of the reservoir water varied depending on the season and ranged between 0.5 °C and 24.6 °C. pH measurements also indicated the sampled water as slightly acidic to slightly alkaline, since pH values were between 6.58 and 8.88. EC values ranged between 335 µS/cm and 460 µS/cm. Redox potential in the reservoir varied from 90 mV to 189 mV. The concentration of dissolved oxygen was between 6.27 mg/L and 10.1 mg/L.
HCO3 was the dominant ion in the reservoir, and the concentrations were between 119 mg/L and 177 mg/L. SO42− and Cl concentrations were in the range of 40–66 mg/L and 19–32 mg/L, respectively. In the case of major cations, the observed values were 45–78 mg/L for Ca2+, 11–20 mg/L for Mg2+, 9.7–16 mg/L for Na+, and 3.6–5.3 mg/L for K+. PO43− was not detected in any of the reservoir water samples (<0.05 mg/L). TOC values ranged between 8.7 mg/L and 14 mg/L.
Among the analysed inorganic nitrogen compounds, the highest concentrations were observed for NO3, i.e., from 0.9 mg/L to 3.5 mg/L. The concentrations of NO2 and NH4+ were considerably lower, and the values were in the range of 0.010–0.033 mg/L and <0.01–0.21 mg/L, respectively.

3.1.3. Groundwater

The depth of sampled wells ranged between 2.8 m and 5.4 m. The temperature of groundwater was between 6.8 °C (in winter) and 14.6 °C (in summer). pH values ranged from 6.37 to 7.61. The results of EC were diverse, i.e., from 181 µS/cm to 1650 µS/cm. Redox potential varied from −13 mV to 238 mV. O2 concentrations measured in situ in groundwater were between 4.09 mg/L and 7.79 mg/L.
Seasonal changes in major ion concentrations were small. Similar to surface water, HCO3 was the main constituent in groundwater (from 57.3 mg/L to 592 mg/L). The lowest concentrations of SO42− and Cl were 21 mg/L and <5 mg/L, whereas the highest concentrations were 104 mg/L and 256 mg/L, respectively. Ca2+ was the dominant cation, and its concentration varied from 37 mg/L to 184 mg/L. Mg2+, Na+, and K+ occurred in lower concentrations, i.e., 4.2–34 mg/L, 3.0–135 mg/L, and 2.6–38 mg/L, respectively. PO43− concentrations usually did not exceed the detection limit (<0.05 mg/L), except for groundwater samples taken from the W3 well, where the values reached 3.2 mg/L. TOC values in the analysed groundwater were between 2.2 mg/L and 11 mg/L.
The groundwater contained higher concentrations of NO3 compared to sampled surface water, as concentrations ranged from 7.5 mg/L to 79.7 mg/L. Lower values were observed for NO2. The concentrations varied between 0.01 mg/L and 0.24 mg/L. NH4+ was mostly observed in concentrations <0.01 mg/L, but in one groundwater sample (W4), it reached 0.3 mg/L.

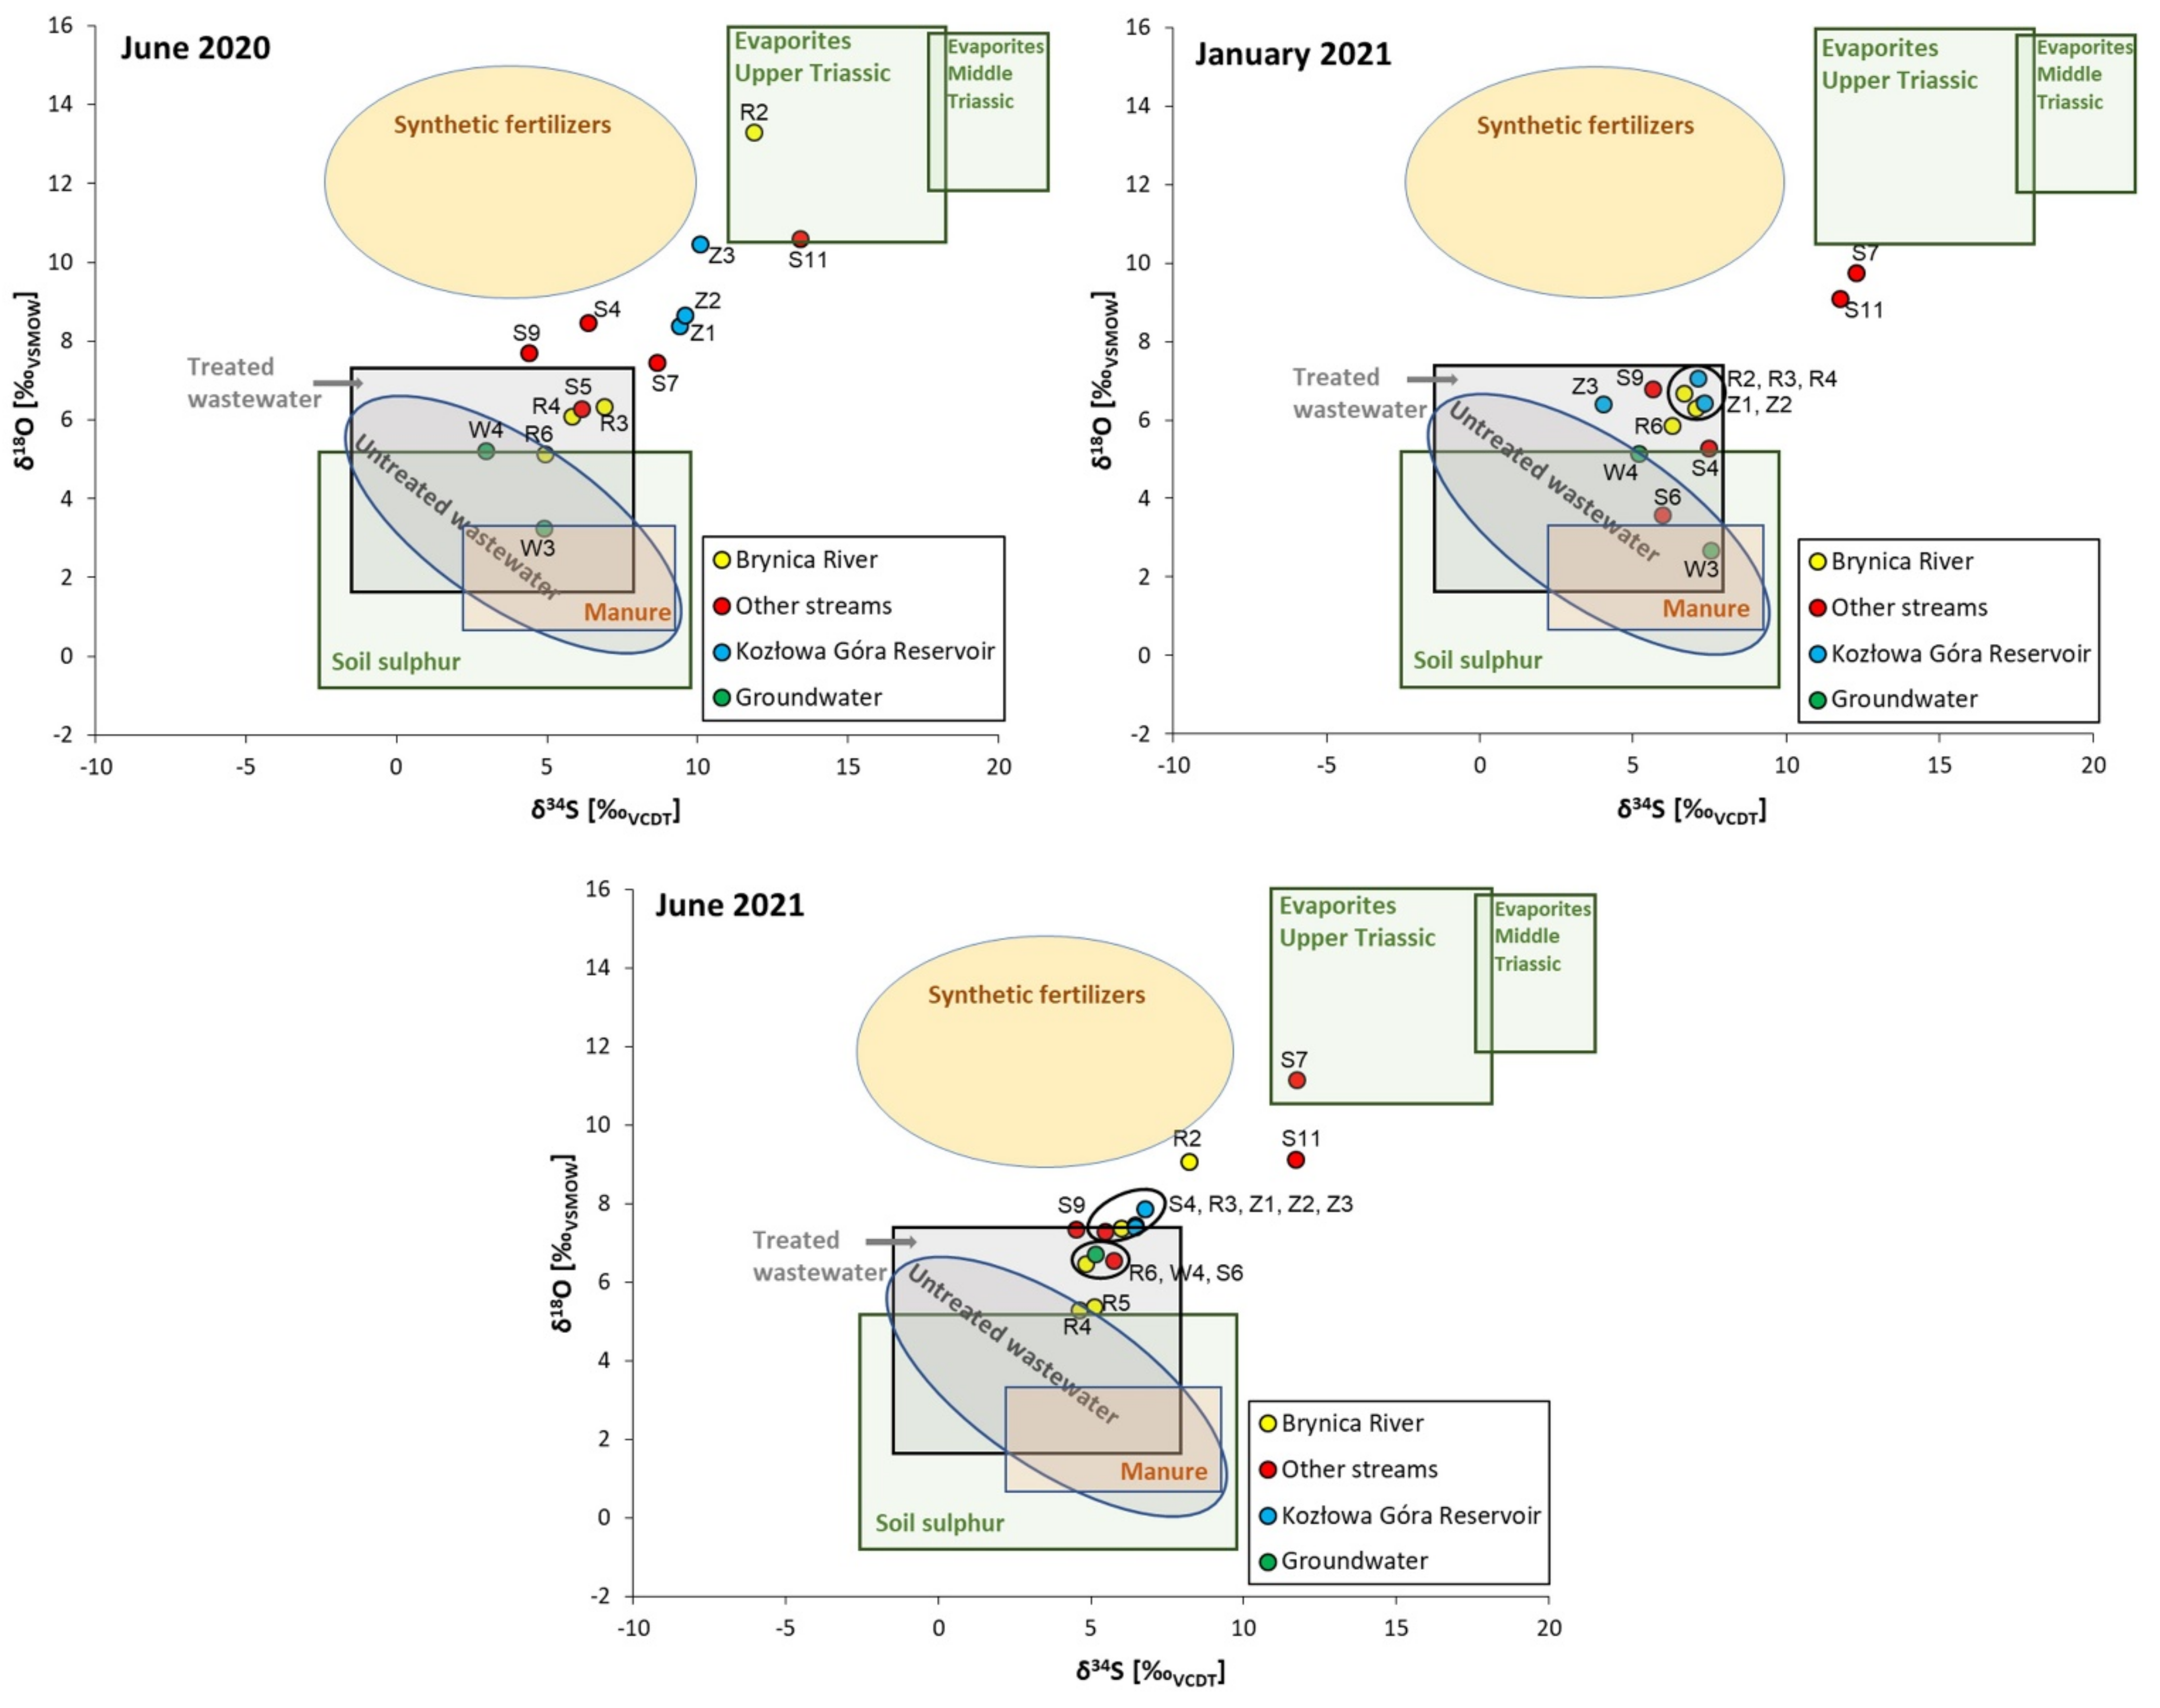
3.2. Isotopic Composition of Sulphate

The results of measurements of δ34S and δ18O in sulphate in surface water and groundwater sampled in 15 sites are summarised in Table 2 as minimum and maximum values from the three sampling campaigns (June 2020, January 2021, and June 2021).
Based on the results of the performed isotopic analyses, one can observe relatively stable values for groundwater samples (W3 and W4) in all three sampling campaigns. Values of δ18O in the W3 sample were the lowest of all the results (from 2.69 to 3.25‰), and δ34S ranged from 4.87 to 7.52‰. In the W4 sample, δ34S and δ18O values were in the ranges of 2.96 to 5.17‰ and 5.16 to 6.73‰, respectively. Water samples collected from the Kozłowa Góra reservoir showed seasonal changes in the isotopic composition of SO42−. The values of δ34S in the three sampling points (Z1, Z2, and Z3) ranged from 4.01 to 10.09‰, and δ18O ranged from 6.41 to 10.46‰. In general, higher values of δ34S and δ18O were observed in summer compared to the winter sampling campaign. Samples taken from the Brynica river and other streams were characterised by δ34S values ranging from 4.38‰ (S3) to 13.39‰ (S11) and δ18O values ranging from 3.59‰ (S6) to 13.30‰ (R2).

4. Discussion

The Quaternary aquifer represents a shallow groundwater system, which is manifested by a significant variation in measured physicochemical parameters within the study period. In addition, all sampled wells were located within areas of very high groundwater vulnerability (Figure 2).
The results indicate that the groundwater contamination level varies depending on the location within the catchment area. The W1 and W2 samples revealed relatively low concentrations of analysed constituents in each season. This is particularly noticeable in the case of W1, as groundwater was characterised by very low EC values and Cl concentrations, regardless of the period (Tables S2 and S3). Among the groundwater samples, the highest concentrations of NO3 were reported for W2, which exceeded the drinking water limit (i.e., 50 mg/L [38]) in two sampling campaigns. In the past, elevated concentrations of NO3 in groundwater from this well were also observed [39]. Given the land use in the vicinity of these wells, the probable source of nitrate is agricultural activities, i.e., the application of manure or fertilisers. Elevated concentration of nitrate was a major concern in W2; therefore, another method, such as NO3 isotopic studies [40], should be considered to investigate the origin of groundwater contamination in this area. Isotopic analyses of NO3 were not planned under the current project, but this method should be applied in future studies.
The W3 and W4 wells located in residential areas south of the airport revealed higher EC values and ion concentrations in the groundwater. However, the NO3 concentration was lower compared to the groundwater sampled in agricultural areas (W2). According to the isotopic results, sulphate in both W3 and W4 originates mainly from wastewater (Figure 3). Most of the catchment area does not have sewers, and domestic sewage is discharged to septic tanks. In this case, leaky septic tanks presumably lead to groundwater contamination. High concentrations of Cl and SO42− and relatively high EC values (up to 1650 µS/cm) in W4 seem to confirm this assumption. The correlation diagram of SO42− vs. HCO3 + Cl (prepared after [41,42]) confirms the distinct chemistry of groundwater from W4 compared to other collected water samples (Figure 4). Moreover, the results plotted on the TIS diagram show that SO42−, although originating from different sources, is not responsible for degradation of the water quality and plays a minor role in the observed total ionic salinity. Based on the groundwater level contours and flow directions to the east of the Kozłowa Góra reservoir, the migration of pollutants from south-eastern residential areas may also influence groundwater quality south of the airport. The observed ion concentrations and parameter values in W3 were not as high as in W4, but the results suggest that the groundwater is of lower quality compared to W1 and W2, mainly due to elevated concentrations of PO43−. It is noteworthy that only in the W3 sample was PO43− detected in concentrations exceeding the natural hydrogeological background (i.e., 1 mg/L [43]). Although PO43− is usually associated with agriculture, it may also come from laundry and dishwashing detergents used in households [44]. Therefore, the presence of PO43− in domestic sewage and its migration to the aquifer through leaky septic tanks may result in elevated concentrations of PO43− in groundwater.
Concentrations of major ions in surface water were similar in warm seasons, i.e., summer and early autumn. In winter, some changes were observed in the Brynica river and other streams (Figure 5). In that period, most of the samples revealed higher concentrations of Cl and Na+, especially in the Brynica river and the Ożarowicki and Nakło streams. An increase in EC values was also observed in winter. The results presented in Figure 4 confirm that Cl contributes significantly to the total ionic salinity in some of the sampled waters. The mentioned river and streams are the largest ones within the analysed catchment area and intersect major roads at several points. During the winter sampling campaign, de-icing roads of could release additional Cl and Na+ into the water environment. At the same time, higher TOC values were reported in winter. This suggests a continuous supply of contaminants to the surface water and slow biodegradation of organic matter due to the prevailing conditions (i.e., low temperatures and reducing conditions). According to isotopic analyses, SO42− originates primarily from wastewater in winter. Furthermore, no significant changes were observed in SO42− concentrations (<100 mg/L in most samples), except for the S7 and S11 sampling points. The increase in sulphate concentrations and the distinct isotopic composition suggest mixed pollution sources for these samples. In most cases, the isotopic results of sampled rivers and streams were comparable in winter, whereas in summer seasons, δ18O values were slightly higher (Figure 3). This suggests the application of fertilisers as an additional factor affecting surface water quality in warm seasons. Apart from the isotopic results, the relationship between NO3/Cl ratio and Cl (adapted from [15]) also suggests mixed sources of contamination in sampled waters. In Figure 6, points representing surface waters show diversified relations, ranging between results for highly contaminated groundwater (W4, high values of Cl-) and groundwater with low anthropogenic impact (e.g., W1, high values of NO3/Cl ratio).
As already mentioned, EC values and ion concentrations in surface water were slightly lower in warmer periods. In contrast to the winter sampling, chemical analyses revealed the presence of PO43− in some river water samples. Although water drained from arable lands may affect the chemical composition of water from the Brynica river (Figure 1), PO43− occurred in this river, starting from the R4 point, i.e., right below the wastewater discharge from the WWTP “Ożarowice”. The WWTP seems to be the main source of PO43− in the Brynica river; however, it is noteworthy that in June 2021, this ion was also detected in Brynica’s tributaries, i.e., the Czechówka stream (S3) and the drainage ditch west of the airport (S6). Both streams run across agricultural lands, away from residential areas. Furthermore, low concentrations of dissolved oxygen were observed in the Czechówka stream in the last sampling campaign (3.14–3.73 mg/L), which may indicate decomposition of organic waste (e.g., manure). Therefore, the tributaries may carry contaminants of agricultural origin to the Brynica river between R2 and R3, but their quantities decrease significantly, reaching values below the detection limit, presumably due to dilution. Moreover, a relatively high concentration of PO43− was reported in the last sampling campaign for the Nakło stream in the vicinity of its spring (S10). The S10 point was surrounded by arable lands. High concentrations of NH4+ and organic matter suggest the agricultural origin of PO43− in this region. High TOC values may be associated with manure applied on arable lands. As a result of organic matter decomposition, NH4+ is released into the water, and dissolved oxygen occurs in a low concentration (2.60 mg/L). High concentrations of NH4+ and low values of NO3 in the observed redox conditions (Eh = 113 mV) suggest recent contamination. Interestingly, in the S11 sampling point, located closer to the Nakło stream mouth, SO42− is characterised with high values of δ34S and δ18O, close to the ranges for natural sources (Figure 3). Moreover, the S11 water samples revealed low values of parameters, indicating influence of anthropogenic activity, such as NO3, Cl, and EC. However, elevated concentrations of NH4+ (0.19–0.82 mg/L) and low concentrations of dissolved oxygen (3.73–6.64 mg/L) were observed, which may be associated with the presence of organic matter (TOC = 11–17 mg/L). All facts considered, nutrients entering the Kozłowa Góra reservoir are of a mixed origin and come from both wastewater and agricultural activities.
Some level of diversity was also observed in the distribution of inorganic nitrogen compounds within the catchment area (Figure 7). Three forms, i.e., NO3, NO2, and NH4+, were detected above the quantification limits in most river samples. This indicates nitrification/denitrification processes and permanent contamination of surface water [44].
In the north-eastern part of the catchment area, i.e., upstream of the Brynica river, the area is covered mostly by forests and arable lands. Sampling points on the Brynica river in this area (R1 and R2) revealed NO3 reaching 12.8 mg/L in R1 in September 2021. In natural areas and regions less impacted by anthropogenic activity, such as forests, NO3 concentrations are lower compared to other land use types [50]. Relatively low concentrations of NO3 and NH4+ indicate distant contamination sources. R1 and R2 are the sampling points closest to the Brynica’s source (Figure 1). Based on the results obtained in September 2021, ion concentrations in the R1 and R2 samples are similar. Isotopic composition of SO42− differed depending on the season, in contrast to SO42− concentrations, which were low in each sampling period (31–47 mg/L). The Brynica river flows across forests and agricultural lands in the northeast, away from residential areas. Therefore, the most probable source of contaminants is agriculture, possibly a mix of synthetic fertilisers and livestock manure.
The agricultural impact is also seen in other streams in the north-eastern part of the catchment area, i.e., Trzonia and Czechówka streams. Although NH4+ and NO2 concentrations in these streams were similar, NO3 concentrations were higher in the Czechówka stream, which runs across arable lands, unlike the Trzonia stream (Figure 1). The influence of manure and synthetic fertilisers in summer was confirmed for S4 by SO42− isotopic studies. Lower concentrations of ions in the Trzonia stream also suggests a lower level of anthropogenic impact.
In the central part of the catchment area, starting from the R3 point, NO3 concentrations increased in the Brynica river. The R3 sampling point was situated upstream the WWTP “Ożarowice”, and the increase in nitrate concentrations is related to another contamination source. Based on the land-use pattern and the chemical results, the drainage ditch (sampled as S5 and S6) is likely to carry a certain amount of NO3 to the Brynica river. Based on the isotopic analyses, the water quality of the ditch could be deteriorated by wastewater, possibly coming from the airport area.
Downstream the WWTP discharge (R4), NO3 concentrations remained similar to upstream the WWTP (R3). However, NH4+ concentrations increased (up to 0.85 mg/L), which resulted from recent contamination caused by the wastewater discharge. In this part of the catchment area, the Ożarowicki stream influences Brynica’s quality, as it provides an additional load of NO3 and slightly reduces NH4+ concentrations due to water mixing. Presumably, a portion of contamination in the Ożarowicki stream is derived from the Siedliska channel, which is the drainage ditch on the south of the airport. The S7 sample revealed the dominance of NH4+ over nitrate, regardless of the season. In this stream, the most reduced conditions were also observed. Isotopic analyses of sulphate revealed higher values of δ34S and δ18O in January 2021 and June 2021. Although the results suggest a natural origin of SO42− (Figure 3), it seems unlikely, considering the contamination sources in the vicinity of the S7 sampling point. This sample was collected at a short distance from a wastewater discharge identified at the Siedliska channel, which significantly influences the water quality. The wastewater probably comes from the areas of car parks next to the airport and/or from the allotments west of the Siedliska channel. Elevated concentrations of ions and TOC indicate the influence of wastewater from a local contamination source, which is the reason for a specific isotopic signature different from the literature values. In the Ożarowicki stream alone, the redox conditions are more oxidising, and other potential contamination sources are possible, such as another wastewater discharge and arable lands (Figure 1).
The quality of the R6 sample reflects a combined impact of the Brynica river and its tributaries. Isotopic results showed that the δ18O and δ34S values changed gradually downstream the river. SO42− and other ions are of mixed origin in R6. Inorganic nitrogen compounds are not as abundant as in Brynica close to the WWTP “Ożarowice”, but the river is still the main input of contamination to the reservoir. Another tributary of the Kozłowa Góra, the Nakło stream, supplies the NH4+ load on a larger scale compared to the Brynica river (Figure 7). This points to a local source, probably of agricultural origin. Redox conditions in the Nakło stream differed throughout the year, but were reduced in each sampling campaign as compared to Brynica.
Undoubtedly, the water quality of the rivers affects the chemical composition of the reservoir. However, both inflowing streams and groundwater recharge the Kozłowa Góra reservoir; thus, contaminants may enter the surface water body along with the groundwater. The groundwater level contours show higher hydraulic gradient on the southeast, which means that this part of the catchment area contributes to significant recharge of the reservoir by groundwater. This implies that contaminants from agricultural and residential areas in this part of the study area can enter the reservoir (Figure 1). Migration of contaminants to the reservoir via rivers, groundwater, and surface run-off may be responsible for water quality deterioration, but the observed contamination level of the reservoir water is lower compared to its tributaries and to groundwater. This means that natural processes must influence the chemical composition of the reservoir water and lead to a decrease in contaminant concentrations.
The Kozłowa Góra reservoir was sampled at three of its banks (west, south, and east), and no significant differences in the chemical composition of water were found. The results of SO42− isotopic analyses indicate that this ion originates partially from agricultural activities in summer and predominantly from wastewater discharges in winter. Although the Brynica river is considered to have a significant impact on the water quality of the reservoir, other factors seem to play an important role in the formation of the chemical composition of the reservoir water. Ions related to agriculture were either not present in the reservoir water (PO43−) or occurred in low concentrations (NO3). The highest concentrations of NO3 in the reservoir water were reported in winter, but they were still considerably lower in comparison to most of the river water samples. One of the processes altering water chemistry in the reservoir is dilution by the Nakło stream and rainwater. Chemical results for the Nakło stream (S11) revealed much lower EC values and concentrations of most analysed ions than in the Brynica river (R6). Moreover, archival data for this area showed low concentrations of NO3 in precipitation (the sum of NO3 and NO2 = 0.32 mg/L, [51]). This suggests that rainwater could partially contribute to dilution and decrease NO3 concentrations in the reservoir. This involves other constituents as well.
The reservoir is partially recharged by groundwater, mainly at its eastern bank. Previous studies conducted in this area revealed the influence of groundwater recharge on water chemistry in the eastern part of the Kozłowa Góra reservoir, resulting in elevated concentrations of NO3 in the north-eastern part of the reservoir compared to the south-western part [32]. This proves that contaminants may reach the reservoir through groundwater recharge. Based on the study results and archival data [32], processes other than dilution influence the chemical composition of the reservoir water. These can be biochemical processes occurring in plant organisms. Dissolved oxygen in the reservoir occurred in higher concentrations compared to the Brynica river and other streams, regardless of the season. As the primary source of O2 is photosynthesis, the results confirm the role of phytoplankton and aquatic plants in the evolution of the reservoir water chemistry. Moreover, plant organisms consume a portion of nutrients. NO3 concentrations in surface water bodies may vary throughout the year, as the growth of plant organisms differs depending on the season. In winter, plant growth and development are slower, and thus organisms absorb a smaller amount of NO3 [52,53,54].

5. Conclusions

The application of combined chemical and isotopic analyses enabled more accurate identification of the anthropogenic factors affecting water quality within the Kozłowa Góra catchment area. The distribution of ion concentrations in the sampled water shows that the contamination risk and contamination level differ depending on land use and the season. Groundwater contamination is a result of a poorly developed sewer system. The highest level of groundwater contamination was observed in residential areas located to the east of the Kozłowa Góra reservoir. Isotopic analyses of SO42− confirmed that the deteriorated water quality in some streams, including the Brynica river, is related mainly to wastewater discharge. In some parts of the catchment area, the overlapping effects of agricultural activities and wastewater discharge are noticeable in warm seasons. Isotopic studies of SO42− facilitated interpretation of contamination origin; however, constituents other than SO42− played an important role in water quality, e.g., Cl and nutrients. Both the isotopic results and relations between the analysed ions indicated a mixed origin of contamination at some sampling points. The measurement of inorganic nitrogen compounds revealed the highest concentrations of NO3 in groundwater. Among the surface water samples, the lowest water quality, manifested by high EC values and ion concentrations, was observed in the Brynica river, the Ożarowicki stream, and the Siedliska channel, i.e., streams where wastewater discharges were identified. Elevated concentrations of NH4+ and TOC, as well as the presence of the other nitrogen compounds (NO3, NO2), confirm long-term contamination and the role of denitrification and nitrification processes in the modification of the chemical composition of the river water. Although the Brynica river carries a significant part of the analysed constituents, groundwater recharge, precipitation, inflow of the Nakło stream, and processes occurring in the reservoir control contaminant concentrations in the Kozłowa Góra, which is a drinking water source for the local community.
Undoubtedly, the application of the two research methods facilitated understanding of the types and the range of human impact on the water environment and water quality. Nevertheless, the involvement of another method, e.g., isotopic analysis of NO3, would allow for a more precise assessment. This primarily concerns streams that run across areas representing different land-use types or reveal misleading results for SO42− isotopic composition.
The identification of contamination sources responsible for water quality deterioration in different parts of the catchment area can be used in further studies within this area, such as the monitoring of microcontaminants in the water environment. The knowledge on existing risks and contamination sources may prove useful in a future interpretation of the origin and migration patterns of monitored substances.

Supplementary Materials

The following are available online at https://www.mdpi.com/article/10.3390/w14060846/s1, Table S1: Methods used in measurements of parameters, Table S2: The results of physico-chemical parameters in sampled water (Date: I—June 2020; II—January 2021; III—June 2021; IV—September 2021), Table S3: The results of chemical analyses of sampled water (Date: I—June 2020; II—January 2021; III—June 2021; IV—September 2021), Table S4: The results of nitrogen compound analyses in sampled water (Date: I—June 2020; II—January 2021; III—June 2021; IV—September 2021), Table S5: The results of isotopic analyses of S and O in SO4 in sampled water (Date: I—June 2020; II—January 2021; III—June 2021; IV—September 2021).

Author Contributions

Conceptualization, K.Ś.; methodology, K.Ś. and S.J.-K.; software, K.Ś. and S.J.-K.; analysis, K.Ś. and S.J.-K.; investigation, K.Ś. and S.J.-K.; resources, K.Ś. and S.J.-K.; data curation, K.Ś.; writing—original draft preparation, K.Ś. and S.J.-K.; writing—review and editing, S.J.-K. and A.J.W.; visualization, K.Ś. and S.J.-K.; supervision, K.Ś. and A.J.W. All authors have read and agreed to the published version of the manuscript.

Funding

This research was completed in the framework of the project “Board for Detection and Assessment of Pharmaceutical Drug Residues in Drinking Water—Capacity Building for Water Management in CE” funded by Interreg Central Europe (the boDEREC-CE project, No CE1412). This research was also co-funded by the Ministry of Education and Science of Poland under grant agreement no. 5033/INTERREG CE/2019/2.

Data Availability Statement

All data presented in this study are available within this article.

Acknowledgments

The authors would like to thank Jacek Wróbel, Piotr Siwek and Krzysztof Pawlik for their assistance during fieldwork. The authors appreciate the review comments from the three anonymous reviewers, which led to significant improvements in the manuscript.

Conflicts of Interest

The authors declare no conflict of interest. The funders had no role in the design of the study; in the collection, analyses, or interpretation of data; in the writing of the manuscript, or in the decision to publish the results.

References

  1. Bradley, P.M.; Barber, L.B.; Clark, J.M.; Duris, J.W.; Foreman, W.T.; Furlong, E.T.; Givens, C.E.; Hubbars, L.E.; Hutchinson, K.J.; Journey, C.A.; et al. Pre/post-closure assessment of groundwater pharmaceutical fate in a wastewater-facility-impacted stream reach. Sci. Total. Environ. 2016, 568, 916–925. [Google Scholar] [CrossRef] [PubMed]
  2. Zhang, F.-S.; Xie, Y.-F.; Li, X.-W.; Wang, D.-Y.; Yang, L.-S.; Nie, Z.-Q. Accumulation of steroid hormones in soil and its adjacent aquatic environment from a typical intensive vegetable cultivation of North China. Sci. Total. Environ. 2015, 538, 423–430. [Google Scholar] [CrossRef] [PubMed]
  3. Wolf, L.; Zwiener, C.; Zemann, M. Tracking artificial sweeteners and pharmaceuticals introduced into urban groundwater by leaking sewer networks. Sci. Total. Environ. 2012, 430, 8–19. [Google Scholar] [CrossRef] [PubMed]
  4. Phillips, P.J.; Schubert, C.; Argue, D.; Fisher, I.; Furlong, E.T.; Foreman, W.; Gray, J.; Chalmers, A. Concentrations of hormones, pharmaceuticals and other micropollutants in groundwater affected by septic systems in New England and New York. Sci. Total. Environ. 2015, 512–513, 43–54. [Google Scholar] [CrossRef] [PubMed]
  5. Kapelewska, J.; Kotowska, U.; Wiśniewska, K. Determination of personal care products and hormones in leachate and groundwater from Polish MSM landfills by ultrasound-assisted emulsification microextraction and GC-MS. Environ. Sci. Pollut. Res. 2016, 23, 1642–1652. [Google Scholar] [CrossRef] [PubMed] [Green Version]
  6. Paíga, P.; Delerue-Matos, C. Determination of pharmaceuticals in groundwater collected in five cemeteries’ areas (Portugal). Environ. Sci. Pollut. Res. 2016, 569–570, 16–22. [Google Scholar] [CrossRef]
  7. Ślósarczyk, K.; Jakóbczyk-Karpierz, S.; Różkowski, J.; Witkowski, A.J. Occurrence of Pharmaceuticals and Personal Care Products in the Water Environment of Poland: A Review. Water 2021, 13, 2283. [Google Scholar] [CrossRef]
  8. Yang, X.; Chen, F.; Meng, F.; Xie, Y.; Chen, H.; Young, K.; Luo, W.; Ye, T.; Fu, W. Occurrence and fate of PPCPs and correlations with water quality parameters in urban riverine waters of the Pearl River Delta, South China. Environ. Sci. Pollut. Res. 2013, 20, 5864–5875. [Google Scholar] [CrossRef]
  9. Cary, L.; Casanova, J.; Gaaloul, N.; Guerrot, C. Combining boron isotopes and carbamazepine to trace sewage in salinazed groundwater: A case study in Cap Bon, Tunesia. Appl. Geochem. 2013, 34, 126–139. [Google Scholar] [CrossRef] [Green Version]
  10. Otero, N.; Soler, A.; Canals, A. Controls of δ34S and δ18O in dissolved sulphate: Learning from a detailed survey in the Llobregat River (Spain). Appl. Geochem. 2008, 23, 1166–1185. [Google Scholar] [CrossRef]
  11. Lorite-Herrera, M.; Jiménez-Espinosa, R. Impact of agricultural activity and geologic controls on groundwater quality of the alluvial aquifer of the Guadalquivir River (province of Jaén, Spain): A case study. Environ. Geol. 2008, 54, 1391–1402. [Google Scholar] [CrossRef]
  12. Puig, R.; Folch, A.; Mencio, A.; Soler, A.; Mas-Pla, J. Multi-isotopic study (15N, 34S, 18O, 13C) to identify processes affecting nitrate and sulfate in response to local and regional groundwater mixing in a large-scale flow system. Appl. Geochem. 2013, 32, 129–141. [Google Scholar] [CrossRef]
  13. Sacchi, E.; Acutis, M.; Bartoli, M.; Brenna, S.; Delconte, C.A.; Laini, A.; Pennisi, M. Origin and fate of nitrates in ground-water from the central Po plain: Insights from isotopic investigations. Appl. Geochem. 2013, 34, 164–180. [Google Scholar] [CrossRef]
  14. Shin, W.-J.; Ryu, J.-S.; Lee, K.-S.; Park, Y. Identification of anthropogenic contaminant sources in urbanized streams using multiple isotopes. Environ. Earth Sci. 2015, 73, 8311–8324. [Google Scholar] [CrossRef]
  15. Torres-Martínez, J.A.; Mora, A.; Knappett, P.S.K.; Ornelas-Soto, N.; Mahlknecht, J. Tracking nitrate and sulfate sources in groundwater of an urbanized valley using a multi-tracer approach combined with a Bayesian isotope mixing model. Water Res. 2020, 182, 115962. [Google Scholar] [CrossRef]
  16. Bottrell, S.; Telam, J.; Bartlett, R.; Hughes, A. Isotopic composition of sulfate as a tracer of natural and anthropogenic influences on groundwater geochemistry in an urban sandstone aquifer, Birmingham, UK. Appl. Geochem. 2008, 23, 2382–2394. [Google Scholar] [CrossRef]
  17. Ingri, J.; Torssander, P.; Andersson, P.S.; Morth, C.-M.; Kusakabe, M. Hydrogeochemistry of sulfur isotopes in the Kalix River catchment, northern Sweden. Appl. Geochem. 1997, 12, 483–496. [Google Scholar] [CrossRef]
  18. Cortecci, G.; Dinelli, E.; Bencini, A.; Adorni-Braccesi, A.; La Ruffa, G. Natural and anthropogenic SO4 sources in the Arno river catchment, northern Tuscany, Italy: A chemical and isotopic reconnaissance. Appl. Geochem. 2001, 17, 79–92. [Google Scholar] [CrossRef]
  19. Zhang, J.; Jin, M.; Cao, M.; Huang, X.; Zhang, Z.; Zhang, L. Sources and behaviors of dissolved sulfate in the Jinan karst spring catchment in northern China identified by using environmental stable isotopes and a Bayesian isotope-mixing model. Appl. Geochem. 2021, 134, 105109. [Google Scholar] [CrossRef]
  20. Caschetto, M.; Colombani, N.; Mastrocicco, M.; Petitta, M.; Aravena, R. Nitrogen and sulphur cycling in the saline coastal aquifer of Ferrara, Italy. A multi-isotope approach. Appl. Geochem. 2017, 76, 88–98. [Google Scholar] [CrossRef]
  21. Jakóbczyk-Karpierz, S.; Sitek, S.; Jakobsen, R.; Kowalczyk, A. Geochemical and isotopic study to determine sources and processes affecting nitrate and sulphate in groundwater influenced by intensive human activity-carbonate aquifer Gliwice (southern Poland). Appl. Geochem. 2017, 76, 168–181. [Google Scholar] [CrossRef]
  22. Jakóbczyk-Karpierz, S.; Ślósarczyk, K.; Sitek, S. Tracing multiple sources of groundwater pollution in a complex carbonate aquifer (Tarnowskie Góry, southern Poland) using hydrogeochemical tracers, TCE, PCE, SF6 and CFCs. Appl. Geochem. 2020, 118, 104623. [Google Scholar] [CrossRef]
  23. Szynkiewicz, A.; Witcher, J.C.; Modelska, M.; Borrok, D.M.; Pratt, L.M. Anthropogenic sulfate loads in the Rio Grande, New Mexico (USA). Chem. Geol. 2011, 283, 194–209. [Google Scholar] [CrossRef]
  24. Cravotta, C.A. Use of Stable Isotopes of Carbon, Nitrogen, and Sulfur to Identify Sources of Nitrogen in Surface Waters in the Lower Susquehanna River Basin, Pennsylvania; U.S. Geological Survey Water-Supply Paper 2497; US Geological Survey: Denver, CO, USA, 1997. [Google Scholar]
  25. Negrel, P.; Pauwels, H. Interaction between different groundwaters in Brittany catchments (France): Characterizing multiple sources through strontium- and sulphur isotope tracing. Water Air Soil Pollut. 2003, 151, 261–285. [Google Scholar] [CrossRef]
  26. Moncaster, S.J.; Bottrell, S.H.; Tellam, J.H.; Lloyd, J.W.; Konhauser, K.O. Migration and attenuation of agrochemical pollutants: Insights from isotopic analysis of groundwater sulphate. J. Contam. Hydrol. 2000, 43, 147–163. [Google Scholar] [CrossRef]
  27. Knoller, K.; Schubert, M. Interaction of dissolved and sedimentary sulfur compounds in contaminated aquifers. Chem. Geol. 2010, 276, 284–293. [Google Scholar] [CrossRef]
  28. Longinelli, A.; Flora, O. Isotopic composition of gypsum samples of Permian and Triassic age from the north-eastern Italian Alps: Palaeoenvironmental implications. Chem. Geol. 2007, 245, 275–284. [Google Scholar] [CrossRef]
  29. Interreg Central Europe boDEREC-CE. The Project Website. Available online: https://www.interreg-central.eu/Content.Node/boDEREC-CE.html (accessed on 22 February 2022).
  30. Corine Land Cover 2018. Available online: https://land.copernicus.eu/pan-european/corine-land-cover/clc2018?tab=download (accessed on 30 June 2021).
  31. Czekaj, J.; Skrzypczak, M.; Siudy, A.; Lach, L.; Sędor, T. Interreg Central Europe PROLINE-CE. Set up of Pilot Specific Management Practices. D.T2.1.4 Descriptive Documentation of Pilot Actions and Related Issues. Report of PROLINE-CE Workpackage T2, Activity T2.1., Pilot Action 2.2: Kozłowa Góra. Available online: https://www.interreg-central.eu/Content.Node/CE110-PROLINE-CE-D.T2.1.4-documentation-pilot-actions.zip (accessed on 5 May 2021).
  32. Czekaj, J.; Skrzypczak, M.; Siudy, A. Interreg Central Europe PROLINE-CE. Implementation of Best Practices for Water Protection in Pilot Actions. D.T2.2.2 Partner-Specific Pilot Action Documentations. Report of PROLINE-CE Workpackage T2, Activity T2.2., Pilot Action 2.2: Kozłowa Góra. Available online: https://www.interreg-central.eu/Content.Node/CE110-PROLINE-CE-T2-D.T2.2.2-9-pilot-action-reports.zip (accessed on 5 May 2021).
  33. Measurement and Observation Data of the Institute of Meteorology and Water Management. Available online: https://danepubliczne.imgw.pl/data/dane_pomiarowo_obserwacyjne/ (accessed on 12 November 2021).
  34. Gajowiec, B. Hydrogeological Map of Poland 1:50 000, Sheet Koziegłowy 878; Polish Geological Institute: Warsaw, Poland, 1997. [Google Scholar]
  35. Gajowiec, B.; Wagner, J.; Kowalczyk, A.; Rubin, K. Hydrogeological Map of Poland 1:50 000, Sheet Kalety 877; Polish Geological Institute: Warsaw, Poland, 1998. [Google Scholar]
  36. Kropka, J.; Kowalczyk, A.; Rubin, K. Hydrogeological Map of Poland 1:50 000, Sheet Bytom 910; Polish Geological Institute: Warsaw, Poland, 1998. [Google Scholar]
  37. Wagner, J.; Chmura, A.; Siemiński, A. Hydrogeological Map of Poland 1:50 000, Sheet Wojanowice 911; Polish Geological Institute: Warsaw, Poland, 1997. [Google Scholar]
  38. Regulation of the Minister of Health of 7 December 2017 on Water Quality Intended for Human Consumption. 2017. Available online: http://isap.sejm.gov.pl/isap.nsf/download.xsp/WDU20170002294/O/D20172294.pdf (accessed on 12 November 2021).
  39. Ślósarczyk, K.; Witkowski, A.J. Preliminary Evaluation of the Possible Occurrence of Pesticides in Groundwater Contaminated with Nitrates—A Case Study from Southern Poland. Water 2021, 13, 3091. [Google Scholar] [CrossRef]
  40. Kendall, C.; Aravena, R. Nitrate Isotopes in Groundwater Systems. In Environmental Tracers in Subsurface Hydrology; Cook, P.G., Herczeg, A.L., Eds.; Springer: Boston, MA, USA, 2000; pp. 261–297. ISBN 978–0-7923–7707–8. [Google Scholar]
  41. Apollaro, C.; Tripodi, V.; Vespasiano, G.; De Rosa, R.; Dotsika, E.; Fuoco, I.; Critelli, S.; Muto, R. Chemical, isotopic and geotectonic relations of the warm and cold waters of the Galatro and Antonimina thermal areas, southern Calabria, Italy. Mar. Pet. Geol. 2019, 109, 469–483. [Google Scholar] [CrossRef]
  42. Apollaro, C.; Di Curzio, D.; Fuoco, I.; Buccianti, A.; Dinelli, E.; Vespasiano, G.; Castrignanò, A.; Rusi, S.; Barca, D.; Figoli, A.; et al. A multivariate non-parametric approach for estimating probability of exceeding the local natural background level of arsenic in the aquifers of Calabria region (Southern Italy). Sci. Total Environ. 2022, 806, 150345. [Google Scholar] [CrossRef]
  43. Witczak, S.; Kania, J.; Kmiecik, E. Katalog Wybranych Fizycznych i Chemicznych Wskaźników Zanieczyszczeń Wód Podziemnych i metod Ich Oznaczania; Biblioteka Monitoringu Środowiska: Warsaw, Poland, 2013; ISBN 978–83–61227–13–7. [Google Scholar]
  44. Dojlido, J. Chemia Wód Powierzchniowych; Wydawnictwo Ekonomia i Śodowisko: Białystok, Poland, 1995; p. 342. ISBN 83–85792–22–8. [Google Scholar]
  45. Claypool, G.E.; Holser, W.T.; Kaplan, I.R.; Sakai, H.; Zak, I. The age curves of sulfur and oxygen isotopes in marine sulfate and their mutual interpretation. Chem. Geol. 1980, 28, 199–260. [Google Scholar] [CrossRef]
  46. Cortecci, G.; Reyes, E.; Berti, G.; Casati, P. Sulfur and oxygen isotopes in Italian marine sulfates of Permian and Triassic ages. Chem. Geol. 1981, 34, 65–79. [Google Scholar] [CrossRef]
  47. Krouse, H.R.; Mayer, B. Sulphur and oxygen isotopes in sulphate. In Environmental Tracers in Subsurface Hydrology; Cook, P.G., Herzeg, A., Eds.; Kluwer Academic Publishers: Boston, MA, USA, 2000; pp. 195–231. [Google Scholar]
  48. Nielsen, H.; Pilot, J.; Grinenko, L.N.; Grinenko, V.A.; Lein, A.Y.; Smith, J.W.; Pankina, R.G. Lithospheric sources of sulphur. In Stable Isotopes: Natural and Anthropogenic Sulphur in the Environment SCOPE; Krouse, H.R., Grinenko, V.A., Eds.; Wiley: Chichester, UK, 1991; pp. 5–132. [Google Scholar]
  49. Boschetti, T.; Cortecci, G.; Toscani, L.; Iacumin, P. Sulfur and oxygen isotope compositions of Upper Triassic sulfates from Northern Apennines (Italy): Palaeogeographic and hydrogeochemical implications. Geol. Acta 2011, 9, 129–147. [Google Scholar]
  50. Juergens-Gschwind, S. Ground water nitrates in other developed countries (Europe). Relationships to land use patterns. In Nitrogen Management and Groundwater Protection; Follett, R.F., Ed.; Elsevier Science Publisher: Amsterdam, The Netherlands, 1989; pp. 75–138. ISBN 9780444599391. [Google Scholar]
  51. Chief Inspectorate for Environmental Protection. Chemistry of Precipitation-Concentration and Loads. Available online: https://powietrze.gios.gov.pl/pjp/maps/chemistry/concentration?lang=en (accessed on 22 February 2022).
  52. Jaguś, A.; Rzętała, M. Kozłowa Góra Water Reservoir. Functioning and Protection against a Background of Geographical and Limnological Characteristics; Polish Geographical Society, Hydrological Commission: Warsaw, Poland, 2003; p. 156. ISBN 83–919007–0-3. [Google Scholar]
  53. Kiedryńska, L.; Papciak, D.; Granops, M. Chemia Sanitarna; Wydawnictwo SGGW: Warsaw, Poland, 2006; p. 194. ISBN 83–7244–803–5. [Google Scholar]
  54. Ulańczyk, R.; Kożuch, B. Monitoring środowiska wodnego i badania modelowe realizowane w obszarze zlewni zbiornika Kozłowa Góra. Gospod. Wodna 2020, 2, 19–22. [Google Scholar]
Figure 1. Land use and identified contamination sources within the Kozłowa Góra catchment area, based on [30,31,32].
Water 14 00846 g001
Figure 2. Geology and hydrogeological conditions of the study area based on [31,32].
Water 14 00846 g002
Figure 3. Isotopic composition of sulphate in surface water and groundwater in the catchment area of the Kozłowa Góra reservoir sampled in June 2020, January 2021, and June 2021. Coloured boxes represent typical isotopic signatures of different SO42− sources [12,26,45,46,47,48,49]. Isotopic signatures of treated and untreated wastewater and synthetic fertilisers are from another study based on local sources (unpublished).
Water 14 00846 g003
Figure 4. Concentrations of SO42− vs. (HCO3 + Cl) in the collected water samples.
Water 14 00846 g004
Figure 5. Piper diagrams for water samples collected in four sampling campaigns.
Water 14 00846 g005
Figure 6. Relationship between NO3/Cl ratio and concentrations of Cl.
Water 14 00846 g006
Figure 7. Variations in NO3 and NH4+ concentrations within the study area.
Water 14 00846 g007
Table 1. Results of measured parameters in sampled water (maximum and minimum values).
Parameter
(Unit)
Brynica RiverStreamsReservoirGroundwater
T
(°C)
min
max
1.0 (R2)
17.8 (R4)
2.6 (S2)
18.8 (S7)
0.5 (Z1)
24.6 (Z1)
6.8 (W1)
14.6 (W3)
pH min
max
6.96 (R2)
7.75 (R1)
6.55 (S1)
7.94 (S10)
6.58 (Z2)
8.88 (Z1)
6.37 (W1)
7.61 (W3)
EC (µS/cm)min
max
374 (R4)
742 (R5)
210 (S11)
1010 (S10)
335 (Z1)
460 (Z1)
182 (W1)
1650 (W4)
Eh
(mV)
min
max
34 (R1)
206 (R2)
−93 (S7)
183 (S4)
90 (Z3)
189 (Z1)
−13 (W2)
238 (W1)
O2
(mg/L)
min
max
2.84 (R2)
10.50 (R2)
2.60 (S10)
9.30 (S6)
6.27 (Z1)
10.10 (Z3)
4.09 (W3)
7.79 (W2)
Ca2+
(mg/L)
min
max
62 (R3)
120 (R1)
27 (S11)
102 (S4)
45 (Z2,Z3)
78 (Z2)
38 (W1)
184 (W4)
Mg2+
(mg/L)
min
max
4.1 (R1)
22 (R3,R4)
5.5 (S1)
38 (S6,S7)
11 (Z3)
20 (Z2)
4.2 (W1)
34 (W4)
Na+
(mg/L)
min
max
7.7 (R1)
52 (R5)
4.2 (S11)
65 (S9)
9.8 (Z3)
16 (Z1)
3.0 (W1)
135 (W4)
K+
(mg/L)
min
max
2.1 (R1,R2)
18 (R5)
1.1 (S11)
90 (S4)
3.6 (Z3)
5.3 (Z2)
2.6 (W1)
38 (W4)
HCO3
(mg/L)
min
max
124 R4)
291 (R1)
48 (S11)
466 (S10)
119 (Z3)
177 (Z3)
57 (W1)
592 (W4)
SO42−
(mg/L)
min
max
31 (R2)
99 (R4)
<10 (S2)
110 (S9,S11)
40 (Z2)
66 (Z1)
21 (W1)
104 (W4)
Cl
(mg/L)
min
max
16 (R1)
84 (R5)
7.8 (S7)
114 (S9)
19 (Z3)
32 (Z1,Z2)
<5 (W1,W2,W3)
256 W4)
PO43−
(mg/L)
min
max
<0.05
0.141 (R4)
<0.05
12.5 (S10)
<0.05<0.05
3.200 (W3)
TOC
(mg/L)
min
max
4.5 (R1)
22 (R3)
3.9 (S1)
120 (S7)
8.7 (Z2)
14 (Z2)
2.2 (W2)
11 (W1)
NO3
(mg/L)
min
max
0.9 (R2)
12.8 (R1)
0.4 (S2,S11)
22.6 (S6)
0.9 (Z1,Z2)
3.5 (Z2)
7.5 (W1)
79.7 (W2)
NO2
(mg/L)
min
max
0.010 (R2)
0.253 (R5)
<0.002 (S7)
0.148 (S7)
0.010 (Z1)
0.033 (Z2)
0.010 (W1)
0.240 (W3)
NH4+
(mg/L)
min
max
<0.01 (R3,R4,R5,R6)
0.84 (R4)
<0.01 (S9)
51.52 (S10)
<0.01 (Z2)
0.21 (Z1)
<0.01
0.30 (W2)
Table 2. Results of measured δ34S and δ18O in sampled water (maximum and minimum values).
Parameter
(Unit)
R2R3R4R5 1R6S4S6S7S9S11Z1Z2Z3W3W4
δ34SVCDT (‰)min
max
6.66
11.85
6.88
7.38
5.30
7.04
5.124.94
6.48
6.37
7.45
5.94
6.56
8.63
12.28
4.38
7.36
9.14
13.39
7.31
9.38
7.12
9.57
4.01
10.09
4.87
7.52
2.96
5.17
δ18OVSMOW (‰)min
max
6.69
13.30
5.97
6.42
4.62
6.31
5.384.82
5.87
5.29
8.48
3.59
6.28
7.45
11.73
4.50
7.70
9.11
11.69
6.43
8.40
6.45
8.66
6.41
10.46
2.69
3.25
5.16
6.73
1 Isotopic composition of SO42− was measured only once, in June 2021.
Publisher’s Note: MDPI stays neutral with regard to jurisdictional claims in published maps and institutional affiliations.

