
Observations of Drifting Snow Using FlowCapt Sensors in the Southern Altai Mountains, Central Asia


1
Koktokay Snow Station, State Key Laboratory of Cryospheric Science, Northwest Institute of Eco-Environment and Resources, Chinese Academy of Sciences, Lanzhou 730000, China
2
College of Urban and Environmental Sciences, Northwest University, Xi’an 710127, China
*
Author to whom correspondence should be addressed.
Water 2022, 14(6), 845; https://doi.org/10.3390/w14060845
Submission received: 16 February 2022
/
Revised: 5 March 2022
/
Accepted: 7 March 2022
/
Published: 8 March 2022
(This article belongs to the Section New Sensors, New Technologies and Machine Learning in Water Sciences)
Abstract
:Drifting snow is a significant factor in snow redistribution and cascading snow incidents. However, field observations of drifting snow are relatively difficult due to limitations in observation technology, and drifting snow observation data are scarce. The FlowCapt sensor is a relatively stable sensor that has been widely used in recent years to obtain drifting snow observations. This study presents the results from two FlowCapt sensors that were employed to obtain field observations of drifting snow during the 2017–2018 snow season in the southern Altai Mountains, Central Asia, where the snow cover is widely distributed. The results demonstrate that the FlowCapt sensor can successfully acquire stable field observations of drifting snow. Drifting snow occurs mainly within the height range of 80-cm zone above the snow surface, which accounts for 97.73% of the total snow mass transport. There were three typical snowdrift events during the 2017–2018 observation period, and the total snowdrift flux caused during these key events accounted for 87.5% of the total snow mass transport. Wind speed controls the occurrence of drifting snow, and the threshold wind speed (friction velocity) for drifting snow is approximately 3.0 m/s (0.15 m/s); the potential for drifting snow increases rapidly above 3.0 m/s, with drifting snow essentially being inevitable for wind speeds above 7.0 m/s. Similarly, the snowdrift flux is also controlled by wind speed. The observed maximum snowdrift flux reaches 192.00 g/(m2·s) and the total snow transport is 584.9 kg/m during the snow season. Although drifting snow will lead to a redistribution of the snow mass, any accumulation or loss of the snow mass is also affected synergistically by other factors, such as topography and snow properties. This study provides a paradigm for establishing a field observation network for drifting snow monitoring in the southern Altai Mountains and bridges the gaps toward elucidating the mechanisms of drifting snow in the Altai Mountains of Central Asia. A broader network of drifting snow observations will provide key data for the prevention and control of drifting snow incidents, such as the design height of windbreak fences installed on both sides of highways.
1. Introduction
Nearly half of the land surface in the Northern Hemisphere, or 4.5 × 10⁷ km2, is covered by snow in winter, with ~3062 × 109 tons of average annual snowfall contributing to this extensive snow cover [1,2]. Snow cover cools the surface by reflecting shortwave radiation and consuming huge amounts of energy via the spring snowmelt, with snowmelt runoff being regulated by winter storage as a solid and springtime release as snowmelt [3,4,5,6]. Furthermore, snow cover has an important insulating effect on the ground surface by blocking energy exchange between the atmosphere and surface, which also affects vegetation and microbial habitats [7,8,9]. The supply, regulation, and habitat functions of snow cover are dominated by snow properties, such as snow depth, snow water equivalent (SWE), and albedo. For example, the thermal effect of snow cover will peak when the snow depth is at its optimal thickness, which varies from 40 to 70 cm [7]. The snow depth, a key parameter that describes seasonal snow cover, is not only affected by snowfall, topography, and vegetation, but also by wind, which leads to snow redistribution via drifting [10,11,12].
Wind-induced snow transport can be divided into two types, including blowing snow and drifting snow. Blowing snow is defined as snow lifted from the surface by the wind, at a height of 2.4 m or more, that will reduce visibility. While drifting snow, similar to blowing snow, is defined as snow lifted from the surface by the wind. The key difference is that the lifted snow remains below 2.4 m. Once it rises to 2.4 m or higher, it becomes blowing snow. In this study, drifting snow controls the snow transport by wind. Regardless, the wind not only redistributes snow via creep, saltation, and turbulent suspension but also contributes snow loss via sublimation [13,14,15]. Snow redistribution due to drifting will also induce cascading effects on the socio-economic system and ecological environment. For example, drifting snow will worsen the traffic conditions, which may lead to traffic accidents due to reduced visibility [16]. Snow redistribution due to drifting snow may also lead to snow accumulation on roads, which will block traffic. Snow fences are installed on both sides of roads as an effective mitigation tool, reducing the impact of drifting snow on traffic by decreasing the wind speed and capturing more snow on the lee side of the barrier or fence [17]. Furthermore, this redistribution due to drifting snow may result in spatial heterogeneities in the meltwater resources across the steppe region, which will then exacerbate spatial heterogeneities in vegetation by altering the hydrothermal conditions of the soil [18]. Drifting snow sublimation may also represent serious moisture loss [19], with the simulated snow mass loss due to drifting snow sublimation being 69.8 mm in the Qilian Mountains in the northern Qinghai-Tibet Plateau, which accounts for ~23.99% of the total snowfall in the area [14].
Numerical models have become an important tool for simulation studies of drifting snow due to limited observations [20,21]. However, field observations of drifting snow need to be acquired to calibrate and validate the numerical models. Field observation methods have gradually evolved from manual records of drifting snow events to automatic records of snowdrift flux to address this increasing need for observations [18,22,23]. The FlowCapt sensor is a relatively stable acoustic sensor [24,25,26] that is now widely used for monitoring drifting snow around the world, including East Antarctica [27,28], the Indian Himalayas [29], and the French Alps [30]. The observation results indicated that the FlowCapt sensor is a reliable means of determining the occurrence and strength of drifting snow events [25].
The Altai Mountains in Inner Asia form a biogeographical divide between the cold polar and arid regions of Central Asia [31] and represent the southern boundary of latitudinal permafrost [32] and stable snow cover [33,34]. Abundant snowfall not only provides a large amount of freshwater [35,36] and controls the soil thermal regime [7], but also induces various natural incidents. The Altai region is the incident center of northern Xinjiang, with snow-related incidents such as snowstorms and drifting snow being the main incident types. Nevertheless, the Altai regions remain poorly understood, and observational data on snow incidents, including drifting snow events, are extremely limited. Therefore, we conducted field observations of drifting snow using FlowCapt sensors in the Altai Mountains, Central Asia, to address this observational gap. Here we utilize the FlowCapt data acquired during the 2017–2018 snow season at Kayier observation site of Koktokay Snow Station to highlight the viability of the FlowCapt sensor for drifting snow monitoring in the Altai Mountains and provide constraints on the occurrence and strength of drifting snow, which will provide a basis for building an integrated field observation network for monitoring drifting snow conditions in the near future.
2. Study Area and Field Observations
2.1. Study Area
The Altai Mountains are a complex transboundary mountain system that stretches across China, Kazakhstan, Mongolia, and Russia in Inner Asia and form an important “Water Tower” for the wider region. The snow and glacier meltwater from this mountain range feed the surrounding lakes, rivers, and streams, which are critical to economic activities across this region [35,37,38]. Spring snowmelt controls the hydrological processes and contributes >40% of the water resources to the region [36]. The seasonal distribution of precipitation, which is controlled by multiple water vapor sources, is fairly uniform [39], whereas the synergistic effects of global warming and Arctic amplification lead to frequent extreme snowfall events in the Altai Mountains [40]. Precipitation is dominated by snowfall during the winter months [41], and persistent snow cover commonly lasts from November until April, with residual snow surviving until June across higher elevations [42]. Snow depth decreases from west to east, and increases gradually from the plains to the mountains, with annual maximum snow depths above 1.0 m in mountainous areas [10]. Snow Fork observations revealed negligible liquid water content in the higher elevations until mid-March [43], although snow crusts may appear earlier in certain years owing to the refreezing of thawing surface snow.
Snow incidents, including snowstorms, drifting snow, and snowmelt floods, are the dominant disasters in northern Xinjiang [44], whereas drifting snow is the most frequent and serious disaster in the Altai and Tien mountains due to the low snow density and liquid water content in the regional snow cover [10,43], which facilitates the movement of snow particles. The potential wind energy in northern Xinjiang is immense, with wind speeds primarily in the 2–9 m/s range [45], providing favorable conditions for drifting snow. Our field survey indicates that almost all of the roads in northern Xinjiang are affected by drifting snow every year. Although some roads have been partially protected by snow fences, traffic disruptions caused by drifting snow remain common during the winter [46]. Effective mitigation of the impact of snowstorms and drifting snow on traffic is critical for ensuring traffic safety and efficient operations in the areas surrounding the Altai and Tien mountains.
2.2. Field Observations and Methods
Koktokay Snow Station was established in August 2011 by the State Key Laboratory of Cryospheric Science of the Northwest Institute of Eco-Environment and Resources, Chinese Academy of Sciences, to offset the lack of basic scientific data in the transboundary mountainous areas by investigating the hydrometeorological conditions, especially snow hydrology, across the 800–3100 m a.s.l. (above sea level) vertical landscape in the headwaters of the transboundary Altai Mountains between China and Mongolia. Seven integrated snow observation systems are currently in operation across the southern Chinese Altai Mountains, which consisting of Kuwei (47°21′9.10″ N, 89°39′43.22″ E, 1379 m a.s.l.), Kayier (47°42′28.50″ N, 89°44′32.63″ E, 1800 m a.s.l.), Jinge (47°42′36.20″ N, 89°59′35.41″ E, 2175 m a.s.l.), Sandaohaizi (46°49′36.68″ N, 90°51′22.48″ E, 2650 m a.s.l.), Koksuli (47°01′26″ N, 89°46′44″ E, 1265 m a.s.l.), Akeshala (47°54′36.68″ N, 89°23′52.48″ E, 1850 m a.s.l.), and Ski Resort (47°10′32″ N, 90°06′29″ E, 2950 m a.s.l.) (Figure 1a) and a complete snow observation network has been established across the transboundary watersheds of the Chinese Altai Mountains. The observation results by Kuwei Observation site of Koktokay Snow Station from 2011 to 2020 showed that the average annual maximum snow depth in this region was 65.5 cm, and the accumulated precipitation from October to next April was approximate 199.5 mm.
Koktokay Snow Station established a snowdrift observation system named Kayier observation site (Figure 1b,c) in October 2017 to monitor drifting snow processes in mountainous areas. The Kayier snowdrift observation site is located in the north–south open valley of the source area of the Irtysh River. The ground is relatively flat within the valley, and the land surface is covered by sparse grassland with a maximum grass height of 10 cm. All the sensors were installed on the central valley floor, more than 500 m from the valley walls. Meteorological conditions and snowdrift fluxes were collected via an automatic meteorological station. Temperature, relative humidity, and vapor pressure observations were acquired using an integrated WS300 sensor (Geonor, Branchville, NJ, USA) that was installed 1.5 m above the ground surface, and the energy balance between the incoming short and long-wave far infrared (FIR) radiation versus the surface-reflected short-wave and outgoing long-wave radiation was measured using a CNR4 Net Radiometer (Kipp and Zonen, Delft, The Netherlands) installed 2.0 m above the ground surface. The snow depth was recorded using an SR50A sonic distance sensor installed 2.0 m above the ground surface, and precipitation (including rainfall and snowfall) was measured using the T-200B precipitation gauges (Campbell Scientific, Logan, UT, USA). Two two-dimensional ultrasonic wind sensors (WindSonic4-L, GILL Instruments, Lymington, UK) were installed 0.75 and 1.50 m above the ground surface to monitor the wind speed and direction. Two second-generation FlowCapt sensors were mounted 0–1 m and 1–2 m above the ground surface, to monitor speed wind and snowdrift flux. The lower detection limit of the FlowCapt sensor for the FlowCapt flux is 0.001 g/(m2·s) and the internal sampling interval is 15 s. The 15-s FlowCapt flux is then converted to a 10-min average value by its internal firmware program (Campbell CR200). All the sensor data were recorded to a CR3000 datalogger at a 10-min interval. The principal sensors and their respective resolutions are given in Table 1. The study used dataset was from 1 December 2017 to 15 April 2018.
The wind is the most critical factor in the study of drifting snow. Although the second-generation FlowCapt sensor can estimate wind speed based on pressure changes, the uncertainty is significant. To ensure accuracy, the wind speed used in this study is from the Gill 2D sonic anemometer rather than that derived from the FlowCapt sensors. To estimate a threshold wind speed for the occurrence of drifting snow and compare it with other studies, corresponding friction velocity was calculated using the following formula [47]:
where is the friction velocity, is the horizontal wind speed at height z above the snow surface, (0.04) is the von Karman constant, and (0.00024 m) is the roughness length of the snow surface [48].
The accuracy of snowdrift flux derived from the second-generation FlowCapt sensor has been significantly improved, but the snowfall contributes significantly to the mass flux measured by the FlowCapt sensor [27]. Hence, the snowdrift fluxes were excluded during snowfall. The total snow transport (TST) in the unit of kg/m was calculated by integrating the snowdrift flux (SDF) over height and time:
where was the length of the FlowCapt tube (1 m), , and were the snowdrift flux observed by the lower and upper FlowCapt sensors and snow depth at the i-th 10-min interval. The constant 600 was the time in seconds for each interval and n was the total number of intervals from 1 December 2017 to 15 April 2018. The total snow transport of each FlowCapt sensor can be calculated, separately.
3. Results and Discussion
3.1. Meteorological and Snow Conditions
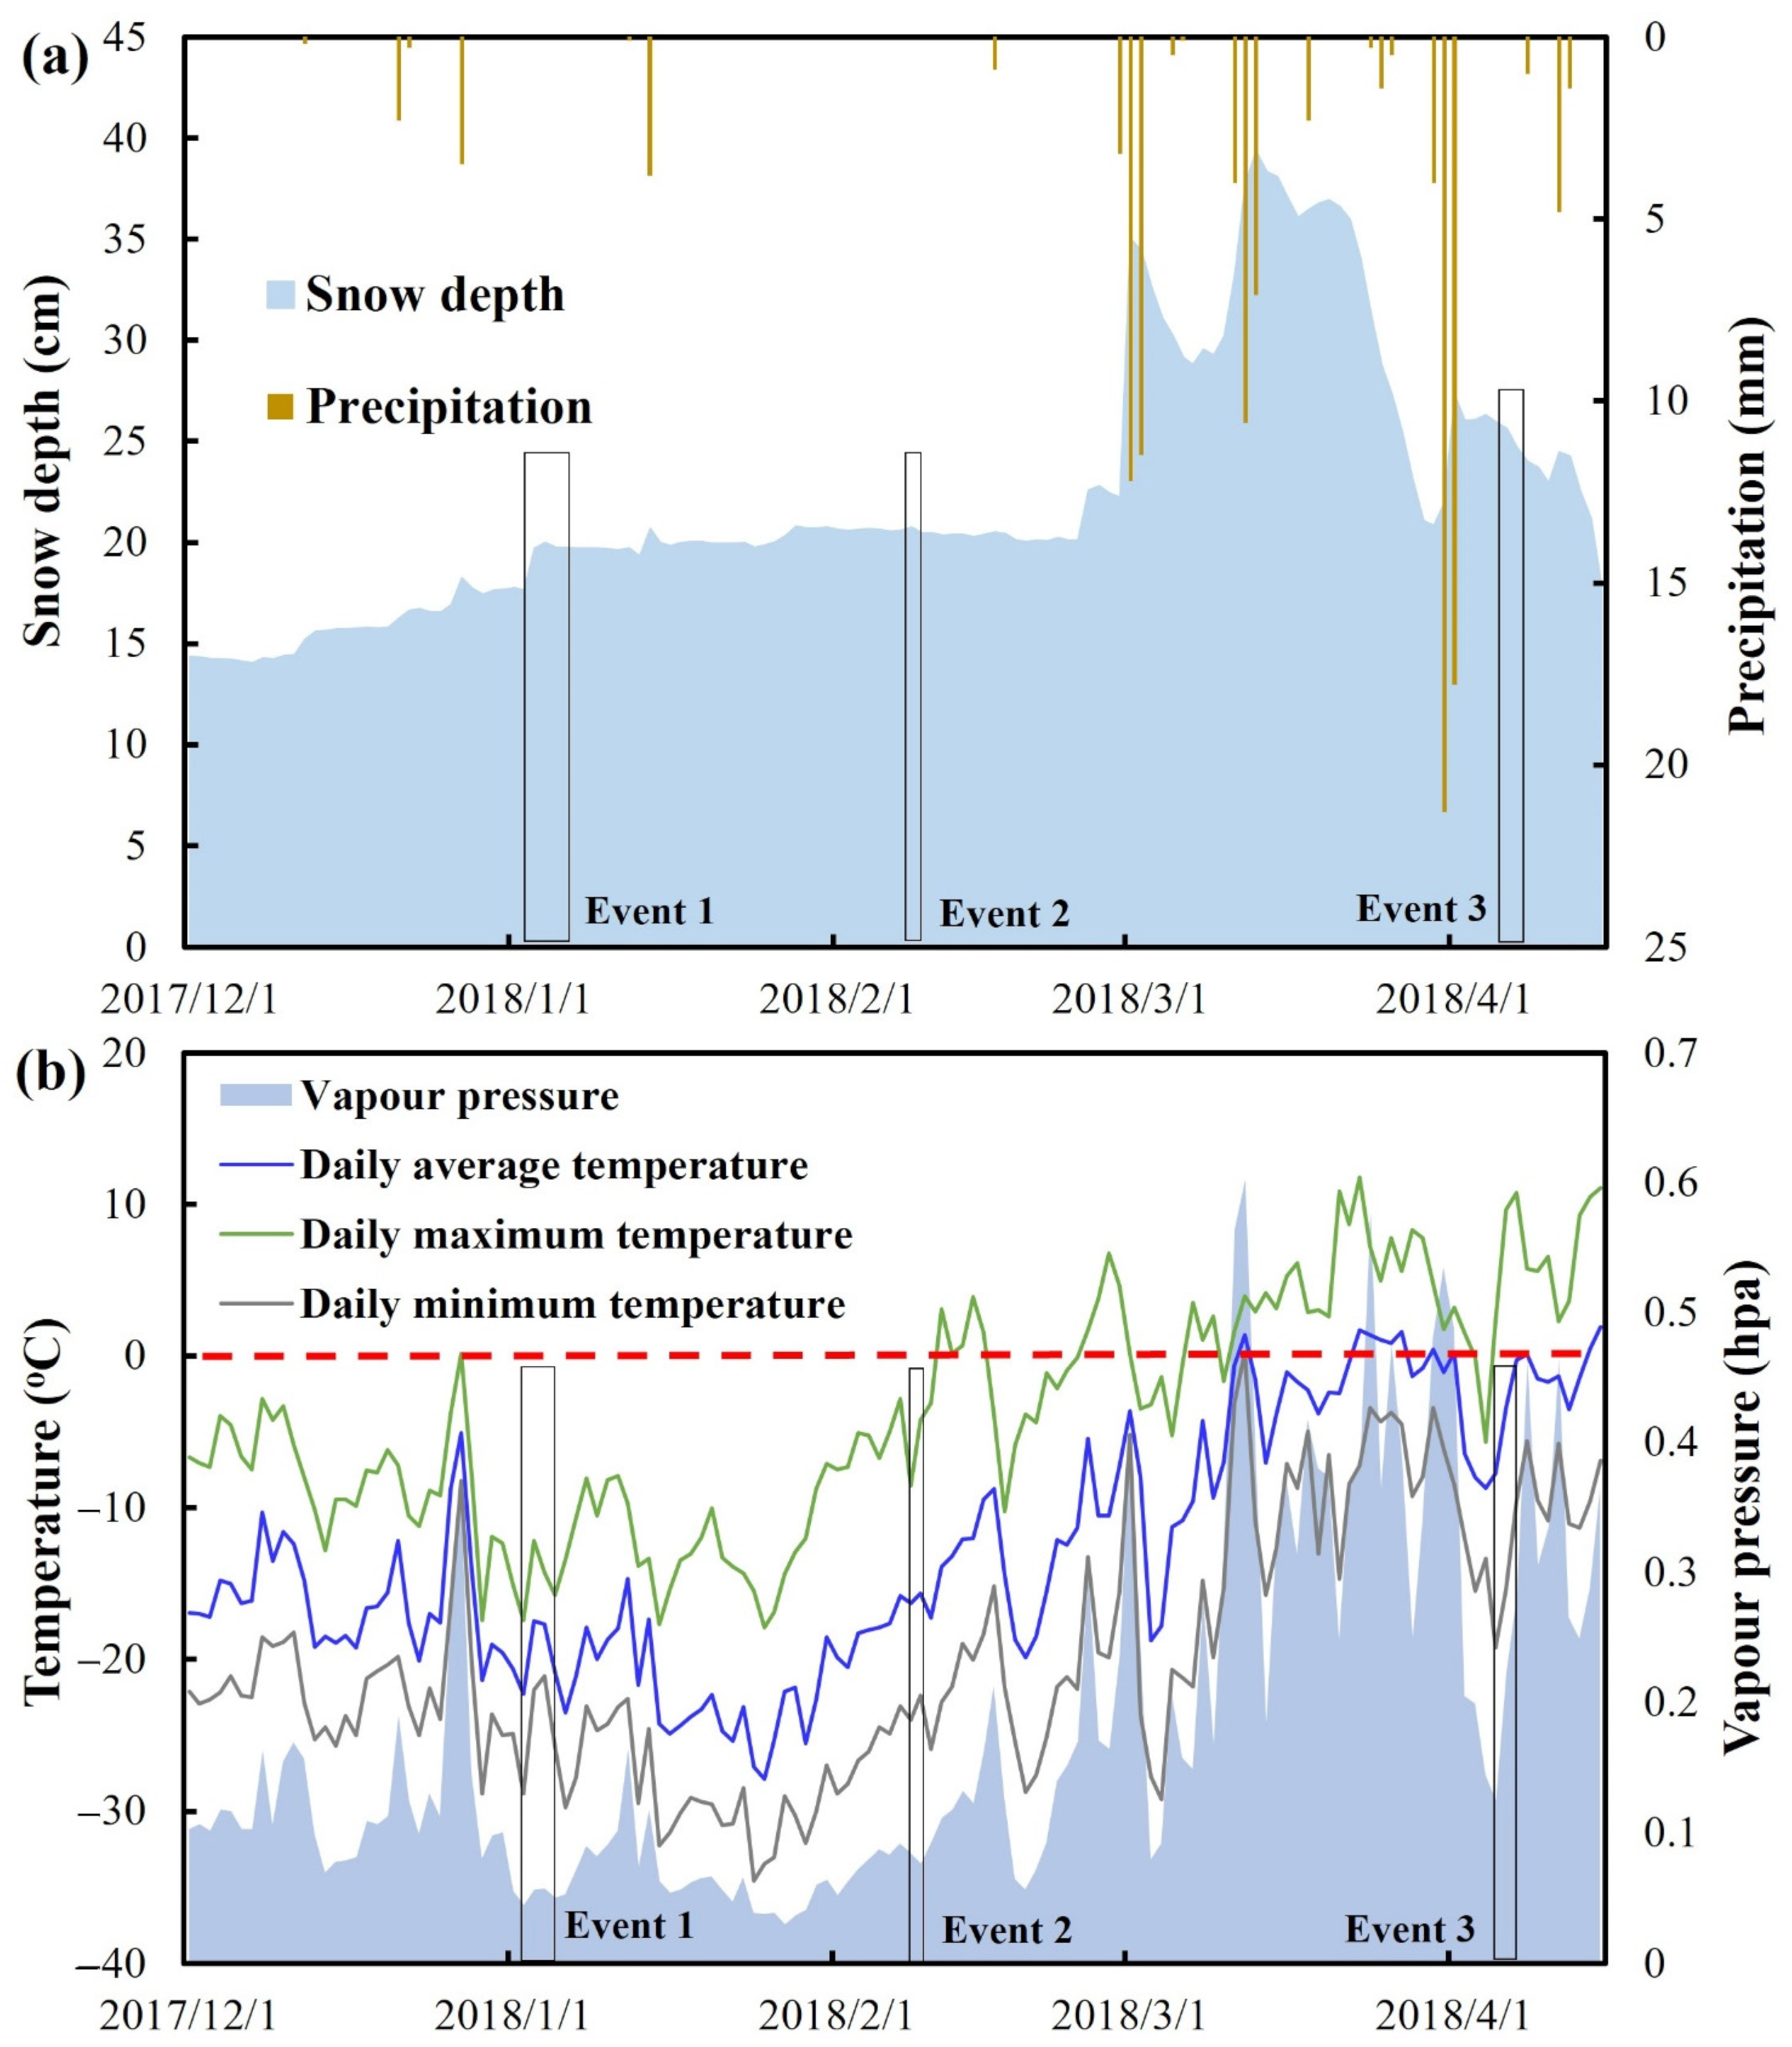
The precipitation, snow depth, air temperature, relative humidity, and vapor pressure records that were observed at the Kayier snowdrift observation site during the December 2017–April 2018 period are shown in Figure 2. The stable winter snow cover, which possessed an average snow depth of 22.3 cm and varied from 14.2 cm on 3 December 2017, to 39.3 cm on 13 March 2018, is conducive to drifting snow. A 14-cm snow depth is sufficient to cover the steppe, such that the effect of vegetation on drifting snow is negligible. Although the snow cover duration was stable, the snow mass was relatively smaller compared with other years, with this difference reflected mainly in the maximum snow depth and average snow depths [7,49]. There was only 14.3 mm of winter snowfall, with only a 7-cm increase in snow depth during the winter. The snow cover was stable and there was likely no significant snowmelt until the end of February because the daily average temperature was always below 0 °C even though the daily maximum temperature was instantly above zero °C (Figure 2b). The vapor pressure is mainly controlled by evaporation intensity. Compared with snow sublimation, the cascade evaporation caused by snow melting will significantly increase the increase of vapor content in the air and further lead to the increase of water vapor pressure. Hence, the vapor pressure variations (Figure 2) also serve as indicators of no significant wintertime snowmelt events. However, it was difficult to determine if a snow crust had formed due to the slight melting of the surface snow, as this would greatly affect the drifting snow probability and flux.
The wind speeds of 0–1 m (WS01) and 1–2 m (WS12) above the ground surface were monitored simultaneously by two two-dimensional ultrasonic wind sensors. The relationship between the daily average WS01 and WS12 wind speeds, and the daily average WS01 (AWS01) and maximum 10-min average WS01 (MWS01) wind speeds are shown in Figure 3. WS01 exhibits a clear linear relationship with WS12, as an R2 value of 0.98 is obtained, with the WS12 wind speed being slightly larger than the WS01 wind speed during the observation period (Figure 3a). This relationship suggests that the average wind speed can be used to analyze the influence of wind speed on the snowdrift flux, as the wind speed is relatively stable within the 0–2 m surface layer. The wind speeds around the observation site, which is located within the valley, are generally moderate. The ranges for the daily WS01 and daily maximum 10-min average WS01 wind speeds during the 1 December 2017–13 March 2018 period were 0.95–5.01 and 2.56–8.68 m/s, with average values of 2.13 and 4.61 m/s, respectively.
3.2. Observed Snowdrift Fluxes
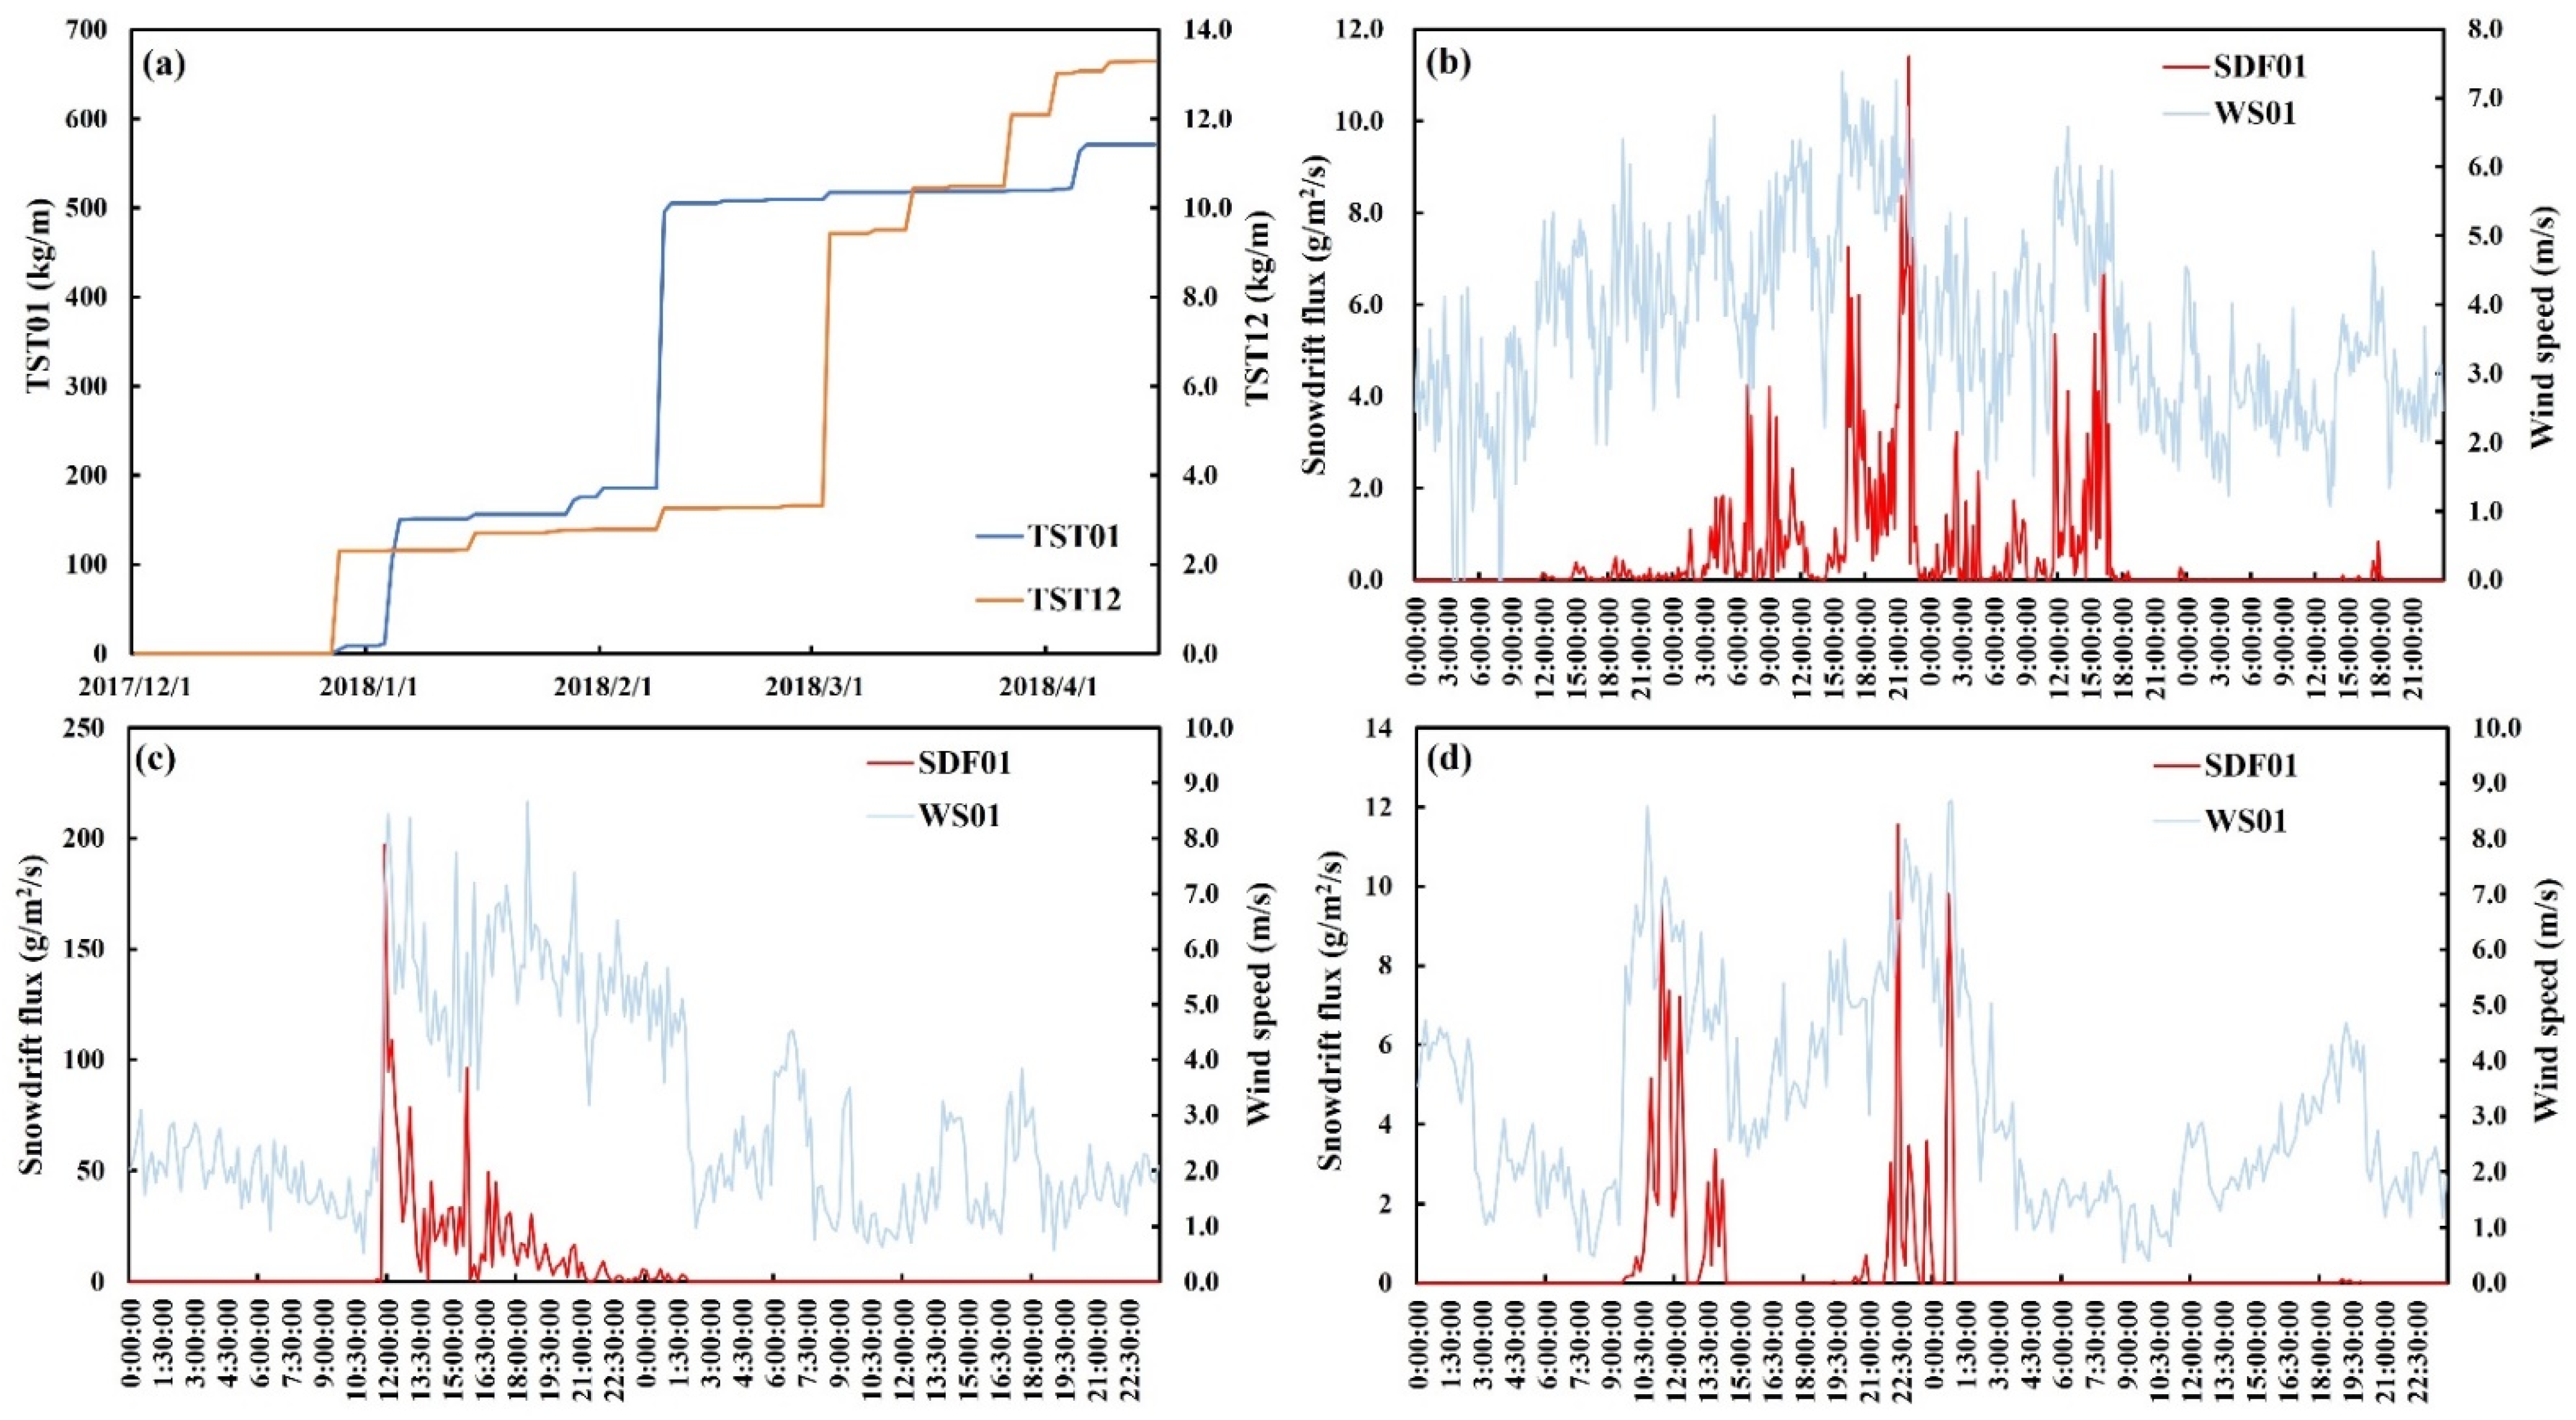
The total snow transports (TSTs) that were obtained by the two FlowCapt sensors are compared during the study period, with the results shown in Figure 4a. The TST01 (0–1 m height) and TST12 (1–2 m height) fluxes reached peak values of 571.6 and 13.3 kg/m, respectively, yielding a total snowdrift flux of 584.9 kg/m. Drifting snow conditions persisted mainly at a height of <80 cm above the snow surface for the average snow depth of 22.3 cm, with the TST01 accounting for 97.73% of the total snowdrift flux. The key zone for drifting snow will shift upward with increasing snow depth, but the snowdrift flux may remain concentrated within the 80-cm zone above the snow surface. This result is similar to that observed in the northern steppe region of China, where 89.61% of the total amount of drifting snow occurred within 30.0 cm of the snow surface [18].
We have identified three significant drifting snow events during the observation period: 2–5 January 2018 (Event 1); 8–9 February 2018 (Event 2); and 4–6 April 2018 (Event 3; Figure 4a). The TSTs for the three events were 141.3, 319.7, and 50.5 kg/m, respectively, and the TST for the three events was 511.5 kg/m, which accounted for ~87.5% of that during the snow season. The observed SDF01 and WS01 values during the Event 1, 2, and 3 periods were displayed in Figure 4b–d, respectively. Continuous drifting snow lasted for >30 h during Event 1, beginning at about 11:00 (GMT) on 3 January and ending around 17:00 on 4 January, whereas continuous drifting snow lasted only 16 h during Event 2, beginning at about 11:00 on 8 February and ending around 2:00 on 9 February, and Event 3 including two small drifting snow events lasted 16 h, accounting for half of Event 1. The drifting snow intensities during Event 1 were significantly lower than that during Event 2, with maximum 10-min average snowdrift fluxes of 11.40, and 192.00 g/(m2·s), respectively, which resulted in twice TST during Event 2 compared with that during Event 1, even though the Event 2 duration was half as long as the Event 1 duration.
Although the occurrence of these typical snowdrift events remains unclear, there is no doubt that the wind speed and snow characteristics play a crucial role. The most recent snowfall before a snowdrift event occurred on 27 December 2017, five days before Event 1, with 3.5 mm of snowfall recorded, which resulted in an approximately 1.5-cm increase in snow depth. The overall wind speed was relatively low after this snowfall event, with a daily wind speed of less than 2.0 m/s. However, the wind speed began to increase on January 1, and reached a maximum on 3 January (Figure 3b and Figure 4b). Snow also began to drift on 2 January, with the maximum snowdrift flux attained by 3 January. This new snowfall provided favorable conditions for the occurrence of Event 1. However, the occurrence of Event 2 was largely controlled by the wind speed. During Event 2, the average wind speed was 5.49 m/s, and 10-min average wind speeds varied from 3.15 to 8.66 m/s. The precipitation and snow depth observations indicate that only 3.8 mm of snowfall occurred between Events 1 and 2, with this snowfall event occurring on 14 January. The snow age had exceeded 20 days by Event 2, and the snow cover was in a very stable state (Figure 2a). However, the steady snow depth before and after Event 2 (Figure 4c). The steady snow depth before and after Event 2 (Figure 2a) suggests that a snow crust might have formed before Event 2, which would have made the snow cover around the observation site difficult to pick up or hold.
Drifting snow is an important factor in the redistribution of snow cover that is also influenced by topography and vegetation conditions. As mentioned above, the drifting snow during Event 2 did not have a substantial impact on the snow cover mass around the observation field because the snow cover was stable, even though this was an intense drifting snow event. This occurred because the observation field was located in the center of the relatively flat valley, which served as a channel for drifting snow, and there was no snow accumulation due to the flat terrain and stable snow cover. However, there was a 2.4-cm increase in snow depth from 17.6 to 20.0 cm due to Event 1. Both the relatively low wind speed and young snow cover, which made it easy for snow grains to attach to the snow surface, likely promoted the accumulation of drifting snow around the observation field. Overall, the observations suggest that wind not only determines the snowdrift occurrence but may also influence drifting-induced snow accumulation or loss.
3.3. Relationship between Drifting Snow and Wind
The wind is the dominant factor for drifting snow. The relationship between wind speed (friction velocity) and drifting snow was investigated during the 1 December 2017–15 April 2018 period, with the relevant results shown in Figure 5. The occurrence probability of drifting snow rose dramatically following an increase in wind speed (Figure 5a) and friction velocity (Figure 5b), with the wind speed (friction velocity) threshold for drifting snow deduced to be 3.0 m/s (0.15 m/s). The probability of drifting snow was <5% when the wind speed (friction velocity) was below 3.0 m/s (0.15 m/s), with largely negligible snowdrift events occurring at these low wind speeds. However, the probability of drifting snow increases abruptly as the wind speed increases from 3.0 to 4.0 m/s, 4.0 to 5.0 m/s, 5.0 to 6.0 m/s, and 6.0 to 7.0 m/s, with occurrence probabilities of 22.87%, 62.18%, 85.14%, and 92.21%, respectively. We can arbitrarily infer that drifting snow will almost certainly occur once the wind speed (friction velocity) exceeds 7.0 m/s (0.4 m/s). This statement applies only to crust-free conditions and that with a strong crust much higher wind speeds can occur with no drifting snow.
The average snowdrift fluxes were calculated for each 1-m/s wind speed (0.05-m/s friction velocity) interval, with the relationship between the snowdrift fluxes and wind speed (friction velocity) shown in Figure 5. Similar to the probability curve for drifting snow, the snowdrift flux was almost negligible when the wind speed (friction velocity) was below 3 m/s (0.15 m/s), and then began to increase as the wind speed increased. The snowdrift fluxes were 1.08, 2.66, 7.45, and 8.89 g/(m2·s), respectively, when the wind speed increased from the 3.0–4.0-m/s interval to the 6.0–7.0-m/s interval. The average snowdrift flux reached 41.51 g/(m2·s) when the wind speed was in the 7.0–8.7 m/s range, with an average wind speed of 7.6 m/s. These observations indicate that the snowdrift fluxes increased exponentially with increasing wind speed.
3.4. Factors Affecting Drifting Snow
Snow characteristics significantly affect the occurrence, frequency, and intensity of drifting snow [18,22,50]. Drifting snow generally occurs a few days after a given snowfall. The adhesion stress between snow grains increases as the snow age increases due to melting, refreezing, and/or compaction processes in the surface snow, such that the movement of the snow grains requires more kinetic energy [50]. In particular, the movement of snow grains will be even more difficult when a frozen snow crust or ice layer forms on the snow surface [51]. New snow is, therefore, more likely to be picked up than old snow, resulting in a typical drifting snow event. Events 1 and 3 occurred within a few days of new snowfall events, and the snow depth changed significantly before and after these two drifting snow events. However, although the intensity of Event 2 was much greater than those of the other events, the snow depth remained almost constant before and after Event 2; the presence of a surface snow crust may be the main reason for the relatively unchanged snow surface. In terms of the material source of drifting snow during Event 2, we inferred that it came from the upwind direction of the observation field. According to the local topography, the observation field was located in the central part of the valley bottom, and the snow in the upwind mountain was convenient to be blown up and accumulate near the downwind mountain. The properties of these new snowfall events, including the liquid water content and snow density, also lead to great differences in the adhesion stress between the snow grains, as higher liquid water content and/or higher snow density will result in larger adhesion stress between the snow grains [50,52,53,54]. Dry snow particles are more likely to be picked up by the wind than high-density wet snow, which may be an important reason why the drifting snow events in northwestern China are more severe than those in northeastern China [55].
The surface vegetation and topography have a joint effect on the occurrence of drifting snow by redistributing the snow cover and reducing the surface wind speed [56,57]. On the one hand, a heterogeneous snow distribution is due to interactions among topography, vegetation, and wind [10,58,59], which will change the snow mass that serves as the source for the drifting snow. Vegetation also greatly alters the snow characteristics, such as the snow temperature, density, and liquid water content, by changing the near-surface energy balance and meteorological conditions [43]. On the other hand, vegetation reduces the wind speed by increasing the thickness of the boundary layer, which in turn reduces the frequency and intensity of drifting snow [57,60]. The drifting snow intensity is significantly stronger when there is an abundant snow source and sparse vegetation than when there is an insufficient snow source and dense vegetation [18]. The snow depth was greater than the vegetation height during the 2017–2018 observation period, such that the vegetation effect on the drifting snow intensity was almost negligible. The average snow depth is generally more than 40.0 cm in the Altai Mountains [10], which is much higher than the grass height, such that drifting snow is almost undisturbed by the grass. However, the abundant forests in this region account for ~39.2% of the land cover in the headwaters of the Irtysh River [43], and will significantly reduce the likelihood of drifting snow.
Another key factor in determining the occurrence of drifting snow is wind, and, more importantly, the threshold wind speed, which is related to the properties of surface snow, which are in turn controlled by meteorological factors and vegetation. Visual observational data from the prairies of western Canada have indicated that the threshold wind speeds at 10.0 m above the surface for wet and dry snow transport are in the 7.0–14.0 and 4.0–11.0 m/s ranges, respectively [22]. Another study discovered that the threshold wind speed was approximately 4.0–5.0 m/s at 10 m above the snow surface for new or slightly aged cold dry snow [52], while the intensity of drifting snow increased exponentially, with a mean wind speed at 1.0 m and 2.0 m above the surface of 2.0 m/s determined along the northern steppe region of China using vertical porous traps [18]. The installation height of the wind speed sensor may be the reason for the great difference in the threshold wind speed. The threshold wind speed is generally closely related to the snow characteristics, and the threshold wind speed increases with either increasing deposition time or increasing temperature [50]. Both the probability and intensity of drifting snow increased exponentially when the wind speed exceeded 3.0 m/s in this study (Figure 5). The lower snow density and liquid water content before mid-March [43] may have led to the lower threshold wind speed for drifting snow in the Altai Mountains.
4. Conclusions
Our principal conclusions included the following:
- (1)
- The maximum snowdrift flux and total snow mass transport were 192.00 g/(m2·s) and 584.9 kg/m, respectively, during the 2017–2018 snow season. The snow mass transport via the FC01 sensor was 571.6 kg/m, which accounted for 97.73% of the total mass. Drifting snow mainly occurred within 80 cm of the snow surface. There were three typical snowdrift events during the observation period, and the total snow mass transport through the CSDF01 sensor was 511.5 kg/m2, which accounted for ~87.5% of the total mass.
- (2)
- The threshold wind speed (friction velocity) for drifting snow is 3.0 m/s (0.15 m/s). The probability of drifting snow is <5% when the wind speed is below the threshold wind speed; the occurrence probability increases abruptly as the wind speed (friction velocity) increases, with the probability of drifting snow exceeding 97.06% (98.14%) for wind speeds above 7.0 m/s (0.4 m/s). The average snowdrift fluxes varied from 1.08 to 41.51 g/(m2·s) when the average wind speed increased from 3.4 to 7.6 m/s.
- (3)
- Drifting snow is controlled by many factors, such as the snow characteristics, wind, vegetation conditions, and topography; the differences in these factors will lead to spatial heterogeneities in the snow redistribution due to drifting snow.
According to the occurrence height of drifting snow, the data observed by one FlowCapt sensor have a good representation when the average snow depth is below 30.0 cm. When constructing the drifting snow observation network in the Chinese Altai Mountains, one FlowCapt sensor is suitable when the average snow depth and two FlowCapt sensors are essential with snow depth over 70.0 cm. This will significantly save our observation cost.
Author Contributions
Conceptualization, W.Z. and Y.S.; methodology, W.Z.; investigation, J.H. and W.Z.; writing—original draft preparation, W.Z.; writing—review and editing, W.Z.; visualization, A.C. and X.W.; supervision, Y.S.; funding acquisition, W.Z. and Y.S. All authors have read and agreed to the published version of the manuscript.
Funding
This work was mainly supported by the National Key R&D Program of China (2019YFC1510502), and the National Natural Science Foundation of China (41690144, 41971083, 42071091). Dr. Anan Chen was supported by the National Natural Science Foundation of China (Grant Nos. 41801035). Funding was also provided by the State Key Laboratory of Cryospheric Science (SKLCS-ZZ-2022), and the Foundation for Excellent Youth Scholars of Northwest Institute of Eco-Environment and Resources, CAS.
Institutional Review Board Statement
Not applicable.
Informed Consent Statement
Not applicable.
Data Availability Statement
Not applicable.
Acknowledgments
Thanks are given to the editors and anonymous reviewers for their valuable suggestions for enriching the content and presentation.
Conflicts of Interest
The authors declare no conflict of interest.
References
- Pulliainen, J.; Luojus, K.; Derksen, C.; Mudryk, L.; Lemmetyinen, J.; Salminen, M.; Ikonen, J.; Takala, M.; Cohen, J.; Smolander, T.; et al. Patterns and trends of Northern Hemisphere snow mass from 1980 to 2018. Nature 2020, 581, 294–298. [Google Scholar] [CrossRef]
- Déry, S.J.; Brown, R.D. Recent Northern Hemisphere snow cover extent trends and implications for the snow-albedo feedback. Geophys. Res. Lett. 2007, 34, L22504. [Google Scholar] [CrossRef]
- Lievens, H.; Demuzere, M.; Marshall, H.-P.; Reichle, R.H.; Brucker, L.; Brangers, I.; de Rosnay, P.; Dumont, M.; Girotto, M.; Immerzeel, W.W.; et al. Snow depth variability in the Northern Hemisphere mountains observed from space. Nat. Commun. 2019, 10, 4629. [Google Scholar] [CrossRef]
- Yang, Y.; Wu, X.-J.; Liu, S.-W.; Xiao, C.-D.; Wang, X. Valuating service loss of snow cover in Irtysh River Basin. Adv. Clim. Chang. Res. 2019, 10, 109–112. [Google Scholar] [CrossRef]
- Qin, Y.; Abatzoglou, J.T.; Siebert, S.; Huning, L.S.; AghaKouchak, A.; Mankin, J.S.; Hong, C.; Tong, D.; Davis, S.J.; Mueller, N.D. Agricultural risks from changing snowmelt. Nat. Clim. Chang. 2020, 10, 459–465. [Google Scholar] [CrossRef]
- You, Q.; Wu, T.; Shen, L.; Pepin, N.; Zhang, L.; Jiang, Z.; Wu, Z.; Kang, S.; AghaKouchak, A. Review of snow cover variation over the Tibetan Plateau and its influence on the broad climate system. Earth Sci. Rev. 2020, 201, 103043. [Google Scholar] [CrossRef]
- Zhang, W.; Shen, Y.; Wang, X.; Kang, S.; Chen, A.a.; Mao, W.; Zhong, X. Snow cover controls seasonally frozen ground regime on the southern edge of Altai Mountains. Agric. For. Meteorol. 2021, 297, 108271. [Google Scholar] [CrossRef]
- Niittynen, P.; Heikkinen, R.K.; Luoto, M. Decreasing snow cover alters functional composition and diversity of Arctic tundra. Proc. Natl. Acad. Sci. USA 2020, 117, 21480–21487. [Google Scholar] [CrossRef] [PubMed]
- Xiao, C.-D.; Wang, S.-J.; Qin, D.-H. A preliminary study of cryosphere service function and value evaluation. Adv. Clim. Chang. Res. 2015, 6, 181–187. [Google Scholar] [CrossRef]
- Zhong, X.-Y.; Zhang, T.; Su, H.; Xiao, X.-X.; Wang, S.-F.; Hu, Y.-T.; Wang, H.-J.; Zheng, L.; Zhang, W.; Xu, M.; et al. Impacts of landscape and climatic factors on snow cover in the Altai Mountains, China. Adv. Clim. Chang. Res. 2021, 12, 95–107. [Google Scholar] [CrossRef]
- Dadic, R.; Mott, R.; Lehning, M.; Burlando, P. Wind influence on snow depth distribution and accumulation over glaciers. J. Geophys. Res. Earth Surf. 2010, 115, F01012. [Google Scholar] [CrossRef] [Green Version]
- Lehning, M.; Loewe, H.; Ryser, M.; Raderschall, N. Inhomogeneous precipitation distribution and snow transport in steep terrain. Water Res. Res. 2008, 44, W07404. [Google Scholar] [CrossRef] [Green Version]
- Nemoto, M.; Nishimura, K. Numerical simulation of snow saltation and suspension in a turbulent boundary layer. J. Geophys. Res. Atmos. 2004, 109, D18206. [Google Scholar] [CrossRef] [Green Version]
- Zhou, J.; Pomeroy, J.W.; Zhang, W.; Cheng, G.; Wang, G.; Chen, C. Simulating cold regions hydrological processes using a modular model in the west of China. J. Hydrol. 2014, 509, 13–24. [Google Scholar] [CrossRef] [Green Version]
- Huang, N.; Shi, G. The significance of vertical moisture diffusion on drifting snow sublimation near snow surface. Cryosphere 2017, 11, 3011–3021. [Google Scholar] [CrossRef] [Green Version]
- Matsuzawa, M.; Kajiya, Y.; Takeuchi, M. The development and validation of a method to estimate visibility during snowfall and blowing snow. Cold Reg. Sci. Technol. 2005, 41, 91–109. [Google Scholar] [CrossRef]
- Blanken, P.D. Designing a Living Snow Fence for Snow Drift Control. Arct. Ant. Alp. Res. 2009, 41, 418–425. [Google Scholar] [CrossRef] [Green Version]
- Zuo, H.; Yan, M.; Wang, H.; Dong, Z.; Li, G. Assessment of snow drift impact in the northern steppe region of China. CATENA 2019, 177, 219–226. [Google Scholar] [CrossRef]
- Savelyev, S.A.; Gordon, M.; Hanesiak, J.; Papakyriakou, T.; Taylor, P.A. Blowing snow studies in the Canadian Arctic Shelf Exchange Study, 2003–04. Hydrol. Proc. 2006, 20, 817–827. [Google Scholar] [CrossRef]
- Li, G.; Wang, Z.S.; Huang, N. A Snow Distribution Model Based on Snowfall and Snow Drifting Simulations in Mountain Area. J. Geophys. Res. Atmos. 2018, 123, 7193–7203. [Google Scholar] [CrossRef]
- Groot Zwaaftink, C.D.; Löwe, H.; Mott, R.; Bavay, M.; Lehning, M. Drifting snow sublimation: A high-resolution 3-D model with temperature and moisture feedbacks. J. Geophys. Res. Atmos. 2011, 116, D16107. [Google Scholar] [CrossRef] [Green Version]
- Li, L.; Pomeroy, J. Estimates of Threshold Wind Speeds for Snow Transport Using Meteorological Data. J. Appl. Meteorol. 1997, 36, 205–213. [Google Scholar] [CrossRef] [Green Version]
- Mahesh, A.; Eager, R.; Campbell, J.R.; Spinhirne, J.D. Observations of blowing snow at the South Pole. J. Geophys. Res. Atmos. 2003, 108, 4707. [Google Scholar] [CrossRef]
- Chritin, V.; Bolognesi, R.; Gubler, H. FlowCapt: A new acoustic sensor to measure snowdrift and wind velocity for avalanche forecasting. Cold Reg. Sci. Technol. 1999, 30, 125–133. [Google Scholar] [CrossRef]
- Jaedicke, C. Acoustic snowdrift measurements: Experiences from the FlowCapt instrument. Cold Reg. Sci. Technol. 2001, 32, 71–81. [Google Scholar] [CrossRef]
- Cierco, F.-X.; Naaim-Bouvet, F.; Bellot, H. Acoustic sensors for snowdrift measurements: How should they be used for research purposes? Cold Reg. Sci. Technol. 2007, 49, 74–87. [Google Scholar] [CrossRef]
- Amory, C. Drifting-snow statistics from multiple-year autonomous measurements in Adélie Land, East Antarctica. Cryosphere 2020, 14, 1713–1725. [Google Scholar] [CrossRef]
- Amory, C.; Trouvilliez, A.; Gallée, H.; Favier, V.; Naaim-Bouvet, F.; Genthon, C.; Agosta, C.; Piard, L.; Bellot, H. Comparison between observed and simulated aeolian snow mass fluxes in Adélie Land, East Antarctica. Cryosphere 2015, 9, 1373–1383. [Google Scholar] [CrossRef] [Green Version]
- Das, R.K.; Datt, P.; Acharya, A. An assessment of the FlowCapt acoustic sensor for measuring snowdrift in the Indian Himalayas. J. Earth Syst. Sci. 2012, 121, 1483–1491. [Google Scholar] [CrossRef] [Green Version]
- Trouvilliez, A.; Naaim-Bouvet, F.; Bellot, H.; Genthon, C.; Gallée, H. Evaluation of the FlowCapt Acoustic Sensor for the Aeolian Transport of Snow. J. Atmos. Ocean. Technol. 2015, 32, 150624141946008. [Google Scholar] [CrossRef] [Green Version]
- Wang, W.; Zhang, D. Holocene vegetation evolution and climatic dynamics inferred from an ombrotrophic peat sequence in the southern Altai Mountains within China. Glob. Planet. Chang. 2019, 179, 10–22. [Google Scholar] [CrossRef]
- Chadburn, S.E.; Burke, E.J.; Cox, P.M.; Friedlingstein, P.; Hugelius, G.; Westermann, S. An observation-based constraint on permafrost loss as a function of global warming. Nat. Clim. Chang. 2017, 7, 340–344. [Google Scholar] [CrossRef]
- Zhang, T.; Zhong, X. Classification and regionalization of the seasonal snow cover across the Eurasian Continent. J. Glaciol. Geocryol. 2014, 36, 481–490. [Google Scholar]
- Muhammad, S.; Thapa, A. Daily Terra–Aqua MODIS cloud-free snow and Randolph Glacier Inventory 6.0 combined product (M*D10A1GL06) for high-mountain Asia between 2002 and 2019. Earth Syst. Sci. Data 2021, 13, 767–776. [Google Scholar] [CrossRef]
- Wu, X.; Zhang, W.; Li, H.; Long, Y.; Pan, X.; Shen, Y. Analysis of seasonal snowmelt contribution using a distributed energy balance model for a river basin in the Altai Mountains of northwestern China. Hydrol. Proc. 2021, 35, e14046. [Google Scholar] [CrossRef]
- Zhang, W.; Kang, S.-C.; Shen, Y.-P.; He, J.-Q.; Chen, A.-A. Response of snow hydrological processes to a changing climate during 1961 to 2016 in the headwater of Irtysh River Basin, Chinese Altai Mountains. J. Mount. Sci. 2017, 14, 2295–2310. [Google Scholar] [CrossRef]
- Chen, Y.; Li, Z.; Fang, G.; Li, W. Large Hydrological Processes Changes in the Transboundary Rivers of Central Asia. J. Geophys. Res. Atmos. 2018, 123, 5059–5069. [Google Scholar] [CrossRef]
- Zhang, Y.; Enomoto, H.; Ohata, T.; Kitabata, H.; Kadota, T.; Hirabayashi, Y. Glacier mass balance and its potential impacts in the Altai Mountains over the period 1990–2011. J. Hydrol. 2017, 553, 662–677. [Google Scholar] [CrossRef]
- Malygina, N.; Papina, T.; Kononova, N.; Barlyaeva, T. Influence of atmospheric circulation on precipitation in Altai Mountains. J. Mount. Sci. 2017, 14, 46–59. [Google Scholar] [CrossRef]
- Cohen, J.; Screen, J.A.; Furtado, J.C.; Barlow, M.; Whittleston, D.; Coumou, D.; Francis, J.; Dethloff, K.; Entekhabi, D.; Overland, J.; et al. Recent Arctic amplification and extreme mid-latitude weather. Nat. Geosci. 2014, 7, 627–637. [Google Scholar] [CrossRef] [Green Version]
- Yao, J.; Chen, Y.; Guan, X.; Zhao, Y.; Chen, J.; Mao, W. Recent climate and hydrological changes in a mountain–basin system in Xinjiang, China. Earth-Sci. Rev. 2022, 226, 103957. [Google Scholar] [CrossRef]
- Wu, X.; Shen, Y.; Wang, N.; Pan, X.; Zhang, W.; He, J.; Wang, G. Coupling the WRF model with a temperature index model based on remote sensing for snowmelt simulations in a river basin in the Altay Mountains, north-west China. Hydrol. Proc. 2016, 30, 3967–3977. [Google Scholar] [CrossRef]
- Zhang, W.; Shen, Y.; Wang, N.; He, J.; Chen, A.a.; Zhou, J. Investigations on physical properties and ablation processes of snow cover during the spring snowmelt period in the headwater region of the Irtysh River, Chinese Altai Mountains. Environ. Earth Sci. 2016, 75, 199. [Google Scholar] [CrossRef]
- Shen, Y.; Su, H.; Wang, G.; Mao, W.; Wang, S.; Han, P.; Wang, N.; Li, Z. The Responses of Glaciers and Snow Cover to Climate Change in Xinjiang (II): Hazards Effects. J. Glaciol. Geocryol. 2013, 35, 1355–1370. [Google Scholar]
- An, X.-Y.; Yan, Z.; Jia, J.-M. A new distribution for modeling wind speed characteristics and evaluating wind power potential in Xinjiang, China. Energ. Sources Part Recov. Utiliz. Environ. Eff. 2020, 1–19. [Google Scholar] [CrossRef]
- Baojuan, H.; Yetang, W.; Weijun, S.; Xiaoyan, W. The unique “Regional East Gale with Blowing Snow” natural disaster in Jeminay County, Xinjiang Uygur Autonomous Region, China. Nat. Hazards 2018, 93, 1105–1108. [Google Scholar] [CrossRef]
- Jdoorschot, J.J.; Lehning, M.; Vrouwe, A. Field measurements of snow-drift threshold and mass fluxes, and related model simulations. Bound.-Layer Meteorol. 2004, 113, 347–368. [Google Scholar] [CrossRef]
- Gromke, C.; Manes, C.; Walter, B.; Lehning, M.; Guala, M. Aerodynamic Roughness Length of Fresh Snow. Bound.-Layer Meteorol. 2011, 141, 21–34. [Google Scholar] [CrossRef] [Green Version]
- Zhong, X.; Zhang, T.; Kang, S.; Wang, K.; Zheng, L.; Hu, Y.; Wang, H. Spatiotemporal variability of snow depth across the Eurasian continent from 1966 to 2012. Cryosphere 2018, 12, 227–245. [Google Scholar] [CrossRef] [Green Version]
- He, S.; Ohara, N. A New Formula for Estimating the Threshold Wind Speed for Snow Movement. J. Adv. Model. Earth Syst. 2017, 9, 2514–2525. [Google Scholar] [CrossRef] [Green Version]
- Albert, M.R.; Perron, F.E., Jr. Ice layer and surface crust permeability in a seasonal snow pack. Hydrol. Proc. 2000, 14, 3207–3214. [Google Scholar] [CrossRef]
- Liston, G.E.; Haehnel, R.B.; Sturm, M.; Hiemstra, C.A.; Berezovskaya, S.; Tabler, R.D. Simulating complex snow distributions in windy environments using SnowTran-3D. J. Glaciol. 2007, 53, 241–256. [Google Scholar] [CrossRef] [Green Version]
- Schweizer, J.; Bruce Jamieson, J.; Schneebeli, M. Snow avalanche formation. Rev. Geophys. 2003, 41, 1016. [Google Scholar] [CrossRef] [Green Version]
- Skiles, S.M.; Painter, T. Daily evolution in dust and black carbon content, snow grain size, and snow albedo during snowmelt, Rocky Mountains, Colorado. J. Glaciol. 2017, 63, 118–132. [Google Scholar] [CrossRef] [Green Version]
- Wang, Z.; Zhang, Z. Regionalization of snow drift in CHINA (Chinese). J. Mount. Sci. 1999, 17, 312–317. [Google Scholar]
- Hiemstra, C.A.; Liston, G.E.; Reiners, W.A. Snow Redistribution by Wind and Interactions with Vegetation at Upper Treeline in the Medicine Bow Mountains, Wyoming, U.S.A. Arct. Antarct. Alp. Res. 2002, 34, 262–273. [Google Scholar] [CrossRef]
- Leenders, J.K.; Boxel, J.H.v.; Sterk, G. The effect of single vegetation elements on wind speed and sediment transport in the Sahelian zone of Burkina Faso. Earth Surf. Proc. Landf. 2007, 32, 1454–1474. [Google Scholar] [CrossRef]
- Gascoin, S.; Lhermitte, S.; Kinnard, C.; Bortels, K.; Liston, G.E. Wind effects on snow cover in Pascua-Lama, Dry Andes of Chile. Adv. Water Res. 2013, 55, 25–39. [Google Scholar] [CrossRef] [Green Version]
- Gacitúa, G.; Bay, C.; Pedersen, M.R.; Tamstorf, M.P. Quantifying Snow and Vegetation Interactions in the High Arctic Based on Ground Penetrating Radar (GPR). Arctic Ant. Alp. Res. 2013, 45, 201–210. [Google Scholar] [CrossRef]
- Essery, R.; Pomeroy, J. Vegetation and topographic control of wind-blown snow distributions in distributed and aggregated simulations for an Arctic tundra basin. J. Hydrometeorol. 2004, 5, 735–744. [Google Scholar] [CrossRef]
Figure 1.
Maps showing the locations of observation sites operated by Koktokay snow station (a), the FlowCapt sensor with the Automatic Weather Station under snow-covered (b) and snow-free (c) conditions.
Figure 1.
Maps showing the locations of observation sites operated by Koktokay snow station (a), the FlowCapt sensor with the Automatic Weather Station under snow-covered (b) and snow-free (c) conditions.

Figure 2.
Meteorological condition observed by Kayier snowdrift observation site from December 1 2017 to April 15 2018: (a) daily precipitation and snow depth; (b) daily average, maximum, and minimum temperature and vapor pressure.
Figure 2.
Meteorological condition observed by Kayier snowdrift observation site from December 1 2017 to April 15 2018: (a) daily precipitation and snow depth; (b) daily average, maximum, and minimum temperature and vapor pressure.

Figure 3.
The relationship between daily average wind speed for height 0~1 m (WS01) and 1~2 m (WS12) (a), and changes in daily average WS01 and the daily maximum of the 10-min average wind speed from 1 December 2017 to 15 April 2018 (b).
Figure 3.
The relationship between daily average wind speed for height 0~1 m (WS01) and 1~2 m (WS12) (a), and changes in daily average WS01 and the daily maximum of the 10-min average wind speed from 1 December 2017 to 15 April 2018 (b).

Figure 4.
Total snow transport (TST) with different heights at the heights of 0~1 m (TST01) and 1~2 m (TST12) (a), and 10-min mean snowdrift fluxes and wind speeds of typical Event 1 (b), 2 (c) and 3 (d).
Figure 4.
Total snow transport (TST) with different heights at the heights of 0~1 m (TST01) and 1~2 m (TST12) (a), and 10-min mean snowdrift fluxes and wind speeds of typical Event 1 (b), 2 (c) and 3 (d).

Figure 5.
The cumulative probability of wind speed and friction velocity and the relationships between the probability and snowdrift flux of drifting snow and wind speed (a) and friction velocity (b).
Figure 5.
The cumulative probability of wind speed and friction velocity and the relationships between the probability and snowdrift flux of drifting snow and wind speed (a) and friction velocity (b).


Table 1.
Principal sensors and their respective accuracies operating at the Kayier snowdrift observation site.
Table 1.
Principal sensors and their respective accuracies operating at the Kayier snowdrift observation site.
| Observation Items | Sensor | Accuracy | Ranges of Utilization | Installation Height (above the Ground Surface) |
|---|---|---|---|---|
| Air temperature | WS300 sensor | ±0.2 °C | −50.0~60.0 °C | 1.50 m |
| Relative humidity | WS300 sensor | ±2% RH | 0~100% | 1.50 m |
| Wind speed and direction | GILL WindSonic4-L | ±2% @12 m/s | 0–60 m/s, 0~359° | 0.75 and 1.75 m |
| Precipitation | T-200B | 0.1% FS | 600.0 mm | - |
| Snow depth | SR50A | ±1.0 cm | 0.5~10 m | 2.0 m |
| Snowdrift flux | FlowCapt | ±5% | 0–250 g/(m2·s) | 0~1 m and 1~2 m |
Publisher’s Note: MDPI stays neutral with regard to jurisdictional claims in published maps and institutional affiliations. |
© 2022 by the authors. Licensee MDPI, Basel, Switzerland. This article is an open access article distributed under the terms and conditions of the Creative Commons Attribution (CC BY) license (https://creativecommons.org/licenses/by/4.0/).
Share and Cite
MDPI and ACS Style
Zhang, W.; He, J.; Chen, A.; Wu, X.; Shen, Y. Observations of Drifting Snow Using FlowCapt Sensors in the Southern Altai Mountains, Central Asia. Water 2022, 14, 845. https://doi.org/10.3390/w14060845
AMA Style
Zhang W, He J, Chen A, Wu X, Shen Y. Observations of Drifting Snow Using FlowCapt Sensors in the Southern Altai Mountains, Central Asia. Water. 2022; 14(6):845. https://doi.org/10.3390/w14060845
Chicago/Turabian StyleZhang, Wei, Jianqiao He, An’an Chen, Xuejiao Wu, and Yongping Shen. 2022. "Observations of Drifting Snow Using FlowCapt Sensors in the Southern Altai Mountains, Central Asia" Water 14, no. 6: 845. https://doi.org/10.3390/w14060845
Note that from the first issue of 2016, this journal uses article numbers instead of page numbers. See further details here.