
Attribution of Runoff Decrease at the Guanyintang Station in the Yongding River Considering the Impact of Coal Mining


State Key Laboratory of Basin Water Cycle Simulation and Regulation, China Institute of Water Resources and Hydropower Research, Beijing 100038, China
*
Author to whom correspondence should be addressed.
Water 2022, 14(6), 842; https://doi.org/10.3390/w14060842
Submission received: 21 January 2022
/
Revised: 20 February 2022
/
Accepted: 3 March 2022
/
Published: 8 March 2022
Abstract
:The Yongding River basin has greatly changed in recent years; its runoff has decreased sharply and has even been cut off. In this study, the Guanyintang station in the upstream Yongding River basin was selected to quantify the impacts of climate change, water use, and coal mining on its runoff. The Mann–Kendall analysis method was used to analyze the climate change trend of the Guanyintang basin from 1956 to 2018. Then, the water and energy transfer processes in large river basins (WEP-L) model was improved to consider the impact of coal mining and applied to quantitatively analyze the impact of meteorological elements and human activities on runoff. The results show that, from 1956 to 2018, the precipitation in the Guanyintang basin decreased slightly, whereas the temperature obviously increased, the potential evapotranspiration changed marginally, and the runoff significantly decreased with a mutation point around 1998. The study period was divided into a calibration period (1956–1976), validation period 1 (1977–1997), and validation period 2 (1998–2018). Compared with the calibration period, the runoff in the validation periods decreased a lot and could not meet the water balance without considering the coal mining impact. After considering coal mining, the simulation accuracy of the model was satisfied. Generally speaking, climate change and coal mining were the main factors for runoff attenuation in validation period 1. In validation period 2, coal mining became the dominant factor, whereas land use change also made certain contributions.
1. Introduction
Studies have shown that the annual runoff of major rivers in China tended to attenuate in recent decades [1], attracting the attention of the government and the public [2]. The Yongding River basin is no exception. Many scholars have made attribution analyses of this attenuation trend, and climate change (e.g., precipitation [3], temperature, and evaporation) and human activities (e.g., increased water intake [4], water conservancy projects [5], agricultural irrigation [6], soil and water conservation [7,8], and land use change [9]) are considered to be the main factors [10,11].
In these analyses, hydrological models, such as the soil and water assessment tool (SWAT) model, the SIMHYD model, and the water and energy transfer processes (WEP) model are widely used in different watersheds, and the conclusions are not all the way same. Hu et al. [12] analyzed the causes of runoff attenuation in the Min–tuo basin in China using the SWAT model and considered that the contributions of precipitation, possible evapotranspiration, and underlying surface changes were 56.18%, 37.08%, and 6.74%, respectively. Yuan et al. [13] analyzed the runoff change of the Liuxi River basin in China using the SWAT model. They concluded that climate change was the main reason for the attenuation, with land use also aggravating the trend and forests having a certain interception effect. Wang et al. [14] used the SIMHYD model and found that the average attenuations of the total runoff caused by human activities and climate change in the Sanchuan River basin of the Yellow River in China were 70.1% and 29.9%, respectively. Chiew et al. [15] established the SIMHYD model to predict the impact of climate change on runoff in southeastern Australia. Jia et al. [16] used the WEP model to analyze the impact of climate change on the runoff process in the source area of the Yellow River, and Kinouchi et al. [17] used the WEP model to analyze the runoff change of the Abukuma basin in Japan under climate change and the changes in the underlying surface. Meanwhile, hydrological models are often combined with statistical methods. Zhang et al. [18] used the Mann–Kendall (M-K) statistical test and the Xin’anjiang model to analyze the impact of land use change on runoff attenuation in the Dapoling Basin. Li et al. [19] used the double cumulative curve method to analyze the impact of human activities in the upper and middle reaches of the Yellow River runoff attenuation, which were 88.1% and 84.9%, respectively. Yang et al. [20] calculated the elastic coefficient of runoff under climate and underlying surface changes in 38 typical sub-basins of the Yellow River. Their results showed that the average contribution rate of precipitation reduction to runoff was 49.3% and that its contribution to evapotranspiration was −3.5%.
Because of the uncertainty of the data selection, parameter setting, and methodologies of different studies, their results were not necessarily consistent, even for the same basin, and even opposite conclusions may be derived. For example, Zhang [21] believed that the attenuation of the runoff in the Yongding River basin is mainly caused by climate change and that its contribution rate accounts for about 65.4%. In contrast, Ding [22] had other thoughts: he reported that human activities were the main reason but did not give a clear contribution rate.
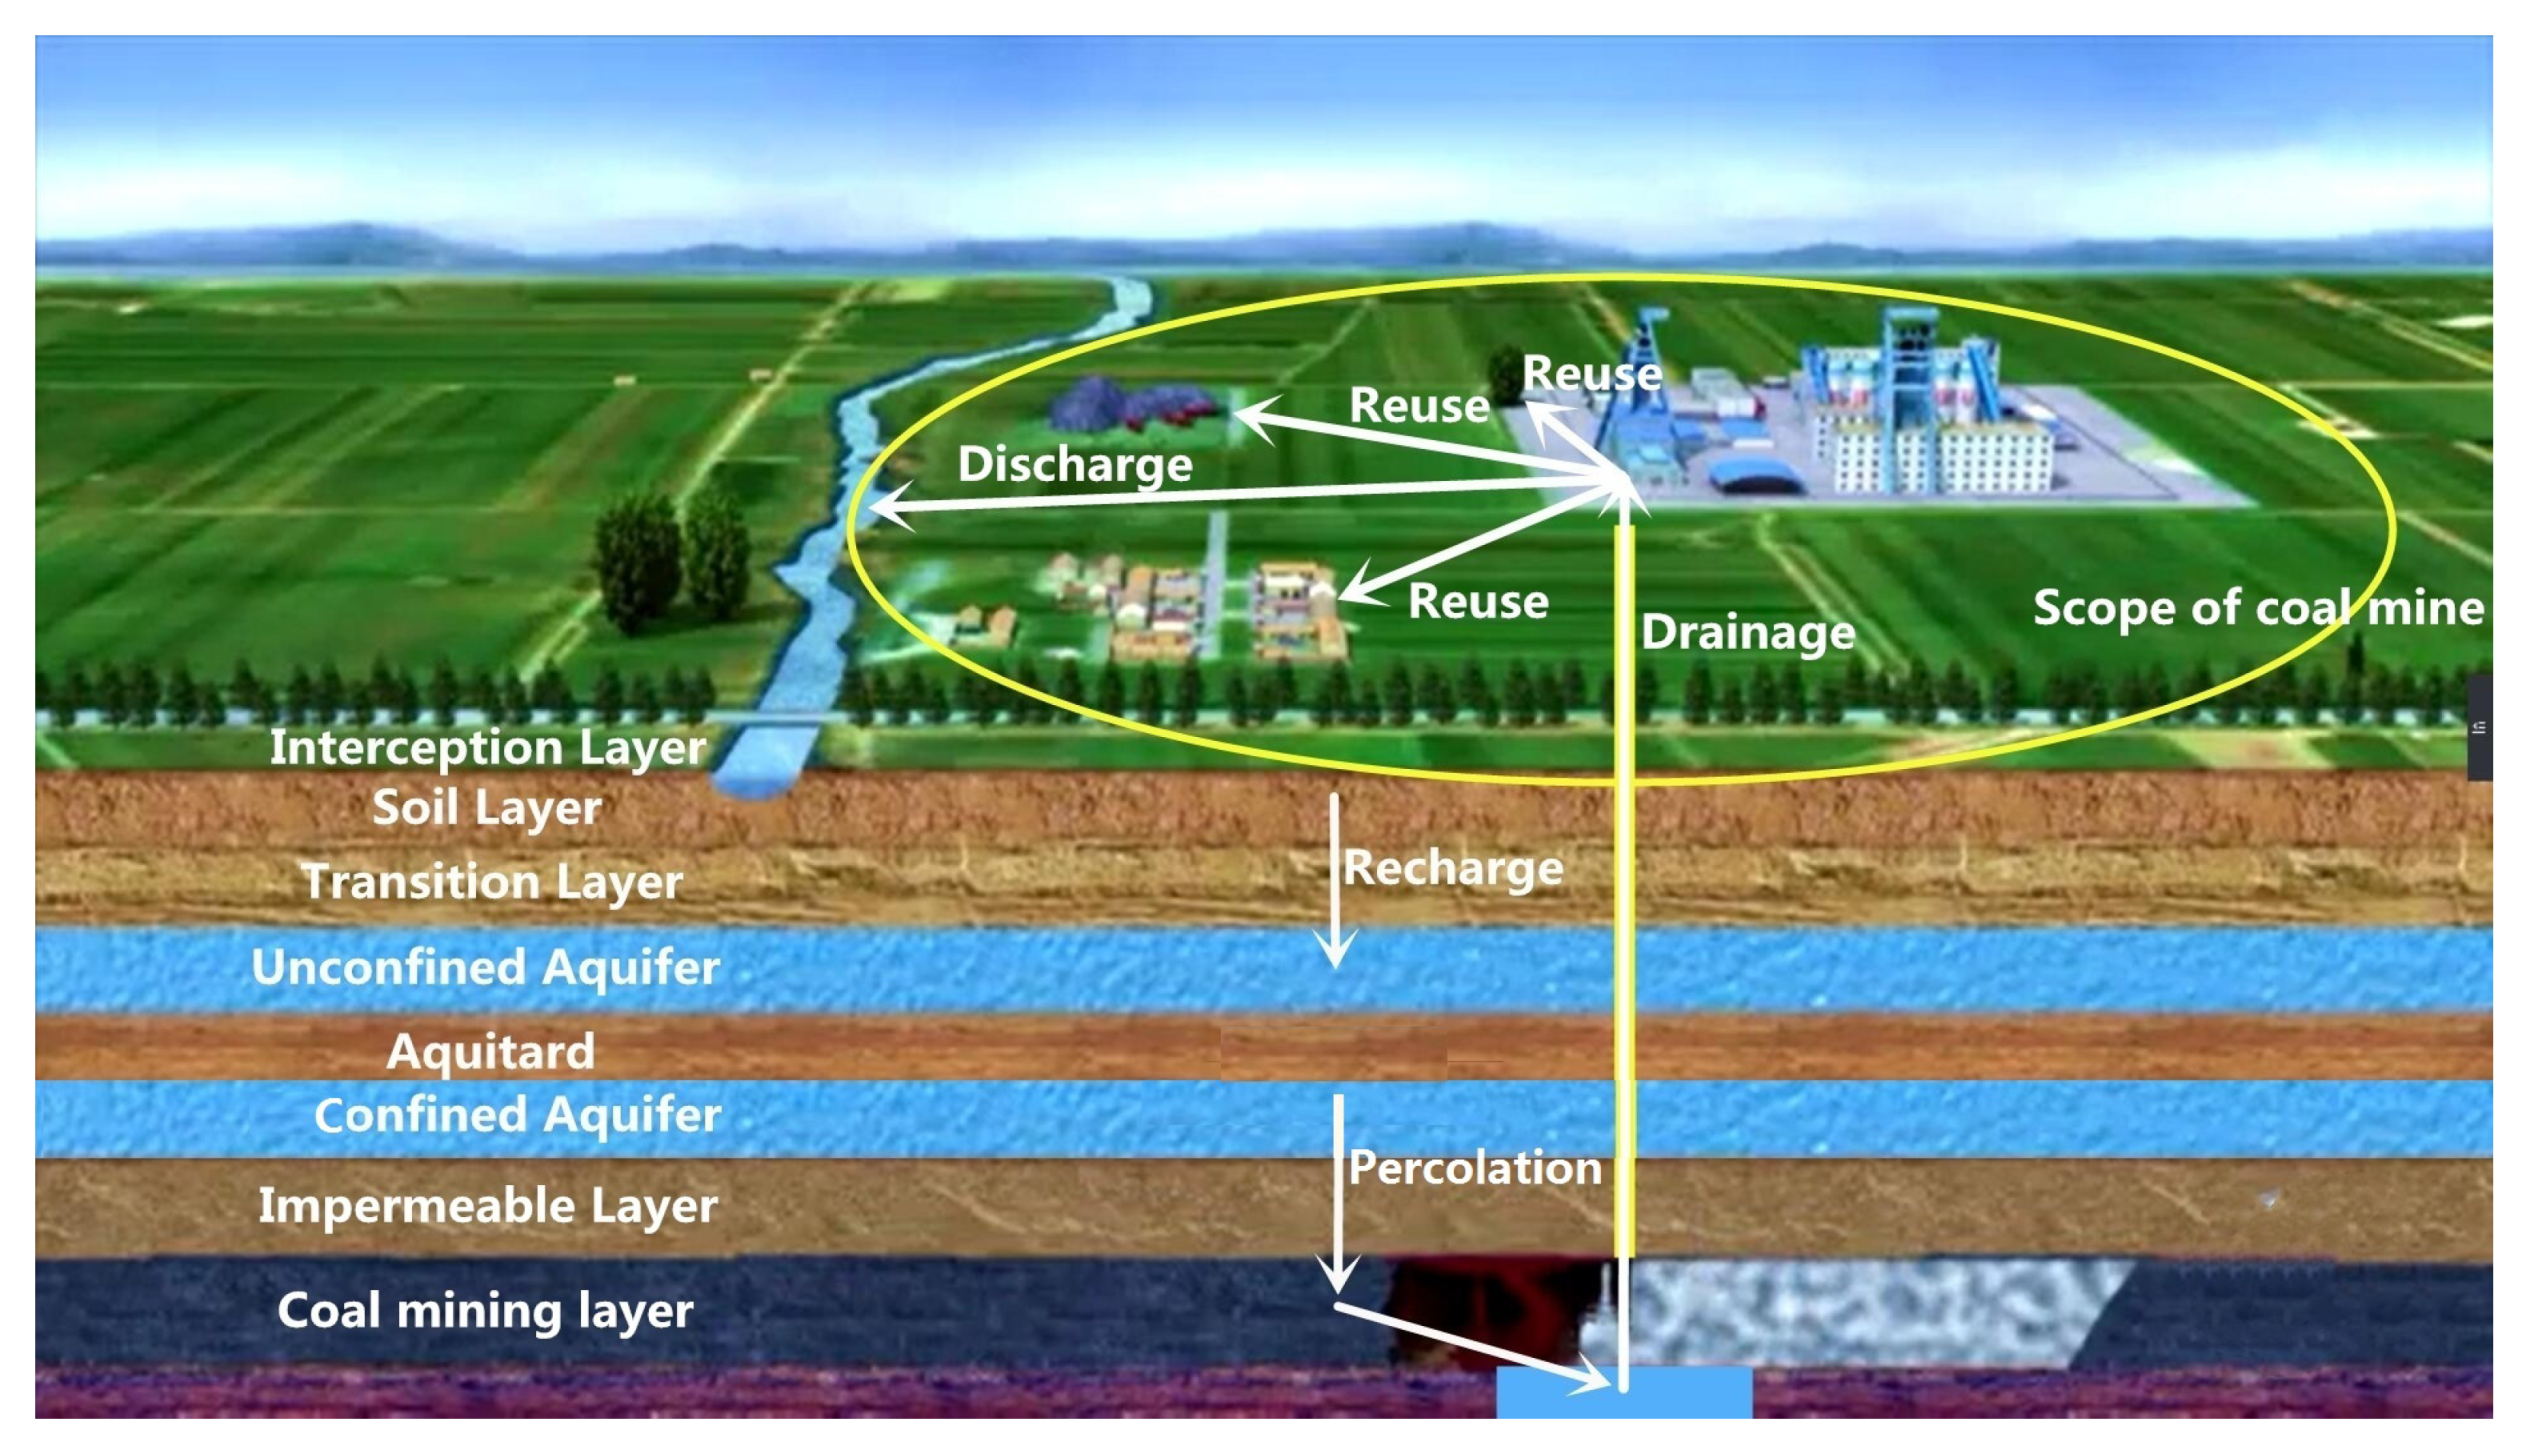
Coal mining activities can have severe and long-term impacts on catchment hydrological processes and stream ecosystems [23,24]. Relevant studies have shown that coal mining and drainage processes form goaf-like funnels (similar to pumping wells) around the coal mine, resulting in the decline of the surrounding groundwater level [25]. With the continuous operations of a coal mine, the scope of its goaf gradually expands around and forms a circular shape. Coal mining also destroys aquifers and produces fracture zones. The water in the ground and soil can quickly infiltrate through the fracture zone, accelerating the lateral flow recharge in the goaf [26,27]. Its influences on runoff have become a heated discussion, but there are only a few relevant studies in the Yongding River basin.
Overall, the attribution of the runoff attenuation in the Yongding River basin still requires further studies. In this paper, the runoff attenuation in the Yongding River basin is analyzed using an improved WEP-L model, the quantitative contribution rates of various factors are given, and the future research direction is discussed.
2. Materials and Methods
2.1. Study Area
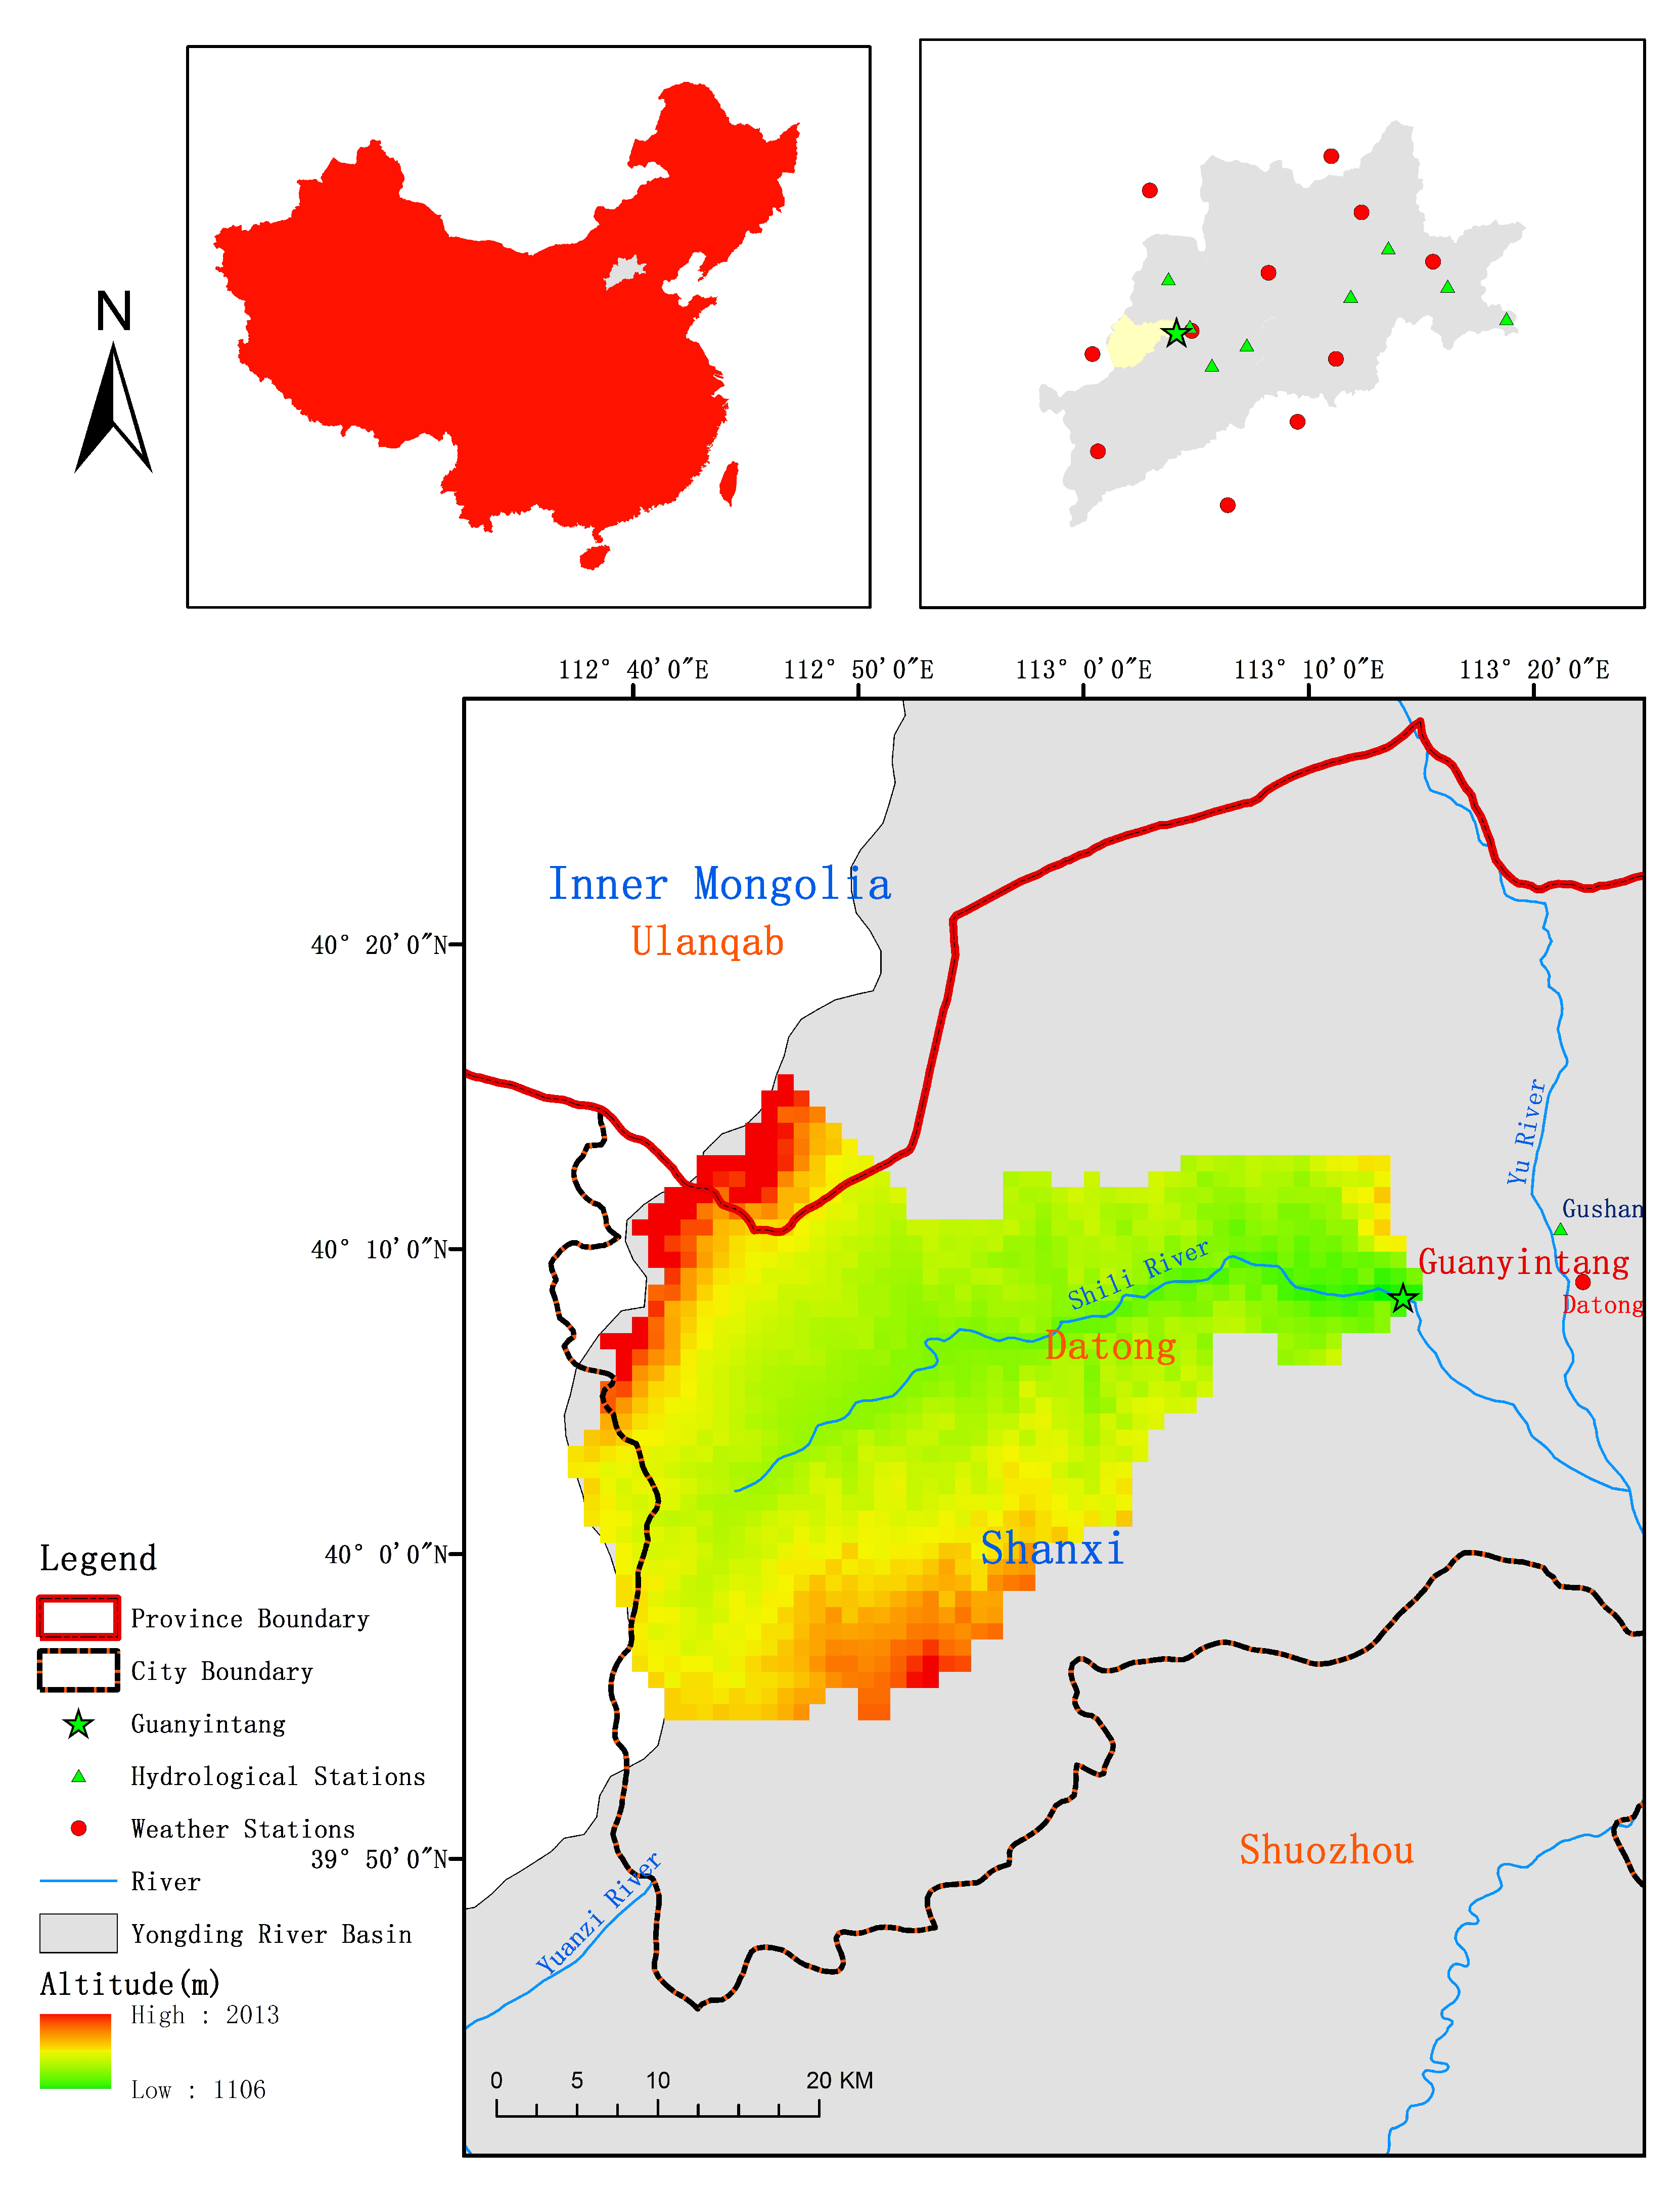
Yongding River is located west of Beijing, It is the largest river in Beijing and one of the seven major water systems in the Haihe River basin, originating from Guancen Mountain, Ningwu County, Shanxi province. It has a basin area of 47,016 km2, including 45,063 km2 of mountainous areas and 1953 km2 of plain areas, and a main stream length of 747 km. It flows through 43 counties and cities, including Inner Mongolia, Shanxi, and Hebei, as well as Beijing and Tianjin. Its main tributaries include the Huliu River, Yang River, Guishui River, and Qingshui River.
The Guanyintang station (113°12 E, 40°06 N) is located on Shili River in the southern suburb of Datong City, Shanxi province, established on 4 May 1951, and with a catchment area of 1185 km2. The length of the main stream above the station is 74.3 km. According to the data from the hydrological calculation manual of Shanxi province, from 1956 to 2008, The average annual precipitation of the basin is 392.5 mm with a rainy period from May to October, the annual average temperature is 5.6 °C varied from −15.4 °C to 25.8 °C, the average annual river runoff is 25.83 million m3, the runoff depth is 21.8 mm, and the average annual runoff coefficient is 0.056. The geographical location and altitude data of the Guanyintang River Basin are shown in Figure 1.
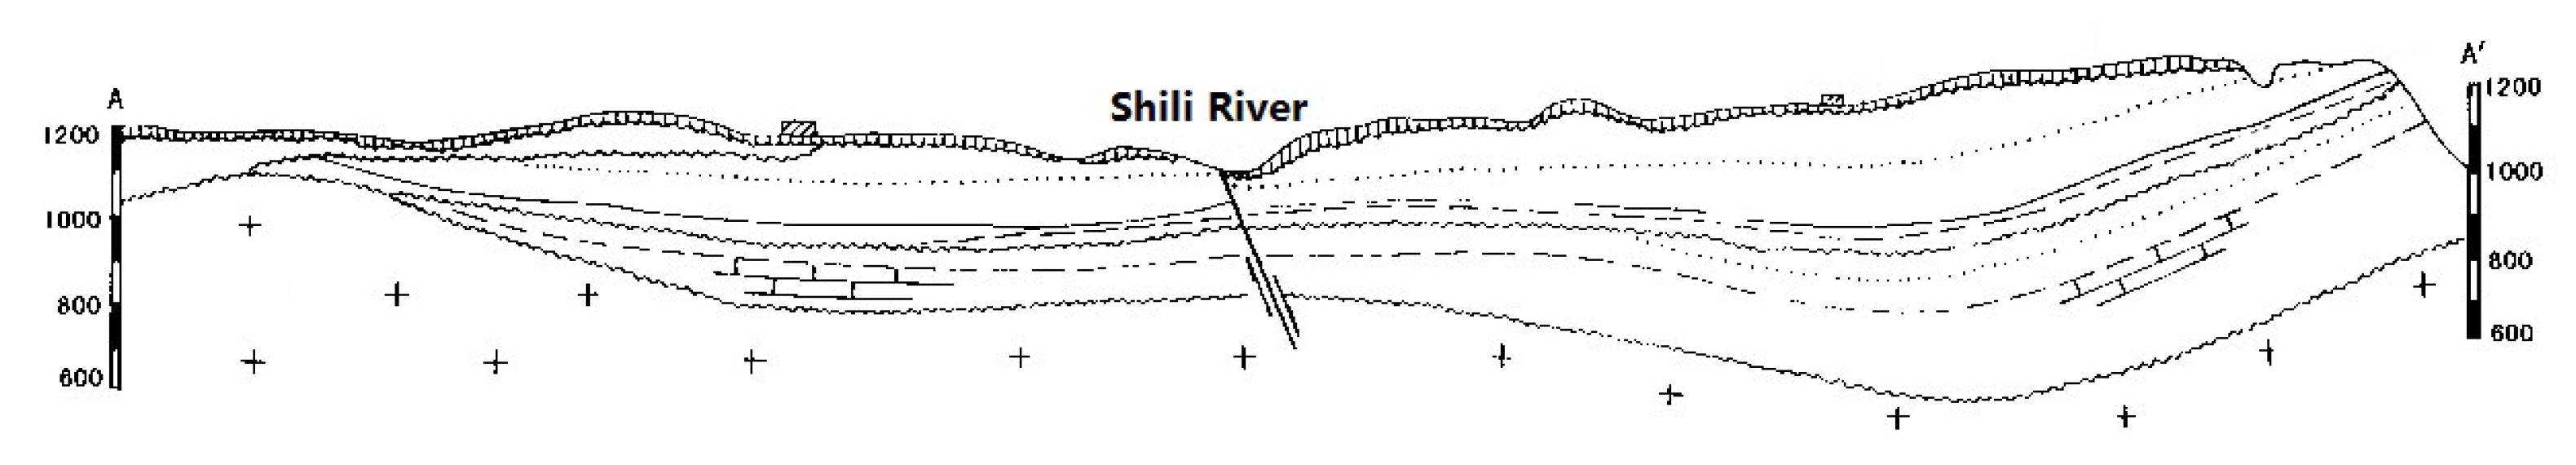
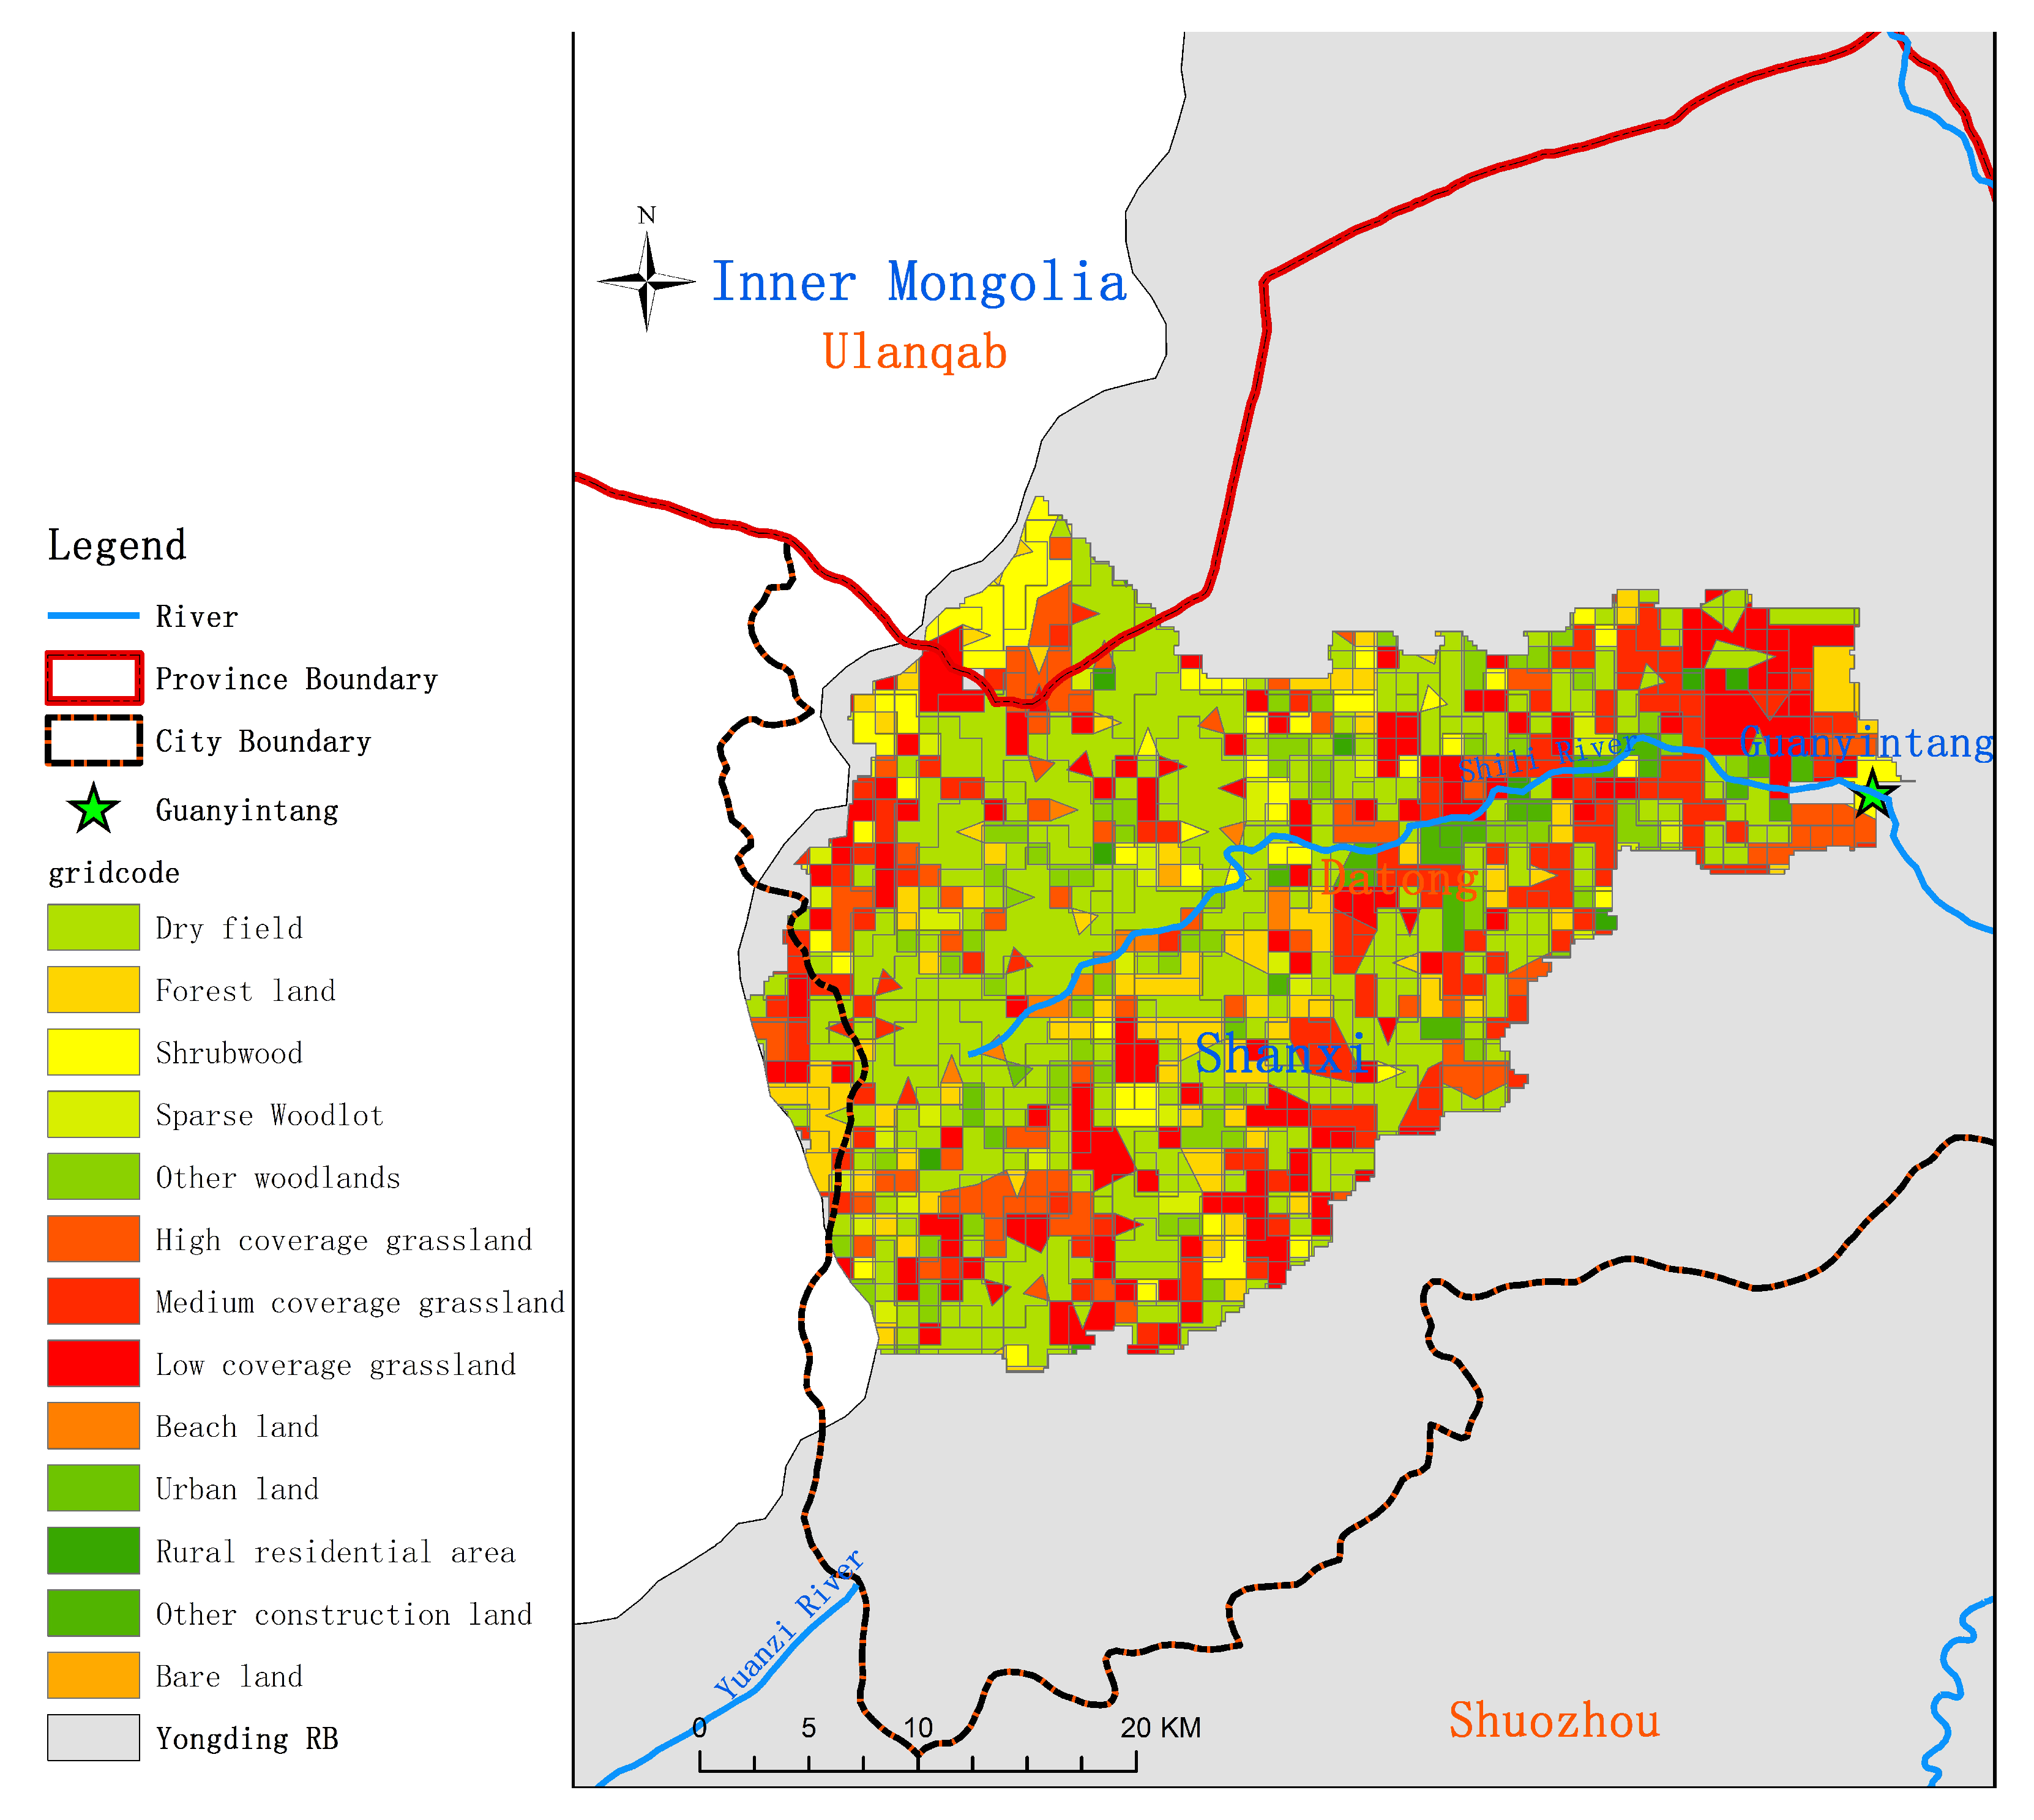
The subsoil and land cover map are shown in Figure 2 and Figure 3, it can be found that the Guanyintang River basin is mainly mountainous, with a main land cover of dry field and grassland, and agriculture as the main human activity, and it has rich underground coal resources. Thus, more attention should be paid to the influence of agricultural water intake and coal mining.There are eight medium and large coal mines (annual coal production ≥ 2 million tons) in the basin. Coal mining has caused serious damage to aquifers and rocks, resulting in a large number of fracture zones. Therefore, the amount and speed of groundwater infiltrate have greatly increased.
2.2. Data Collection and Preprocessing
In this paper, the daily meteorological data came from 11 national meteorological stations (http://data.cma.cn/) (accessed on 5 July 2020) (Figure 1) in the Yongding River basin, distributed using the inverse distance weights method and compared with the hydrological manuals of the Shanxi and Hebei Provinces and water resource survey reports to ensure their accuracy. The monthly runoff data of the Guanyintang station came from Book 3, Volume 3 of the People’s Republic of China Hydrological Yearbook. DEM data: 1–1 km raster; source: Computer Network Information Center, Chinese Academy of Sciences. Land use data: land cover 1980/1990/1995/2000/2005/2010/2015 vector product; source: Geographical Information Monitoring Cloud Platform, Chinese Academy of Sciences. Monthly water use data after 1996 came from the Shanxi statistical yearbook and water resources bulletin, and those from 1956 to 1995 were interpolated according to survey data from 1980, 1985, 1990, and 1995. Coal mine data including their locations, designed scales, current production capacities, areas, affected areas, and so on, came from Shanxi Energy Bureau. The data inputs in the model simulation are shown in Table 1.
Potential evapotranspiration () was estimated using the Penman–Monteith equation, which is recommended by the World Food and Agriculture Organization. The expression of the Penman–Monteith correction formula is as follows [28]:
where is the potential evapotranspiration , is the net all-wave radiation at the canopy surface , G is the soil heat flux density , is the daily air temperature at 2 m above the ground level (°C), is the wind speed at 2 m above the ground level , is the saturation vapor pressure (kPa), is the actual vapor pressure (kPa), is the slope of the saturated vapor pressure curve versus air temperature (kPa°C), and y is the psychrometric constant (kPa°C).
2.3. Methodology
2.3.1. Mann–Kendall Analysis
In this study, the change trend of monthly precipitation, monthly mean temperature, monthly runoff, and monthly evapotranspiration between 1956 and 2018 were analyzed by the Mann–Kendall method.
The M–K analysis is a nonparametric statistical test method widely used in monotonous upward or downward trends of meteorological parameters, runoffs, and other time series. The test statistic S is calculated as follows:
where and are the values of the sequence.
When the statistic S is greater than 0, it indicates that the sequence has an upward trend; otherwise, it indicates that the sequence has a downward trend. When the absolute value of S reaches 1.65, 1.96, 2.58, and 3.29, the change of the sequence reaches 90%, 95%, 99%, and 99.9% confidence levels, respectively.
2.3.2. Wavelet Analysis
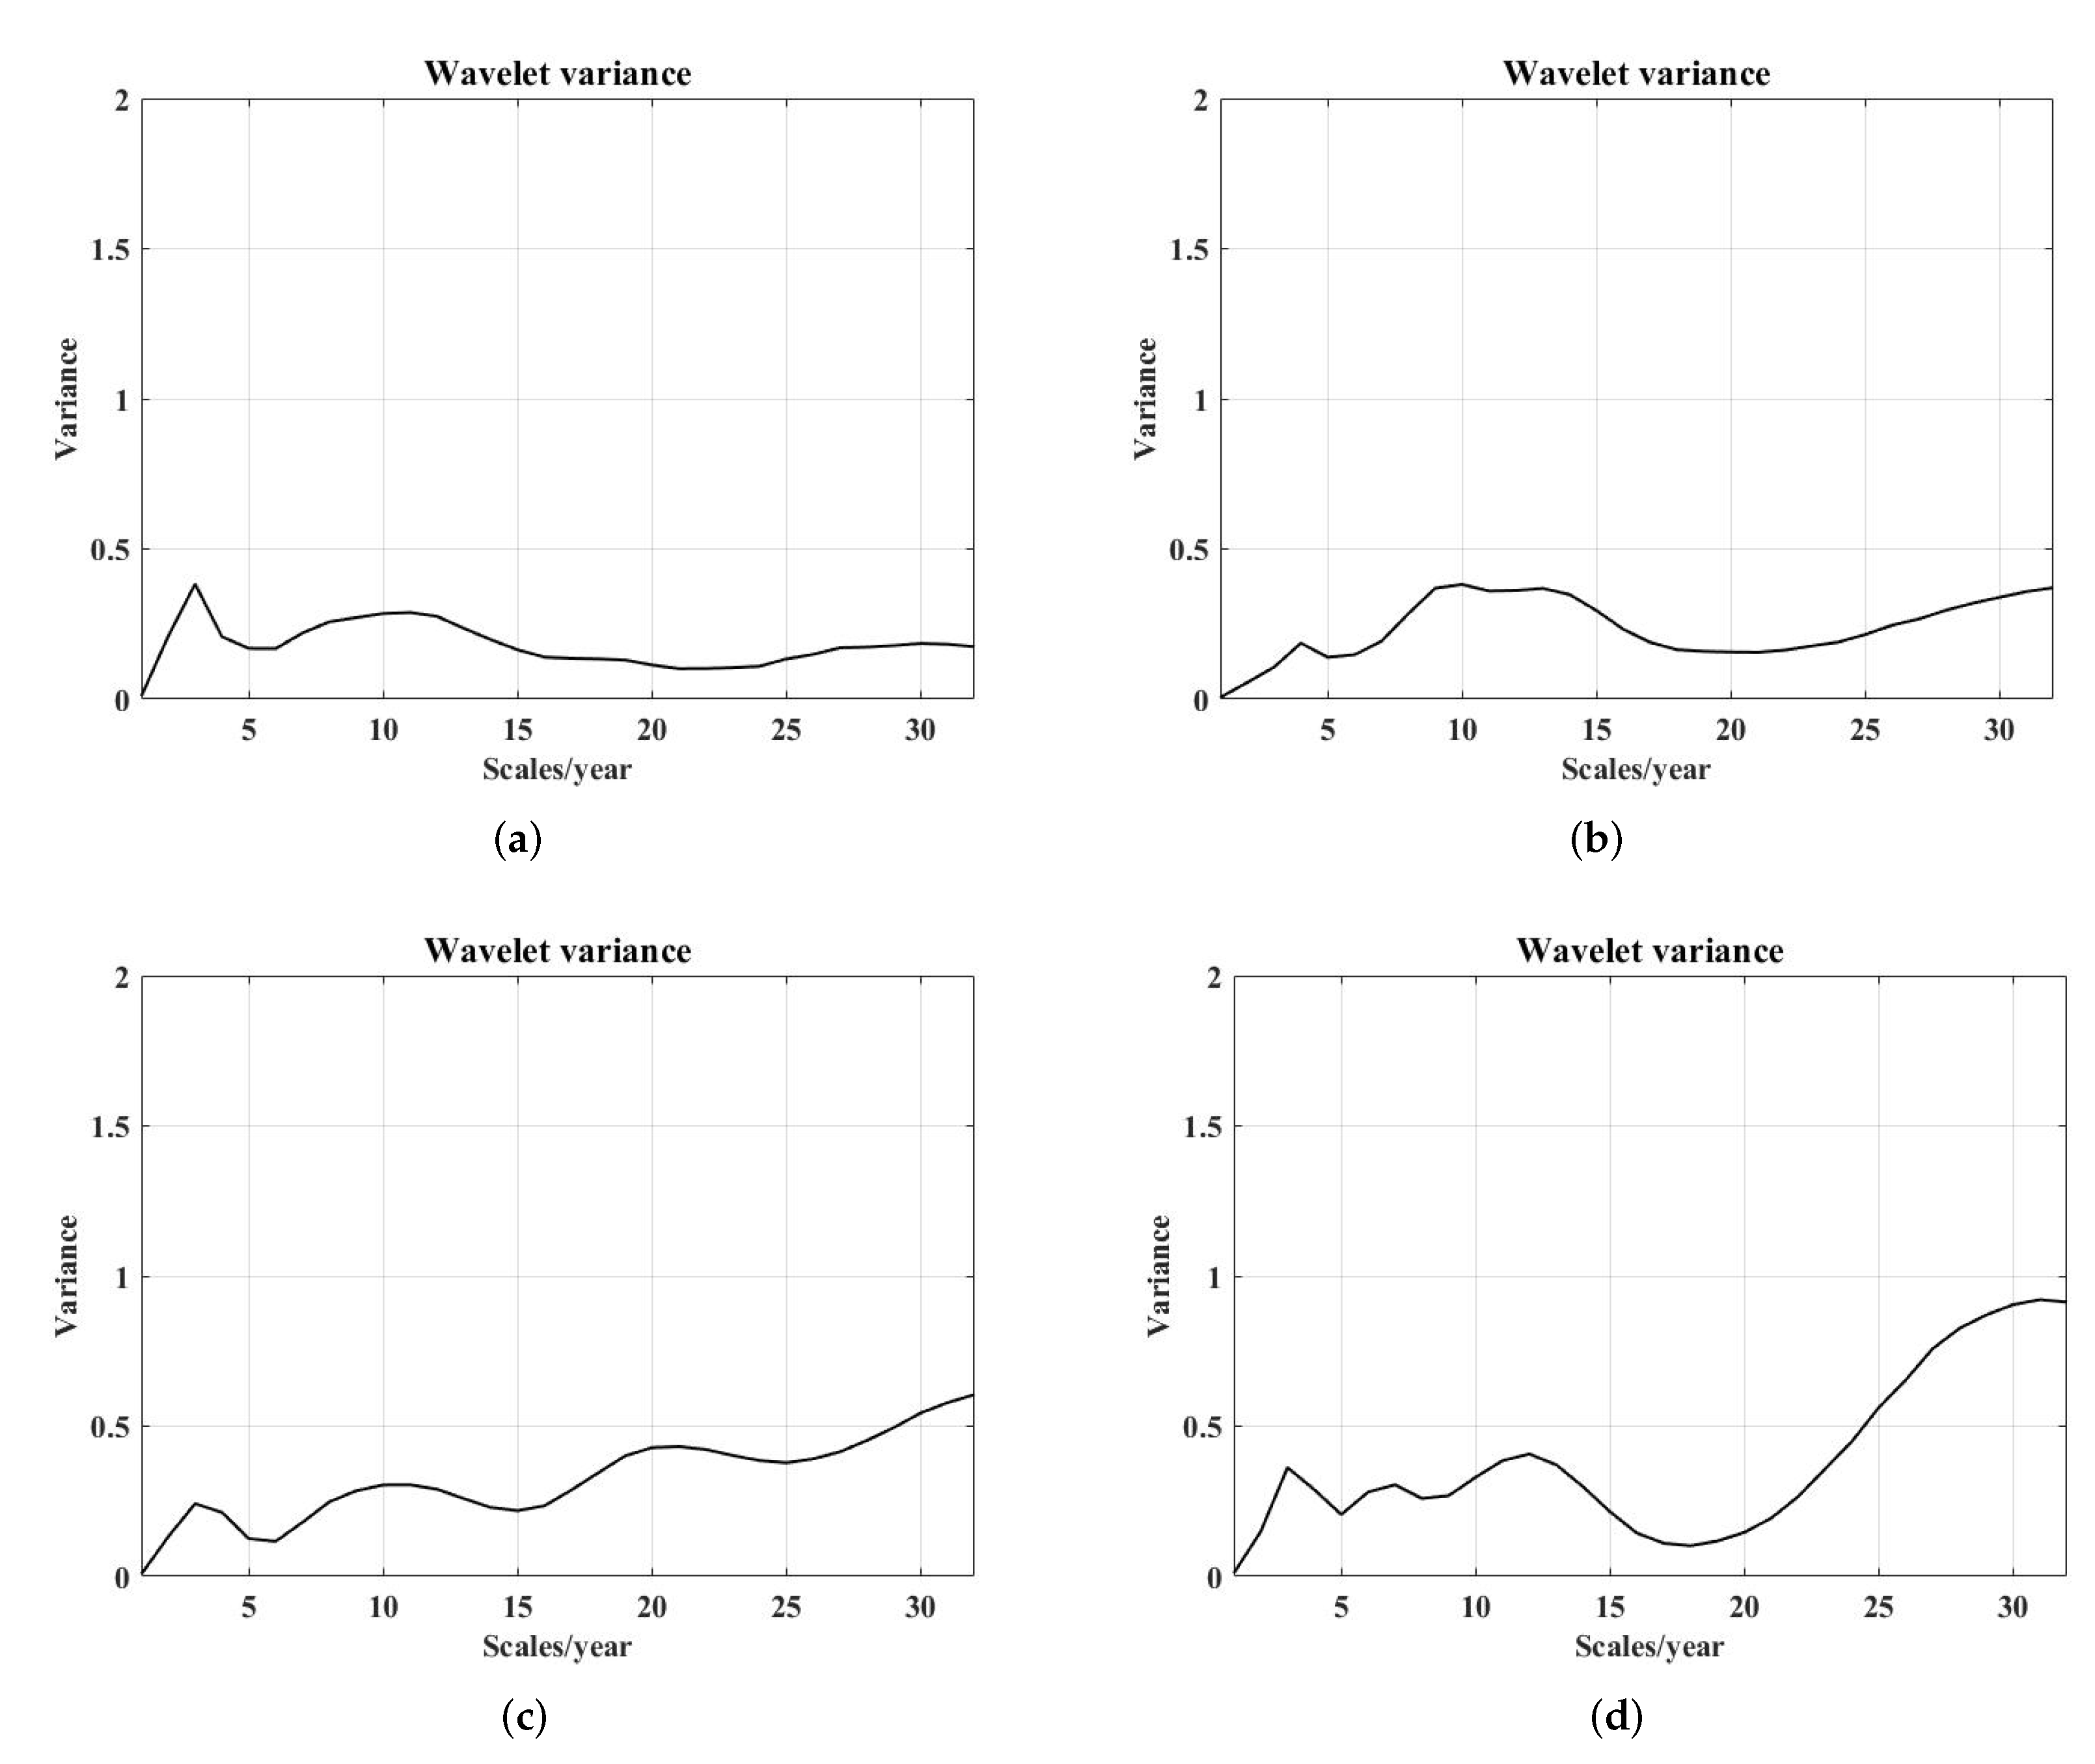
Wavelet analysis is a data analysis method mainly used to reveal various change cycles hidden in time series, fully reflect the change trends of a system in different time scales, and qualitatively estimate the future development trend of the system. The commonly used wavelet functions are the Morlet wavelet and the Marr wavelet. Wavelet variance can reflect the energy of signal fluctuations with scale α and determine the relative intensity of different scale disturbances in the signal and the main time scale, namely, the main period. The variance calculation formula of the Morlet wavelet is as follows:
where are the Wavelet coefficients.
2.3.3. WEP-L Model Runoff Change Attribution Identification
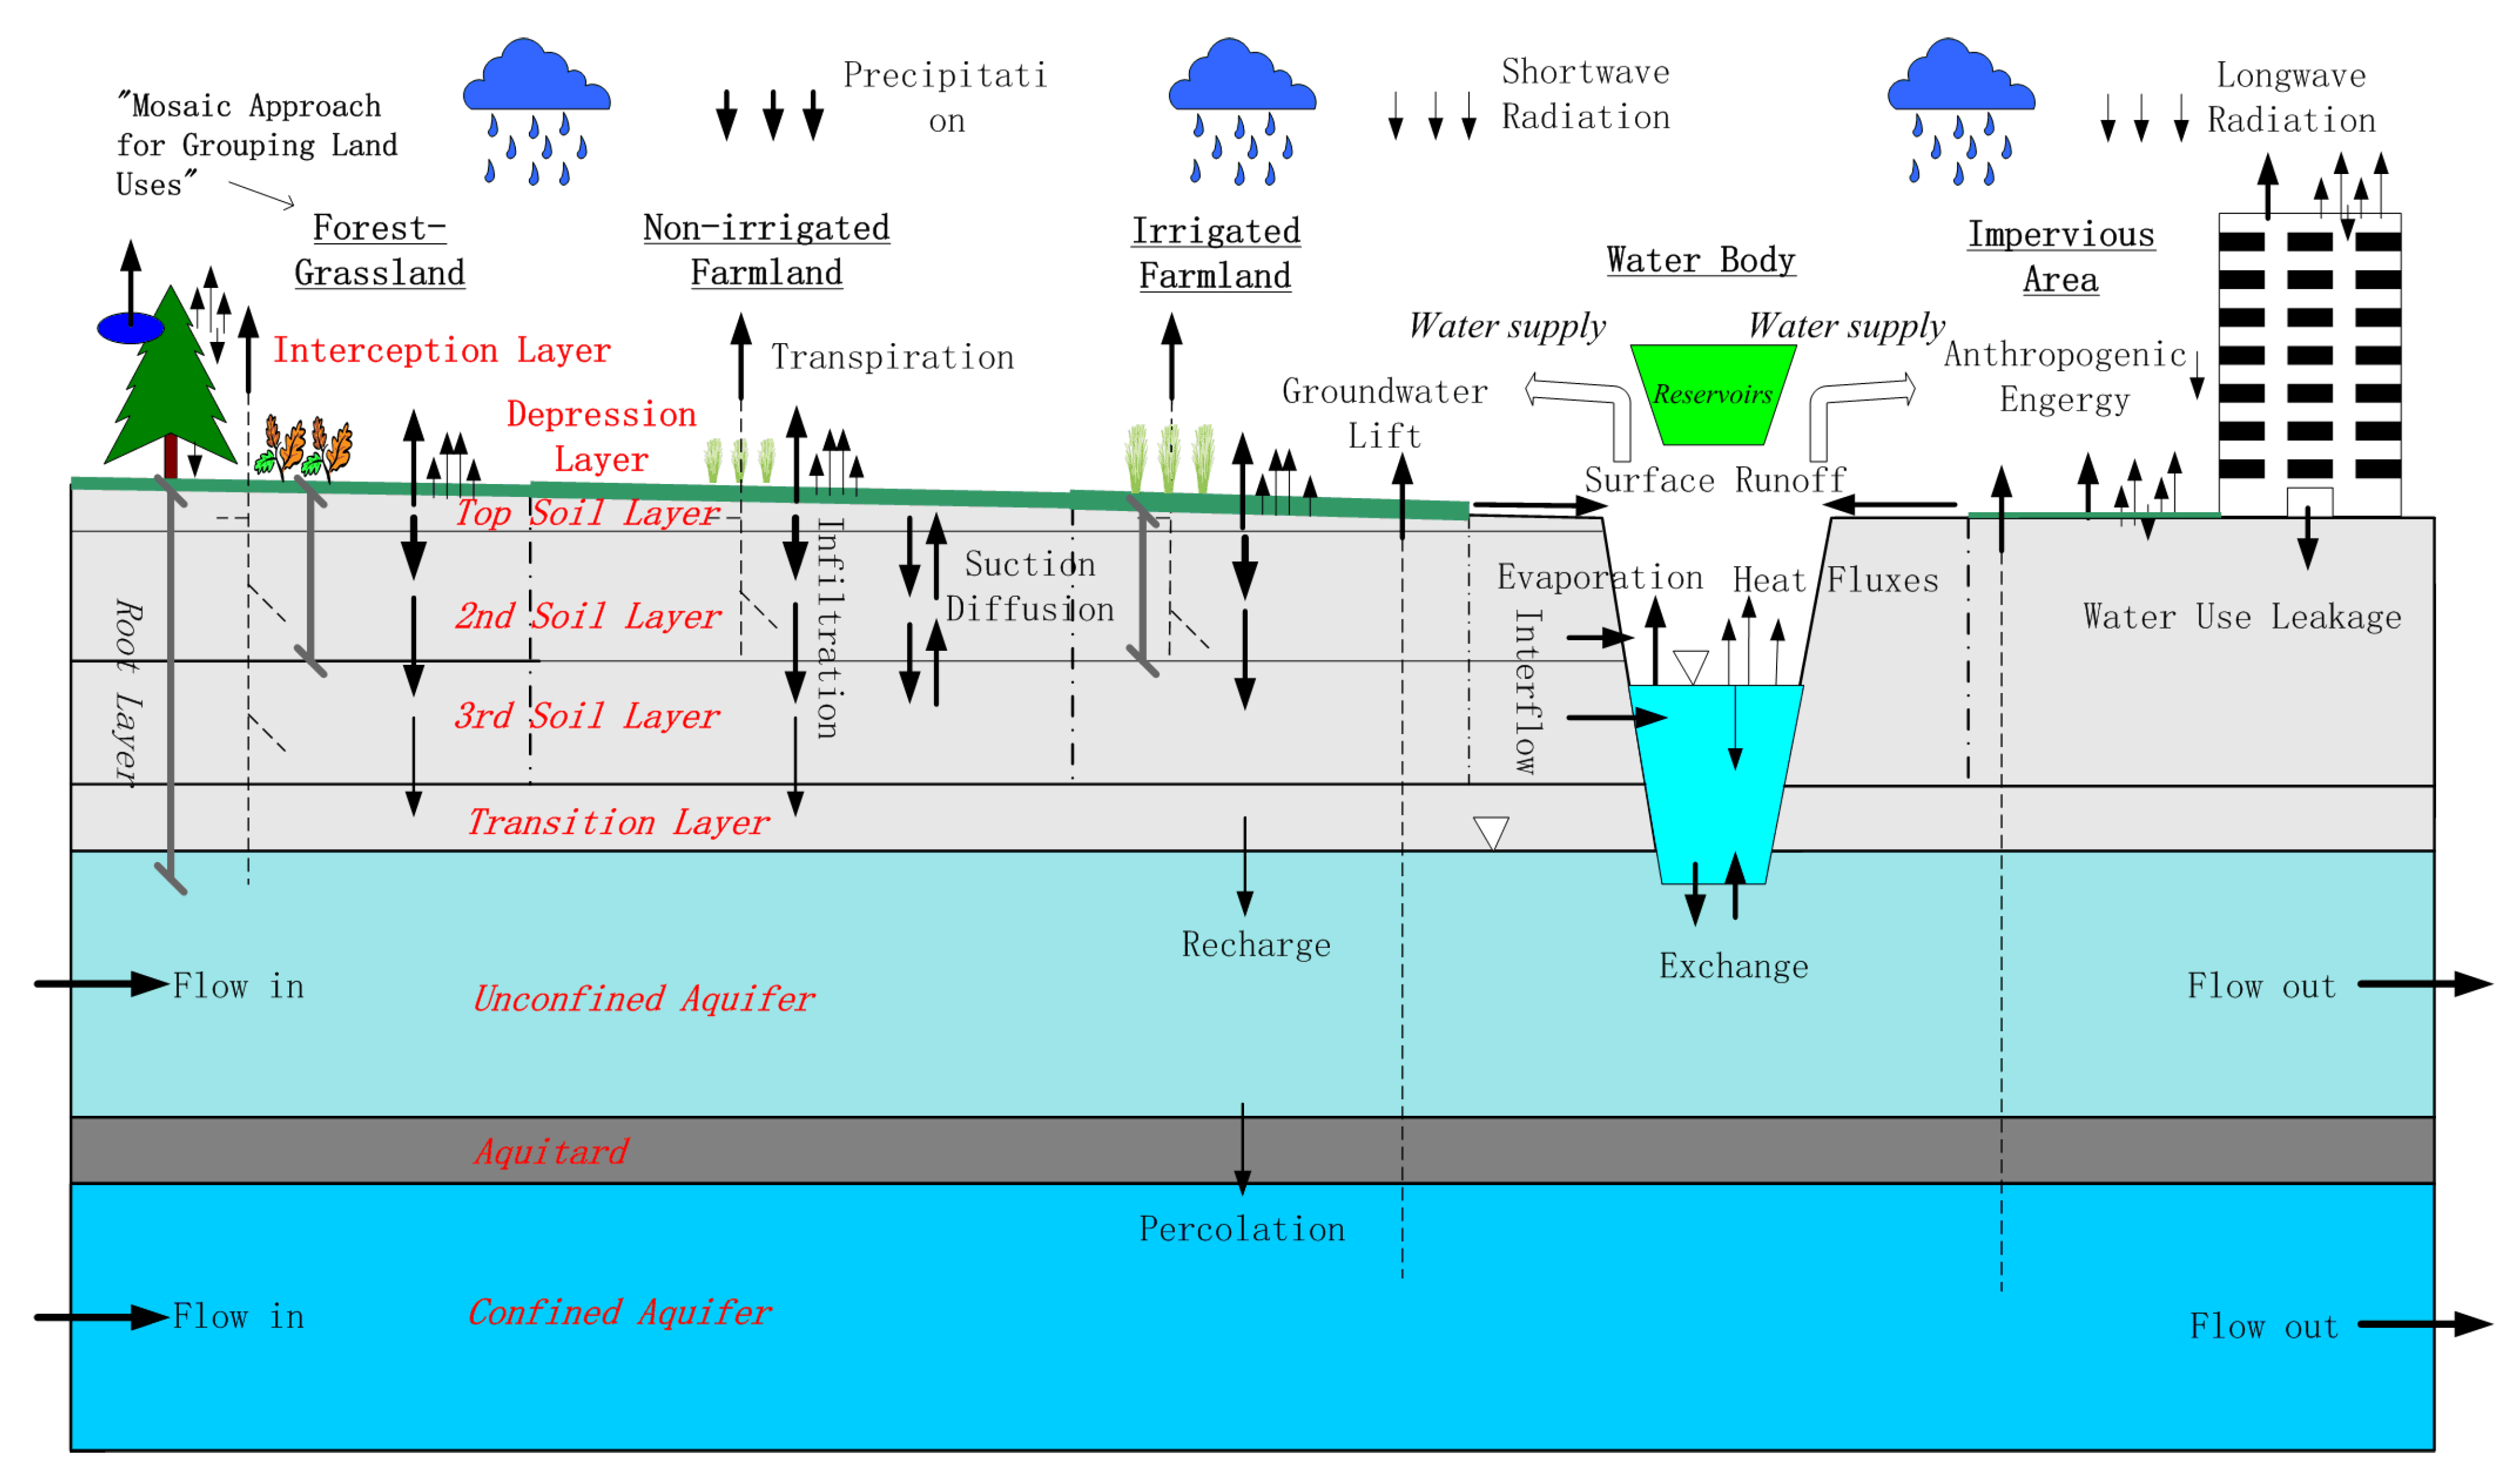
The water and energy transfer processes in large river basins (WEP-L) model is a distributed hydrological model based on water cycle and surface energy exchange processes. WEP-L can simulate the natural water cycle process and energy budget of the basin and then couple the water resources allocation model (ROWAS) and multi-objective decision analysis model (DAMOS), which can then simulate the water use processes of human activities [29]. After years of development, the model has been successfully applied to the determination of the impact of urbanization in Tokyo, Japan [30], the Qingxichuan watershed regeneration plan in Seoul, Korea [31], the water cycle simulation of typical Chinese watersheds such as the Heihe River basin [32] and the Haihe River basin [33], the evaluation of water resources in the Yellow River basin [34], and the study of the natural–social dualistic water cycle in the Haihe River basin [35]. The vertical and horizontal structures of the WEP-L model are shown in Figure 4 and Figure 5.
2.3.4. Model Setup, Calibration, and Validation
The basin was divided into 577 calculation units. The annual and monthly natural runoff data of the Guanyintang station were restored by consulting the relevant water intake data and reservoir operation data. The 10-day water distribution coefficients of agricultural irrigation were corrected according to the data of the Yongding River basin and the irrigation period of corn, which is the main crop in the area.
Three scenarios were set up to study the contributions of climate change, land use changes, water intakes, and coal mining to runoff attenuation (Table 2). Moreover, for water intake, agricultural (AWI), industrial and domestic water intakes (IWI) were taken into consideration. Scenario 1 was set to verify the simulation accuracy of the model under the non-water use condition, which can be used to eliminate the error caused by water use data. In Scenario 2, water use data were added to improve the simulation accuracy of the model. For Scenario 3, coal mining simulation was added to further improve the simulation accuracy of the model and identify the contribution rates of its factors. Our study period was 1956–2018, with a length of 63 years. Considering that another large coal mine was built near the upstream of the Guanyintang station in 1976, the calibration period was set from 1956 to 1976, validation period 1 from 1977 to 1997, and validation period 2 from 1998 to 2018. The differences in the effects of human activities on runoff between the 20th and 21st centuries are also shown by comparing verification periods 1 and 2. For each case, there were scenarios with actual meteorological data inputs (CCS) and comparison scenarios, also called the non-climate change scenario (NCCS), where the climate scenarios of validation periods 1 and 2 are all the same as those of the calibration period to distinguish the contribution of climate change and human activities to runoff attenuation.
In this study, the Nash–Sutcliffe efficiency (NSE) and relative error (RE) were used to evaluate the performance of the model.
2.3.5. Coal Mining Module Improvement
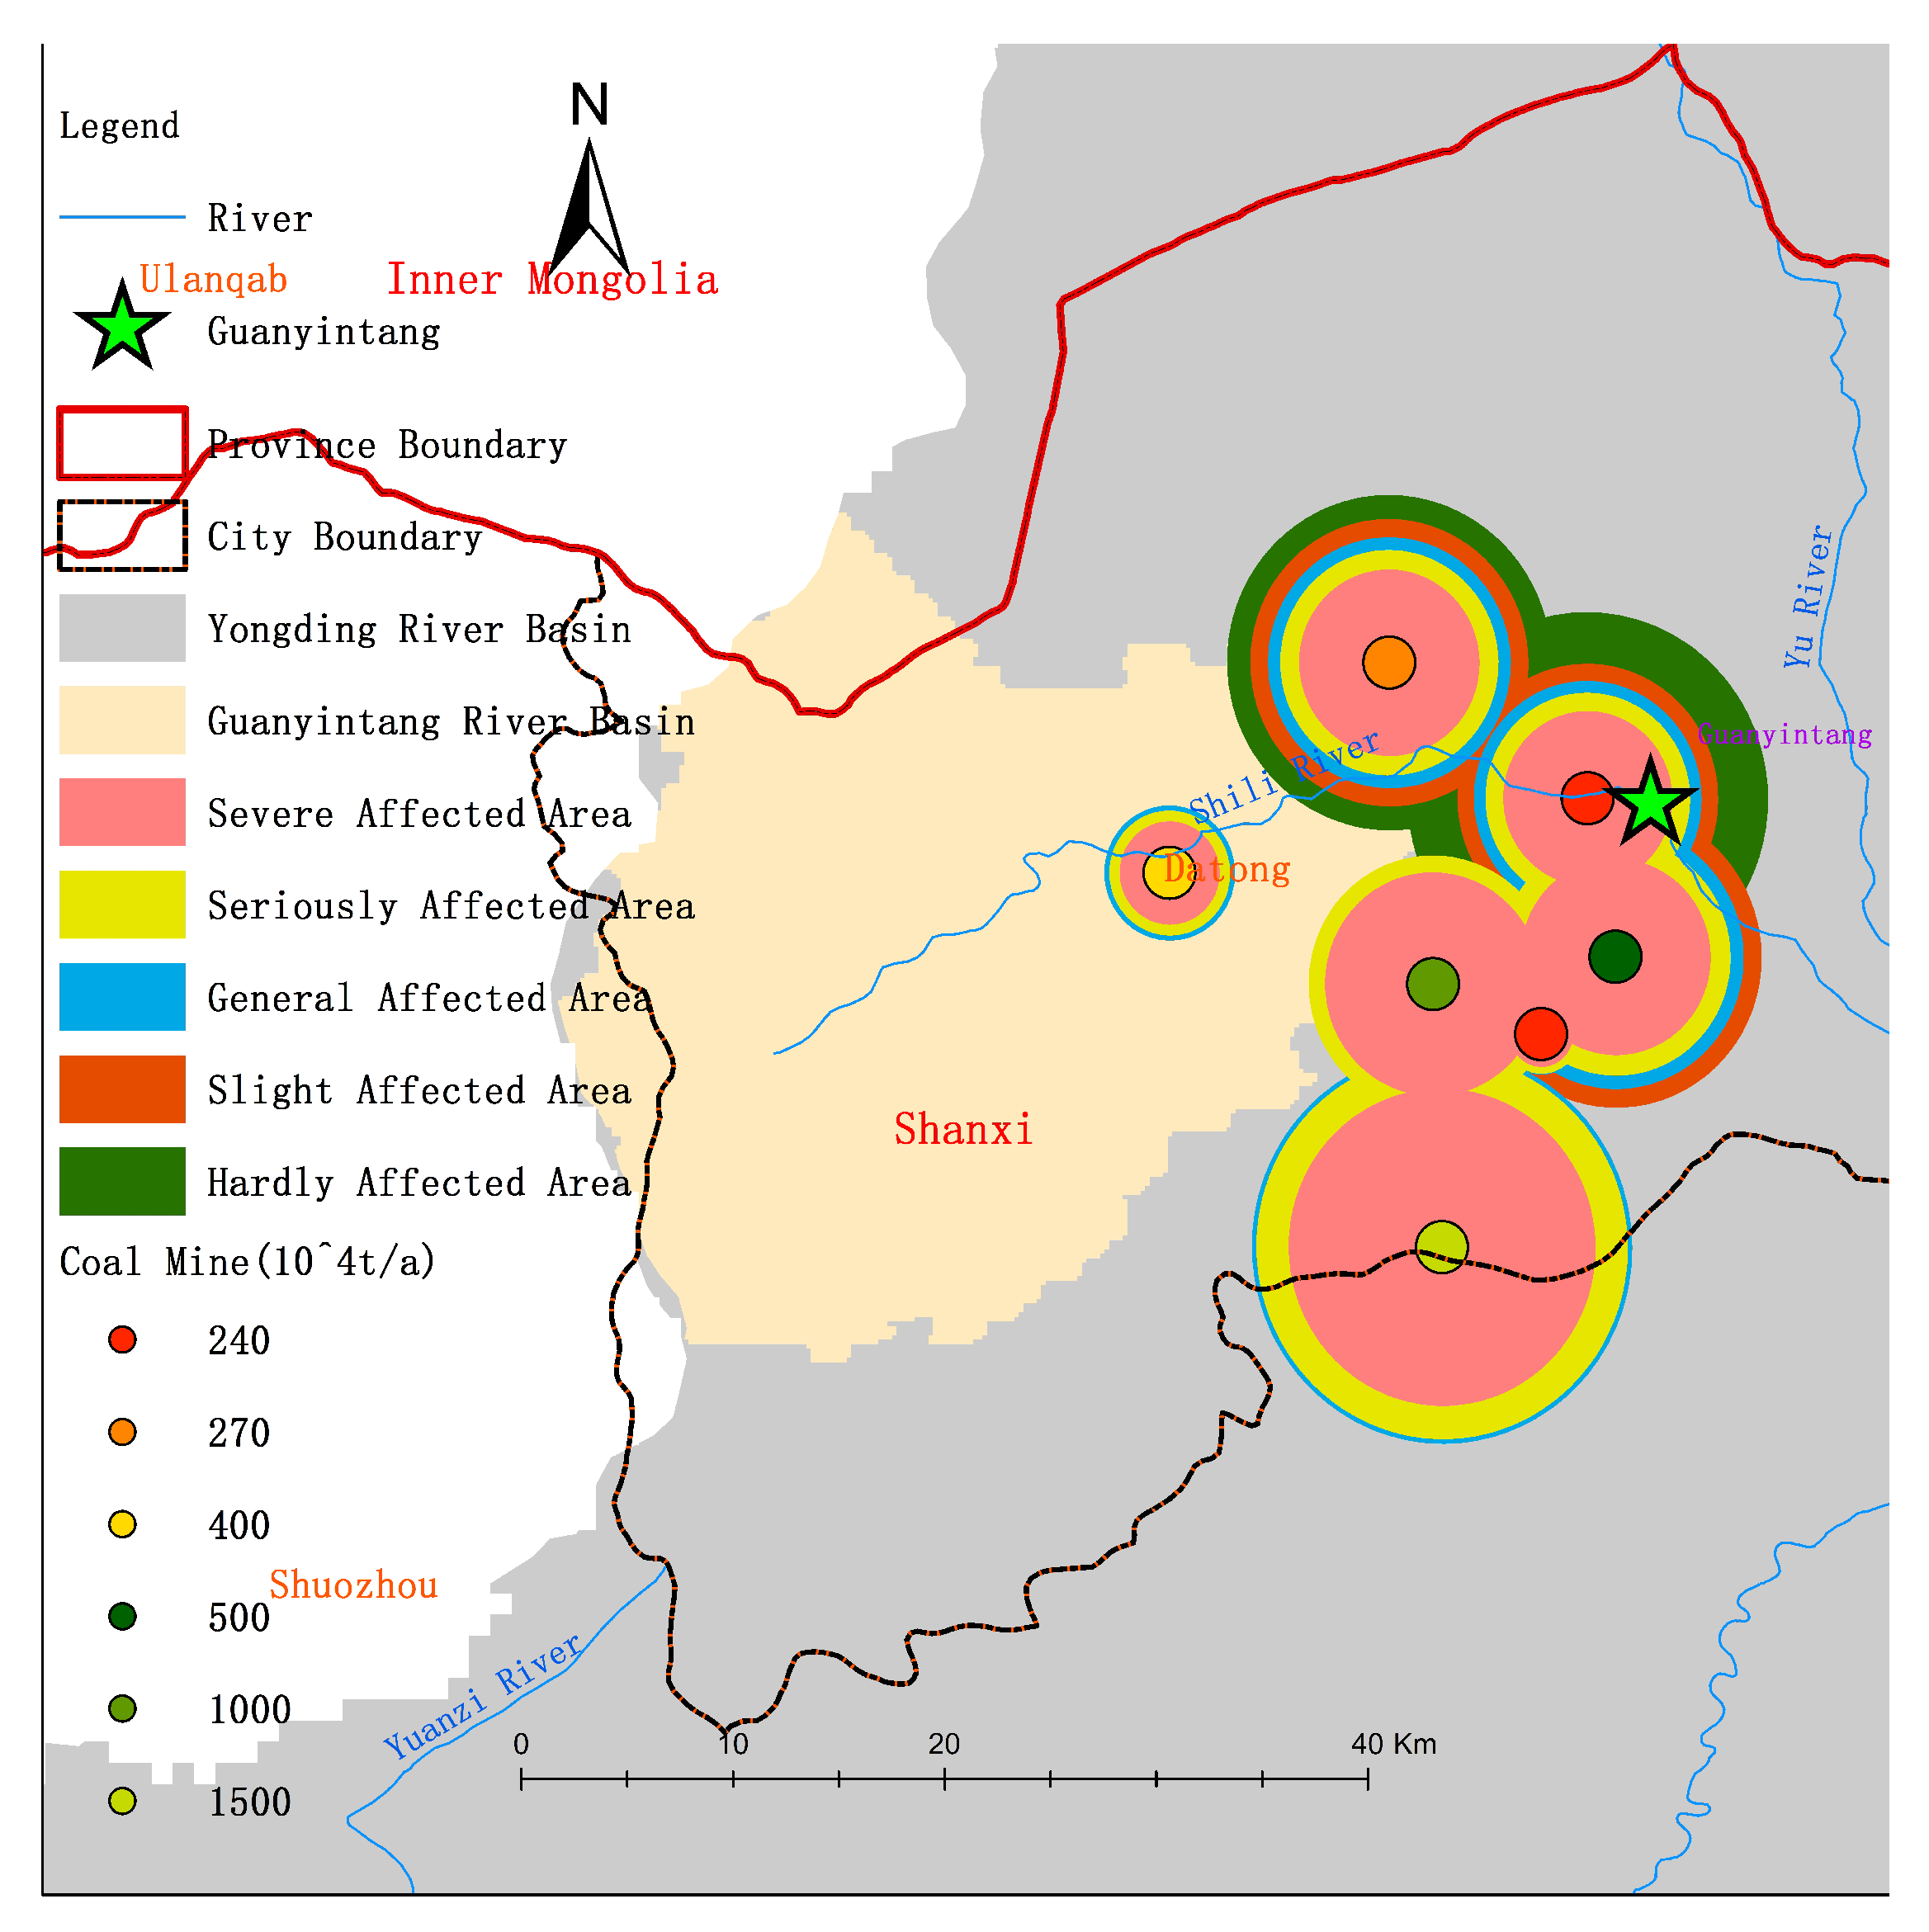
There are eight large coal mines in the Yongding River basin (annual output ≥2 million tons). Two of these are close to each other and built in the same year, so they were combined into one. Five areas have been established based on the size of the goaves, dependent on the number of years of mining and the mining rate, and distance from the coal mine: severely affected area (scope of the coal mine), seriously affected areas (to be influenced within 0–5 years), generally affected areas (to be influenced within 5–14 years), slightly affected areas (to be influenced in 14–28 years), and hardly affected areas (affected areas up to 2018). The areas to be influenced after 2018 were not discussed in this paper. The scope of the goaves generated by coal mining is shown in Figure 6.
The five influence areas were allocated to their simulation units according to their spatial location, then the proportion of affected areas in the calculation units were calculated. A comprehensive influenced coefficient was calculated through the inverse distance weighting of the radius of the five affected areas:
where is the influenced coefficient of the calculation unit, is the affected area in the calculation unit (km2), is the area of the calculation unit (km2), is the inverse distance square weight, and is the radius of the affected area (km).
A new coal mining layer was added to the bottom of the model to store the percolated water, and the percolation priority was raised to simulate the impact of rapid infiltration in the goaf on runoff production:
where is the amount of water stored in the goaf ( km2), n is the number of coal mines that have affected the calculation unit, is the annual output of the coal mine ( t), is a correction coefficient in the model simulation, m is the number of calculation units affected by the coal mine, is the water storage allocation weight of the calculation units, and is the influenced coefficients.In this study, m varied from 1 to 6 and n varied from 1 to 4.
The drained water was partially reused, and the rest was discharged into the nearby river. A constant proportion of 0.15 between the drainage and the annual output of a coal mine was used from the data of the Datong coalfields:
where is the amount of water discharged into the river ( km2), and is the proportion of water reused in the model simulation.
The vertical and lateral hydraulic conductivities of the calculation unit within the goaf were increased to simulate the rapid infiltration and lateral flow recharge in the goaves:
where is the vertical hydraulic conductivity coefficient of the calculation unit (), is the lateral hydraulic conductivity coefficient of the calculation unit (),The original value of and ranged from 0.01 to 0.1 according to empirical data and relevant references. n is the number of coal mines that have affected the calculation unit, and are the correction coefficients in the model simulation, and represents the influenced coefficients.
The vertical structure of the model after improvement is shown Figure 7:
2.3.6. Calculation of the Contribution Rates
In this study, runoff reduction is the difference between the observed runoff of the calibration period and the validation period. The contributions of each factor were calculated in the following.
The contribution of land use change was estimated in the NCCS of S1 by subtracting the simulated runoff in the validation period from that in the calibration period as the influences of climate change and water intake were ruled out:
where is the runoff change due to land use change, is the simulated flow in the calibration period of S12, and is the simulated flow in the validation period of S11.
The contribution of climate change was estimated by subtracting the simulated runoff in the validation period of the CCS from that in the validation period of the NCCS. As these were on the same underlying surface, the difference was considered to be caused by climate change.
where is the runoff change due to climate change, is the simulated flow in the validation period of S32, and is the simulated flow in the validation period of S31.
The contributions of agricultural water intake () and industrial and domestic water intake () were converted from their quantity of water intake. The contribution of coal mining was calculated by converting its simulated results (.)
Lastly, the contribution rate of a factor was calculated by dividing its contribution by the sum of the contributions.
3. Results
3.1. Climate Change Trends Analysis
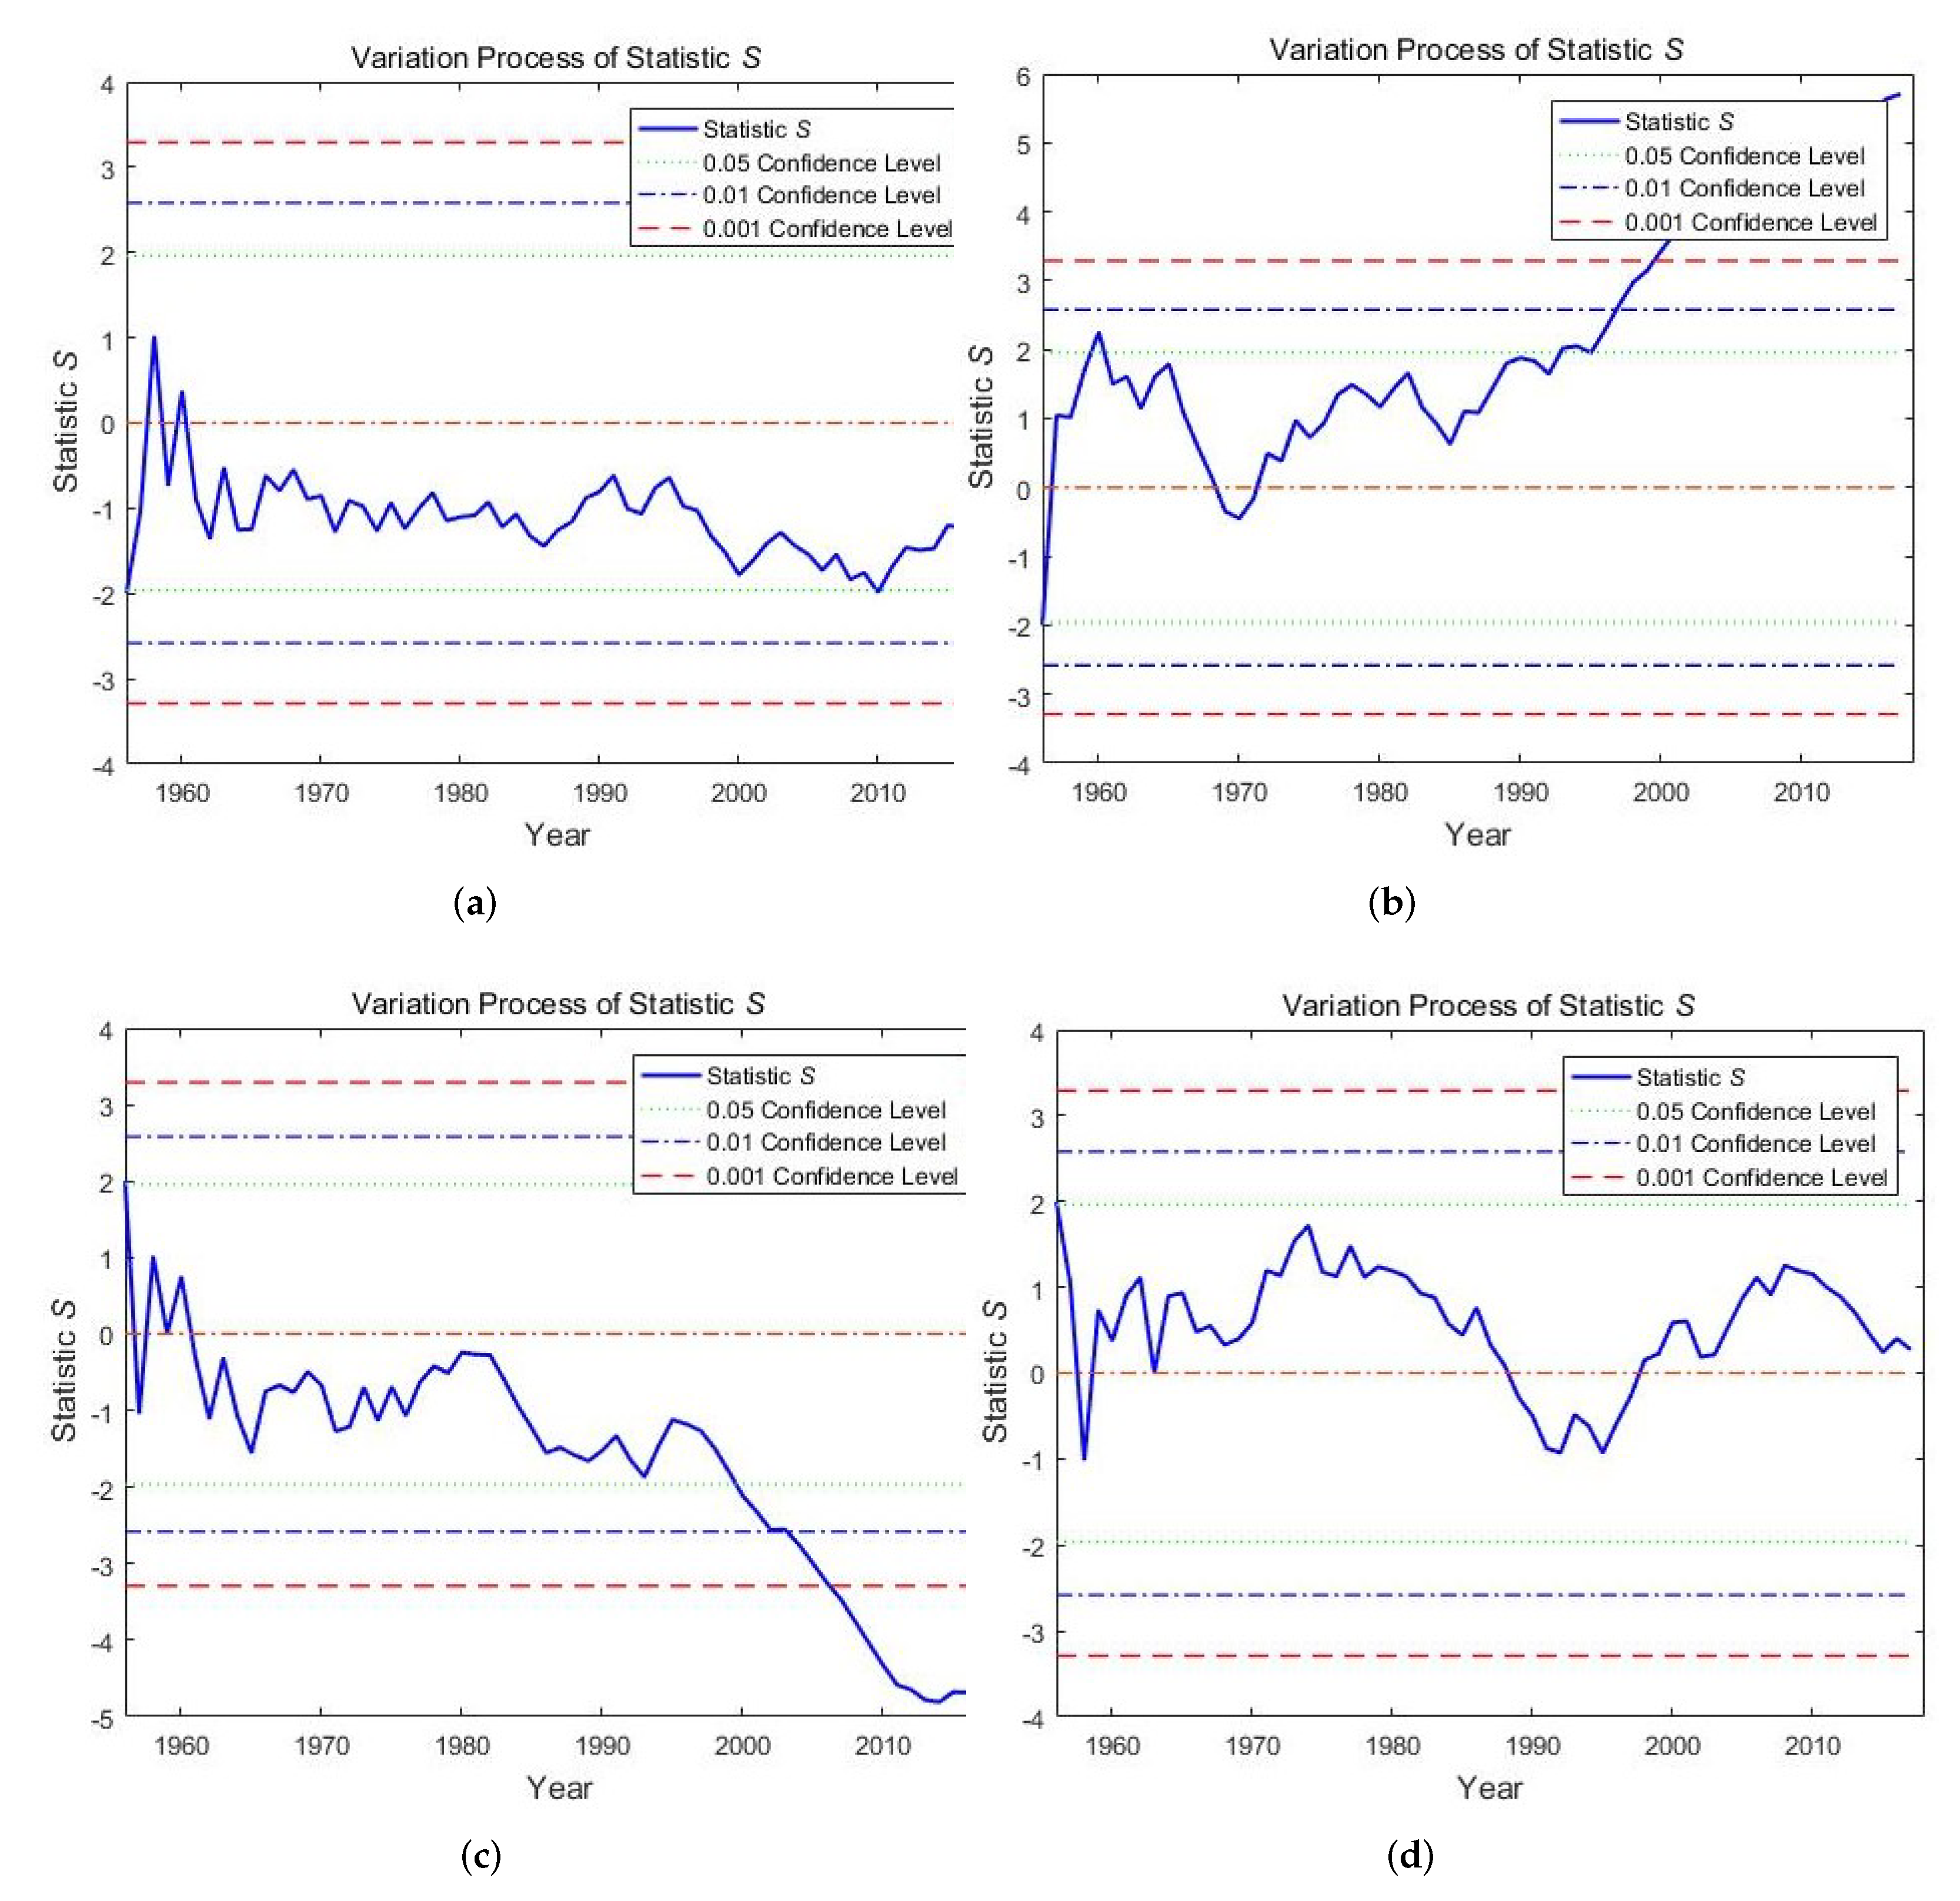
The M–K test results of monthly precipitation, monthly mean temperature, monthly runoff and monthly evapotranspiration between 1956 and 2018 in the Guanyintang station are presented in Table 3 and Figure 8, showing that the precipitation of the Guanyintang control basin decreased to a certain extent, reaching the 80% confidence level. Evaporation had a very slight increase, which was almost negligible. The temperature showed a very obvious upward trend, exceeding the 99.9% confidence level, which was consistent with the upward trend of the global temperature and with a mutation point of 1991. The runoff attenuation was significantly obvious, exceeding the 99.9% confidence level with a mutation point of 1998.
The results of the wavelet analysis in Table 4 and Figure 9 show some periodic (but not very obvious) laws of precipitation in the Guanyintang River basin. For temperature, evaporation, and runoff, there were hardly any periodic laws. Meanwhile, the mutation points were consistent with the results of the M–K test.
3.2. Model Simulation Results Analysis
3.2.1. Simulation Results of S1
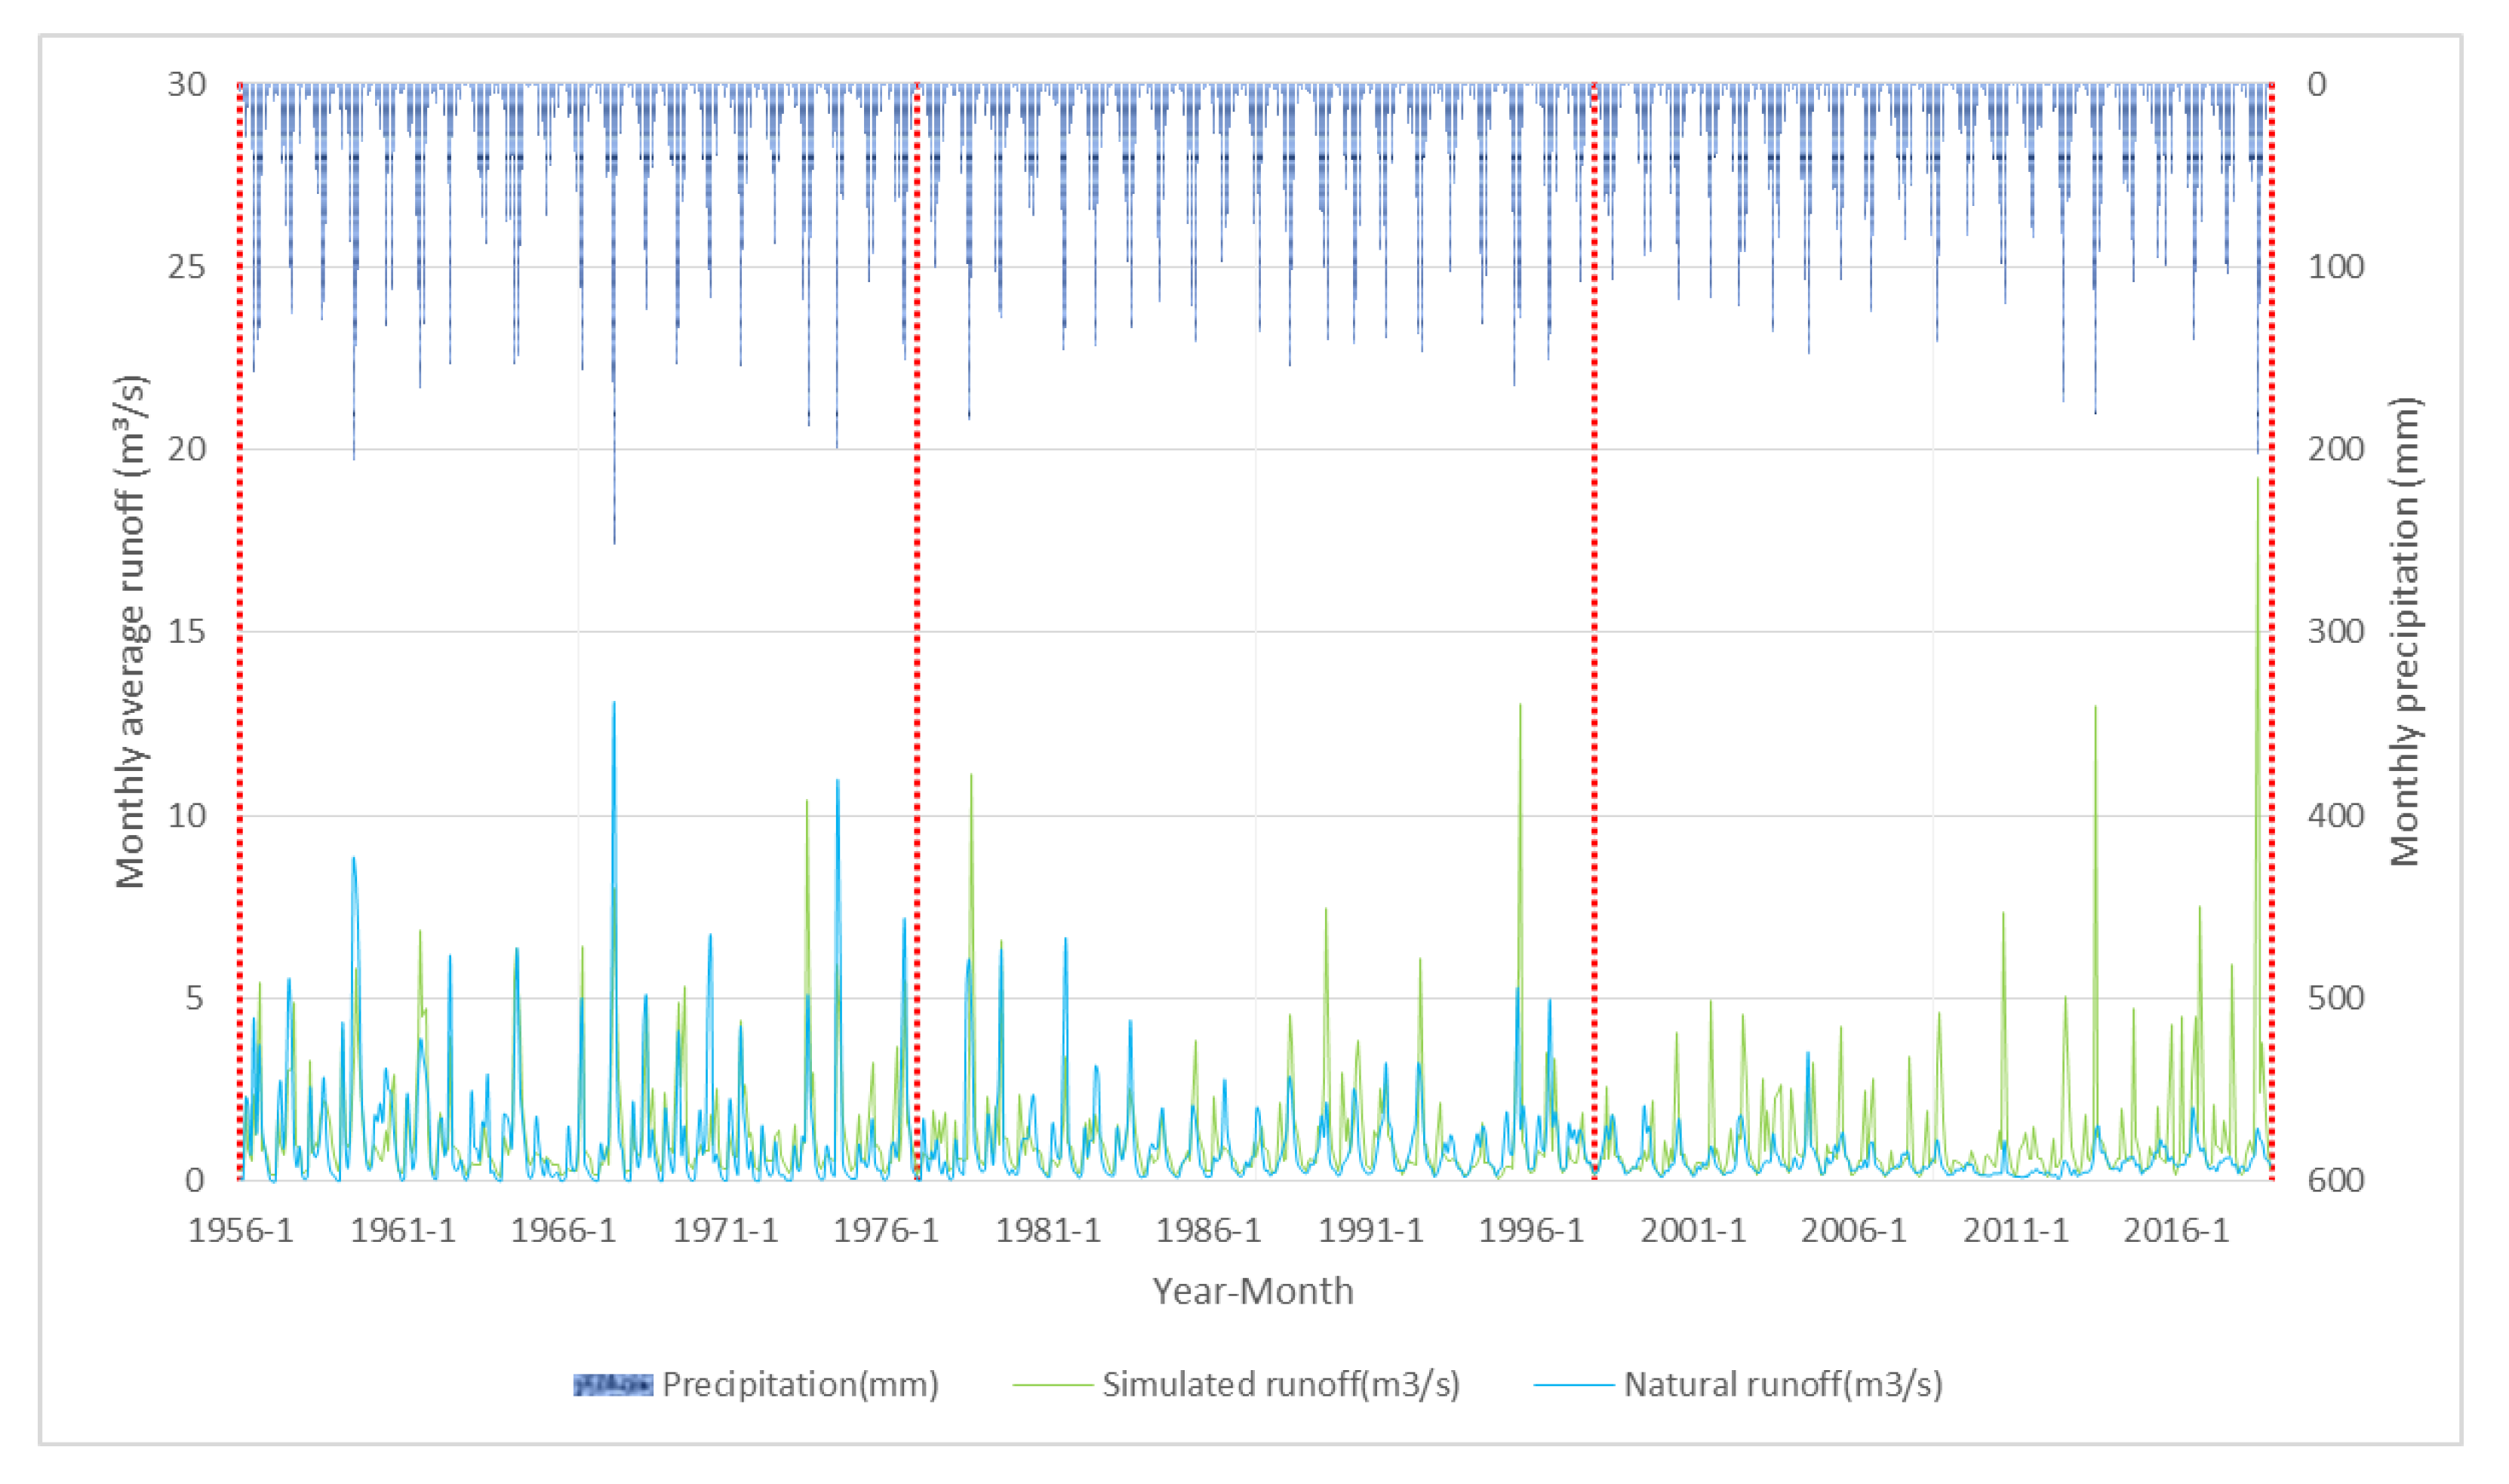
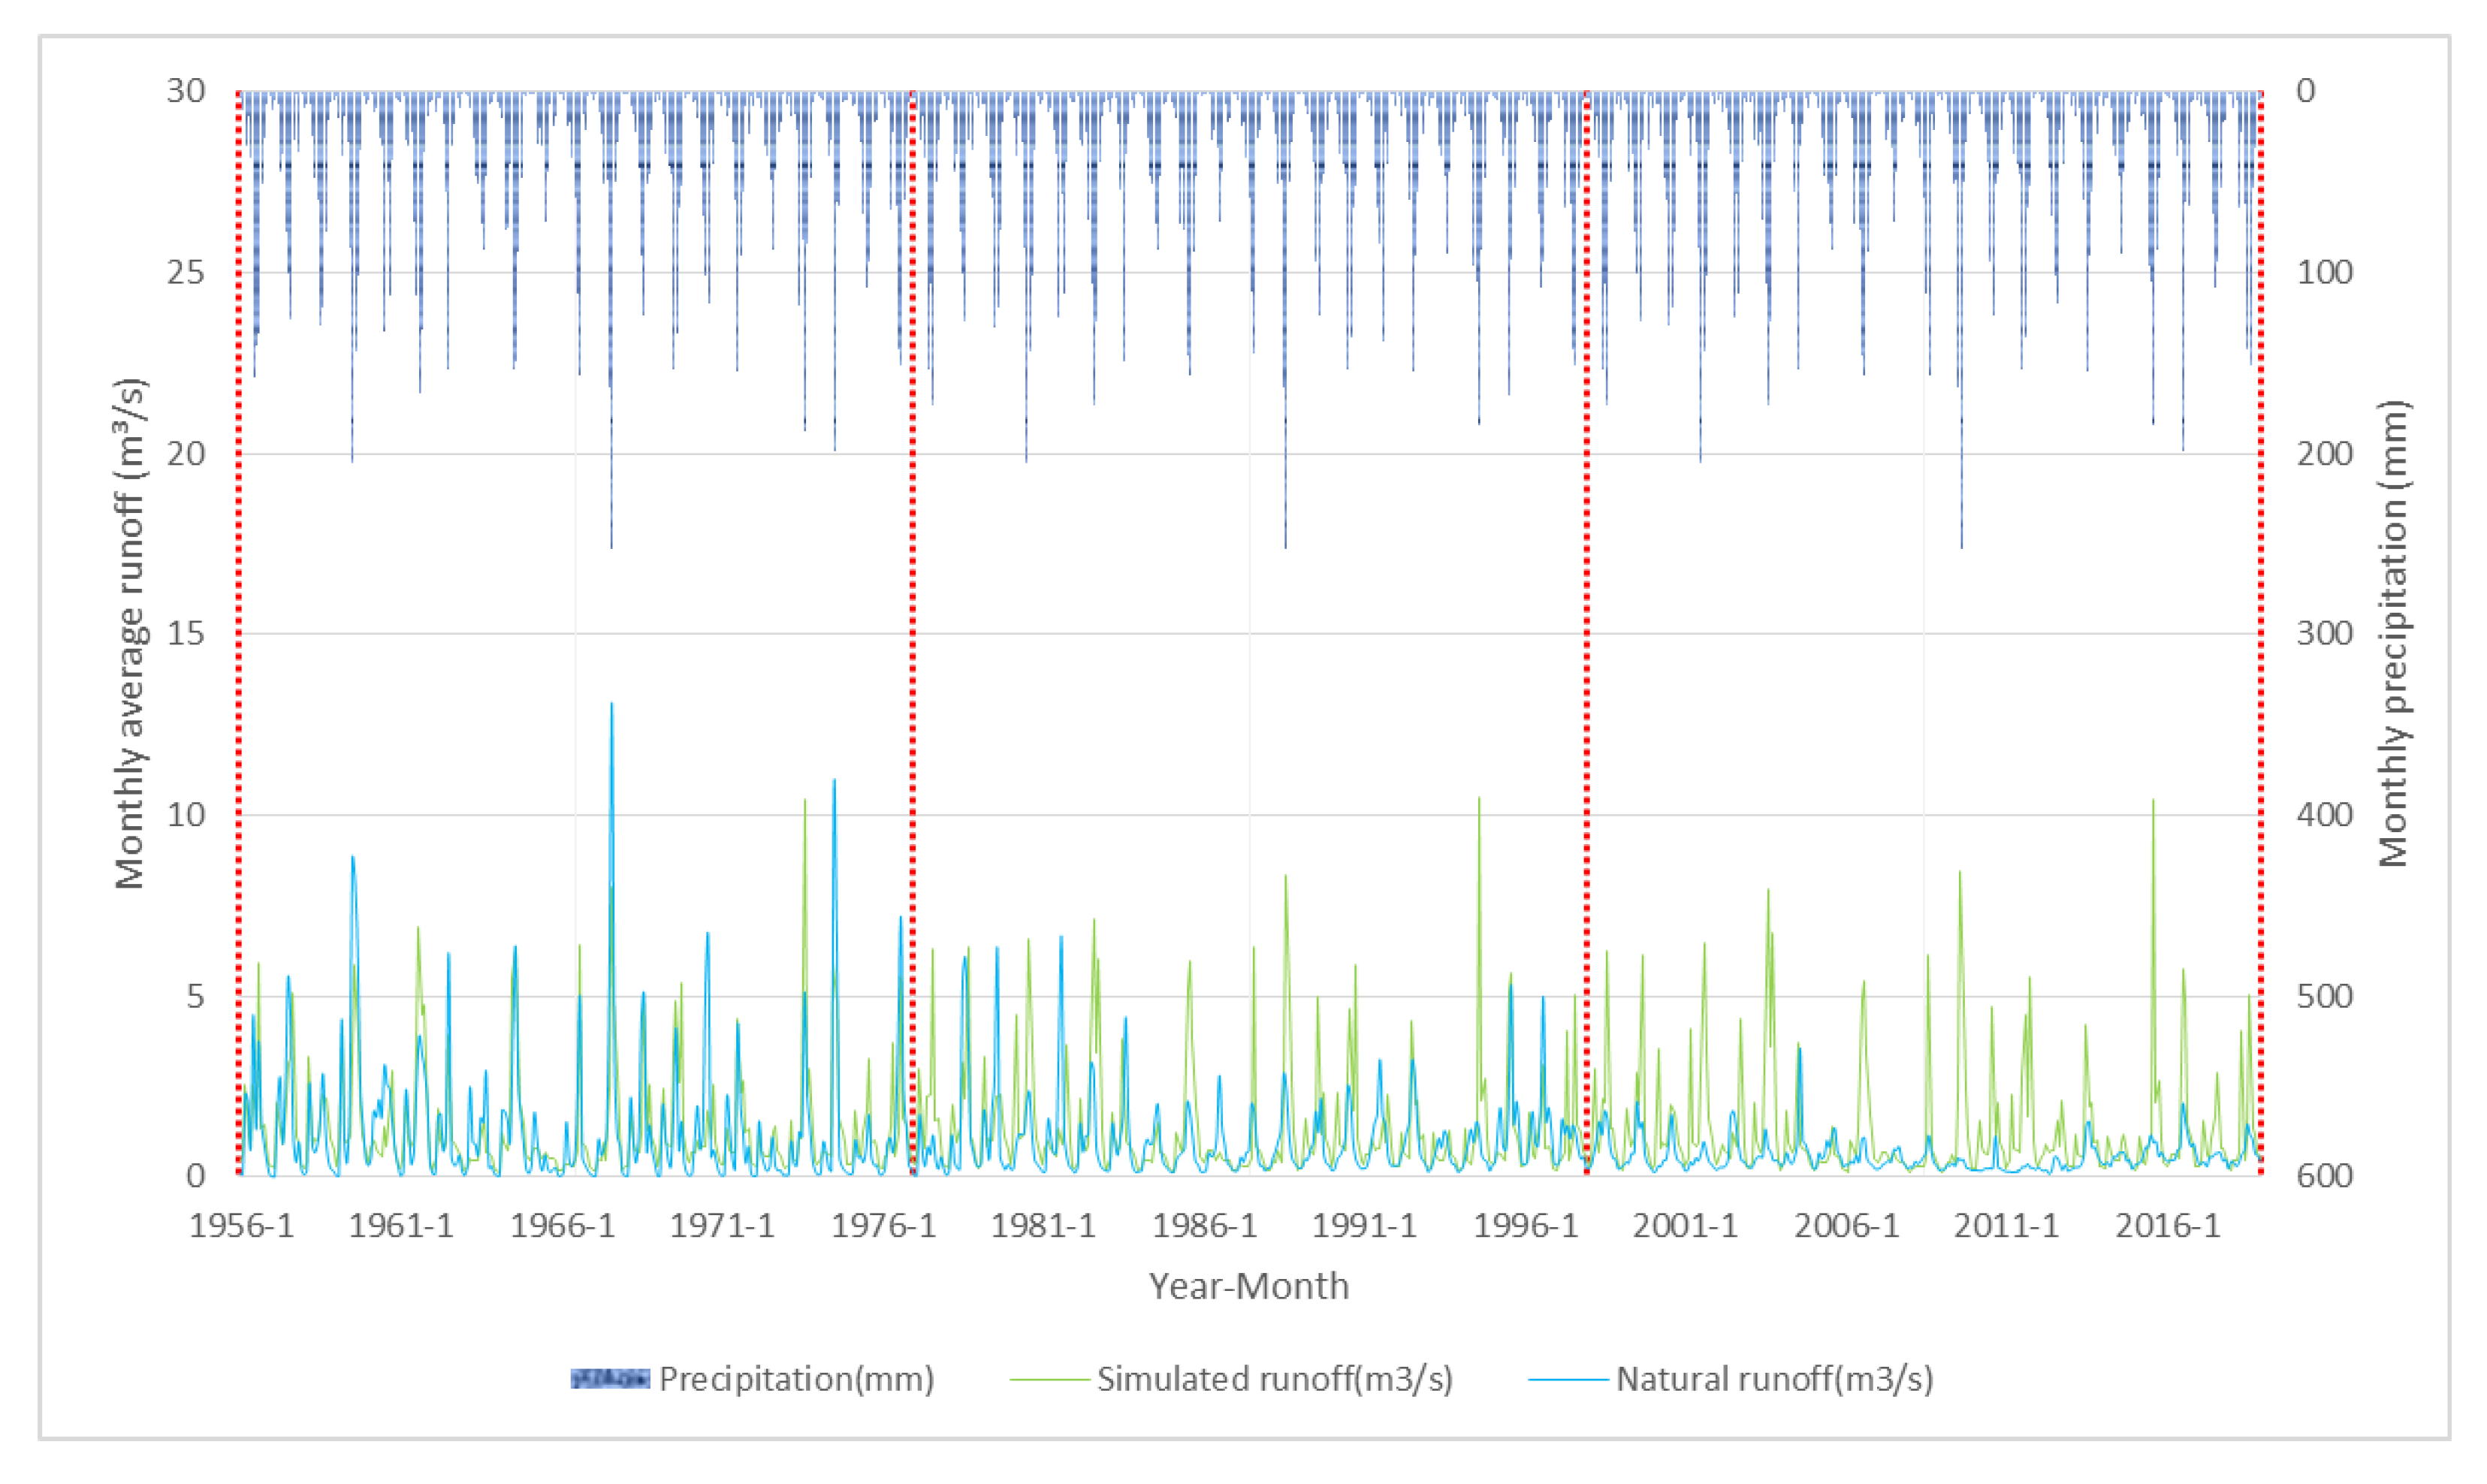
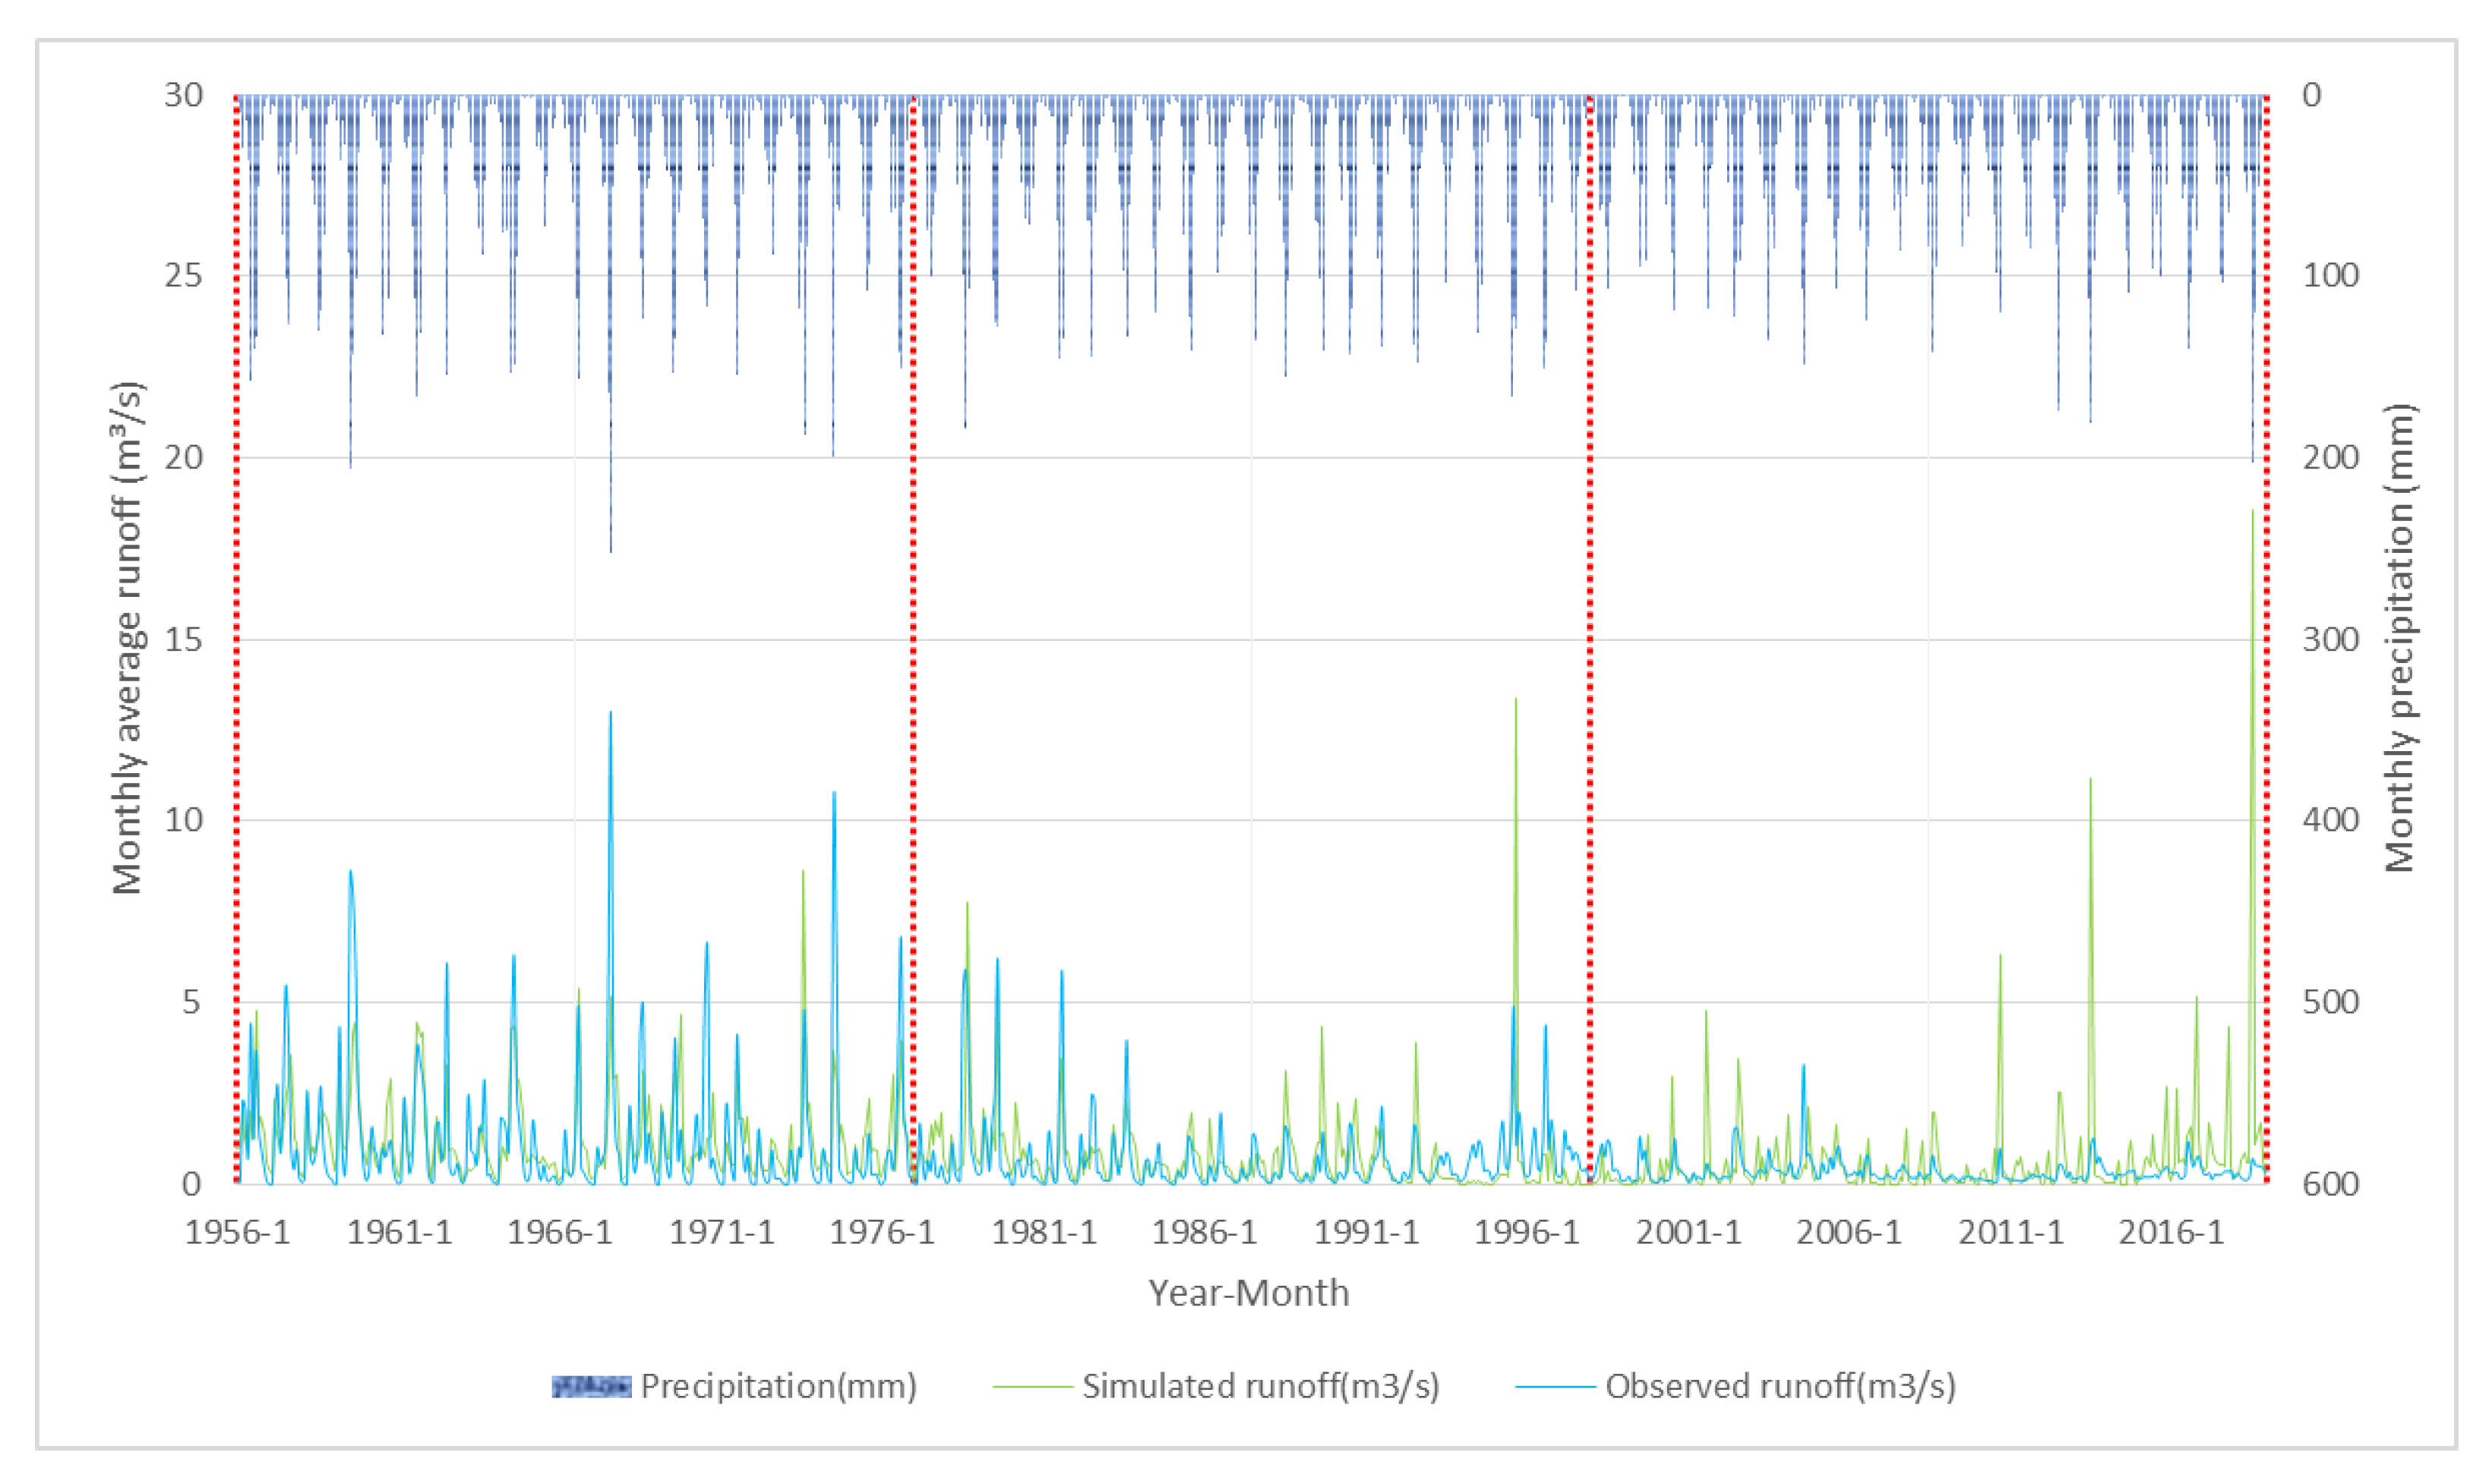
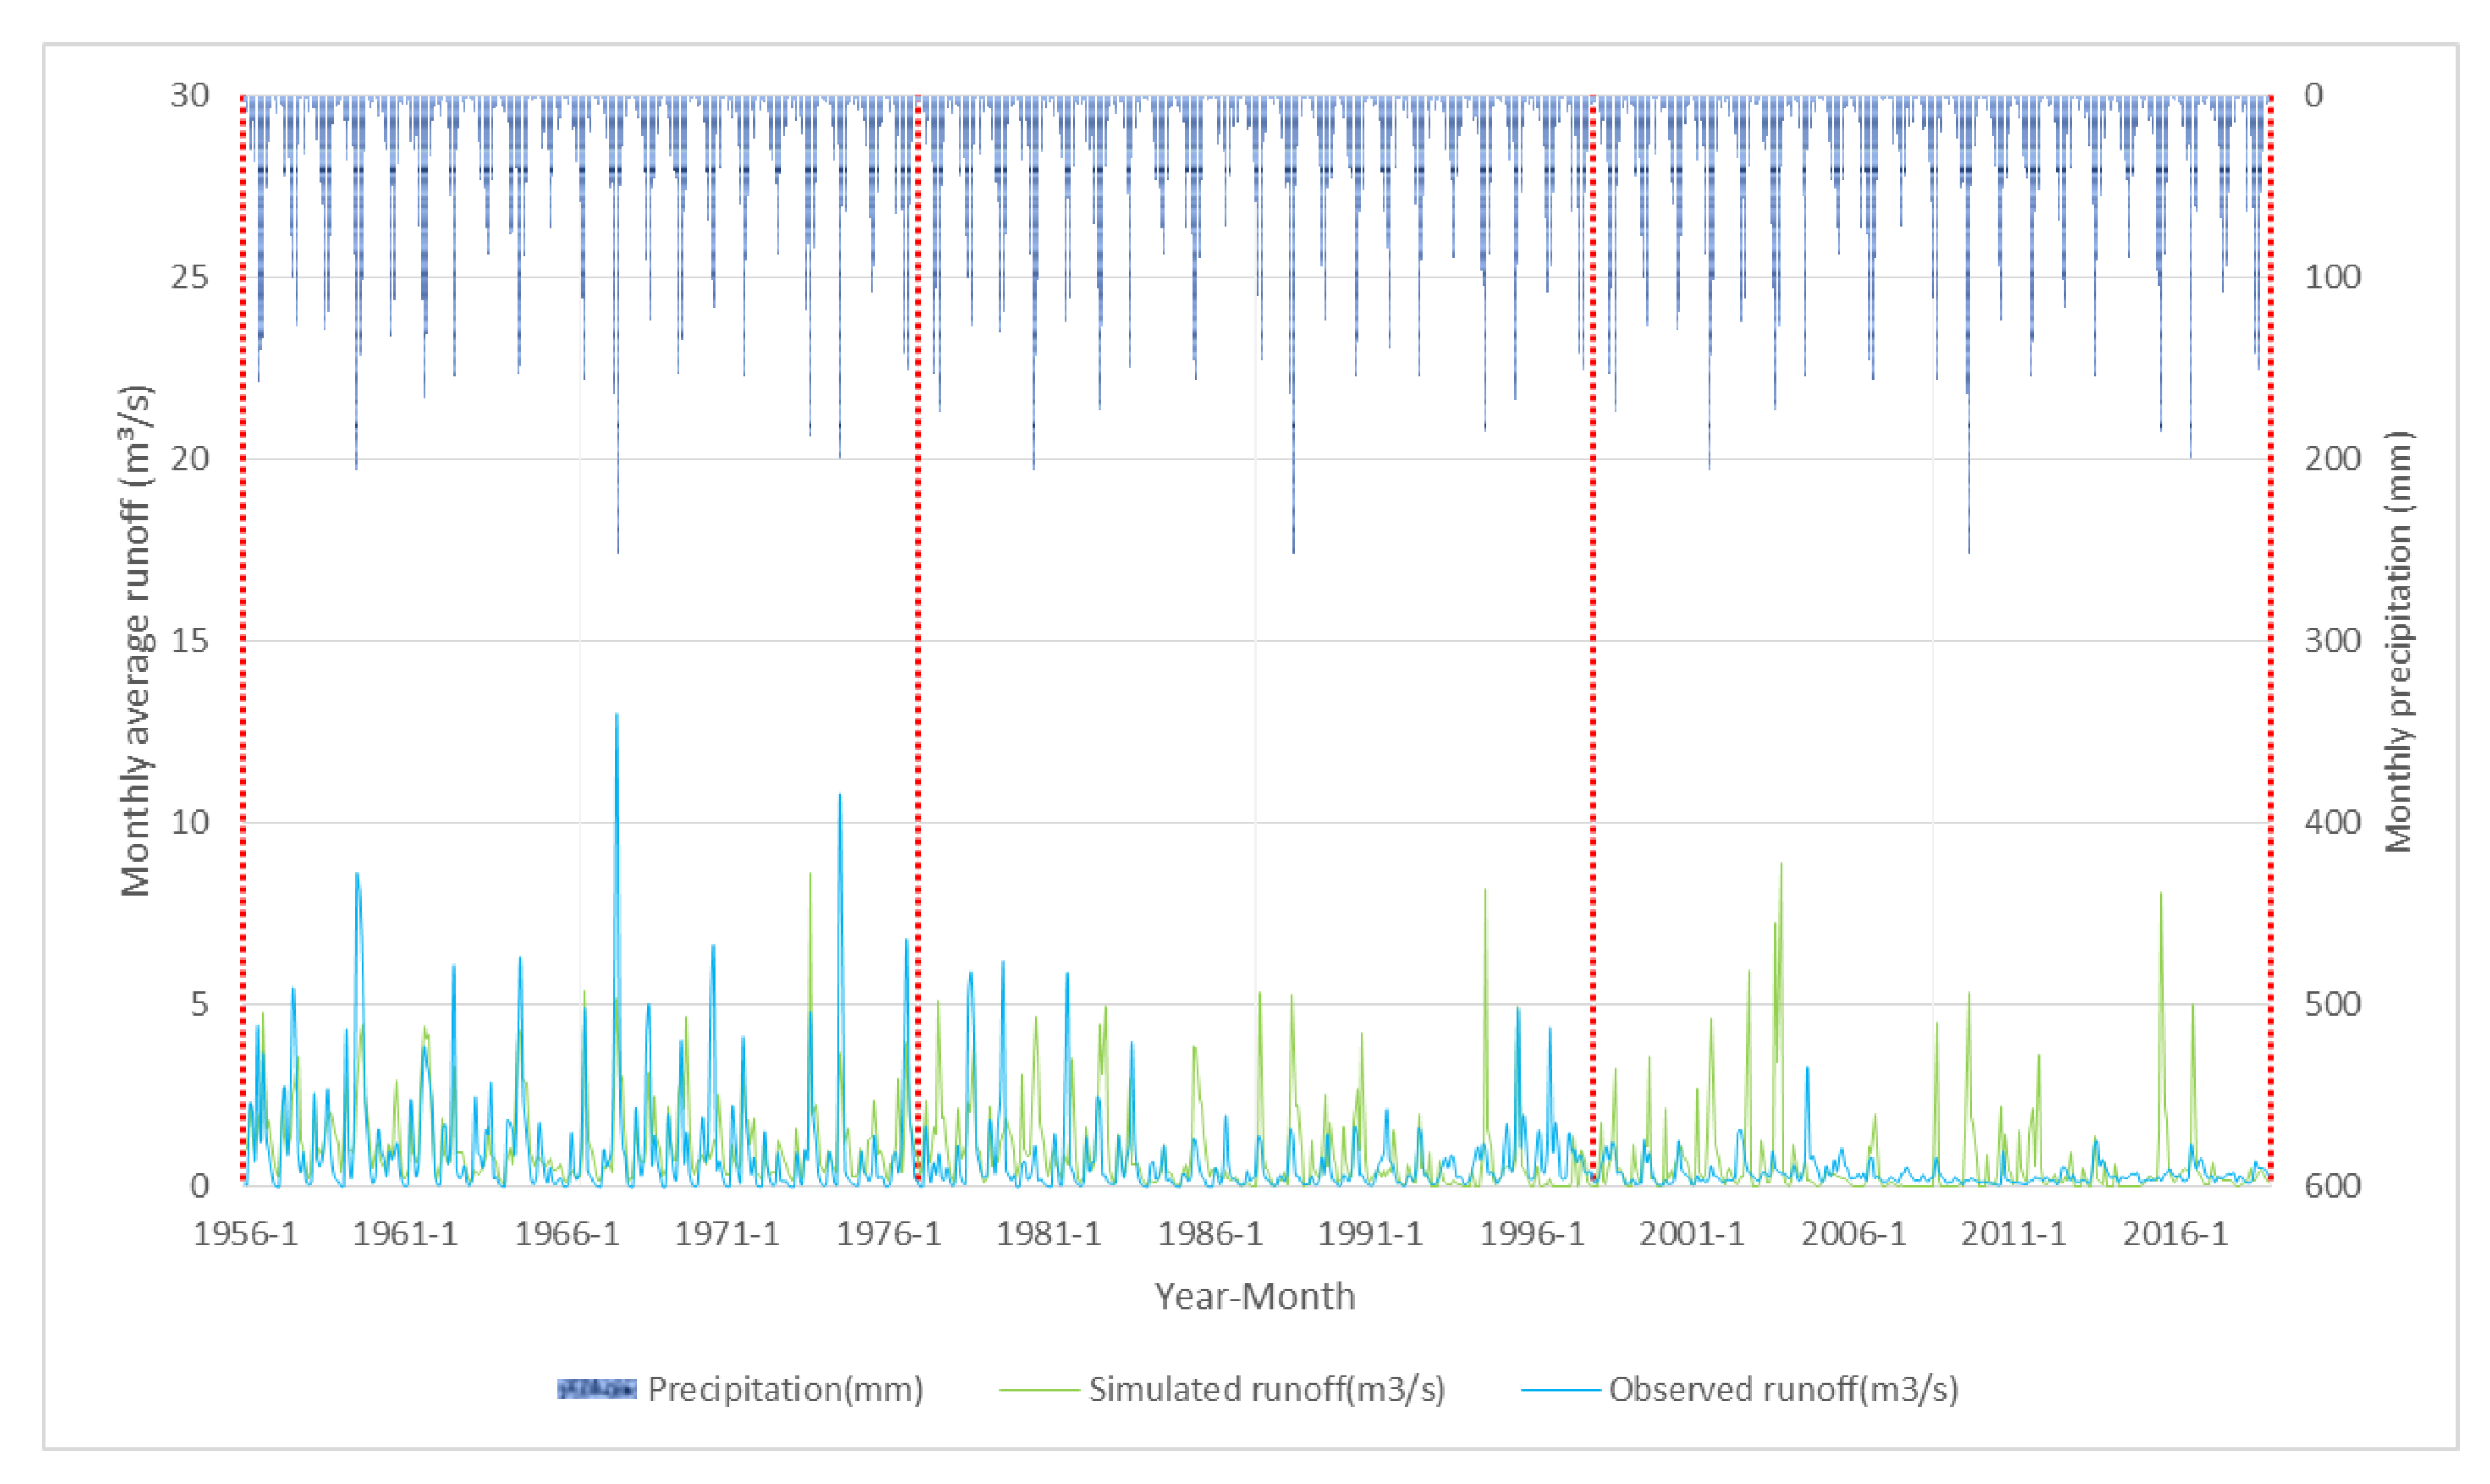
The simulation results of S1 are shown in Table 5 and Figure 10 and Figure 11. The simulation accuracy in the calibration periods was acceptable with a NSE close to 0.6 and RE less than 5%. These indicate that the WEP-L model had good applicability in the Guanyintang basin. In the validation periods, relative errors increased rapidly under the same parameters as the calibration period. As the water intakes has been restored, the reasons were supposed to be the change in the underlying surface and the hydrological process caused by human activities, such as coal mining, groundwater over-exploitation, and so on.
In the NCCS, the runoff decreased gradually under the same climate scenario. It is supposed to be caused by land use change as we ruled out climate change and water intakes. In validation period 1, the simulation accuracy and relative error of the CCS are better than those of the NCCS, indicating that climate change played an important role in the runoff attenuation. In validation period 2, the relative errors exceeded 100%, indicating that the changes in the underlying surface and hydrological process caused great runoff attenuation in this period and still cannot meet the water balance, even if the water intakes were restored. Thus, water use must be considered to improve the simulation accuracy of the model.
3.2.2. Simulation Results of S2
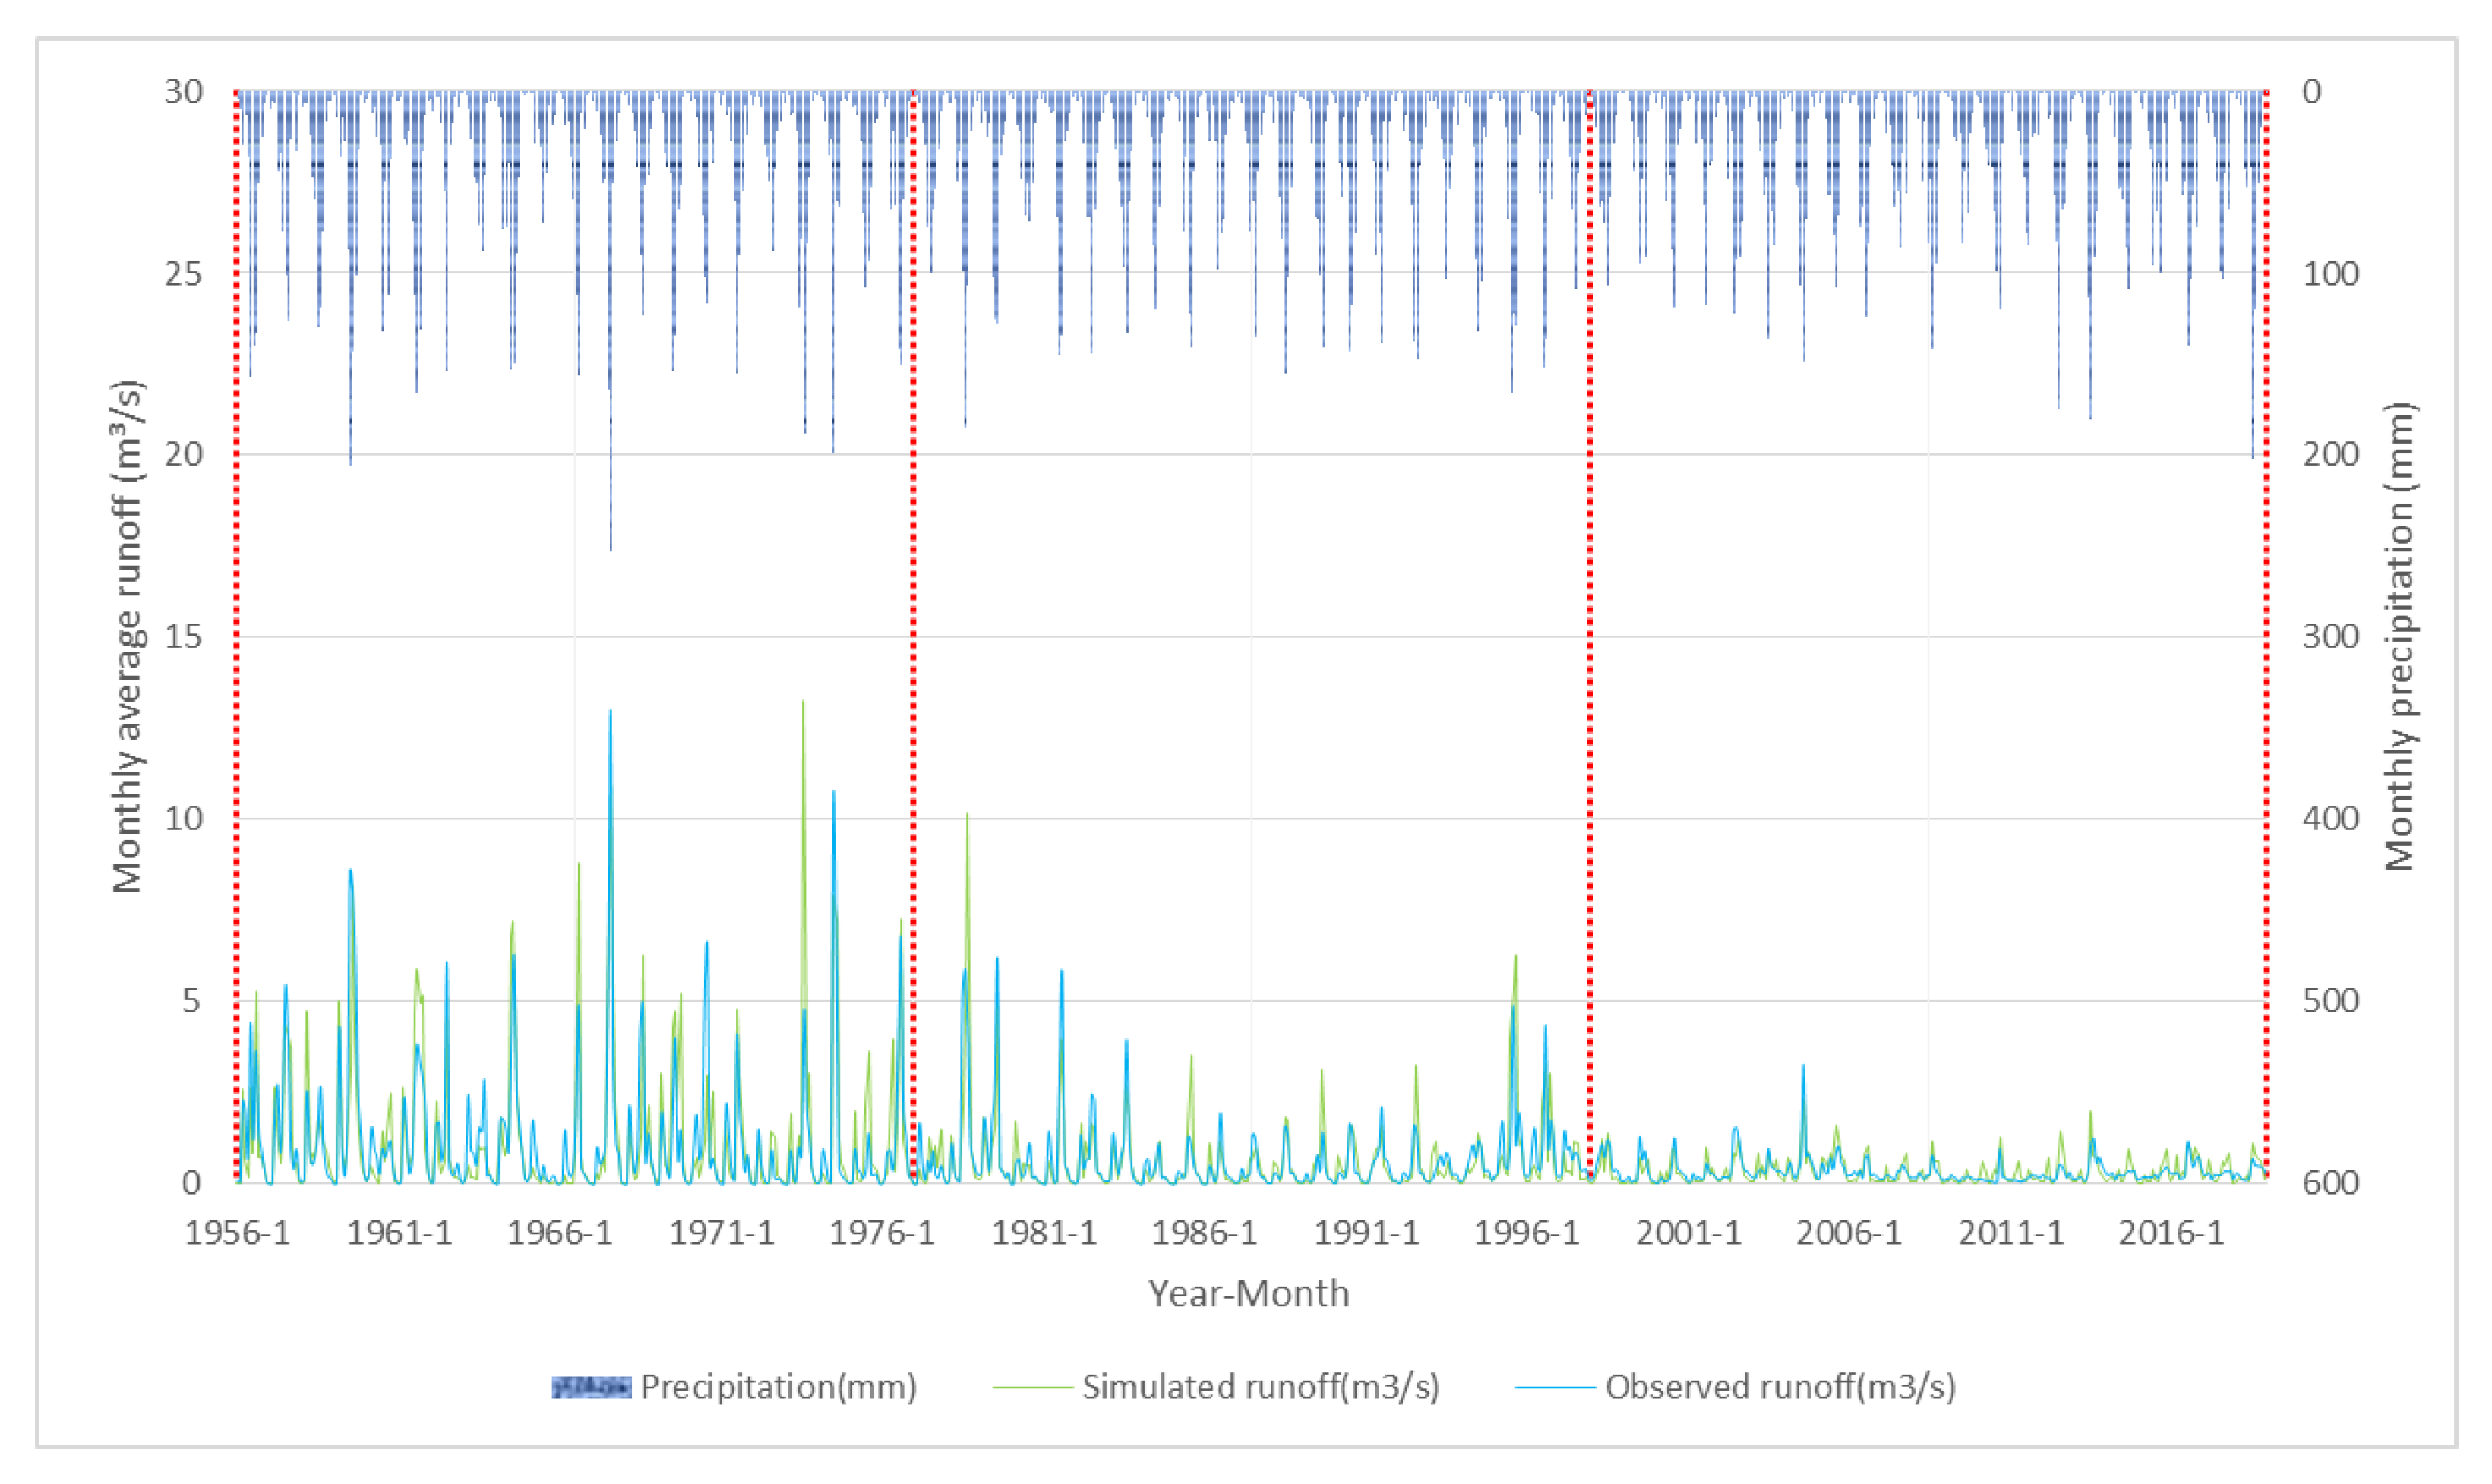
The simulation results of S2 are shown in Table 6 and Figure 12 and Figure 13. After readjusting the parameters in the calibration period, we found that the relative errors in the validation periods were better than those of S1, indicating that adding water use in the model simulation is a better way of getting more accurate results than directly restoring it from the observed flow.
In validation period 1, the simulation accuracy and relative error of the CCS were also better than those in the NCCS, further proving that climate change is an important factor in the runoff attenuation in validation period 1. Moreover, there were still huge relative errors in validation period 2, so we believe that the underlying surface and hydrological process of the Guanyintang River basin changed remarkably. Considering that Shanxi has been the largest coal producer for a long time in China, a coal mining module was added in the model to identify the contribution of coal mining to runoff attenuation.
3.2.3. Simulation Results of S3
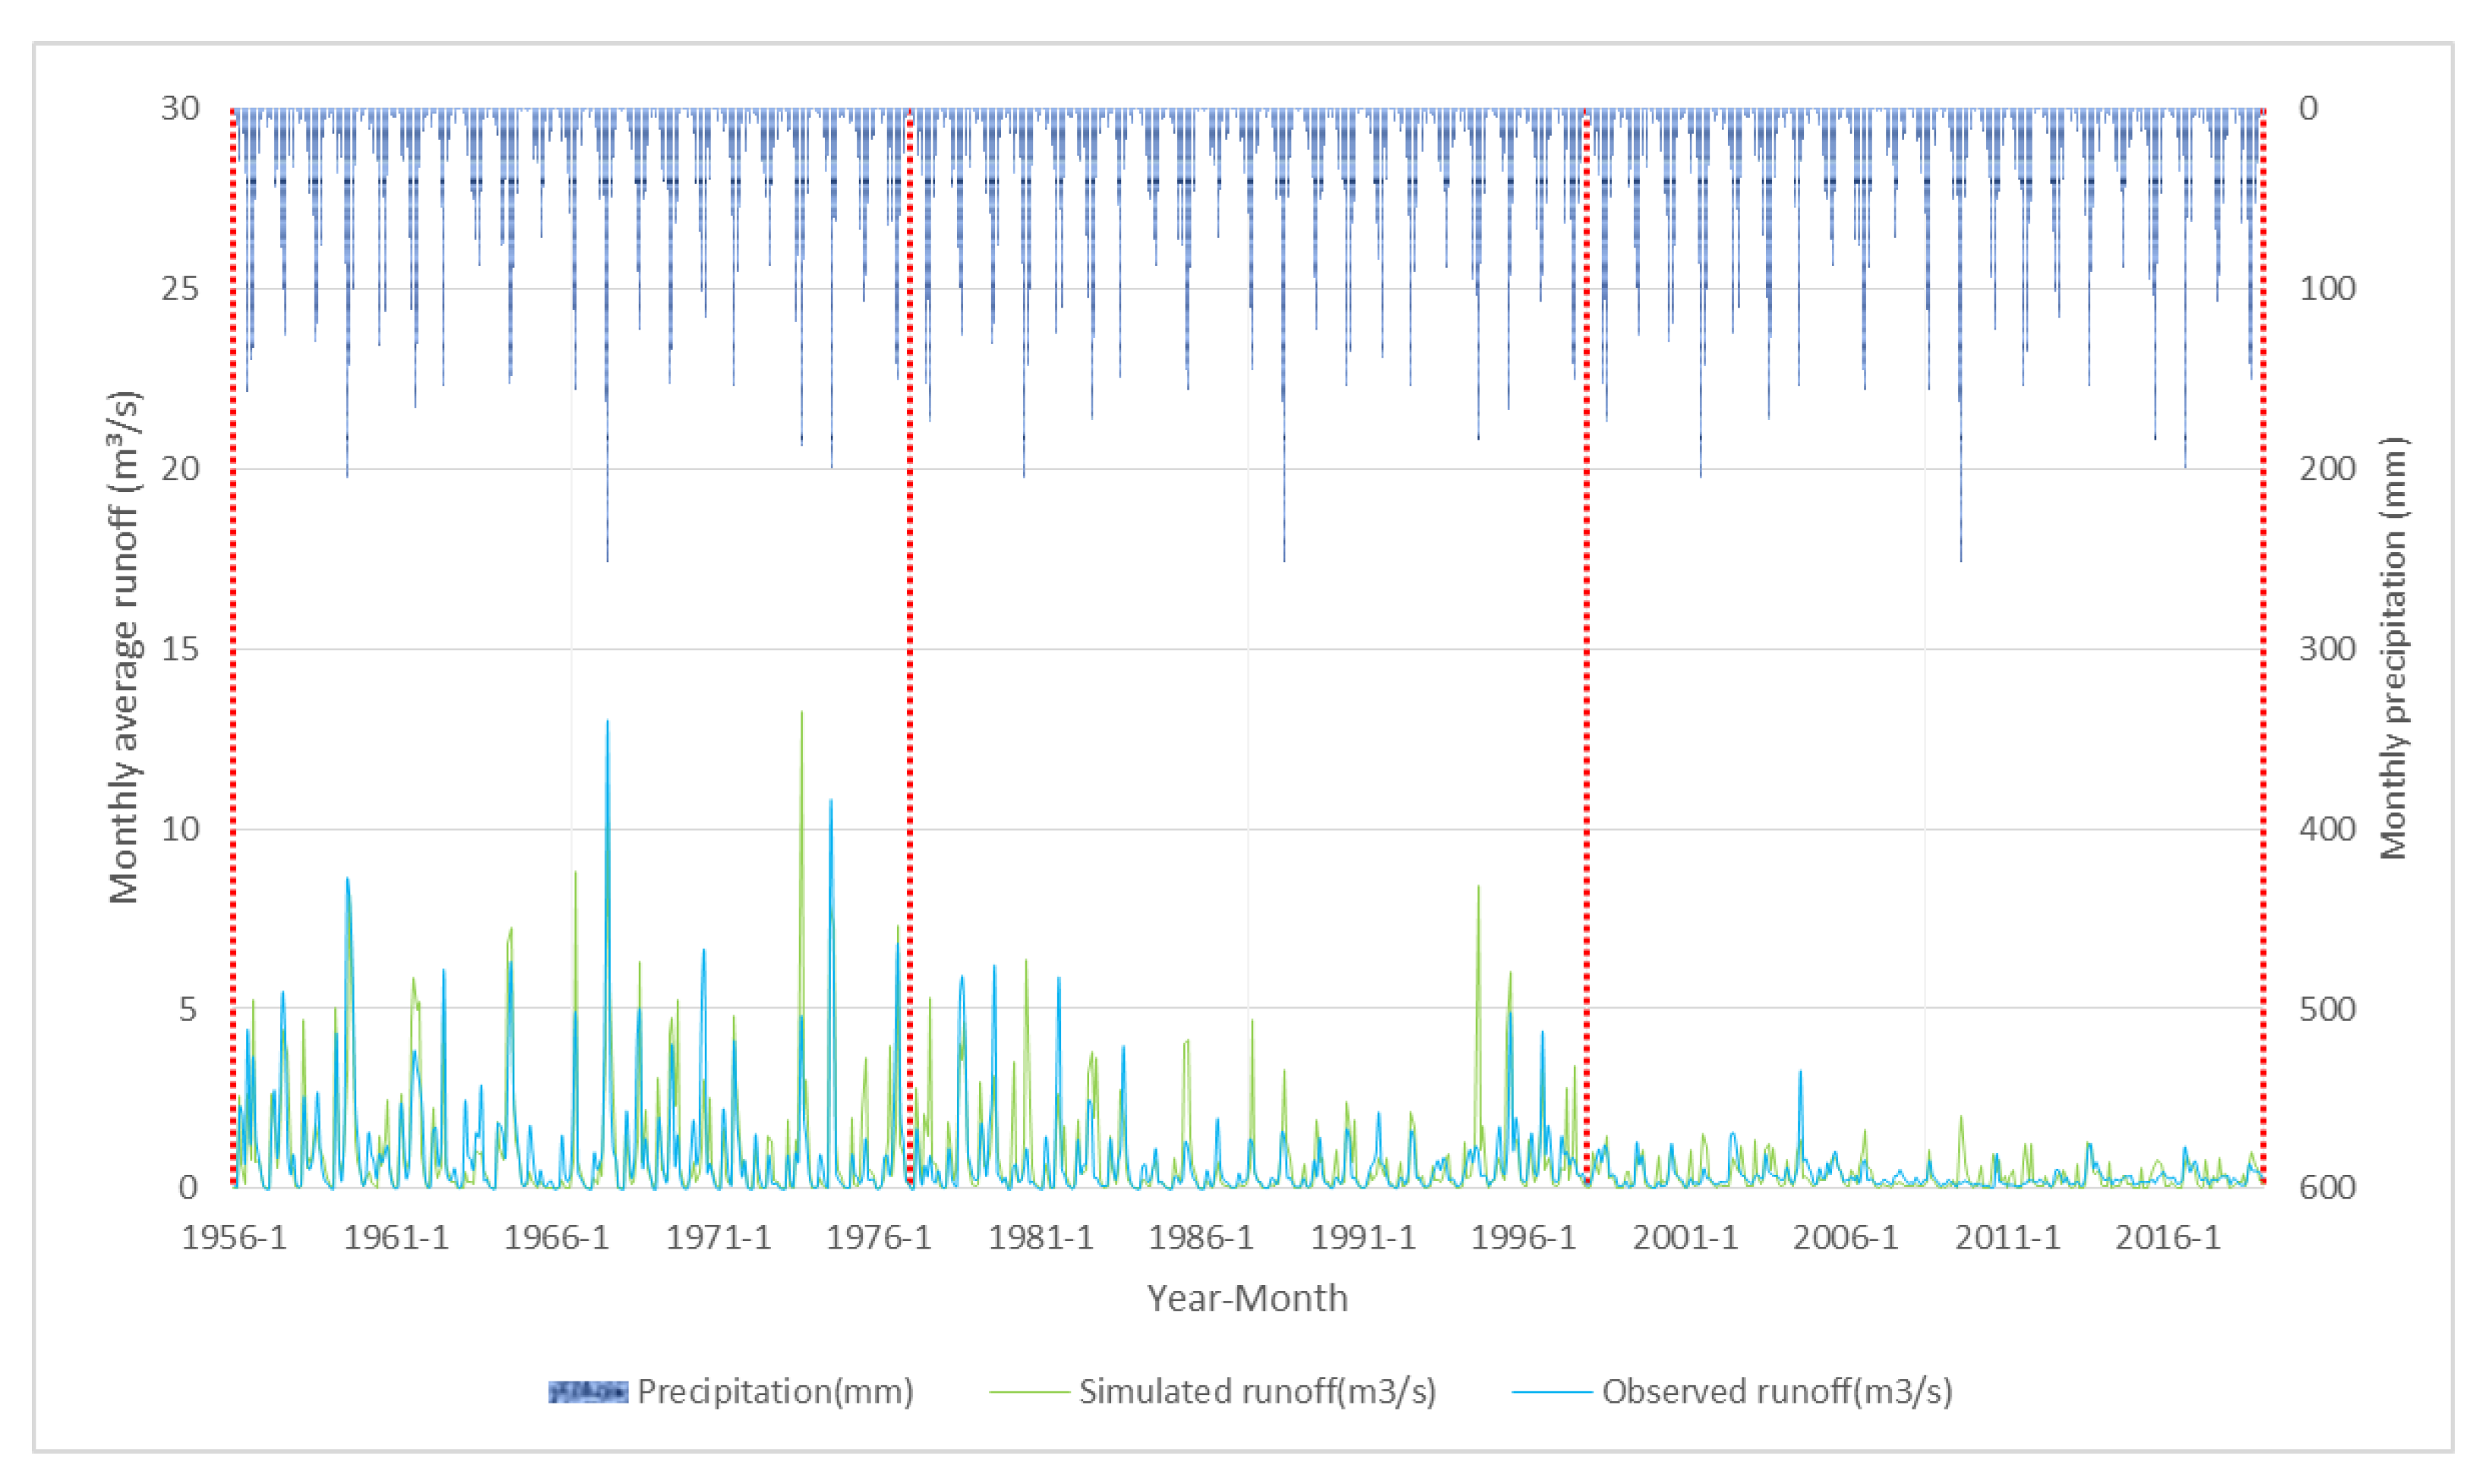
The simulation results of S3 are shown in Table 7 and Figure 14 and Figure 15. After readjusting the parameters in the calibration period, we found that the simulation accuracy in the validation periods has improved a lot, indicating that the coal mining module improvement achieved ideal effects.
In validation period 1, the simulation accuracy and relative error of the CCS were still better than those of the NCCS. Thus, climate change certainly contributed to the runoff attenuation in validation period 1. In validation period 2, RE and NSE were greatly improved, showing that coal mining is a major factor for runoff attenuation during this period.
The estimated coefficient values are shown in Table 8. The range of refers to the existing data and technological level in the Guanyintang River basin. As we can see, the annual damage of coal mining to water resources is about 1.5–2.25 times its annual output. The vertical and lateral hydraulic conductivities increased to 1.1–6.2 times their original values, showing the huge impact of coal mining on catchment hydrological processes and stream ecosystems.
4. Discussion
The Yongding River basin is an area strongly affected by human activities, and the impact in the Guanyintang basin is more apparent. According to the yearbook, as early as the 1950s and 1960s, several temporary earth dams were built upstream of the Guanyintang station for flood control and drought resistance. At the same time, coal mine drainage was discharged into the river. In 1976, the Shilihe reservoir, with a storage capacity of 10.6 million m3, was built in the basin. Moreover, there is a Shilihe irrigation area (area >6.67 km2) downstream of the Guanyintang station. After 1981, the water intake of the irrigation area was moved upstream of the Guanyintang station. Later, several large coal mines were built in the basin, which had a great impact on the runoff of the Guanyintang station.
According to the subsoil and land cover data in Figure 2 and Figure 3, agricultural activities and coal mining are the main human activities in Guanyintang River basin, and the overall contributions of the discussed factors on runoff attenuation shown in Table 9 further proved that. The table shows that in validation period 1, the main influencing factors were coal mining and climate change. In validation period 2, coal mining became a dominant factor, and land use change made certain contributions. Therefore, human activities, especially coal mining, are the dominant factors for the runoff attenuation in the Guanyintang River basin, with contribution rates of approximately 70% in validation period 1 and 95% in validation period 2.
Our results provide insights into the ecological protection and governance of the Guanyintang River basin. In the next step, we should control the increase of water intake, operate the reservoir reasonably, and improve the utilization efficiency of water resources. In addition, coal mining technologies should be improved to reduce the damage to aquifers, and the fracture zones in the goaf should be repaired.
5. Conclusions
This paper analyzed the change trends of climate and runoff in the Guanyintang basin from 1956 to 2018 using the M–K test. According to the subsoil and land cover data, the potential factors were selected and the contributions of climate change and human activities to the runoff changes were determined based on the coal-mine-improved WEP-L model.The main conclusions are as follows:
- Based on the analysis of the change trend and mutation point of climate and runoff from 1956 to 2018, the precipitation of the Guanyintang River basin showed a slight downward trend with a sudden change occurred in 1958, the temperature increased significantly by about 0.03 °C per year, and the runoff decreased significantly by about 0.4 million m3 per year. According to Table 9, the attenuation of precipitation is one of the reasons for the runoff attenuation in the Guanyintang River basin but the major factor was human activity rather than climate change.
- In terms of simulation effectiveness, the model had a great performance at calibration, and the RE in the verification period increased. After the coal mining module was added, the simulation effectiveness was significantly improved. Generally, WEP-L has good applicability in the Guanyintang River basin.
- In validation period 1 (1977–1997), coal mining and climate change were the main reasons for the runoff attenuation in the Guanyintang River basin, and their contribution rates were about 59%. Agricultural, industrial, and domestic water intakes were the secondary factors, with contribution rates of about 33%. In validation period 2 (1998–2018), coal mining became the main reason for the runoff attenuation in the Guanyintang station, with a contribution rate of about 74%. Land use change was the secondary factor, with a contribution rate of about 13%. The contribution of climate change became negligible in this period.
- Coal mining has become a growing problem in the Guanyintang River basin, which significantly impacted the catchment hydrological processes and stream ecosystems. With the expansion of the goaves, it may even influence the surrounding river basins. Thus, enough attention should be paid against this, and relevant protection policies must be introduced.
- Due to the uncertainty in the dimension of coal mines and its ongoing development, calibration remains really challenging, and more thoughtful consideration should be taken regarding geological characteristics and groundwater movement processes; this also gives us enlightenment to improve in future research.
Author Contributions
Conceptualization, Y.J.; methodology, T.P.; software, J.L.; validation, T.P.; formal analysis, Y.J.; investigation, C.N.; resources, C.N.; data curation, J.D.; writing—original draft preparation, T.P.; writing—review and editing, Y.J.; visualization, J.L.; supervision, Y.J.; project administration, Y.J.; funding acquisition, Y.J. All authors have read and agreed to the published version of the manuscript.
Funding
This work was supported by the National Natural Science Foundation of China (51779272), the independent research project of the “State Key Laboratory of Simulation and Regulation of Water Cycle in River Basin” (SKL2020ZY04), and the special support funds for national high-level talents (WR0166A012019).
Institutional Review Board Statement
Not applicable.
Informed Consent Statement
Not applicable.
Data Availability Statement
Restrictions apply to the availability of these data. Data was obtained from [China Meteorological Administration] and are available from http://data.cma.cn/ (accessed on 5 July 2020) with the permission of [China Meteorological Administration].
Conflicts of Interest
The authors declare no conflict of interest.
References
- Zhang, J.Y.; Wang, G.Q. Climate change and sustainable utilization of water resources in China. Hydro-Sci. Eng. 2009, 4, 17–21. [Google Scholar]
- Zhang, S.; Yang, D.; Yang, H.; Lei, H. Analysis of the dominant causes for runoff reduction in five major basins over China during 1960–2010. Adv. Water Sci. 2015, 5, 4–12. [Google Scholar]
- Lin, L.; Wang, Z. Changes in hourly precipitation may explain the sharp reduction of discharge in the middle reach of the Yellow River after 2000. Front. Environ. Sci. Eng. 2013, 7, 756–768. [Google Scholar]
- Ren, L.L.; Wang, M.R.; Li, C.H.; Zhang, W. Impacts of human activity on river runoff in the northern area of China. J. Hydrol. 2002, 261, 204–217. [Google Scholar] [CrossRef]
- Sun, X.; Peng, Y.; Zhou, H. Impacts of land cover change and hydraulic project on runoff based on SWAT distributed watershed hydrological model. J. Water Resour. Water Eng. 2016, 27, 33–39. [Google Scholar]
- Bennett, J.; Zhang, L.; Jia, Y.; Zhou, Z.; Zhang, Z. Environmental Protection in China: Land-Use Management, 1st ed.; Edward Elgar Publishing: Northampton, MA, USA, 2008; pp. 142–156. [Google Scholar]
- Junyu, Q.; Cai, Q.; Cai, L.; Sun, L. Scale Effect of Runoff and Sediment Reduction Effects of Soil and Water Conservation Measures in Chabagou, Dalihe and Wudinghe Basins. Prog. Geogr. 2011, 30, 95–102. [Google Scholar]
- Jiang, K.; Li, Z.; Luo, C.; Wu, M.; Chao, L. The reduction effects of riparian reforestation on runoff and nutrient export based on annagnps model in a small typical watershed, china. Environ. Sci. Pollut. Res. 2019, 26, 5934–5943. [Google Scholar] [CrossRef]
- Bellot, J.; Bonet, A.; Sanchez, J.; Chirino, E. Likely effects of land use changes on the runoff and aquifer recharge in a semiarid landscape using a hydrological model. Landsc. Urban Plan. 2001, 55, 41–53. [Google Scholar] [CrossRef]
- Wang, D.; Hejazi, M. Quantifying the relative contribution of the climate and direct human impacts on mean annual streamflow in the contiguous united states. Water Resour. Res. 2011, 47, 411. [Google Scholar] [CrossRef] [Green Version]
- Zuo, D.; Xu, Z.; Zhao, J.; Abbaspour, K.; Yang, H. Response of runoff to climate change in the wei river basin, china. Int. Assoc. Sci. Hydrol. Bull. 2015, 60, 508–522. [Google Scholar] [CrossRef] [Green Version]
- Hu, J.; Ma, J.; Nie, C.; Xue, L.; Wang, Z. Attribution analysis of runoff change in min-tuo river basin based on swat model simulations, China. Sci. Rep. 2020, 10, 2900. [Google Scholar] [CrossRef] [Green Version]
- Yuan, Y.; Zhang, Z.; Meng, J. Impact of changes in land use and climate on the runoff in Liuxihe Watershed based on SWAT model. J. Appl. Ecol. 2015, 26, 989–998. [Google Scholar]
- Wang, G.; Zhang, J.; He, R.H.; Jiang, N.; Jing, X. Runoff reduction due to environmental changes in the sanchuanhe river basin. Int. J. Sediment Res. 2008, 23, 174–180. [Google Scholar] [CrossRef]
- Chiew, F.; Teng, J.; Vaze, J.; Post, D.; Perraud, J.; Kirono, D. Estimating climate change impact on runoff across southeast Australia:Method, results, and implications of the modeling method. Water Resour. Res. 2009, 45, 82–90. [Google Scholar] [CrossRef]
- Jia, Y.; Gao, H.; Niu, C.; Qiu, Y. Impact of climate change on runoff process in headwater area of the Yellow River. J. Hydraul. Eng. 2008, 39, 52–58. [Google Scholar]
- Kinouchi, T.; Musiake, K. Simulating hydrological impact of environmental change in the Abukuma watershed, Japan. In Proceedings of the 4th Conference of Asia Pacific Association of Hydrology and Water Resources, Beijing, China, 3 November 2008. [Google Scholar]
- Zhang, Q.; Bao, W.; Yang, X.; Chen, W. Land Use Change in Response to Runoff Based on Combination Statistics with Xinanjiang Model. Water Resour. Power 2015, 33, 12–15. [Google Scholar]
- Li, E.; Mu, X.; Zhao, G. Temporal changes in annual runoff and influential factors in the upper and middle reaches of Yellow River from 1919–2010. Adv. Water Sci. 2014, 25, 155–163. [Google Scholar]
- Sun, F.; Yang, D.; Liu, Z.; Cong, Z. Study on coupled water-energy balance in yellow river basin based on budyko hypothesis. Adv. Water Sci. 2007, 38, 409–416. [Google Scholar]
- Zhang, L.; Yu, S.; Duan, Y. Quantitative assessment of the effects of climate change and human activities on runoff in the Yongding River Basin. Progress. Inquisitiones Mutat. Clim. 2013, 9, 391–397. [Google Scholar]
- Ding, A.; Zhao, Y.; Hao, D. Analysis of variation characteristics of runoff and their influencing factors in the Yongding River Basin. South-to-North Water Transf. Water Sci. Technol. 2013, 11, 17–22. [Google Scholar]
- Sun, W.; Song, X.; Zhang, Y.; Chiew, F.; Post, D.; Zheng, H. Coal mining impacts on baseflow detected using paired catchments. Water Resour. Res. 2020, 56, e2019WR025770. [Google Scholar] [CrossRef]
- Song, X.; Sun, W.; Zhang, Y.; Song, S.; Gao, Y. Using hydrological modelling and data-driven approaches to quantify mining activities impacts on centennial streamflow. J. Hydrol. 2020, 585, 124764. [Google Scholar] [CrossRef]
- Zhang, C. Ecological restoration strategy for the damage and effects of coal mining on environment in shanxi province. Res. Soil Water Conserv. 2008, 15, 139–142. [Google Scholar]
- Zhang, Y.; Zhang, Y.; Tang, L.; Zhao, X.; Zhu, X.P. Influence of coal mine goaf on rainfall runoff formation in cetian reservoir basin. Water Resour. Power 2019, 37, 4. [Google Scholar] [CrossRef] [Green Version]
- Wei, D. Research on the influence of coal mine goaf on rainfall and runoff. Shanxi Hydrotech. 2018, 4, 59–62. [Google Scholar]
- China Meteorlogical Administration. Grades of Meteorological Drought; GB/T 20481-2017; Standards Press of China: Beijing, China, 1996. [Google Scholar]
- Jia, Y. Development of WEP model and its application to an urban watershed. Hydrol. Prochydrological Process. 2001, 15, 2175–2194. [Google Scholar] [CrossRef]
- Jia, Y.; Ni, G.; Yoshitani, J.; Kawahara, Y.; Kinouchi, T. Coupling Simulation of Water and Energy Budgets and Analysis of Urban Development Impact. J. Hydrol. Eng. 2002, 7, 302–311. [Google Scholar] [CrossRef]
- Kim, H.; Noh, S.; Jang, C.; Kim, D.; Hong, I. Monitoring and analysis of hydrological cycle of the Cheonggyecheon watershed in Seoul, Korea. In Proceedings of the International Symposium on the Urban Water Cycle in the Cheonggyecheon Watershed, Seoul, Korea, 24 March 2004. [Google Scholar]
- Jia, Y.; Ni, G.; Yoshitani, J.; Kawahara, Y.; Kinouchi, T. Distributed model of hydrological cycle system in Heihe River basin II.Applications. J. Hydrol. Eng. 2006, 37, 655–661. [Google Scholar]
- Xu, F.; Jia, Y.; Niu, C.; Leszek, S.; Zhao, L. Evaluating spatial differences in the contributions of climate variability and human activity to runoff change in the Haihe River basin. Hydrol. Sci. J. 2021, 66, 2060–2073. [Google Scholar] [CrossRef]
- Jia, Y.; Wang, H.; Zhou, Z.; Qiu, Y.; Luo, X.; Wang, J. Development of the WEP-L distributed hydrological model and dynamic assessment of water resources in the Yellow River basin. J. Hydrol. 2006, 331, 606–629. [Google Scholar] [CrossRef]
- Ding, X.; Jia, Y.; Wang, H.; Qiu, Y. Prediction of Water Resources in the Hai River Basin under Changing Environment. In Proceedings of the International Symposium of Iahs-Pub-China: Predictions in Ungauged Basins: Theory & Practice, Beijing, China, 1 January 2010. [Google Scholar]
Figure 1.
Geographical location of the Guanyintang station and the distribution of meteorological and hydrological stations.
Figure 1.
Geographical location of the Guanyintang station and the distribution of meteorological and hydrological stations.

Figure 2.
Schematic geological section of the subsoil in Guanyintang River basin.

Figure 3.
Land cover map of the Guanyintang River basin.

Figure 4.
Vertical structure of the WEP-L model.

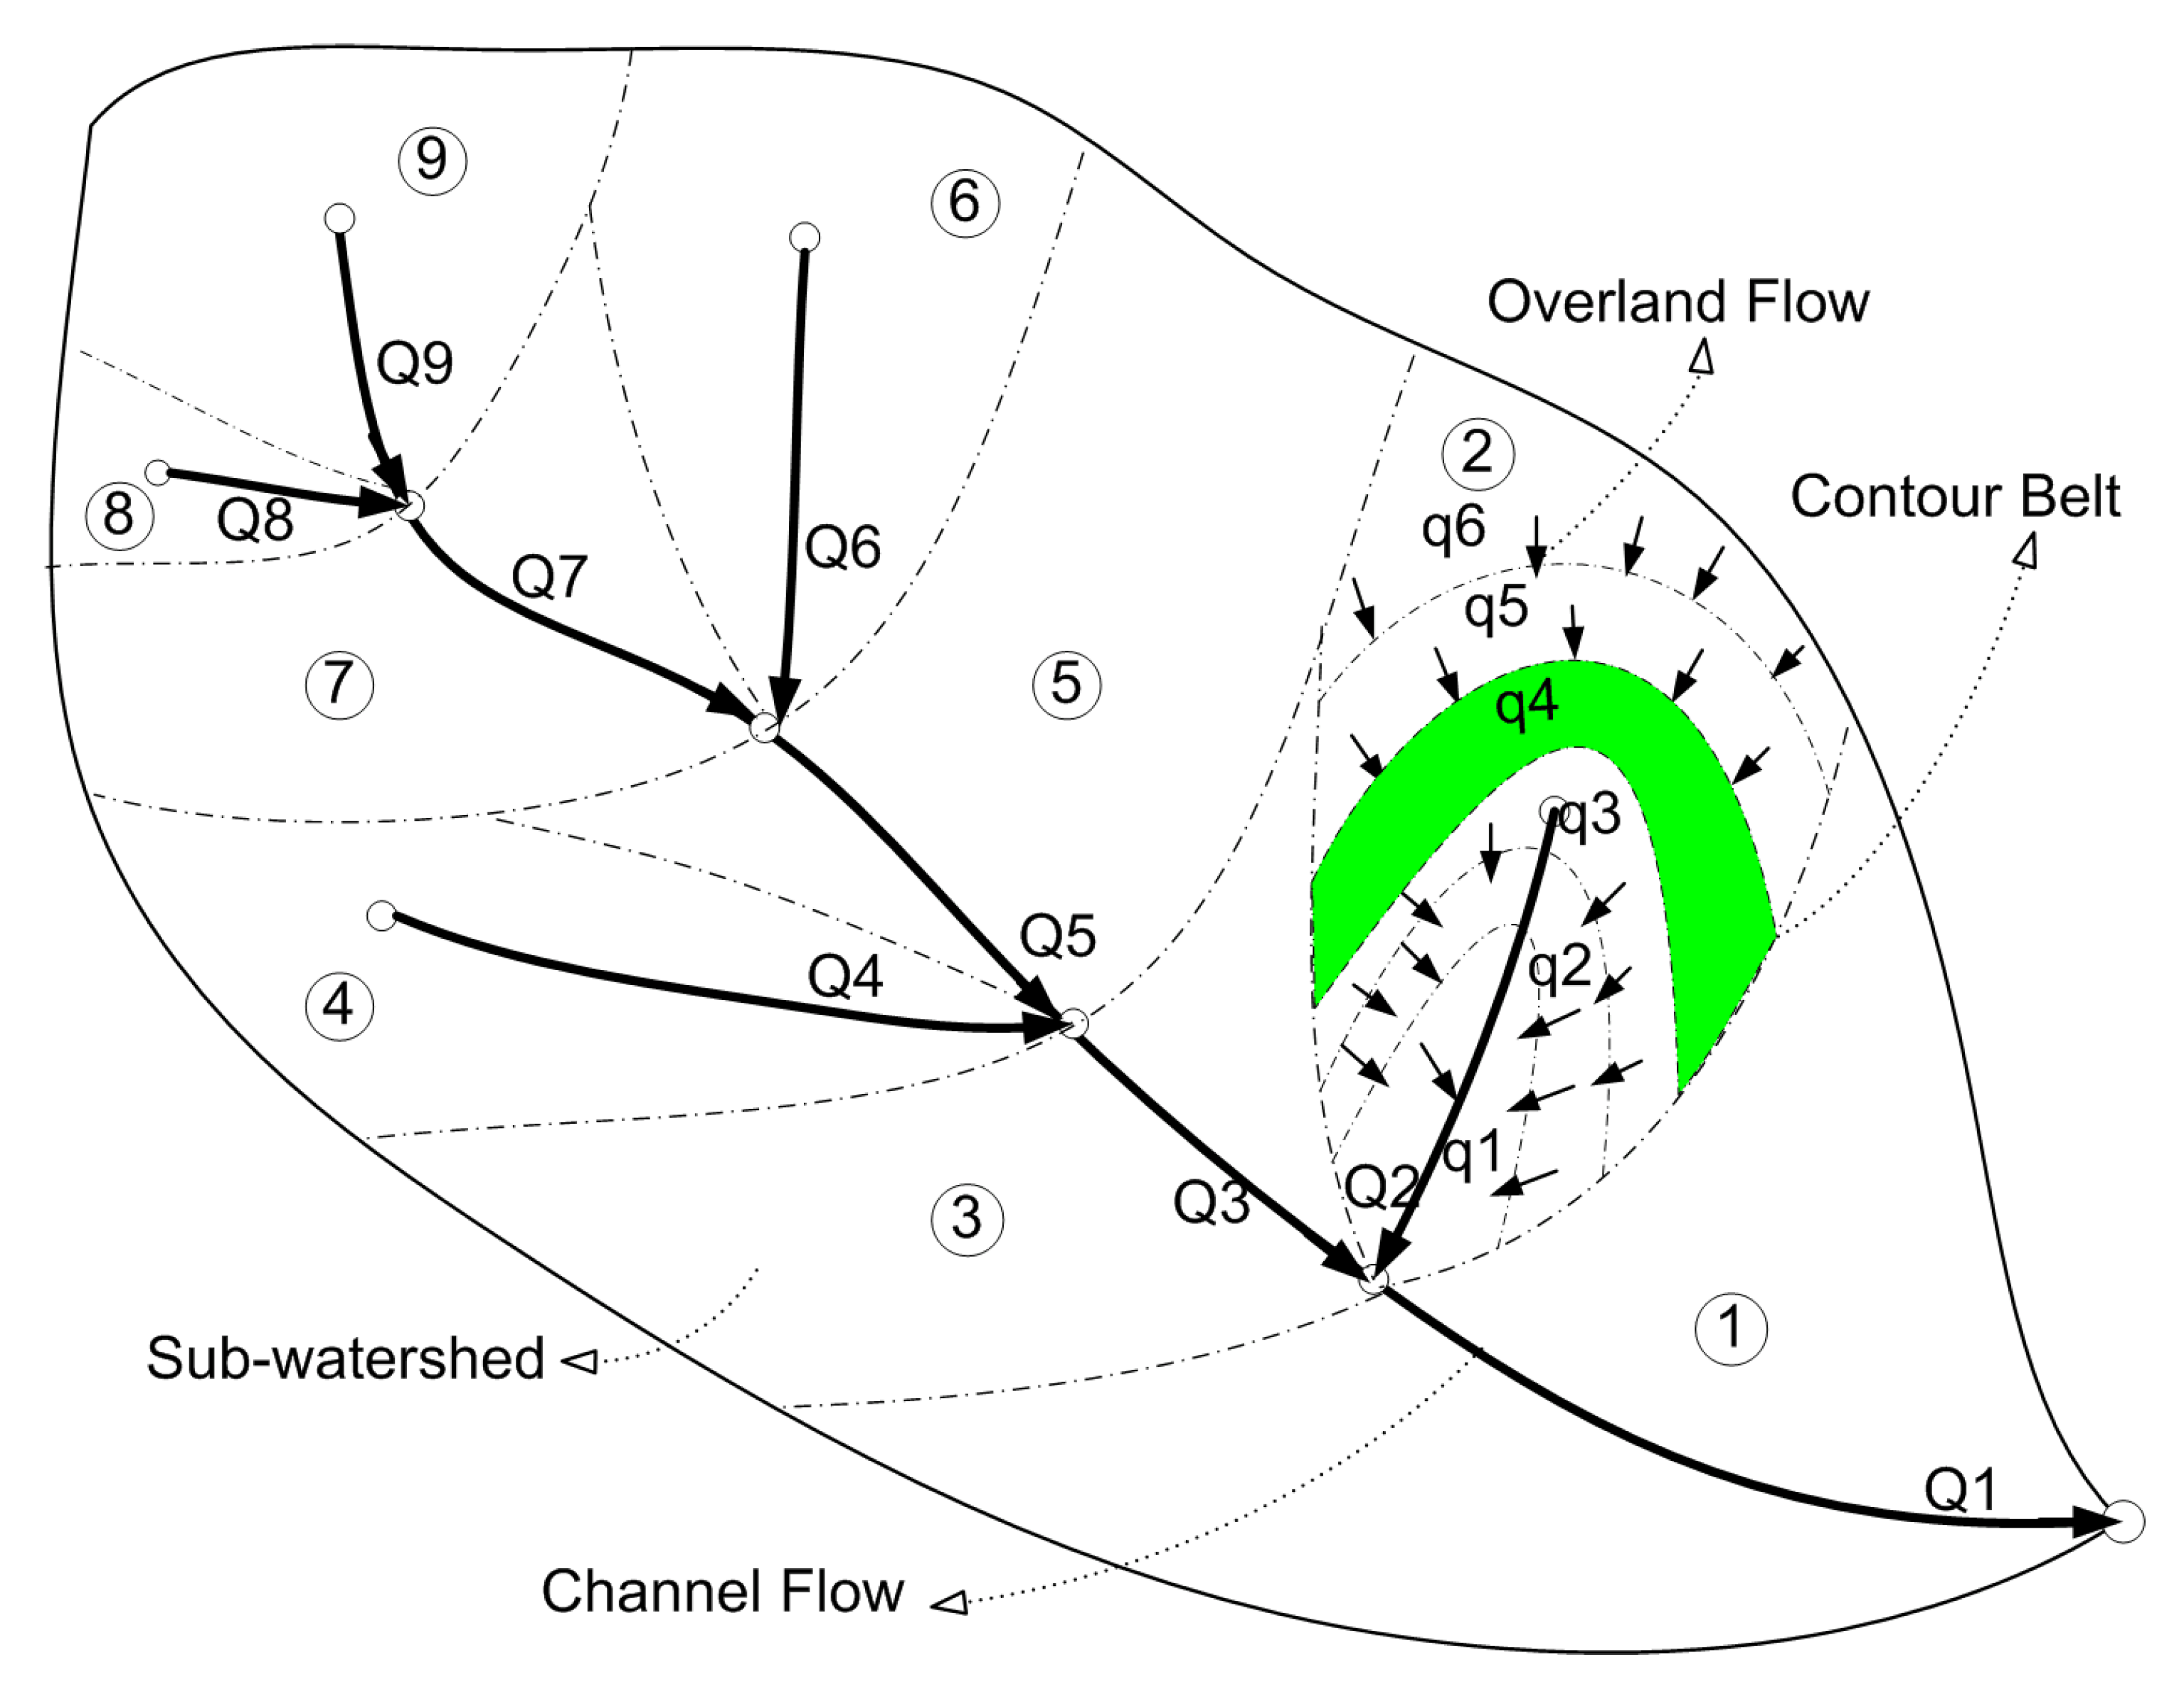
Figure 5.
Horizontal structure of the WEP-L model.

Figure 6.
Geographical locations of the coal mines in the Guanyintang River basin and the scope of areas affected by coal mining.
Figure 6.
Geographical locations of the coal mines in the Guanyintang River basin and the scope of areas affected by coal mining.

Figure 7.
Vertical structure of the WEP-L model after improvement.

Figure 8.
Variation process of the statistic S in the Guanyintang station. (a) Precipitation; (b) temperature; (c) runoff; (d) evapotranspiration.
Figure 8.
Variation process of the statistic S in the Guanyintang station. (a) Precipitation; (b) temperature; (c) runoff; (d) evapotranspiration.

Figure 9.
Wavelet variance of the Guanyintang station. (a) Precipitation; (b) temperature; (c) runoff; (d) evapotranspiration.
Figure 9.
Wavelet variance of the Guanyintang station. (a) Precipitation; (b) temperature; (c) runoff; (d) evapotranspiration.

Figure 10.
Simulated results of S1 (CCS).

Figure 11.
Simulated results of S1 (NCCS).

Figure 12.
Simulated results of S2 (CCS).

Figure 13.
Simulated results of S2 (NCCS).

Figure 14.
Simulated results of S3 (CCS).

Figure 15.
Simulated results of S3 (NCCS).


Table 1.
Data inputs in model simulation.
| Data Type | Period | Aggregation |
|---|---|---|
| Meteorological | 1956–2018 | Daily |
| Runoff | 1956–2018 | Monthly |
| DEM | 2015 | 1 km × 1 km Raster |
| Land use | 1980/1990/1995/2000/2005/2010/2015 | Vector product |
| Water use | 1956–2018 | Monthly |
| Coal mines | 1956–2018 | Yearly |
Table 2.
Scenario settings and considered factors.
| Scenarios | CC | CM | AWI | IWI | LUC | |
|---|---|---|---|---|---|---|
| S1 | s11 (CCS) | √ | × | × | × | √ |
| s12 (NCCS) | × | × | × | × | √ | |
| S2 | s21 (CCS) | √ | × | √ | √ | √ |
| s22 (NCCS) | × | × | √ | √ | √ | |
| S3 | s21 (CCS) | √ | √ | √ | √ | √ |
| s22 (NCCS) | × | √ | √ | √ | √ | |
CCS: climate change scenarios; NCCS: non-climate scenarios;CC: climate change; CM: coal mining; AWI: agricultural water intake; IWI: industrial & domestic water intake; LUC: land use change.
Table 3.
Results of the Mann–Kendall test in the Guanyintang station between 1956 and 2018.
| Type of Statistics | Trend | Mutation Year | Confidence Level |
|---|---|---|---|
| Precipitation (mm/a) | −0.634 | 1958 | 82.3% |
| Temperature (°C/a) | +0.030 | 1991 | 100% * |
| (mm/a) | +0.071 | 2014 | 60.8% |
| Runoff ( /a) | −0.004 | 1998 | 100% * |
* The trend has reached a confidence level of 95%.
Table 4.
Results of the wavelet analysis in the Guanyintang station.
| Type of Statistics | Trend | Main Period | Variance |
|---|---|---|---|
| Precipitation (mm/a) | 1958 | 3 | 0.4 |
| Temperature (°C/a) | 1999 | none | none |
| (mm/a) | 2001 | none | none |
| Runoff ( m3) | 1998 | none | none |
Table 5.
Simulated results of S1.
| Scenarios | Calibration Period (1956–1976) | Validation Period 1 (1977–1997) | Validation Period 2 (1998–2018) | ||||||||||||
|---|---|---|---|---|---|---|---|---|---|---|---|---|---|---|---|
| AP | AS | AO | RE | NSE | AP | AS | AO | RE | NSE | AP | AS | AO | RE | NSE | |
| S11 (CCS) | 40.0 | 1.39 | 1.36 | +1.94% | 0.58 | 37.1 | 1.13 | 1.00 | +12.8% | −0.30 | 36.6 | 1.18 | 0.56 | +112.9% | −17.23 |
| S12 (NCCS) | 40.0 | 1.41 | 1.36 | +3.36% | 0.58 | 40.0 | 1.36 | 1.00 | +35.4% | −1.07 | 40.0 | 1.29 | 0.56 | +132.1% | −14.49 |
RE: relative error; AP: average precipitation (mm); AS: average simulated flow (m3/s); AO: average observed flow (m3/ s); NSE: Nash–Sutcliffe efficiency coefficient.
Table 6.
Simulated results of S2.
| Scenarios | Calibration Period (1956–1976) | Validation Period 1 (1977–1997) | Validation Period 2 (1998–2018) | ||||||||||||
|---|---|---|---|---|---|---|---|---|---|---|---|---|---|---|---|
| AP | AS | AO | RE | NSE | AP | AS | AO | RE | NSE | AP | AS | AO | RE | NSE | |
| S21 (CCS) | 40.0 | 1.26 | 1.25 | +0.55% | 0.50 | 37.1 | 0.71 | 0.67 | +6.1% | −0.36 | 36.6 | 0.62 | 0.35 | +77.3% | −19.96 |
| S22 (NCCS) | 40.0 | 1.26 | 1.25 | +0.55% | 0.50 | 40.0 | 0.86 | 0.67 | +28.4% | −0.76 | 40.0 | 0.60 | 0.35 | +73.7% | −13.41 |
RE: relative error; AP: average precipitation (mm); AS: average simulated flow (m3/s); AO: average observed flow (m3/s); NSE: Nash–Sutcliffe efficiency coefficient.
Table 7.
Simulated results of S3.
| Scenarios | Calibration Period (1956–1976) | Validation Period 1 (1977–1997) | Validation Period 2 (1998–2018) | ||||||||||||
|---|---|---|---|---|---|---|---|---|---|---|---|---|---|---|---|
| AP | AS | AO | RE | NSE | AP | AS | AO | RE | NSE | AP | AS | AO | RE | NSE | |
| S31 (CCS) | 40.0 | 1.26 | 1.25 | +0.42% | 0.61 | 37.1 | 0.64 | 0.67 | −3.4% | 0.46 | 36.6 | 0.35 | 0.35 | +1.4% | 0.49 |
| S32 (NCCS) | 40.0 | 1.26 | 1.25 | +0.42% | 0.61 | 40.0 | 0.81 | 0.67 | +22.1% | −0.10 | 40.0 | 0.36 | 0.35 | +4.0% | −0.07 |
Table 8.
Estimated values of the coefficients in the coal mining module.
| Coefficient | |||||
|---|---|---|---|---|---|
| Range | 0–0.29 | 1.5–2.25 | 0.3–0.5 | 10 | 10 |
Correction coefficients are dimensionless.
Table 9.
Contribution rate calculations for various factors based on S3.
| Periods | CC | CM | AWI | IWI | LUC | Sum | RC | RE |
|---|---|---|---|---|---|---|---|---|
| Validation period 1 | −0.17 (27.9%) | −0.19 (31.1%) | −0.12 (19.7%) | −0.08 (13.1%) | −0.05 (8.2%) | −0.61 | −0.58 | 5.2% |
| Validation period 2 | −0.01 (1.1%) | −0.70 (73.7%) | −0.07 (7.4%) | −0.05 (5.3%) | −0.12 (12.6%) | −0.95 | −0.90 | 5.6% |
CC: climate change; CM: coal mining; AWI: agricultural water intake; IWI: industrial and domestic water intake; LUC: land use change; RC: runoff change; RE: relative error; unit of values: m3/s.
Publisher’s Note: MDPI stays neutral with regard to jurisdictional claims in published maps and institutional affiliations. |
© 2022 by the authors. Licensee MDPI, Basel, Switzerland. This article is an open access article distributed under the terms and conditions of the Creative Commons Attribution (CC BY) license (https://creativecommons.org/licenses/by/4.0/).
Share and Cite
MDPI and ACS Style
Peng, T.; Jia, Y.; Niu, C.; Liu, J.; Du, J. Attribution of Runoff Decrease at the Guanyintang Station in the Yongding River Considering the Impact of Coal Mining. Water 2022, 14, 842. https://doi.org/10.3390/w14060842
AMA Style
Peng T, Jia Y, Niu C, Liu J, Du J. Attribution of Runoff Decrease at the Guanyintang Station in the Yongding River Considering the Impact of Coal Mining. Water. 2022; 14(6):842. https://doi.org/10.3390/w14060842
Chicago/Turabian StylePeng, Tao, Yangwen Jia, Cunwen Niu, Jiajia Liu, and Junkai Du. 2022. "Attribution of Runoff Decrease at the Guanyintang Station in the Yongding River Considering the Impact of Coal Mining" Water 14, no. 6: 842. https://doi.org/10.3390/w14060842
Note that from the first issue of 2016, this journal uses article numbers instead of page numbers. See further details here.