
Effects of Sea Level Rise on Land Use and Ecosystem Services in the Liaohe Delta
by
 ,
,
Liehui Zhi
1,2 ,
,
Muxinzhou Gou
3,
Xiaowen Li
1,*,
Junhong Bai
1,
Baoshan Cui
1,
Qingyue Zhang
2,
Gaojing Wang
2,
Hazrat Bilal
1 and
Usman Abdullahi
1 1
School of Environment, Beijing Normal University, Beijing 100875, China
2
School of Earth Science and Engineering, Hebei University of Engineering, Handan 056038, China
3
CCTEG Chongqing Design and Research Institute (Group) Co., Ltd., Yuzhong District, Chongqing 400010, China
*
Author to whom correspondence should be addressed.
Water 2022, 14(6), 841; https://doi.org/10.3390/w14060841
Submission received: 31 January 2022
/
Revised: 4 March 2022
/
Accepted: 4 March 2022
/
Published: 8 March 2022
(This article belongs to the Special Issue Climate Model Projections: Sea-Level Rise and Impacts on Coastal Defense Decision-Making)
Abstract
:Sea level rise (SLR) has a significant impact on the ecosystem services in coastal wetlands. Taking the Liaohe Delta as an example, the SLAMM (Sea Level Rise Affecting Marsh Model) was used to simulate the medium-term (2010–2050) and the long-term (2010–2100) of the spatiotemporal changes of land use in the four scenarios (0.5, 1, 1.5, and 2 m) of sea level rise by 2100 and then based on the InVEST (Integrated Valuation of Ecosystem Services and Tradeoffs Model) to assess and compare the impact of SLR on ecosystem services. The results are as follows. (1) The difference in SLR height greatly influences the transformation of the coastal wetland pattern. In 2100, the core construction land would be affected on a large scale for landward salt marsh migration for 1.5 and 2 m SLR scenarios. (2) Due to inundation, erosion, and vegetation succession, the mean total carbon storage for the four scenarios will decrease by about 0.58 × 10⁶ t. The habitat quality is relatively stable, and its value is about 0.7. The nitrogen and phosphorus loads will be reduced by 26.27% and 28.22%, respectively. The region spatial distribution of freshwater marshes will shrink, while the transformation of salt marshes is inconsistent. The large-scale formation of regularly flooded marshes can also provide high levels of ecosystem services as salt marshes. In conclusion, the coastal wetlands show two evolution patterns under the four sea level rise scenarios, the two low ones show a slow change, and the two high ones are large. Quantitative assessment of the effects, scope and intensity of the impact of SLR on the function of ecosystem services in the coastal wetlands can provide reference and indicative significance for wetland development, construction, ecological conservation, and restoration in similar coastal areas under the impact of climate change.
1. Introduction
Since the 1990s, the rapid development of the social economy and population growth in China’s coastal area have intensified the contradiction between supply and demand of land use. Large-scale reclamation projects have encroached on large areas of coastal wetlands, resulting in damage to biodiversity and ecosystem services in coastal areas. The resource base of regional ecological security and sustainable development is seriously threatened [1,2,3]. Meanwhile, global climate change has attracted widespread attention since the 1970s, and sea level rise (SLR) is an essential feature of global climate change [4]. According to previous projections, global sea levels are expected to rise by about 0.5 to 1 m by 2100. However, according to the IPCC in 2021, that assumption is underestimated. In the worst-case scenario, it will rise by at least 2 m by 2100 [5].
Studies and observations have shown that SLR affects the vegetation distribution pattern of coastal wetlands. The “coastal squeeze effect” caused by human activities and SLR on coastal wetlands has resulted in the loss of habitat conditions for salt marsh vegetation to adapt to SLR for landward migration, which in turn has led to the degradation and collapse of key ecosystem services in coastal wetlands [6,7,8,9]. Therefore, the quantitative assessment of the scope and intensity of the impact of SLR on wetland habitats and ecosystem services should be emphasized, which will provide reference and indication for wetland development and construction and dynamic adjustment of ecological protection and restoration under the influence of climate change.
Current studies have focused on the direct effects of SLR on land use patterns and have also assessed such effects from the perspective of ecosystem service values [10,11], while further quantitative and spatial pattern analysis of regional multi-ecosystem services is less studied [12,13,14].
The SLAMM (Sea Level Rise Affecting Marsh Model) has been used to simulate the feedback processes (http://warrenpinnacle.com/prof/SLAMM (accessed on 20 February 2022)) and spatial pattern effects of coastal wetlands under SLR scenarios [11,15,16,17]. InVEST (Integrated Valuation of Ecosystem Services and Tradeoffs Model) was used to assess ecosystem services. InVEST can analyze multiple scales and multiple scenarios (https://naturalcapitalproject.stanford.edu/software/invest (accessed on 20 February 2022)) and support ecosystem planning and management. Based on the commonalities of the spatial representation of the two models, our study explored a complete method flow that combines them to characterize the impacts of climate change on coastal wetlands from a macrospatial perspective.
The Liaohe Delta is located in the important core area of the national strategy “Liaoning Coastal Economic Belt”, an important rice agricultural economic zone and oil production area in China [18]. Due to the interaction of river and ocean, i.e., fresh and salty water, the ecological environment of coastal wetlands in the Liaohe delta is fragile. With urbanization and the continuous high intensity of coastal reclamation activities, the coastal wetland ecosystem services in the Liaohe Delta have been degraded under the influence of urbanization, agriculture, oilfield development, road, dam, and construction of other infrastructure. The SLR in Bohai Bay has brought significant ecological and environmental impacts to the Liaohe Delta. The natural and man-made two-way coastal squeeze effect has become very significant. It may continue to intensify in the future, which makes the sustainable development of the region face increasingly serious ecological and socio-economic risks, and there is an urgent needs to develop effective ecological regulation and measures [19,20]. Current studies on the impact of SLR in the Liaohe Delta have mainly focused on the impact of historical SLR on coastal wetlands in recent decades [21,22], but studies to assess the impact of future SLR on the region are also necessary. Therefore, we took coastal wetlands in the Liaohe Delta as the study area and evaluated ecosystem services that exert ecological benefits under four alternative future SLR scenarios (0.5, 1, 1.5 and 2 m by 2100). The technology of forecasting long-term changes in nature could be suitable for other coastal regions. The study results may provide scientific basis for coastal zone management strategies in response to climate change in the region.
2. Materials and Methods
2.1. Study Area
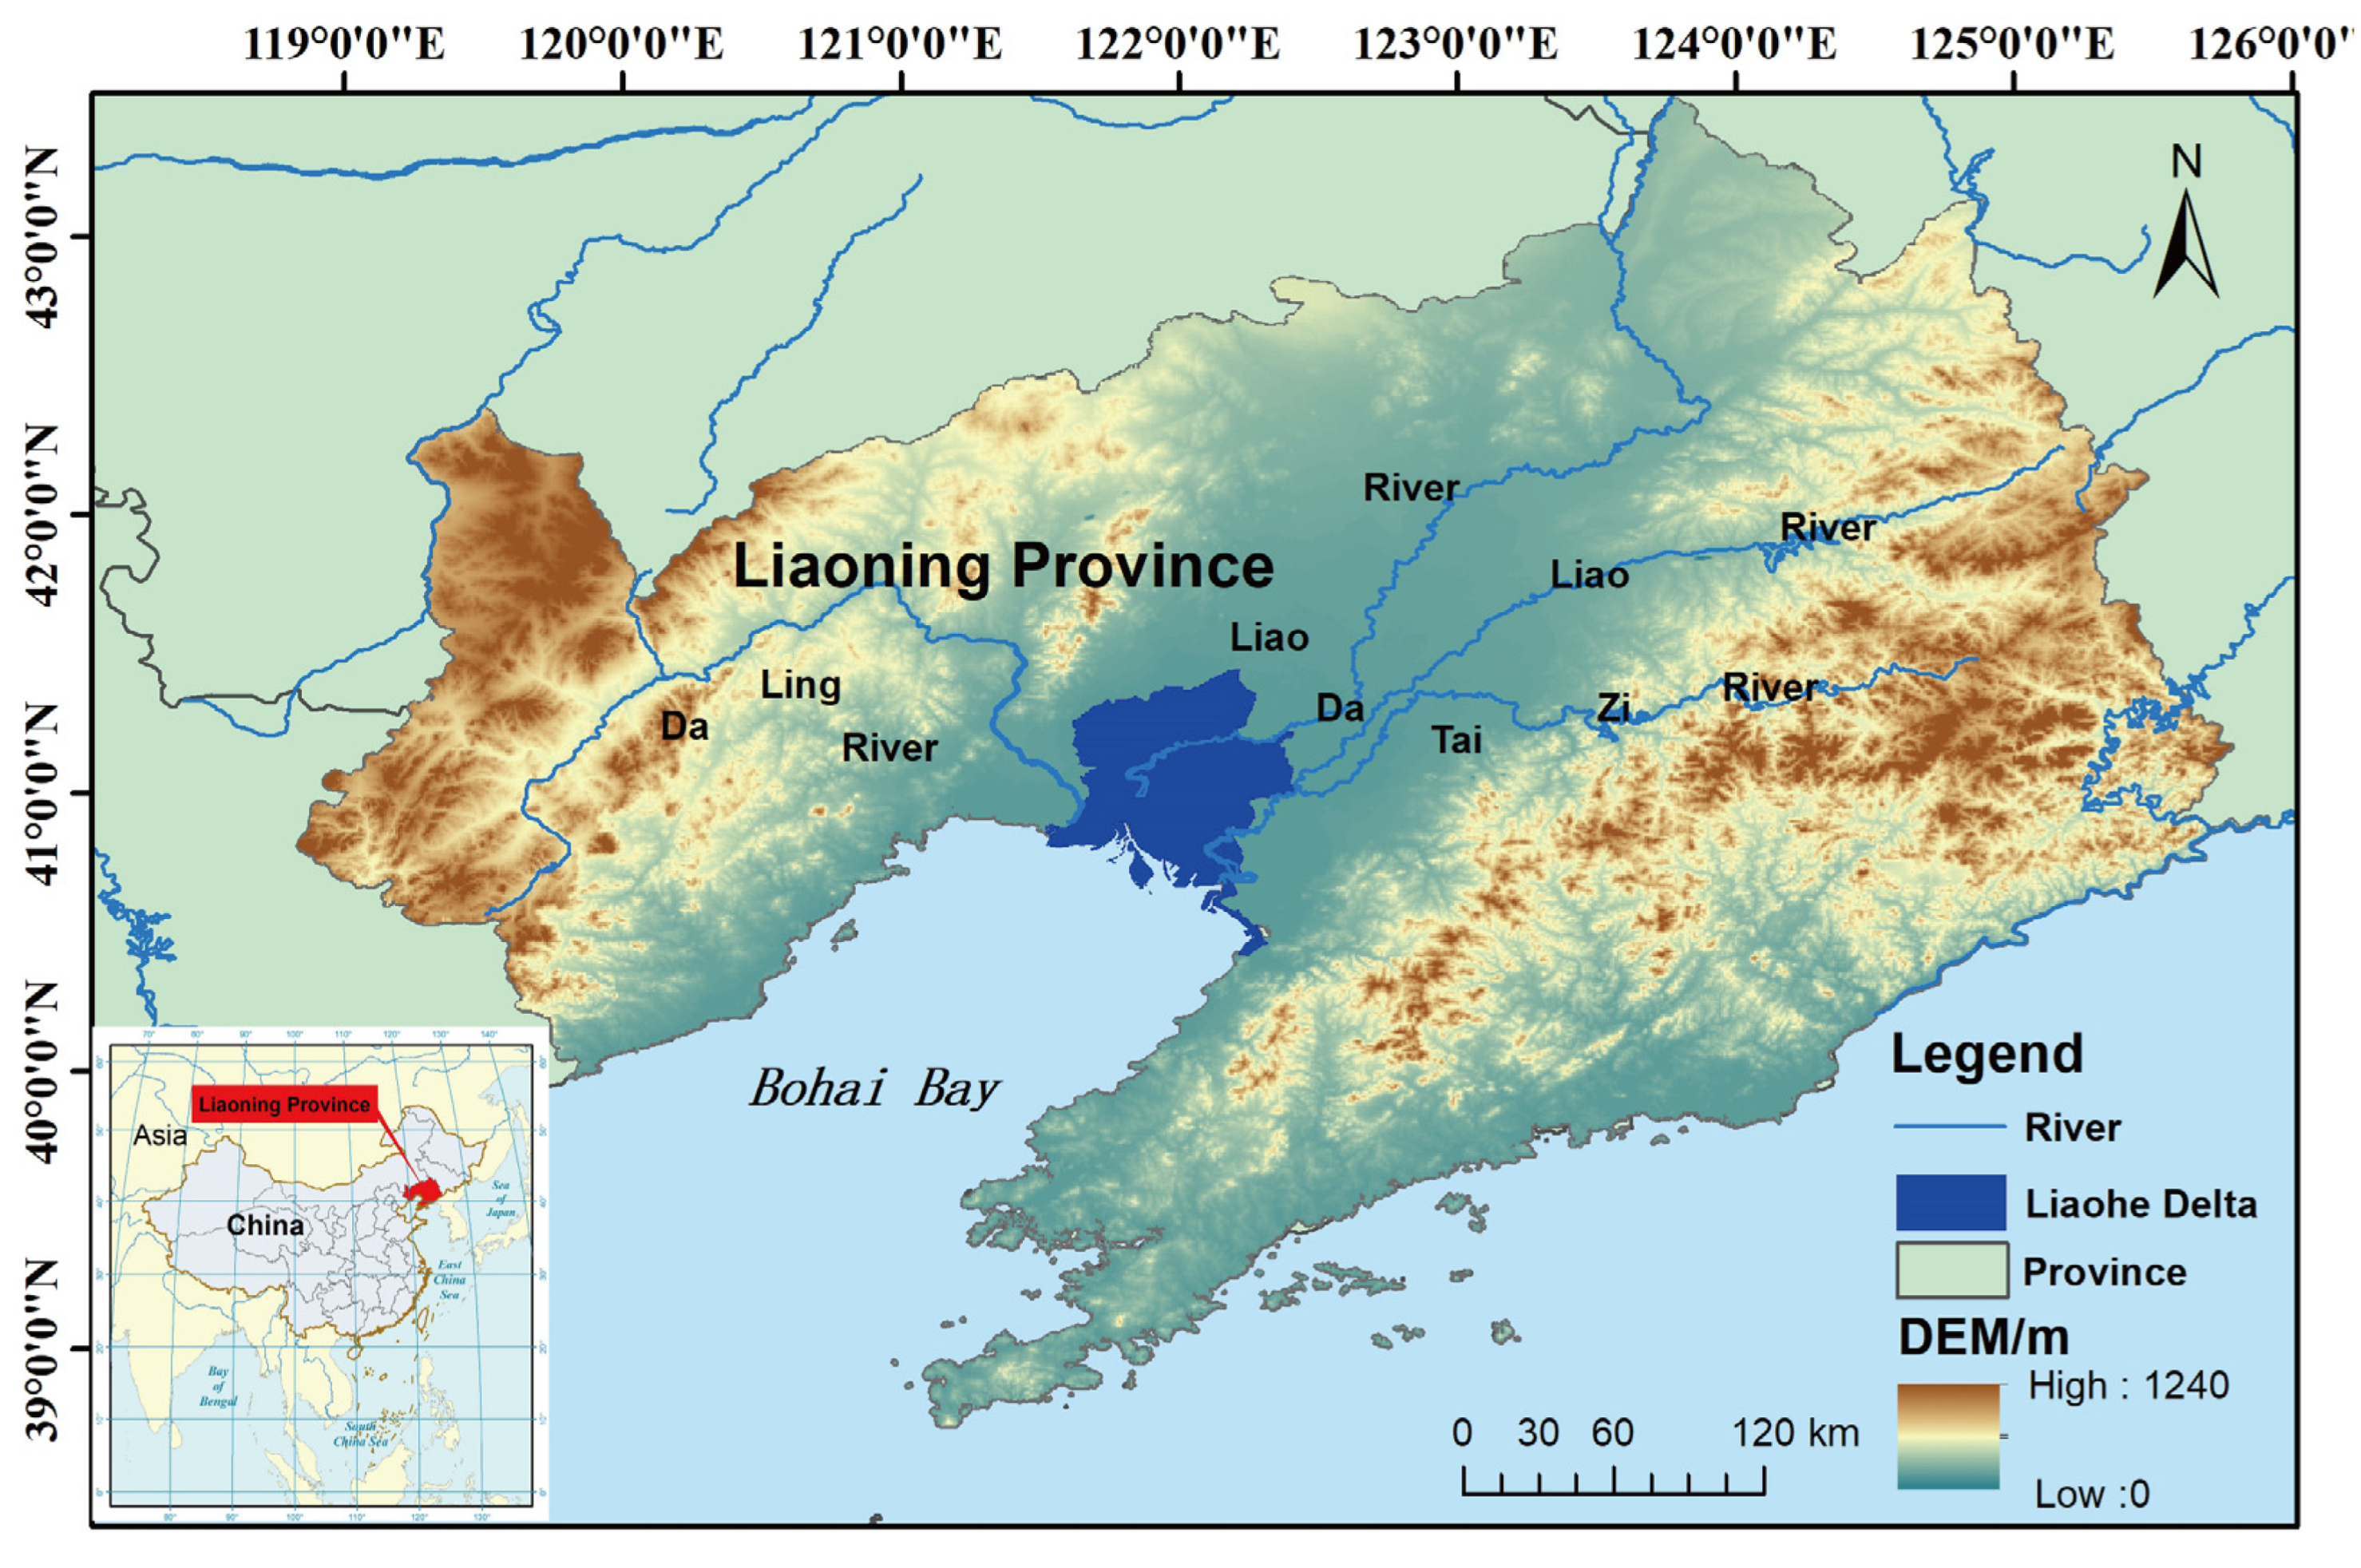
The Liaohe Delta is located in the southwest of Liaoning Province, where the Liaohe River, the Daliao River, and the Daling River enter the sea (Figure 1), which is an alluvial plain, a bay delta [9,23]. The Liaohe Delta has a large area of well-preserved reed marshes and intertidal salt marshes dominated by Suaeda salsa and is a coastal blue carbon ecosystem that plays an important role in carbon storage. Meanwhile, the coastal area of the Liaohe Delta is a key node in the migration of East Asian birds and essential breeding and resting habitat for a large number of migratory waterfowl. A total of 45 species of birds are included in the “China-Japan Migratory Bird Protection Agreement”, 46 species are included in the “China-Australia Migratory Bird Protection Agreement”, and 5 species (e.g., red-crowned cranes and white cranes) and 29 species (e.g., black-billed gulls and gray cranes) are included, respectively, in the national primary and secondary protected lists [24,25]. Due to its globally significant coastal wetland resources and biodiversity conservation value, the Liaohe Delta coastal wetland was approved to establish the Shuangtai River Estuary National Nature Reserve in 1986. It was included in the internationally important wetland protection system Ramsar Wetland in 2005 [26]. As a comprehensive area of agriculture, aquaculture, and petrochemical industry, the Liaohe Delta is rich and diverse in fishery resources. Common domestic fish, shellfish, shrimp, and crabs are naturally distributed or cultivated. Agriculture is dominated by rice cultivation and has the third largest oil field in China—i.e., the Liaohe Oilfield. The use of feed, fertilizer, and oil and gas extraction may increase the pollution load of water bodies while improving economic activities. Therefore, this study focused on three ecosystem services that exert ecological benefits, namely carbon storage, habitat quality, and water purification in estuarine deltas.
2.2. Study Methods
2.2.1. Simulate Terrestrial Changes Caused by Sea Level Rise
In this study, SLAMM was used to study land use change in the Liaohe Delta under the SLR scenario. The model integrates relevant research data providing an effective means and accurately fruitful results to simulate the impact of SLR on coastal wetlands and has been widely used by government and international non-governmental organizations to assess and analyze SLR impacts [27,28]. The model was mainly based on five processes: inundation, erosion, alluvium, saturation, and accretion. Elevation determines the scope of the upper and lower tidal flats and predicts the emergence of salt marshes or other types of coastal wetlands depending on the inundation frequencies and hydrological regimes. The conversions of wetland types under SLR scenarios occur when the SLR exceeds coastal accretion rates or sedimentation and the lowest altitude is below the suitable inhabited altitudes for a certain type of coastal wetland [28]. Those categories of coastal wetlands close to the seawater will be subjected to erosion, where the maximum water withdrawal is greater than 9 km (http://warrenpinnacle.com/prof/SLAMM (accessed on 20 February 2022)).
The land use transformation in the Liaohe Delta was simulated in the medium term (2050) and long term (2100) relative to 2010 under the current trend of SLR. Estimates of SLR by 2100 varied between experts; e.g., 50–140 cm [29], 75–190 cm [30], and 2 m is at the upper end of plausible scenarios due to physical limitations on glaciological conditions [31]. Therefore, we set four scenarios (0.5, 1.0, 1.5 and 2.0 m) for SLR based on the A1B scenario (a balance across all sources where balanced is defined as not relying too heavily on one particular energy source, on the assumption that similar improvement rates apply to all energy supply and end-use technologies) in IPCC. The relative rate of SLR is the same between the A1B scenario and the 1, 1.5, and 2 m scenarios, but the extent of SLR by the year 2100 is allowed to vary.
The land use change in coastal wetlands under the SLR scenario could be simulated based on model parameters and spatial data (land use and elevation). Land use data were obtained from Northeast Institute of Geography and Agroecology, Chinese Academy of Sciences, which were reclassified into 7 classes to accommodate SLAMM (Table 1). The elevation data required for the model we used were CoastalDEM, which is Climate Central’s proprietary, high-accuracy digital elevation model for coastal areas (https://go.climatecentral.org/coastaldem/ (accessed on 20 February 2022)). Prediction of the trend of sea level rise was from the China’s State Oceanic Administration (2018), elevation correction based on average tide level was from global tide forecast service platform (http://global-tide.nmdis.org.cn/Default.html (accessed on 20 February 2022)), the daily range data were from the “Chinese gulf” [32], and data for the storm surge, coastal erosion, deposition, and geology in Liaohe Estuary were obtained from these studies in recent years [33,34,35,36,37].
2.2.2. Assessment of Ecosystem Services
The InVEST is widely used to quantitatively assess ecosystem services such as biodiversity conservation, water harvesting, and carbon storage worldwide, followed by ecosystem provisioning and support services for present and historical periods [38,39,40]. Based on obtaining the land use of the Liaohe Delta under four SLR scenarios using SLAMM, the land use data of the former simulation results were used as the data source for the InVEST to simulate ecosystem services. It should be noted that the two land use classifications are consistent.
(1) Carbon storage
Based on ArcGIS 10.5 and the Carbon Model module of InVEST, we simulated the distribution and change of carbon storage in the Liaohe Delta under the scenario of SLR. The carbon storage of the ecosystem was divided into aboveground biological carbon storage (Cabove), underground biological carbon storage (Cbelow), dead organic carbon storage (Cdead), and soil carbon storage (Csoil). The formula for the calculation of total carbon storage (CT) of the Liaohe delta ecosystem is presented in Equation (1). Referring to relevant studies [1,41,42,43,44], carbon storage densities of different land uses corresponding to SLAMM were obtained (Table 2).
CT = Cabove + Cbelow + Cdead + Csoil
(2) Habitat quality
Habitat Quality in InVEST was used to evaluate a habitat’s ability to support biodiversity in spatial units of the Liaohe Delta. Habitat quality index ranges from 0 to 1, with higher values indicating more suitable habitats. Habitat quality of grid x of habitat land use type j was calculated based on the degree to which grid x is affected by the threat source grid y Equation (2), and the suitability degree of land use type j (Table 3).
where is the degree to which grid x is affected by the threat source grid y; i is the parameter determined by the influence range of the threat source; is the influence degree of threat source r; is the accessibility of grid x; is the sensitivity of habitat j to source factor r.
Red-Crowned Crane, Black-Billed Gull, and Oriental White Stork are the biodiversity-sensitive indicator species. Their primary habitat consists of marshes and tidal flats, and they can also be active in agriculture ponds and salt fields, while the development of the field, construction land, artificial waterways, and ports for economic activities are identified as threats to weaken their habitat quality. The data required for the Habitat Quality model include the land use obtained from SLAMM, the threat source distributions derived from un-reclassified 2010 land use data, threat source parameters, and threat sensitivity of each habitat type; see relevant studies [45]. The threat source parameter data and habitat data are shown in Table 3 and Table 4.
(3) Water quality purification
This study adopts the rainfall and runoff pollution load estimation method to evaluate the future impact of change in land use caused by SLR on water quality. The formula for estimating the nitrogen and phosphorus load of the Liaohe Delta under the simulated scenario [46] is as follows in Equation (3).
where is the annual runoff discharge load generated by land type X; CF is the factor for correction of rainfall without a runoff, which is 0.9; is the runoff coefficient of ground type X; AX is the area of earth type X; is the local annual precipitation; is the average concentration of runoff discharge of ground type X. Average nitrogen and phosphorous load result were calculated according to relevant studies [47,48] as shown in Table 5.
3. Results
3.1. Dynamic Changes in Coastal Wetlands in the YRD under Different SLR Scenarios
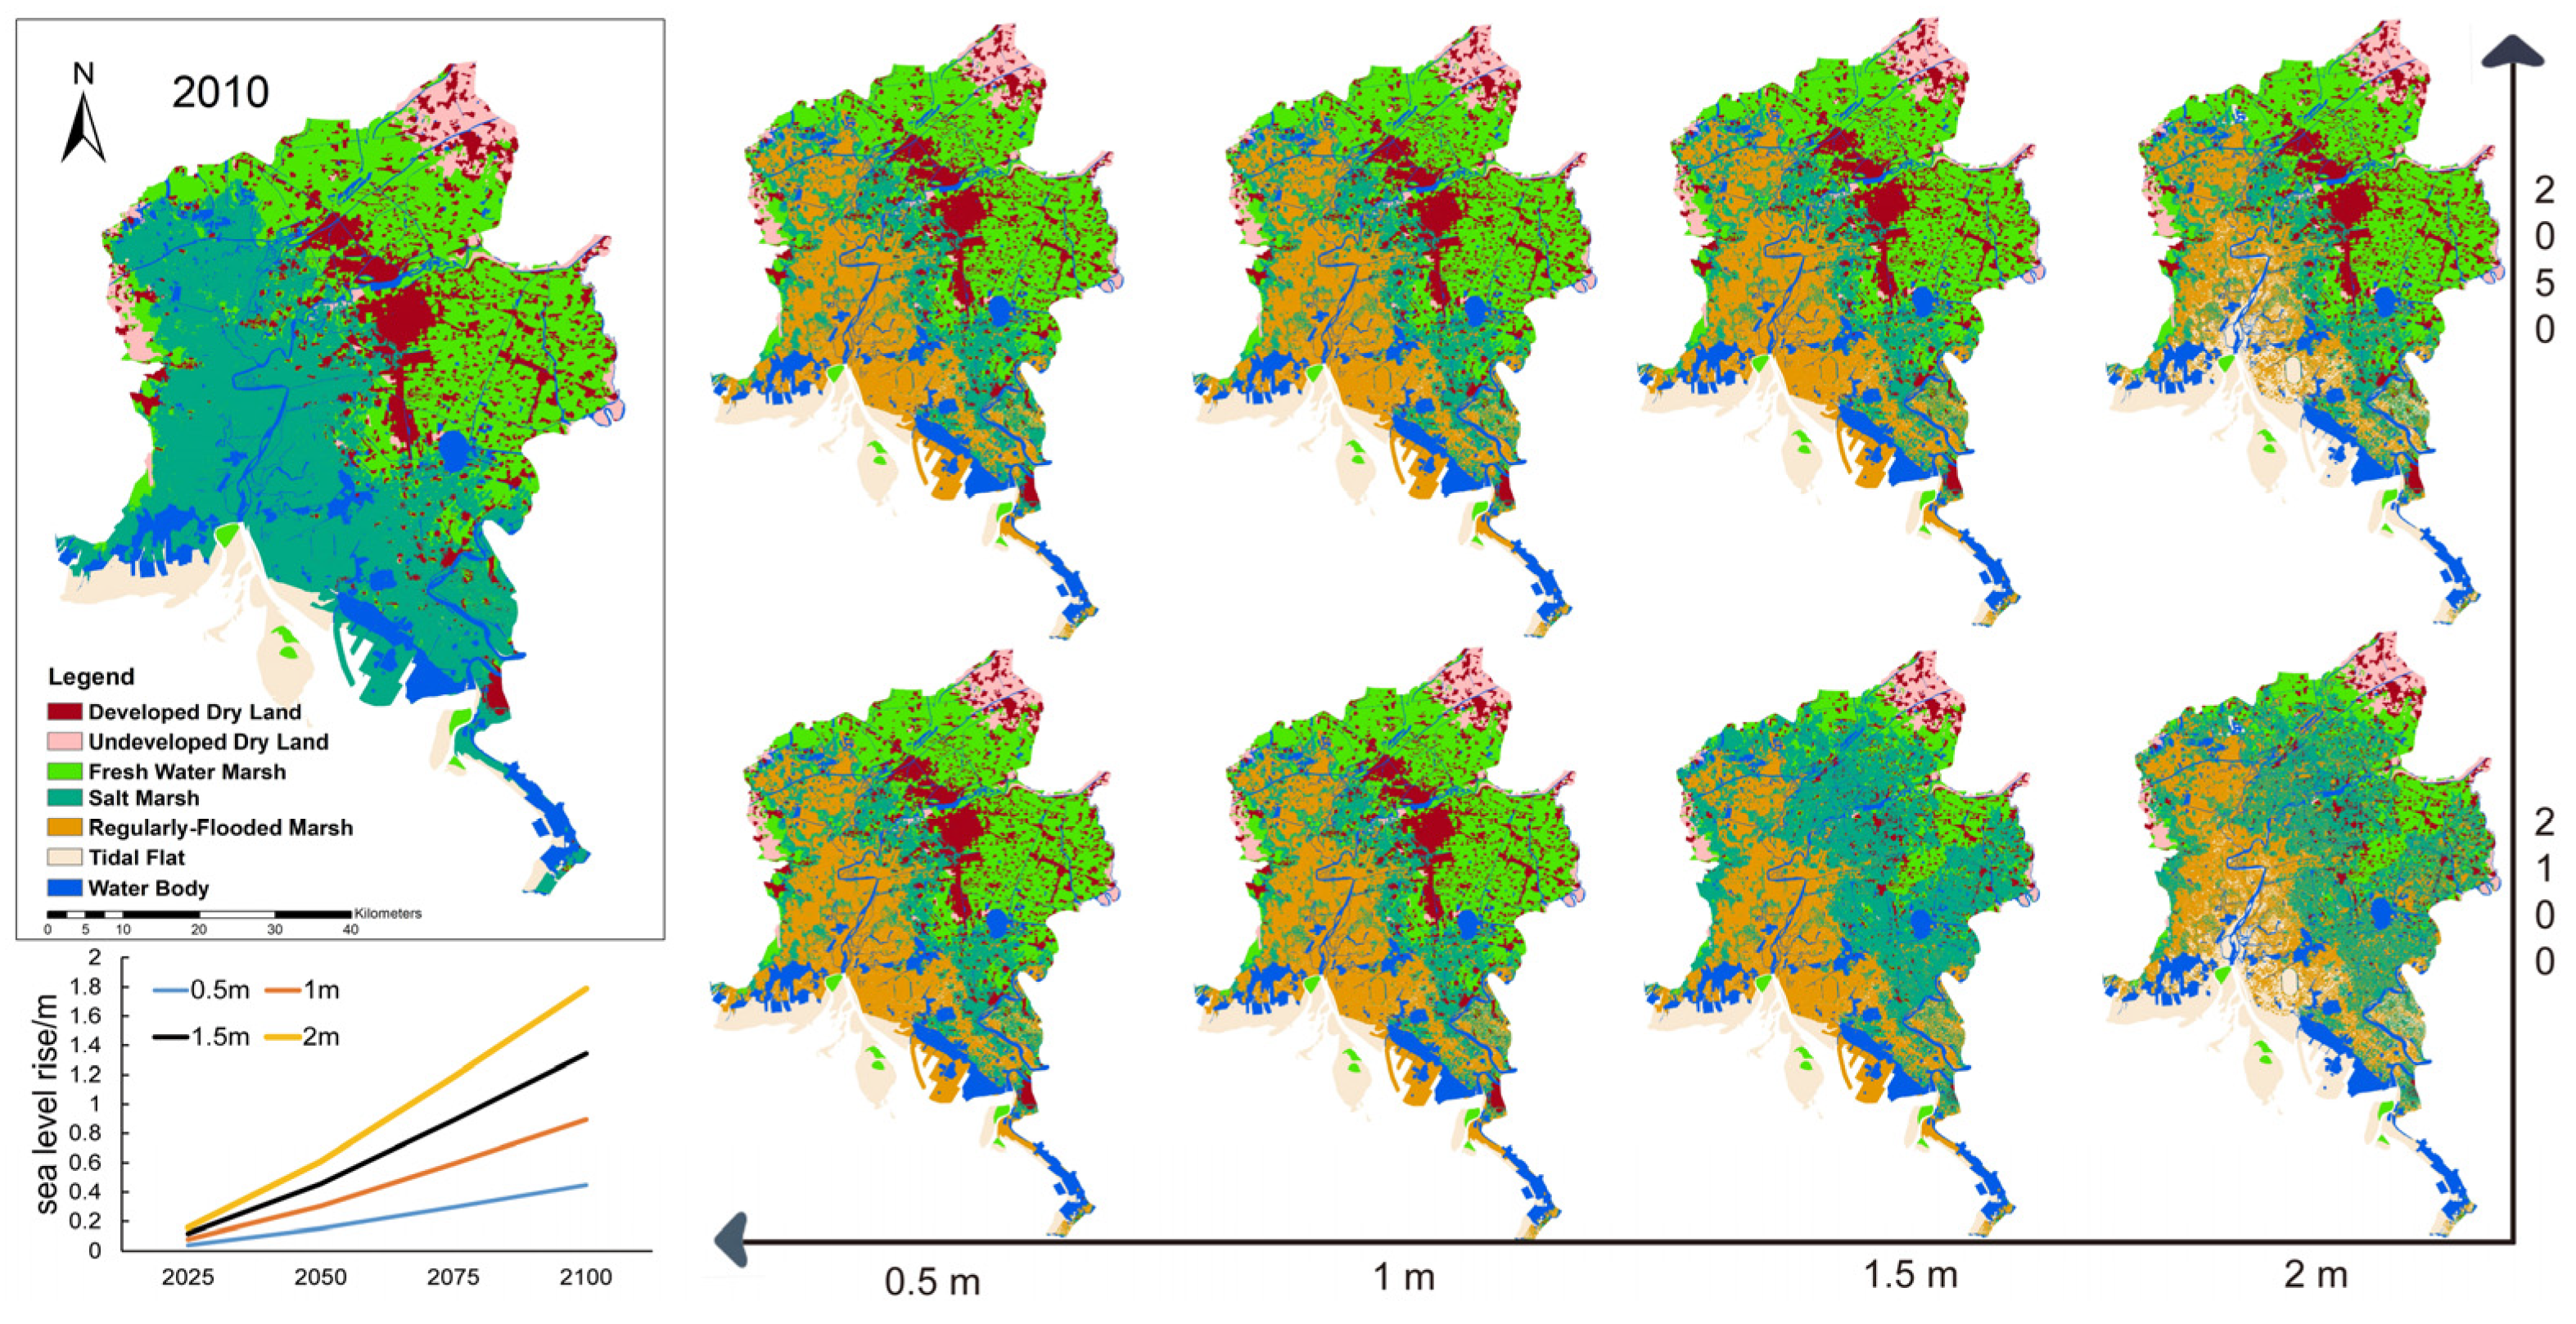
Under four different SLR scenarios, the height difference of estuarine relative SLR continued to expand, from 0.04 m by 2025 to 0.15 m by 2050, 0.30 m by 2075, and 0.45 m by 2100. For the 0.5 m, 1 m, 1.5 m, and 2 m SLR by 2100 scenarios, estuarine SLR will be 0.45 m, 0.89 m, 1.34 m, and 1.79 m, respectively. The land use changes in the Liaohe Delta from 2010 to 2100 are shown in Figure 2 and Figure 3 under different SLR scenarios. With the rise in sea level, the dry land area will generally decrease significantly under 1.5 m and 2 m scenarios. It can be seen that land use change is mainly from dry land to wetland, and the area and spatial distribution of different marsh types also change further over time. Freshwater marshes will gradually transform into regularly flooded marshes and salt marshes, and the distribution of the latter two will gradually move inland with the rise of sea level. Under the 0.5 and 1.0 m SLR scenarios, the main changes would be landward migration of salt marshes and the formation of regularly flooded marshes. Core construction land could not be significantly affected. The main difference between the two scenarios lies in the small range of changes in the land use area in the 0.5 m scenario. Under the 1.5 m SLR scenario, the developed dryland and freshwater marshes would decrease significantly in 2100, while the area of salt marshes would decrease and then increase. The growth pattern of regularly flooded marshes would be similar to the 1 m scenario. In 2100, the core construction land would be affected on a large scale for landward salt marsh migration. A significant difference between the 2 m scenario and the other three scenarios is the significant expansion of the tidal flat area. Compared with the 1.5 m scenario, in the 2 m scenario, the developed, undeveloped dryland and freshwater marshes would decrease more in 2050 and 2100; salt marshes would be only a few lower in 2050, and 35,479 hm2 lower in 2100; regularly flooded marshes would be lower in 2050 and relatively higher in 2100.
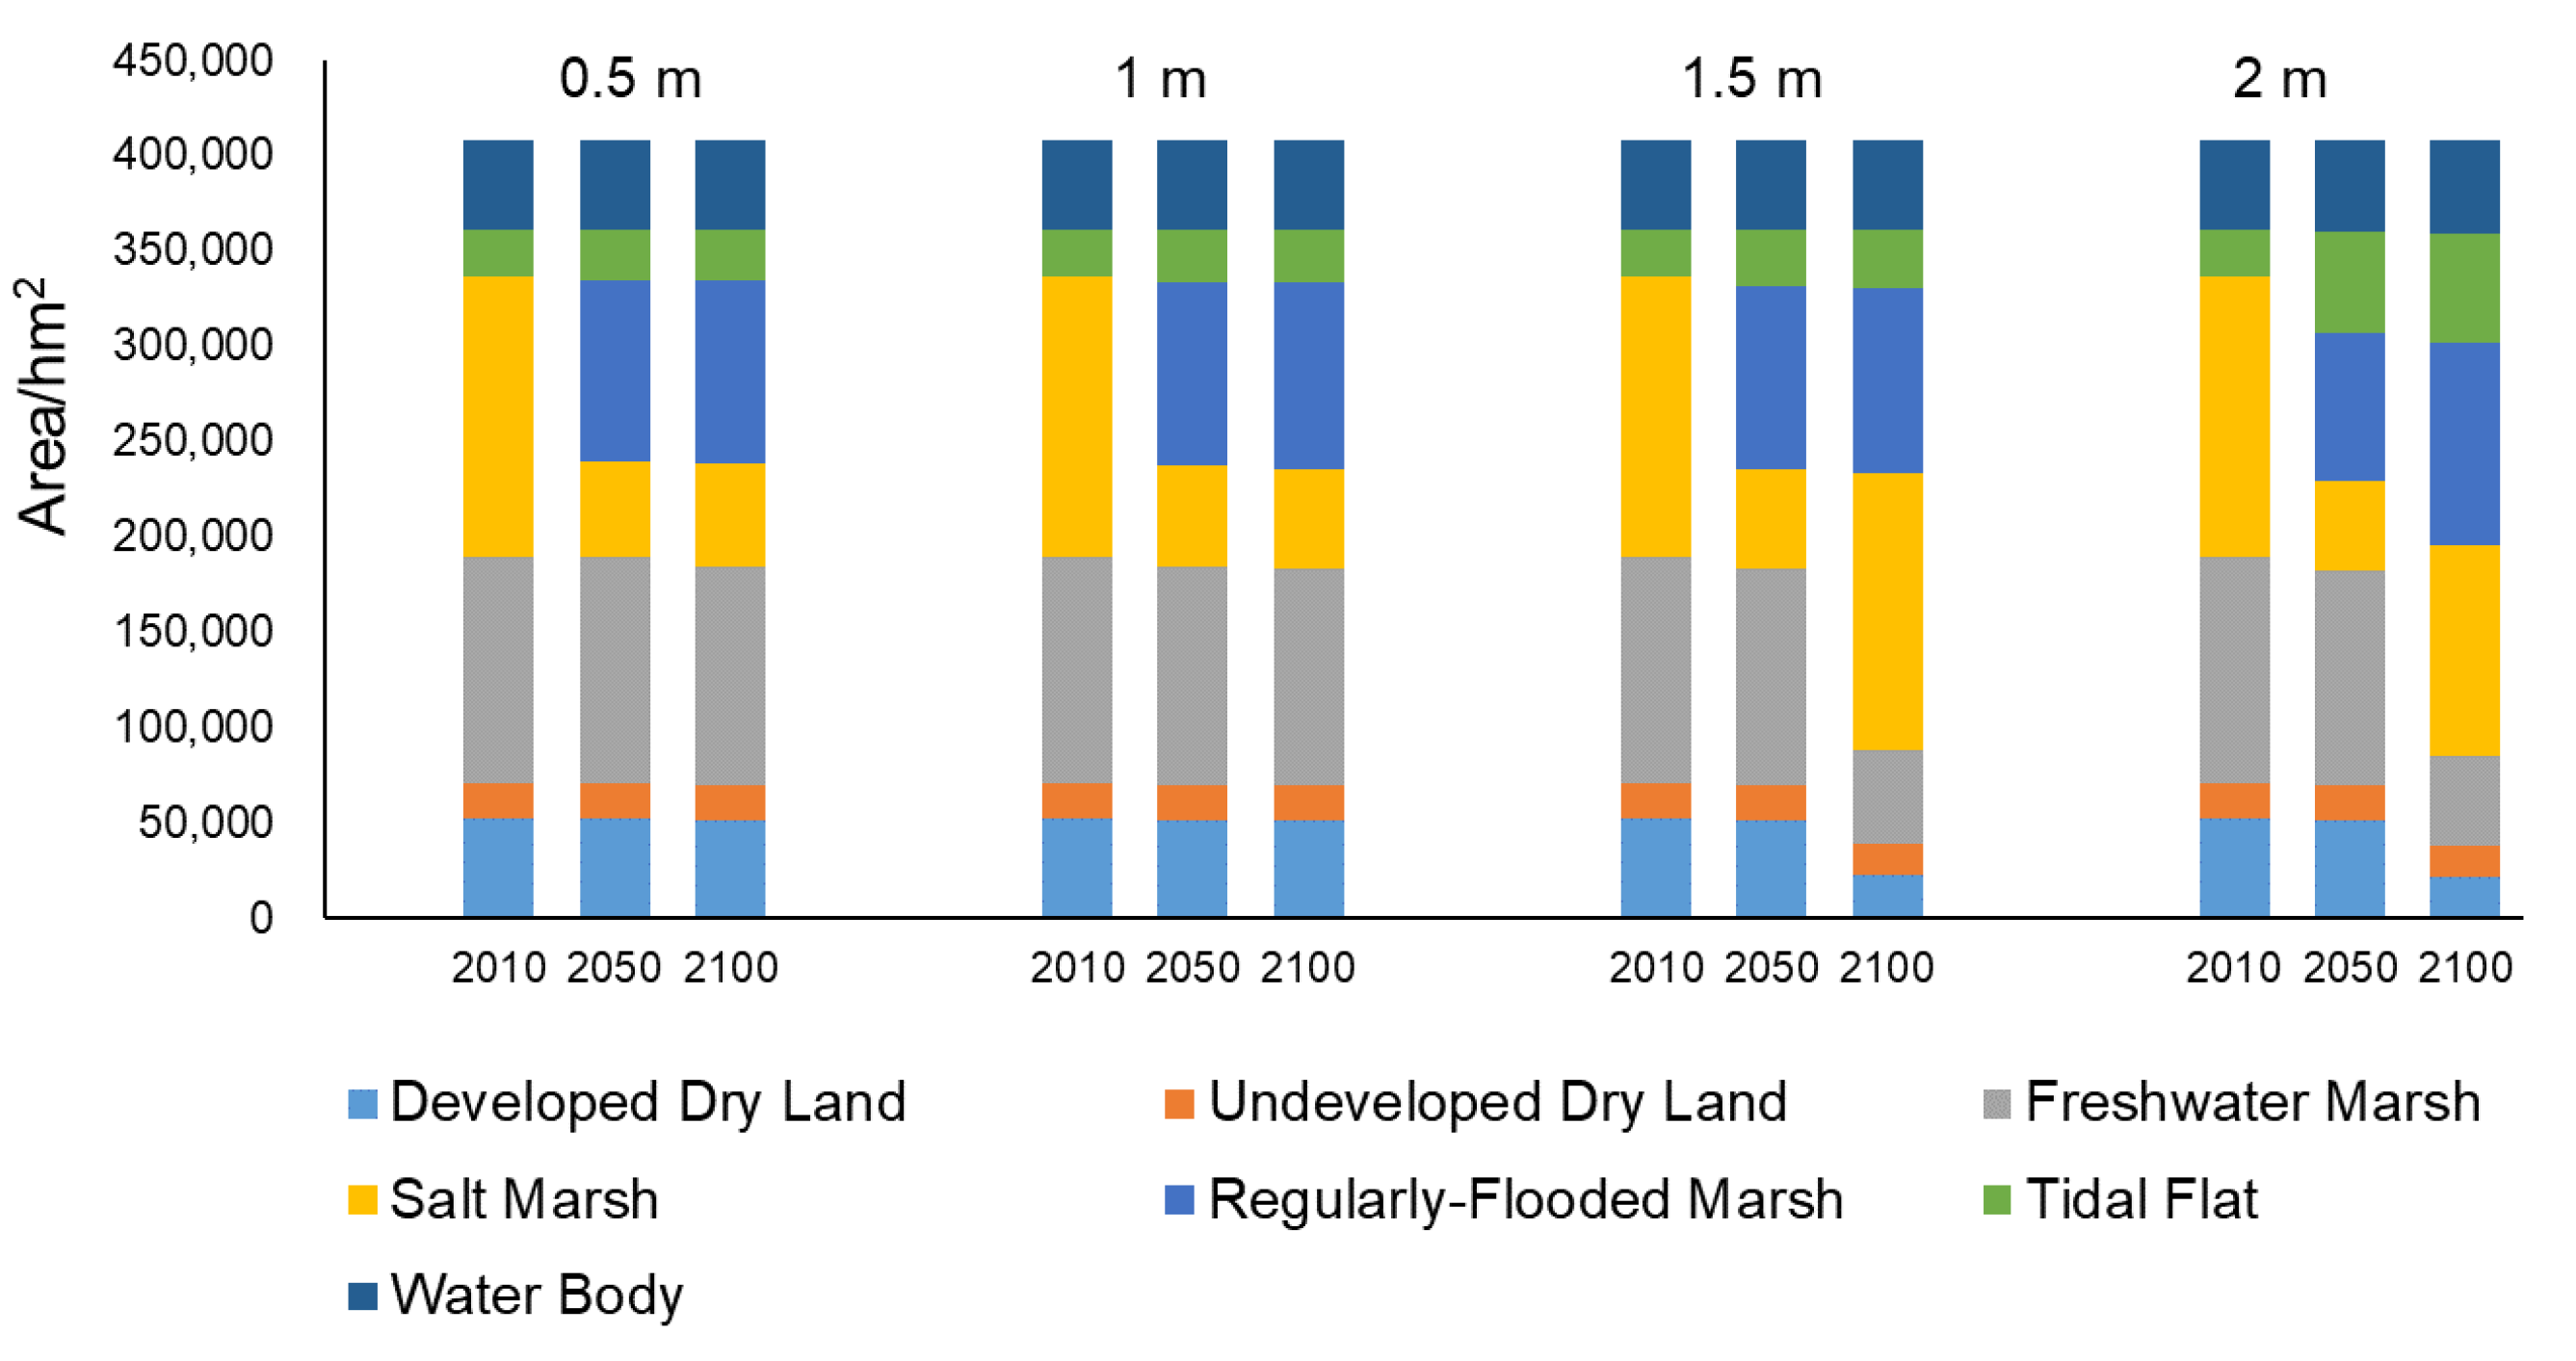
In terms of mean values, by 2050, the developed dryland will decrease by 671.44 hm2, the undeveloped dryland will decrease by 105.5 hm2, the freshwater marshes will decrease by 3355.11 hm2, and the salt marshes will decrease by 97,088.5 hm2, while the regularly flooded marshes and tidal flats will increase by 91048.66 hm2 and 9839.1 hm2. By 2100, the developed dryland will decrease by 15,589.57 hm2, the undeveloped dryland will decrease by 1002.08 hm2, the freshwater marshes will decrease by 37206.15 hm2, and the salt marshes decreased by 57074.36 hm2, while the regularly flooded marshes and tidal flats will increase by 99,234.49 hm2 and 11,056.57 hm2.
3.2. Effects of Sea Level Rise on Ecosystem Services in the Liaohe Delta
3.2.1. Carbon Storage
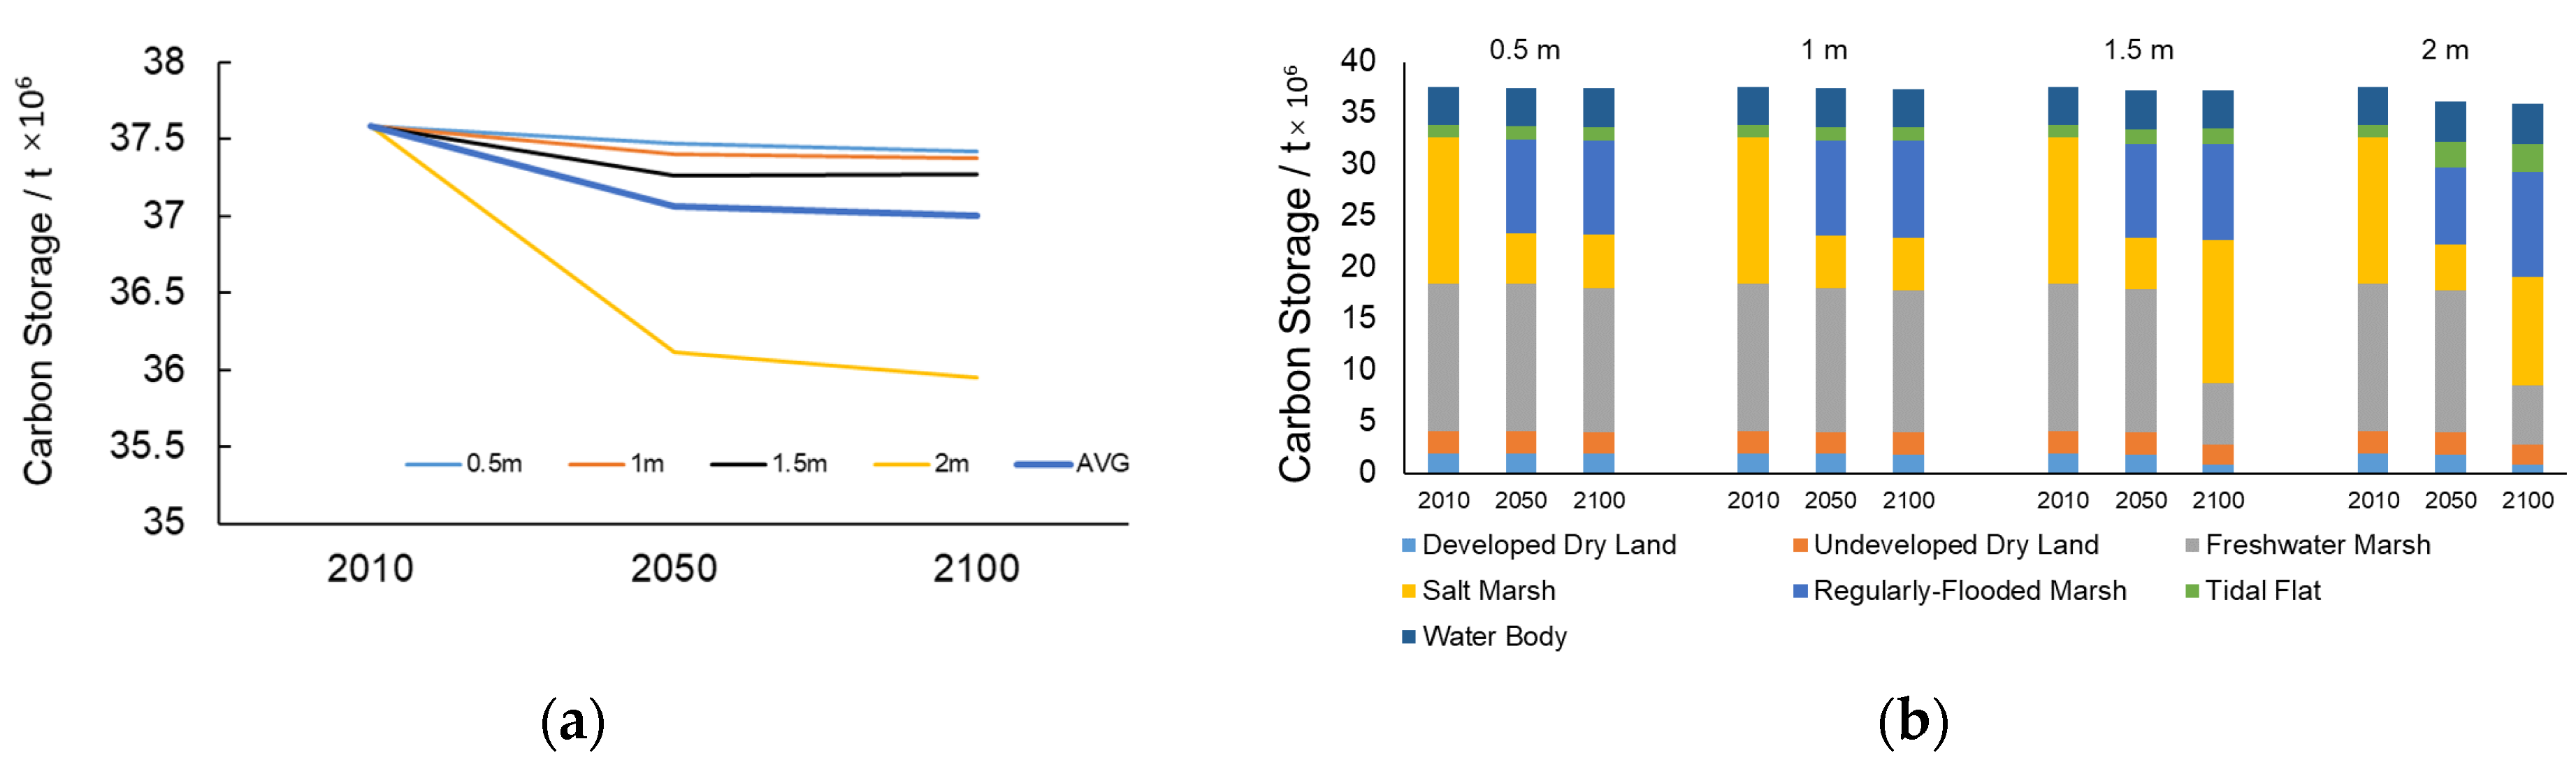
Under four different scenarios of SLR, the total carbon storage in the Liaohe Delta continues to decrease. Under the 0.5 m SLR scenario, the total carbon storage decreases from 37.59 × 10⁶ t in 2010 to 37.47 × 10⁶ t in 2050 by 0.3%, and to 37.42 × 10⁶ t in 2100 by 0.2% compared with 2050, with an overall decrease of about 0.45%. While the total carbon storage would decrease 1.48 × 10⁶ t in 2050 by 3.93%, and 0.16 × 10⁶ t in 2100 by 0.45% compared with 2050, with an overall decrease of about 4.36% for the 2 m SLR scenario.
The total carbon storage would be highest for the 0.5 m scenario, then 1 and 1.5 m scenario and much higher than the 2 m scenario by 2050 and 2100. The mean effect of SLR on carbon storage in the Liaohe Delta would be 37.06 × 10⁶ t in 2050 (decrease 0.53 × 10⁶ t) and 37.0 × 10⁶ t in 2100 (decrease 0.58 × 10⁶ t) (Figure 4.).
The decrease in dry land area and freshwater marsh will contribute to the decline in total carbon storage. At the same time, the slight increase in water bodies and tidal flat areas caused by SLR brings about a certain increase in carbon storage. However, the decrease in salt marshes would be accompanied by an increase in regularly flooded marshes. The carbon storages of the two were equal, so there would be little change in carbon storages.
3.2.2. Habitat Quality
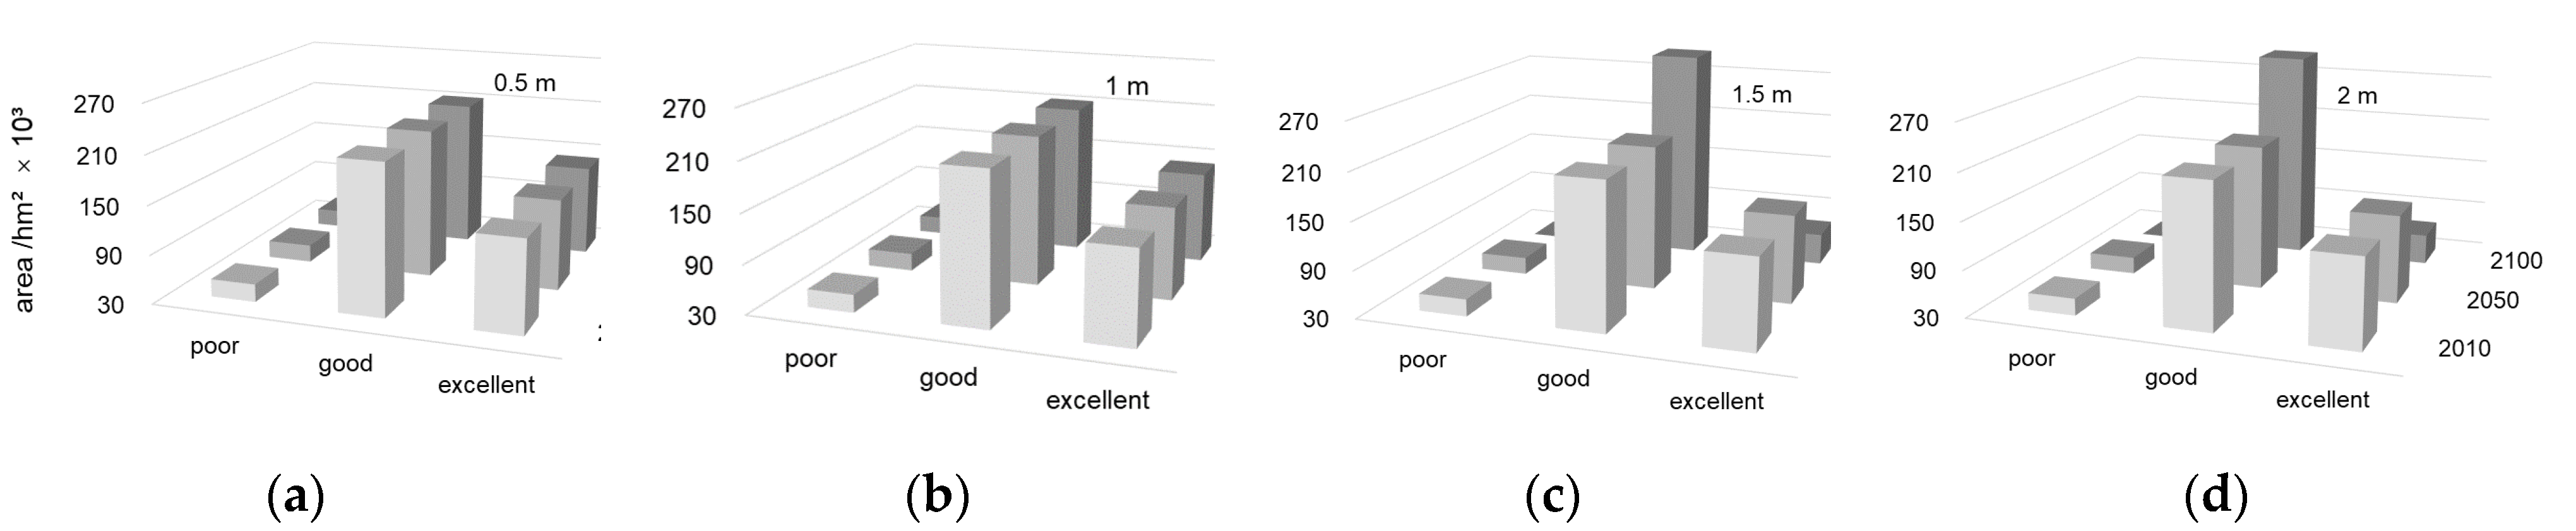
For the medium-term and long-term habitat quality under the 44 different scenarios, the natural fracture method was used to divide them into three grades. Among them, the high-value area (0.81–1) represents excellent habitat quality, the median value area (0.1–0.81) represents good habitat quality, and the low-value area (0–0.1) represents poor habitat quality. Habitat quality zonal distribution area under four different SLR scenarios (0.5, 1, 1.5, and 2 m) in Liaohe Delta were reclassified as shown in Figure 5. In general, under the four different SLR scenarios, the habitat quality is relatively stable, and its value is about 0.7.
The area of habitat quality at all levels in the three periods would be the same for the 0.5 m SLR scenario. Under the 0.5 and 1 m SLR scenario, the area of good levels is the largest at about 213 × 103 hm2, accounting for 52%. The areas of the 1.5 m and 2 m scenarios at each level would be close in both the medium and long periods. The habitat quality level pattern in 2050 in the 1.5 m and 2.0 m SLR scenarios would be similar to that of the 1 m scenario. By 2100, the habitat quality level pattern would change in the two high-SLR scenarios, with the area of good levels increasing to 315.51 × 10³ hm2, while the excellent level area and the poor level area would decrease to 49% and 43% of that in 2050.
3.2.3. Water Quality Purification
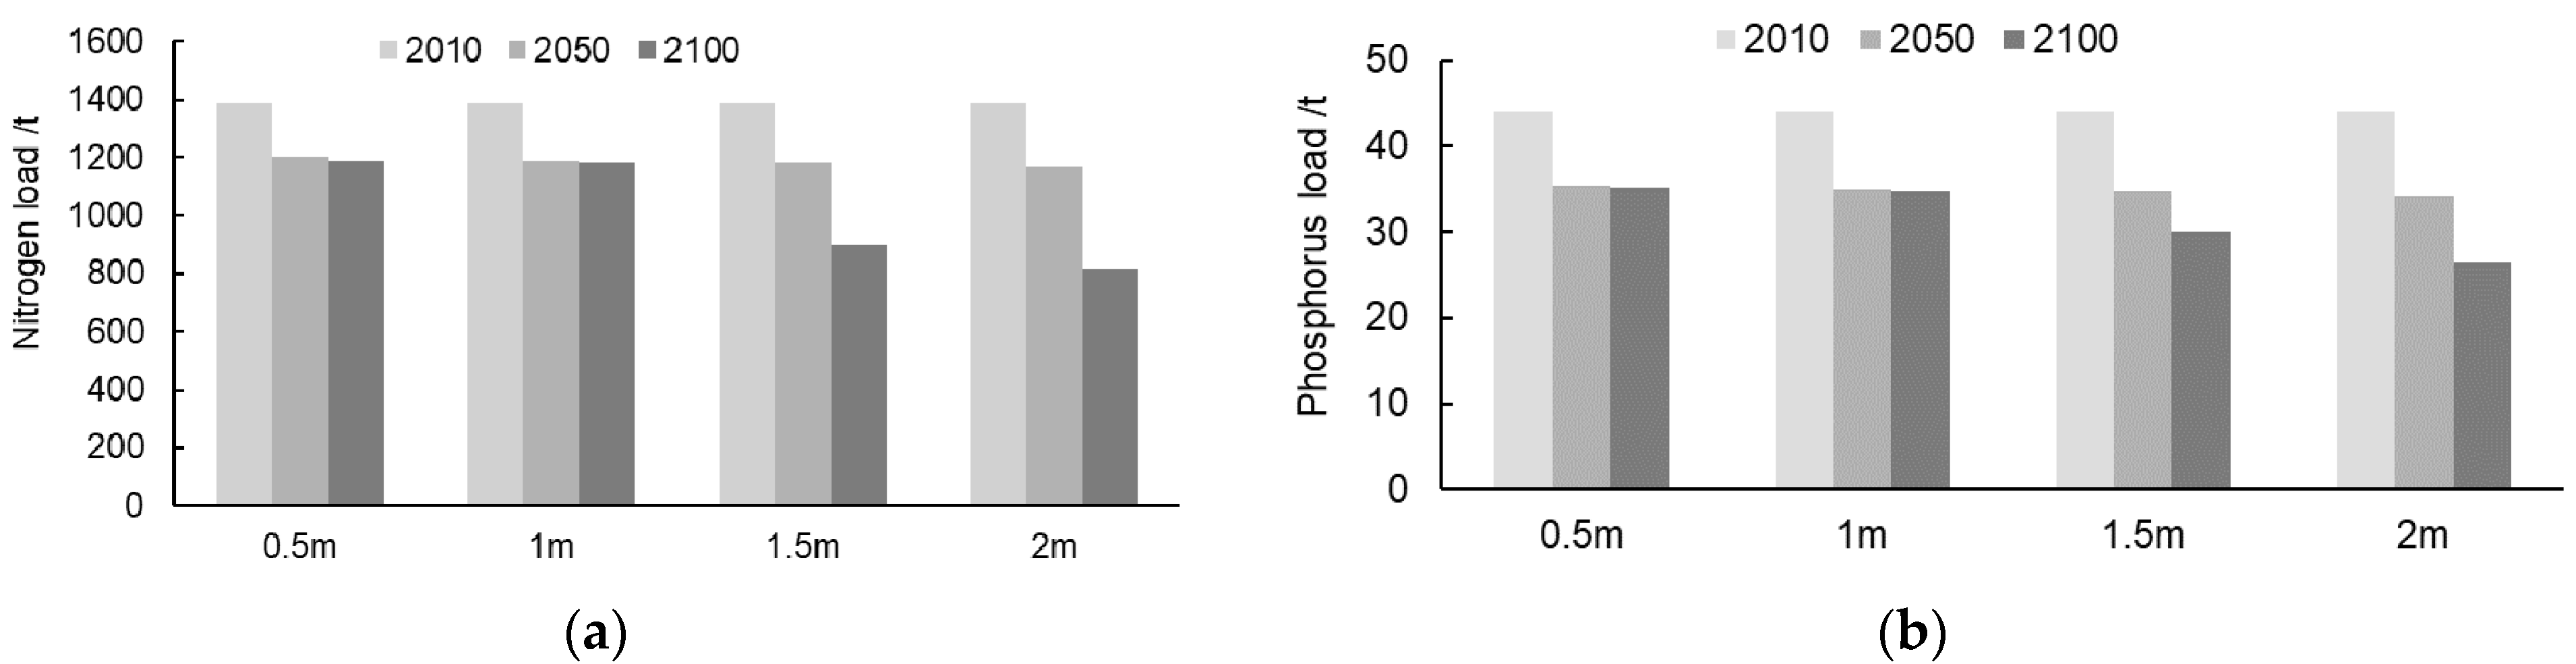
Due to the rise in sea level, a large area of land will be replaced by marsh wetlands, the area of wetland will increase significantly, and the output of nitrogen and phosphorus will be relatively small and have good interception capacity. Therefore, the changeable trend of total nitrogen and total phosphorus emissions in the Liaohe Delta will gradually decrease, and the total nitrogen will decrease, by a mean of 14% and 28%, respectively. The mean total nitrogen load will be 1385.7 t, 1185.96 t, and 1021.71 t in 2010, 2050, and 2100, respectively. The decrease in the total phosphorus will be relatively large, by a mean of 21% and 26%, respectively (Figure 6). The mean total phosphorus load would be 44.01 t, 34.78 t, and 31.58 t in 2010, 2050, and 2100 (Figure 6).
Under the four different SLR scenarios, nitrogen loads were higher than phosphorus loads. The variation patterns of nitrogen and phosphorus loads are similar (Figure 6). In each study year of each scenario, the lowest nitrogen load would be 814.68 t (2 m SLR scenario in 2100), and the highest would be 1385.70 t (2010–2100). The maximum reduction in nitrogen load would be 30% (2 m SLR scenario, from 2050 to 2100) and the minimum reduction would be 0.7% (1 m SLR scenario, from 2050 to 2100). For phosphorus load, the highest would be 44 t (2010) and the lowest would be 26.45 t (2 m SLR scenario in 2100).
4. Discussions
SLR will have a significant impact on coastal land use in the Liaohe Delta, and the ecological pattern of the coastal region should meet the needs of sustainable socio-economic development of the coastal economic zone. Integrated wetland protection, restoration and early warning ecological pattern under future scenarios will be a more comprehensive and sustainable ecological safety management scheme for the coastal area [49]. It has been shown that SLR drives inland migration of coastal marsh vegetation [50] and shapes new wetland patterns inland, which is consistent with the prediction of changes in future land use types in the Liaohe Delta. It is worth noting that under the four SLR scenarios discussed, a large part of the original salt marsh distribution region will be at risk of developing into inundation areas due to lower elevation, which poses a great challenge to coastal defense in the region. Based on the biological characteristics of marshes, ecological shorelines can be constructed to prevent floods [51] and enhance ecosystem services. The simulation in the Liaohe Delta is based on the current land use, and with the further construction of roads, dams, and other infrastructure, and the continuous improvement of water conservancy projects, new land use patterns will emerge. This hard and impervious surface, which is not suitable for vegetation growth, will limit the terrestrial migration of salt marshes and cannot provide suitable habitats for salt marshes [50]. Therefore, based on the simulation results of the current land use and in conjunction with the regional development plan, it is necessary to establish a land buffer zone and delineate a blue line to cope with the SLR so as to reserve space for the inland migration of salt marshes [49].
Changes in ecosystem services driven by SLR are complex, and the resistance of coastal wetlands to SLR in the United States contributes to their carbon sink function [52], and the loss of carbon sinks in mangrove ecosystems in the Negombo estuary is influenced by SLR [53]. The total carbon storage in the study area will decrease, while the carbon storage in regularly flooded marshes in the medium term and salt marshes in the long term under high SLR is enhanced; the habitat in the coastal area is highly variable, and the areas with excellent and good habitat quality are distributed in the central part dominated by freshwater marshes and salt marshes; the total nitrogen and phosphorus emission loads in the study area show a decreasing trend, and the nascent salt marshes effectively retain pollutants. These areas of enhanced ecosystem services driven by SLR, high-value areas, and areas of overlapping multiple types of functions should be used as an important basis for delineating regional ecological protection red lines. The coastal wetland region affected by SLR is a key area for subsequent coastal zone management. Further research in China should also pay attention to residents’ understanding of possible changes in coastal wetlands and formulate corresponding management strategies to cope with different risks [14].
SLAMM could simulate wetland change more accurately than GrC (growing cluster model) and RCM (the random constraint match model) [28]. SLAMM is an empirical model whose parameters are static values, and the simulation results have certain limitations. Meanwhile, SLR is uncertain, and the comparative study of multiple scenarios makes the research results more indicative [54]. Subsequent studies should further assess the role played by existing hard shorelines in ecosystem service maintenance under SLR scenarios and reasonably construct coastal ecological protection; a network regulation mechanism conducive to sustainable development should be comprehensively constructed from the perspective of complex ecological–social–economic systems [55]; and rational planning of coastal wetland ecological safety patterns should be performed on a larger scale [56,57].
5. Conclusions
The most extensive impacts of the high-SLR scenario will be on coastal wetlands. This is consistent with our expectations and perceptions. Specifically, the 1.5 and 2 m SLR scenarios significantly impact the core urban area. SLR would cause a significant increase in the inundation area. Salt marshes will decrease in the low-SLR scenario and be mainly replaced by regularly flooded marshes. In contrast, in the high SLR scenario, salt marshes will decrease in the medium term and increase and expand inland in the long term. We should reasonably delineate the ecological red line for rescue protection of natural wetlands (high-value ecosystem services areas and areas of overlapping multiple types of services driven by SLR), the ecological green line for wetland ecological restoration and compensation (potential restoration areas that are now developed land such as salt flats and aquaculture ponds and have the potential to be restored as wetland vegetation habitats), and the ecological blue line for response to SLR and coastal compression (landward migration area of coastal wetlands under the SLR scenario). Finally, an ecological security pattern integrating the three lines that can bear the total impact of climate change and human activities will be formed.
The SLAMM and InVEST were used in conjunction to form a complete technical process for assessing the impacts of SLR on coastal wetlands. This local study technology can also be suitable for a global audience. The models used in the research are open access. Only four SLR scenarios are used. More incremental values may be used to identify tipping points in land use so managers can understand which SLR values will trigger the need to change the management strategy.
Author Contributions
Conceptualization, L.Z., X.L. and J.B.; methodology, L.Z. and M.G.; software, G.W.; validation, Q.Z., G.W. and L.Z.; formal analysis, M.G.; investigation, Q.Z.; resources, B.C.; writing—original draft preparation, L.Z.; writing—review and editing, L.Z., H.B. and U.A.; visualization, L.Z.; supervision, B.C.; project administration, J.B. and X.L.; funding acquisition, J.B. and X.L. All authors have read and agreed to the published version of the manuscript.
Funding
This research was funded by the National Natural Science Foundation of China (No. 32171572), the National Key R&D Program of China (grant 2019YFE0121500), the Shandong Joint Foundation of National Natural Science Foundation of China (No. U2006215), the National Natural Science Foundation of China (No. 31770576) and the Education and Teaching Reform Research Project in Hebei University of Engineering (No.JG2022018). The APC was funded by the National Natural Science Foundation of China (No. 32171572).
Institutional Review Board Statement
Not applicable.
Informed Consent Statement
Not applicable.
Data Availability Statement
Not applicable.
Acknowledgments
The authors also extend appreciation to all the anonymous reviewers and editors for their constructive comments that improved the paper.
Conflicts of Interest
The authors declare no conflict of interest.
References
- Ma, T.T.; Liang, C.; Li, X.W.; Xie, T.; Cui, B. Quantitative assessment of the impact of reclamation activities on coastal wetlands in China. Wetl. Sci. 2015, 13, 653–659. [Google Scholar]
- Ma, Z.J.; Melville, D.S.; Liu, J.G.; Chen, Y.; Yang, H.Y.; Ren, W.W.; Zhang, Z.W. Ecosystems management rethinking China’s new great wall. Science 2014, 346, 912–914. [Google Scholar] [CrossRef] [Green Version]
- Cui, B.S.; Xie, T.; Wang, Q.; Li, S.Z.; Yan, J.G.; Yu, S.L.; Liu, K.; Zheng, J.J.; Liu, Z.Z. Impacts of large-scale reclamation on coastal wetlands and countermeasures. Proc. Chin. Acad. Sci. 2017, 32, 418–425. [Google Scholar]
- Cui, L.F. Vulnerability Assessment of Coastal Wetlands in the Yangtze Estuary under the Influence of Sea Level Rise; East China Normal University: Shanghai, China, 2016. [Google Scholar]
- IPCC. 2021: Summary for Policymakers. In IPCC Special Report on the Ocean and Cryosphere in a Changing Climate; Pörtner, H.-O., Roberts, D.C., Masson-Delmotte, V., Zhai, P., Tignor, M., Poloczanska, E., Mintenbeck, K., Nicolai, M., Okem, A., Petzold, J., et al., Eds.; IPCC: Geneva, Switzerland, 2021; In press. [Google Scholar]
- Barbier, E.B.; Hacker, S.D.; Kennedy, C.J.; Koch, E.W.; Stier, A.C.; Silliman, B.R. The value of estuarine and coastal ecosystem services. Ecol. Monogr. 2011, 81, 169–193. [Google Scholar] [CrossRef]
- Betini, G.S.; Fitzpatrick, M.J.; Norris, D.R. Experimental evidence for the effect of habitat loss on the dynamics of migratory networks. Ecol. Lett. 2015, 18, 526–534. [Google Scholar] [CrossRef]
- Pontee, N. Defining coastal squeeze: A discussion. Ocean Coast. Manag. 2013, 84, 204–207. [Google Scholar] [CrossRef]
- Liu, Z.Q.; Lv, X.G.; Liu, H.Y. A comparative study of wetland resources in the Yellow River Delta and Liaohe Delta. Resour. Sci. 2000, 3, 60–65. [Google Scholar]
- Wang, B.Q.; Yang, F.; Wang, Z.B. The impact of sea level rise on ecosystem service value and adaptive measures. Acta Ecol. 2015, 35, 7998–8008. [Google Scholar]
- Yoskowitz, D.; Carollo, C.; Pollack, J.B.; Santos, C.; Welder, K. Integrated Ecosystem Services Assessment: Valuation of Changes due to Sea Level Rise in Galveston Bay, Texas, USA. Integr. Environ. Assess. Manag. 2017, 13, 431–443. [Google Scholar] [CrossRef]
- Craft, C.; Clough, J.; Ehman, J.; Joye, S.; Park, R.; Pennings, S.; Guo, H.; Machmuller, M. Forecasting the effects of accelerated sea-level rise on tidal marsh ecosystem services. Front. Ecol. Environ. 2009, 7, 73–78. [Google Scholar] [CrossRef] [Green Version]
- Krauss, K.W.; Cormier, N.; Osland, M.J.; Kirwan, M.L.; Stagg, C.L.; Nestlerode, J.A.; Russell, M.J.; From, A.S.; Spivak, A.; Dantin, D.; et al. Created mangrove wetlands store belowground carbon and surface elevation change enables them to adjust to sea-level rise. Sci. Rep. 2017, 7, 1030. [Google Scholar] [CrossRef] [Green Version]
- Sikder, A.H.M.K.; Mozumder, P. Risk Perceptions and Adaptation to Climate Change and Sea-Level Rise: Insights from General Public Opinion Survey in Florida. J. Water Resour. Plan. Manag. 2020, 146, 04019081. [Google Scholar] [CrossRef]
- Laura, G.; Freeman, K.; Kelly, E.; Gordon, D.R.; Putz, F.E. Retrospective and prospective model simulations of sea level rise impacts on Gulf of Mexico coastal marshes and forests in Waccasassa Bay, Florida. Clim. Change 2011, 107, 35–57. [Google Scholar]
- Li, J.; Shang, Z.; Wang, F.; Chen, Y.; Tian, L.; Jiang, X.; Wang, H. Holocene sea level change on the west coast of the Bohai Bay. Quat. Sci. 2015, 35, 243–264. [Google Scholar]
- Wang, H.; Ge, Z.M.; Yuan, L.; Zhang, L.Q. Evaluation of the combined threat from sea-level rise and sedimentation reduction to the coastal wetlands in the Yangtze Estuary, China. Ecol. Eng. 2014, 71, 346–354. [Google Scholar] [CrossRef]
- Zhou, G.S.; Zhou, L.; Guan, E.K.; Zhao, F.W. Liaohe Delta Wetland and Global Change. J. Meteorol. Environ. 2006, 22, 7–12. [Google Scholar]
- Li, X.W.; Xiao, D.N.; Hu, Y.M. Analysis and Evaluation of Liaodong Bay Coastal Wetland Landscape Planning Plan. J. Ecol. 2002, 2, 224–232. [Google Scholar]
- Sun, J. Evolution Characteristics and Value Evaluation of Tidal Flat Resources in Panjin City under Remote Sensing Monitoring; Jilin University: Changchun, China, 2007. [Google Scholar]
- Huang, G.L. Study on the Change and Driving Mechanism of Wetland Landscape in Liaohe Delta. Ph.D. Thesis, Beijing Forestry University, Beijing, China, 2011. [Google Scholar]
- Dong, Y. The Impact of Climate Change on the Ecological Environment of the Liaohe Delta Wetland; Northeastern University: Boston, MA, USA, 2008. [Google Scholar]
- Ding, L.; Zhang, H.; Sun, C.Z. Study on landscape pattern changes of coastal wetlands in Liaoning Province. Wetl. Sci. 2008, 66, 7–12. [Google Scholar]
- Wang, Y.; Zhou, L.; Jia, Q.Y.; Yu, W.Y. Soil freezing and thawing characteristics of Panjin reed marshes. Wetl. Sci. 2016, 1414, 295–301. [Google Scholar]
- Zhang, X.L.; Zhang, Z.H.; Gu, D.Q.; Xu, Z.J.; Ye, S.Y. Evolution of coastal wetlands in the Liaohe Delta. J. Ecol. Environ. 2009, 18, 1003–1009. [Google Scholar]
- Yan, X.; Liu, M.; Zhong, J.; Guo, J.; Wu, W. How Human Activities Affect Heavy Metal Contamination of Soil and Sediment in a Long-Term Reclaimed Area of the Liaohe River Delta, North China. Sustainability 2018, 10, 338. [Google Scholar] [CrossRef] [Green Version]
- Wu, W.; Yeager, K.M.; Peterson, M.S.; Fulford, R.S. Neutral models as a way to evaluate the sea level affecting marshes model (SLAMM). Ecol. Model. 2015, 303, 55–69. [Google Scholar] [CrossRef]
- Clough, J. A White Paper on Data Requirements and Data Inventory for Alaska SLAMM Analyses; Warren Pinnacle Consulting, Inc.: Warren, VT, USA, 2010. [Google Scholar]
- Rahmstorf, S. A Semi-Empirical Approach to Projecting Future Sea-Level Rise. Science 2007, 315, 368–370. [Google Scholar] [CrossRef] [PubMed] [Green Version]
- Vermeer, M.; Rahmstorf, S. Global sea level linked to global temperature. Proc. Natl. Acad. Sci. USA 2009, 106, 21527–21532. [Google Scholar] [CrossRef] [PubMed] [Green Version]
- Pfeffer, W.T.; Harper, J.T.; O’Neel, S. Kinematic Constraints on Glacier Contributions to 21st-Century Sea Level Rise. Science 2008, 321, 1340–1343. [Google Scholar] [CrossRef] [PubMed]
- China Gulf Chronicle Compilation Committee. China Gulf Chronicle; Ocean Publishing House: Beijing, China, 1998; Volume 14. [Google Scholar]
- Wang, B.F.; Zhai, Q.F.; Ao, X.; Zhao, Y.J.; Ren, Z.Y.; Zhu, D.H.; Liu, N.N.; Qi, C.; Zhao, X.Q. Analysis of Storm Surge Disaster in Liaoning. Anhui Agric. Sci. 2014, 42, 1765–1768, 1835. [Google Scholar]
- Li, W.S.; Wang, H.; Zhang, J.L.; Zuo, C.S.; Li, H.; Dong, J.X. Coastal erosion and impact assessment of Liaodong Bay under sea level rise scenarios. Ocean Bulletin. 2019, 38, 31–37. [Google Scholar]
- Liu, D.W.; Hu, K.; Zhao, X.; Zhang, K.X.; Gong, X.J.; Tang, G.W. Study on the sedimentary environment of Gaizhou Beach in the Liaohe Estuary in the past 30 years. J. Oceanogr. 2017, 39, 131–142. [Google Scholar]
- Tian, H.; Sun, Q.; Jin, H.T.; Liang, X.J.; Ma, S.M.; Du, J.Z.; Li, X.G. Exploration on Environmental Geological Problems in Liaohe Delta Region. Groundwater 2017, 39, 133–135, 139. [Google Scholar]
- Piao, S.L.; Fang, J.Y.; He, J.S.; Xiao, Y. Grassland vegetation biomass and its spatial distribution pattern in China. Chin. J. Plant Ecol. 2004, 4, 491–498. [Google Scholar]
- Bagstad, K.J.; Semmens, D.J.; Winthrop, R. Comparing approaches to spatially explicit ecosystem service modeling: A case study from the San Pedro River, Arizona. Ecosyst. Serv. 2013, 5, 40–50. [Google Scholar] [CrossRef]
- Keller, A.A.; Fournier, E.; Fox, J. Minimizing impacts of land use change on ecosystem services using multi-criteria heuristic analysis. J. Environ. Manag. 2015, 156, 23–30. [Google Scholar] [CrossRef] [PubMed] [Green Version]
- Wang, Y.; Meng, J.; Qi, Y.; Peng, F. Review of ecosystem management based on the InVEST model. Chin. J. Ecol. 2015, 34, 3526–3532. [Google Scholar]
- Zhen, W.; Huang, M.; Zhai, Y.L.; Chen, K.; Gong, Y.Z. Changes in forest vegetation carbon storage and carbon sequestration rate in Liaoning Province. Chin. J. Appl. Ecol. 2014, 25, 1259–1265. [Google Scholar]
- Suo, A.; Zhao, D.; Zhang, F. Research on the function of carbon storage and carbon sequestration of vegetation in estuarine wetlands in northern my country: Taking Panjin area of Liaohe Delta as an example. Oceanogr. Res. 2010, 28, 67–71. [Google Scholar]
- Dong, H.F.; Yu, J.B.; Sun, Z.G.; Mou, X.J.; Chen, X.B.; Mao, P.L.; Wu, C.F.; Guan, B. Spatial distribution characteristics of organic carbon in tidal flat wetlands along the coast of the Yellow River Estuary. Environ. Sci. 2010, 6, 1594–1599. [Google Scholar]
- Huang, M.; Ji, J.J.; Cao, M.K.; Li, K.R. Simulation of aboveground and belowground biomass of vegetation in China. Chin. J. Ecol. 2006, 12, 4156–4163. [Google Scholar]
- Zheng, Y.; Zhang, P.T.; Tang, F.; Zhao, L.I.; Zhao, X. Research on the impact of land use change on habitat quality in Changli County based on InVEST model. China Agric. Resour. Zoning 2018, 39, 121–128. [Google Scholar]
- Yang, J.W.; Gou, M.X.Z.; Jia, Z.L.; Wei, T.; Mo, L.; Li, Y.X. Non-point source pollution load assessment and control measures in Xiji River Basin. Sci. Technol. Eng. 2019, 19, 419–424. [Google Scholar]
- Wu, R.; Liu, G.; Wen, Y. Temporal and spatial variation of water production and water purification services in Guanting Reservoir basin based on InVEST model. Environ. Sci. Res. 2017, 30, 406–414. [Google Scholar]
- Fu, C.; Su, J.; Zhao, H.; Li, Q. GIS-Based Non-Point Source Pollution Load Estimation for Cities in the Upper Reaches of Zhanghe River. Water Resour. Prot. 2020, 36, 60–66. [Google Scholar]
- Ma, T.T. Research on the Optimization and Regulation of the Damaged Coastal Wetland Restoration System in the Yellow River Delta; Beijing Normal University: Beijing, China, 2019. [Google Scholar]
- Kirwan, M.L.; Megonigal, J.P. Tidal wetland stability in the face of human impactsandsea-levelrise. Nature 2013, 504, 53–60. [Google Scholar] [CrossRef] [PubMed]
- Chapman, M.G.; Underwood, A.J. Evaluation of ecological engineering of “armoured” shorelines to improve their value as habitat. J. Exp. Mar. Biol. Ecol. 2011, 400, 302–313. [Google Scholar] [CrossRef]
- Wang, F.; Lu, X.; Sanders, C.J.; Tang, J. Tidal wetland resilience to sea level rise increases their carbon sequestration capacity in United States. Nat. Commun. 2019, 10, 5434. [Google Scholar] [CrossRef]
- Perera, K.A.R.S.; De Silva, K.H.W.L.; Amarasinghe, M.D. Potential impact of predicted sea level rise on carbon sink function of mangrove ecosystems with special reference to Negombo estuary, Sri Lanka. Glob. Planet. Change 2018, 161, 162–171. [Google Scholar] [CrossRef]
- Borchert, S.M.; Osland, M.J.; Enwright, N.M.; Griffith, K.T. Coastal wetland adaptation to sea level rise: Quantifying potential for landward migration and coastal squeeze. J. Appl. Ecol. 2018, 55, 2876–2887. [Google Scholar] [CrossRef]
- Zhi, L.H.; Li, X.W.; Bai, J.H.; Guan, Y.N. Integrating ecological and socioeconomic networks using nitrogen metabolism in the Yellow River Delta, China. Resour. Conserv. Recycl. 2020, 162, 105012. [Google Scholar] [CrossRef]
- Liang, C.; Li, X.W.; Cui, B.S.; Ma, T.T. Construction of priority protection pattern of coastal wetlands in China. Wetl. Sci. 2015, 13, 660–666. [Google Scholar]
- Li, X.W.; Liang, C.; Shi, J.B. Developing wetland restoration scenarios and modeling its ecological consequences in the Liao he River Delta wetlands, China. Clean Soil Air Water 2012, 40, 1185–1196. [Google Scholar] [CrossRef]
Figure 1.
Location of the Liaohe Delta.

Figure 2.
Dynamic changes in the distribution and relative sea level rise of estuarine in the scenarios of medium term (2010–2050) and the long term (2010–2100) for 0.5, 1.0, 1.5, and 2.0 m sea-level rise (SLR) by 2100 in the Liaohe Delta.
Figure 2.
Dynamic changes in the distribution and relative sea level rise of estuarine in the scenarios of medium term (2010–2050) and the long term (2010–2100) for 0.5, 1.0, 1.5, and 2.0 m sea-level rise (SLR) by 2100 in the Liaohe Delta.

Figure 3.
Dynamic changes in area in the scenarios of medium-term (2010–2050) and the long-term (2010–2100) for 0.5, 1, 1.5 and 2 m sea-level rise (SLR) by 2100 in the Liaohe Delta.
Figure 3.
Dynamic changes in area in the scenarios of medium-term (2010–2050) and the long-term (2010–2100) for 0.5, 1, 1.5 and 2 m sea-level rise (SLR) by 2100 in the Liaohe Delta.

Figure 4.
Changes in carbon storage in the Liaohe Delta (a) and various land uses (b) under four sea level rise scenarios.
Figure 4.
Changes in carbon storage in the Liaohe Delta (a) and various land uses (b) under four sea level rise scenarios.

Figure 5.
Habitat quality zonal distribution area under 0.5 (a), 1 (b), 1.5 (c), and 2 (d) m sea level rise scenarios in the Liaohe Delta.
Figure 5.
Habitat quality zonal distribution area under 0.5 (a), 1 (b), 1.5 (c), and 2 (d) m sea level rise scenarios in the Liaohe Delta.

Figure 6.
Differences in nitrogen (a) and phosphorus (b) loads in 2050 and 2100 under 3 different sea level rise scenarios in the Liaohe Delta.
Figure 6.
Differences in nitrogen (a) and phosphorus (b) loads in 2050 and 2100 under 3 different sea level rise scenarios in the Liaohe Delta.


Table 1.
SLAMM operating parameters and data sources.
| Parameter Types | Values |
|---|---|
| Sea level rise trend (mm/year) | 3 |
| Elevation correction based on average tide level (m) | 0.25 |
| Diurnal range (m) | 2.7 |
| Salt marsh elevation (above Average tide level) (m) | 1.8 |
| Vegetation marsh erosion rate (m/year) | 2.5 |
| Forest swamp erosion rate (m/year) | 2.5 |
| Erosion rate of tidal flat (m/year) | 2.5 |
| Frequency of periodic flood swamp accretion (mm/year) | 28.3 |
| Frequency of swamp accretion by seasonal flood (mm/year) | 28.3 |
| Accretion frequency of tidal freshwater marshes (mm/year) | 29 |
| Beach subsidence rate (mm/year) | 75 |
| The frequency of major storms (times/year) | 1 |
Table 2.
Carbon density value by different regions (t/hm2).
| Land Use | Cabove | Cbelow | Csoil | Cdead |
|---|---|---|---|---|
| Developed land a | 0 | 0 | 36 | 0 |
| Undeveloped land b | 51 | 15 | 53.1 | 0.9 |
| Freshwater marshes | 51 | 24 | 45 | 1.65 |
| Salt marsh | 30 | 15 | 59.5 | 1.5 |
| Regularly Flooded Marsh | 30 | 15 | 59.5 | 1.5 |
| Tidal flats | 3 | 0 | 45 | 0 |
| Water Body | 7.5 | 4.5 | 78 | 0 |
Table 3.
Threat source parameters.
| Types of the Threat Source | The Scope of the Threat | Level of Threat | Mode of Decays |
|---|---|---|---|
| Field | 0.8 | 0.5 | exponential |
| Construction land | 2.8 | 0.7 | exponential |
| Waterway | 1.6 | 0.7 | linear |
| Port | 3.8 | 0.7 | exponential |
Table 4.
Habitat sensitivity parameters.
| Land Use | Suitability Degree | Field | Construction Land | Waterway | Port |
|---|---|---|---|---|---|
| Developed Dry Land | 0 | 1 | 1 | 1 | 1 |
| Undeveloped Dry Land | 1 | 1 | 1 | 1 | 1 |
| Freshwater Marsh | 0.9 | 0.6 | 0.9 | 0.5 | 0.3 |
| Salt Marsh | 0.7 | 0.8 | 0.9 | 0.5 | 0.8 |
| Regularly Flooded Marsh | 0.7 | 0.8 | 0.9 | 0.5 | 0.8 |
| Tidal Flat | 0.7 | 0.6 | 0.9 | 0.2 | 0.4 |
| Water Body | 0.9 | 0.4 | 0.9 | 0.8 | 0.2 |
Table 5.
Per-unit area by different regions.
| Land Use | Total Nitrogen Load (kg/hm2) | Total Phosphorus Load (kg/hm2) |
|---|---|---|
| Developed Dry Land | 11 | 0.25 |
| Undeveloped Dry Land | 15 | 0.2 |
| Freshwater Marsh | 2 | 0.1 |
| Salt Marsh | 2 | 0.1 |
| Regularly Flooded Marsh | 2 | 0.1 |
| Tidal Flat | 0.1 | 0.01 |
| Water Body | 0.1 | 0.01 |
Publisher’s Note: MDPI stays neutral with regard to jurisdictional claims in published maps and institutional affiliations. |
© 2022 by the authors. Licensee MDPI, Basel, Switzerland. This article is an open access article distributed under the terms and conditions of the Creative Commons Attribution (CC BY) license (https://creativecommons.org/licenses/by/4.0/).
Share and Cite
MDPI and ACS Style
Zhi, L.; Gou, M.; Li, X.; Bai, J.; Cui, B.; Zhang, Q.; Wang, G.; Bilal, H.; Abdullahi, U. Effects of Sea Level Rise on Land Use and Ecosystem Services in the Liaohe Delta. Water 2022, 14, 841. https://doi.org/10.3390/w14060841
AMA Style
Zhi L, Gou M, Li X, Bai J, Cui B, Zhang Q, Wang G, Bilal H, Abdullahi U. Effects of Sea Level Rise on Land Use and Ecosystem Services in the Liaohe Delta. Water. 2022; 14(6):841. https://doi.org/10.3390/w14060841
Chicago/Turabian StyleZhi, Liehui, Muxinzhou Gou, Xiaowen Li, Junhong Bai, Baoshan Cui, Qingyue Zhang, Gaojing Wang, Hazrat Bilal, and Usman Abdullahi. 2022. "Effects of Sea Level Rise on Land Use and Ecosystem Services in the Liaohe Delta" Water 14, no. 6: 841. https://doi.org/10.3390/w14060841
Note that from the first issue of 2016, this journal uses article numbers instead of page numbers. See further details here.