
Spatial and Time Variable Long Term Infiltration Rates of Green Infrastructure under Extreme Climate Conditions, Drought and Highly Intensive Rainfall


1
Research Centre for Built Environment NoorderRuimte, Hanze University of Applied Sciences, 9747 AS Groningen, The Netherlands
2
Deltares Daltonlaan 600, 3584 BK Utrecht Postbus, 85467 3508 AL Utrecht, The Netherlands
Water 2022, 14(6), 840; https://doi.org/10.3390/w14060840
Submission received: 2 January 2022
/
Revised: 4 March 2022
/
Accepted: 7 March 2022
/
Published: 8 March 2022
(This article belongs to the Special Issue Urban Hydrogeology Studies)
Abstract
:Swales are widely used Sustainable Urban Drainage Systems (SuDS) that can reduce peak flow, collect and retain water and improve groundwater recharge. Most previous research has focused on the unsaturated infiltration rates of swales without considering the variation in infiltration rates under extreme climate events, such as multiple stormwater events after a long drought period. Therefore, fieldwork was carried out to collect hydraulic data of three swales under drought conditions followed by high precipitation. For this simulation, a new full-scale infiltration method was used to simulate five rainfall events filling up the total storage volume of the swales under drought conditions. The results were then compared to earlier research under regular circumstances. The results of this study show that three swales situated in the same street show a variation in initial infiltration capacity of 1.6 to 11.9 m/d and show higher infiltration rates under drought conditions. The saturated infiltration rate is up to a factor 4 lower than the initial unsaturated rate with a minimal rate of 0.5 m/d, close to the minimum required infiltration rate. Significant spatial and time variable infiltration rates are also found at similar research locations with multiple green infrastructures in close range. If the unsaturated infiltration capacity is used as the design input for computer models, the infiltration capacity may be significantly overestimated. The innovative method and the results of this study should help stormwater managers to test, model, plan and schedule maintenance requirements with more confidence, so that they will continue to perform satisfactorily over their intended design lifespan.
1. Introduction
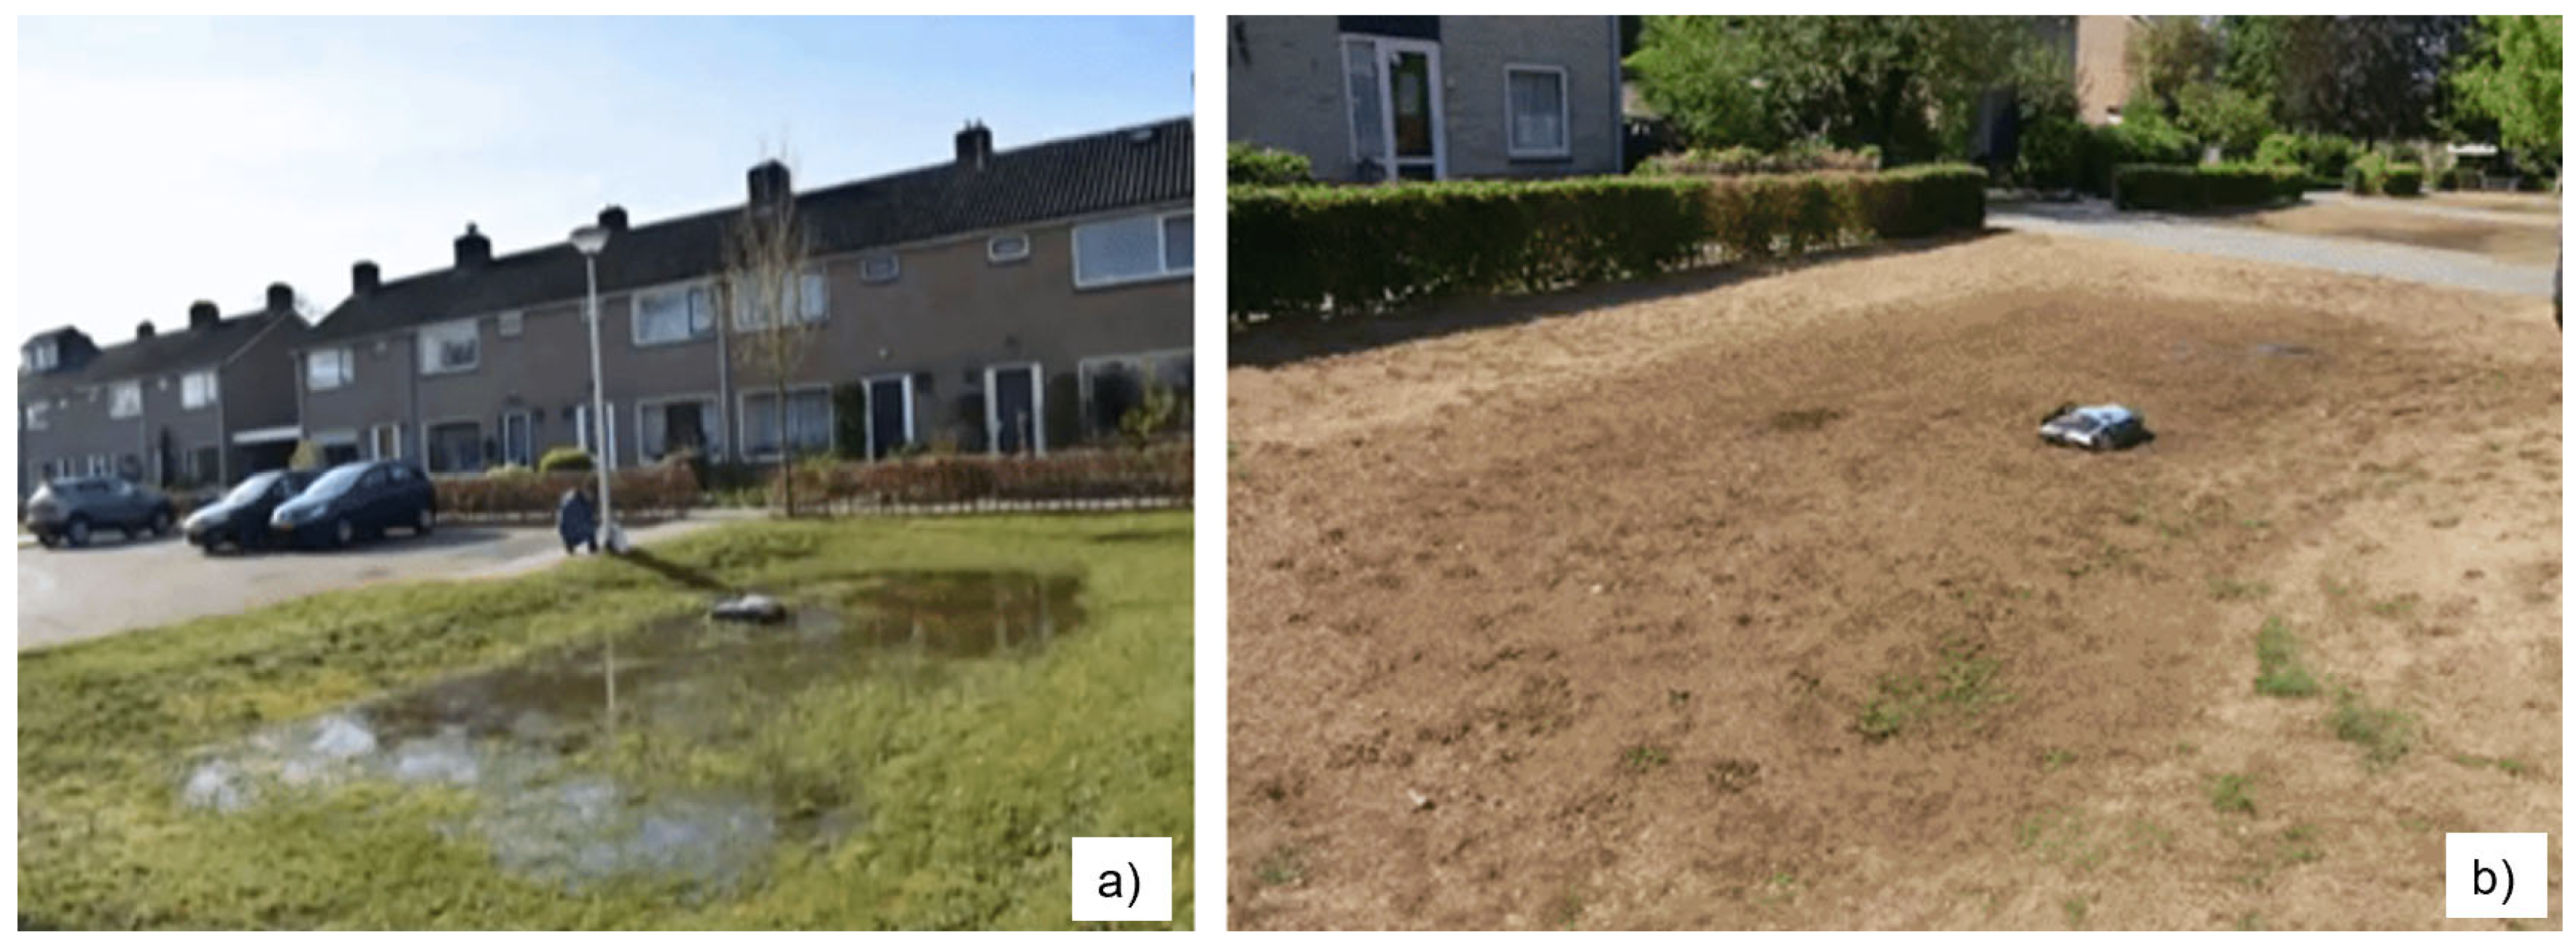
Urbanisation and climate change effect the water balance in our cities, resulting in challenges such as flooding, droughts and heat stress. The development and urbanization of watersheds increases impervious land cover and leads to an increase in stormwater runoff volume [1,2]. Stormwater management has shifted to include techniques that reduce runoff volumes and improve runoff water quality in addition to reducing the peak flow rate. Sustainable Urban Drainage System (SuDS), green infrastructure (GI), nature-based solutions (NBS) and bio-retention practices are typically designed to reduce runoff through infiltration and have been used for decades globally to provide infrastructure conveyance and water quality treatment [2,3,4]. Swales are typical landscape surface-drainage system vegetated (generally grass-lined) channels that receive stormwater runoff through gentle side-slopes and convey this stormwater downstream by way of longitudinal slopes [4,5,6,7]. Water quality treatment in a swale occurs through the process of sedimentation, filtration, infiltration and biological and chemical interactions with the soil. Swales have been shown to be very efficient in removing sediment particles from urban runoff [8,9,10]. The embankment slopes of swales can provide a bonus for volume retention, which in turn is positively impacted by the infiltration capacity of the filter media, soil moisture deficit, and side-slope length [11,12,13,14]. The type of vegetation, such as deep-rooted grass species and proliferation of root and earthworm channels, also improve infiltration [15,16,17]. Regarding soil composition in general, bioswales are composed of loamy sands, loams, or sandy loams resulting in variation in the infiltration rates of bio-swales and bio filters [14,16]. Several studies show that the performance of swales and sustainable urban drainage systems in general can be influenced by (human) failures in the design, implementation and maintenance of swales [4,18,19]. Besides these factors, there is a general consensus on the increase in extreme events in Europe in the 21st century [20,21,22], fostered by a temperature rise in the context of global warming that will affect the performance of green infrastructure. Drought impacts recorded in the recent past in Europe [23,24,25] will become more substantial in the future, making the identification of areas where droughts are projected to become more frequent and severe an important subject. In many European countries, the year 2018 broke drought records, with growing concerns in The Netherlands [26,27] after a 2-month period of no rain. The dry visual state of green infrastructure (Figure 1) in 2018 compared to 2017 raised many questions from Dutch municipalities and water authorities on the efficiency of swales being the most commonly used Sustainable Urban Drainage Systems in The Netherlands.
A large variation in the hydraulic performance of swales can be expected by the several discussed factors as different filter media, soil moisture content, side-slope length, type of vegetation, soil composition and (human) errors in the design, implementation and maintenance phase. There are several international studies that determined the variation in mean volume reduction in swales from 11 to 75% [10,28,29,30,31,32] and peak flow rate reductions from 10 to 74% with detention provided by infiltration or check dams improving this mitigation [33,34]. In The Netherlands, check dams are hardly applied; the hydraulic efficiency of swales rely on infiltration and retention capacity. The infiltration capacity of swales is usually estimated by measuring the rate at which water soaks away from small test pits or boreholes [4,35,36,37] or ring infiltrometer tests [38,39,40]. A number of studies have demonstrated a high degree of spatial variability between different infiltration measurements since the results were based on the infiltration rate through a very small area that is used to represent the total infiltration area [19,41,42,43]. Studies show large spatial variation in infiltration rates with individually measured infiltration values varying by a factor of 100, concluding that about 20 measurements at each swale is needed to reduce the uncertainty [44].
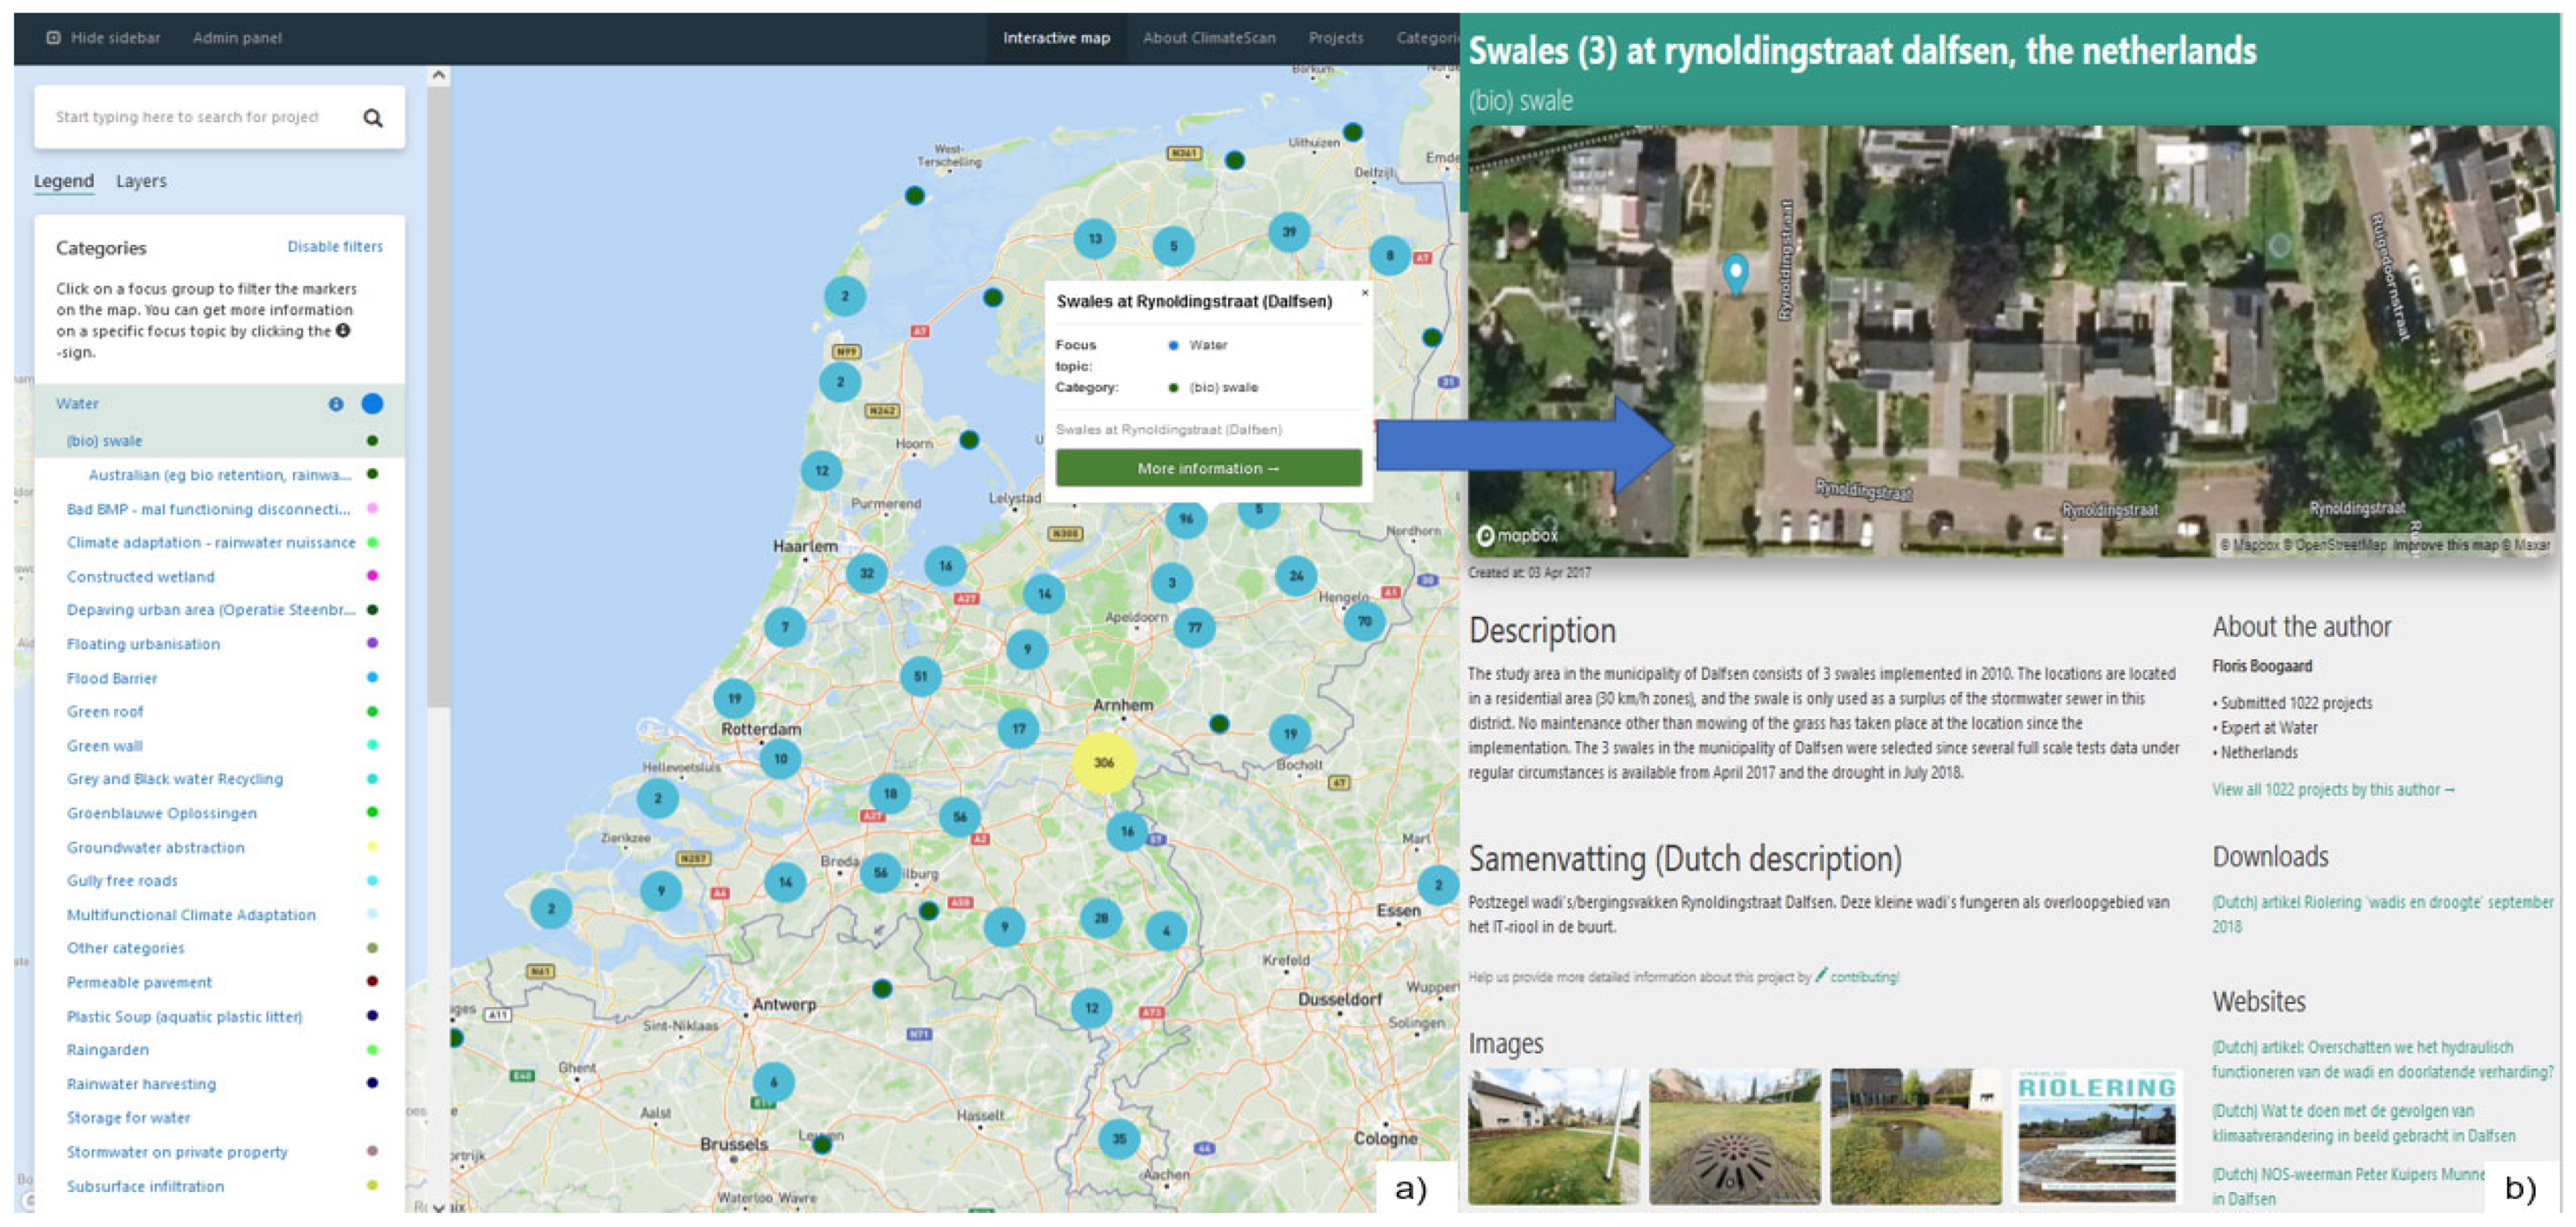
No studies have been found on the effect of long dry periods on the infiltration capacity of (Dutch) swales. Since swales are the most implemented nature-based climate adaptation method in the Netherlands (Figure 2a), research on this topic is advised. It is estimated that over 5000 swales are implemented in The Netherlands and more will be constructed to replace grey infrastructure in the near future. Urban planners and stakeholders need to have an understanding of the spatial and temporal variability of swales under normal and extreme circumstances, such as the severe drought in 2018. Therefore, this study set out to answer the following questions:
- Which variation of the (un)saturated infiltration capacity can be expected under extreme weather conditions of drought followed by severe rainfall?
- Do the swales empty their storage volume within 2 days under all circumstances according to the Dutch guidelines [45]?
While previous research on swales used small scale (ring infiltrometer) tests to gain insight into hydraulic performance, in this study, a full-scale test is applied where the total volume of 3 swales is repeatedly filled up with a tanktruck.
Study Area and Data
To answer the research questions, Dalfsen was chosen as the study area (Figure 1), since full-scale research on variation in infiltration capacity was conducted here in 2017 and was repeated at the ending of the drought in 2018. It is a unique location as three swales are constructed next to each other in the same street at the same time, built by the same design characteristics under similar geo-hydraulic circumstances in 2010. At this location, the variation in hydraulic performance can be studied and compared to earlier research results, with the permission of the municipality and residents.
The open-source online platform “Climatescan” presented in Figure 2a shows over 1000 locations where swales have been installed in The Netherlands from 1999 to the present [46]. Figure 2b shows the exact location of the study area in the municipality of Dalfsen, where three swales were implemented.
Dutch swales are shallow (often <0.3 m deep), dry, vegetated, and generally grass-lined, receiving stormwater runoff through drainage pipes and gullies from the connected surface area of roads and houses [45], see Figure 3. The figure shows the basic green infrastructure with the road surface and the grassed swale with engineered soil and inlet and outlet.
A number of swale infiltration systems have been in use in The Netherlands for years (Figure 2b), or even decades, but despite their long-term operation there is limited documentation on their hydraulic performance over their expected lifetime.
Dutch guidelines dictate a maximum emptying time of 48 h for swales with a depth of 30 to 50 cm [45]. Guidelines in The Netherlands are based on several factors such as the limited availability of space in urban areas, the low permeability of the soil, high groundwater tables and limited public health concerns (drowning of kids and mosquito nuisance) as a safety factor, given that the infiltration capacity of swales may reduce over time by clogging [19,45]. Similar guidelines on the hydraulic performance of swales can be found in Germany, where advice has been given on a design that enables the swale to infiltrate stormwater with a minimum infiltration rate of 0.864 m/d [47].
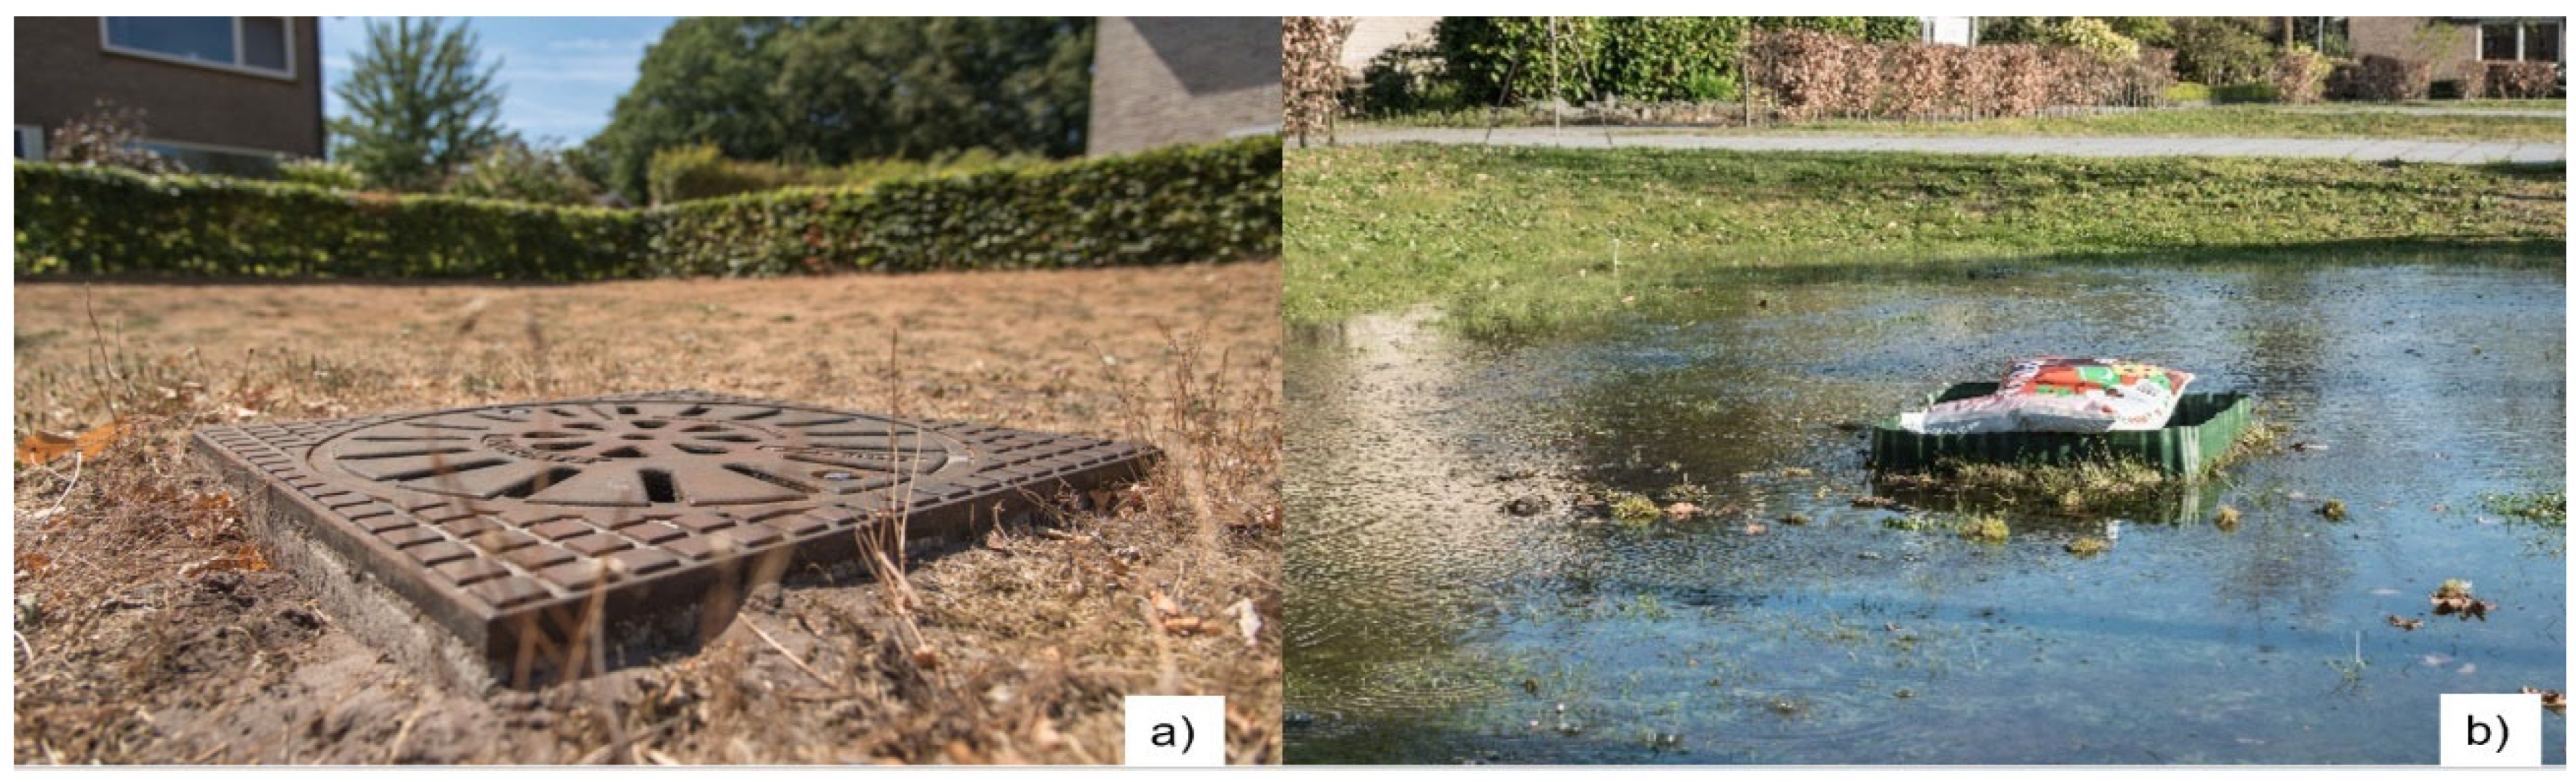
The study area in the municipality of Dalfsen is located in a residential area (30 km/h zones) and the three individual swales are used as a surplus of the stormwater sewer in this district. Figure 3 and Figure 4 show the impact of drought on vegetation in 2018 compared to 2017. The data of the full-scale infiltration test used in this study was executed on 20 April 2017, which is compared to the data of infiltration tests on 27 July 2018 after 7 weeks of drought.
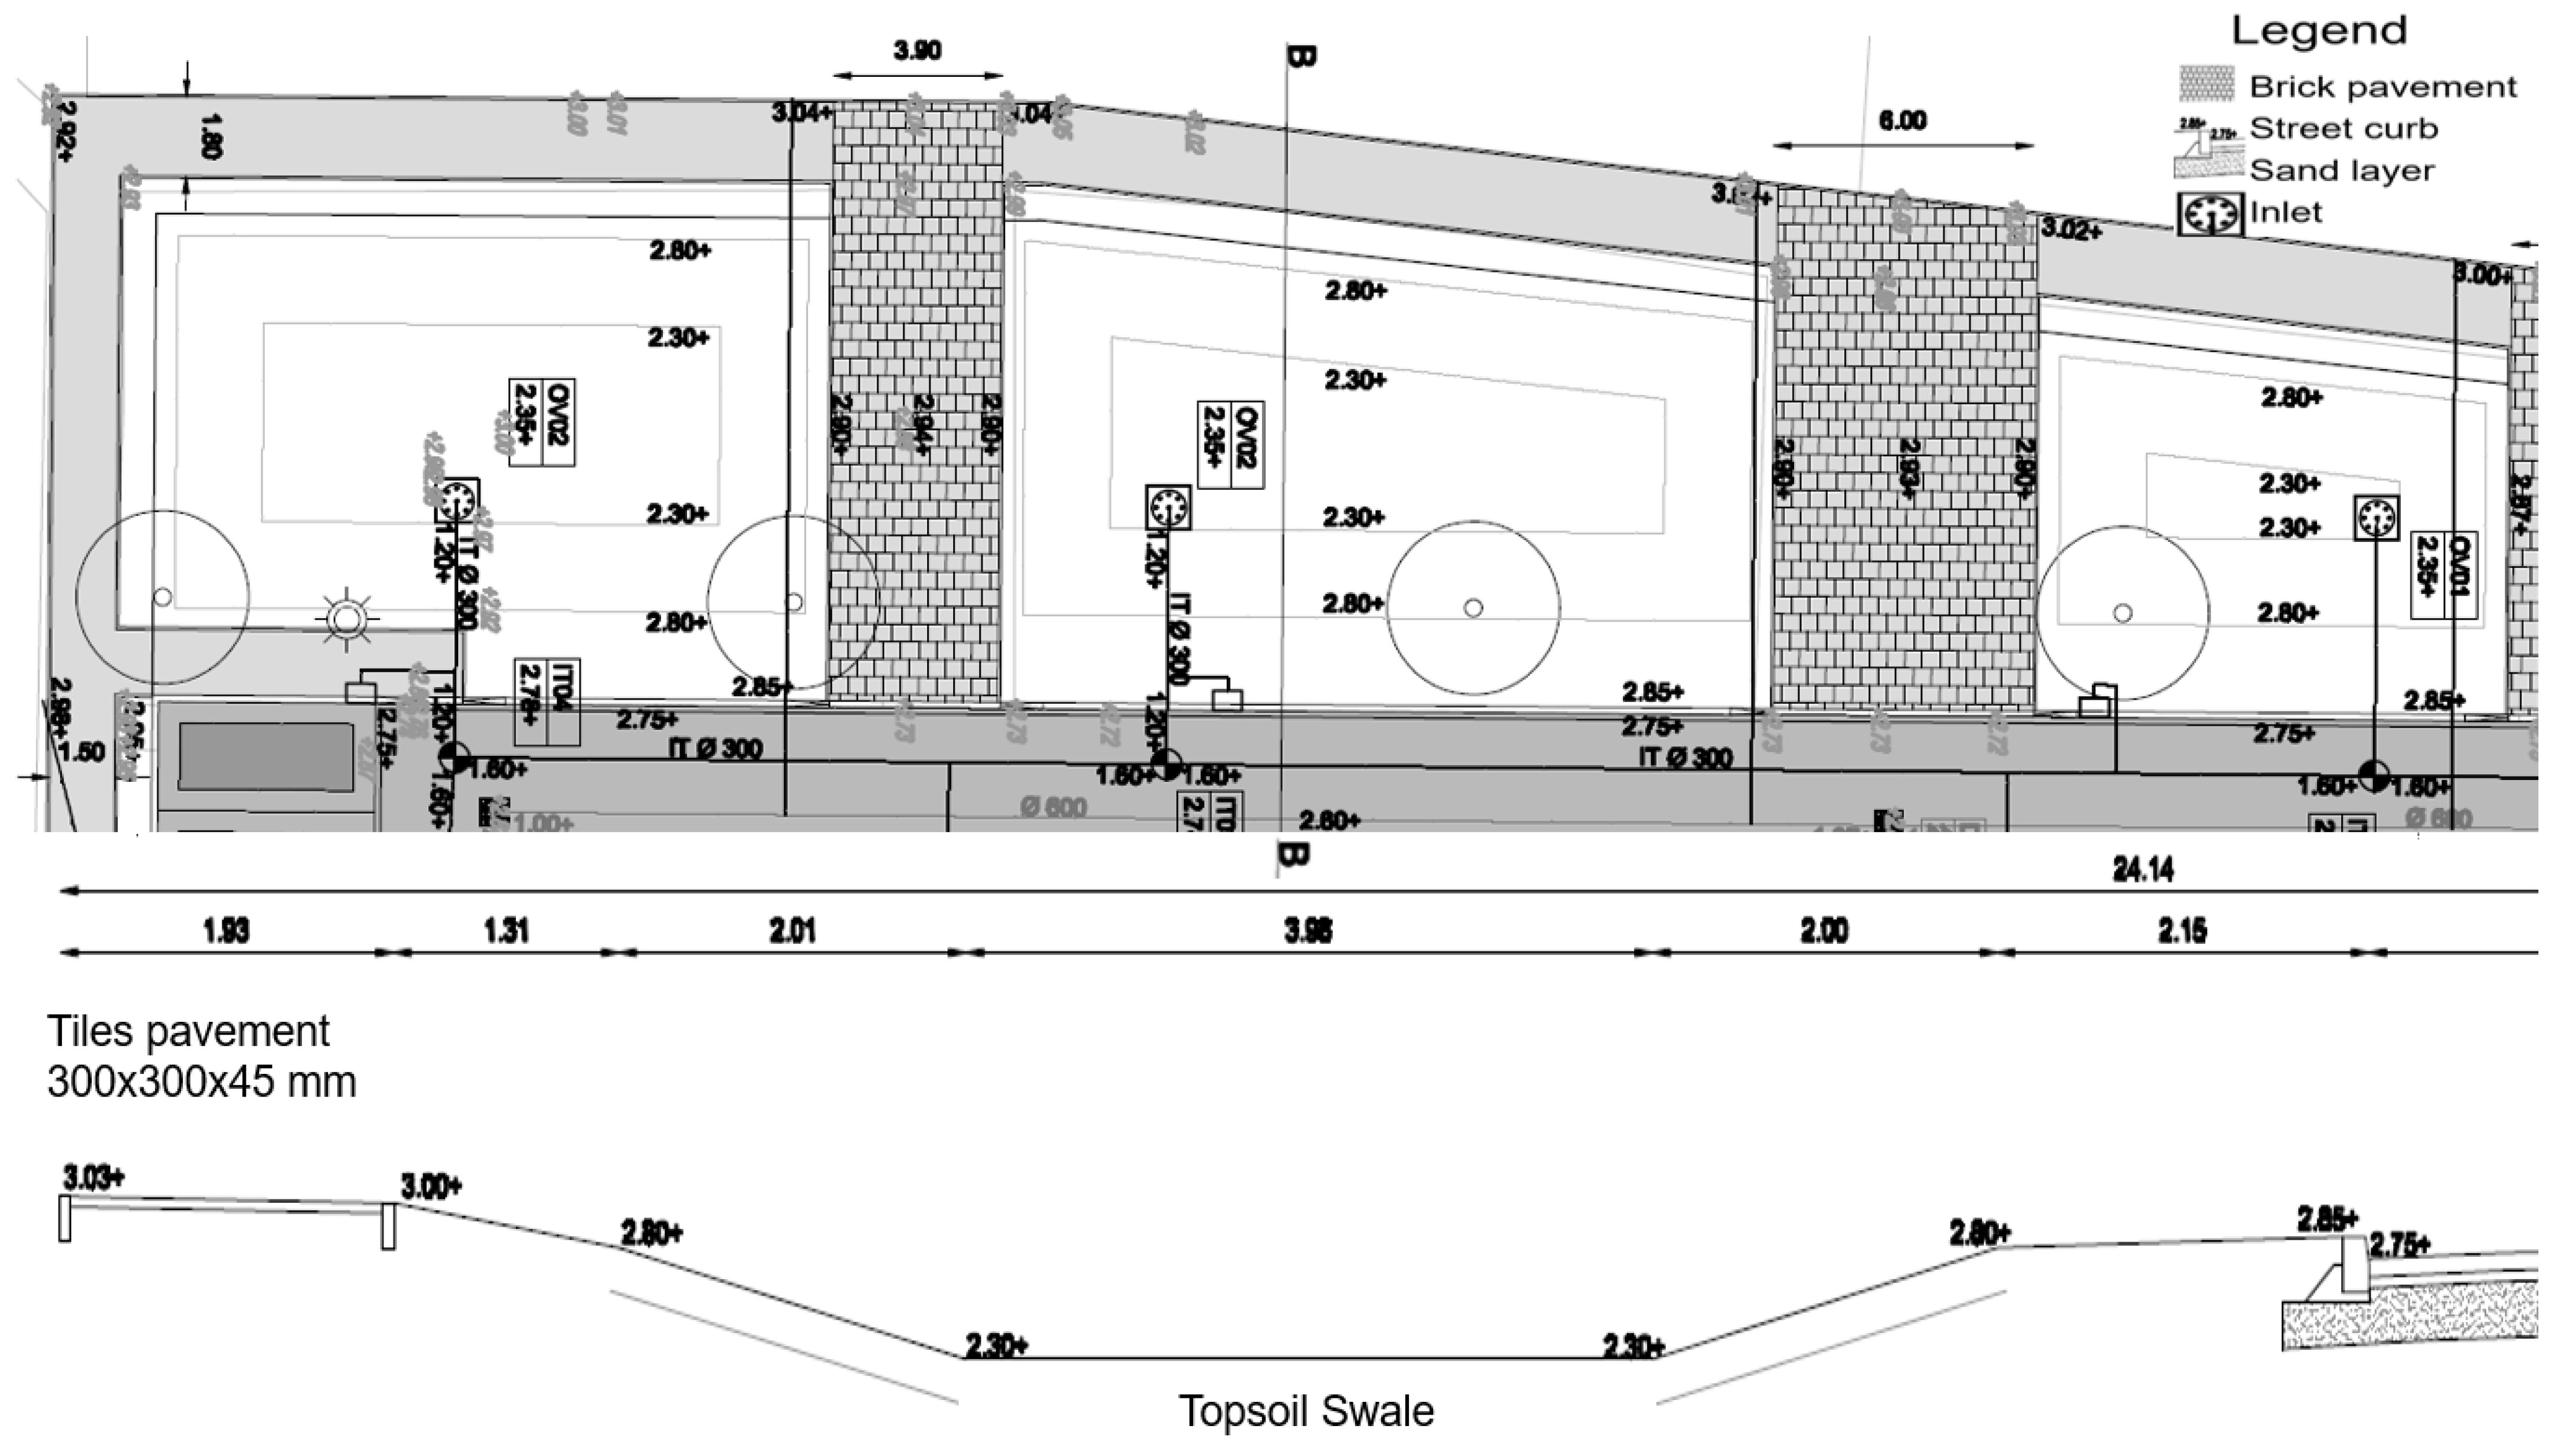
The dimensions of the swales are presented in Figure 5. All swales have a maximum depth of 50 cm to street level. Swales 1 and 2 are similar (both an average storage volume 7.6 m3 up to the overflow level of appr. 10 cm height); swale 3 is smaller (storage volume 1.7 m3 up to the overflow level).
2. Materials and Methods
For the case study Dalfsen, a full-scale infiltration test was used [19] where the total volume of the swales was submerged (simulating high intensive rainfall) and the emptying time was measured by several measurements during regular and extreme drought conditions during 2018 (7 weeks of drought). A number of issues were considered using the full-scale test method in the municipality Dalfsen:
- Selection swale for testing;
- Water supply alternatives;
- Accurate determination of surface infiltration rate.
- (1)
- The swales in the municipality of Dalfsen are a unique research location as the three swales are situated next to each other and were all built by the same contractor and with the same materials in 2010, under the same geo-hydraulic conditions. All swales have a confined space which can be filled by a tank truck up to the water level of outflow, without any additional constructions to prevent water leaving the swale during the full-scale infiltration test.
- (2)
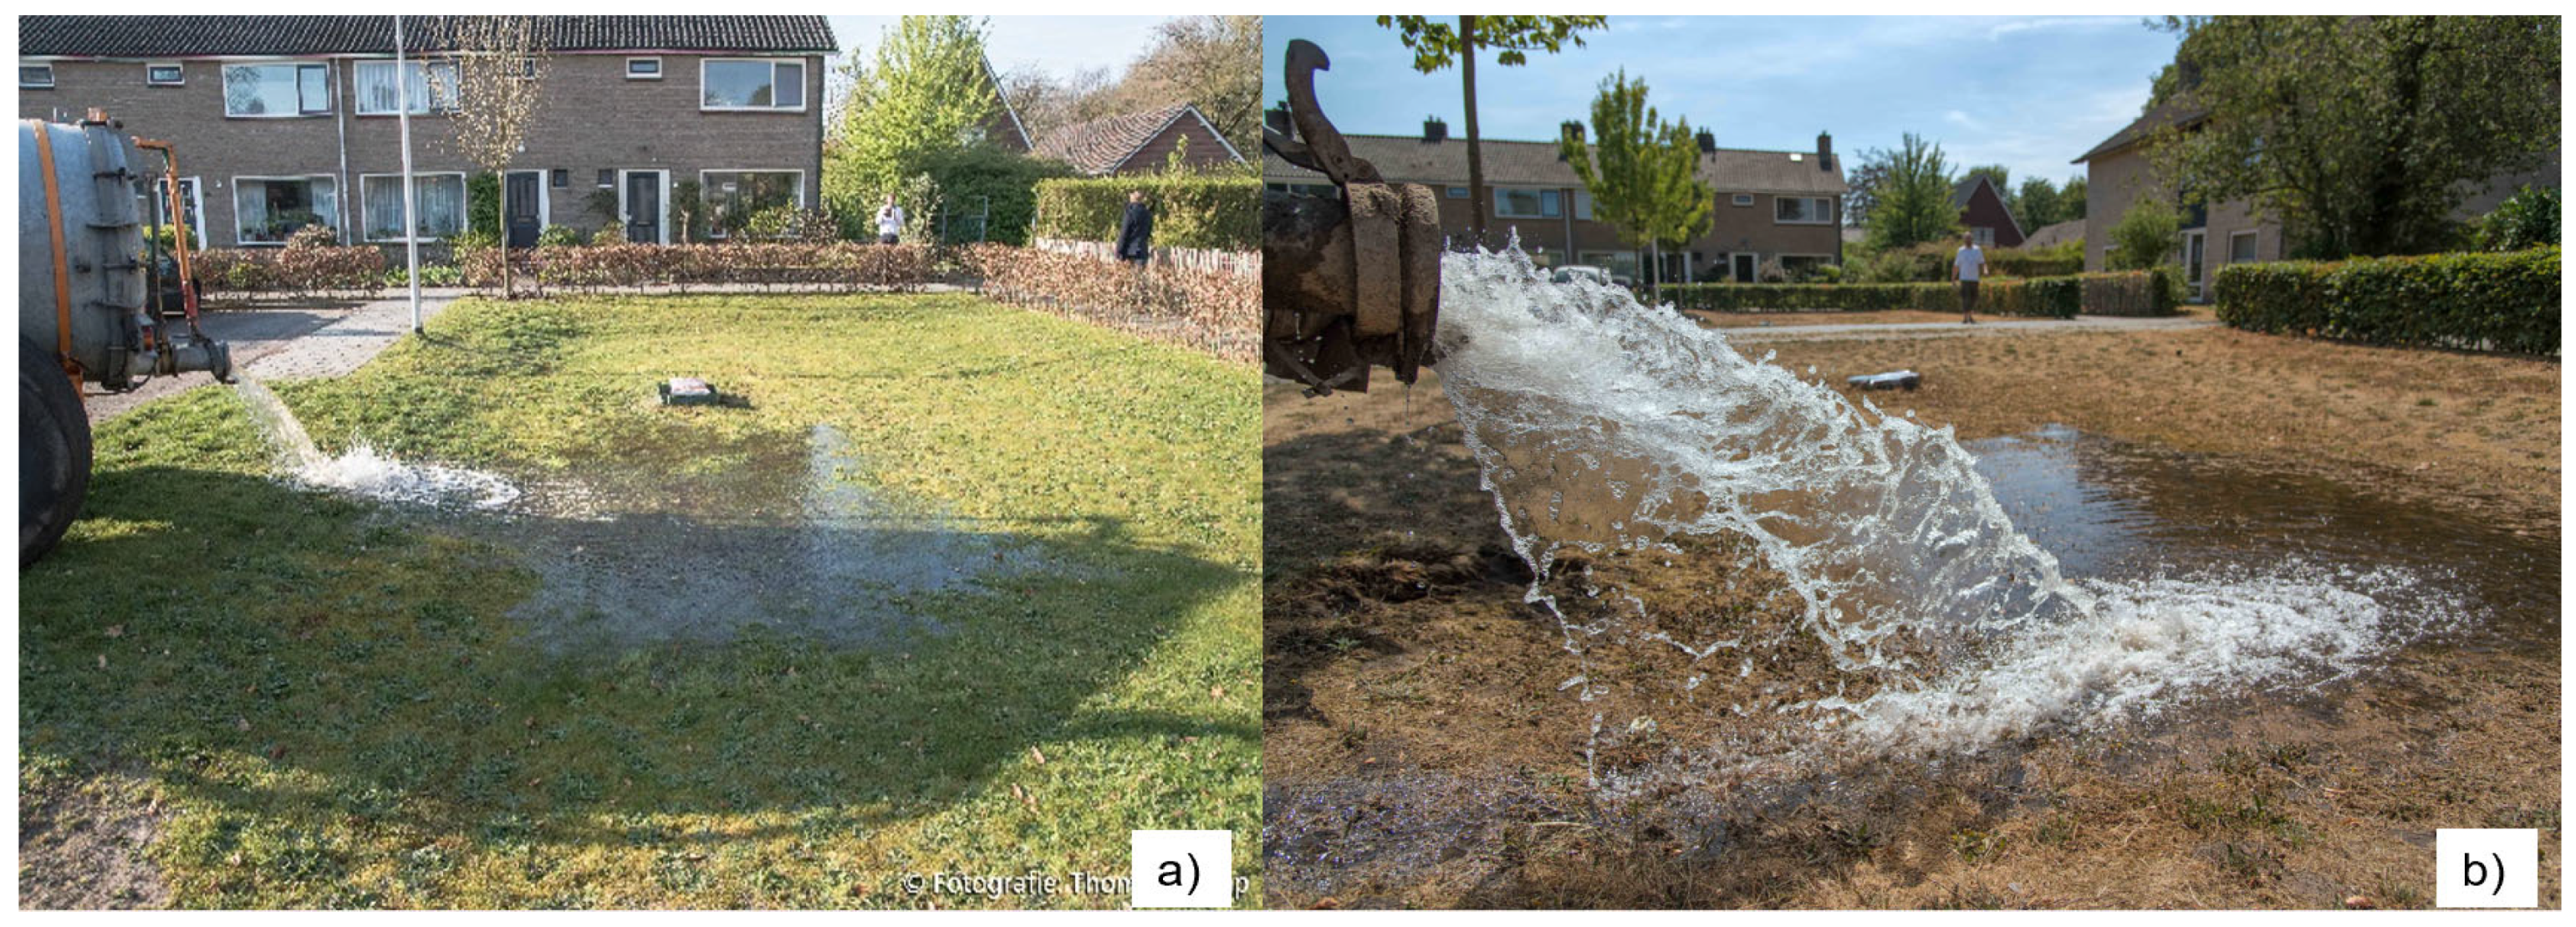
- For this full-scale infiltration test in Dalfsen, a tanktruck was used with a larger storage volume of 10 m3 than the volume of the swales (swale 1 and 2 have a storage volume of 8 m3 up till the overflow level of 10 cm), so every individual swale was filled with water continuously with the tanktruck (Figure 6 and Figure 7). The time interval between refilling the swales was within 10 min.
- (3)
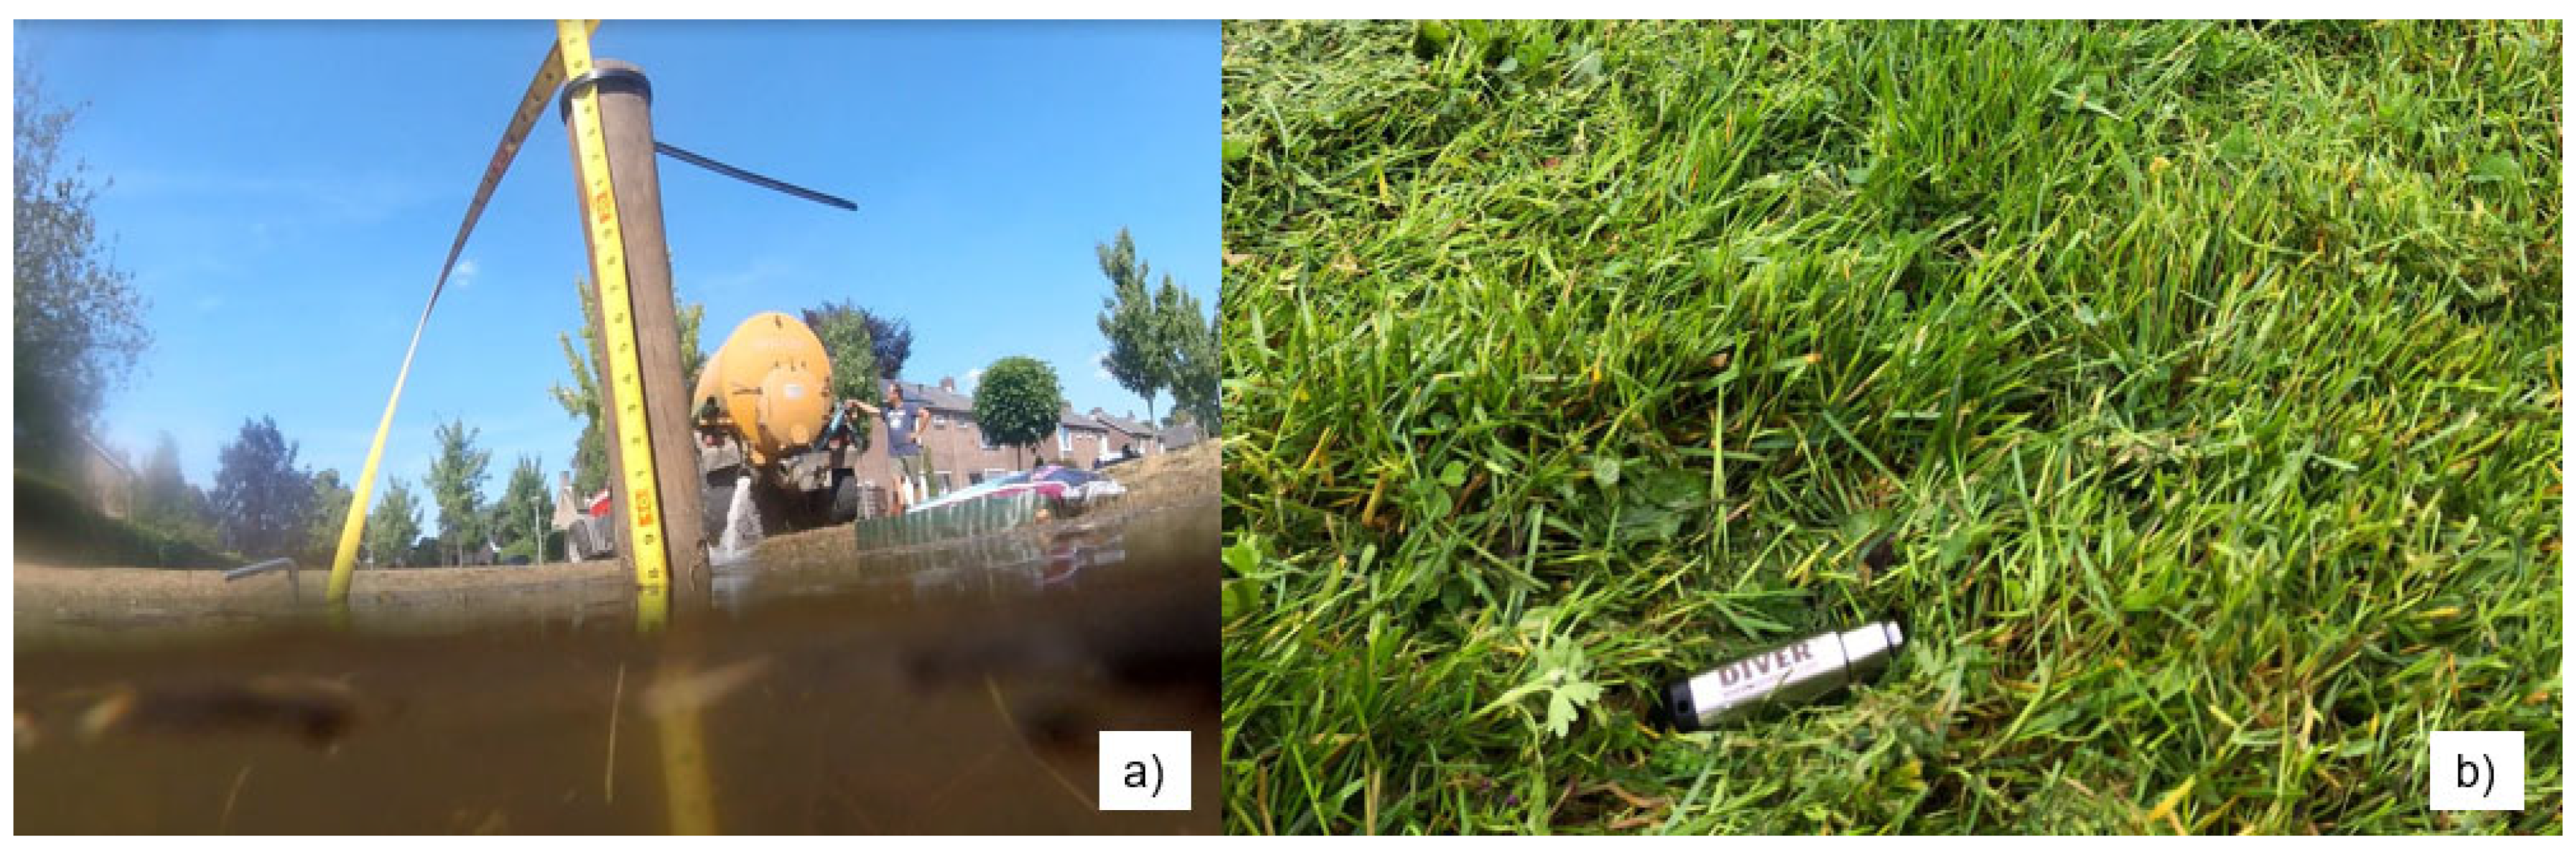
- Wireless, self-logging, pressure transducer loggers (Minidiver. Available online: https://www.eijkelkamp.com/producten/sensors-monitoring_nl/ (accessed on 1 January 2022)) were used in the study as the primary method of measuring and recording the reduction in water levels over time. Two loggers were installed at the lowest points of the swale. The transducers continuously monitored the static water pressures at those locations, logging the data in internal memory. Three different measurement methods were used in conjunction with the pressure transducers in order to verify the transducer readings, as shown in Figure 7. The three methods were: hand measurements, underwater camera (Figure 7) and time-lapse photography (movies available at ClimateScan. Available online: https://www.climatescan.nl/projects/1114/detail (accessed on 1 January 2022)).
3. Results and Discussion
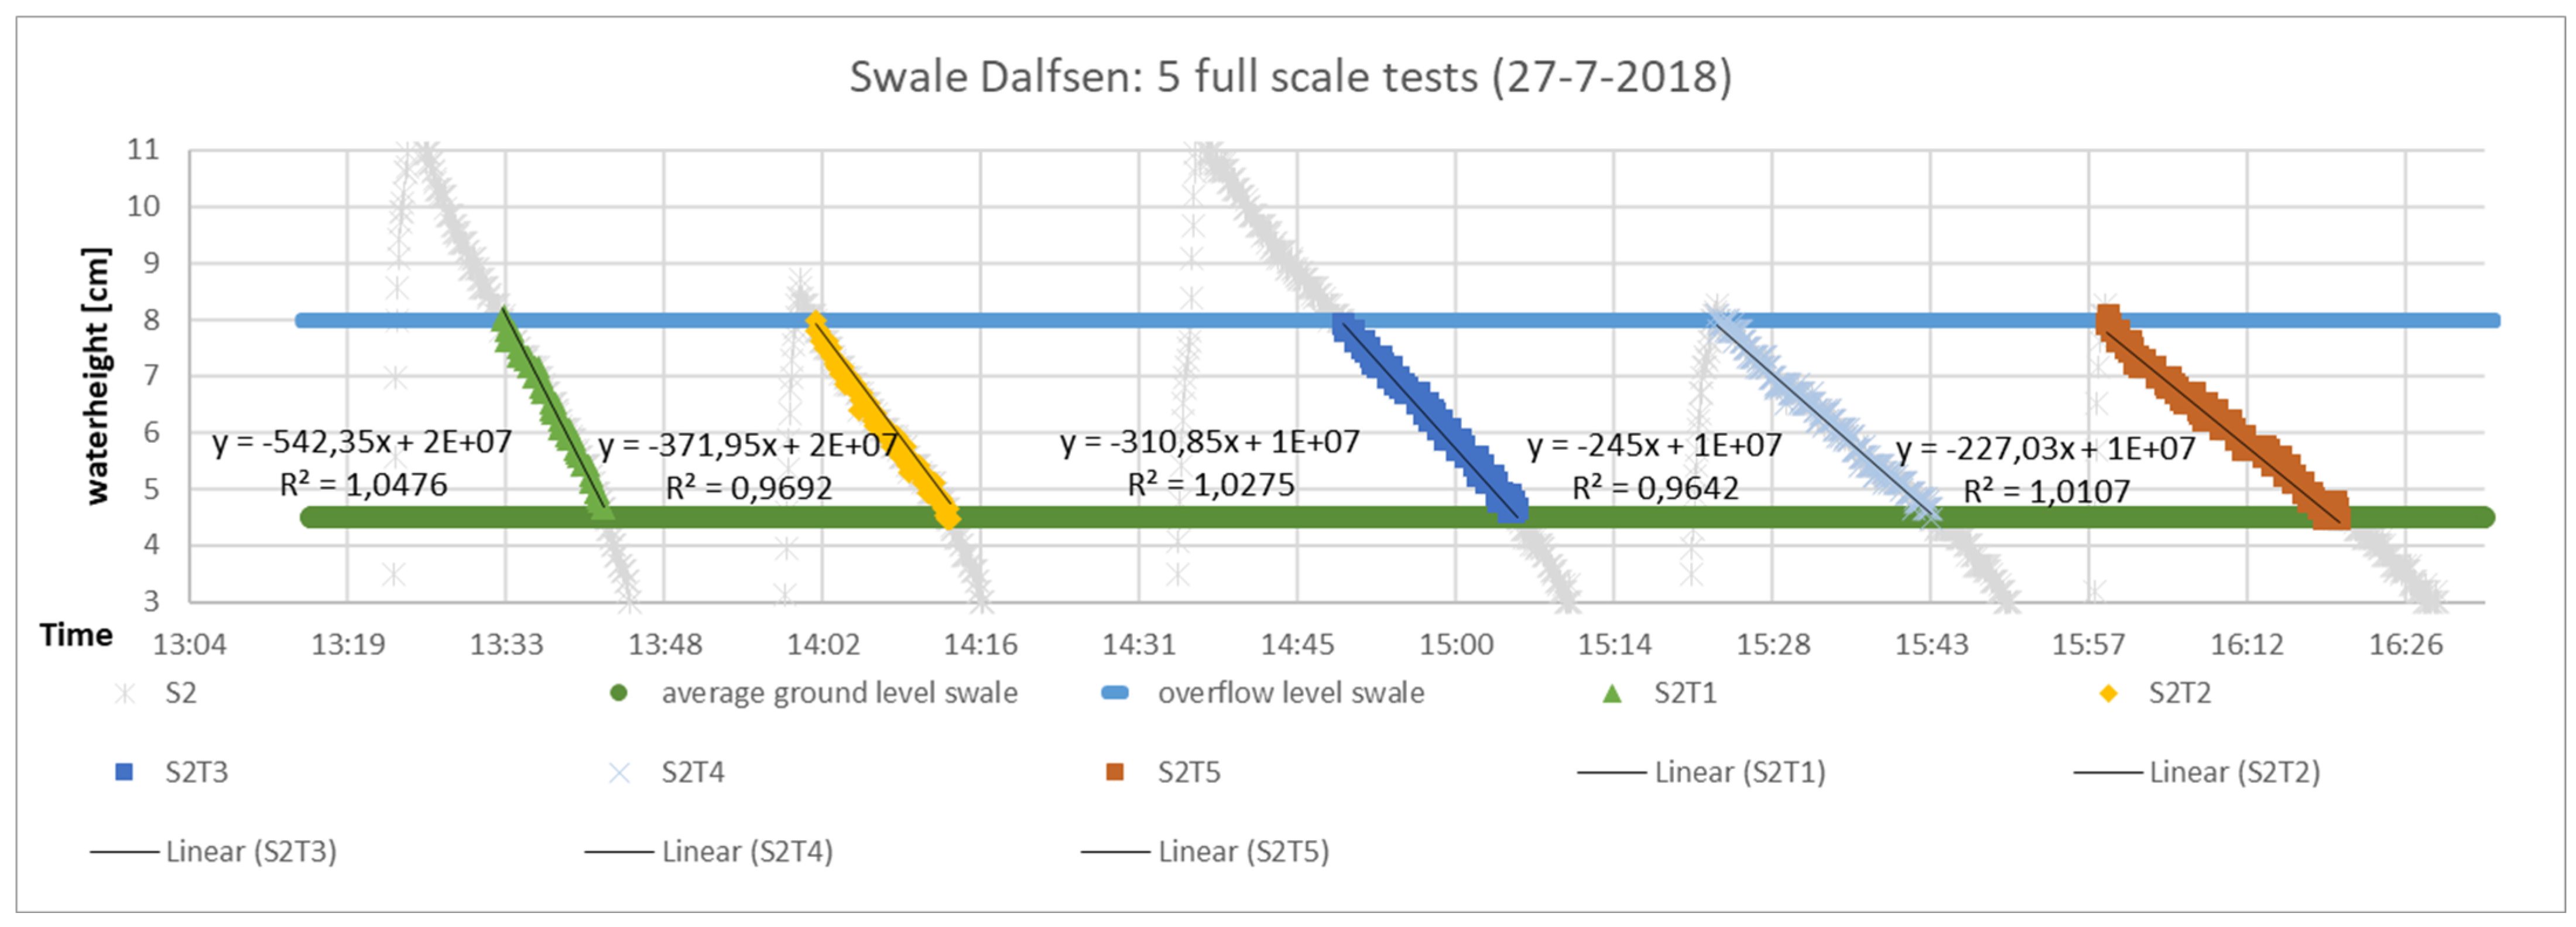
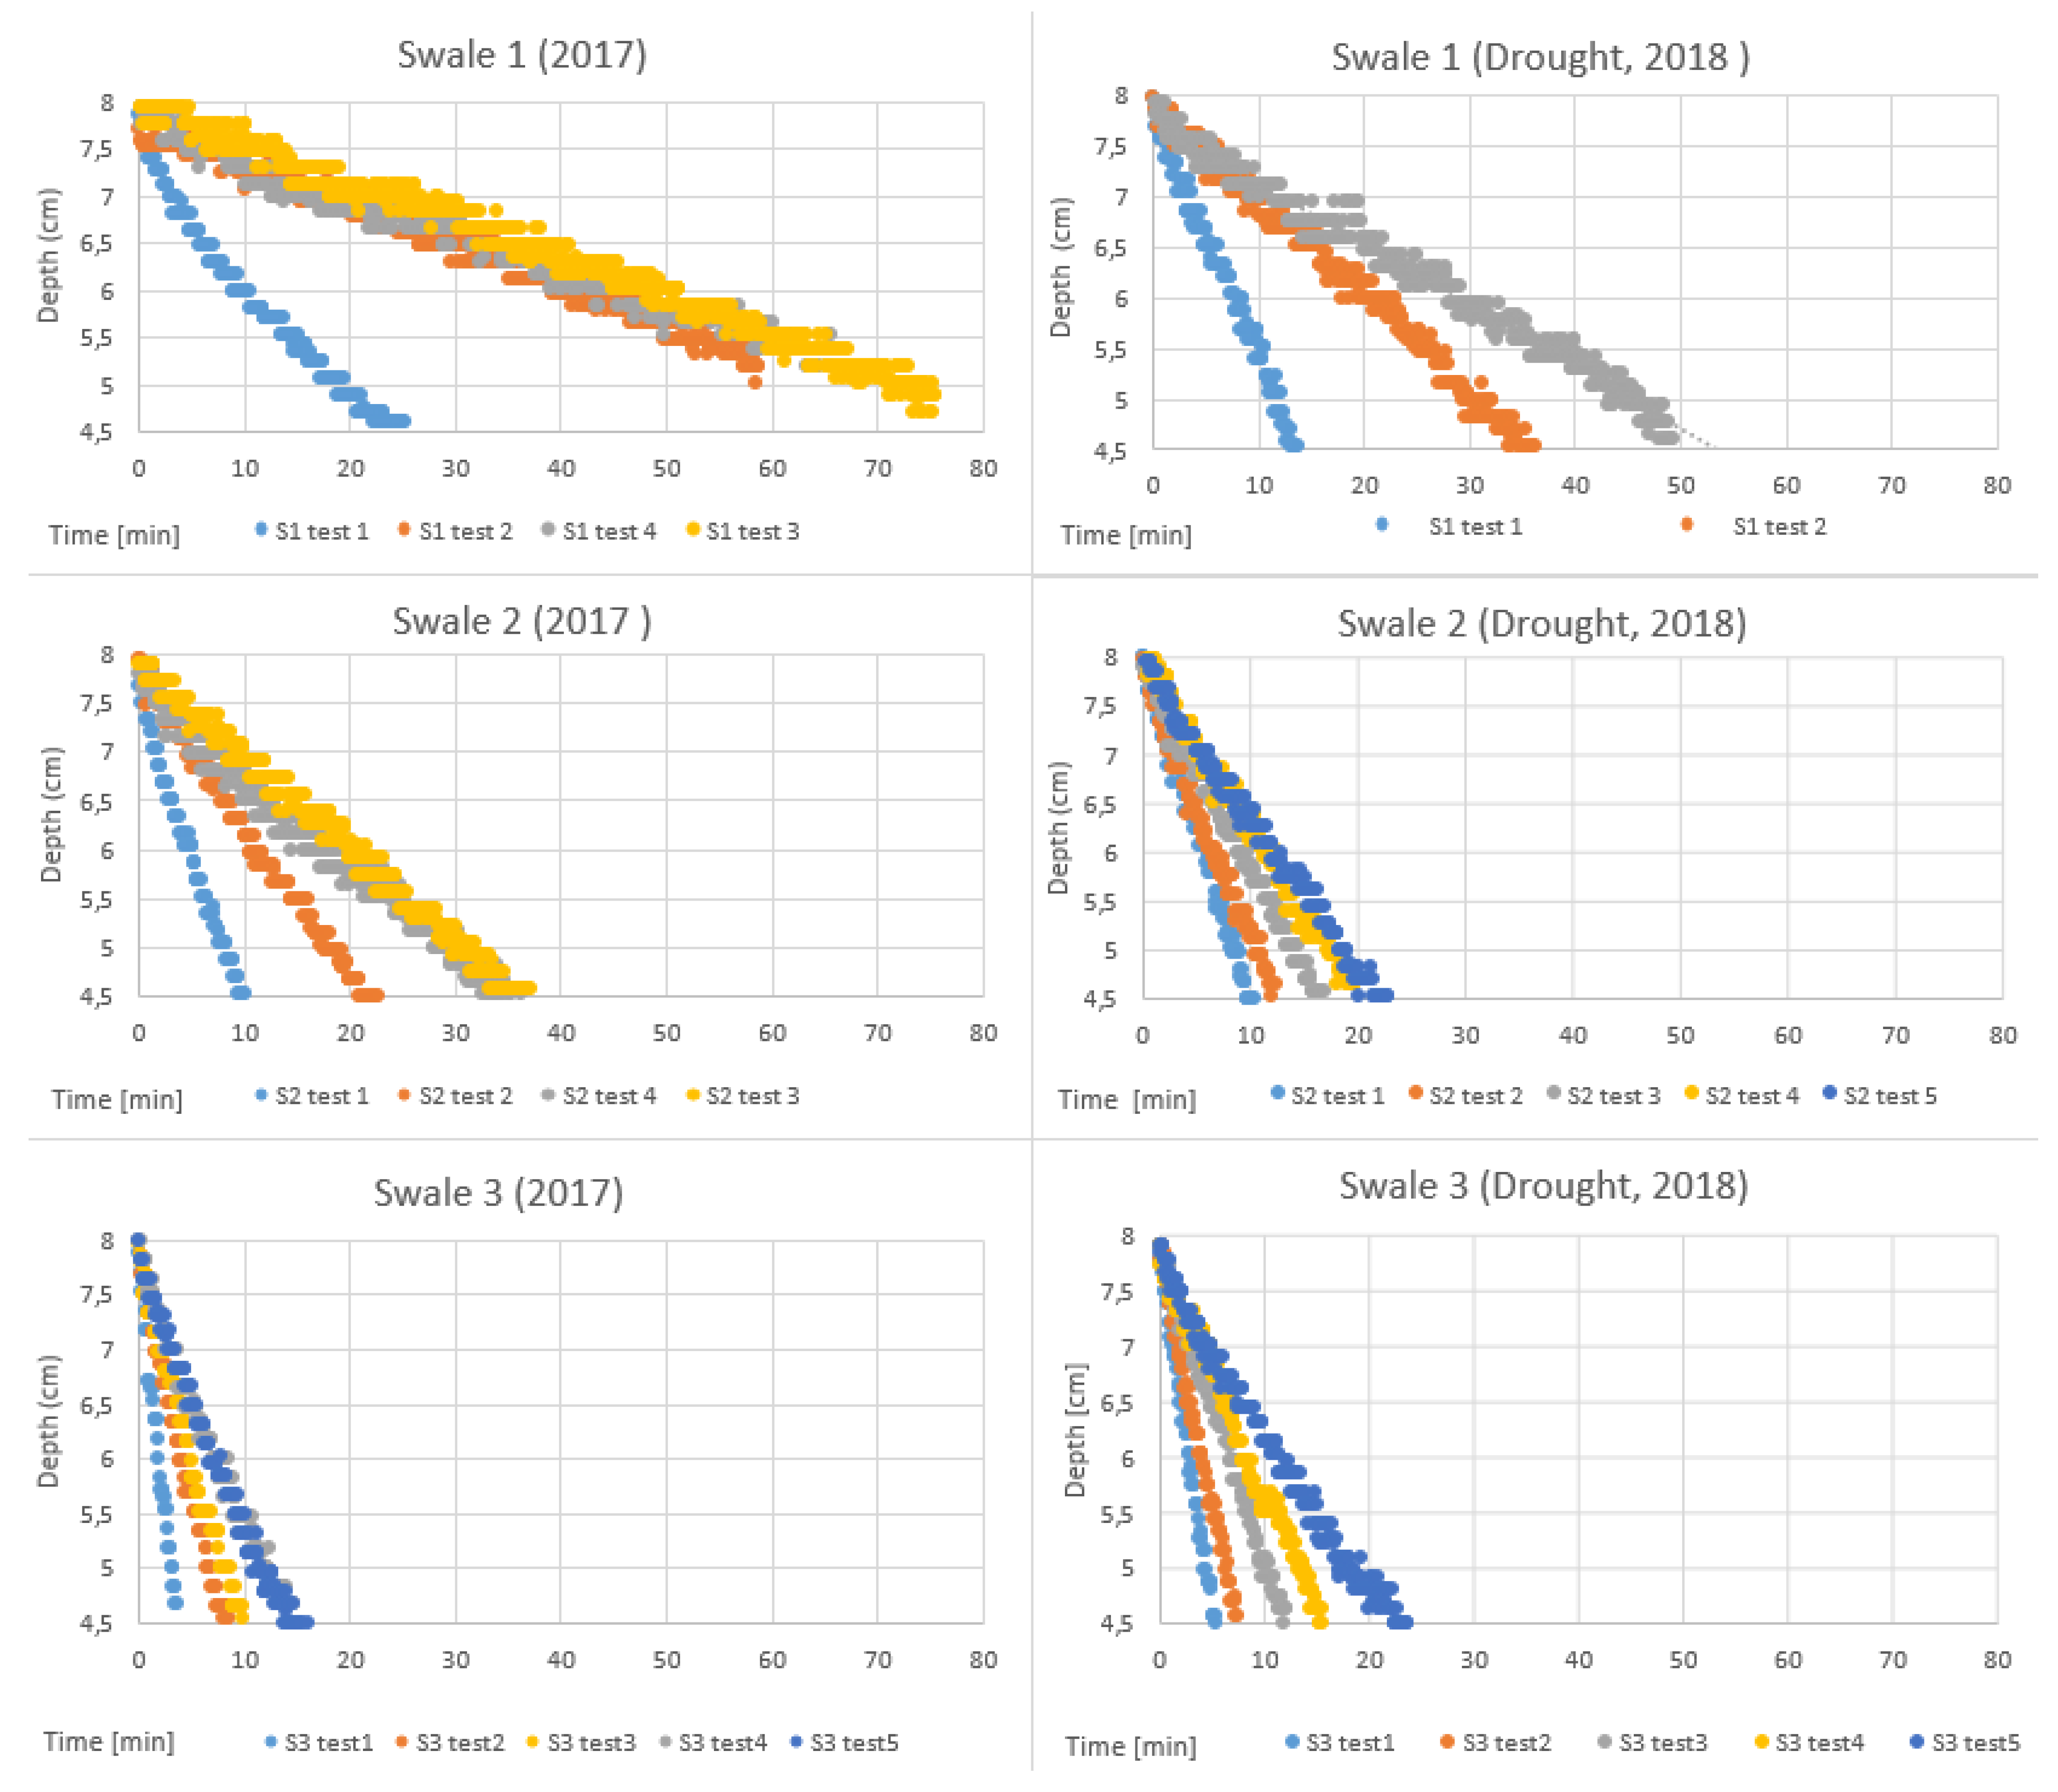
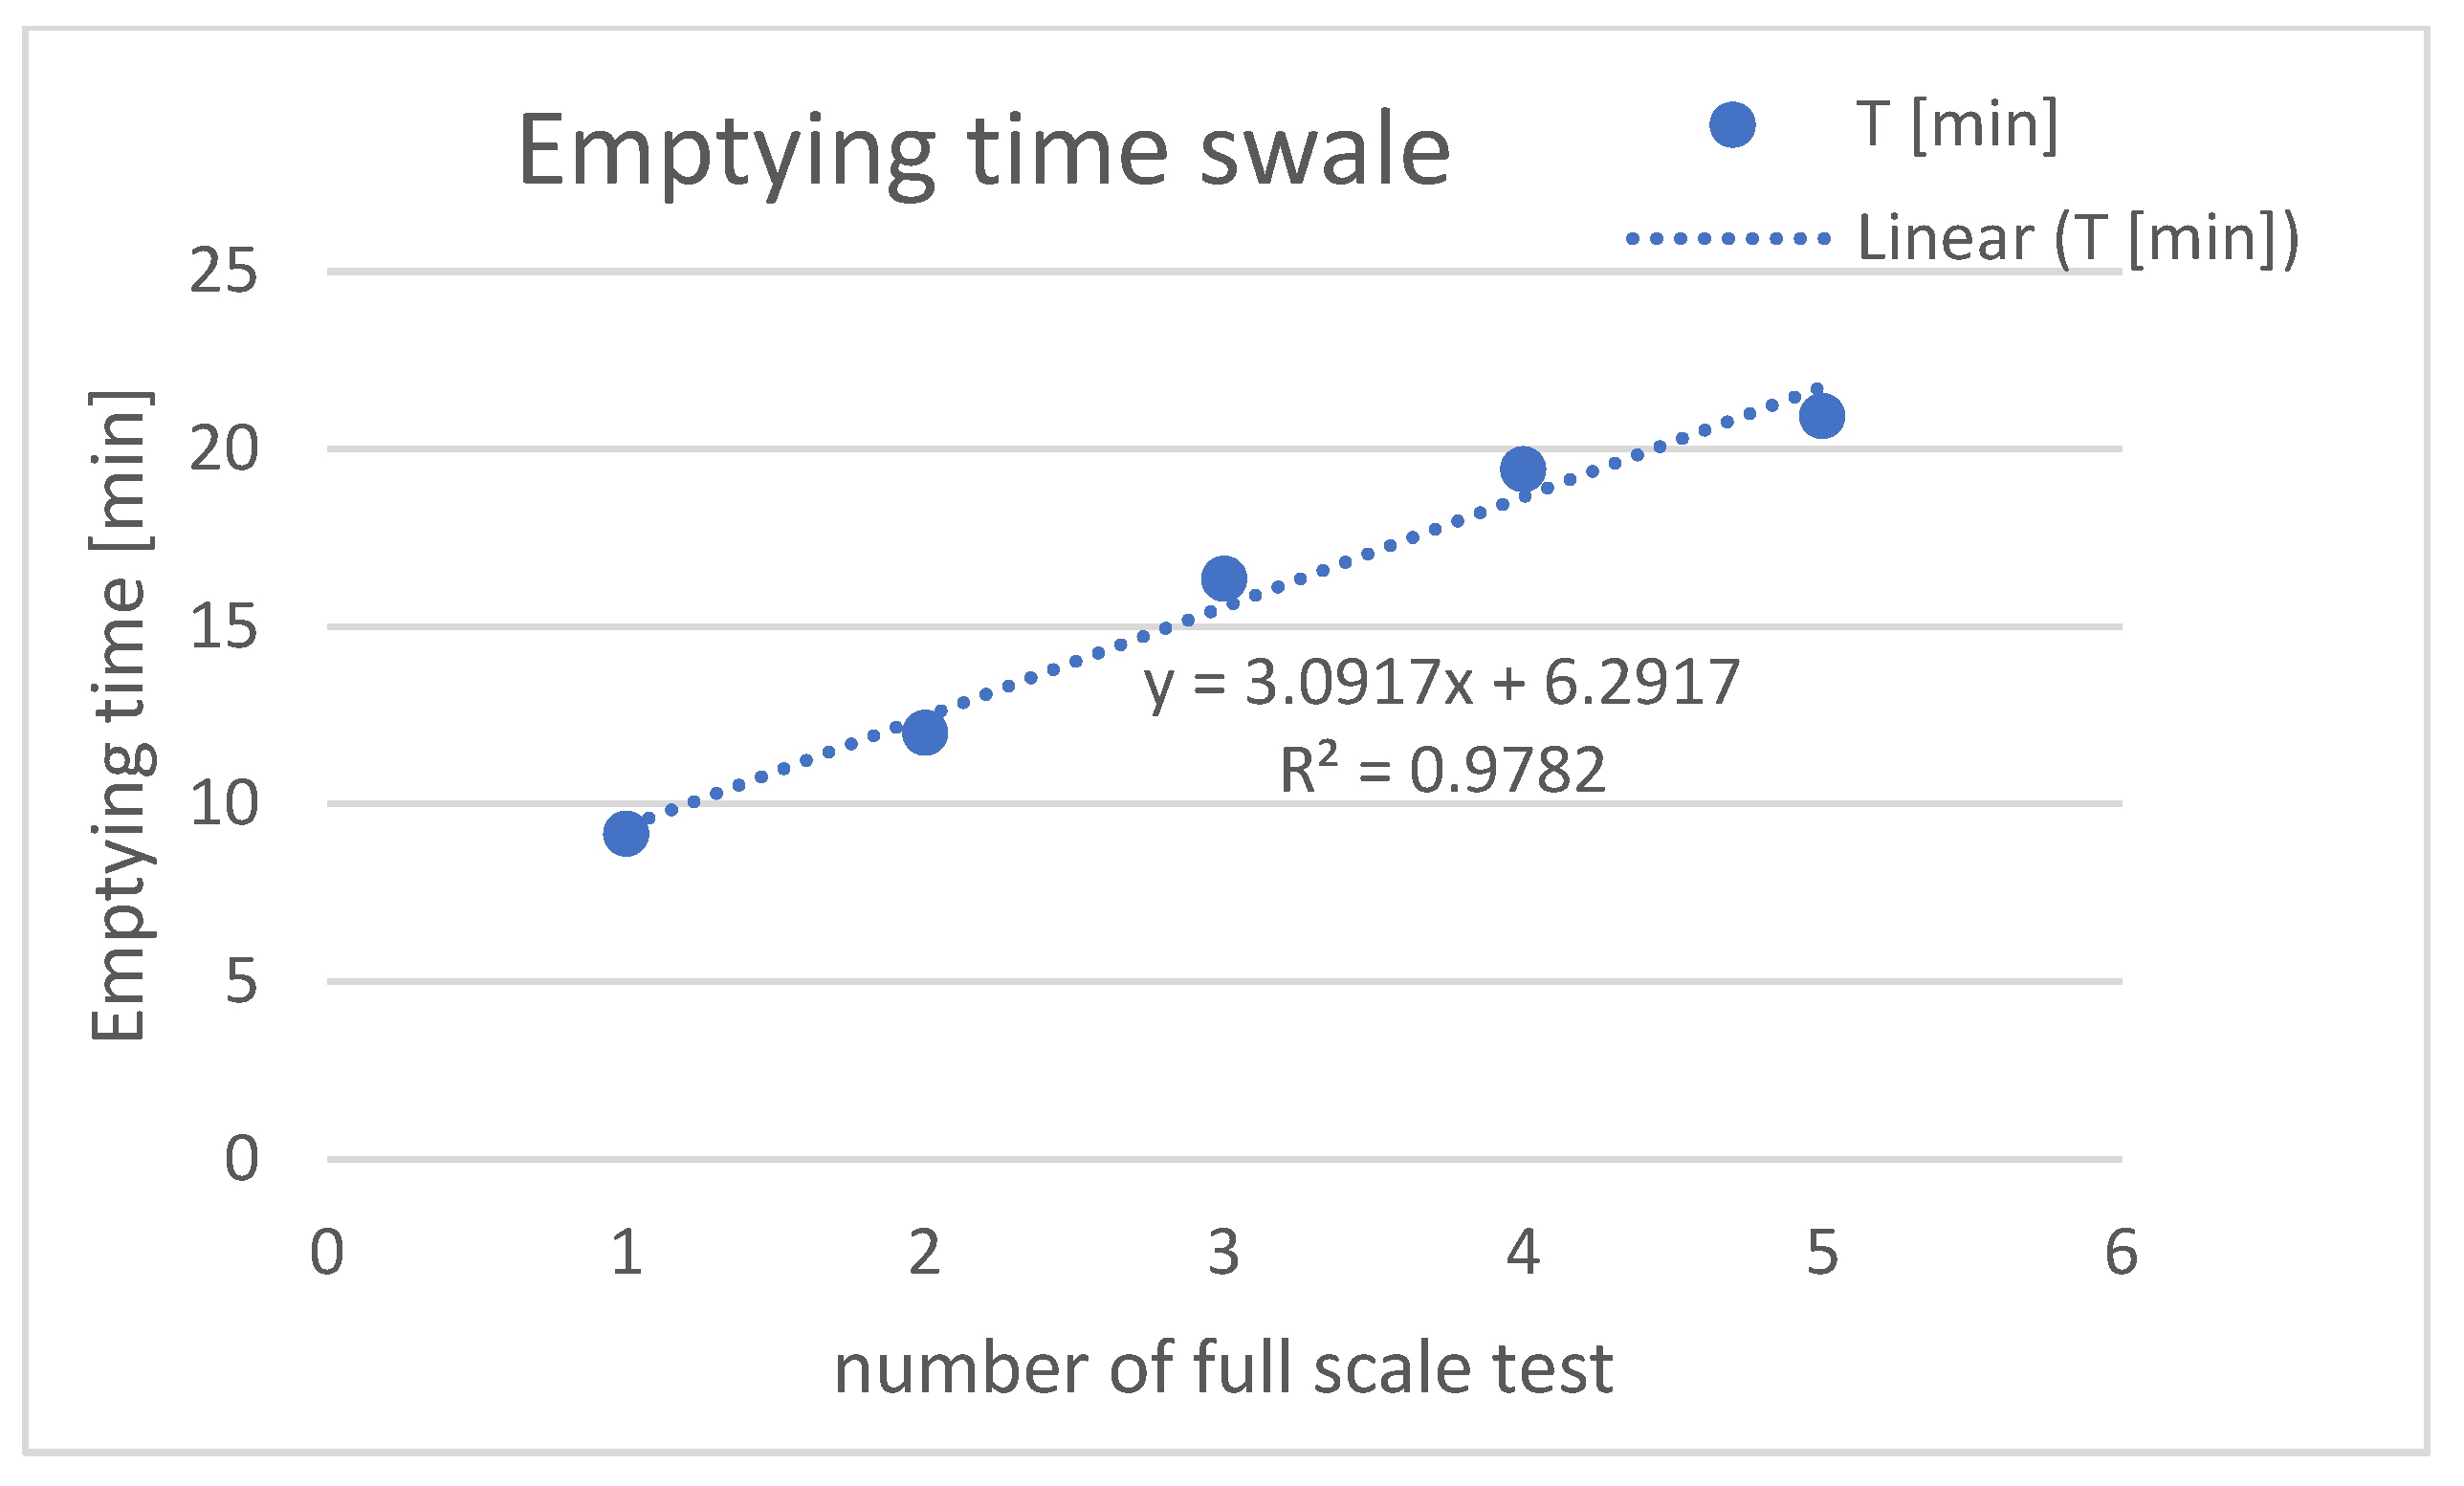
Three swales were tested repeatedly with the full-scale infiltration tests on two occasions under different (simulated) weather conditions. The results show the linear emptying curves of the three swales in Dalfsen (Figure 8 and Figure 9). The number of tests at individual swales depended on the duration of each test and the availability of the tanktruck as the water source. Swale 2 could be tested with a maximum of five full-scale tests (Figure 8). For comparative reasons, all graphs display the measuring interval 8 to 4.5 cm of the water column; 8 cm is the height just below the outlet, thereby ruling out any error due to leakage in the data (Figure 8). Below 4.5 cm the infiltration surface of the swale was not regular, with the water being just above the “bumpy” bottom of the swale, allowing water to flow horizontally from a small puddle to puddle. By truncating the data, any subsurface flow due to depressions effecting the emptying curve was ruled out (Figure 8 and Figure 9).
The maximum standard deviation of the pressure transducer loggers is in the range of +/−0.5 cm, which is reflected in the thickness of the lines in Figure 9. All the emptying curves for the three swales under normal conditions show similar patterns; rapid emptying time with steep linear curves for the first infiltration test and gradually increasing in time with lower infiltration rates (Figure 9).
Figure 9 shows a high variation in the infiltration rates of the swales. Simple linear regression analysis was used to generate lines of best fit for the transducer readings from each swale. A factor 7 difference in initial infiltration rate between swale 1 and 3 can be observed in 2017 (factor 3 in 2018), while the design, construction and maintenance of the swales are the same. Repeating the infiltration test can lead to reduction in infiltration rates in the order of 50% (swale 2), Figure 10.
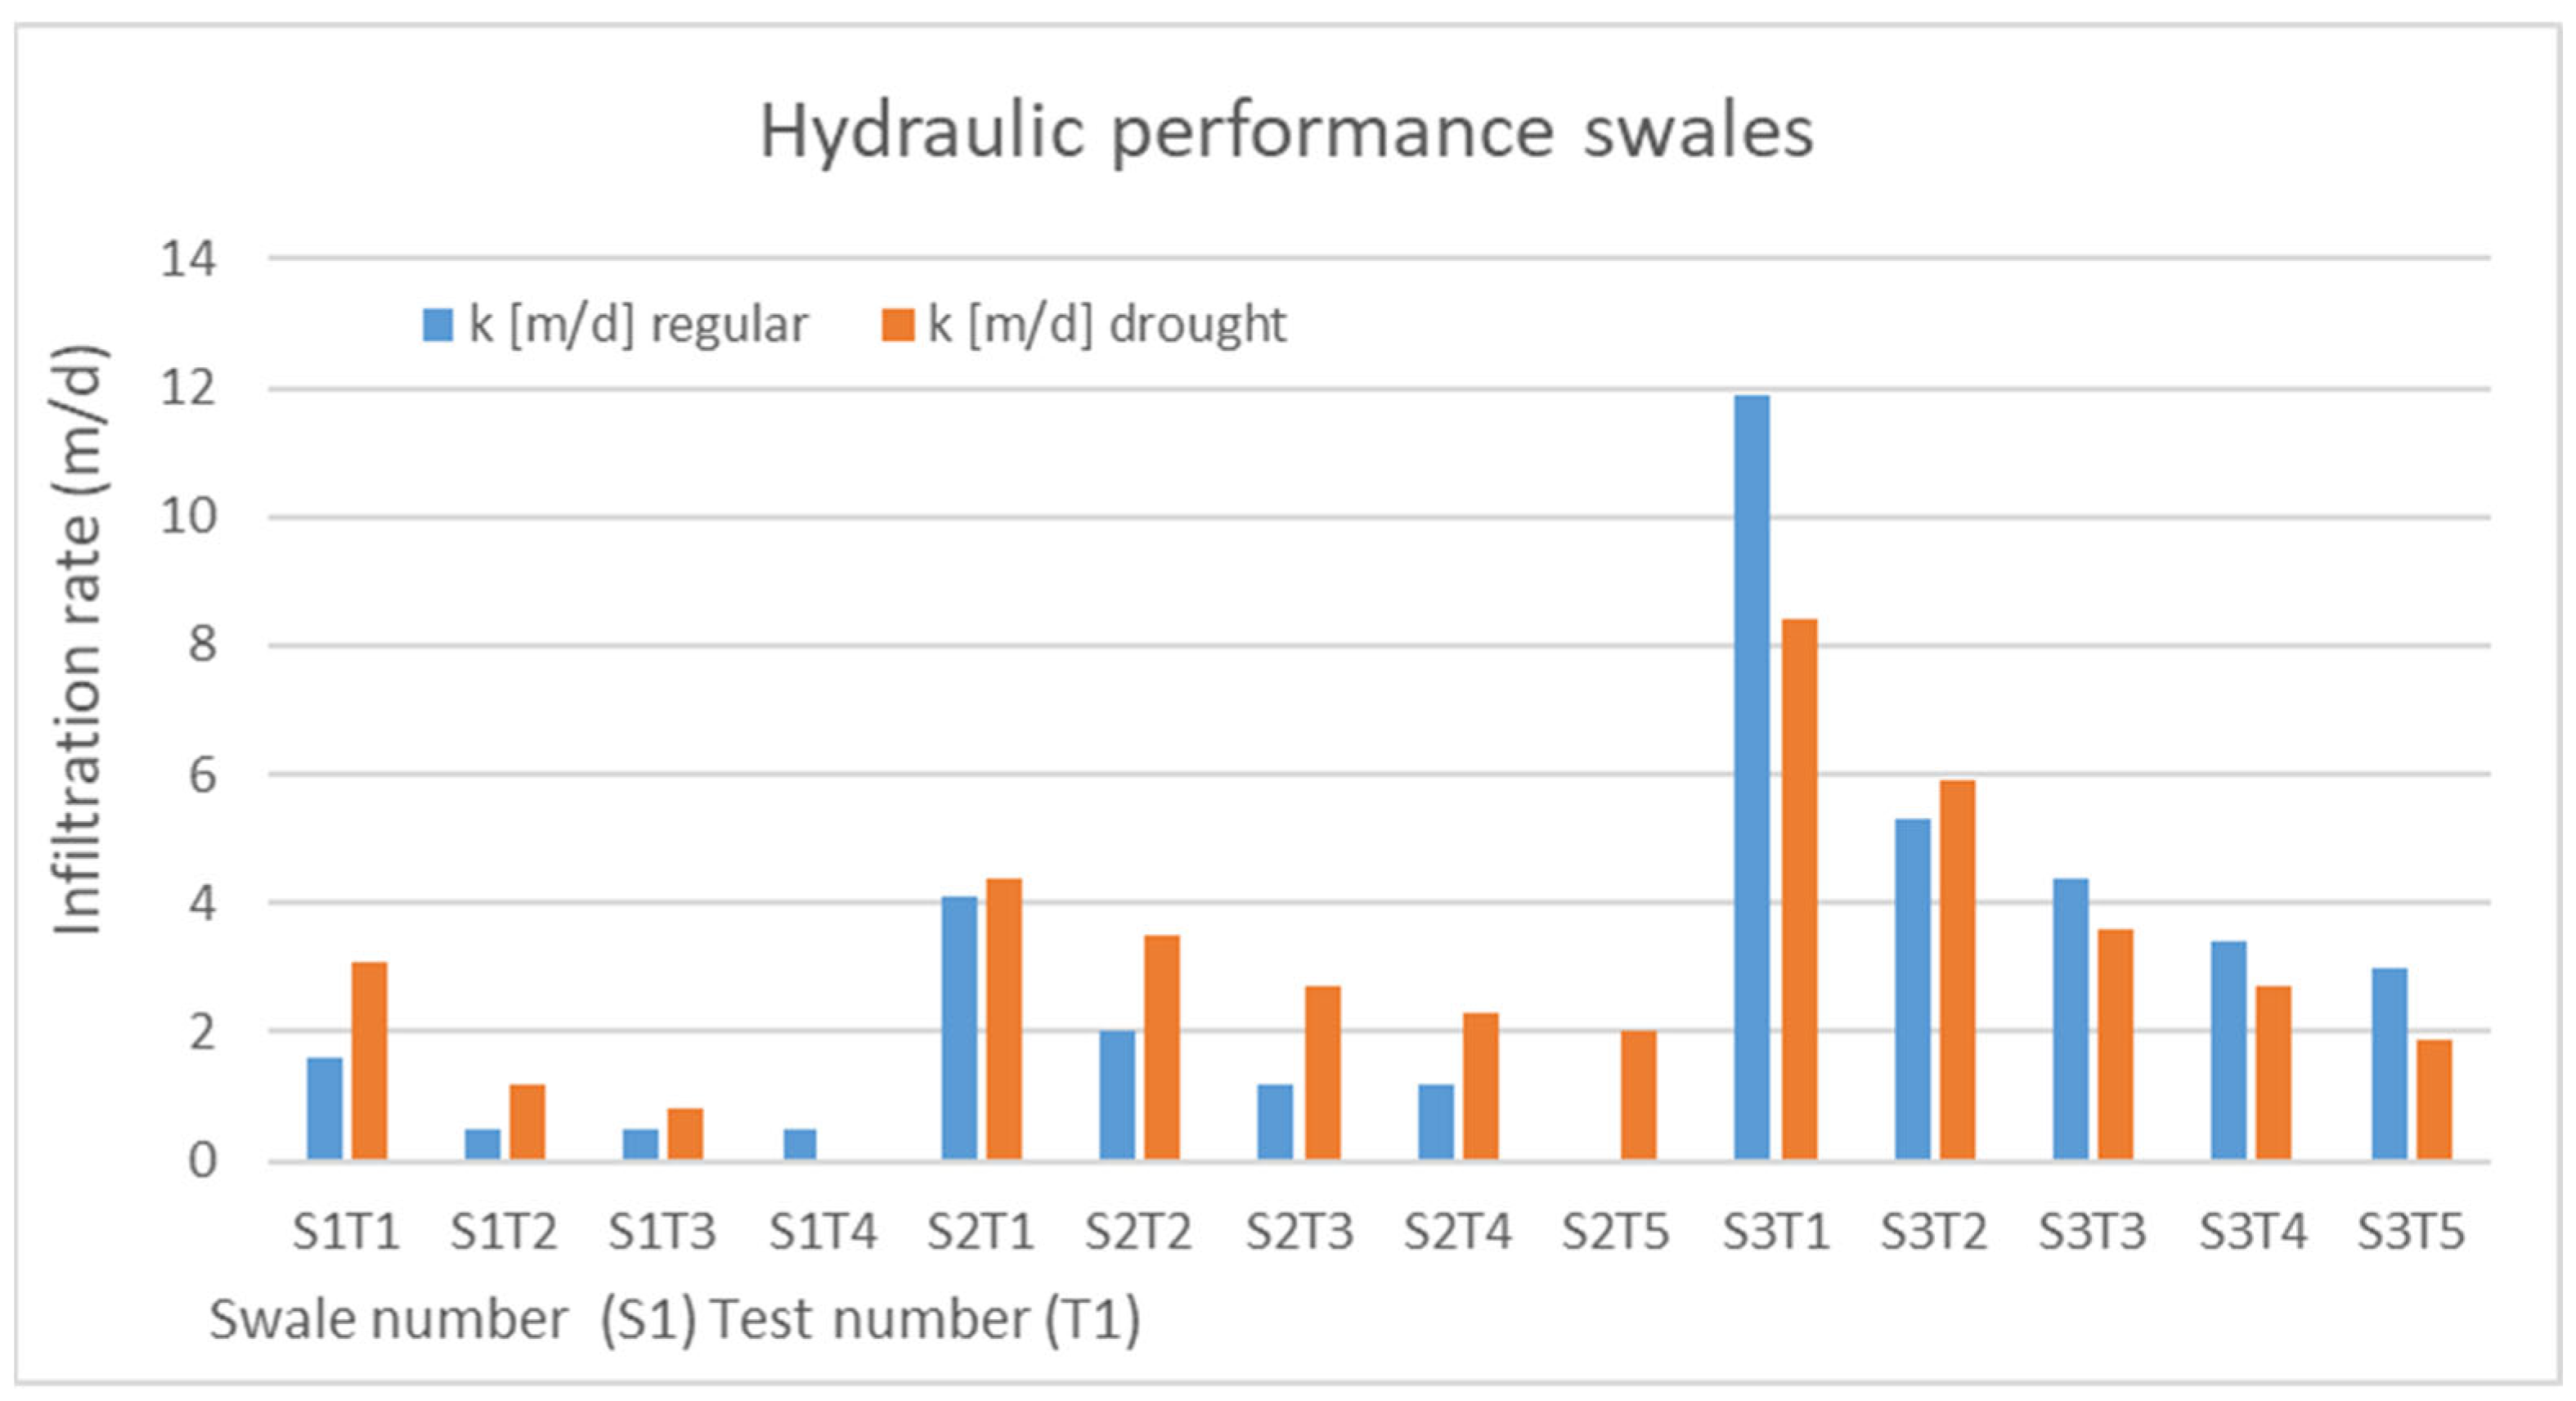
The equations of the linear regression lines were then used to calculate the average infiltration rate in m/d. Figure 11 shows the calculated infiltration rates of all tests. The infiltration rate after five tests of swale 3 in 2017 and 2018 was 25% of its initial infiltration capacity. After five tests, a saturated steady state infiltration rate was not yet reached.
In drought conditions, all swales did not reach the saturated steady state infiltration rate, even after five full-scale tests in contrast to swale 1 and 2 under regular circumstances in 2017. Swales 1 and 2 showed increased infiltration capacity during the drought period. The relatively small swale 3 (Figure 5) has a different pattern and the emptying time is lower in the drought situation.
4. Discussion
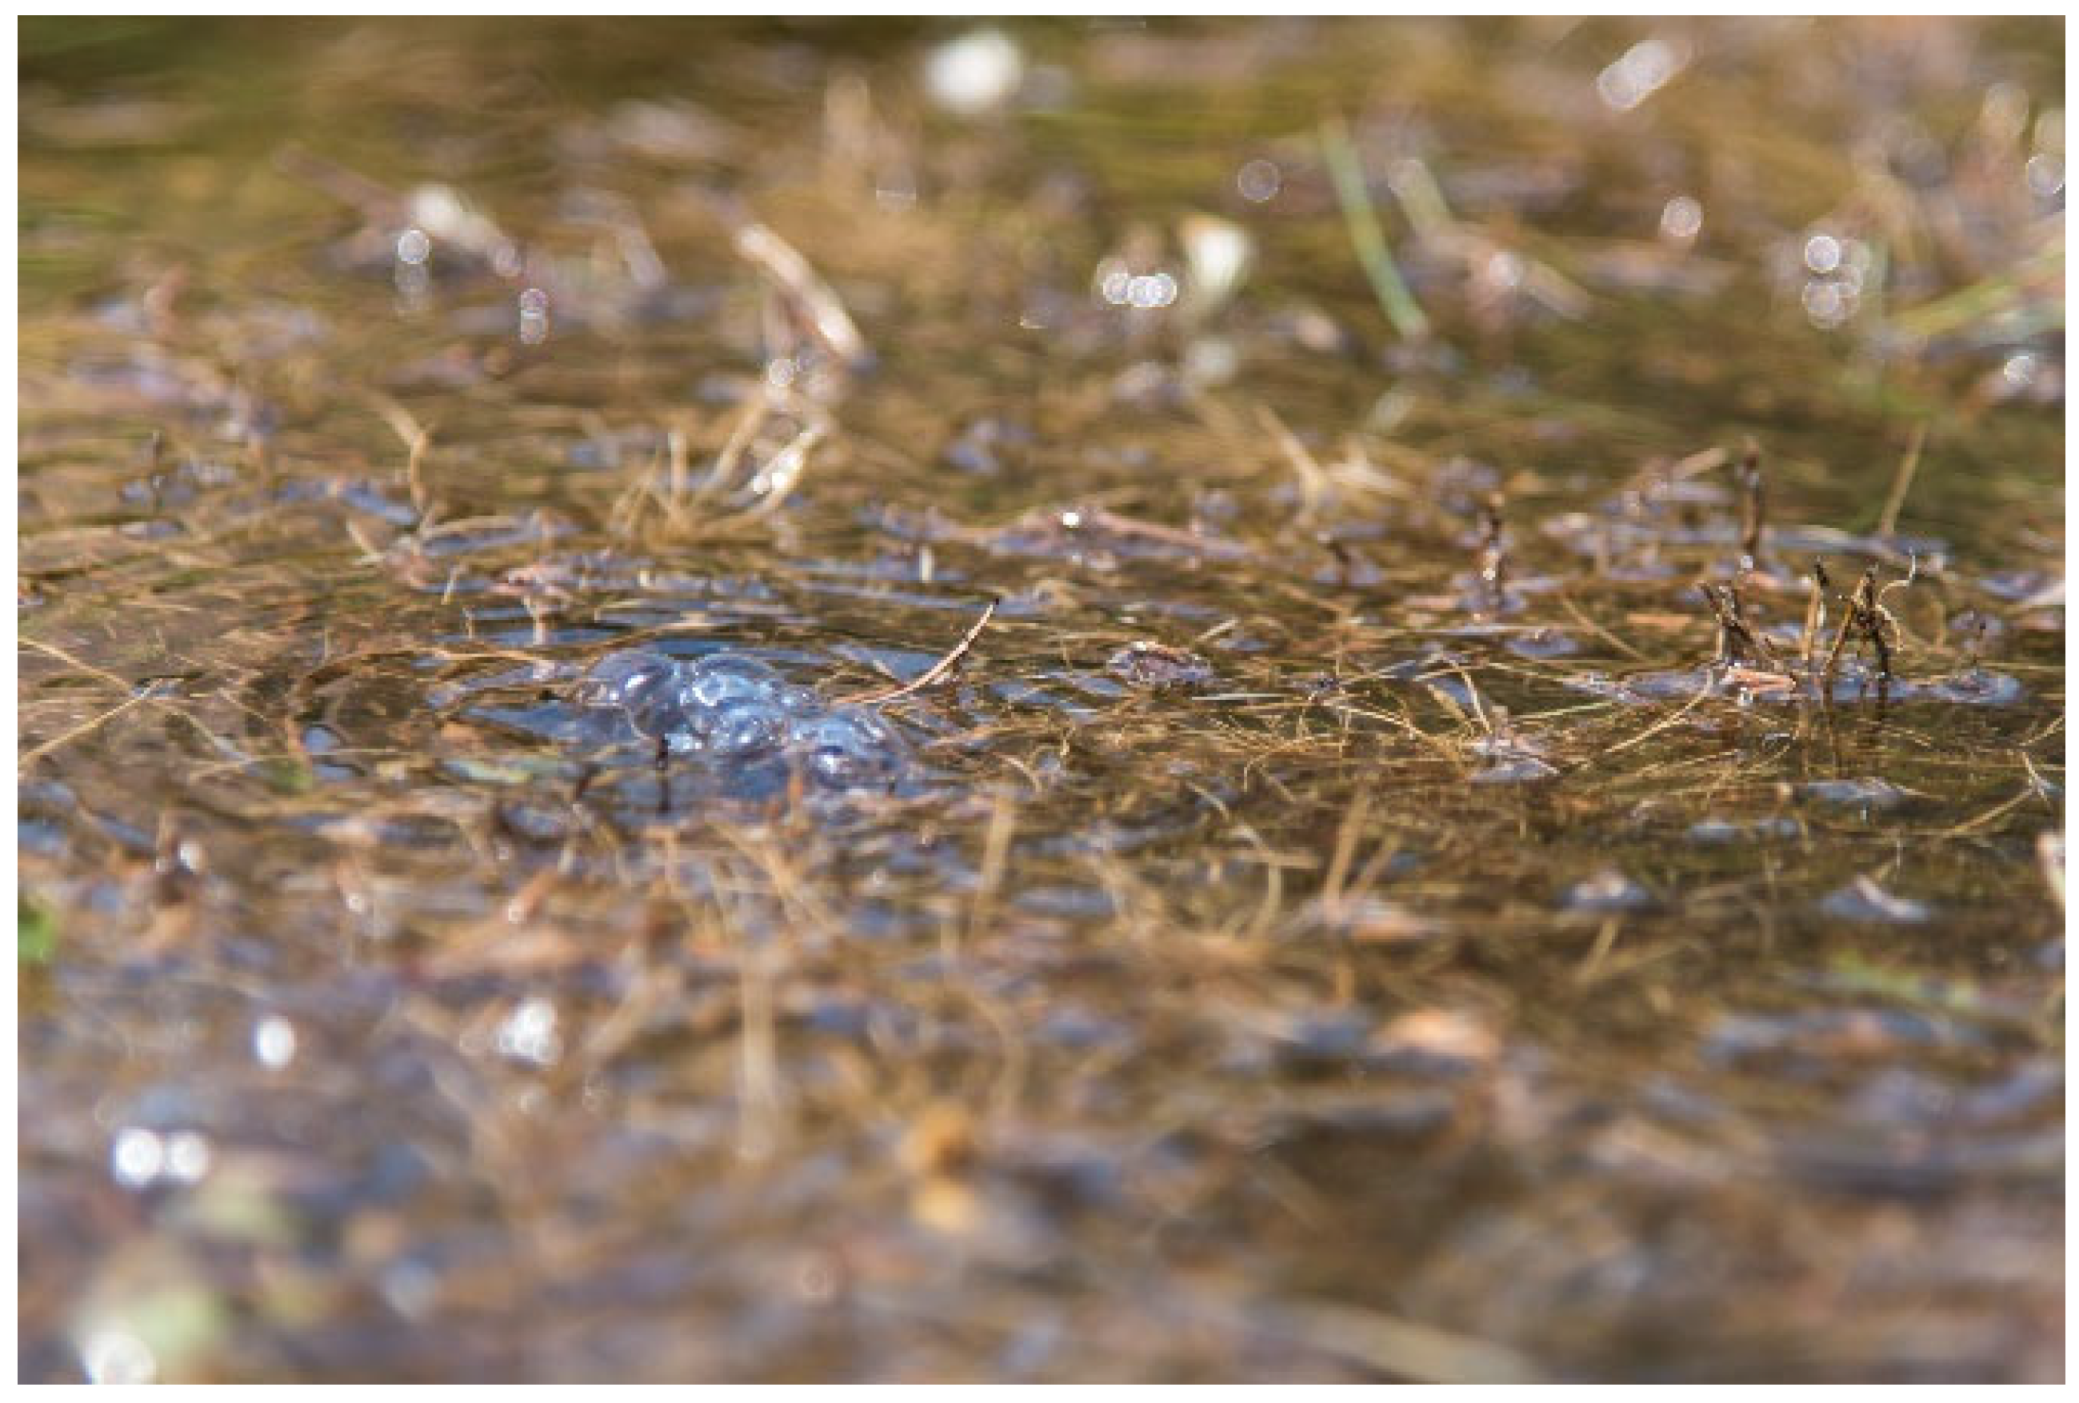
The largest swales 1 and 2 have a higher infiltration rate during the drought period in contrast to the smallest swale 3. Note that for swale 3 this difference in emptying time is only in the order of some minutes due to the much higher infiltration rate compared to swale 1 and 2 (the difference in emptying time is 47 min for swale 1). The municipality expected a lower infiltration rate during drought (seeing the dry baren state of the swales in Figure 1b) and feared intensive rainfall after the drought period, resulting in flooding. A possible explanation for the increased infiltration rate during drought is preferential flow [15,48] due to cracks in the soil and micro-pores as the result of dying roots, enabling the vertical flow of air and water (Figure 12).
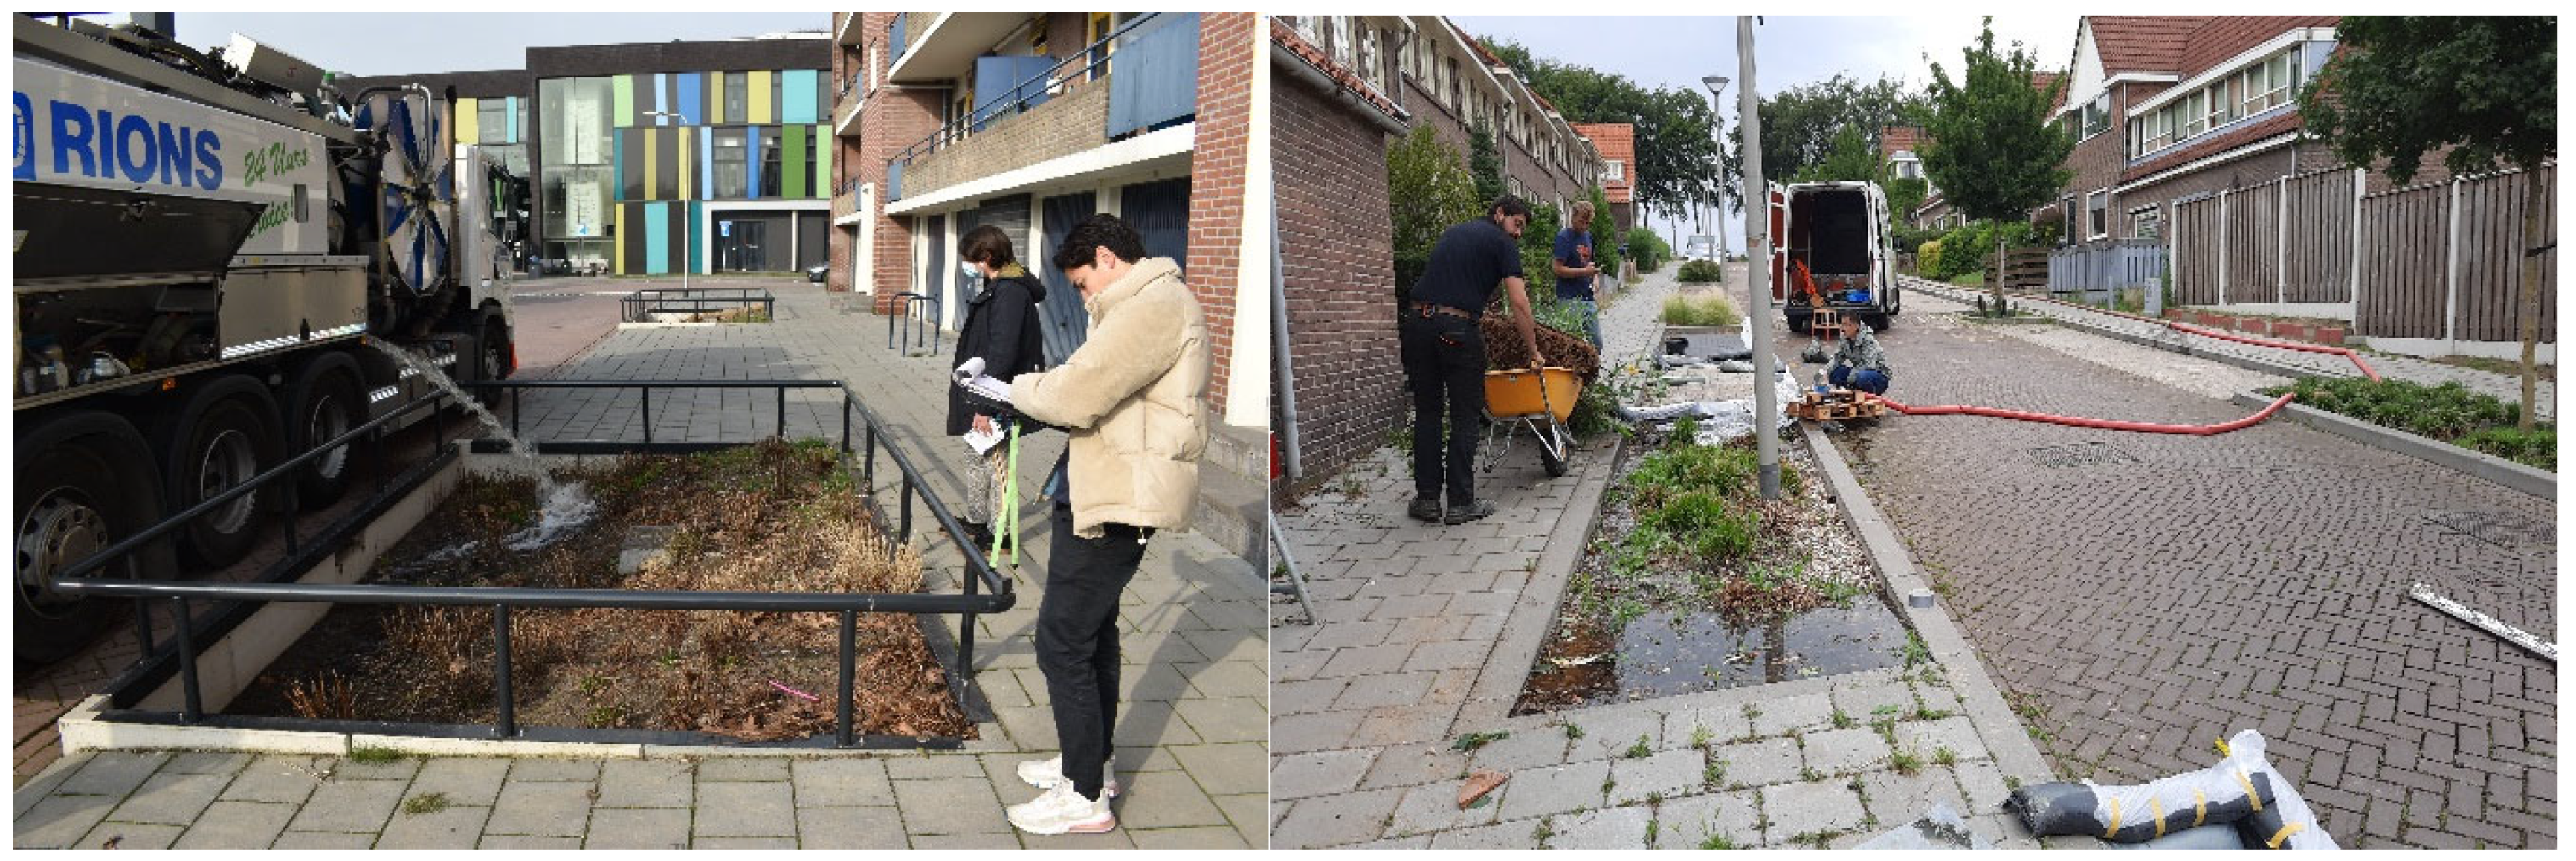
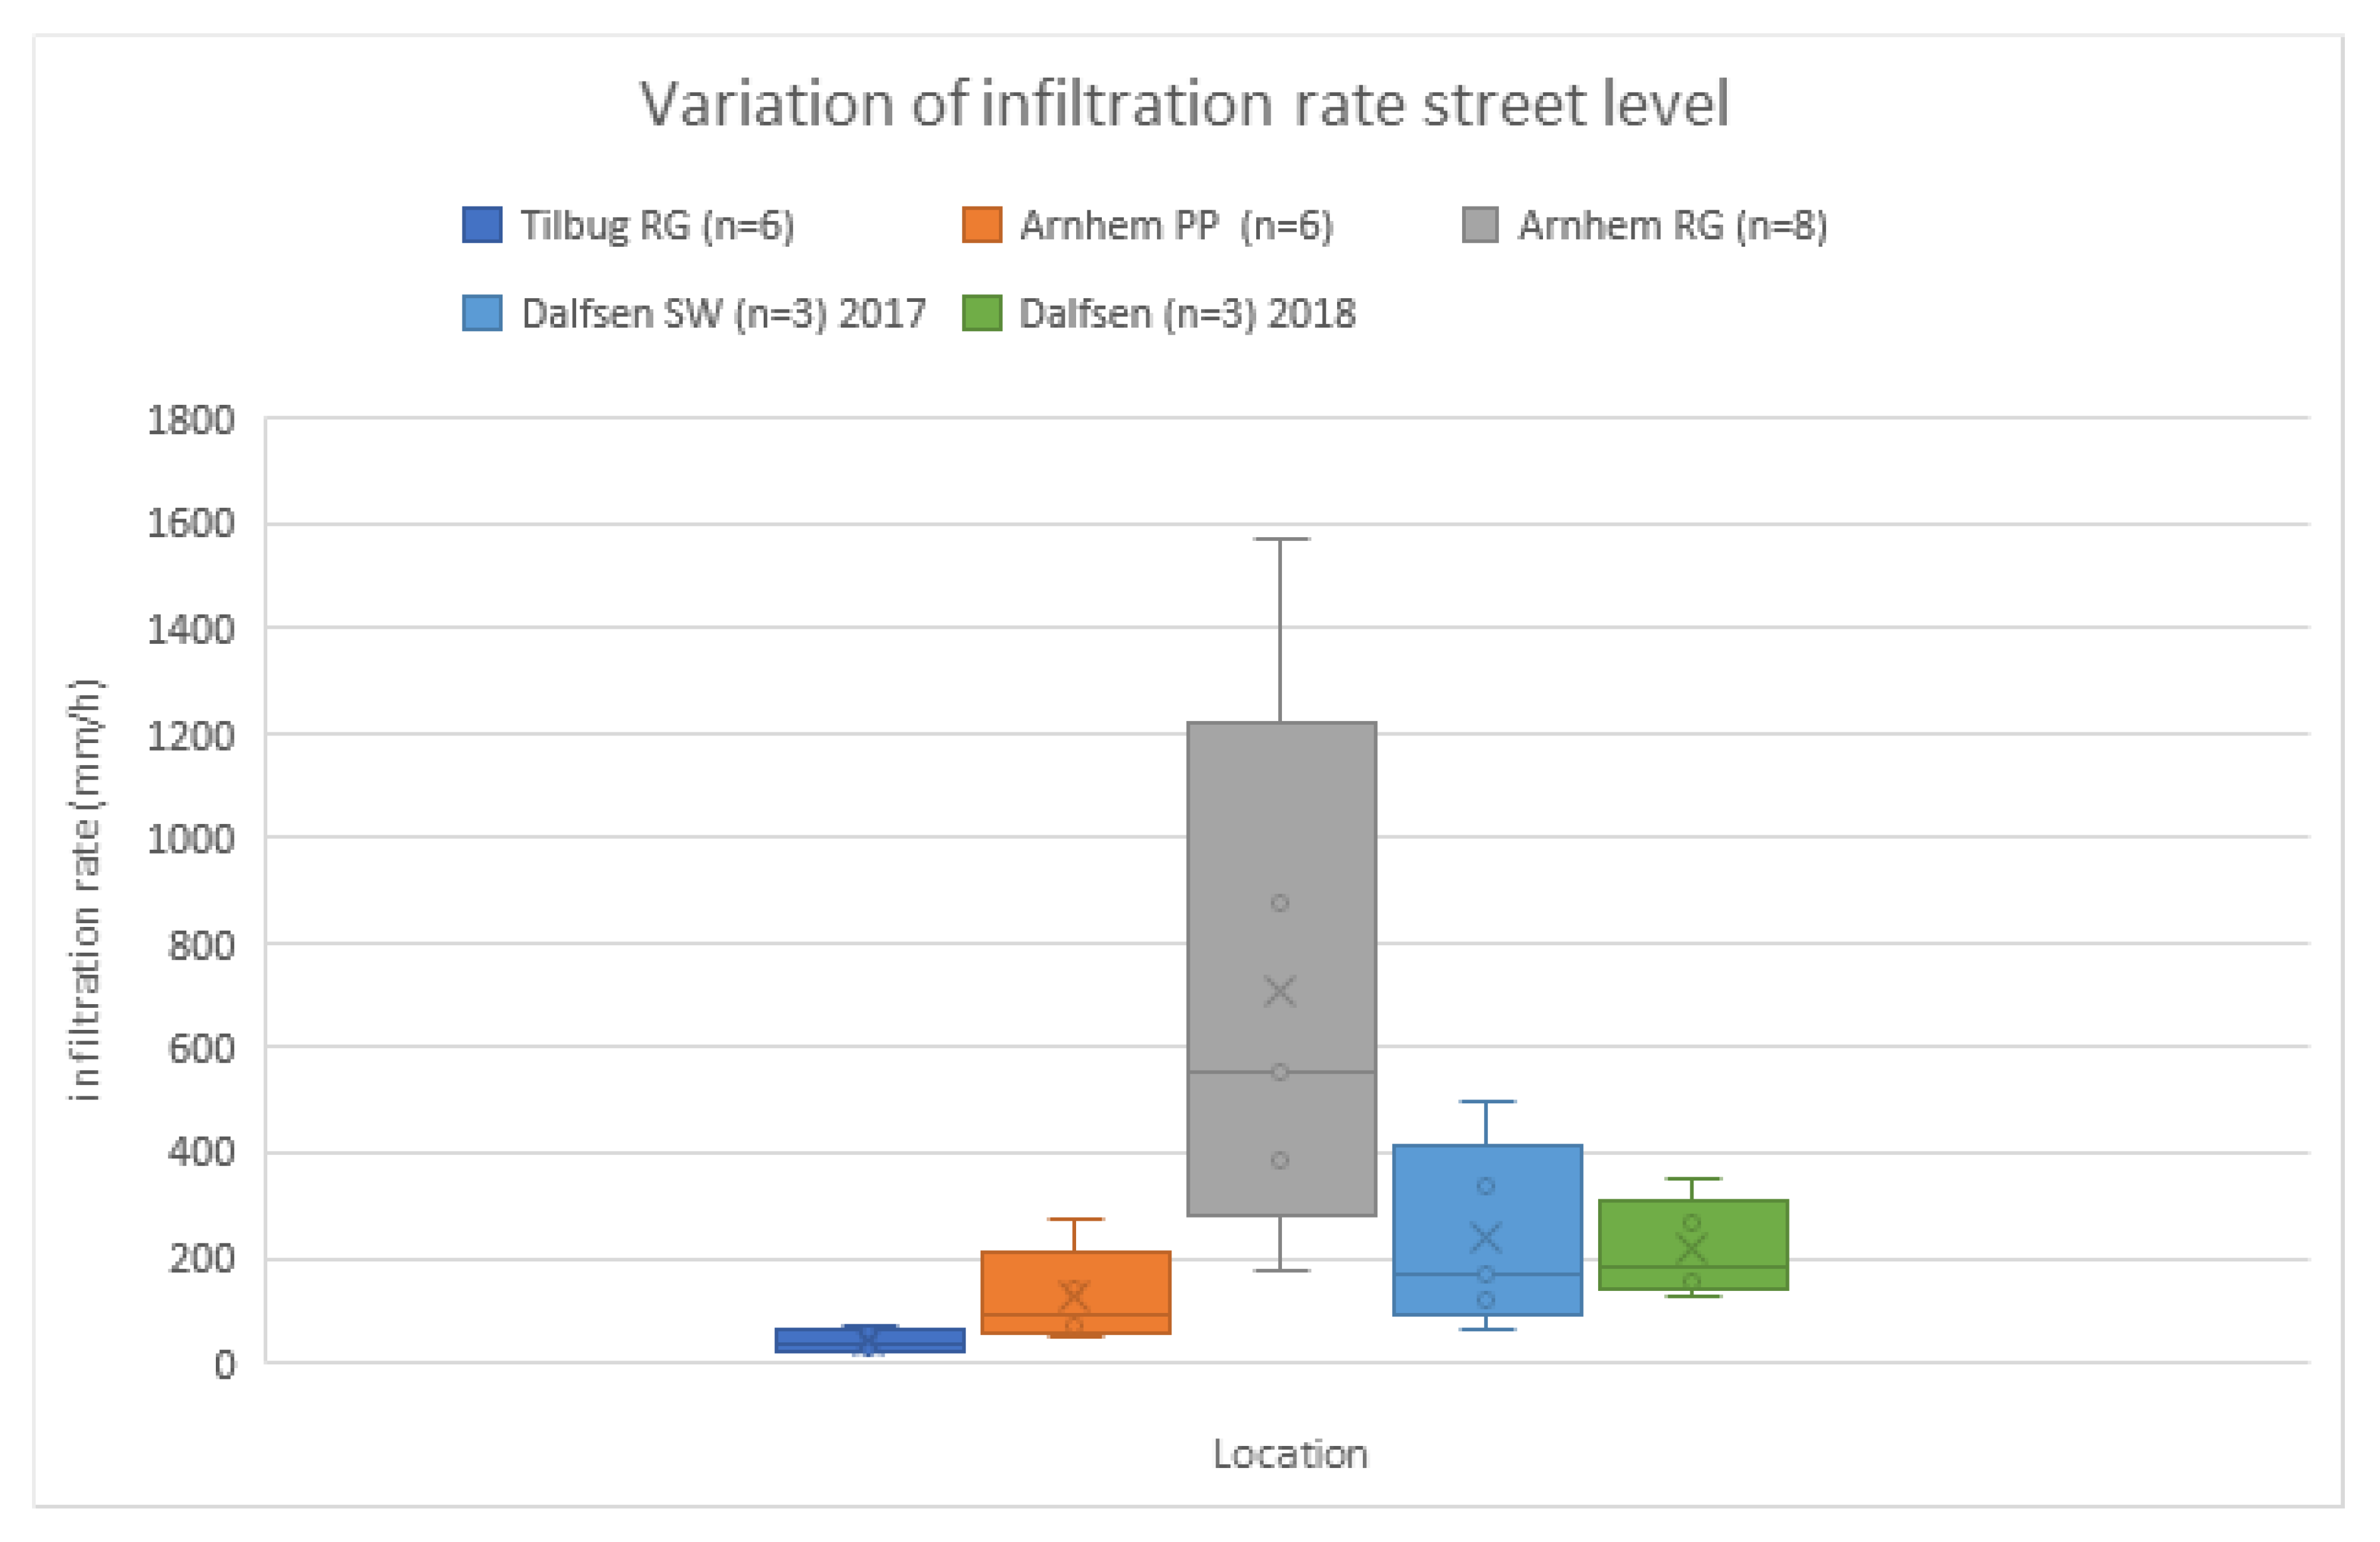
The variation in initial infiltration capacity of 1.6 to 11.9 m/d of the three swales situated in the same street was received by the municipality with more surprise. However, same observations were recorded in other municipalities, such as Tilburg and Arnhem, where the same full-scale method was used on several green infrastructures on one street (Figure 13) showing a high variation in infiltration rate (Figure 14).
Surprising to the municipality is also the difference between the saturated and unsaturated infiltration capacity: the measured saturated infiltration rates are up to a factor of 4 lower than the initial unsaturated capacity, with a minimal rate of 0.5 m/d. Other studies, where small-scale tests were used, such as (Modified) Philip–Dunne (MPD) or infiltrometer tests [4,35,36,37,38,39,40,51], show a variation in (un)saturated infiltration rates. Research locations with green infrastructure, where the full-scale test method was applied under similar Dutch circumstances, also show a significant reduction in infiltration rates between the unsaturated and saturated tests, ranging from 27% to 48% [52]. The most important outcome of this research, particularly for public stakeholders, was that all swales empty their storage volume within two days under all circumstances, according to the Dutch guidelines [45]. These research results should raise awareness about the variation in infiltration rates among stormwater managers engaged with the planning, testing, and modelling of green infrastructure about the spatial and time variable long-term infiltration capacity rates of green infrastructure.
5. Conclusions
The full-scale infiltration testing method was applied in this study to determine the variation in the hydraulic performance of three swales under different (simulated) weather conditions. The results from this study show that the tested swales empty their storage volume within 48 h under regular and extreme drought (un)saturated conditions, even after five full-scale tests (lowest value 0.5 m/d) after 8 years in operation, and without maintenance other than mowing the grass. Stormwater managers are satisfied that their green infrastructure demonstrates the minimum required infiltration capacity, so any tangible improvement to their design and characterization, such as additional drainage, is not needed.
The individual swales in Dalfsen show a variation in the initial infiltration capacity of 1.6 to 11.9 m/d. Most previous research focused on unsaturated infiltration rates. However, the results of this study show that the difference in infiltration rates between saturated and unsaturated can differ by a factor 4 (after 5 full-scale tests). These large differences by a factor of 4 in (un)saturated infiltration rate in one street is also determined in other research with the full-scale test in The Netherlands. Therefore, if the unsaturated infiltration capacity is used as the design input for computer models, the infiltration capacity may be significantly overestimated. It is therefore recommended that an appropriate degree of pre-saturation is accounted for in the design or a linear increase in the emptying time, as shown in this paper. This could be applied by a simple reduction in the design unsaturated infiltration rate. The results of this study should help stormwater managers with the modelling, planning, testing and scheduling of maintenance requirements for swales with more confidence, so that they will continue to perform satisfactorily over their intended design lifespan.
Funding
This research was funded by SIA, grant number SVB/ RAAK.PUB07.015 project Groenblauwe oplossingen, kansen en risico's.
Data Availability Statement
Not applicable.
Acknowledgments
This research is supported through Raak GroenBlauw, kansen en risicos co-funded by SIA. Thanks to the municipality Dalfsen, Tilburg and Arnhem for support for this work. Photos by Thomas Klomp.
Conflicts of Interest
The authors declare no conflict of interest.
References
- Marsalek, J.; Jiménez-Cisneros, B.E.; Malmquist, P.-A.; Karamouz, M.; Goldenfum, J.; Chocat, B. Urban Water Cycle Process and Interactions; UNESCO Publishing and Taylor and Francis Group: Paris, France, 2006. [Google Scholar]
- Fletcher, T.; Andrieu, H.; Hamel, P. Understanding, management and modelling of urban hydrology and its consequences for receiving waters: A state of the art. Adv. Water Resour. 2013, 51, 261–279. [Google Scholar] [CrossRef]
- Fletcher, T.D.; Shuster, W.; Hunt, W.F.; Ashley, R.; Butler, D.; Arthur, S.; Trowsdale, S.; Barraud, S.; Semadeni-Davies, A.; Bertrand-Krajewski, J.-L.; et al. SUDS, LID, BMPs, WSUD and more—The evolution and application of terminology sur-rounding urban drainage. Urban Water J. 2015, 12, 525–542. [Google Scholar] [CrossRef]
- Ballard, B.W.; Wilson, S.; Udale-Clarke, H.; Illman, S.; Scott, T.; Ashley, R.; Kellagher, R. The SuDS Manual; CIRIA C753-The SuDS Manual, CIRIA Research Project (RP)992CIRIA; Department for Environment Food & Rural Affairs, CIRIA: London, UK, 2015; ISBN 978-0-86017-760-9. [Google Scholar]
- Davis, A.P.; Jamil, E. Field Evaluation of Hydrologic and Water Quality Benefits of Grass Swales with Check Dams for Managing Highway Runoff. In Proceedings of the International Low Impact Development Conference 2008, Seattle, WA, USA, 16–19 November 2008. [Google Scholar] [CrossRef] [Green Version]
- Davis, A.P.; Stagge, J.H.; Jamil, E.; Kim, H. Hydraulic performance of grass swales for managing highway runoff. Water Res. 2012, 46, 6775–6786. [Google Scholar] [CrossRef] [PubMed]
- Stagge, J.H.; Davis, A.P.; Jamil, E.; Kim, H. Performance of grass swales for improving water quality from highway runoff. Water Res. 2012, 46, 6731–6742. [Google Scholar] [CrossRef]
- Winston, R.J.; Hunt, W.F.; Kennedy, S.G.; Wright, J.D.; Lauffer, M.S. Field Evaluation of Storm-Water Control Measures for Highway Runoff Treatment. Environ. Eng. 2012, 138, 101–111. [Google Scholar] [CrossRef]
- Barrett, M.E.; Walsh, P.M.; Malina, J.F.; Charbeneau, R.J. Performance of Vegetative Controls for Treating Highway Runoff. Environ. Eng. 1998, 124, 1121–1128. [Google Scholar] [CrossRef]
- Deletic, A. Sediment transport in urban runoff over grassed areas. J. Hydrol. 2005, 301, 108–122. [Google Scholar] [CrossRef]
- García-Serrana, M.; Gulliver, J.S.; Nieber, J.L. Infiltration capacity of roadside filter strips with non-uniform over-land flow. J. Hydrol. 2017, 545, 451–462. [Google Scholar] [CrossRef] [Green Version]
- Blanco-Canqui, H.; Gantzer, C.J.; Anderson, S.H.; Alberts, E.E.; Thompson, A.L. Grass Barrier and Vegetative Filter Strip Effectiveness in Reducing Runoff, Sediment, Nitrogen, and Phosphorus Loss. Soil Sci. Soc. Am. J. 2004, 68, 1670–1678. [Google Scholar] [CrossRef]
- Lucke, T.; Mohamed, M.A.K.; Tindale, N. Pollutant Removal and Hydraulic Reduction Performance of Field Grassed Swales during Runoff Simulation Experiments. Water 2014, 6, 1887–1904. [Google Scholar] [CrossRef] [Green Version]
- Le Coustumer, S.; Fletcher, T.; Deletic, A.; Barraud, S.; Lewis, J.F. Hydraulic performance of biofilter systems for stormwater management: Influences of design and operation. J. Hydrol. 2009, 376, 16–23. [Google Scholar] [CrossRef]
- Abu-Zreig, M.; Rudra, R.P.; LaLonde, M.N.; Whiteley, H.R.; Kaushik, N.K. Experimental investigation of runoff reduction and sediment removal by vegetated filter strips. Hydrol. Process. 2004, 18, 2029–2037. [Google Scholar] [CrossRef]
- Le Coustumer, S.; Fletcher, T.D.; Deletic, A.; Barraud, S.; Poelsma, P. The influence of design parameters on clogging of stormwater biofilters: A large-scale column study. Water Res. 2012, 46, 6743–6752. [Google Scholar] [CrossRef]
- Fort, F.; Jouany, C.; Cruz, P. Root and leaf functional trait relations in Poaceae species: Implications of differing re-source-acquisition strategies. J. Plant Ecol. 2012, 6, 211–219. [Google Scholar] [CrossRef]
- De Bilt, V.; Nieuwenhuis, E.; van de Ven, F.; Langeveld, J. Root causes of failures in sustainable urban drainage systems (SUDS): An exploratory study in 11 municipalities in The Netherlands. Blue-Green Syst. 2021, 3, 31. [Google Scholar] [CrossRef]
- Boogaard, F. Stormwater Characteristics and New Testing Methods for Certain Sustainable Urban Drainage Systems in The Netherlands. Ph.D. Thesis, Technische Universiteit Delft, Delft, The Netherlands, July 2015; p. 149. [Google Scholar]
- IPCC. 2021: Climate Change 2021: The Physical Science Basis. In Contribution of Working Group I to the Sixth Assessment Report of the Intergovernmental Panel on Climate Change; Masson-Delmotte, V., Zhai, P., Pirani, A., Connors, S.L., Péan, C., Berger, S., Caud, N., Chen, Y., Goldfarb, L., Gomis, M.I., et al., Eds.; Cambridge University Press: Cambridge, UK, 2021. [Google Scholar]
- Forzieri, G.; Feyen, L.; Russo, S.; Vousdoukas, M.; Alfieri, L.; Outten, S.; Migliavacca, M.; Bianchi, A.; Rojas, R.; Cid, A. Multi-hazard assessment in Europe under climate change. Clim. Change 2016, 137, 105–119. [Google Scholar] [CrossRef] [Green Version]
- Spinoni, J.; Vogt, J.V.; Naumann, G.; Barbosa, P.; Dosio, A. Will drought events become more frequent and severe in Europe? Int. J. Climatol. 2018, 38, 1718–1736. [Google Scholar] [CrossRef] [Green Version]
- Naumann, G.; Spinoni, J.; Vogt, J.; Barbosa, P. Assessment of drought damages and their uncertainties in Europe. Environ. Res. Lett. 2015, 10, 124013. [Google Scholar] [CrossRef]
- Blauhut, V.; Stahl, K.; Stagge, J.H.; Tallaksen, L.M.; De Stefano, L.; Vogt, J. Estimating drought risk across Europe from re-ported drought impacts, hazard indicators and vulnerability factors. Hydrol. Earth Syst. Sci. Discuss. 2015, 12, 12515–12566. [Google Scholar]
- Stahl, K.; Kohn, I.; Blauhut, V.; Urquijo, J.; De Stefano, L.; Acácio, V.; Dias, S.; Stagge, J.H.; Tallaksen, L.; Kampragou, E.; et al. Impacts of European drought events: Insights from an international database of text-based reports. Nat. Hazards Earth Syst. Sci. 2016, 16, 801–819. [Google Scholar] [CrossRef] [Green Version]
- Eertwegh, G.A.P.H.; van den Bartholomeus, R.P.; Louw, P.; de Witte, J.P.M.; Dam, J.; van Deijl, D.; van Hoefsloot, P.; Clevers, S.H.P.; Hendriks, D.; Al, E. Droogte in Zandgebieden van Zuid-, Midden-en Oost-Nederland. Rapportage Fase 1: Ontwikkeling van Uniforme Werkwijze Voor Analyse van Droogte en Tussentijdse Bevindingen. KnowH2O. 2019. Available online: https://research.wur.nl/en/publications/droogte-in-zandgebieden-van-zuid-midden-en-oost-nederland-rapport (accessed on 1 January 2022).
- Knight, E.M.P.; Hunt, W.F.; Winston, R.J. Side-by-side evaluation of four level spreader-vegetated filter strips and a swale in eastern North Carolina. J. Soil Water Conserv. 2013, 68, 60–72. [Google Scholar] [CrossRef]
- Deletic, A. Modelling of water and sediment transport over grassed areas. J. Hydrol. 2001, 248, 168–182. [Google Scholar] [CrossRef]
- COASTAR. Available online: https://www.deltares.nl/nl/publication/coastar-nationaal-regionale-en-nationale-coastar-toepassingen-in-beeld/ (accessed on 1 January 2022).
- Rushton, B.T. Low-impact parking lot design reduces runoff and pollutants loads. J. Water Resour. Plan. Manag. 2001, 127, 172–179. [Google Scholar] [CrossRef]
- Barrett, M.E. Comparison of BMP Performance Using the International BMP Database. J. Irrig. Drain. Eng. 2008, 134, 556–561. [Google Scholar] [CrossRef]
- Ackerman, D.; Stein, E. Evaluating the effectiveness of best management practices using dynamic modeling. J. Environ. Eng. 2008, 134, 628–639. [Google Scholar] [CrossRef]
- Davis, A.P.; Traver, R.G.; Hunt, W.F.; Lee, R.; Brown, R.A.; Olszewski, J.M. Hydrologic Performance of Bioretention Storm-Water Control Measures. J. Hydrol. Eng. 2012, 17, 604–614. [Google Scholar] [CrossRef]
- Fassman, E.A.; Liao, M. Monitoring of a series of swales within a stormwater treatment train. In Proceedings of the 32nd Hydrology and Water Resources Symposium, Newcastle, Australia, 30 November–3 December 2009; Engineers Australia: Barton, Australia, 2009; pp. 368–378. [Google Scholar]
- Bettess, R. Infiltration Drainage-Manual of Good Practice; CIRIA R156; CIRIA: London, UK, 1996; ISBN 978-0-86017-457-8. [Google Scholar]
- Palhegyi, G.E. Designing Storm-Water Controls to Promote Sustainable Ecosystems: Science and Application. J. Hydrol. Eng. 2010, 15, 504–511. [Google Scholar] [CrossRef]
- BRE Digest 365. In Soakway Design; Buildings Research Establishment: Bracknell, UK, 1991; ISBN 0-85125-502-7.
- ASTM D3385-09; Standard Test Method for Infiltration Rate of Soils in Field Using Double-Ring Infiltrometer. American Society for Testing and Materials (ASTM): West Conshohocken, PA, USA, 2009.
- Nestingen, R.S. The Comparison of Infiltration Devices and Modification of the Philip-Dunne Permeameter for the Assessment of Rain Gardens. Master’s Thesis, Department of Civil Engineering, University of Minnesota, Minneapolis, MN, USA, 2007. [Google Scholar]
- DIN 19682-7; Soil Quality—Field Tests—Part 7: Determination of Infiltration Rate by Double Ring Infiltrometer. German Institute for Standardization: Berlin, Germany, 2015.
- Lucke, T.; Beecham, S. Field investigation of clogging in a permeable pavement system. Build. Res. Inf. 2011, 39, 603–615. [Google Scholar] [CrossRef]
- Pezzaniti, D.; Beecham, S.; Kandasamy, J. Influence of clogging on the effective life of permeable pavements. Water Manag. 2009, 162, 211–220. [Google Scholar] [CrossRef] [Green Version]
- Fassman, E.A.; Blackbourn, S. Urban Runoff Mitigation by a Permeable Pavement System over Impermeable Soils. J. Hydrol. Eng. 2010, 15, 475–485. [Google Scholar] [CrossRef]
- Ahmed, F.; Gulliver, J.; Nieber, J. Field infiltration measurements in grassed roadside drainage ditches: Spatial and temporal variability. J. Hydrol. 2015, 530, 604–611. [Google Scholar] [CrossRef]
- RIONED. Swales: Recommendations for Design, Implementation and Maintenance; Stichting RIONED: Ede, The Netherlands, 2006. [Google Scholar]
- Restemeyer, B.; Boogaard, F.C. Potentials and Pitfalls of Mapping Nature-Based Solutions with the Online Citizen Science Platform ClimateScan. Land 2021, 10, 5. [Google Scholar] [CrossRef]
- Arbeitsblatt DWA-A 138-Planung, Bau und Betrieb von Anlagen zur Versickerung von Niederschlagswasser-Verlag: DWA, Ausgabe: 04/2005, ISBN Print: 978-3-937758-66-4, ISBN E-Book: 978-3-96862-062-6, 32 April 2005; Stand: Korrigierte Fassung März 2006. Available online: https://webshop.dwa.de/en/dwa-a-138-versickerungsanlagen-4-2005.html (accessed on 1 January 2022).
- Allaire, S.E.; Roulier, S.; Cessna, A.J. Quantifying preferential flow in soils: A review of different techniques. J. Hydrol. 2009, 378, 179–204. [Google Scholar] [CrossRef]
- Boogaard, F.; Roelofs, R.; Laurentzen, E. Time and Spatial Depending Infiltration Rates (In Dutch: Infiltratiecapaciteit Verharding Verschilt in Ruimte en Tijd). Land en Water nr. 5-mei 2021. Available online: https://research.hanze.nl/en/publications/infiltratiecapaciteit-verharding-verschilt-in-ruimte-en-tijd (accessed on 1 January 2022).
- Boogaard, F.; Schilder, S.; Lekkerkerk, J. Variation in Infiltration Rates Swales (In Dutch: Infiltratiecapaciteit Wadi’s Varieert in Ruimte en Tijd); Land en Water, nr 1/2- Februari 2021. Available online: https://research.hanze.nl/nl/publications/infiltratiecapaciteit-wadis-varieert-in-ruimte-en-tijd (accessed on 1 January 2022).
- Ebrahimian, A.; Sample-Lord, K.; Wadzuk, B.; Traver, R. Temporal and spatial variation of infiltration in urban green infrastructure. Hydrol. Process. 2019, 34, 1016–1034. [Google Scholar] [CrossRef]
- Boogaard, F.; Lucke, T. Long-Term Infiltration Performance Evaluation of Dutch Permeable Pavements Using the Full-Scale Infiltration Method. Water 2019, 11, 320. [Google Scholar] [CrossRef] [Green Version]
Figure 1.
(a) Swale at study site in the municipality Dalfsen showing normal condition in 2017 and (b) the same swale after a 7-weeks dry period in 2018. The swales in Dalfsen is the case study presented in this paper.
Figure 1.
(a) Swale at study site in the municipality Dalfsen showing normal condition in 2017 and (b) the same swale after a 7-weeks dry period in 2018. The swales in Dalfsen is the case study presented in this paper.

Figure 2.
(a) Aggregated map of The Netherlands with over 1000 locations installed Dutch swales (Source: ClimateScan. Available online: https://www.climatescan.nl/map#filter-1-1 (accessed on 1 January 2022)). (b) Exact location of 3 swales in the Reynoldstraat in Dalfsen (more information: ClimateScan. Available online: https://www.climatescan.nl/projects/1114/detail (accessed on 1 January 2022)).

Figure 3.
The swale construction in the municipality Dalfsen, The Netherlands.

Figure 4.
Inlet of the swale in Dalfsen—(a) dry period in 2018, (b) during full-scale test in 2017.

Figure 5.
Swale 1 (left) to 3 (right) and cross-section B-B (swale 2).

Figure 6.
The full-scale infiltration test with a tank truck executed repetitively for monitoring the hydraulic behaviour of swales in Dalfsen—(a) under regular conditions in 2017, (b) Same monitoring after 7 weeks of drought in 2018.
Figure 6.
The full-scale infiltration test with a tank truck executed repetitively for monitoring the hydraulic behaviour of swales in Dalfsen—(a) under regular conditions in 2017, (b) Same monitoring after 7 weeks of drought in 2018.

Figure 7.
The methods for monitoring the water height in the swales during the infiltration tests were (a) hand measurements on a measuring tape and underwater video camera, continuous time-lapse photography (b) and pressure transducer loggers.
Figure 7.
The methods for monitoring the water height in the swales during the infiltration tests were (a) hand measurements on a measuring tape and underwater video camera, continuous time-lapse photography (b) and pressure transducer loggers.

Figure 8.
Empty curves swale 2 (S2) and 5 tests (T1–T5) in drought situation.

Figure 9.
Emptying time graphs of swale 1, 2 and 3 under regular (2017, left) and drought conditions (2018, right).
Figure 9.
Emptying time graphs of swale 1, 2 and 3 under regular (2017, left) and drought conditions (2018, right).

Figure 10.
Emptying time of swale 2 show a factor of about 50% decline after 5 full-scale tests.

Figure 11.
Infiltration rate in m/d (results of linear regression analysis).

Figure 12.
Significant bubbles during the filling process indicating (preferential) flow during the drought period: air-filled pores are filled with water forcing out the trapped air.
Figure 12.
Significant bubbles during the filling process indicating (preferential) flow during the drought period: air-filled pores are filled with water forcing out the trapped air.

Figure 13.
Measurements at two streets with multiple green infrastructure in The Netherlands: Azuurweg Tilburg (left, ClimateScan. Available online: https://www.climatescan.nl/projects/6052/detail (accessed on 1 January 2022)) and Reestraat Arnhem (right, ClimateScan. Available online: https://www.climatescan.nl/projects/1109/detail (accessed on 1 January 2022)).


Publisher’s Note: MDPI stays neutral with regard to jurisdictional claims in published maps and institutional affiliations. |
© 2022 by the author. Licensee MDPI, Basel, Switzerland. This article is an open access article distributed under the terms and conditions of the Creative Commons Attribution (CC BY) license (https://creativecommons.org/licenses/by/4.0/).
Share and Cite
MDPI and ACS Style
Boogaard, F.C. Spatial and Time Variable Long Term Infiltration Rates of Green Infrastructure under Extreme Climate Conditions, Drought and Highly Intensive Rainfall. Water 2022, 14, 840. https://doi.org/10.3390/w14060840
AMA Style
Boogaard FC. Spatial and Time Variable Long Term Infiltration Rates of Green Infrastructure under Extreme Climate Conditions, Drought and Highly Intensive Rainfall. Water. 2022; 14(6):840. https://doi.org/10.3390/w14060840
Chicago/Turabian StyleBoogaard, Floris Cornelis. 2022. "Spatial and Time Variable Long Term Infiltration Rates of Green Infrastructure under Extreme Climate Conditions, Drought and Highly Intensive Rainfall" Water 14, no. 6: 840. https://doi.org/10.3390/w14060840
Note that from the first issue of 2016, this journal uses article numbers instead of page numbers. See further details here.