
Geochemistry of Thermal and Cold Mineral Water and Gases of the Tien Shan and the Pamir
by
 , ,
, ,
Georgy Chelnokov
1,* ,
,
Vasily Lavrushin
1,
Ivan Bragin
1,2,
Abdulaziz Abdullaev
3,
Altyn Aidarkozhina
1 and
Natalya Kharitonova
2,4 1
Heat and Mass Transfer Laboratory, Geological Institute Russian Academy of Science, Pyzhevsky Lane 7, Bld. 1, 119017 Moscow, Russia
2
Laboratory of Hypergene Processes Geochemistry, Far East Geological Institute, Far Eastern Branch Russian Academy of Science, Prospect 100-Letya 159, 690022 Vladivostok, Russia
3
Institute of Seismology, Al-Farabi Str. 75A, Almaty 050060, Kazakhstan
4
Faculty of Geology, Lomonosov Moscow State University, GSP-1, Leninskiye Gory, 119991 Moscow, Russia
*
Author to whom correspondence should be addressed.
Water 2022, 14(6), 838; https://doi.org/10.3390/w14060838
Submission received: 3 February 2022
/
Revised: 4 March 2022
/
Accepted: 6 March 2022
/
Published: 8 March 2022
Abstract
:This study presents the first regional hydrogeochemical portrait of the mineral waters and associated gases of the Central Asia region, shaped by the Tien Shan and the Pamir. A geochemical survey of more than 50 fluid discharges from the Northern Tien Shan to the Pamir was carried out between 2018 and 2019. Isotopic (δD, δ18O, d15N2, d13CCO2, d13CCH4) and chemical data allow elucidating fluid genesis and general evolution in the continental collision zone. Geothermometric estimations as well as the content of the chemical components in waters (Cl, Li, B, Br) and gases (N2, CO2) suggest that the studied waters are not related to the presence of any active hydrothermal systems at shallow depth. Silica and cation geothermometers along with thermodynamic equilibrium calculations indicate that the temperature of unmixed deep fluids does not exceed 110 to 150 °C. The determination of d15N2 and d13CCO2 has revealed that the mantle genesis of gas flux matches with the areas of CO2-rich waters manifestations. The dislocation of mineral and thermal waters of Central Asia along the major regional tectonic structures is provided by topographically driven and well-developed long circulation of waters at the depth of 1 to 4 km.
1. Introduction
There are about 20 thermal and cold mineral manifestations in the Pamir (Tadjikistan) [1,2] and more than 70 in the Tien Shan (Kirgizstan, Kazakhstan, and Tadjikistan) [2,3,4]. The mineral waters of these areas have been known to local people for a long time, but significant regional investigations were carried out in the twentieth century [3,4,5,6,7,8,9]. Unfortunately, many of these works do not contain results of chemical analyses that can be used to perform geochemical calculations. After the Soviet Union dissolution in 1991, investigations were focused more on the balneological or seismological utilization of these waters either without or with limited data on the chemical and isotopic composition of the waters and associated gases [10,11,12,13]. Despite the vast literature and numerous studies of 13C that geochemistry reported for various regions of the world, the behavior of 13C in the groundwater systems of the Tien Shan–Pamir region is limited as well [14,15]. New data on Pamir mineral springs chemistry and genesis are scarce and often do not provide information on some important elements [13], (see Table S1). Even though the Tien Shan–Pamir thermal water manifestations are connected with key questions regarding the active intra-continental orogeny and also subduction zone outside the Himalayas, they remain surprisingly poorly represented in English-language publications [11,12,16,17,18].
The present study describes the geochemistry of the main thermal and cold fluid manifestations located across the structures of Pamir (Tadzhikistan) through the South Tien Shan (Kirgizstan) to the North Tien Shan (Kazakhstan) (Figure 1, the numbers and names of all the investigated waters are given in Table S1). The primary goals of this work are to investigate the geochemistry of the waters and associated gases, elucidate the geochemical processes affecting the fluid genesis, overview the role of the tectonic setting in their origin and distribution, and estimate the temperature of the geothermal systems. Our findings provide new hydrogeochemical information for Central Asia that was previously available only scarcely. We believe that the obtained results allow a clear understanding of the genesis of the geofluids of the Tien Shan and the Pamir, and the results are useful for the development and utilization of the geothermal and mineral water resources.
2. Geological and Tectonic Framework
The research area is located between 36° and 45° N and 68° and 80° E (Figure 1). The Tien Shan and the Pamir as a whole are complicated block mountain structures. Their pronounced uplifts and depressions are separated in most cases by faults, both small and large. The modern geological structure of the region reflects Quaternary vertical movements [19]. The tectonics of the territory is widely and comprehensively represented in the geological literature [20,24,25,26,27]. The area is pressed between large blocks of consolidated Earth’s crust: in the North and West with the Central Kazakhstan shield and the Turan plate on the Ural-Siberian platform; in the East with Tarim, and in the South with the Indian platform (Figure 1). Central Asia is characterized by a complex geological structure, high modern mobility of the Earth’s crust, and a highly dissected terrain with alternating mountain ranges and large inter-mountain depressions (Figure 1). The north boundary of the study area is defined by the contact of the middle and late Palaeozoic Yili volcanic arc (YVB) with the Northern Tien Shan. The south endpoint is presented by the south Pamir structures. Within the area, the Tien Shan is subdivided conventionally into the northern, central, and southern geographic regions. This subdivision is broadly based on the regional Palaeozoic evolution; the ensuing amalgamation of various terranes resulted in the formation of distinctive tectonic zones [20]. Pamir, separated from the Tien Shan by the Alai narrow valley, is also divided into three parts: Northern, associated with the mountain structures of the Kunlun, Southern, which is seen as a system of Hindu Kush–Pamir–Karakoram, and Central, compressed between them.
To the north, the Late Palaeozoic-age Yili volcanic belt (YVB) represents a continental arc, which overlaps Early Palaeozoic accretionary collages and sutures in the region of SE Kazakhstan [28]. This area is characterized by a significant dissection of the relief, well exposure of Paleozoic rocks, deep penetration of meteor and meltwater, active water exchange, and high seismicity. The Yili depression as an inter-mountain basin occupies most of the area (up to 70%) and is filled out by Mesozoic and Cenozoic deposits of high thickness (up to 4500 m) [3]. These deposits are represented by overlapping clays, sands, sandstones, limestones, siltstones, and other poorly consolidated sediments. Data of many deep drilling projects (1000–2900 m) reveal that geothermic gradients vary from 27 to 28 °C/km within the Yili depression [3]. As a result of geological and hydrogeological conditions, the natural mineral spring discharge within the YVB is extremely rare. All the thermal waters were sampled from artesian wells (175–800 m deep), which are part of the Alma–Ata seismic stations network.
The North Tien Shan, situated east of the Talas–Fergana Fault, comprises several Precambrian-age blocks as well as Cambrian–Lower Ordovician ophiolites and marine sediments [29], overlain by Ordovician-age sediments and volcanic rocks, and cut by I-type granites [20]. The region includes the southern margin of the Kazakh–Kyrgyz continent, which was deformed as a result of subduction and accretion during the Late Carboniferous and Early Permian [30].
Within the Northern Tien Shan, most mineral springs are distributed within the Issyk-Kul depression (Figure 1). According to Matychenkov [16], the geological structure consists of: (1) Quaternary and Pliocene–Quaternary water-bearing sediments composed of boulders and pebbles as well as alluvial pebble beds of piedmont plains and stream valleys (up to 450 m); (2) Mesozoic to Upper Pliocene stratified terrigenous deposits (clay, silt, sand; less often conglomerates and salt-bearing deposits) up to 4500 m; (3) Proterozoic to Upper Paleozoic bedrocks, which are faulted metasedimentary and igneous rocks whose equivalents are exposed in the ridges around the lake. Most of the thermal manifestations are located within the Terskey-Alatoo Range, which surrounds the Issyk-Kul depression in the south (Figure 1). It is the Neotectonic meganticline structure of 400 km length and 25 km width, with absolute elevations higher than 4 km. The northern slope of the range is steep with many erosion steps. The magnitude of displacement along the Pre-Terskey fault is up to 1 km [31]. As a result of drilling thermal waters with T > 40 °C and TDS from 0.35 to 45 g/L, were disclosed at the depths of 800 to 1600 m [16]. The water chemistry displayed a lateral zonation and anomalies related to the fault block structure of the Meso-Cenozoic sedimentary fill of the artesian basin. The water saturation of various blocks depends on their lithology and geological evolution. The estimated temperature gradient was 20 to 35 °C/1 km for boreholes with depths below 2000 m, and 23 to 35 °C/1 km in holes attaining a depth of 4900 m.
Within the Kirgiz Range (west side of NTS), two types of mineral waters were tested: (1) thermal waters with N2-dominated gas, disclosed by the 1500 m well (#18) and (2) cold CO2-rich waters in Paleozoic (Middle Ordovician) phyllitic schists, limestones, siltstones, and sandstones (#19) (Figure 1). Another manifestation of CO2-rich waters is located on the south slope of the Sonkel Range (#21), where it is connected with Carboniferous limestones and a red siltstone–sandstone package with a trace of gypsification processes. An interesting fact is that the cold CO2-rich springs are always located at higher altitudes (2471–3050 m) than the N2-rich thermal waters (1148–2455 m).
The Middle Tien Shan (MTS) comprises a range of Neoproterozoic units that include tillites and acid volcanic rocks [29]. It is separated from the North Tien Shan by the Terskey Suture. To the NW, the Karatau–Talas terrane [28] is considered to form a marginal part of the Middle Tien Shan microcontinent based on similarities in terms of the Early Palaeozoic depositional facies from both areas. From Middle Devonian to Late Carboniferous times, the Middle Tien Shan probably formed a part of the passive margin of the Kazakh–Kyrgyz continent and was characterized by shallow-marine carbonate and siliciclastic sediments [28]. Mineral water manifestations within the Middle Tien Shan are rare and typically attracted to the east slope of Talas–Fergana Fault and were connected with Paleozoic rocks (low Carbonaceous limestones and Silurian shist). There are no sufficient data relating to mineral springs located in this part of the territory; thus, no samples have been obtained during this study. Moreover, thermal (37 °C) and subthermal (17 °C) waters are locally spread within the Naryn River valley (#20) where they are associated with Oligocene–Miocene redbeds (up to 400 m, sandstones, siltstones, clays, gypsum), which lie on Devonian and Cretaceous limestones (>1000 m) [4].
The South Tien Shan (STS), which is separated from the Middle Tien Shan by the Early Ordovician–Early Carboniferous ophiolites [20], is of a Late Palaeozoic-age fold-and-thrust belt formed during the closure of the Turkestan Ocean [22]. The STS can be subdivided into several units: the Gissar–Alai segment in the west of the Talas–Fergana Fault, and the Kokshal segment in the east comprising Ordovician–mid-Carboniferous pelagic sediments, partly associated with intraplate volcanism, and thick carbonate platforms (mainly Late Devonian–Early Carboniferous), which are best developed in the latter two segments [29,32]. Post-collisional intrusions are dated as Early Permian. A distinctive feature of the southern Tien Shan is the wide distribution of cold of CO2-rich waters in the Kokshal segment (#22–27), while N2-thermal waters are confined to the Gissar–Alai segment (Figure 1). Within the last one, Paleozoic deposits are represented by volcanogenic complexes (basalts, andesites, andesitic-dacite porphyrites, and tuffs with insignificant layers of marbled limestones) of the lower carbon system, and intrusive rocks of the Middle-Upper Carboniferous age (granites, granodiorites, diorites) [11,12]. The hydrological conditions are complex and mainly defined by tectonic dislocations.
Substantially, all the CO2-rich water manifestations of the Tien Shan belong to the currently active 500-km-long NW–SE-oriented intracontinental dextral strike-slip Talas–Fergana Fault (TFF). It is an important inherited Palaeozoic structure and has generated an estimated accumulated offset of more than 100 km since the end of the Palaeozoic [20] (Figure 1). The TFF is still active, with an average slip rate estimated at ∼9 to 14 mm/a based on radiocarbon dating of terraces displaced by the fault [20].
The most fascinating cold and subthermal artesian mineral CO2-rich springs are located in the Kokshal segment of STS. Beshbelchir mineral spring (#22) is located within the south slope of the At-Bashi range in Devonian (trachybasalts and tuffs) and Carboniferous (limestones) rocks, at an altitude 3300 m asl. [4]. Kolsu spring (#23) is located within the SE side of Chatirkel-Aksai basin (3520 m asl.) and associated with Middle Paleozoic sandstones and schists with layers of dark-gray silicified limestones. Chatirkul CO2-rich waters (#24) are disclosed by the well at an altitude of 3157 m asl. in the tectonic zone of Mesozoic and Neogene sediments (Jurassic carbonic flysch formation and Cenozoic redbeds conglomerates). The borehole has a well discharge of about 5 L/s and active gas flowrate.
The Pamir and Tien-Shan conjunction zone extends in a sublatitudinal direction, framing the Pamir from the north and west (Figure 1). Its southern boundary is the Darvaz–Karakul fault zone; its northern boundary is formed by the Gissar–Kokshaal fault zone. The largest structural elements in the conjunction zone are the Alai depression in the east and the Tadjik depression in the southwest. The active, left-lateral Darvaz Fault represents the western boundary of the Pamir indenter (Figure 1) and juxtaposes the Palaeozoic–Triassic units of the North Pamir with the Mesozoic–Cenozoic successions of the Tajik basin [33]. The Pamir orogen consists of several allochthonous micro-continents (Northern, Central, and South Pamir). The Rushan–Pshart Suture zone separates the South Pamir to the south from the Central Pamir to the north (Figure 1), contains remnants of the consumed Meso-Tethys Rushan–Pshart Ocean, and records the evolution of the Rushan–Pshart Ocean from its birth to southward travel, subduction, and subsequent collision between the Central and Southern Pamirs [34]. Seismicity in the south-western Pamir features frequent intermediate-depth earthquakes, reaching hypocentral depths of 300 km, which is rare for regions not obviously related to active subduction of the oceanic lithosphere. Cold (#43, 46) and thermal (#44, 45, 48) manifestations occur in the south-western Pamir and are associated with the giant Shakhdara–Alichur composite gneiss dome. According to Krainov [1], another group of cold and thermal high pCO2 mineral springs was located within the SE part of Central Pamir. Moreover, Li [18] described the hydrogeochemical characteristics and genesis of the high-temperature geothermal system in the Tashkorgan basin of the Pamir syntax, western China. However, the authors do not provide gas composition data. Only one CO2-rich spring (#51) of the Northern Pamir was shortly described [13].
In summary, the mineral waters of the Tien Shan and the Pamir discharge over a wide range of geological settings formed in the conditions of continental collision, subduction, accretion and related igneous activity, etc. Nearly 80% of the manifestations are low enthalpy waters with temperatures of 20 to 93 °C, while others are cold mineral waters. By the associated gas composition of the hydromineral manifestations, they are divided into two types: thermal nitric waters, and cold and thermal CO2-rich waters. Remarkably, thermal CO2-rich waters are typically only for South Pamir structures.
3. Materials and Methods
Data were collected in two field campaigns in 2018 and 2019 from the Afghan border in SE-Tajikistan along Gissar-Alai, Fergana ridge, and the Southern Tien Shan ranges of Kyrgyzstan to Southern Kazakhstan (Figure 1, Table S1). In total, more than 50 water samples and 27 gas samples were sampled for chemical and isotopic analyses. The water samples were filtered through 0.45 µm mixed cellulose ester filters (Advantec, Tokyo, Japan) and collected in acid washed, high-density polyethylene sample bottles. Waters for the cation analysis were acidified to pH < 2 with ultrapure HNO3. Water temperature, conductivity, and pH were measured directly in the field using Mettler Toledo probe (Mettler-Toledo, Zürich, Switzerland). Major cations and anions were analyzed by ion chromatography. Carbonate species were titrated in situ with 0.1N HCl. Trace elements concentrations in groundwaters were determined by ICP-MS (Agilent 7500, Agilent Technologies Inc., Santa Clara, CA, USA) analysis.
In order to verify the reliability of the chemical analyses, we have calculated the Charge Balance Error ion to identify the ionic imbalances and analytical errors during the procedure of the sample selection. If the Charge Balance Error ion exceeded ±10%, such samples were not considered to be suitable for plot and geothermometers [35]. The interpretation of the chemical data and the mineral equilibrium calculations were performed based on AquaChem 5.1 software, which included computer code PHREEQC [36]. The geothermometric calculations of the reservoir temperatures used in this study are as follows:
- TSiO2 = [1032/(4.69 − lgSiO2)] − 273.15, [37];
- TSiO2 = −44.119 + 0.24469 SiO2 − 1.7414 × 10⁻⁴ SiO22 + 79.305 lgSiO2; Improved SiO2 [38]
- TNa–Li = 1049/[lg(Na/Li) + 0.44] − 273.15, [39];
- TNa–K–Ca = 1647/(lg(Na/K) + (4/3)[lg(Ca0.5/Na) + 2.06] + 2.47) − 273.15, [40].
- TCa–Mg = 979.8/3.1170 − log(Ca/Mg) + 0.07003 logΣeq − 273.15, [41]
- TK–Mg = 4410/14 − log(K2/Mg) − 273.15, [42]
where SiO2 in the mg/L, Na/Li in mmol/L, and Na/K and Ca/Na in mol/L. Σeq is the summation (in eq/L) of the major dissolved species.
The carbon isotope composition δ13C(TDIC), as well as hydrogen and oxygen isotope compositions of waters, were analyzed at the Geological Institute of the Russian Academy of Sciences using a Thermo Electron system consisting of the Delta V Advantage mass spectrometer, the Gas-Bench-II device (determination of δ13C(TDIC), δD, and δ18O in H2O), and the Trace GC Ultra gas chromatograph (determination of δ13C(CO2) and δ13C(CH4) in free gas samples) in the Laboratory of Isotope Geochemistry and Geochronology, Geological Institute, Russian Academy of Sciences. All δ13C values are given in per mille (‰) relative to the V-PDB standard; δD and δ18O are in per mille relative to the V-SMOW standard. The measurement error was ±0.2‰ for δ13C and δ18O and ±3‰ for δD.
Bubbling gas samples were collected from the natural springs and boreholes using standard techniques [43,44]. The composition of the gas was analyzed by gas chromatography techniques using thermal conductivity detectors and molecular sieve columns with He and Ar as carrier gases for the determination of H2, N2, O2, and CH4. A Porapak Q column with He carrier gas was used for the separation of CO2. Detection limits were 0.001 vol%. Isotopes ratios d13C(CO2) were determined by mass spectrometry MAT-253 (Thermo Fisher Scientific, Bremen, Germany) using the Trace-GC gas chromatograph at the Geological Institute RAS (Moscow). The precisions of the analyses are 0.1‰ for 13C.
Nitrogen isotopes were analyzed in the Centre of Isotopic Research (CIR) of the Russian Geological Research Institute (VSEGEI), Sankt-Petersburg. δ15N measurements were carried out on a gas chromatograph Agilent 6890 (Agilent Technologies Inc., Santa Clara, CA, USA), a mass spectrometer Finnigan Delta Plus XL (Thermo Fisher Scientific, Bremen, Germany) with GC Combustion Interface II. The analytical precision of δ15N measurements is better than 0.3‰. Nitrogen isotope measurements are reported in the delta notation, where d15N is the per mille (‰) deviation of the sample 15N/14N ratio from that of air, the standard for N isotope measurements.
4. Results and Discussion
4.1. Water Chemistry
The Piper Plot divides the groundwaters into three major groups (Figure 2): I—temporary hardness Ca–HCO3 (Ca–Mg–Na–HCO3) waters, II—alkali carbonate Na–HCO3 (Na–Cl–HCO3), and III—saline waters of Na–Cl, Na–SO4, and Na–Cl–HCO3 types.
Ten samples belong to the Ca–Mg–HCO3 type. Except for one spring (#7) with TDS 0.4 g/L, other waters of this group are represented by high pCO2 mineral waters, which explain their high TDS values (1.1–3.8 g/L). The pH varies from 5.9 to 7.5, the redox potential from +7 to +135 mV, and the water temperature from 5 to 35 °C. Br− and B− are presented in concentrations of 0.01 to 0.78 mg/L and 0.07 to 2.4 mg/L, respectively (Table S1). The concentrations of fluorine in this group are the lowest and even less than the detection limit. The Si contents of the spring waters are less than 54 mg/L. The waters demonstrate a positive correlation between HCO3− and TDS (r = 0.98), TDS and Cl− (r = 0.84), Na+ and Cl− (r = 0.92).
Five samples belong to the alkali carbonate groundwater (Na–HCO3), with the temperature changing from 7 to 60 °C. Similar to the first group, the high pCO2 waters of this group (#22, 25, 47) are characterized by high TDS, which varies from 2.5 to 7.2 g/L, neutral pH (6.7–7.8), and redox potential from −281 to +73 mV (Table S1). The lowest mineralization of 0.3 to 0.5 g/L, high pH (8.4–9.3), and Eh from −158 to +48 mV are defined in groundwaters not affected by CO2 gas (#17, 11) (Table S1). The HCO3/Cl ratios of 2.4 to 15 correspond to HCO3-rich mineral waters where Na is a dominating cation. Compared with the first group, the concentrations of Br− and B− increase and are equal to 0.04 to 0.98 mg/L and 0.1 to 8.2 mg/L, respectively. The contents of Si are temperature-dependent and vary from 9 to 66 mg/L. The waters have correlations between TDS and Cl− (r = 1), TDS and HCO3− (r = 0.98), and Na+ and Cl− (r = 1).
The third group is the biggest one and includes 29 saline groundwaters represented by Na–Cl, Na–SO4, and Na–Cl–HCO3 types. The TDS changes significantly from 0.3 to 13.2 g/L. The pH varies from 6.3 to 10.3. Twenty-five percent of the water samples have a pH above 9. The Eh values indicate a wide range of reducing (−350 to −40 mV) and oxidizing conditions (+13 to +196 mV). The highest temperature is 94 °C (average 31 °C). The Na dominates as cation species range from 56 to 2669 mg/L. The concentrations of SO42− reach 2.4 g/L. Typically, the waters contain Br− (0.02–3.8) and B (0.3–7.1 mg/L). Several springs demonstrate high concentrations of Sr (up to 22 mg/L) and Ba2+ (up to 23 mg/L). Local enrichments also occur for F− (9–23 mg/L). The maximal concentrations of silica, even in high-temperature waters, are not more than 67 mg/L, while the values of Al3+ are comparable to other studied water types (Table S1).
Since the triangular plots on Figure 2 do not contain any information on total ionic salinity, this parameter is inspected by means of the correlation diagram of Ca + Mg vs. Na + K (Figure 3D), where the TIS values of the considered waters can be estimated by comparing the position of each sample with the lines of slope −1, which are iso-TIS lines [45]. This indicates that almost half of the tested waters have a TIS of 4 to 120 meq/L, irrespective of the chemical type they belong to. This low salinity indicates that the waters from these sources come from a relatively low depth or/and present a mixture of cold and warm waters. Figure 3 shows that the CO2-rich cold springs (#21, 23, 24, 46) generally have Ca and Mg concentrations higher than the thermal springs. The higher Ca and Mg contents of these springs are probably due to water–carbonate rock–CO2 interaction. A TIS between 120 and 400 meq/L was observed for ten water samples. This supposes that chemical features have been acquired at the great depth due to long water–rock interaction. These waters belong to the third group apart from sample #25, which is from the second group. Waters with high amounts of TIS are not typical for the Middle Tien Shan and the Pamir area.
4.2. Fate of Chemical Heterogeneity
A heterogeneous chemical composition characterizes the analyzed groundwaters. In addition to chemical reactions (such as oxidation/reduction reactions), three major natural processes commonly contribute to the observed chemistry of groundwaters: simple mixing, cation exchange, and dissolution of minerals.
In order to explore the mechanism of salinity, the plot of Na+ versus Cl− is widely used [46,47]. The water sample distribution in the Na–Cl diagram of Figure 3A does not reflect binary mixing with a seawater end-member. Six samples (#26, 27, 30, 43, 44, 46) demonstrate a 1:1 stoichiometric ratio for Na/Cl; thus, significant effects of leaching of NaCl are presented for some mineral waters of the Tien Shan (Kirgizia) and the Pamir. However, substantially, all the mineral waters lie under the 1:1 line and demonstrate molar Na/Cl ratios between 1.3 and 3.4. This fact indicates additional sources of sodium, such as the weathering of Na-bearing silicates, a dissolution of Na-bearing evaporites, and cation exchange between Ca2+/Mg2+ in groundwaters and Na+ from clay minerals. Four samples (#2, 31, 36, 37, 38) demonstrate the dominance of Cl− over Na+. Although the dominance of Na+ over Ca2+ + Mg2+ (Figure 3D) indicates ion exchange, the dominance of Cl− over Na+ (Figure 3A) and dominance of Ca2+ + Mg2+ over HCO3− and SO42− (Figure 3C) is suggestive of reverse ion exchange [48,49]. The concentration of Mg2+ in the mineral water of the first group (#21, 23, 24, etc.) is much higher than in the other samples (Table S1). Spearman’s Rank Correlation Coefficient (r) for Mg2+ and HCO3− is 0.7, which indicates that this high concentration of Mg2+ is derived from the dissolution of dolomite. Figure 3C also suggests that carbonate weathering is the major source of solutes in these waters. Ca2+, Mg2+, and HCO3− in the mineral waters are derived from the dissolution of calcite and dolomite. The high (Mg2+ + Ca2+)/HCO3− ratios in the Djety-Oguz (#36, 37, 38), Keremetsu (#31), and Nizhnekamenka (#2) waters cannot be attributed to HCO3− depletion under the existing slightly alkaline conditions. Since HCO3− does not form carbonic acid (H2CO3) [50], the excess Ca and Mg might have been contributed to the groundwater from other sources, such as the reverse ion exchange process [51]. The calcium and magnesium from minerals exchange with the sodium in the water, which can be expressed by the scheme below:
2Na+ + Ca(Mg)clay ↔ Naclay + Ca2+(Mg2+)
The plot Na+ versus SO42− demonstrates that most of studied waters reflect the influence of evaporite minerals (r = 0.7; n = 45), such as mirabilite/thenardite (Na2SO4) (Figure 3B). Similar correlations obtained for Ca2+ vs. SO42− (r = 0.5; n = 45) and Cl− vs. SO42− (r = 0.6; n = 45) indicate that gypsum, anhydrite, and a group of chlorosulfate minerals are the primary sources of these elements for Na–SO4 and Na–Cl–SO4 water types. The presence of these minerals is often noted in the geological description of the drilling core [3]. These water types are dominant within the Tien Shan and the Pamir and characterize the region’s geological history and sedimentary environment.
The main hydrochemical processes and possible origin of groundwaters are well explained in the Durov diagram [48]. Based on this plot (Figure 4), eight samples fall in fields “a” and “b”, representing the Mg–Ca–HCO3 groundwater facies, probably reflecting carbonate weathering in dolomite-rich sedimentary rocks and evaporites (gypsum, anhydrite, halite, and chlorosulfates) dissolution. One sample falls within the field “c”, which indicates ion-exchange processes. Three samples fall within the field “e”, which is characterized by the mixing of waters of different types. A gradual increase in the ion concentrations is observed for CO2-rich groundwater (#19, 21, 23, 24, 43, 44, 45, 46, 51). Sixteen samples fall within the field “f”, which is represented by the Na–SO4 water type. The genesis of these waters is connected with the evaporite environment, as was established above. Three samples fall within the field “h”, characterized by the Mg–Na–Ca–Cl type, which shows the possible influence of reverse ion exchange. Ten samples fall within the field ‘i’ and are characterized by the dissolution of halite (# 6, 27, 29, 30, 36, 39), mirabilite and dolomite (# 12, 15), or saline water mixing (# 16, 28).
Ion exchange is one of the important processes responsible for concentration of ions in the groundwater [51,52]. The plot in Figure 3C can be used to determine the ion exchange processes. If reverse ion exchange is present, the points shift right due to excess of Ca2+ + Mg2+ over HCO3− + SO42−. The chloro-alkaline indices (CAI) also provide valuable information about the ion exchange reactions between the groundwaters and the host rocks minerals [53]. The CAI was calculated using the following formulas:
[Cl − (Na + K)]/Cl and [Cl − (Na + K)]/Cl + HCO3 + SO4 + NO3
A positive index indicating reverse ion exchange is supposed to be a result of an exchange between Na and K in the groundwater with Ca and Mg in the host rocks. The negative values of the CAI ratio will indicate chloralkaline disequilibrium and the cation–anion exchange reaction. Twelve samples show positive and 25 samples show negative CAI values in the analyzed samples (Figure 5). The results obtained demonstrate that the reverse ion exchange processes are observed in the Tien Shan and are not typical for Pamir. Overall, based on the main ions’ interpretation, it can be concluded that the water–rock interaction and ion exchange are the primary hydrochemical processes that influence the hydrochemistry in the study area.
The Cl and Br concentrations are highly correlated for all the groundwaters (Spearman’s Rank Correlation Coefficient = 0.8 for 59 samples) (Figure 6A). The mass ratios of Cl to Br range from 125 to 11,473 (average 1317, n = 59) (Figure 6A). According to the Cl/Br ratio, several mineral waters (#2, 6, 18, 19, 50) follow the seawater-dilution line, indicating the predominantly marine component (Cl/Brsea = 288, Figure 6A). We suppose that a relict of fossil seawater (connate water) plays an important role in the water chemistry of the above-mentioned samples. The same conclusions were made in respect of the thermal waters located in the Chinese Tien Shan [17]. The mass ratios of Cl to Br ranging from 303 to 900 (Figure 6A) is an indication of fresh water and NaCl dissolution components [54]. The salinity of all the studied mineral waters from the Pamir (#43, 44, 45, 46, 47, 48, 51) indicates the halite dissolution processes. The much higher groundwater ratios (Cl/Br up to 11,000) are probably derived from dissolved halite deposits [55].
The Li–Cl–B ternary plot shows that all the thermal waters demonstrate low B/Cl ratios (Figure 6B). Thus, the absence of waters with low chloride and high boron content indicates no geothermal degassing and/or phase separation followed by fluid condensation at shallow depth [56,57]. It appears that the high Li+ concentrations are typical for thermal waters located in granitic missives (#49, 17), where the biotite is the main source of lithium [58]. The correlation between Cl and B underlines the progressive rock dissolution of these species (r = 0.78). Whereas, for the high temperature waters [57], chlorides and boron are released from rock during water–rock interaction in approximately stoichiometric proportions (r = 1). Considering that many waters with high B content have low temperature (5–17 °C), the contribution from magmatic fluids is not probable. According to Earle at al. [59], base-exchange softening and the consequent enhanced boron desorption can take place in aquifers with sufficient exchange surfaces (e.g., clay minerals). Thus, the elevated levels of boron in several samples (#22, 25, 30, 37, 38, 42, 47) are supposed to be connected with the ion-exchange processes described above.
The process of aluminosilicates hydrolysis is observed in water discharge from granites (#1, 10, 16, 17, 32, 33, 39, 40, 49). The main features of the waters are high pH > 9, F, and Si content (Table S1). The silicate dissolution (e.g., K-feldspar) and secondary minerals (e.g., kaolinite, montmorillonite, boehmite, etc.) precipitation increase water pH because both processes consume H+ and lead to the accumulation of OH−. For example:
KNaAlSi3O8 + 3H+ → K+ + Na+ + AlO(OH) + 3SiO2(aq) + H2O
Granitic rocks are the typical source of fluoride and contain much higher F than any other rock type. The detailed mineralogical investigations of granites from the thermal area Khoja-Obi-Garm (#49) reveal apatite presence in the rock. Thus, apatite is supposed to be a possible source of fluoride [11,12]. High fluoride levels in the groundwater could indicate longer water residence time in aquifers. These processes are typical and studied well in low–enthalpy thermal waters all over the world [60,61,62].
Mineral saturation indices (SI) may provide insight into the nature of the chemical processes that control solute concentrations in groundwaters. Saturation indices have been calculated for minerals commonly observed in marine sediments. Measured fluid compositions were interpreted using PHREEQC [36] together with its PHREEQC database. According to many authors [63,64,65], a water saturation with respect to a mineral can be indicated using an error band equal to ±1/20th of the thermodynamic equilibrium constant (log KT) (indicated as grey areas on Figure 7).
Figure 7A indicates the calculated SI values for calcite and ordered dolomite for all the groundwater samples, showing both undersaturation and supersaturation for the carbonates. The carbonates saturation index of the eight groundwater samples (#19, 22, 23, 24, 25, 27, 42, 47) is generally above equilibrium and indicates that calcite and ordered dolomite are supersaturated; thus, precipitation is thermodynamically favored (Figure 7). The travertine deposition is presented in proof of the modeling (#19, 22, and 47). All the high pCO2 mineral water samples are located in the oversaturated zone (#19, 21, 22, 23, 24, 47). The state of oversaturation in ordered dolomite as well as a stable phase in the low–temperature environments could be linked to both nonstoichiometry dolomite presence (with Ca2+ excess) and higher cation disorder and consequent kinetic reasons [66]. One sample (#37) demonstrates supersaturation with respect to calcite but undersaturation or in equilibrium with respect to ordered dolomite. The supersaturation of calcite shows a dynamic equilibrium between precipitation and calcite dissolution in the aquifer. Calcite supersaturated samples mainly belong to water from the Southern Tien Shan (Kirgizstan), with one sample from Pamir (Tadjikistan). The majority of the samples are in equilibrium with respect to calcite, and half of them are in equilibrium with respect to dolomite (Figure 7A).
Seven mineral water samples are undersaturated with respect to carbonates (#6, 11, 18, 30, 43, 52, 53). However, dissolution of carbonates may occur and contribute to increases in Ca2+ and HCO3− only for one spring #43 from the first group (Ca–HCO3). Other undersaturated mineral waters have a low concentration of Ca2+ and Mg2+ because there are no sufficient carbonate minerals for dissolution. The mineralogical investigations of granite from the Khodja-Obi-Garm (#49) thermal area suggest that the water does not dissolve the vein calcite [12]. Calculated calcite saturation indexes show that waters are close to equilibrium with respect to calcite (Figure 7A).
It is noticeable that, among the third group (Na–Cl (–SO4, –HCO3)), only two samples (#27 and 42) are more saturated with respect to dolomite than calcite. According to the previous geochemical interpretation (Figure 4), the preferential exchange of Ca2+ for Mg2+ in cation-exchange reactions with clay minerals is the most probable for these waters [67].
More than 40% of the waters (20 samples) are typically supersaturated with respect to quartz (Figure 7B), indicating a system dominated by silicate weathering. Quartz supersaturation characterizes the samples from the Pamir and the Southern Tien Shan (Kirgizstan) but not mineral waters from the Northern Tien Shan (Kazakhstan). The supersaturation conditions of the samples do not lead to silica minerals precipitation, which is most probably due to kinetic and hydrologic constraints (continuous flow of groundwater). The majority of the waters, including high salinity and temperature waters, are in equilibrium for quartz. Moreover, no sinter was noted during the fieldwork in 2018 to 2019 or geological surveys [3].
Thermodynamic calculations indicate that all the groundwater samples are undersaturated with respect to halite, thus proving the conservative nature (not getting easily oversaturated) of sodium and chloride. Most mineral water samples were undersaturated with respect to gypsum and anhydrite, but the equilibrium was reached with increasing TDS value (Figure 7C). The dissolution of aluminosilicate minerals, especially albite, anorthite, and plagioclase, is possible for most mineral waters with a TDS range of 0.4 to 2.4 g/L (Figure 7D). The waters with a high TDS are oversaturated or close to equilibrium relative to the primary aluminosilicate minerals.
The equilibrium between fluids, host rocks, and the fluid temperatures at depth can be estimated using different solute geothermometers. The Giggenbach’s method [42], shown graphically in Figure 8A, assumes an average crustal composition that, when altered to produce sericite and chlorite in a hydrothermal system that is saturated in quartz, produces dominantly common silicates and results in the concentration of K, Na, and Mg being fixed by the temperature of the system (shown as the full equilibrium line in Figure 8A) [68].
The fifteen samples occupy positions close to the Mg corner, reflecting their highly immature state. In this case, the application of solute geothermometers, based on the assumption of attainment even of only partial equilibrium, is not justified. Twenty-five samples lie in the area of mixing/dilution, with shallow solutions typically enriched in Mg and a line of dissolution of silicates at low temperature at a constant Na/K ratio when alkali elements increase with time of dissolution. Three thermal manifestations (#11, 31, 42) demonstrate the equilibrium between the fluids and host rocks. The application of geothermometers for them provides realistic estimations of fluid temperatures at depth.
The reservoir temperatures were estimated by several classical chemical geothermometers (SiO2–quartz, chalcedony, Na–K, K–Mg, and Na–K–Ca, Na–Li) and a specific geothermometer for carbonate systems (Ca–Mg) [41]. The Ca–Mg geothermometer provides an equilibrium temperature much higher than 100 °C for waters circulated in crystalline rocks (Table S2). Based on the geological–hydrogeological conditions of the study area and data of thermometry in the several wells [3,4], the calculated temperature values are unreasonably high and are, therefore, rejected. However, for the mineral waters in carbonate rocks and typically CO2-rich waters, the estimated temperatures are much closer to the measured temperatures. If we assume a situation when Na and Ca have not equilibrated between fluid and rock, it is possible to apply the K–Mg geothermometer. Figure 8B shows that equilibrium temperatures of SiO2 (chalcedony) and K–Mg [42] geothermometers correlate well in the temperature interval from 20 to 80 °C. The highest temperatures are estimated for the Pamir area (#48, 47) and the South Tien Shan (#49, 53).
The mixing/dilution processes are indicated for most of the samples located inside the partially equilibrated water area. In order to gain a better understanding of the processes that may take place within the geothermal systems, it seems proper to use mixing models to estimate the reservoir temperature. The silica-enthalpy mixing model suggested by Truesdell and Fournier [69] was used to estimate the temperature of the hot water component of the mixed waters. Enthalpy should be used because, when two waters with different temperatures are mixed, the combined heat contents of those waters are conserved (neglecting small heat of dilution effects) but the combined temperatures are not. All partially equilibrated waters have close SiO2–enthalpy characteristics and are located within gray area on Figure 9, which indicates similar results. Figure 9 shows the results of the application the silica-enthalpy mixing model to the three most representative thermal areas: (a) water with highest temperature (borehole of Khodja-Obi-Garm) with T = 94 °C (#49), (b) Djelandy thermal spring with temperature 79 °C (#48), and (c) Djety-Oguz low-enthalpy waters (#36, 37, 38) which lie close to the equilibrium line on the Giggenbach triangle (Figure 8A). Taking into account that the expected reservoir temperature is to be below 180 °C, the chalcedony controls the silica content of the thermal fluids [70].
The first mixing line connects the thermal water with a temperature of 94 °C (#49) and the cold water. The line intersects the chalcedony curve at an enthalpy of 630 kJ/kg (>150 °C). The second mixing line connects hot thermal waters from the thermal natural spring (#48) and the cold water intersecting with the chalcedony curve at an enthalpy of 530 kJ/kg (>120 °C). The third mixing line plotted based on the data on four springs of the Djety-Oguz area demonstrates an enthalpy of 450 kJ/kg (>110 °C). The results are as follows: (1) during the rising to the surface, the fluid with temperature around 150 °C and SiO2 content of 200 mg/L is mixed with the cold groundwaters within granites of the South Tien Shan mountains (#49); (2) the hot water with temperature as high as 120 °C and SiO2 content as high as 125 mg/L might be found in deep portions of the Pamir (line 2, #48); and (3) the end-member of low-enthalpy thermal water of the Tien Shan is probably presented by the water with 100 mg/L silica content and the temperature about 110 °C.
4.3. Isotopic Composition of Waters
The studied δD and δ18O waters contents are reported in Table S1 and shown in Figure 10A. These data indicate that meteoric precipitation is the typical source of all the types of studied mineral waters (Figure 10A). Deuterium excess value is higher than 7‰ (up to 23.6‰), corresponding to the present-day precipitation over the region [71,72]. According to Liu [72], the d-excess in Tajikistan river waters is in the range from 4.9‰ to 16.9‰, with an average value of 12.5‰, which is slightly higher than the global average precipitation (10‰). Although some waters have elevated temperatures, no geothermal 18O-shift has been detected. Negative d-excess was found only for two samples: the first one is the cold pCO2 waters (d-excess = −15.2‰), and the second is thermal waters (d-excess = −5.0‰). Issyk-Kul Lake waters have a d-excess of about minus 12‰. Neither obvious altitude effects nor temperature control were revealed among the studied waters.
The δ18O and Cl data show that the levels of δ18O remain relatively constant (−9.3 to −17.8) whatever the chloride contents varying between 4 and 7594 mg/L. The increased Cl concentrations compared to other mineral waters evidence mixture with hydrothermal fluids or longer water residence times. The deuterium–chloride relation of the waters is a vital tool for studying the different cooling processes of thermal springs [73]. As shown in Figure 10B, three groups of waters with the deuterium and chloride values having a linear relationship are identified: 1. thermal waters from boreholes within Yili Paleozoic volcanic belt; 2. thermal waters collected on the north and east of Issyk-Kul Lake basin; and 3. the cold high pCO2-rich waters of the Talas Fergans Ridge. These correlations could indicate either the mixing processes with meteoric waters or steam separation processes in high temperature geothermal reservoir, which lead to waters becoming more saline and isotopically heavier [74,75]. The hydrogen isotopes are more affected by evaporation than the oxygen isotopes, which is one of the reasons of δ2H vs. Cl correlation along with absence of δ18O vs Cl correlation. Because high temperature waters reservoirs and steam separation are not expected, the mixing processes are more reliable. Thus, it was shown [76] that the isotopic values of Issyk-Kul Lake and its surrounding high land area are controlled by the isotopic and mass balance between the rapid kinetic evaporation, drainage, and precipitation. It is likely that the heavy waters in Issyk-Kul Lake could significantly contribute to the aquifers of the coastal thermal waters. Figure 10B also indicates that no mixing processes were evident in the Pamir area.
4.4. Chemical and Isotopic Composition of Gases
The chemical compositions (CO2, CH4, N2, O2, H2, He, and Ar) were measured in associated gases of most mineral water manifestations. Isotopic compositions of light elements (δ13C, δ15N, δ13CCH4) in gases of the N2- and CO2-rich waters were made for the first time.
The components of associated gases from the studied fluids are presented in Table S3. Carbon dioxide and nitrogen are the main components of the gases in the fluids. The methane (32 vol.%) was marked only in one cold CO2-rich spring (#27). Nitrogen is very abundant in the gas phase associated with the thermal springs (99%). There is only one high pCO2 thermal spring (T = 60 °C)—Garm-Chasma, which is located on Pamir.
The published data on gas composition and inert gases (Ar, He) are limited (Table S3). Helium content varies from 12 to 1500 ppm in high pCO2 waters and from 240 to 76,000 ppm in the N2-dominated thermal waters (Table S3). The maximal He content (10,000–76,000 ppm) was found in the thermal springs of the Tien Shan (#12, 13, 31, 37, 38), and, according to the He-Ar-N2 diagram [77], it indicates crustal component presence (Figure 11A). In several thermal springs (#37, 38), high content of He could be explained by radiogenic decay [78]. This suggestion is also supported by high 222Rn emanation noted in this area [4].
According to high N2/He (141–1150) and low He/Ar ratios (0.0005–0.07), some gases from the Tien Shan (#17, 23, 25, 26) and Pamir (#46, 47, 49) were identified as air-contaminated samples (Figure 11A,B). The N2/Ar ratios of the other samples vary from 47 to 99 (Figure 11A; Table S2), most of which are mainly ranging between air (N2/Ar = 83.6 [79] and air-saturated waters (ASW, N2/Ar = 38 [80]. The location of these samples’ points to air mixture during the gases are rising to the surface. For two samples (#15, 21), the N2/Ar ratios are higher than air value (Figure 11, Table S3), which may demonstrate the excessive nitrogen occurrence and indicate a nonatmospheric source for N2 (gases produced from maturation of organic matter buried in sedimentary formations and/or gases from igneous and metamorphic basement rocks) [81,82]. Thus, it is evidenced that all studied gases are generated in the atmosphere and the upper crust (Figure 11A). Minissale et al. [78] argue that N2-rich thermal waters tend to the He corner, indicating a very long residence time of the gas phase in a crust affected by U and Th decay.
The isotopic investigations of associated gases have been conducted for the cold mineral waters and the thermal springs (Table S3). Helium isotopes information was taken from several sources [4,10,83,84,85,86,87]. The available 3He/4He data suggest that He associated with many thermal (# 18, 37, 38, 39, 47, 48, 49) and cold mineral springs (#46) is derived from the crust (R/Ra = 0.02–0.1, where Ra = 1.39 × 10⁻⁶ is the 3He/4He ratios in the air). It is contrary to mantle genesis of Djety-Oguz gas samples (#37 and #38), which were classified as mantle-derived gases in Figure 10A. Helium derived from few cold CO2-rich mineral springs within the central Tien Shan (Atbashi Range, #22, 23, 24, Table S3) represents a typical mantle-derived helium signature (3He/4He = 6.0 × 10⁻⁶–2.4 × 10⁻⁶). The other CO2-rich waters from the Pamir (#47) and the South Tien Shan (#26, 27) with 3He/4He ratio vary from 0.1 to 0.4 Ra, and a 4He/20Ne ratio from 1 to 3000 indicates both MORB and radiogenic components (e.g., [87,88,89,90]). This means that small parts of deep sourced He and Ne are added in these samples because the concentrations of He and Ne in meteoric water are low and easily changed by the addition of other sourced He and Ne.
Two main hypotheses were invoked to explain the origin of deeply derived CO2 discharging from gas emissions, thermal (from Pamir, #47), and cold springs: (1) mantle degassing and (2) thermo-metamorphic reactions within the carbonate rocks and/or the metamorphic basement [4]. For CO2-rich waters, values of δ13CPDB vary from −3.0‰ to −10.0‰. On the one hand, that complies with the deep-seated mantle CO2 origin (−4 to −8‰, [91]). On the other hand, for thermal CO2-rich waters of Pamir δ13CCO2 values (−4.5‰ vs. VPDB), a contribution from thermo-metamorphic reactions involving carbonate formations cannot be ruled out. However, the most negative δ13CCO2 value (−10‰) may mark the influence of fractionation of C–isotopes between gaseous CO2 (δ13CCO2 = −1‰–−2‰) and dissolved HCO3 (δ13CHCO3 = +7‰) when deep CO2 reacts with cold groundwaters for a long time. According to several investigations [92,93], given enough contact time between high-pressure dissolved CO2 and a water temperature of 10 °C to 25 °C, the isotope fractionation factor varies from −9.6 to −8.5‰. The δ13CPDB for HCO3 for these waters is positive and varies from +3.6‰ to +10.7‰ (Table S1).
The values of δ13CCO2 of the N2-dominated thermal waters vary from −16.9‰ to −30.2‰, which indicates the biogenic origin of CO2. The δ13CPDB for HCO3 of these waters is also negative and varies from −4.1‰ to −17.7‰ (Table S1).
The presence of methane in gases of Kara-Shoro (#27) CO2-rich mineral waters could evidence the biogeochemical processes (biogenous microbial methane) or thermogenic genesis of methane. The obtained value of δ13C(CH4) for the Kara-Shoro is 33‰PDB, indicating its thermogenic origin. Nevertheless, there are no sufficient data on δ13DCH4, and this question remains a subject for further studies.
The present-day distribution of nitrogen and its isotopes among the different terrestrial reservoirs illustrates the wide-scale 15N-depleted homogeneity of the mantle (δ15N ≈ –5 ± 2‰) compared to the atmosphere (δ15N = 0‰) and crust/sediments (δ15N > 0‰) [94]. As reported by many authors, δ15N values are in the range from +2.2 ± 0.6‰ to +7.7 ± 2.0‰ from low-grade metamorphic rocks to gneiss unit, respectively [95,96,97]. All the studied gas manifestations were divided into two groups by the values of δ15N: (1) N2-rich thermal waters with positive values of δ15N and (2) high pCO2 waters with negative values of δ15N (Table S3).
The highest δ15N values (+4.2–+4.4‰) were found within one thermal manifestation Djety-Oguz (#37, 38, Table S3) and corresponded to δ15N of organic matter or gneiss unit (+3‰ and +7‰, [94]). Often, δ15N values > +4.0 attribute to recycling at subducted sediments, oceanic crust, and lithosphere [98,99]. The genesis of gases with δ15N values ranging from +1.6 to +2.1‰ could be associated with low-grade metamorphic rocks (shale rocks). Most of the other N2-dominated gas manifestations lie in the interval of δ15N from +0.4‰ to +1.4‰ (Table S3), indicating a nonatmospheric N2 source (crust + sediment + atmosphere). Only one point (#32) shows the atmospheric volume of δ15N = 0 (Table S3). Thus, the nitrogen in thermal gases collected within the study area is the result of mixing between atmospheric and crustal sediment components. The 3He/4He ratio supports conclusions about the crust genesis of gases (see above).
The obtained values of δ15N for the high pCO2 mineral waters vary from +0.6‰ to −4.4‰. The lightest δ15N signatures (−2.1‰ to −4.4‰) characterize gases from the Pamir and the Tien Shan, of which the N2 content is low (0.8–2.3 vol.%, Table S3). It could indicate their primary mantle genesis, confirmed by the mantle 3He/4He ratio and δ13CCO2 (see above). The data on CO2-rich waters with higher N2 content (from 9.4 to 56 vol.%) do not appear to show an obvious mantle dependency (δ15N varies from −1.1 to +0.6‰). The derived values are too high for the mantle N2, indicating the mixing of deep-seated gases with N2 from air-saturated waters.
4.5. The Overview of Obtained Regional Tectonic and Geochemical Results
The obtained geochemical results were compared with the findings of regional works and the deep-drilling data (1963–1987) on the Tien Shan (Kazakhstan and Kirgizstan) [3,4,100]. Unfortunately, such data on the Pamir [1] are scarce. The latest geophysical data were also used for the interpretation of the neotectonic conditions within the area [21,22]. The new information on the chemistry and isotopes of gases (especially 13C and 15N) was compared with helium isotopic data [85,87], which allowed to estimate the gas genesis within the Tien Shan and the Pamir for the first time (Figure 11).
The different geological and historical development of the Pamir and the Tien Shan structures exerts a strong influence on the origin and evolution of the thermal and cold mineral waters of these areas. We highlight several geological characteristics of Pamir, which are important for understanding the mineral waters’ origin: (1) the main structural elements of Pamir were formed by the “Karakorum” phase of folding (Lower Cretaceous). After that, the Pamir turned into a stable geosynclinal structure and joined the Variscides of the Tien Shan. Since the Oligocene, similar orogenic movements began in the Pamir and the Tien Shan. However, opposite to the Tien Shan with the movement of rock masses along the lines of tectonic disturbances, Pamir underwent another phase of folding, which was accompanied by effusive magmatism; (2) due to consolidation, the Pamir structure reacted as a rigid body to the orogenic movements in the Neogene and Quaternary periods, and, finally, the deep vertical fractures for water circulation were formed. Thus, the mineralization of waters is not high, up to 3.5 g/L. Such conditions are typical for most of the Pamir structures, except the extreme south-eastern part, where an intermountain basin (Triassic and Jurassic) was formed [18]; (3) the igneous activity in Neogene (central Pamir) led to the emergence of thermal high pCO2 waters not peculiar to the Tien Shan.
Based on our chemical interpretations and geothermal calculations (with geothermal gradient 30 °C/km), the evolution of the mineral waters can be expressed with two vertical hydrochemical zones: (1) the shallow circulation zone of cold or low-enthalpy thermal Ca-HCO3 waters (for both CO2 and N2-rich waters), and (2) the deep circulation zone (>2500 m), where high temperature Na–Cl–HCO3 and Na–SO4 types are formed. The studied Pamir waters (#43, 44, 45, 46, 47) are affected by subsurface processes and not suitable for geothermometry. Their chemical differences depend on the depth of penetration and interaction with different lithotypes and the CO2 partial pressure. Relatively low mineralization of these waters (0.9–3.5 g/L) and low concentrations of easily accumulating trace elements (Br, Al, As, etc.) are conditioned by interaction with crystal rocks. The applied Si-enthalpy mixing model indicates that the hot water with a temperature as high as 120 °C and SiO2 content as high as 125 mg/L may exist in deep horizons of Pamir. The gas isotopic data reveal crust genesis of the N2 and He for this thermal water (#48). Whereas, CO2, N2, and He of CO2-rich water of Pamir comply with the deep-seated mantle origin.
Opposite to Pamir, the evolution of the Tien Shan mineral waters is not limited by vertical hydrochemical zones. The Tien Shan orogen combines high elevations in generally sublatitudinal ranges with depressions filled with Mesozoic to Cenozoic sediments. Another difference is that only cold mineral CO2-rich waters are known in the territory of the Tien Shan. Most of the mineral waters of the Tien Shan were disclosed by the wells, providing more information about geological structures, hydrogeological conditions, geochemical zonality, geothermometry, etc.
Na–Cl and Na–SO4 waters have primary distribution within the study area, while the Ca–HCO3 waters are typically connected with CO2 degasation (Tables S1 and S2). Most of these waters are disclosed by the wells within the northern part of the territory–within an intermountain basin (the Yili, Issyk-Kul) and mountain uplifts (Kungey, Terskey, Kirgis, Sonkel, Fergana, Gissar-Alai).
Within the intermountain basins, the chemical evolution of water is primarily described by the circulation time (as time of water–rock interaction) and the sedimentary rock composition. According to Zhevago [3], the chemical composition of groundwater varies along with changes in the depth of water penetration, as well as from the rim to the central part of a depression. The water from the Chushkala well (#15), located far from the catchment zone, illustrates this conclusion (TDS = 5.3 g/L, with high content of Cl and SO4). Waters from the rim of the depression are basically characterized by low mineralization, 0.4 to 1 g/L (#7, 10, 11). Drilling data also reveal that, at the depth of 1 to 4 km, the Mesozoic and Cenozoic deposits are represented by sandstones, limestones, siltstones, and evaporites, the rock permeability is high, and the underground runoff to deepest Mesozoic sediments was estimated up to 42 m3/day [3,4,100]. It correlates well with data on the meteoric genesis of the mineral water obtained by us, which were sampled from artesian wells of 175 to 800 m depth. [3]. Based on geothermometry, the Kerimagash well (#11) predicts deep reservoir temperature about 110 °C. The Si-enthalpy mixing model applied for N2-dominated thermal water indicates the mixing processes at depth and gives the similar estimated temperature. This correlates well with deep drilling results showing that the maximum aquifer temperature of 97 °C is obtained at the depth of 2730 m in Cretaceous sandstones [3]. The crustal He origin is proved by the high He content (10,000–43,000 ppm) (#12, 13, 31) and available helium isotopy [87]. The values of δ13CCO2 of intermountain waters indicate the biogenic origin of CO2 (−16.9‰ to −30.2‰), which is in compliance with the evolution of sedimentary basins. Additionally, the genesis of nitrogen in the gases is supposed to be the result of mixing between atmospheric and crustal sediment components.
Within the mountain uplifts, the thermal N2-rich waters are typically associated with Paleozoic–Mesozoic granites, granodiorites, or their extrusive equivalents (#1, 16, 10, 17, 32, 33, 34, 39, 40, 42, 49). These waters are widespread within the mountain ranges of North and South Tien Shan, and on the territory of Chinese Tien Shan [17]. The main features of these waters are high pH > 9, F, and Si contents (Table S1). The topography-driven fluid flow follows the faults and shear systems that are generated by the active uplift and neotectonics of the Tien Shan. The water reacts with the granite and dissolves aluminosilicates in dilute H2SO4 derived from sulfide oxidation. As was demonstrated by Bucher et al. [17], water stored in fractured granites may also have a halite-dissolution signature of the halogens. The water mixing/dilution is typical for these waters. During rising to the surface, the fluid with temperature around 150 °C and SiO2 content of 200 mg/L is mixed with cold groundwaters. The gases (He, N2, CO2) demonstrate crustal origin (Table S3).
The most unique manifestation of thermal waters—Djety-Oguz (#36–38)—was formed in complicated geological conditions. The water is associated with Mesozoic–Cenozoic fold (Jurassic silty clays, redbeds), containing intensively faulted Paleozoic (Carboniferous limestones and granites) and Proterozoic (mica schists and gneiss) rocks in the core [16]. According to the previous investigation [4,7,14,16], the genesis of these waters is associated with dilution of Ca–Na–Cl deep-seated waters (TDS = 10–15 g/L) by the ultra-fresh groundwaters that are typical of the Djety-Oguz valley. The original high chloride enrichment and temperature of the water provide intense leaching from acid intrusions that occur within the zone of its circulation, and the disturbance of carbonate equilibrium by mixing of the thermal and fresh cold water leads to the leaching of calcium carbonates. Our results reveal that water evolution includes at least two stages. At the first stage, the Cl–Na waters interact with Proterozoic rocks, where silicate weathering controls the major ion chemistry of calcium, magnesium, and sodium dissolution reaction. At the second stage, waters interact with clays, redbeds, and host limestones, demonstrating the reverse ion exchange reactions. The processes of water mixing/dilution were also detected. The end-member of Djety-Oguz low-enthalpy thermal water is probably presented by the water with 100 mg/L SiO2 and the temperature about 110 °C. The crustal origin of He, N2, and CO2 is proved by the highest He content (49,000–76,000 ppm), low helium isotopy (R/Ra = 0.02–0.03), and positive data of d15N (Table S3). Such low R/Ra values are in line with the very high concentration of total helium that suggests either a long residence of fluids underground or the presence of anomalously high U and Th concentrations [73]. The content of CO2 in gases is less than 0.3%vol., and δ13CCO2 indicates CO2 biogenic origin (−19.5‰ to −21.0‰).
The cold CO2-rich mineral waters are located primarily within the mountain uplifts. The difference in chemical composition of these waters (Ca–HCO3, Ca–HCO3–SO4, Na–Cl–HCO3) depends on the types of host rocks. Thus, the Na–Cl–HCO3 type of water is the result of water–rock interaction with Jurassic sandstones and siltstones (#25, 26, 27). Whereas, Ca–HCO3 and Ca–HCO3–SO4 waters (#19, 21, 22, 23, 24) are being formed during water interaction with Paleozoic (Carboniferous–Ordovician) limestones, a red siltstone–sandstone, and evaporites. The most atmospheric or metamorphic affected springs are Kara-Keche (#21), Beshbelchir (#22), and one from Kara-Shoro (#27). The value of methane determined for Kara-Shoro (#27) suggests its thermogenic genesis.
According to Polyak [85,86,87] and Rybin et al., [10] the mantle He flux is strongly associated with CO2-rich mineral waters in the eastern part of the South Tien Shan (#22, 23, 24, Table S2). For the first time, the isotopic determination of δ15N2 and δ13CCO2 reveals deep-seated mantle genesis of gas flux and supports Polyak’s conclusions that the isotope–helium anomalies are connected with the conjunction zones of epiplatform orogenesis and ancient tectonically stable structures (the Caledonian Kazakh shield and the Precambrian Tarim plate). The obtained isotopic data indicate that the south part of the intracontinental dextral strike-slip Talas–Fergana Fault is the most active and appears to play a significant role in the mantle gas migration to the surface. Based on the δ13CCO2 and δ15N values for the cold CO2-rich mineral waters, the impact of the deep-seated mantle CO2 was defined. Moreover, long time water–gas interaction suggests C-isotopes fractionation. Significantly, high pCO2 waters characterized by negative values of δ15N also suggest a mantle source of N2.
By the geophysical data [21,22], the Tarim Plate subduction probably plays an important role in generating heat flow, which reflects the temperature of the North Tian Shan thermal springs (Figure 12). The results of the magnetotelluric sounding of the Middle Tien Shan [21] allowed assuming that the Precambrian mica-bearing granite–gneisses and metamorphic rocks at a depth of 20 km are characterized by an intense fracturing and high fluid saturation.
5. Conclusions
In this paper, the chemistry and isotopy of the 30 thermal waters, 16 cold mineral waters, and associated gases discharging in the Tien Shan (Kazakhstan, Kirgizia, Tajikistan) and the Pamir (Tajikistan) were presented and discussed. The results showed that all the studied waters are meteoric-originated and represented by three main types: I—temporary hardness Ca–Mg–HCO3 (Ca–HCO3) groundwaters with TDS 0.4–3.8 g/L and temperatures up to 35 °C, II—alkali carbonate Na–HCO3 (Na–Cl–HCO3) groundwaters characterized by higher TDS varying from 2.5 to 7.2 g/L and temperature up to 60 °C, and III—saline groundwaters of Na–Cl, Na–SO4, and Na–Cl–HCO3 types with TDS up to 13.2 g/L and the highest T = 94 °C.
The chemical evolution of mineral waters demonstrates that cation exchange, mineral dissolution, and hydrolysis are dominant evolutionary pathways. Cation exchange (Ca2+ ↔ Na+) is identified as a dominant geochemical process within the evolution of Na–HCO3 and Na–Cl water types. The reverse ion exchange processes, identified for several water manifestations of the Tien Shan, are not typically for the Pamir. Moreover, evaporite dissolution plays an important role in the water chemistry of the mineral groundwaters of the Tien Shan, whereas the salinity of the Pamir mineral waters drives the processes of hydrolysis.
The dislocation of the cold mineral and thermal waters of Central Asia along major regional tectonic structures is provided by topographically driven circulation and well-developed long circulation of waters at the depth of 1 to 4 km in the intermountain valleys. The thermal waters do not get heated by the hot intrusives but are heated up to 50°C due to deep circulation and regional heat flow. The hottest thermal waters are associated with Paleozoic–Mesozoic igneous rocks and located at the South Tien Shan and the Pamir. The high flow rate, water temperature up to 94 °C, a clear meteoric signature of waters, and genesis of associated gases suggest the presence of a very well-developed convective circuit. The dislocation of thermal waters along with earthquake-generating structures also indicates the active penetration zones, suitable for water circulation at great depths.
The determination of δ15N2 and δ13CCO2 has revealed deep-seated mantle genesis of gas flux, which supports previous conclusions that the isotope–helium anomalies are connected with conjunction zones of the Caledonian Kazakh shield and the Precambrian Tarim plate. From a tectonic perspective, the obtained data indicate that the south part of the intracontinental dextral strike-slip Talas–Fergana Fault is the most active and appears to play a significant role in the migration of mantle fluids to the surface.
Supplementary Materials
The following supporting information can be downloaded at: https://www.mdpi.com/article/10.3390/w14060838/s1, Table S1: Hydrogeochemical results including stable isotopes; Table S2. Measured in the field and calculated reservoir temperatures (°C) by different geo-thermometers; Table S3. Chemical and isotopic composition of the associated gases of the Tien-Shan and Pamir.
Author Contributions
Conceptualization, V.L. and G.C.; methodology, V.L. and A.A. (Abdulaziz Abdullaev); software, A.A. (Altyn Aidarkozhina); validation, N.K., I.B., V.L. and G.C.; resources, V.L.; writing—original draft preparation, G.C.; visualization, G.C.; supervision, V.L.; project administration, V.L.; funding acquisition, V.L. All authors have read and agreed to the published version of the manuscript.
Funding
This work was supported by the Russian Science Foundation, grant № 18-17-00245.
Institutional Review Board Statement
Not applicable.
Informed Consent Statement
Not applicable.
Data Availability Statement
Not applicable.
Acknowledgments
The authors thank numerous field assistants for their support and the local population and municipal authorities for the collaboration. We thank M. Chelnokova for the technical editing and comprehensive support. This work was supported by the Russian Science Foundation, grant № 18-17-00245.
Conflicts of Interest
The authors declare no conflict of interest.
References
- Krainov, S.P.; Petrova, N.G. Trace elements of mineral waters pf Pamir. J. Geochem. 1962, 4, 356–366. (In Russian) [Google Scholar]
- Churshina, N.M. Geothermal Investigations in Central Asia and Kazakhstan; M: Nauka: Moscow, Russia, 1985; pp. 95–101. (In Russian) [Google Scholar]
- Zhevago, V.S. Geothermy and Thermal Waters of Kazakhstan; Nauka: Alma-Ata, Kazakhstan, 1972; p. 225. [Google Scholar]
- Matychenkov, V.E.; Imankulov, B.I. Mineral Waters in Kirghizia; Llim: Frunze, Kirghizia, 1987; p. 250. (In Russian) [Google Scholar]
- Volkenshtein, S.K. Ak−su hot springs. In Mineral Waters of the Semirechensk Region; B. И. AндpУcoв: Kazan, Russia, 1901; pp. 3–19. (In Russian) [Google Scholar]
- Prokopenko, N.M. Thermal Water of Pamir; Pamir Expedition: Moscow, Russia, 1932; Volume 1. [Google Scholar]
- Prochukhan, D.P. Ak-su and Dzhety-Ogyz hot springs (Kirghizia). In Geology and Geochemistry of the Tien Shan; Gatalskiy, M.M., Ed.; Proceedings of Kirgizstan. Special Expedition of 1932−1933; Izd. AN SSSR: Moscow, Russia, 1935; Volume II, Part V; pp. 155–184. (In Russian) [Google Scholar]
- Vasilieva, V.N. Formation of Dzhety−Oguz radioactive thermal springs. In Formation and Distribution of Mineral Wafers in the USSR Territory; Ivanov, V.V., Ed.; Gosgeoltehizdat: Moscow, Russia, 1960; pp. 47–50. (In Russian) [Google Scholar]
- Disler, V.N. High pCO2 Mineral Waters of the Tien Shan and Pamir. Hydrogeological Questions of the Mineral Waters; Research Institute of Balneology and Physiotherapy, Nauka: Moscow, Russia, 1977; Volume 34, pp. 192–218. (In Russian) [Google Scholar]
- Rybin, A.K.; Batalev, V.Y.; Bataleva, Е.A. 3He/4He Isotopic Composition in Gases of Thermal Springs of the Tian Shan; VII Int. Symposium: Bishkek, Kyrgyzstan, 2018; pp. 128–134. [Google Scholar]
- Demonova, A.Y.; Kharitonova, N.A.; Korzun, A.V.; Sardorov, A.I.; Chelnokov, G.A. The chemical composition of the nitrogen thermal waters of the balneoclimatic of Khoja-Obi-Garm Spa (Tajikistan). Mosc. Univ. Bulletin. S 4. Geol. 2017, 5, 77–84. (In Russian) [Google Scholar] [CrossRef]
- Demonova, A.; Kharitonova, N.; Bragin, I.; Chelnokov, G.; Ivanov, V. Low-enthalpy thermal waters within Khoja-Obi-Garm field (Republic of Tajikistan). E3S Web Conf. 2019, 98, 01011. [Google Scholar] [CrossRef]
- Kireeva, T.K.; Salikhov, F.S.; Bychkov, A.Y.; Kharitonova, N.A. Chemical Composition and Parameters of Formation of the Waters of Some Thermal Springs in Tajikistan. Geochem. Int. 2020, 58, 423–434. [Google Scholar] [CrossRef]
- Voitov, G.I.; Kucher, M.I.; Denisov, S.A. Features of the water and gas chemistry fate and isotopic composition of CO2 and CH4 in mineral springs of Djete-Oguz. Doklady AN SSSR 1988, 302, 1212–1216. (In Russian) [Google Scholar]
- Abdullaev, A.U.; Voitov, G.I.; Imanbaeva, M.D. Chemical, isotopical and heat flow instabilities of thermal springs of Kirgizstan. In Geothermy of Seismic and Non−Seismic Zones; Nauka: Moscow, Russia, 1993; p. 400. [Google Scholar]
- Matychenkov, V.E. Hydromineral resources of the Issyk−Kul region In Lake Issyk−Kul: Its Natural Environment; Klerkx, J., Imanackunov, B., Eds.; NATO Science Series; Earth and Environmental Sciences; Kluwer Academic Publishers: Dordrecht, The Netherlands; Springer: Amsterdam, The Netherlands, 2002; Volume 13, pp. 59–70. [Google Scholar]
- Bucher, K.; Zhang, L.; Stober, I. A hot spring in granite of the Western Tianshan, China. Appl. Geochem. 2009, 24, 402–410. [Google Scholar] [CrossRef]
- Li, Y.; Pang, Z.; Yang, F.; Yuan, L.; Tang, P. Hydrogeochemical characteristics and genesis of the high−temperature geothermal system in the Tashkorgan basin of the Pamir syntax, western China. J. Asian Earth Sci. 2017, 149, 134–144. [Google Scholar] [CrossRef]
- Krestnikov, V.N.; Nersesov, I.L.; Stange, D.V. The relationship between the deep structure and quaternary tectonics of the Pamir and Tien-Shan. Tectonophysics 1984, 104, 67–83. [Google Scholar] [CrossRef]
- Brunet, M.-F.; Sobel, E.R.; McCann, T. Geological evolution of Central Asian Basins and the western Tien Shan Range. Geol. Soc. Lond. Spec. Publ. 2017, 427, 1–17. [Google Scholar] [CrossRef]
- Medved, I.; Bataleva, E.; Buslov, M. Studying the Depth Structure of the Kyrgyz Tien Shan by Using the Seismic Tomography and Magnetotelluric Sounding Methods. Geosciences 2021, 11, 122. [Google Scholar] [CrossRef]
- Khan, N.G.; Bai, L.; Zhao, J.; Li, G.; Moklesur Rahman, M.; Cheng, C.; Yang, J. Crustal structure beneath Tien Shan orogenic belt and its adjacent regions from multi-scale seismic data. Sci. China Earth Sci. 2017, 60, 1769–1782. [Google Scholar] [CrossRef]
- Mechie, J.; Yuan, X.; Schurr, B.; Schneider, F.; Sippl, C.; Ratschbacher, L.; Minaev, V.; Gadoev, M.; Oimahmadov, I.; Abdybachaev, U.; et al. Crustal and uppermost mantle velocity structure along a profile across the Pamir and southern Tien Shan as derivedfrom project TIPAGE wide-angle seismic data. Geophys. J. Int. 2012, 188, 385–407. [Google Scholar] [CrossRef] [Green Version]
- Molnar, P.; Tapponnier, P. Cenozoic tectonics of Asia: Effects of a continental collision. Science 1975, 189, 419–426. [Google Scholar] [CrossRef]
- Burtman, V.S.; Skobelev, S.F.; Molnar, P. Late Cenozoic slip on the Talas-Ferghana fault, the Tien Shan, central Asia. Geol. Soc. Am. Bull. 1996, 108, 1004–1021. [Google Scholar] [CrossRef]
- Safonova, I.; Seltmann, R.; Kröner, A.; Gladkochub, D.; Schulmann, K.; Xiao, W.; Kim, J.; Komiya, T.; Sun, M. A new concept of continental construction in the Central Asian Orogenic Belt. Episodes 2011, 34, 186–196. [Google Scholar] [CrossRef] [Green Version]
- Schneider, F.M.; Yuan, X.; Schurr, B.; Mechie, J.; Sippl, C.; Kufner, S.K.; Murodkulov, S. The Crust in the Pamir: Insights from Receiver Functions. J. Geoph. Res. Solid Earth 2019, 124, 9313–9331. [Google Scholar] [CrossRef] [Green Version]
- Alekseev, D.V.; Kroner, A.; Hegner, E.; Rojas-Agramonte, Y.; Biske, Y.S.; Wong, J.; Geng, H.Y.; Ivleva, E.A.; Mühlberg, M.; Mikolaichuk, A.V.; et al. Middle to Late Ordovician arc system in the Kyrgyz Middle Tian Shan: From arc-continent collision to subsequent evolution of a Palaeozoic continental margin. Gond. Res. 2016, 39, 261–291. [Google Scholar]
- Biske, Y.S.; Seltmann, R. Paleozoic Tian Shan as a transitional region between the Rheic and Urals−Turkestan oceans. Gond. Res. 2010, 17, 602–613. [Google Scholar] [CrossRef]
- Thomas, J.-C.; Cobbold, P.R.; Shein, V.S.; Le Douaran, S. Sedimentary record of late Paleozoic to Recent tectonism in central Asia—Analysis of subsurface data from the Turan and south Kazak domains. Tectonophysics 1999, 313, 243–263. [Google Scholar] [CrossRef]
- Korjenkov, A.M. General Peculiarities of Neotectonic Structural Forms of the Northeastern Tien Shan. Ph.D. Thesis, Institute of Seismology, AS Kirghiz SSR, Frunze, Russia, 1988; p. 261. (In Russian). [Google Scholar]
- Seltmann, R.; Konopelko, D.; Biske, G.; Divaev, F.; Sergeev, S. Hercynian post−collisional magmatism in the context of Paleozoic magmatic evolution of the Tien Shan orogenic belt. J. Asian Earth Sci. 2011, 42, 821–838. [Google Scholar] [CrossRef]
- Hamburger, M.W.; Sarewitz, D.R.; Pavlis, T.L.; Popandopulo, G.A. Structural and seismic evidence for intracontinental subduction in the Peter the First Range, Central Asia. GSA Bull. 1992, 104, 397–408. [Google Scholar] [CrossRef]
- Yogibekov, D.; Sang, M.; Xiao, W.; Windley, B.F.; Mamadjonov, Y.; Yang, H.; Huang, P.; Aminov, J.; Vatanbekov, F. Late Palaeozoic to Late Triassic northward accretion and incorporation of seamounts along the northern South Pamir: Insights from the anatomy of the Pshart accretionary complex. Geol. J. 2020, 55, 7837–7857. [Google Scholar] [CrossRef]
- Nicholson, K. Geothermal Fluids: Chemistry and Exploration Techniques, 1st ed.; Springer: Berlin/Heidelberg, Germany, 1993; pp. 19–194. [Google Scholar]
- Parkhurst, D.L.; Appelo, C.A.J. A computer program for speciation, batch−reaction, one−dimensional transport, and inverse geochemical calculations. In Water−Resources Investigations Report 99–4259; U.S. Geological Survey: Denver, CO, USA, 1999; 312p. [Google Scholar]
- Fournier, R.O. Chemical geothermometers and mixing models for geothermal systems. Geothermics 1977, 5, 41–50. [Google Scholar] [CrossRef]
- Verma, S.P.; Santoyo, E. New improved equations for, and SiO2 geothermometers by outlier detection and rejection. J. Volcanol. Geotherm. Res. 1997, 79, 9–23. [Google Scholar] [CrossRef]
- Fouillac, C.; Micard, G. Sodium/Lithium ratios in water applied to geothermometry of geothermal reservoirs. Geothermics 1981, 10, 55–70. [Google Scholar] [CrossRef]
- Fournier, R.O. Truesdel, Empirical Na−K−Ca geothermometer for natural waters. Geochim. Cosmochim. Acta 1973, 37, 1255–1275. [Google Scholar] [CrossRef]
- Chiodini, G.; Frondini, F.; Marini, L. Theoretical geothermometers and pCO2 indicators for aqueous solutions coming from hydrothermal systems of medium−low temperature hosted in carbonate−evaporite rocks. Application to the thermal springs of the Etruscan Swell. Italy. Appl. Geochem. 1995, 10, 337–346. [Google Scholar] [CrossRef]
- Giggenbach, W.F. Geothermal solute equilibria. Derivation of Na−K−Mg−Ca geoindicators. Geochim. Cosmochim. Acta 1988, 52, 2749–2765. [Google Scholar] [CrossRef]
- Giggenbach, W.F.; Goguel, R.L. Collection and analysis of geothermal and volcanic water and gas discharges. NZ DSIR Chem. Rep. 1989, 2401, 1–82. [Google Scholar]
- Arnorsson, S.; Bjarnasson, J.O.; Giroud, N.; Gunnarsson, I.; Stefansson, A. Sampling and analysis of geothermal fluids. Geofluids 2006, 6, 203–216. [Google Scholar] [CrossRef]
- Apollaro, C.; Vespasiano, G.; De Rosa, R.; Marini, L. Use of mean residence time and flowrate of thermal waters to evaluate the volume of reservoir water contributing to the natural discharge and the related geothermal reservoir volume. Application to Northern Thailand hot springs. Geothermics 2015, 58, 62–74. [Google Scholar] [CrossRef]
- Magaritz, M.; Nadler, A.; Koyumdjisky, H.; Dan, J. The use of Na−Cl ratios to trace solute sources in a semi−arid zone. Water Resour. Res. 1981, 17, 602–608. [Google Scholar] [CrossRef]
- Dixon, W.; Chiswell, B. The use of hydrochemical sections to identify recharge areas and saline intrusions in alluvial aquifers, southeast Queensland, Australia. J. Hydrol. 1992, 135, 259–274. [Google Scholar] [CrossRef]
- Lloyd, J.A.; Heathcote, J.A. Natural Inorganic Hydrochemistry in Relation to Groundwater: An Introduction; Oxford University Press: New York, NY, USA, 1985; p. 296. [Google Scholar]
- Alfaifi, H.J. Combined graphical and geostatistical technique to determine the hydrochemical processes affecting groundwater chemistry in coastal areas, Western Saudi Arabia. Arab. J. Geosci. 2019, 12, 65. [Google Scholar] [CrossRef]
- Appelo, C.A.J.; Postma, D. Geochemistry, Groundwater and Pollution; Balkema: Amsterdam, The Netherlands, 2005. [Google Scholar]
- Glover, E.T.; Akiti, T.T.; Osae, S. Major ion chemistry and identification of hydro geochemical processes of groundwater in the Accra Plains Elixir. Geoscience 2012, 50, 10279–10288. [Google Scholar]
- Zhu, G.F.; Li, Z.Z.; Su, Y.H.; Ma, J.Z.; Zhang, Y.Y. Hydrogeochemical and isotope evidence of groundwater evolution and recharge in Minqin Basin, Northwest China. J. Hydrol. 2007, 33, 239–251. [Google Scholar] [CrossRef]
- Schoeller, H. Geochemistry of groundwater. In Groundwater Studies—An International Guide for Research and Practice; UNESCO: Paris, France, 1977; Chapter 15; pp. 1–18. [Google Scholar]
- Rittenhouse, G. Bromine in oil−field waters and its use in determining possibilities of origin of these waters. AAPG Bull. 1967, 51, 2430–2440. [Google Scholar]
- Stober, I.; Zhong, J.; Zhang, L.; Bucher, K. Deep hydrothermal fluid−rock interaction: The thermal springs of Da Qaidam, China. Geofluids 2016, 16, 711–728. [Google Scholar] [CrossRef]
- Truesdell, A.H.; Haizlip, J.R.; Armansson, H.; D’Amore, F. Origin and transport of chloride in superheated geothermal steam. Geothermics 1989, 18, 295–304. [Google Scholar] [CrossRef]
- Arnórsson, S.; Andresdottir, A. Processes controlling the distribution of boron and chlorine in natural waters in Iceland. Geochim. Cosmichim. Acta 1995, 59, 4125–4146. [Google Scholar] [CrossRef]
- Drüppel, K.; Stober, I.; Grimmer, J.C.; Mertz-Kraus, R. Experimental alteration of granitic rocks: Implications for the evolution of geothermal brines in the Upper Rhine Graben, Germany. Geothermics 2020, 88, 101903. [Google Scholar] [CrossRef]
- Earle, S.; Krogh, E. Elevated fluoride and boron levels in groundwater from the Nanaimo group, Vancover Island, Sea to Sky. Geotechnique 2006, 43, 1584–1591. [Google Scholar]
- Kharitonova, N.A.; Lyamina, L.A.; Chelnokov, G.A.; Bragin, I.V.; Karabtsov, A.A.; Tarasenko, I.A.; Nakamura, H.; Iwamori, H. The Chemical and Isotope Composition of Nitrogen Thermal Groundwaters of the Kuldur Spa (Jewish Autonomous Region, Russia). Mosc. Univ. Geol. Bull. 2020, 75, 621–635. [Google Scholar] [CrossRef]
- Bragin, I.V.; Zippa, E.V.; Chelnokov, G.A.; Kharitonova, N.A. Estimation of the Deep Geothermal Reservoir Temperature of the Thermal Waters of the Active Continental Margin (Okhotsk Sea coast, Far East of Asia). Water 2021, 13, 1140. [Google Scholar] [CrossRef]
- Chelnokov, G.A.; Bragin, I.V.; Kharitonova, N.A.; Aleksandrov, I.A.; Ivin, V.V.; Chelnokova, B.I. Geochemistry and Conditions of the Formation of the Ulsk Thermal Spring (Coasts of the Sea of Okhotsk, Khabarovsk Krai). Russ. J. Pac. Geol. 2019, 13, 163–175. [Google Scholar] [CrossRef]
- Jenne, E.A.; Ball, J.W.; Buchard, J.M.; Vivit, D.V.; Barks, J.H. Geochemical modeling: Apparent solubility controls of Ba, Zn, Cd, Pb. and F in waters of the Missouri Tri-State Mining Area. In Trace Substances in Environmental; Hemphill, D.D., Ed.; University of Missouri: Columbia, MO, USA, 1980; pp. 353–361. [Google Scholar]
- Langmuir, D.; Melchior, D. The geochemistry of Ca, Sr, Ba andrea sulfates in some deep brines from the Paulo Duro Basin, Texas. Geochim. Cosmochim. Acta 1985, 49, 2423–2432. [Google Scholar] [CrossRef]
- Plummer, N.; Busby, J.; Lee, R.; Hanshaw, B. Geochemical Modelling of the Madison Aquifer in Parts of Montana, Wyoming, and South Dakota. Water Resour. Res. 1990, 26, 1981–2014. [Google Scholar] [CrossRef]
- Apollaro, C.; Caracausi, A.; Paternoster, M.; Randazzo, P.; Aiuppa, A.; De Rosa, R.; Fuoco, I.; Mongelli, G.; Muto, F.; Vanni, E.; et al. Fluid geochemistry in a low-enthalpy geothermal field along a sector of southern Apennines chain (Italy). J. Geochem. Explor. 2020, 219, 106618. [Google Scholar] [CrossRef]
- Drever, J.F. The Geochemistry of Natural Waters: Englewood Cliffs; Prentice-Hall: Hoboken, NJ, USA, 1982; p. 388. [Google Scholar]
- Minissale, A.; Corti, G.; Tassi, F.; Darrahc, T.H.; Vaselli, O.; Montanari, D.; Montegrossi, G.; Yirgud, G.; Selmo, E.; Tecluf, A. Geothermal potential and origin of natural thermal fluids in the northern Lake Abaya area, Main Ethiopian Rift, East Africa. J. Volcanol. Geotherm. Res. 2017, 336, 1–18. [Google Scholar] [CrossRef]
- Truesdell, A.H.; Fournier, R.O. Procedure for estimating the temperature of a hot water component in a mixed water using a plot of dissolved silica vs. enthalpy. J. Res. US Geol. Surv. 1977, 5, 49–52. [Google Scholar]
- Arnórsson, S.; Gunnlaugsson, E.; Svavarsson, H. The chemistry of geothermal waters in Iceland III. Chemical geothermometry in geothermal investigations. Geochim. Cosmochim. Acta 1983, 47, 567–577. [Google Scholar] [CrossRef]
- Bershaw, J.; Lechler, A. The isotopic composition of meteoric water along altitudinal transects in the Tian Shan of Central Asia. Chem. Geol. 2019, 516, 68–78. [Google Scholar] [CrossRef]
- Liu, Q.; Tian, L.D.; Wang, J.L.; Wen, R.; Weng, Y.B.; Shen, Y.P.; Vladislav, M.; Kanaev, E. A study of longitudinal and altitudinal variations in surface water stable isotopes in West Pamir, Tajikistan. Atmos. Res. 2015, 153, 10–18. [Google Scholar] [CrossRef]
- Truesdell, A.H.; Frye, G.A. Isotope Geochemistry in Geothermal Reservoir Studies. In Proceedings of the SPE California Regional Meeting, Bakersfield, CA, USA, 13 April 1977. [Google Scholar]
- Taran, Y.A.; Bernard, A.; Gavilanes, J.-C.; Lunezheva, E.; Cortés, A.; Armienta, M.A. Chemistry and mineralogy of high−temperature gas discharges from Colima volcano, Mexico. Implications for magmatic gas–atmosphere interaction. J. Volcanol. Geotherm. Res. 2001, 108, 245–264. [Google Scholar] [CrossRef]
- Ohba, T.; Hirabayashi, J.; Nogami, K. D/H and 18 O/16 O Ratios of Water in the Crater lake at Kusatsu−Shirane Volcano, Japan. J. Volcanol. Geotherm. Res. 2000, 97, 329–346. [Google Scholar] [CrossRef]
- Ma, L.; Jilili, A.; Li, Y.M. Spatial differentiation in stable isotope compositions of surface waters and its environmental significance in the Issyk-Kul Lake region of Central Asia. J. Mt. Sci. 2018, 15, 254–263. [Google Scholar] [CrossRef]
- Giggenbach, W.F. The composition of gases in geothermal and volcanic systems as a function of tectonic setting. Proc. Int. Symp. Water-Rock Interact. 1992, 8, 873–878. [Google Scholar]
- Minissale, A.; Vaselli, O.; Chandrasekharam, D.; Magro, G.; Tassi, F.; Casiglia, A. Origin and evolution of ‘intracratonic’ thermal fluids from central−western peninsular India. Earth Planet. Sci. Lett. 2000, 181, 377–394. [Google Scholar] [CrossRef]
- Marty, B.; Gunnlaugsson, E.; Jambon, A.; Oskarsson, N.; Ozima, M.; Pineau, F.; Torrsander, P. Gas geochemistry of geothermal fluids at a spreading center: The Hengill area, SW-Iceland. Chem. Geol. 1991, 91, 207–225. [Google Scholar] [CrossRef]
- Hamme, R.C.; Emerson, S.R. The solubility of neon, nitrogen and argon in distilled water and seawater. Deep. Sea Res. Part I Oceanogr. Res. Pap. 2004, 51, 1517–1528. [Google Scholar] [CrossRef]
- Jenden, P.D.; Kaplan, I.R.; Poreda, R.J.; Craig, H. Origin of nitrogen−rich natural gases in the California Great Valley: Evidence for helium, carbon and nitrogen isotope ration. Geochim. Cosmochim. Acta 1988, 52, 851–861. [Google Scholar] [CrossRef]
- Ballentine, C.J.; Lollar, B.S. Regional groundwater focusing of nitrogen and noble gases into the Hugoton−Panhandle giant gas field, USA. Geochim. Cosmochim. Acta 2002, 66, 2483–2497. [Google Scholar] [CrossRef]
- Barabanov, L.N.; Disler, V.N. Nitrogenous Termae of the USSR Ministry of Health Public; Nauka: Moscow, Russia, 1968; 120p. (In Russian) [Google Scholar]
- Sharif-Zade, V.B.; Verkhovskii, A.B.; Loktev, V.A.; Markov, I.M.; Meshik, A.P.; Shukolyukov, Y.A. Isotopes of noble gases in the nitrogen thermal waters and carbon dioxide waters of the southern Pamir. Geokhimiya 1988, 8, 1187–1198. (In Russian) [Google Scholar]
- Polyak, B.G.; Prasolov, E.M.; Kamenskii, I.L.; Elmanova, N.M.; Sultankhodzhaev, A.A.; Chernov, I.G. The isotopic composition of He, Ne, and Ar in the underground fluids of the Tien Shan. Geokhimiya 1989, 1, 87–97. (In Russian) [Google Scholar]
- Polyak, B.G.; Kamenskii, I.L.; Sultankhodzhaev, A.A.; Chernov, I.G.; Barabanov, L.N.; Lisitsyn, A.N.; Khabarovskaya, M.V. Mantle-derived helium in fluids from south-eastern Tien-Shan. Dok. AN SSSR 1990, 312, 721–725. (In Russian) [Google Scholar]
- Polyak, B.G.; Prasolov, E.M.; Tolstikhin, I.N.; Yakovlev, L.E.; Ioffe, A.I.; Kikvadze, O.E.; Vereina, O.B.; Vetrina, M.A. Noble Gas Isotope Data Base. 2015. Available online: http://data.deepcarbon.net/ckan/dataset/523f4bf3−5de4−4c30−9c62−34af0dc62f70 (accessed on 2 February 2022).
- O’Nions, R.K.; Oxburgh, E.R. Helium, volatile fluxes and the development of the continental crust. Earth Planet. Sci. Lett. 1988, 90, 315–331. [Google Scholar] [CrossRef]
- Ueda, A.; Nagao, K.; Shibata, T.; Suzuki, T. Stable and noble gas isotopic study of thermal and groundwaters in northwestern Hokkaido, Japan and the occurrence of geopressured fluids. Geochem. J. 2010, 44, 545–560. [Google Scholar] [CrossRef] [Green Version]
- Álvarez-Valero, A.M.; Sumino, H.; Burgess, R.; Núñez-Guerrero, E.; Okumura, S.; Borrajo, J.; Lozano Rodríguez, J.A. Noble gas variation during partial crustal melting and magma ascent processes. Chem. Geol. 2022, 588, 120–635. [Google Scholar] [CrossRef]
- Whiticar, M.J.; Faber, E.; Whelan, J.K.; Simoneit, B.R.T. Thermogenic and bacterial hydrocarbon gases (free and sorbed) in Middle Valley, Juan de Fuca Ridge, Leg 139. In Proceedings of the Ocean Drilling Programme, Scientific Results, V. 139: College Station, TX (Ocean Drilling Program); Texas A&M University: College Station, TX, USA, 1994; pp. 467–477. [Google Scholar]
- Mook, W.G.; Bommerson, J.C.; Staverman, W.H. Carbon isotope fractionation between dis-solved bicarbonate and gaseous carbon dioxide. Earth Planet. Sci. Lett. 1974, 22, 169–176. [Google Scholar] [CrossRef]
- Giammanco, S.; Krajnc, B.; Kotnik, J.; Ogrinc, N. Temporal analysis of d13C CO2 and CO2 efflux in soil gas emissions at Mt. Etna: A new tool for volcano monitoring. Ann. Geophys. 2017, 60, S0663. [Google Scholar] [CrossRef] [Green Version]
- Cartigny, P.; Marty, B. Nitrogen Isotopes and Mantle Geodynamics: The Emergence of Life and the Atmosphere−Crust−Mantle Connection. Elements 2013, 9, 359–366. [Google Scholar] [CrossRef]
- Bebout, G.E.; Fogel, M.L. Nitrogen−isotope compositions of metasedimentary rocks in the Catalina Schist, California: Implications for metamorphic devolatilization history. Geochim. Cosmochim. Acta 1992, 56, 2839–2849. [Google Scholar] [CrossRef]
- Zhu, Y.; Shi, B.; Fang, C. The isotopic compositions of molecular nitrogen: Implications on their origins in natural gas accumulations. Chem. Geol. 2000, 164, 321–330. [Google Scholar] [CrossRef]
- Mingram, B.; Bräuer, K. Ammonium concentration and nitrogen isotope composition in metasedimentary rocks from different tectonometamorphic units of the European Variscan Belt. Geochim. Cosmochim. Acta 2001, 65, 273–287. [Google Scholar] [CrossRef]
- Agusto, M.; Tassi, F.; Caselli, A.T.; Vaselli, O.; Rouwet, D.; Capaccioni, B.; Caliro, S.; Chiodini, G.; Darrah, T. Gas geochemistry of the magmatic−hydrothermal fluid reservoir in the Copahue–Caviahue Volcanic Complex (Argentina). J. Volcanol. Geotherm. Res. 2013, 257, 44–56. [Google Scholar] [CrossRef]
- Zelenski, M.; Taran, Y. Geochemistry of volcanic and hydrothermal gases of Mutnovsky volcano, Kamchatka: Evidence for mantle, slab and atmosphere contributions to fluids of a typical arc volcano. Bull. Volcanol. 2011, 73, 373–394. [Google Scholar] [CrossRef]
- Akhmedsafin, U.M.; Sadykov, Z.S. Underground Water Flow in Kazakhstan; Nauka: Alma-Ata, Kazakhstan, 1964. (In Russian) [Google Scholar]
Figure 1.
(A) Shaded relief and simplified geological map of the Tien Shan and Pamir, including crystalline basement domes, Paleozoic–Tertiary magmatic rocks, Paleozoic–Mesozoic sutures, and major Cenozoic deformation zones. Map modified from Refs. [19,20,21,22,23]. (B) Simplified cross-sections across the Pamir–Tien Shan shows the dependency of localization of mineral springs with topographic forms from the south to north. Suture zones are represented by magenta dotted lines: Palaeozoic volcanic belt (YVB) in light blue; North Tien Shan (NTS) in green; Middle Tien Shan (MTS) in light orange; South Tien Shan (STS) in orange. Pamir: North Pamir (NP), Central Pamir (CP), and Southern Pamir (SP). Main faults: I—Talas Ferghana Fault; II—Main Pamir Thrust; III—Darvaz Fault; IV-Karakorum Fault.

Figure 2.
Classification of studied waters using Piper diagram. Numbers according to Table S1. White circles—samples from Kazakhstan, black—from Kirgizstan, square—from Tajikistan, diamond—samples from the Chinese Pamir [18].

Figure 3.
The plots of the correlations between main ions for the thermal and cold mineral water manifestations. Symbols as in Figure 2. (A) Cl vs. Na, (B) Ca + Mg vs. Na, (C) HCO3 + SO4 vs. Ca + Mg, and (D) Ca + Mg vs. Na + K with total ionic salinity (TIS) lines.
Figure 3.
The plots of the correlations between main ions for the thermal and cold mineral water manifestations. Symbols as in Figure 2. (A) Cl vs. Na, (B) Ca + Mg vs. Na, (C) HCO3 + SO4 vs. Ca + Mg, and (D) Ca + Mg vs. Na + K with total ionic salinity (TIS) lines.

Figure 4.
Durov plot showing the predominant groundwater facies. I—the first group (blue)—Ca–Mg–HCO3 (Ca–HCO3) groundwaters; II—the second group (purple)—Na–HCO3 (Na–Cl–HCO3) groundwaters; III—the third group (green)—groundwaters of Na–Cl, Na–SO4, and Na–Cl–HCO3 types. The description for fields (“a”–“i”) is given in the text above.

Figure 5.
Relation between CAI1 and CAI2 indexes in studied waters.

Figure 6.
(A) elucidation of saline sources using the variations of Cl/Br ratios; (B) ternary Cl–Li–B diagram of the thermal waters.
Figure 6.
(A) elucidation of saline sources using the variations of Cl/Br ratios; (B) ternary Cl–Li–B diagram of the thermal waters.

Figure 7.
Relationship between: (A) calcite and dolomite saturation indices, (B) quartz saturation indices and TDS, (C) gypsum saturation indices vs. TDS, and (D) albite saturation indices vs. TDS.
Figure 7.
Relationship between: (A) calcite and dolomite saturation indices, (B) quartz saturation indices and TDS, (C) gypsum saturation indices vs. TDS, and (D) albite saturation indices vs. TDS.

Figure 8.
The Na–K–Mg diagram (A) [42] and different geothermometers correlation (B) for the collected thermal discharges.
Figure 8.
The Na–K–Mg diagram (A) [42] and different geothermometers correlation (B) for the collected thermal discharges.

Figure 9.
Silica–enthalpy mixing model for the most representable partially equilibrated water [69]. The chalcedony solubility curve is proposed by Arnorsson et al. [70]; blue represents the area of localization of partially equilibrated water, as established by Figure 7.

Figure 10.
δ2H vs. δ18O (A) and Cl (B) relations in studied waters of the Pamir and the Tien Shan with the Global Meteoric Water Line (GMWL). The dashed line (A) indicates the linear trend of Pamir River samples [72].
Figure 10.
δ2H vs. δ18O (A) and Cl (B) relations in studied waters of the Pamir and the Tien Shan with the Global Meteoric Water Line (GMWL). The dashed line (A) indicates the linear trend of Pamir River samples [72].

Figure 11.
The N2–He–Ar (A) and CO2–N2–Ar (B) ternary plots show the gases’ genesis [77].
Figure 11.
The N2–He–Ar (A) and CO2–N2–Ar (B) ternary plots show the gases’ genesis [77].


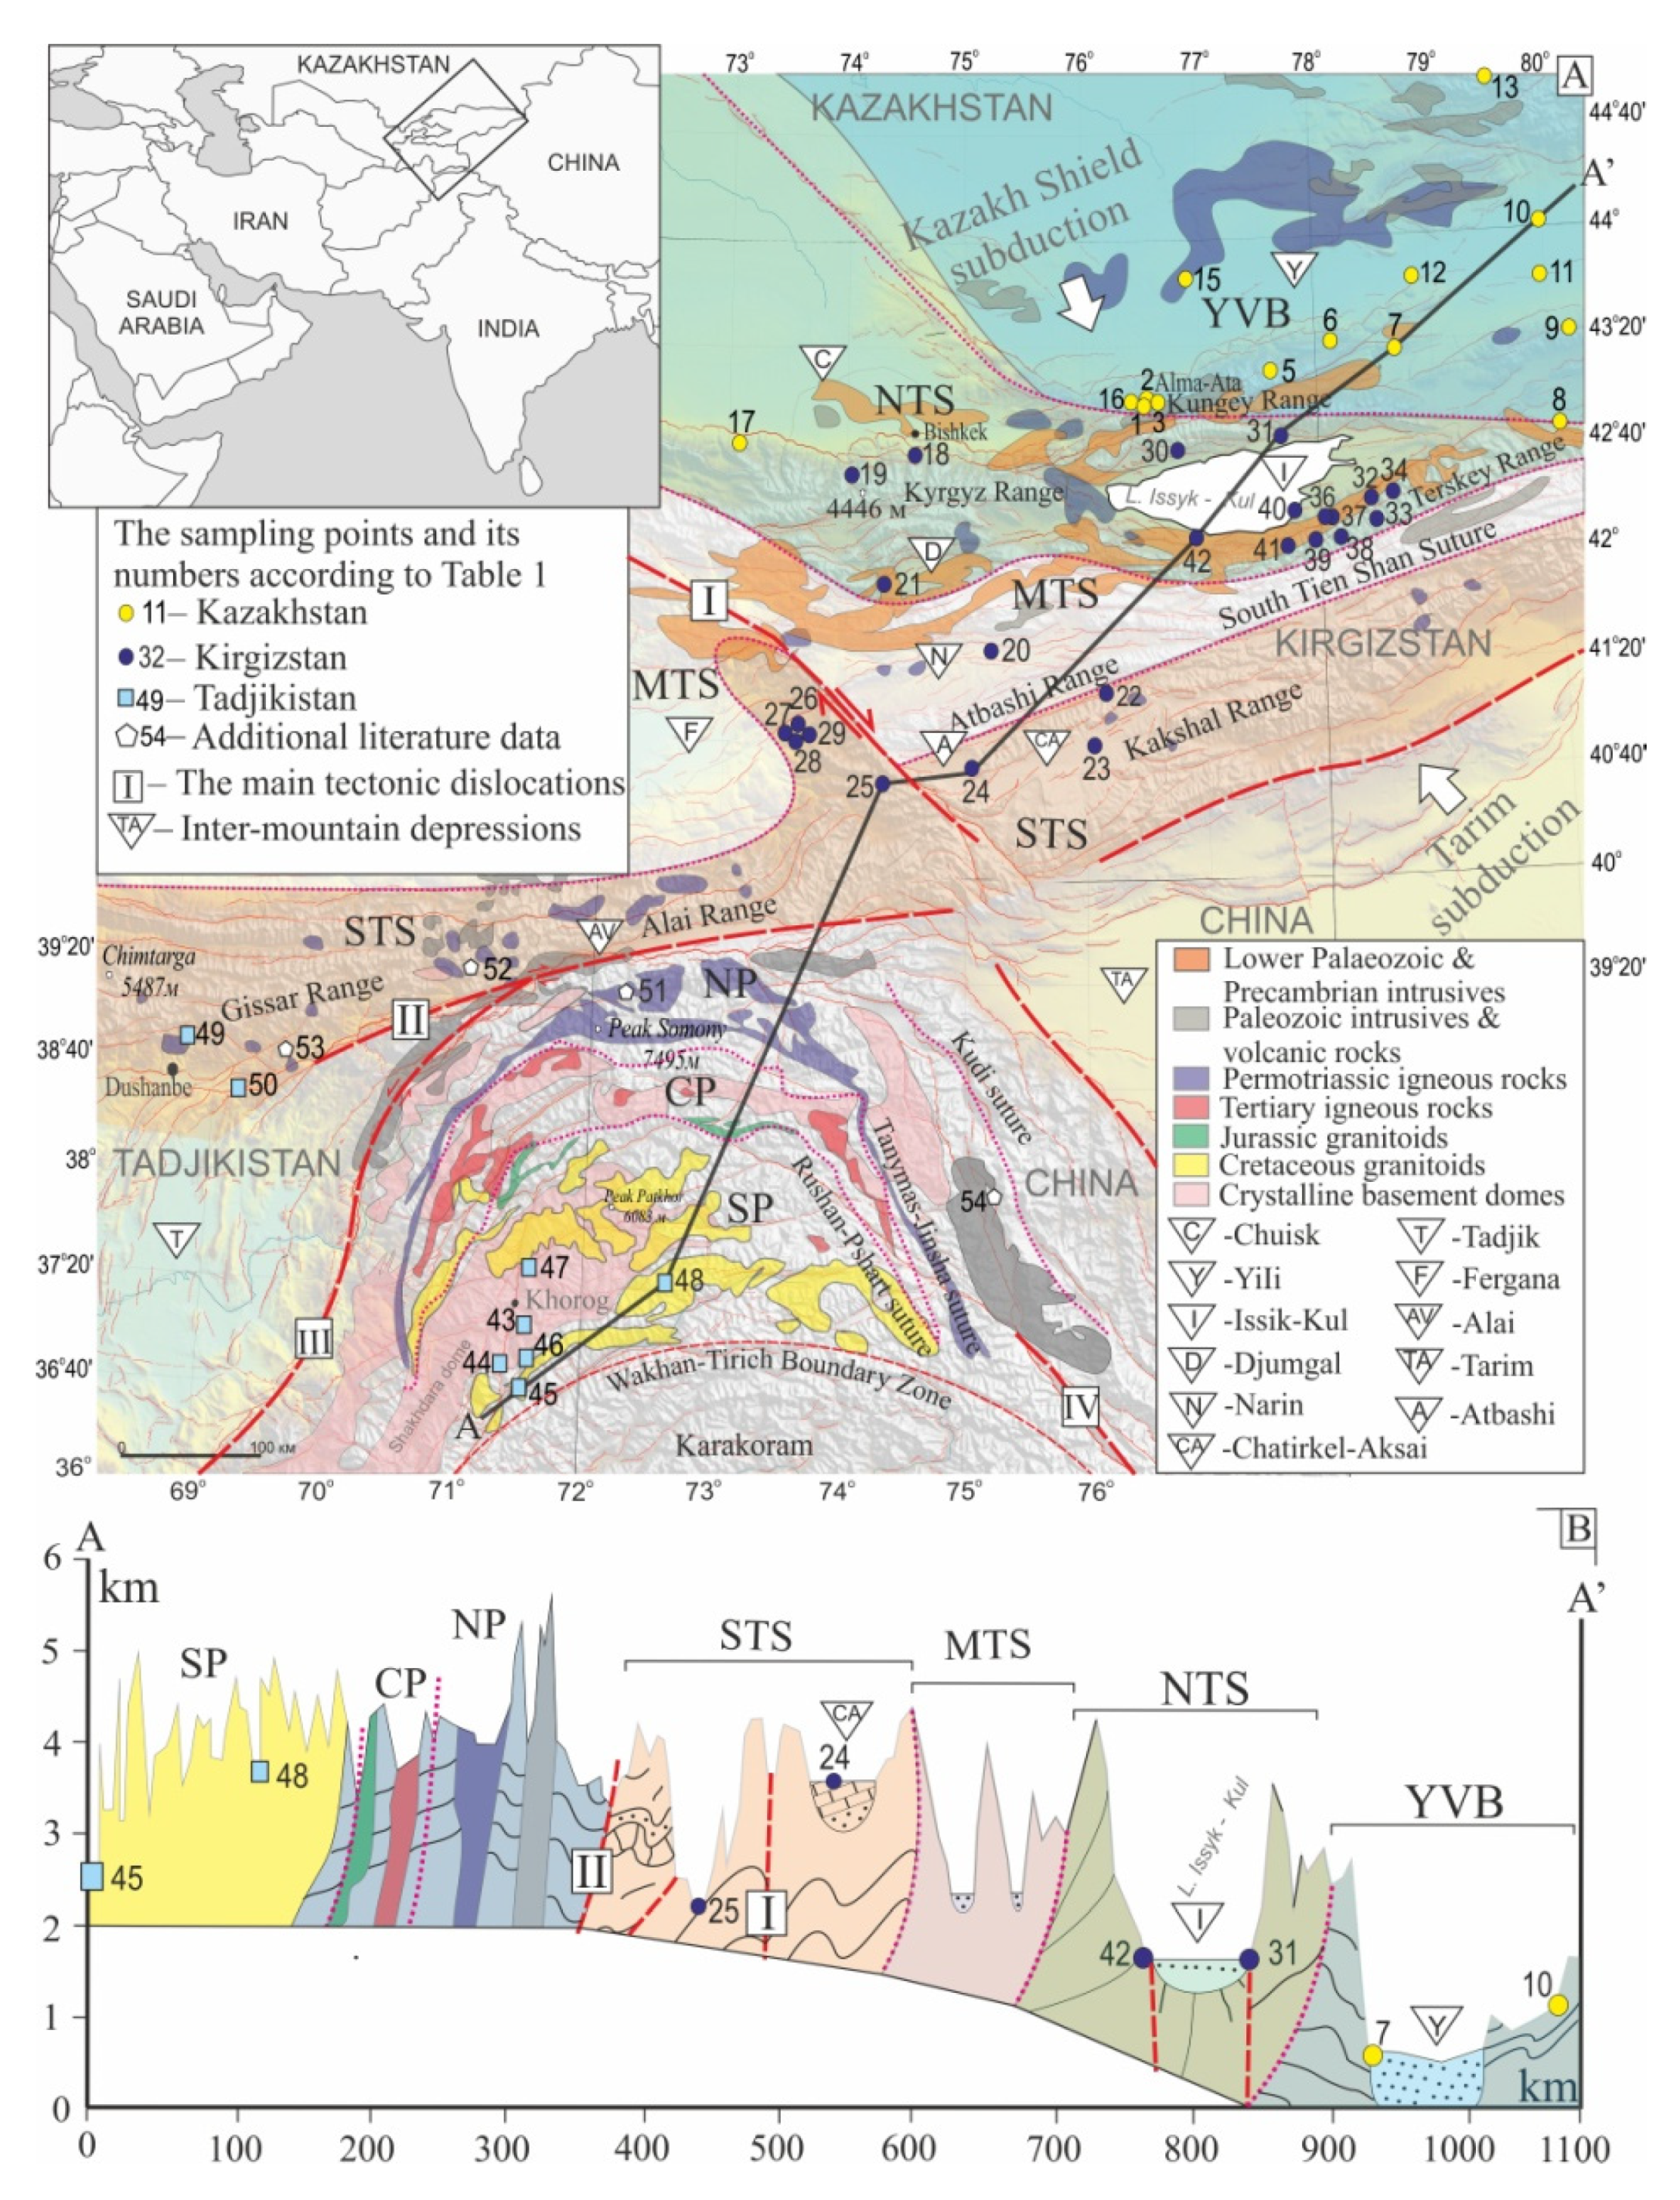
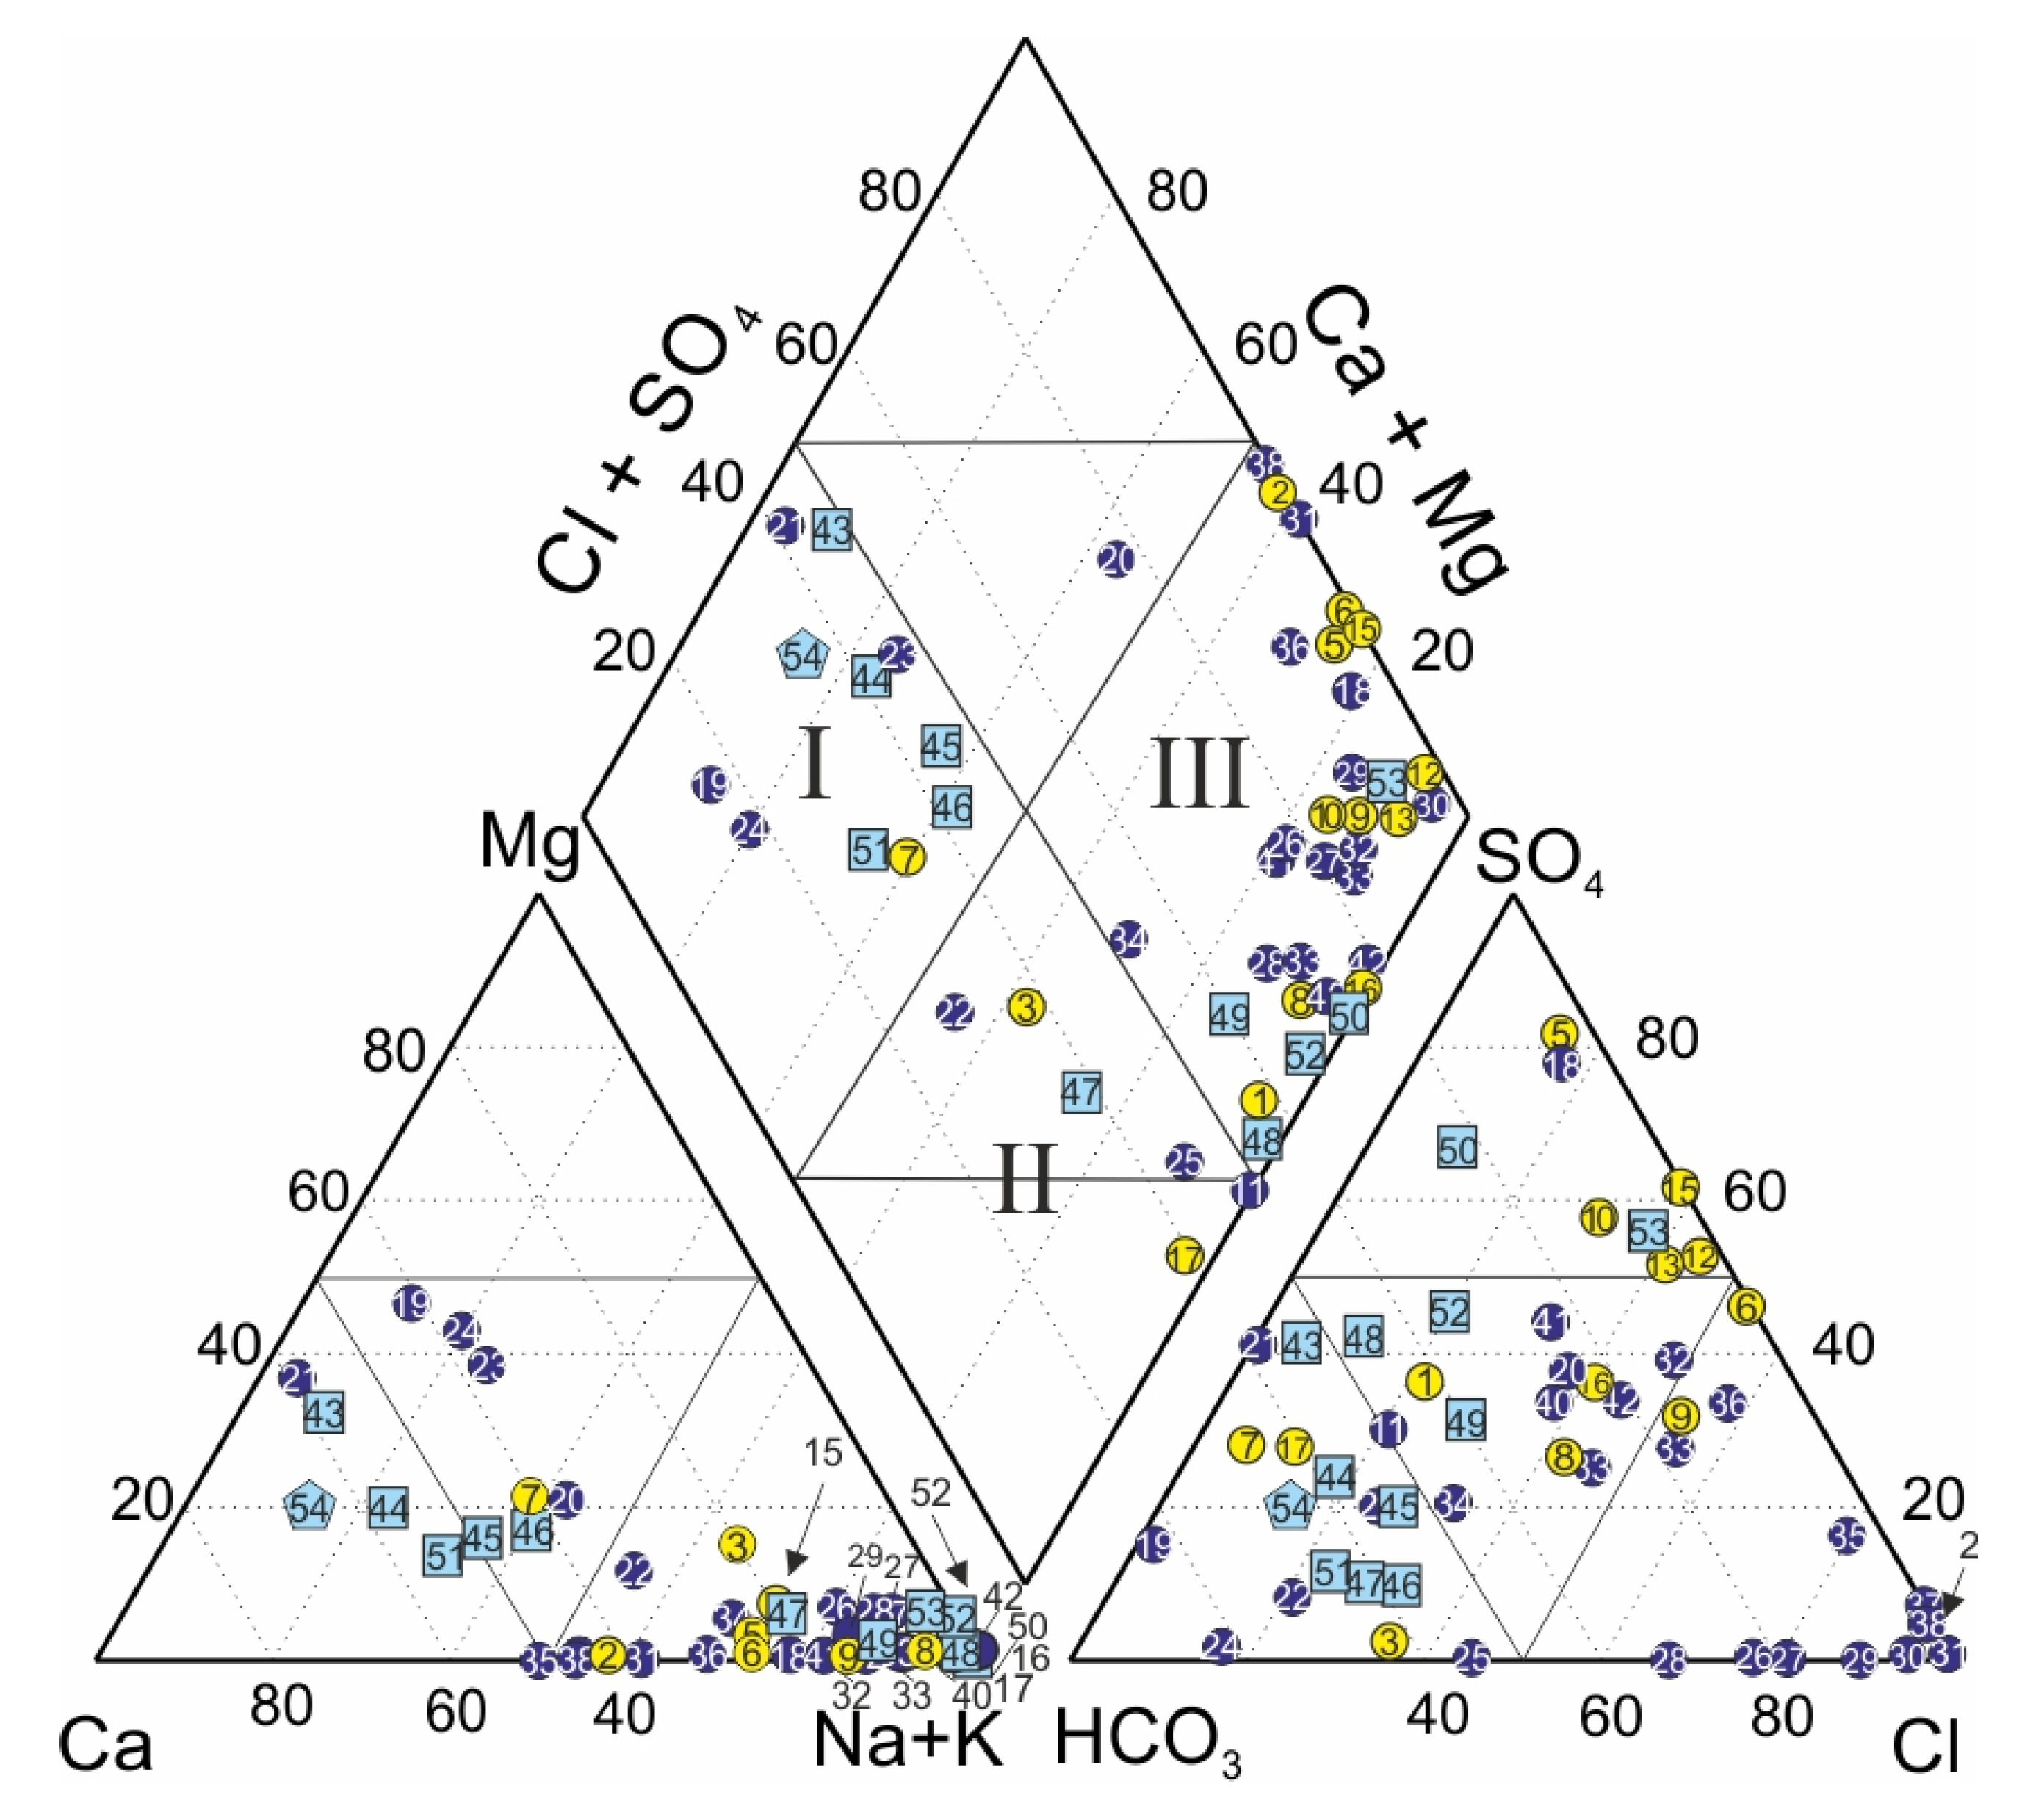
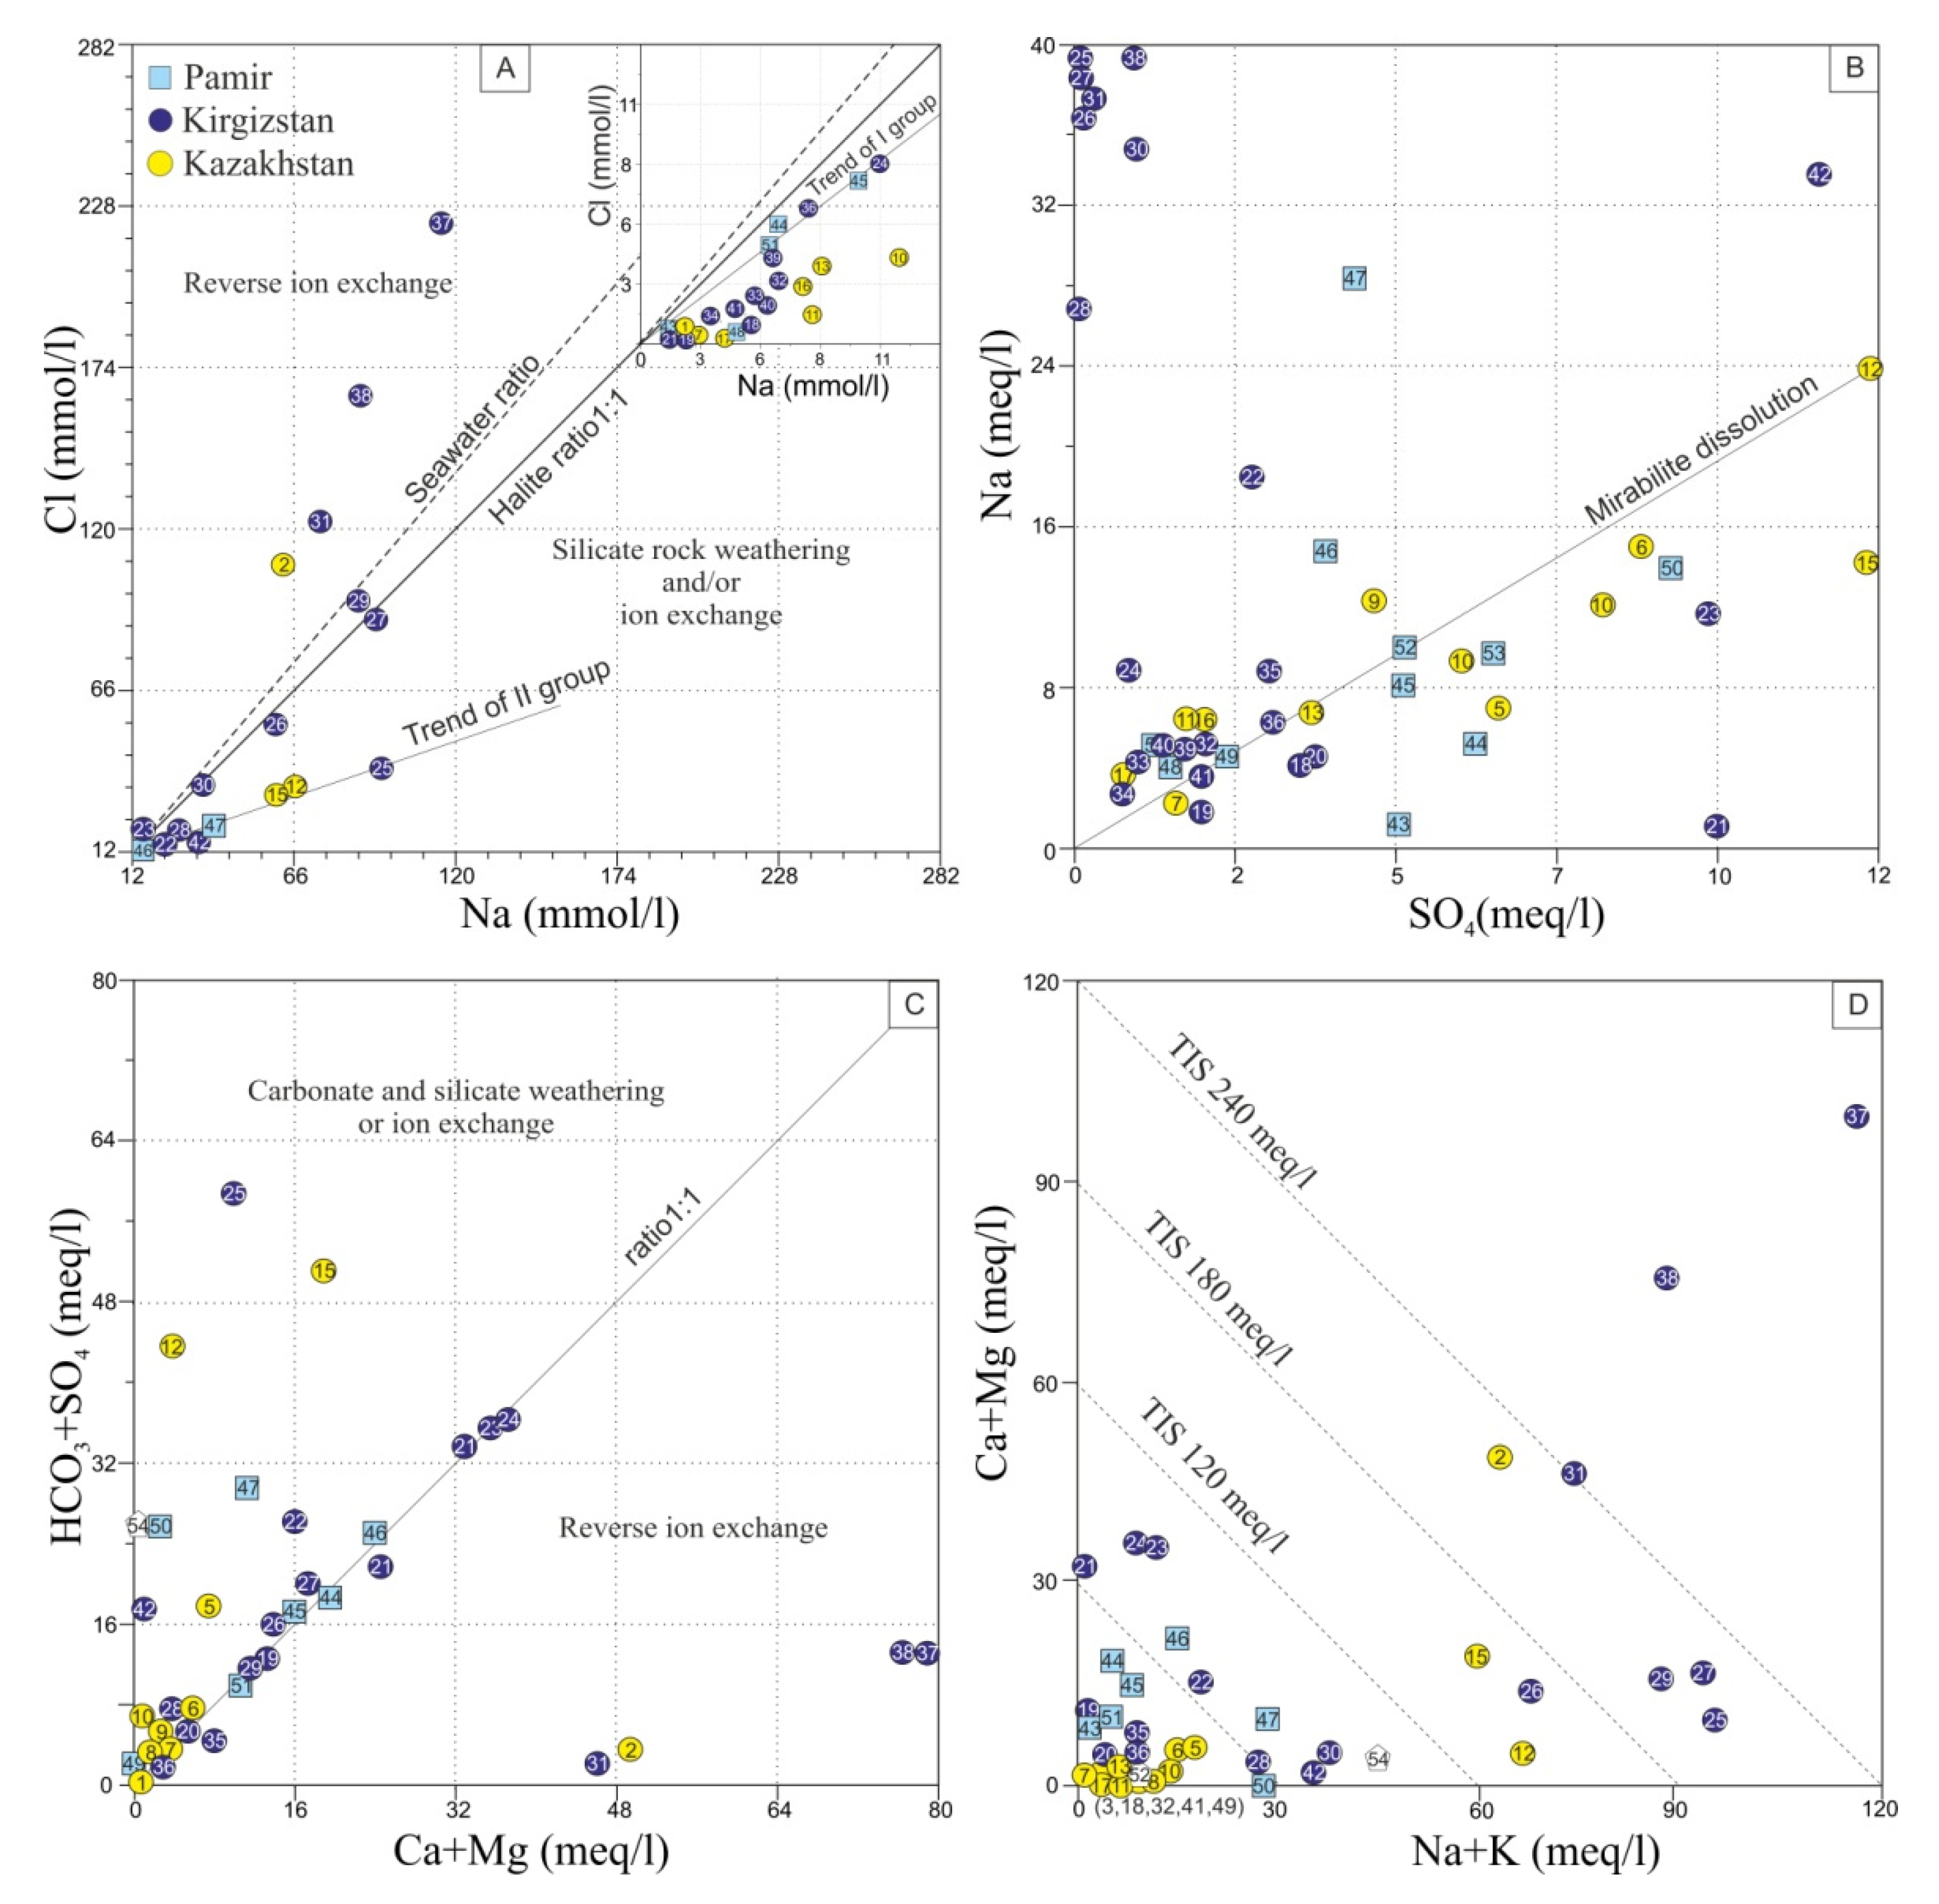
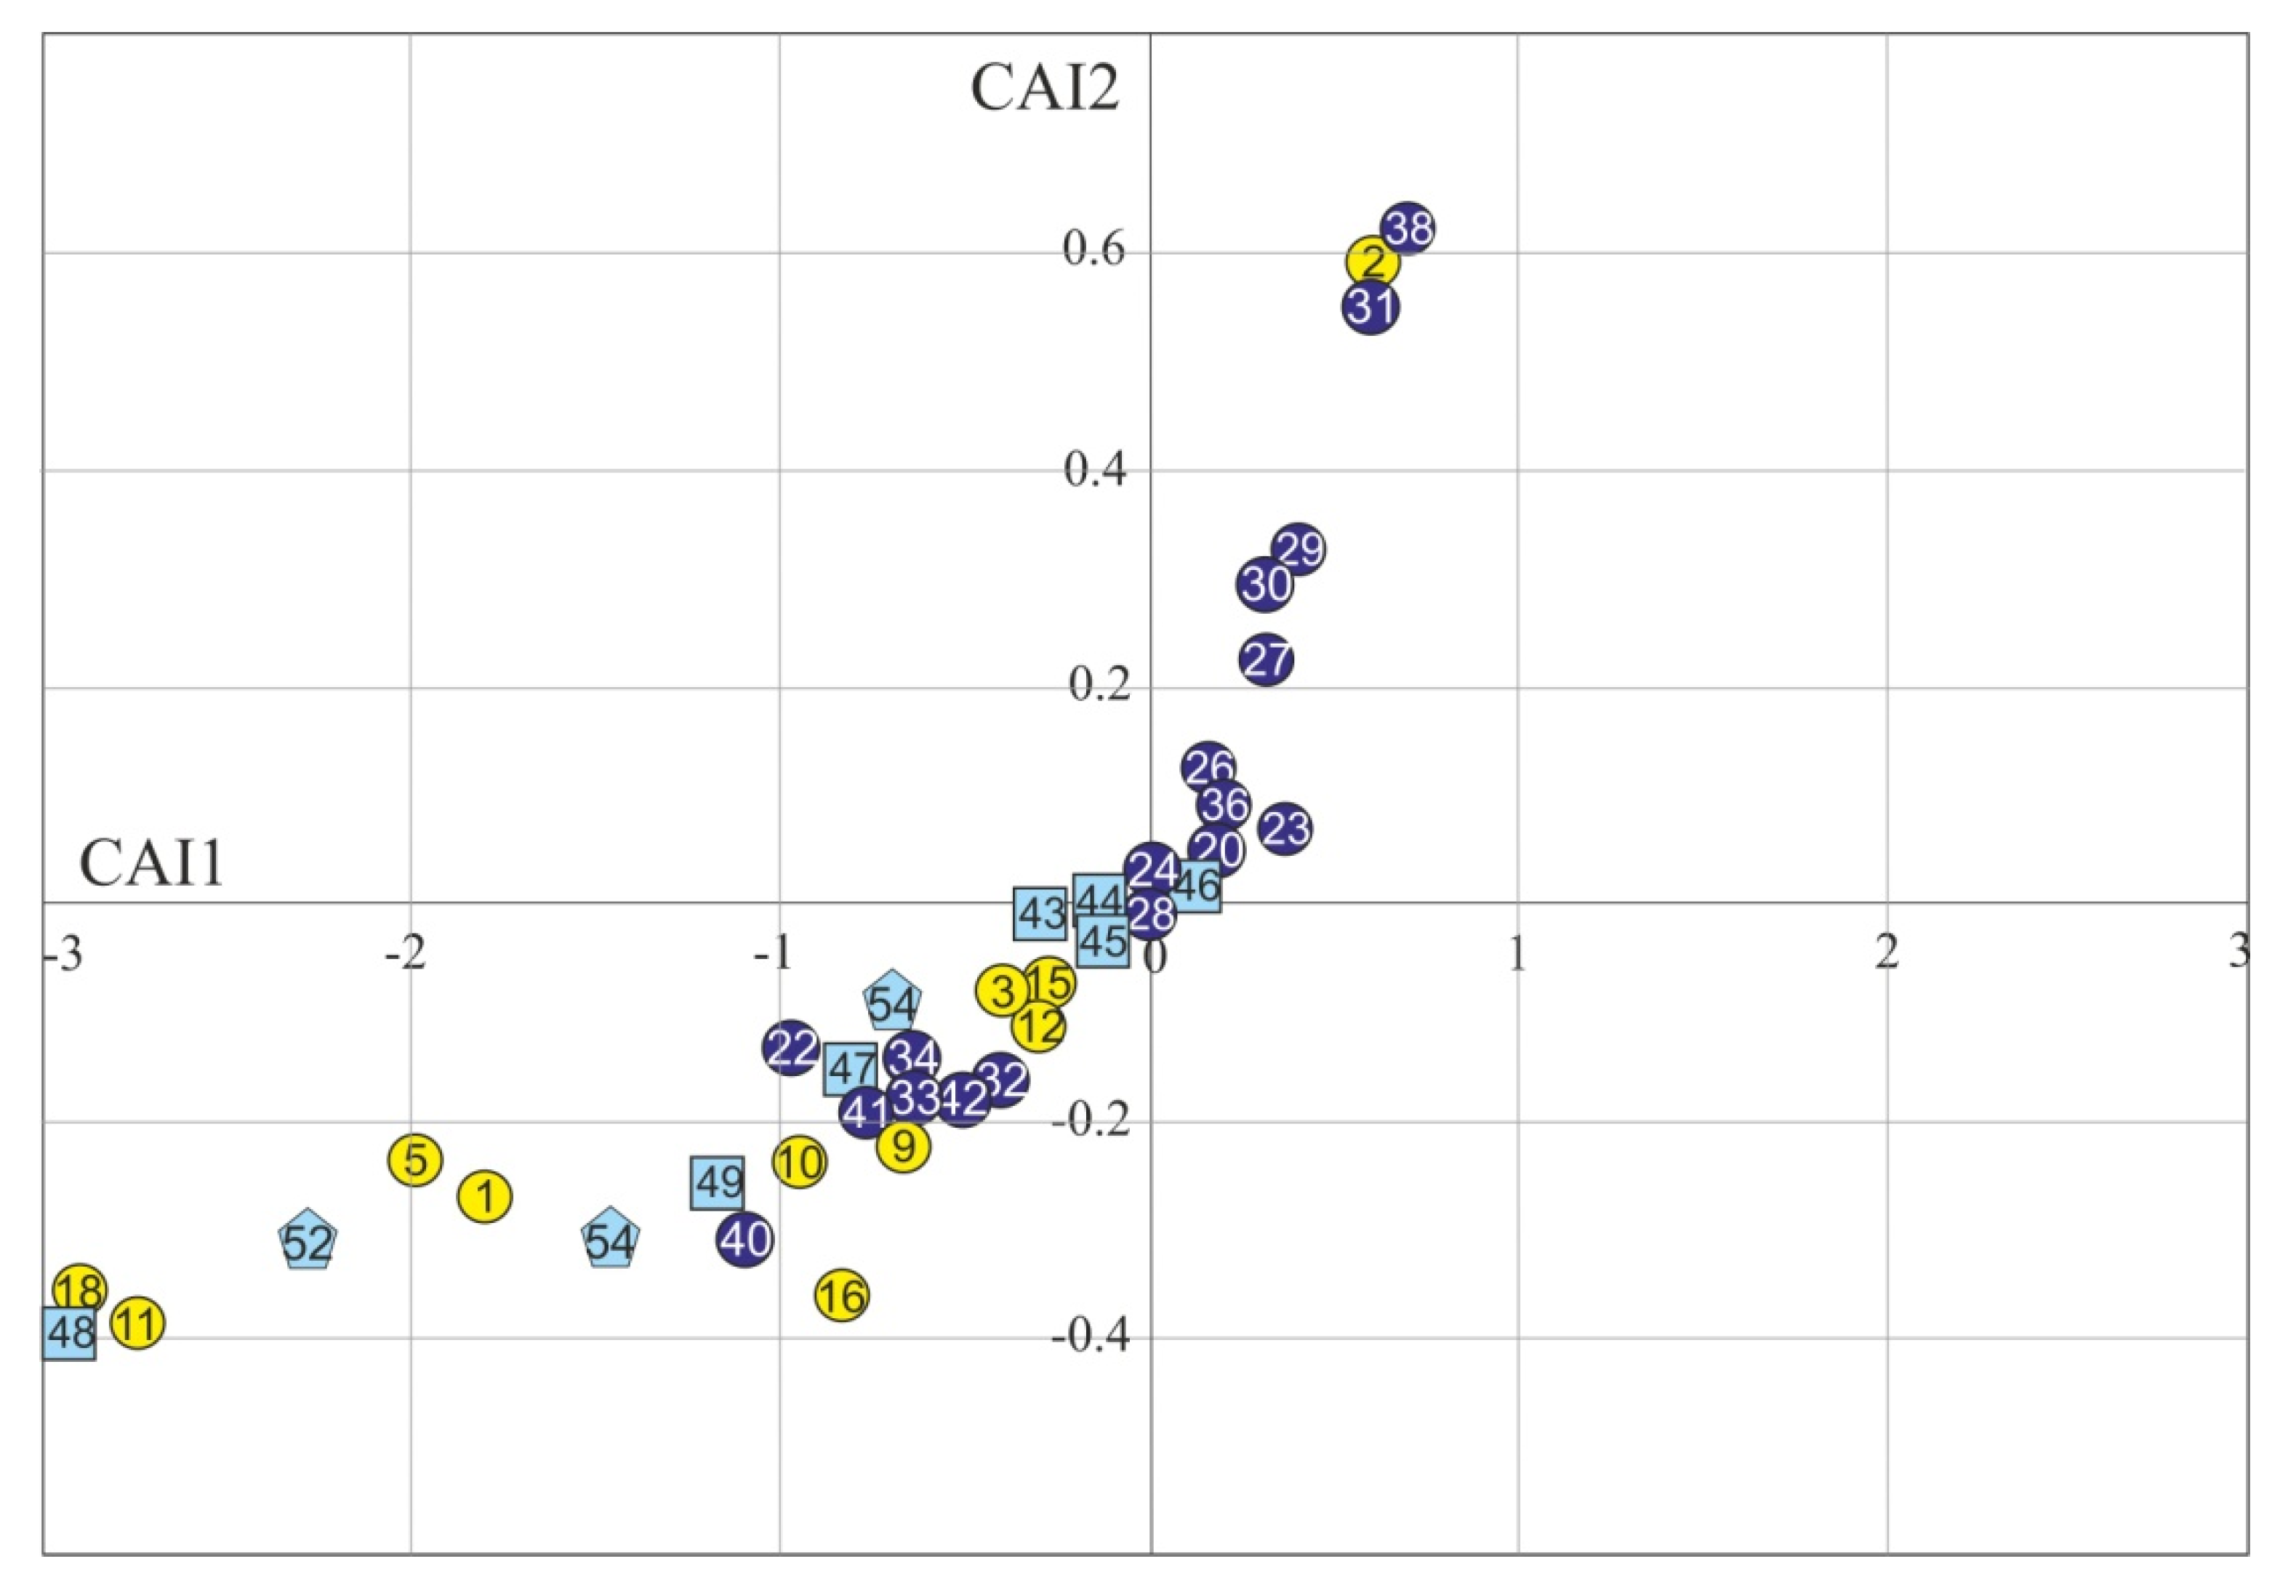
Publisher’s Note: MDPI stays neutral with regard to jurisdictional claims in published maps and institutional affiliations. |
© 2022 by the authors. Licensee MDPI, Basel, Switzerland. This article is an open access article distributed under the terms and conditions of the Creative Commons Attribution (CC BY) license (https://creativecommons.org/licenses/by/4.0/).
Share and Cite
MDPI and ACS Style
Chelnokov, G.; Lavrushin, V.; Bragin, I.; Abdullaev, A.; Aidarkozhina, A.; Kharitonova, N. Geochemistry of Thermal and Cold Mineral Water and Gases of the Tien Shan and the Pamir. Water 2022, 14, 838. https://doi.org/10.3390/w14060838
AMA Style
Chelnokov G, Lavrushin V, Bragin I, Abdullaev A, Aidarkozhina A, Kharitonova N. Geochemistry of Thermal and Cold Mineral Water and Gases of the Tien Shan and the Pamir. Water. 2022; 14(6):838. https://doi.org/10.3390/w14060838
Chicago/Turabian StyleChelnokov, Georgy, Vasily Lavrushin, Ivan Bragin, Abdulaziz Abdullaev, Altyn Aidarkozhina, and Natalya Kharitonova. 2022. "Geochemistry of Thermal and Cold Mineral Water and Gases of the Tien Shan and the Pamir" Water 14, no. 6: 838. https://doi.org/10.3390/w14060838
Note that from the first issue of 2016, this journal uses article numbers instead of page numbers. See further details here.