
SOL40: Forty Years of Simulations under Climate and Land Use Change


Department of Civil and Environmental Engineering (D.I.C.A.), Politecnico di Milano, 20133 Milano, Italy
*
Author to whom correspondence should be addressed.
Water 2022, 14(6), 837; https://doi.org/10.3390/w14060837
Submission received: 18 January 2022
/
Revised: 16 February 2022
/
Accepted: 3 March 2022
/
Published: 8 March 2022
(This article belongs to the Special Issue Climatic Trends and Impacts of Global Change in Europe and in the Mediterranean Basin)
Abstract
:Nowadays, a major issue is land-use change by urban development that alters the catchment response to meteorological events. Urban basins have less storage capacity and more rapid runoff, so urban rivers rise more quickly during storms and have higher peak discharge rates than rural catchments. An exemplary case of this situation is the city of Milan (northern Italy) and its whole territory that extends towards the north collecting meteoric precipitation through the Seveso, Olona and Lambro (SOL) rivers. To assess the impact of anthropogenic development on urban catchment scale hydrology, a reanalysis of 40 years of simulations was carried out with the Curve Number (CN) map based on current land use and compared to simulations using the CN maps based on past land use. A coupled hydro-meteorological system was built that combined a physically based rainfall-runoff hydrological model FEST-WB, developed by the Politecnico di Milano, with the ERA5-Land hourly dataset for the period 1981 to 2020, that was provided by the ECMWF under the framework of the Copernicus Climate Change Service Programme. The study (named SOL40) analyses 40 year trends in the main meteorological (air temperature, precipitation) and hydrological variables (runoff) over the SOL area and tried to quantify and separate the impact of land use change from that of climate change.
1. Introduction
In recent years, the interest of the scientific community in the knowledge and effects of climate change has considerably grown. The number of natural disasters and the associated damage is continuously increasing, in particular in catastrophes related to meteorological and hydrological events [1,2]. For instance, floods are the most frequent catastrophic events in nature, capable of causing severe economic, infrastructural, and social damages. By 2020, it is estimated that 1.47 billion people in the world are exposed to flood risk, with a third in poverty conditions [3].
Italy, where this study is focused, has historically been hit by flood events that have had huge consequences both in economic terms and human lives. The vulnerability of the Italian territory towards these phenomena is well known and documented and is due to geomorphological and climatic aspects and urban and infrastructural development of the post-war period, these latter often carried out without real attention to the hazard for natural events [4].
This fragility becomes serious if we consider that an increase of extreme precipitation is expected in the future, especially in the Mediterranean area [5], although climate models indicate a reduction in total annual rainfall, with a decrease in the number of rainy days [6].
Several studies have attempted to analyse possible changes in the extremes of precipitation in the Mediterranean area, but no consistent trends have been obtained, and results vary significantly depending on the geographical location and analysed period [7,8].
In contrast, recent studies have confirmed the evident increase in the availability of humidity in the lower levels of the atmosphere, especially in the south European area; this increase (in terms of available energy), due to global warming, will result in a climate more prone to triggering severe storms and heavy rainfall in the affected areas [9]. However, in terms of inundations, it does not seem that there has been an increase in the average flow rates in the Italian area in the period 1960–2010, except for areas northwest of Italy and northwest of Europe [10].
As far as the urbanization issue is concerned, its role in altering the hydrological response to intense rainfall is well known; urbanized basins respond more quickly and produce higher flood peaks than rural ones, and therefore urban/construction land will always enhance the problem of flooding, as investigated by [11]. In addition, constructions built near banks of riverbeds can reduce the flow transport capacity, increasing the water level for a given flow rate [12]. Recent research shows that apart from the effects derived from climate change, the real issue that amplifies the damage caused by floods is the diffuse anthropization process, which has caused the loss of the natural hydrographic network that formerly existed in river basins [13] and, therefore, investigating the impact of land cover change in hydrological modelling is essential for water resources management [14]. Hence, climate change and rapid urbanization will be the two main factors responsible for augmented flood rates in the coming decades, and many studies have robustly analysed these aspects, which are considered the most probable causes of this rise in flood hazard [15,16].
Finally, in terms of economic damage, the flood risk can be expressed with the well-known Varnes equation [17], where the risk (and therefore the potential economic loss) precisely grows with the increasing number of citizens exposed to flood events, and with a greater probability of the occurrence of extreme events for those reasons explained above.
Following Nemec [18], “to keep the people away from the water, and not the water away from the people”, in recent years, has led many local authorities, civil protection and research centres to build “non-structural” risk reduction systems such as, for example, real-time alerts to the population, that are supported by innovative, widespread and well-documented hydro-meteorological forecasting systems in the HEPEX community (https://hepex.irstea.fr/, accessed on 15 January 2022).
Following the chain-approach already implemented in real time hydro-meteorological forecasts [19,20,21], the goal of this work was to carry out a hydro-climatological reanalysis over the Seveso, Olona and Lambro (SOL) river basins. The focus was mainly on the Seveso River, an infamous channel for its frequent flood episodes, about 2–3 per year in the last decades [22], that hit the northern area of the city of Milan, causing much economic damage and inconvenience to dwellers, for example as in the 2010 and 2014 events.
The developed coupled system combines the ERA5-Land reanalysis dataset that provides hourly meteorological data from 1981 to 2020 with a spatial resolution of about 9 km, available from the European Centre for Medium-Range Weather Forecasts (ECMWF) as part of the Copernicus Climate Change Service program [23] and the spatially distributed and physically based hydrological model FEST-WB, developed by the Politecnico di Milano [24,25]. Hence, forty years (this explains the name SOL40) of simulation data were available in this reanalysis to reconstruct temperature, precipitation, and runoff data of the past.
The reliability of using climatological reanalysis for hydrological modelling has already been studied in recent years using the old version of ERA5 at 31 km of spatial resolution, with positive results [26,27].
The main benefits of these reanalysis databases are particularly relevant for ungauged areas or those territories with a poor data quality of meteorological observations [28]. Fortunately, in the study area, the hydro-meteorological monitoring network is managed by the Environment Protection Agency of Lombardy Region (ARPA Lombardia), which has collected continuous data since 1998. Nevertheless, this period is considered too limited for a robust climatic analysis of this territory, and consequently, it was necessary to use the above-mentioned ERA5-Land reanalysis dataset to cover at least 30 years of climatological information.
Furthermore, to evaluate the impact of urbanization over the selected hydrological watersheds, various Curve Number (CN) maps were used, derived from land use maps of the Corine Land Cover project (CLC), available from the Copernicus Land Monitoring Change online platform [29], using a similar approach proposed by Basu et al. [14].
Therefore, the main goal of this work was to analyse and separately quantify the effects of land use change and climate change, to understand their influence over these watersheds.
The paper is structured as follows: Section 2 describes the area of study with a focus on the land use change over the Seveso River basin closed at Bovisio-Masciago town. Section 3 reports the ERA5-Land reanalysis dataset, the FEST-WB hydrological model, the observed data coming from available weather stations and the statistical indexes to analyse meteorological data. Section 4 presents the climatic trends for temperature and precipitation values and the hydrological response over the study area, and afterwards, it analyses the climate and land use change and the impact of this latter on discharge values over this catchment.
2. Area of Study
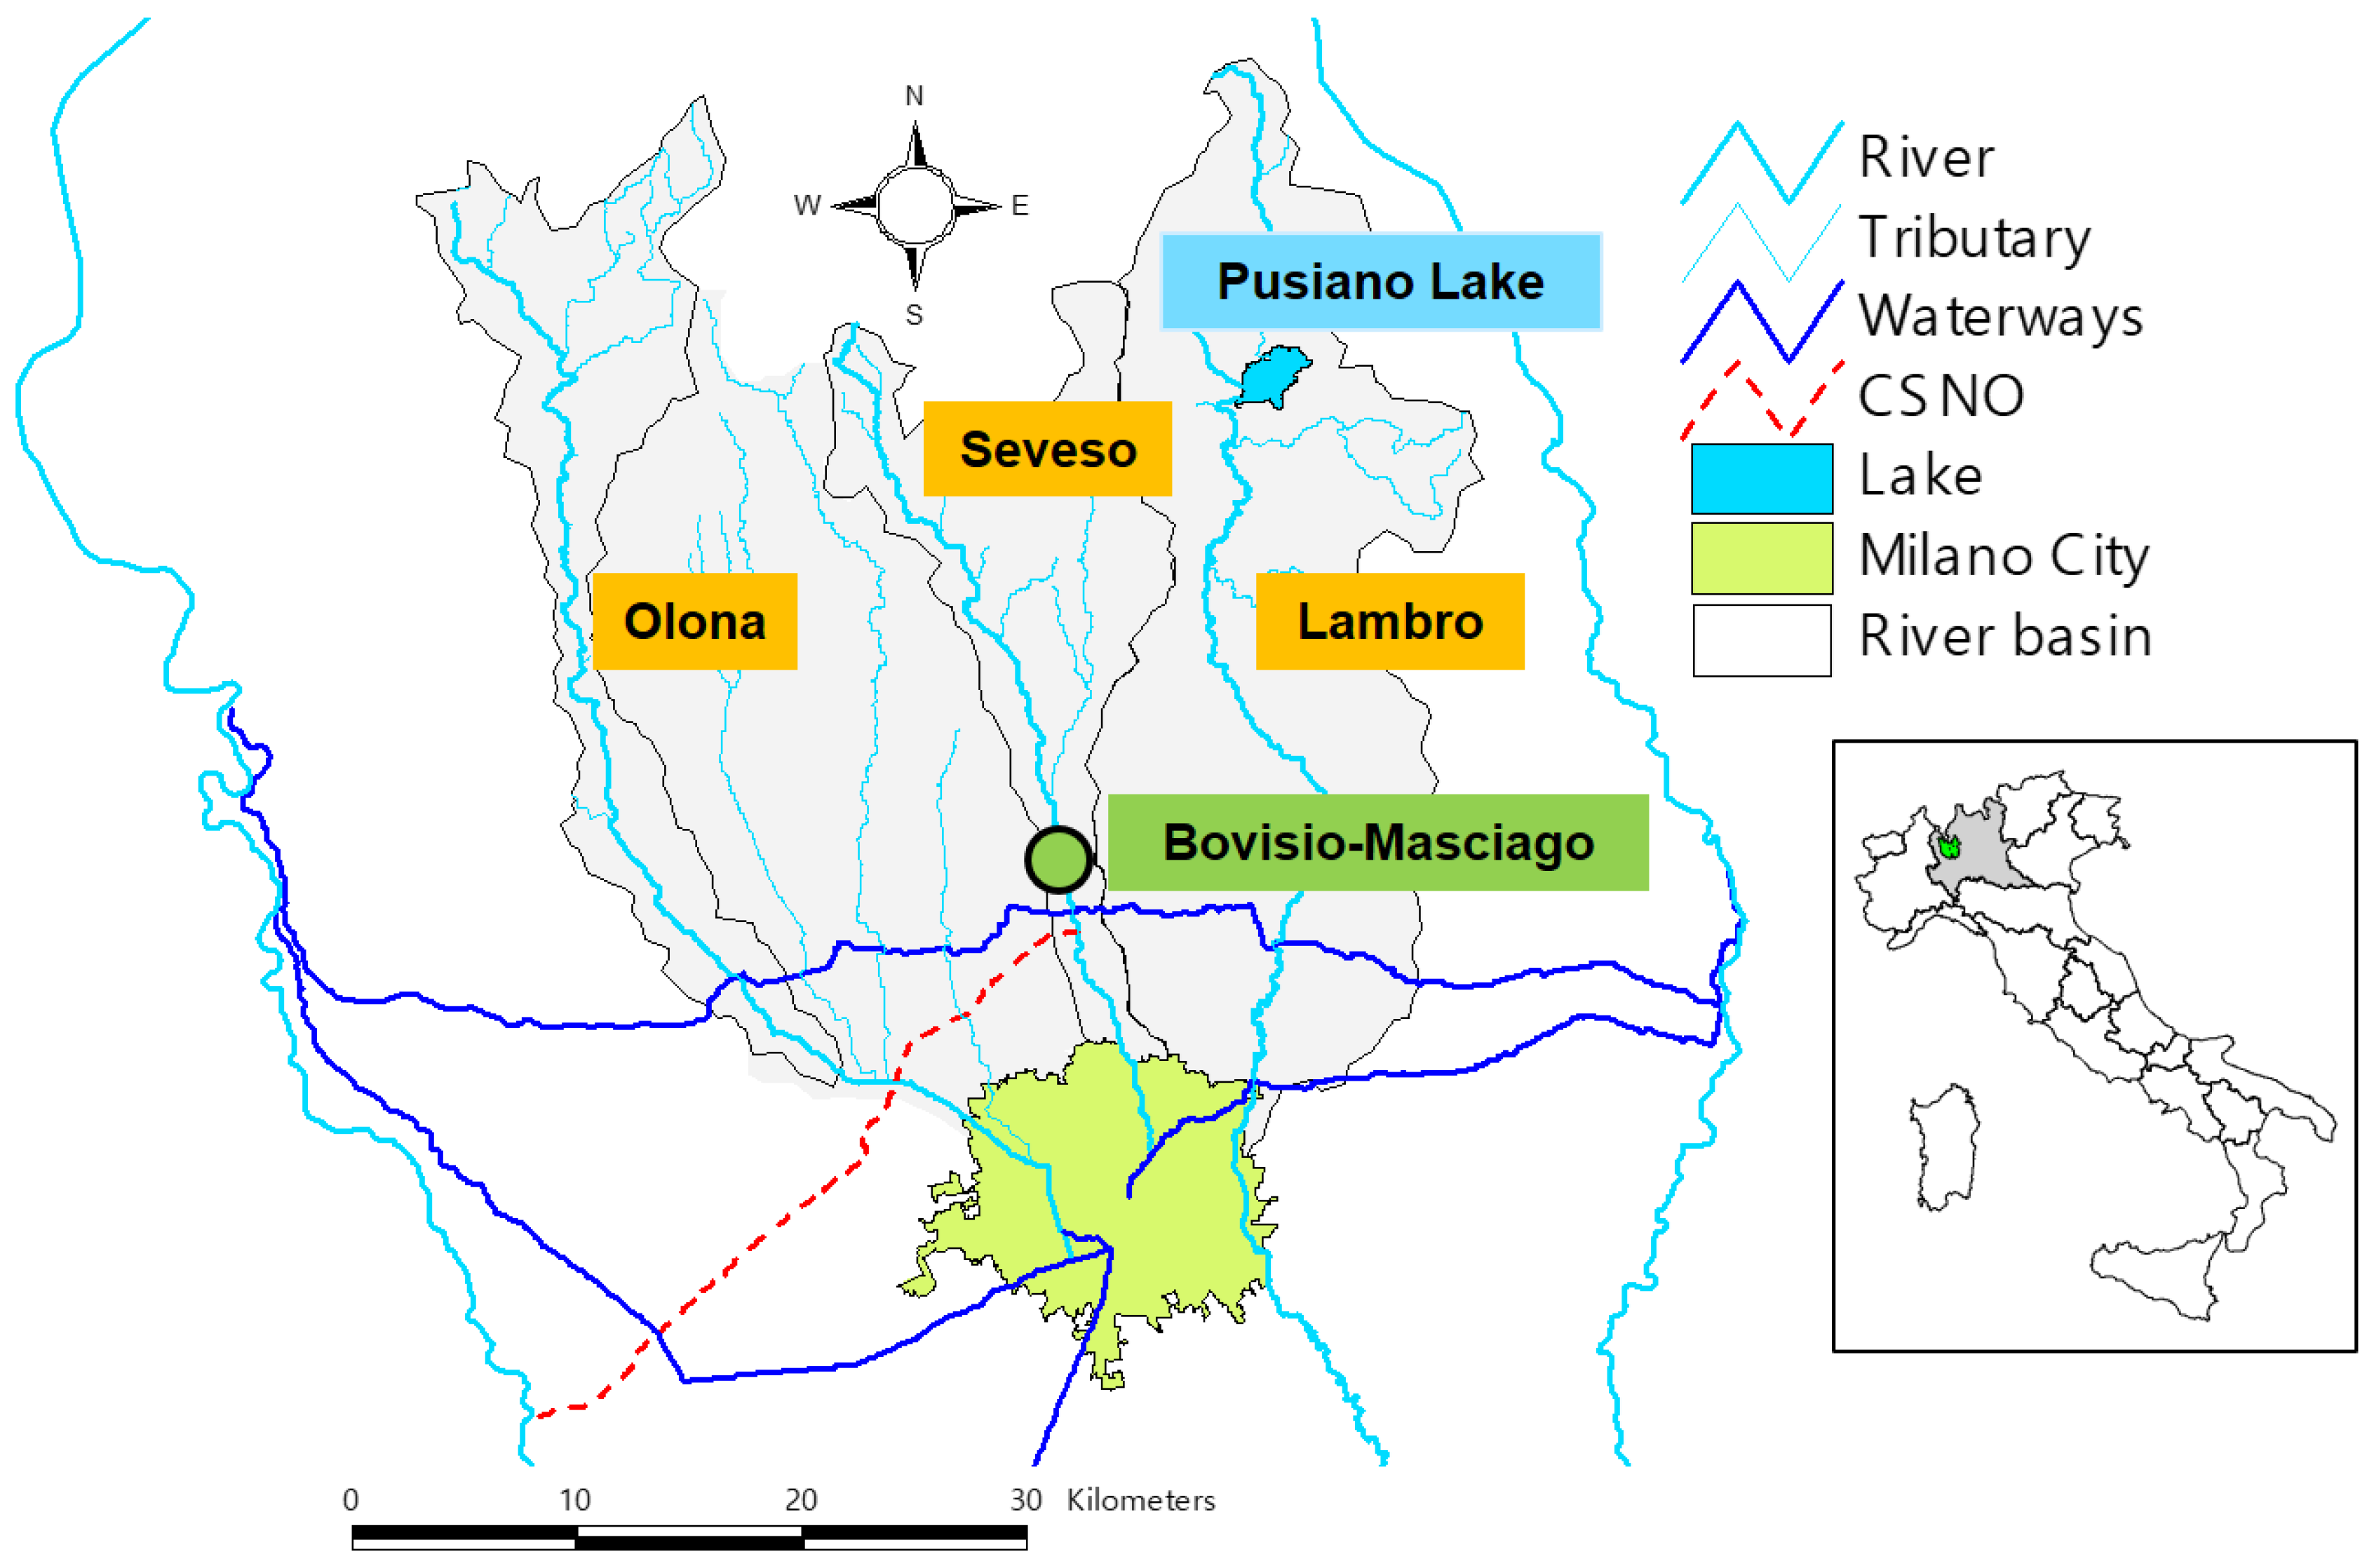
Milano is one of the most populous cities in Italy with 1,316,000 inhabitants living in 182 km2, and it is also one of the most important economic areas with about 5 million people in its immediate area. A large region from the Italian Prealps drains to Milano. The main rivers are the Lambro (catchment area of 500 km2), the Seveso (catchment area of 207 km2), and the Olona (catchment area of 208 km2), plus several minor tributaries for a total drainage surface area of about 1300 km2.
In the past, the Milano urban area has been subjected to a high flood hazard and, in fact, starting from the 1970s a series of risk mitigation measures were adopted with the aim of reducing the excessive discharges flowing through the urban areas. However, the complex flood protection system of the city did not completely succeed in recent years, and a new project to build detention basins in the next years has already been planned.
As all these three catchments are affected by structural measures: the Ponte Gurone dam over the Olona basin, the north-west spillway channel (which is an acronym of the Italian Canale Scolmatore Nord-Ovest, CSNO) over the Seveso basin, and the regulated Pusiano lake in the Lambro River basin, in order to carry out this study we selected a section of the Seveso River upstream of the CSNO and all analyses were performed on this trunk of river basin closed at the Bovisio-Masciago gauge section (Figure 1).
Land Use Change
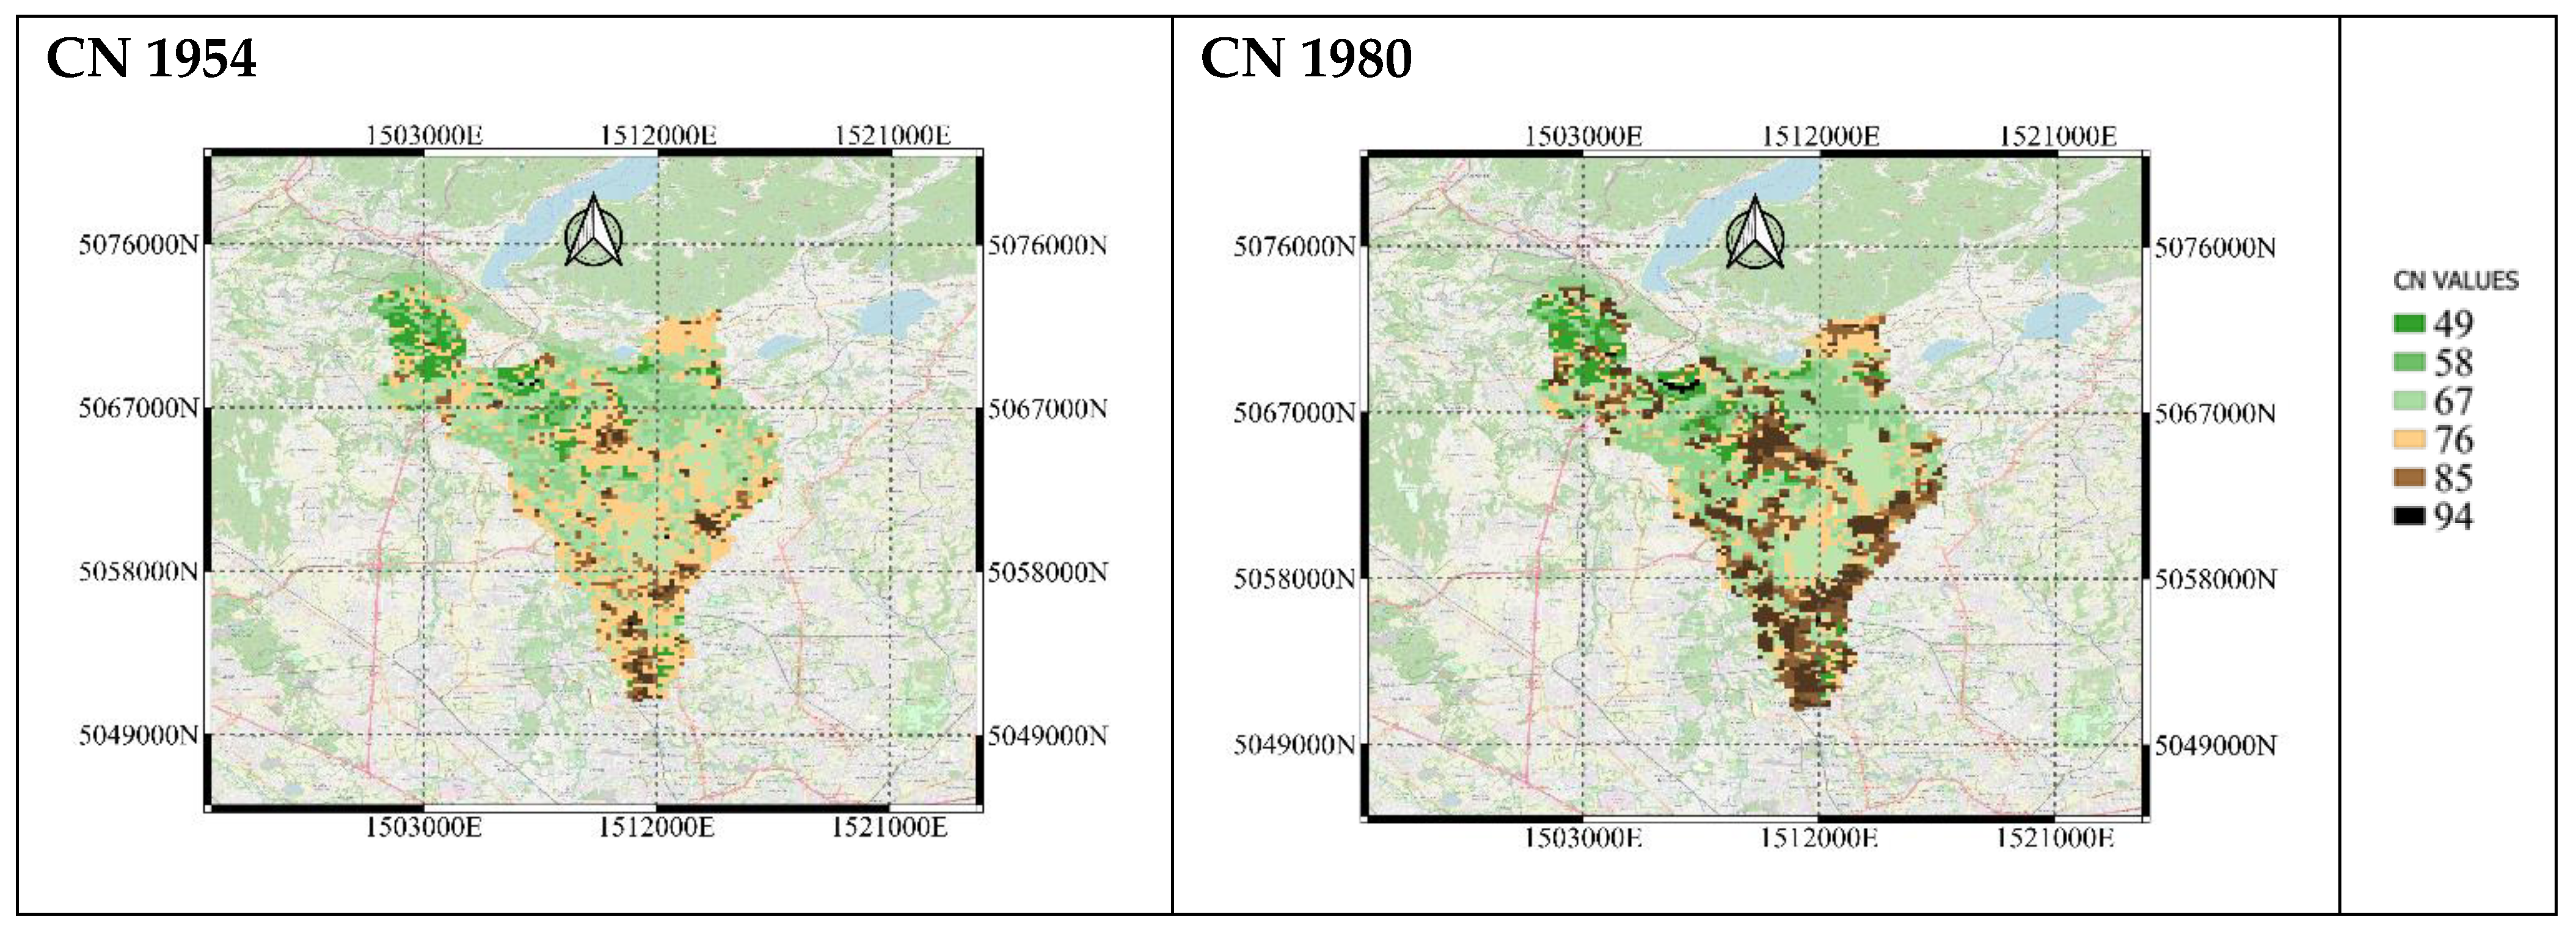
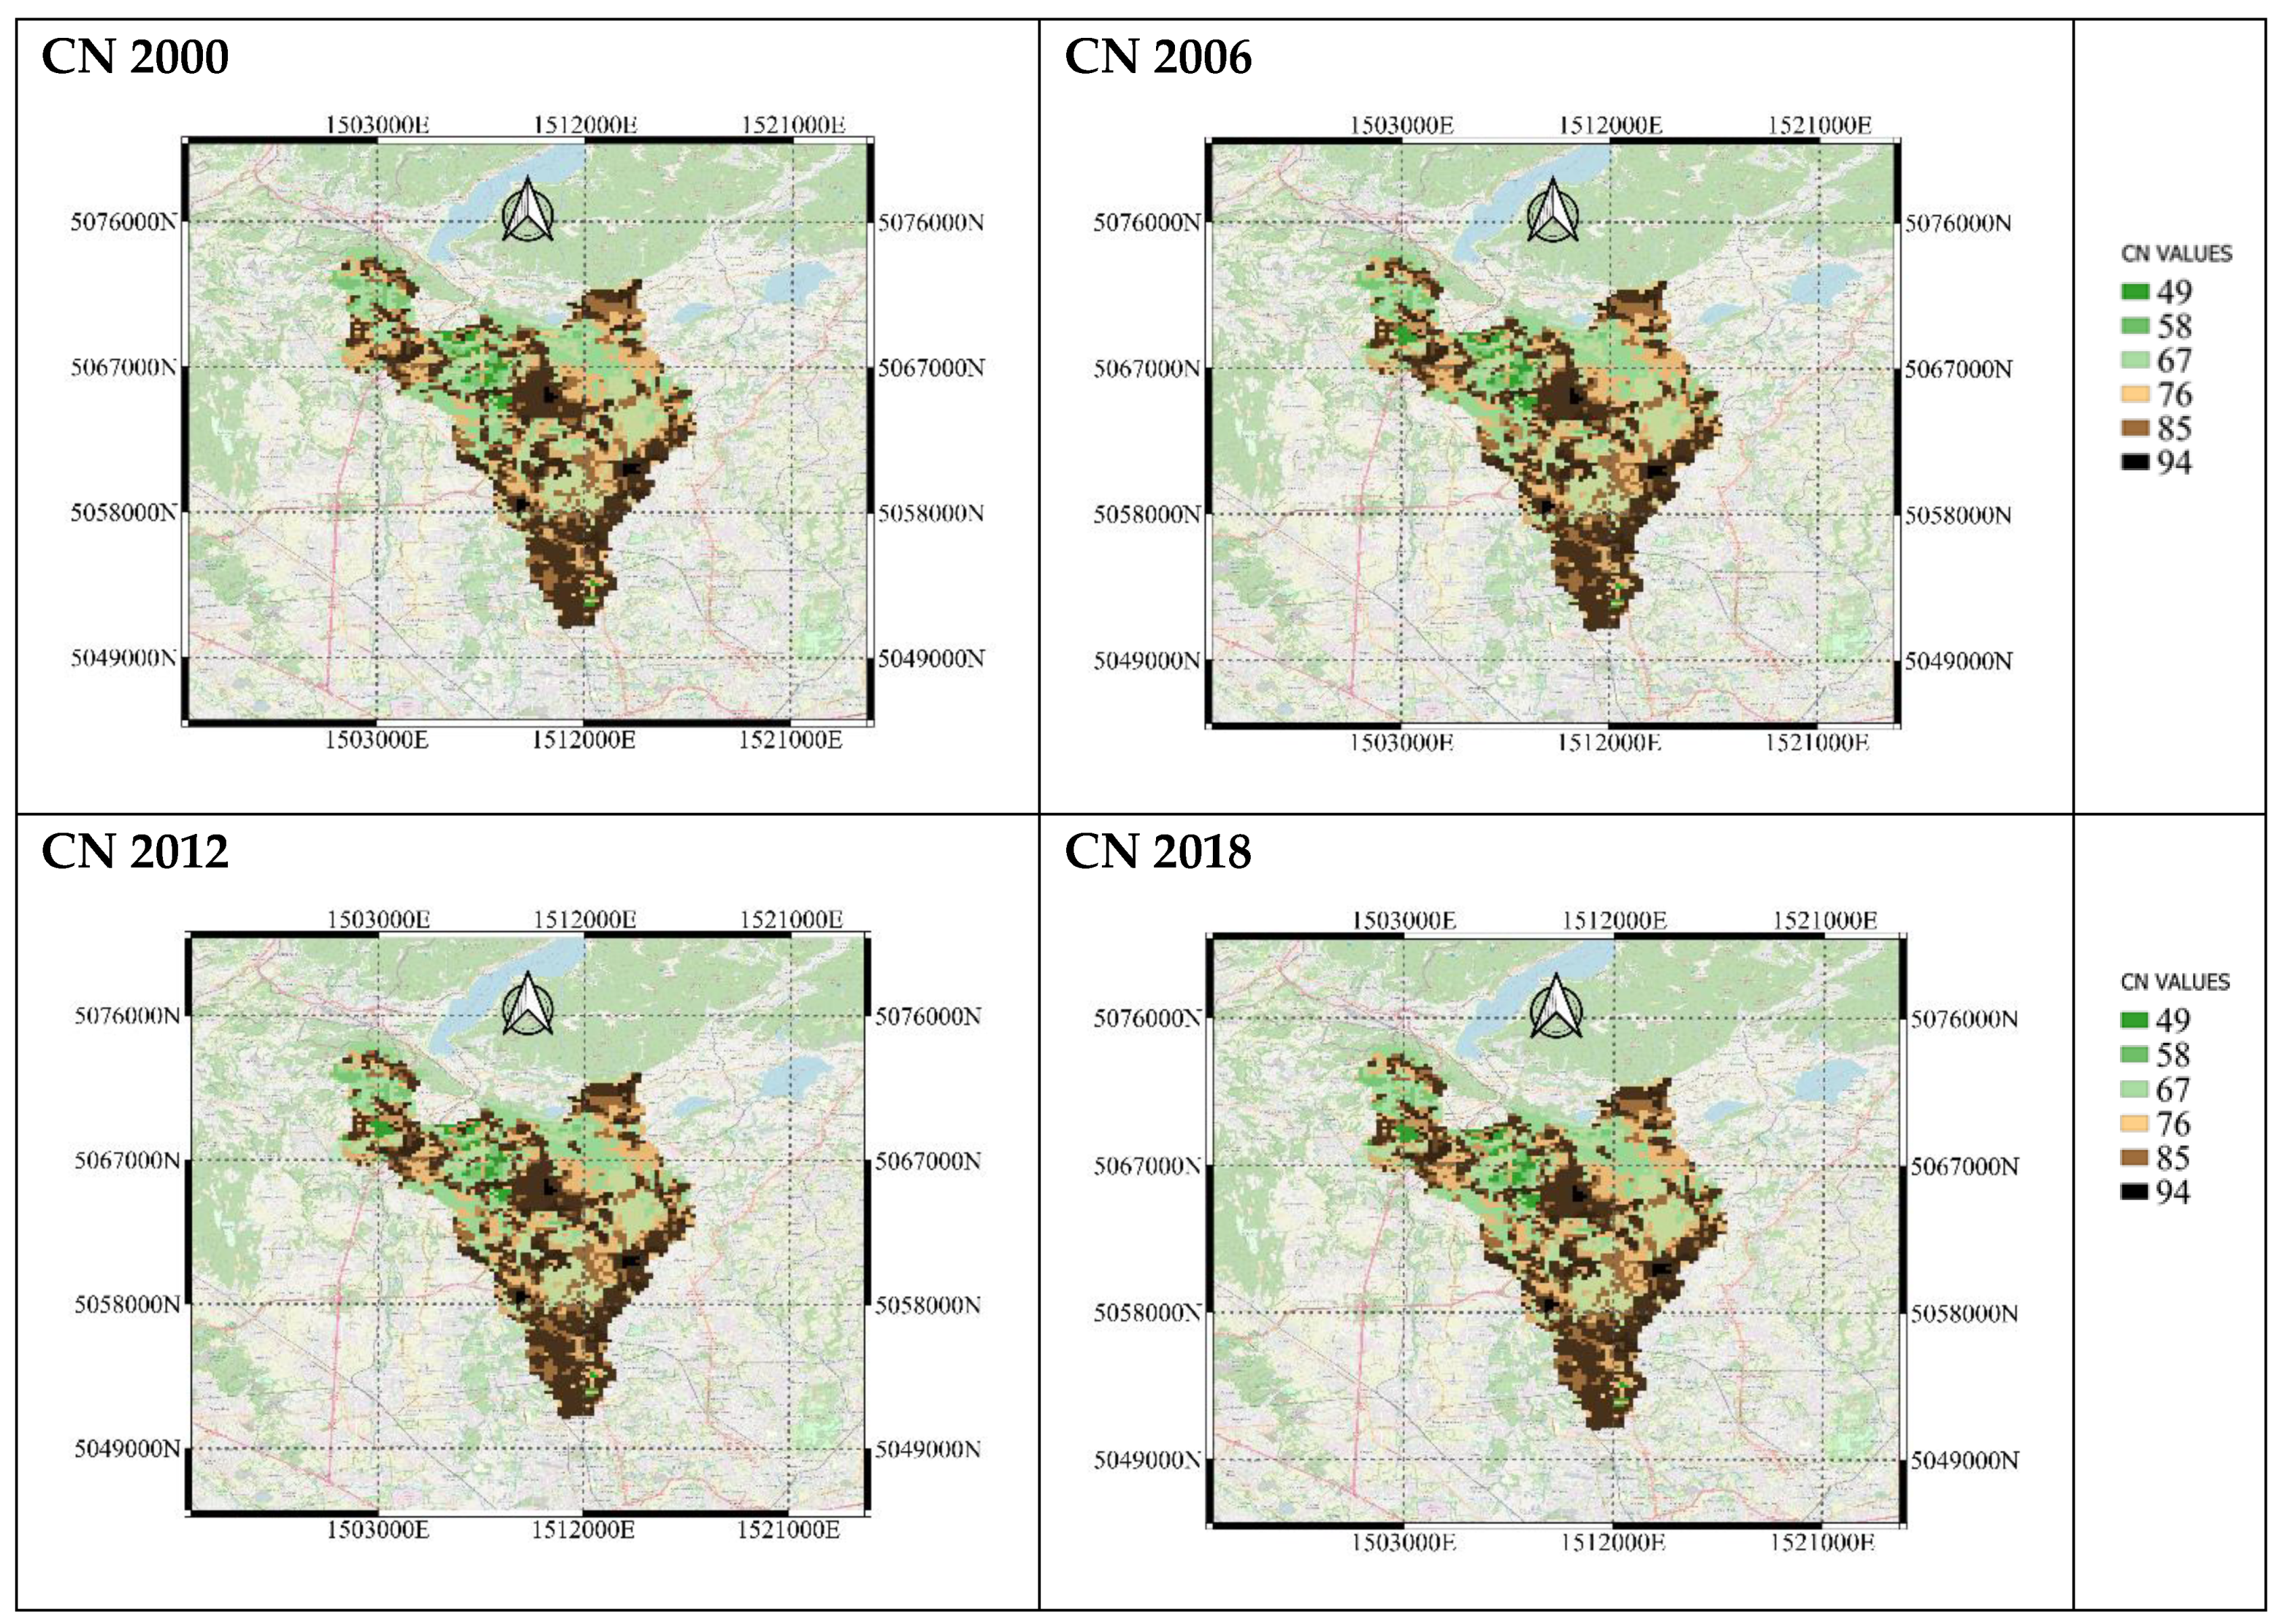
The territory extending north of Milano has been subjected to a significant expansion of urban area since 1950, modifying the response of the watershed to precipitation input. Figure 2 shows the area of the territory covered by urban development in the years 1954, 1980, 2000, 2006, 2012 and 2018, and the corresponding values of Soil Conservation Service-Curve Number (SCS-CN). Land use data was obtained from the Lombardy Region database (www.cartografia.regione.lombardia.it, accessed on 15 January 2022). We chose SCS-CN for measuring the basin runoff production, because the higher the CN is, the greater the generated runoff volume. Table 1 shows the percentage of urbanized area and the average CN in these selected years for the Seveso River at the Bovisio-Masciago gauge section. Results show that the overall percentage of urbanization has constantly increased from 11.1% in 1954 to 32.0% in 1980 and up to 44.7% in the year 2000. Vice versa, in the last two decades, no significant increments were found, and the urbanized area varied by about 2% in twenty years only.
3. Materials and Methods
This section described the one-way coupling system between the ERA5-land reanalysis and the hydrological model FEST-WB used to simulate 40 years of data over the SOL river basin to understand the impact of climate change and land use. As explained above, we focused our analyses on the Seveso River basin closed at Bovisio-Masciago town, and thus upstream of any structural work along the river channel. In this section, the climatological dataset, the implemented hydrological model, the available observed weather data, and the skill scores are described in detail.
3.1. The ERA5-Land Reanalysis
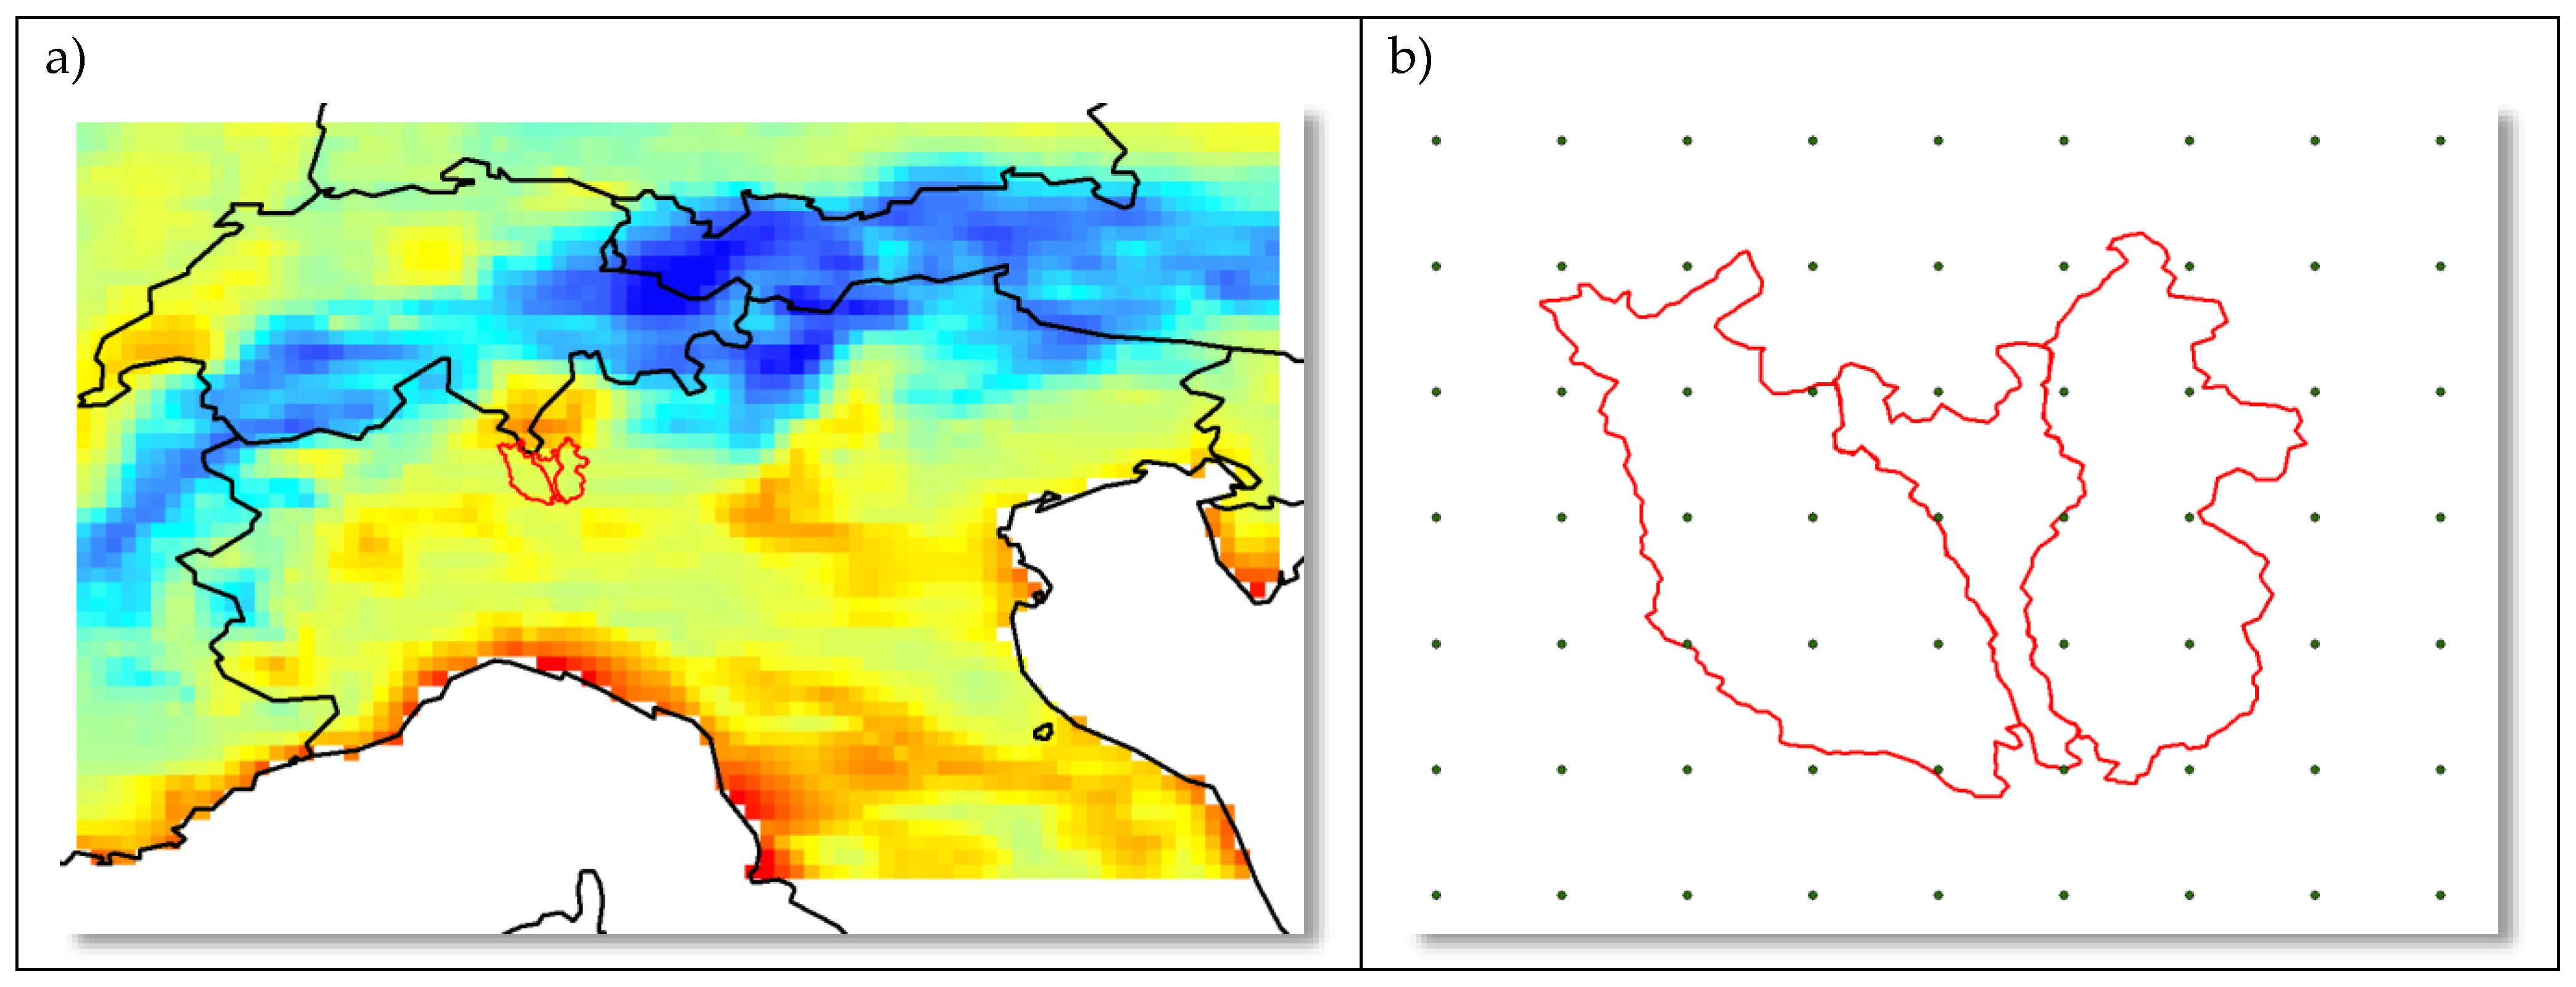
ERA5-Land (Figure 3) is a reanalysis dataset providing a consistent view of the evolution of land variables over several decades at an enhanced spatial resolution of 9 km (0.08°). Data have been downloaded from this web site https://cds.climate.copernicus.eu/cdsapp#!/dataset/reanalysis-era5-land?tab=overview (accessed on 15 January 2022) in GRIB2 format.
To feed our hydrological model with data for this case study, we selected the following atmospheric variables: the 2 m air temperature and dew point, total precipitation, 10 m u- and v-component of wind and the surface solar radiation downwards. All values were available at an hourly time scale from 1 January 1981 to 31 December 2020; hence, 40 years of data was available, an amount useful to understand climate variability, mainly in terms of temperature and precipitation, and the hydrological response over this area. For a detailed description of the ERA5-Land hourly dataset, the reader can refer to [30] and this online documentation: https://confluence.ecmwf.int/display/CKB/ERA5-Land%3A+data+documentation (accessed on 15 January 2022).
3.2. The FEST-WB Model
In this work, we used the rainfall-runoff physically based distributed FEST-WB model developed on top of the MOSAICO library [19,31] for simulating the rainfall-runoff transformation. The FEST-WB computes the main processes of the hydrological cycle: evapotranspiration, infiltration, surface runoff, flow routing, subsurface flow, and snow melt and accumulation. The computation domain is discretized with a mesh of regular square cells (200 m × 200 m in this study) in each of which water fluxes are calculated at hourly time steps.
The FEST computes soil moisture fluxes by solving the water balance equation at a given cell (i, j) and time (t). In particular, the temporal evolution of the soil moisture, , is given by Equation (1):
where is the precipitation rate, and are the runoff and drainage fluxes, is the evapotranspiration rate, and is the soil depth. Runoff rate is calculated according to the Soil Conservation Service–Curve Number scheme, SCS-CN [32], extended for continuous simulation. That is, in Equation (2), soil retention capacity, S, at a given location and time is updated at the beginning of a storm as a linear function of the degree of saturation, ε [20]:
where and are the values of when the soil is dry and wet (i.e., antecedent moisture conditions (AMC) I and III in the SCS-CN method, respectively). The actual evapotranspiration is computed as a fraction of the potential rate tuned by a beta distribution that, in turn, depends on soil moisture content [33]. Hillslope propagation is modelled by using a linear reservoir numerical scheme, while surface and subsurface flow routing is based on the Muskingum method [34]. For further details upon development and application of the FEST-WB, the reader can refer to [35,36,37,38]. For details about model parameters applied to the Milano urban area, the reader can refer to [20].
3.3. Observed Weather Data
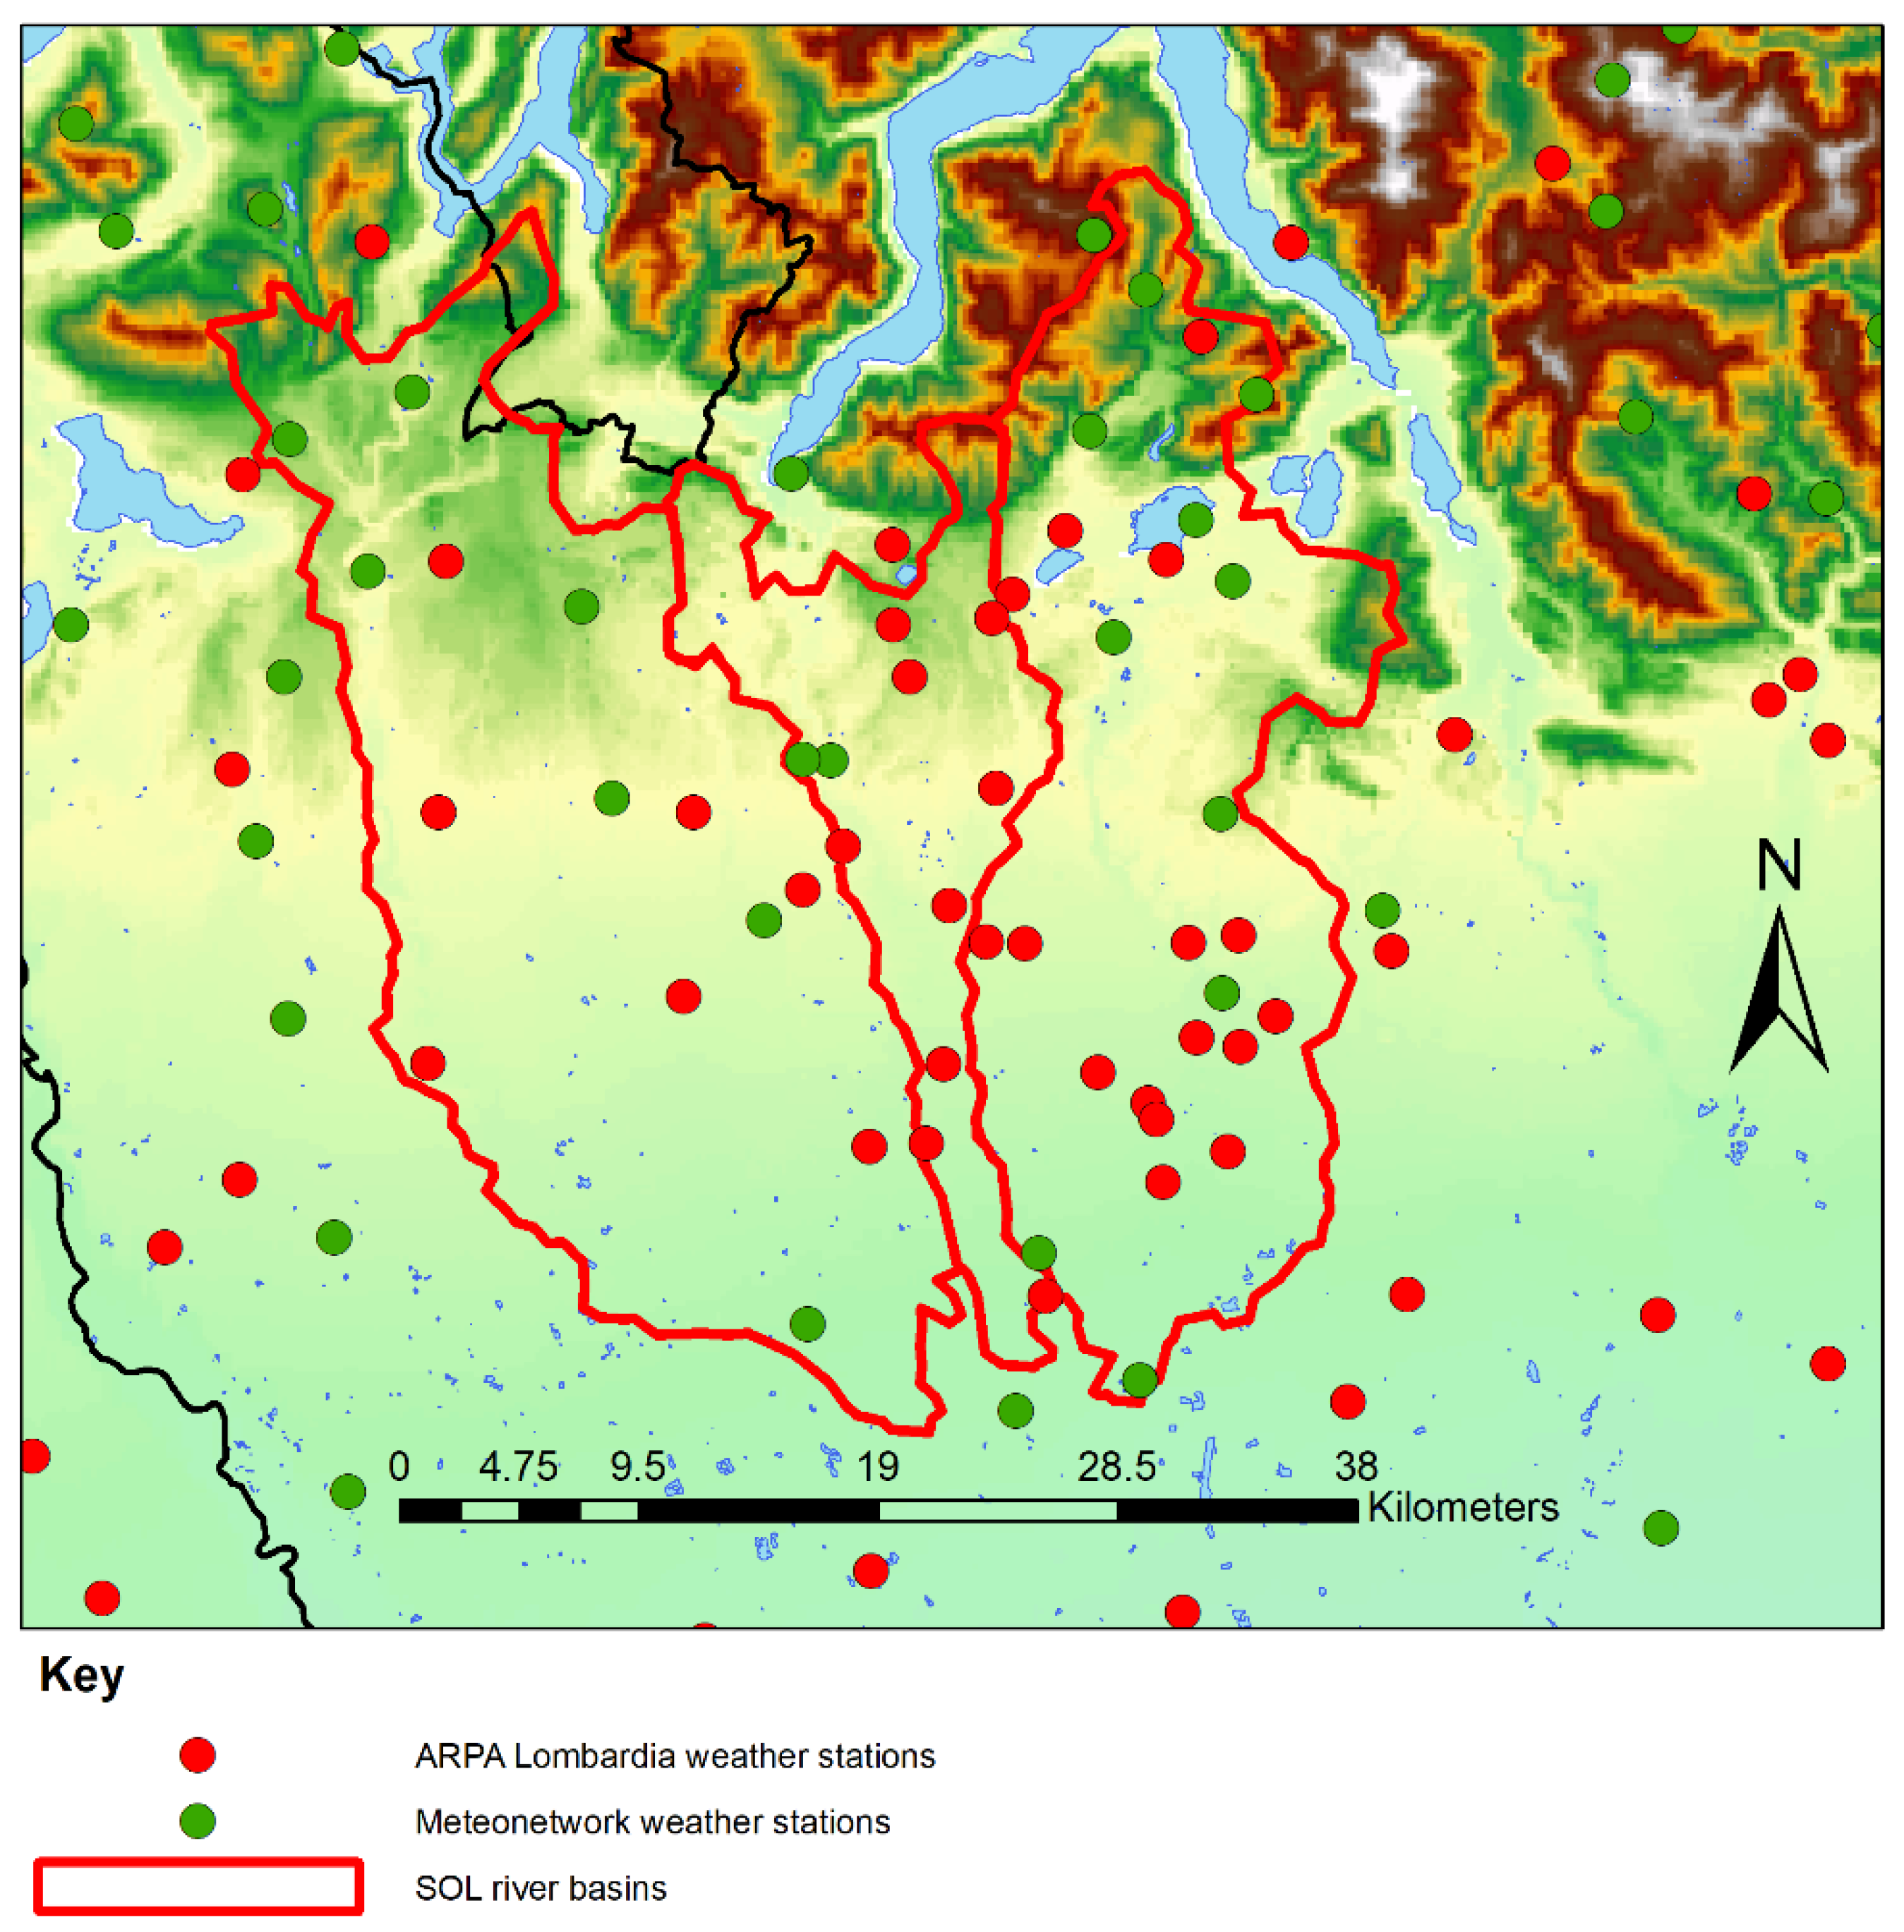
Available meteorological observed data used in comparisons were: precipitation, temperature, relative humidity, incoming solar radiation, and wind speed, hourly collected by the monitoring network system managed by the ARPA (Regional Agency for Environmental Protection) of the Lombardy region since 2003 and by Meteonetwork, an open-source association of citizen scientists with available weather station data since 2013. Figure 4 depicts the location of weather stations of both networks in the study area.
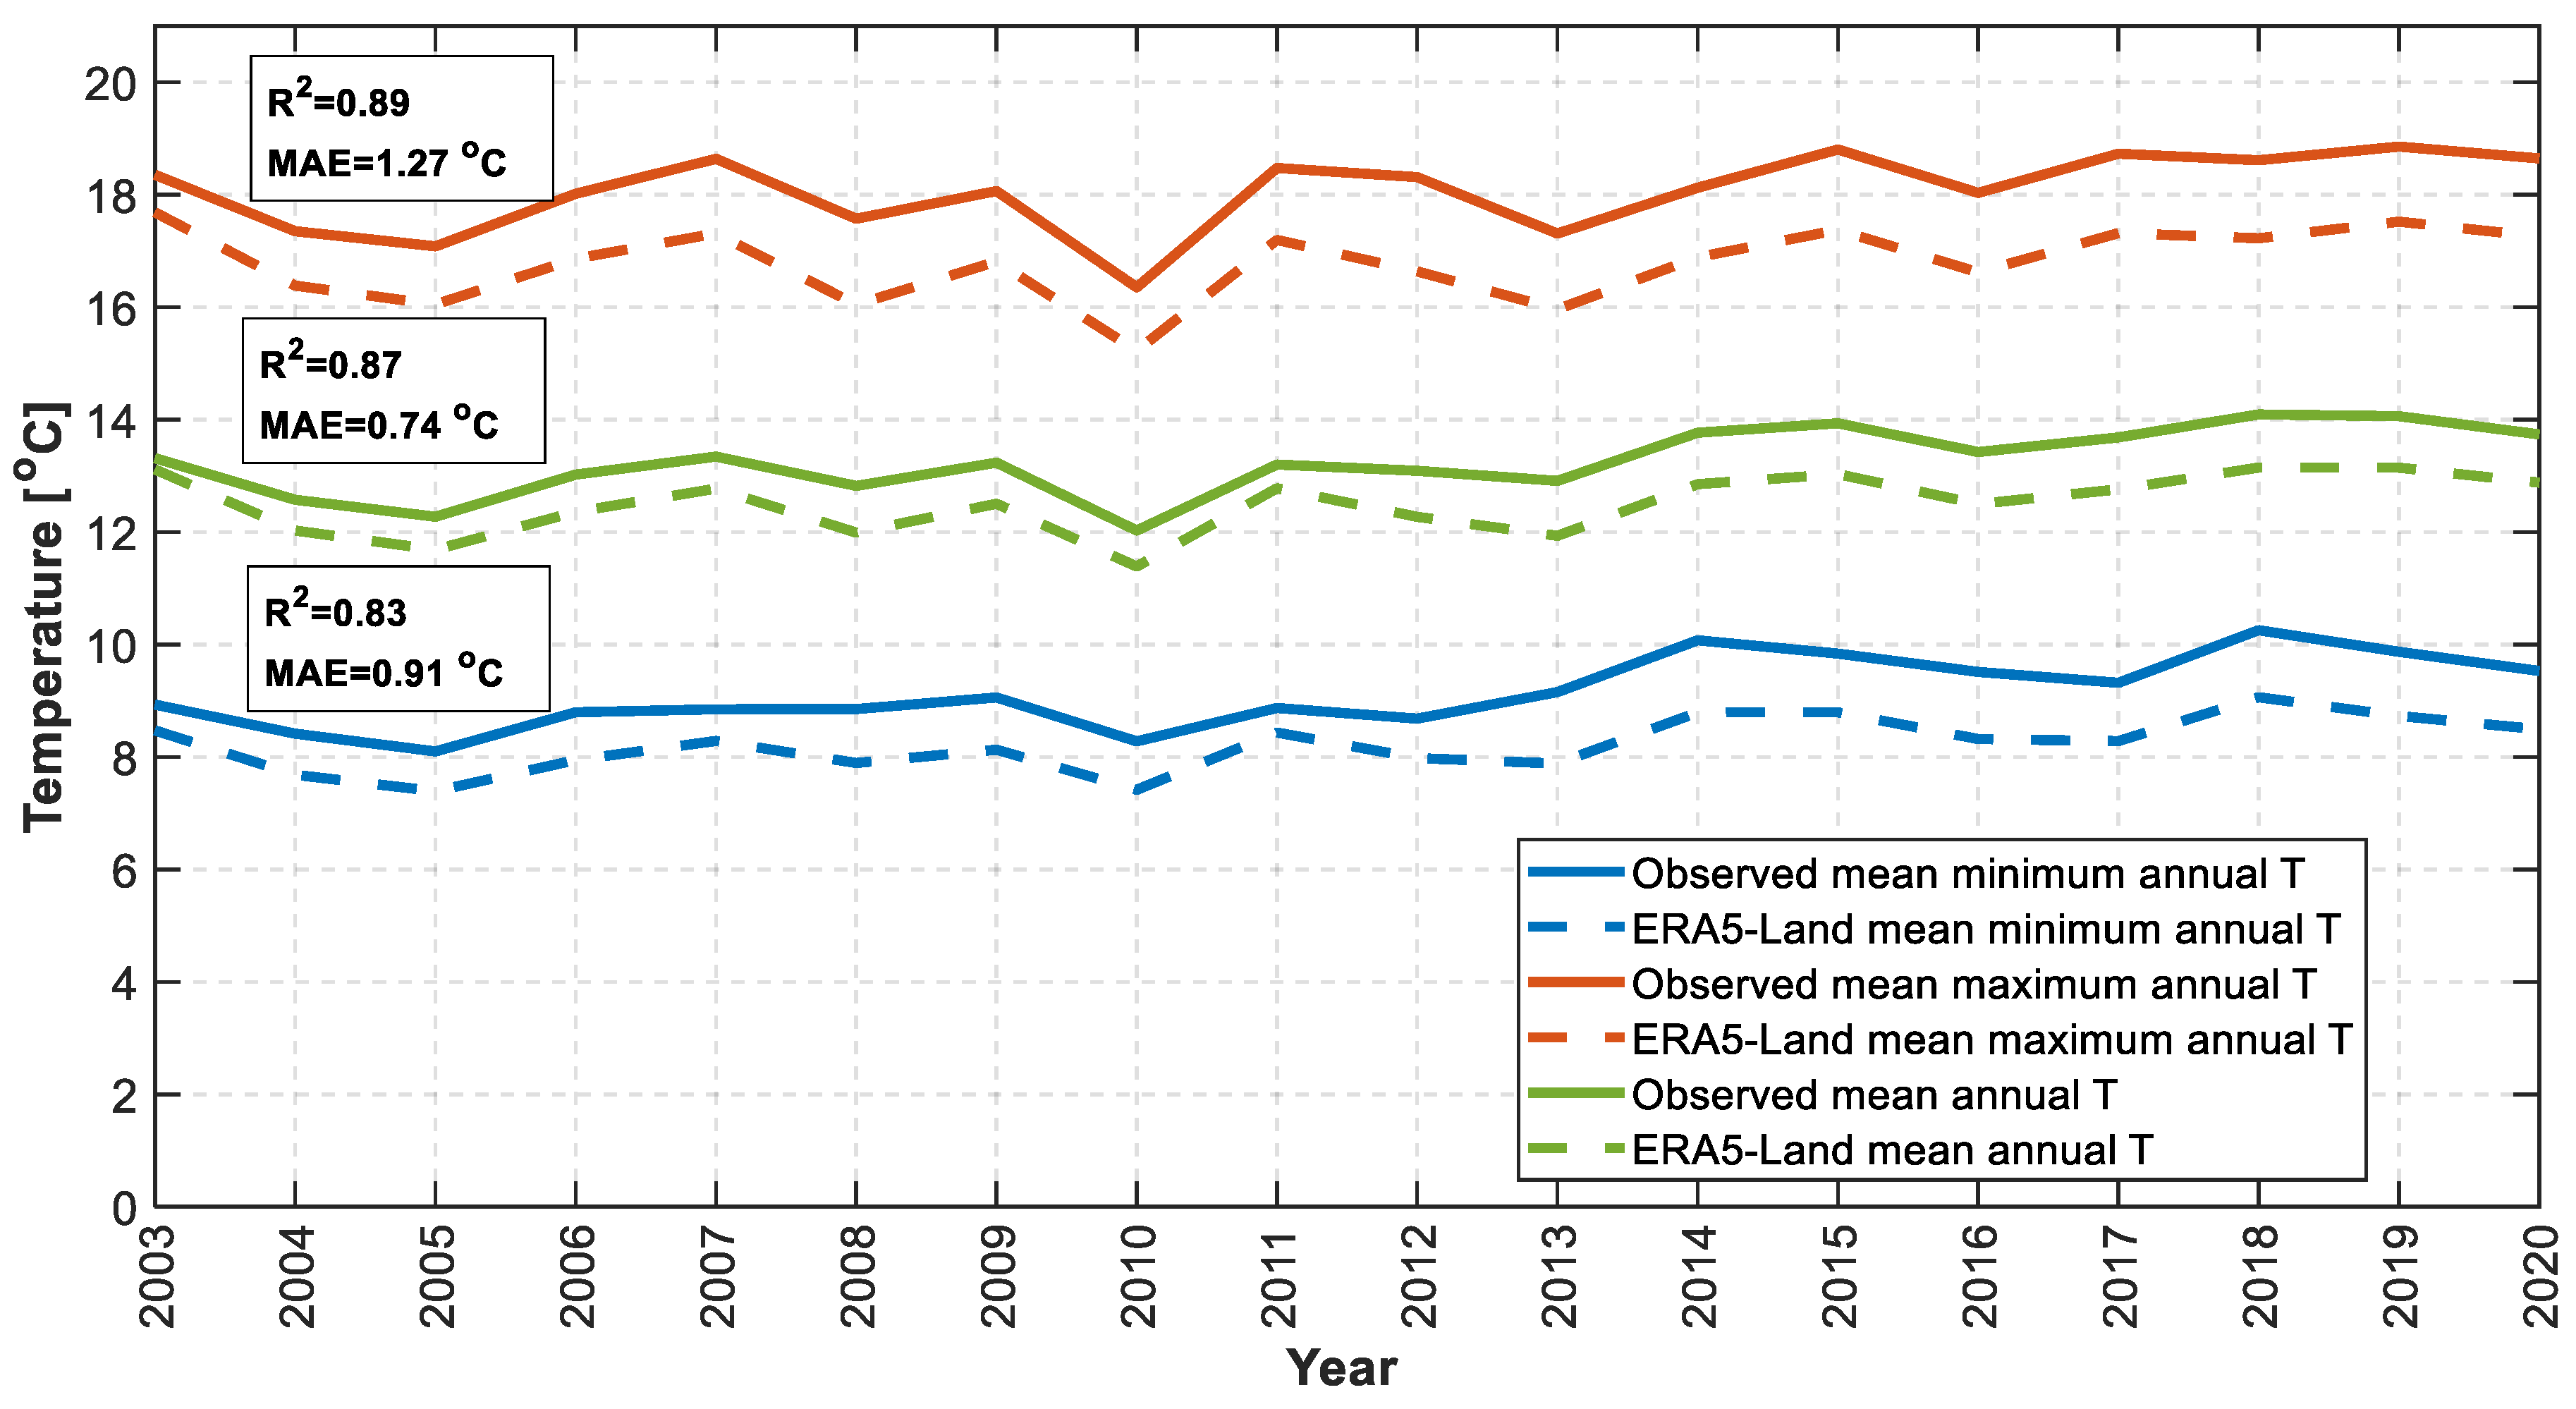
The first analysis was to check the goodness of the ERA5-Land dataset over the SOL area through common statistical skill scores (see Section 3.4 for further details). Hence, we compared local observations coming from the ARPA and the Meteonetwork weather stations versus the ERA5-Land data. As reported in Figure 5, temperature data from ERA5-Land showed a general tendency to underestimate local climatic conditions both for minimum and maximum values, with this latter much enhanced; in fact, the MAE is equal to 0.91 °C for minimum annual temperature, 0.74 °C for mean temperature, and 1.27 °C for the maximum one. Nevertheless, the results depict how the yearly variability is reasonable well reconstructed with a determination coefficient equal to 0.83 for mean minimum annual temperature, 0.87 for mean annual temperature and 0.89 for mean maximum annual temperature. Due to these high scores, it was not necessary to introduce a correction bias; first, as it was not our aim in this study, and, additionally, we were more interested to understand trends and variability in these last 40 years rather than absolute climatological values or seasonal patterns.
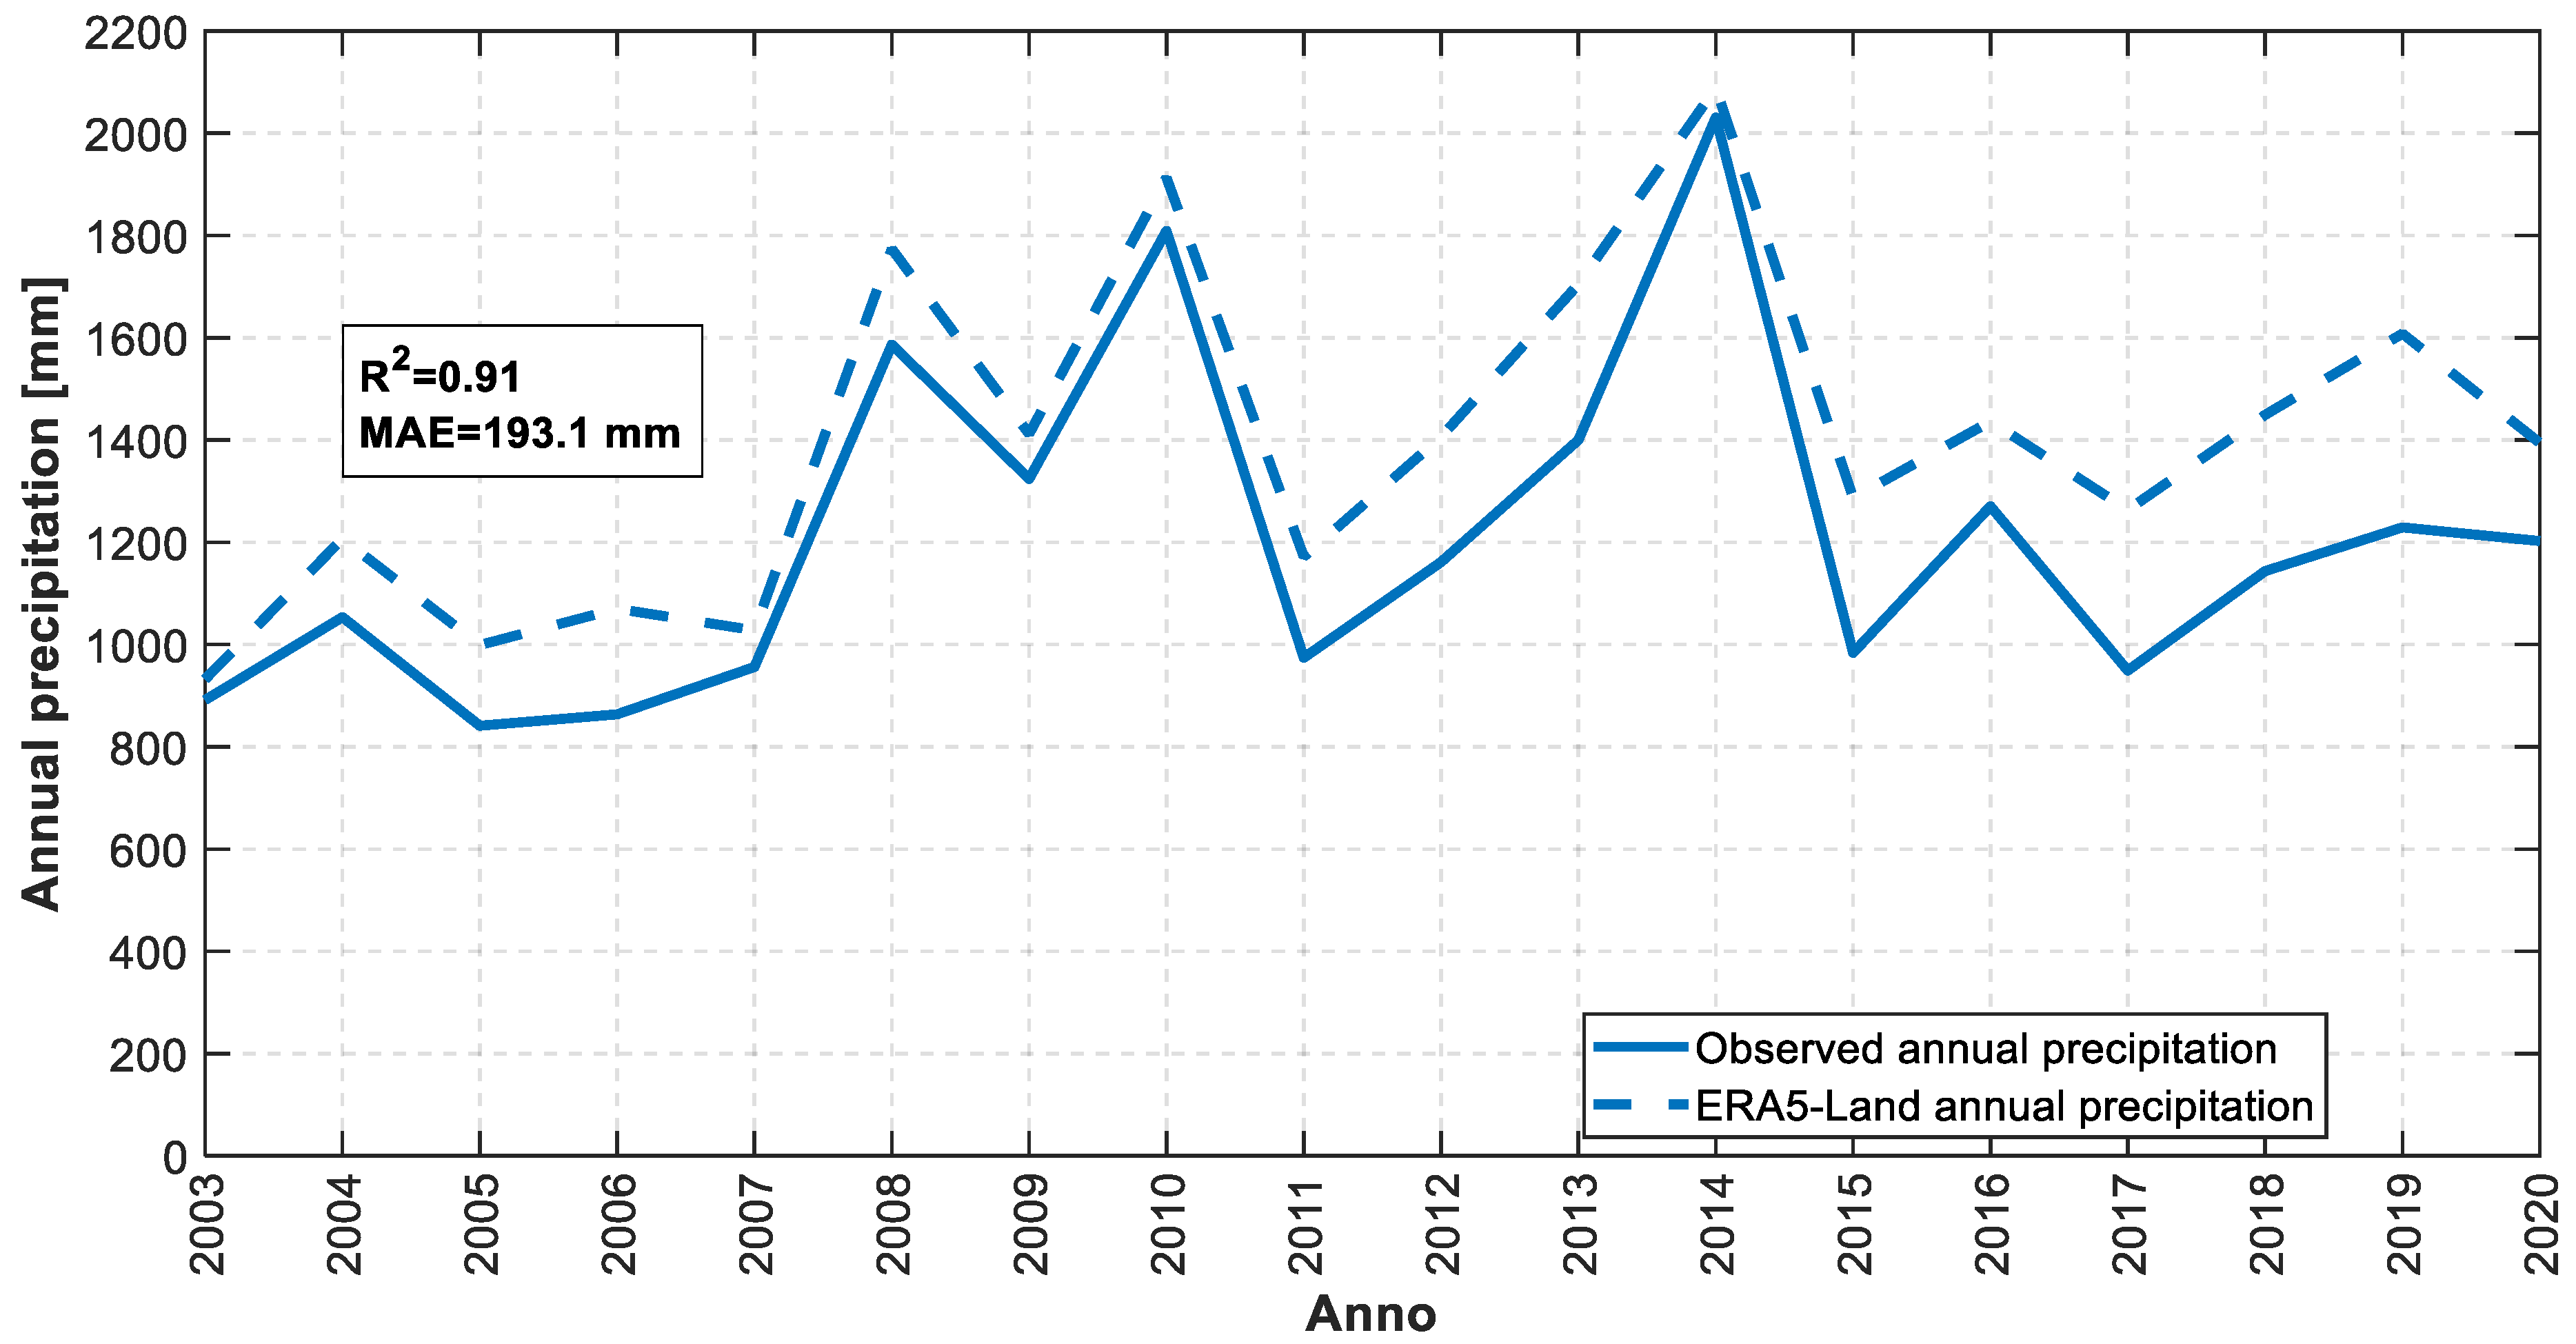
The same behaviour was found for the precipitation analysis, shown in Figure 6. Here, the ERA5-Land tends to overestimate the observed values coming from local measurements by the ARPA and Meteonetwork weather stations (MAE equal to +193.1 mm), but, as well as for temperature, high and low values are fairly well reconstructed and the R2 is equal to 0.91.
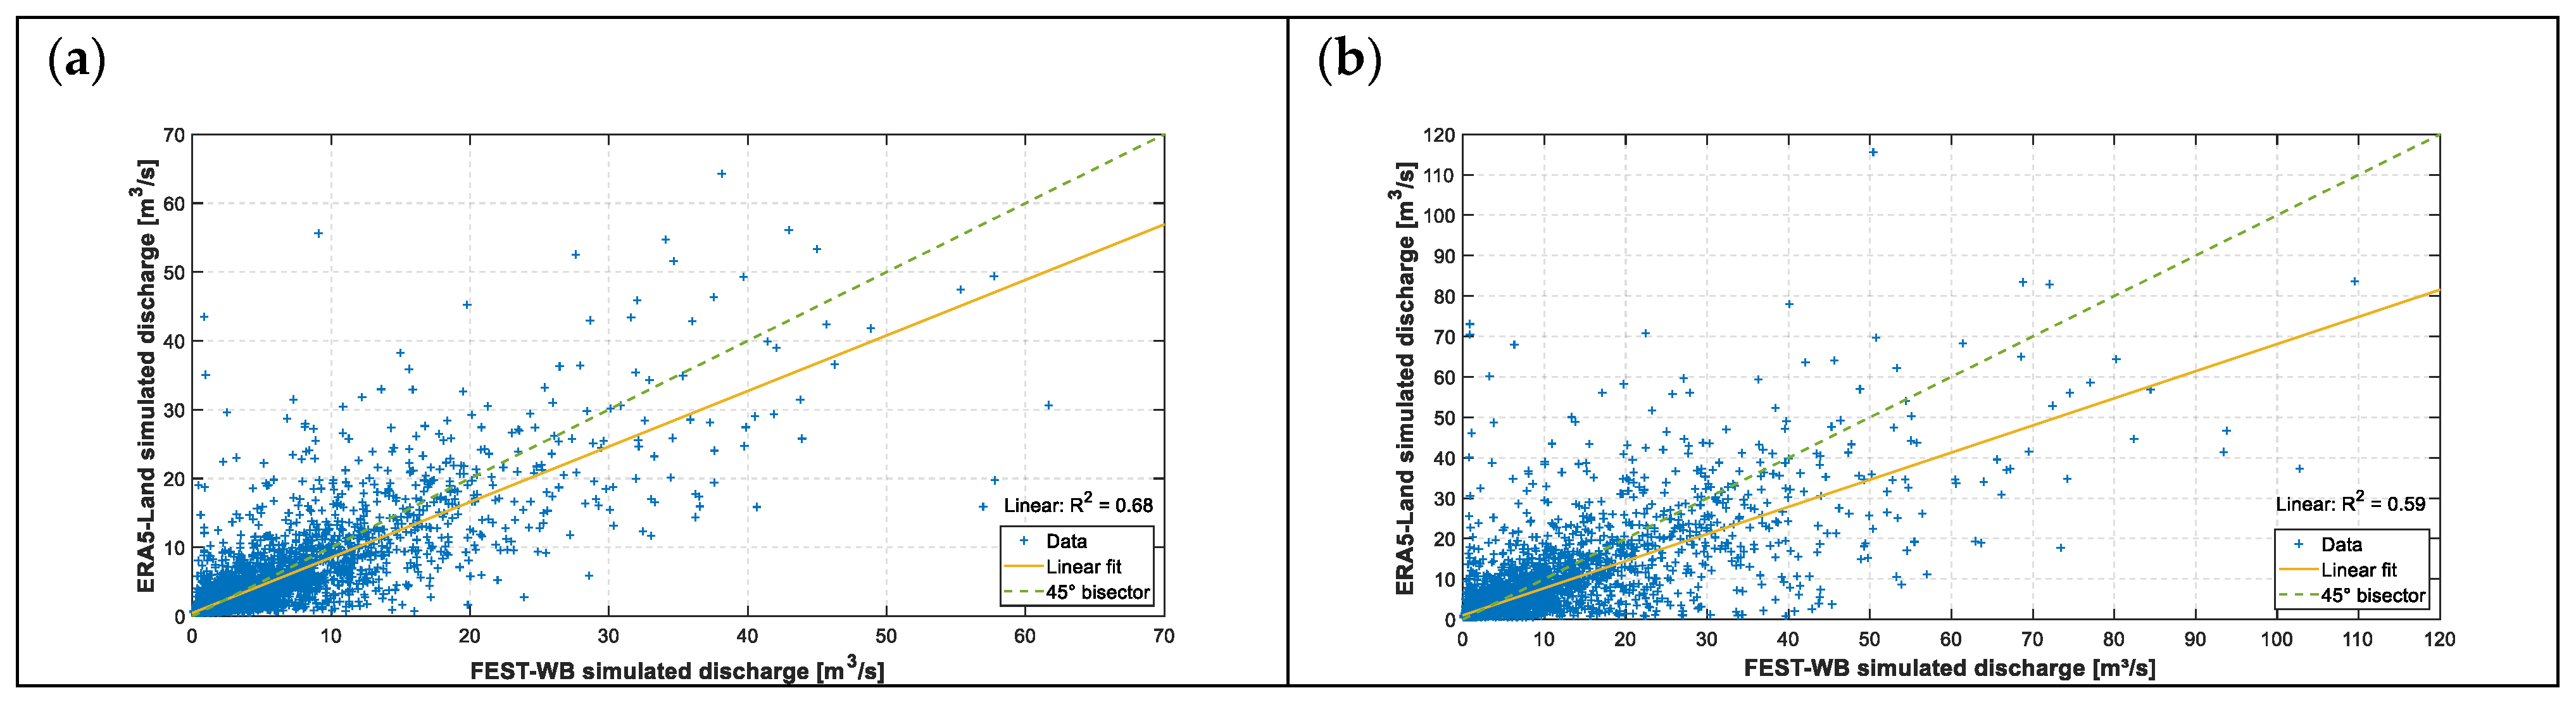
As far as the discharge is concerned, simulated runoff values obtained with the FEST-WB hydrological model forced with the ERA5-Land reanalysis showed a good agreement with the simulated flowrates forced with observed data from the ARPA and Meteonetwork weather stations over the available overlapping period 2003–2020: the coefficient of determination R2 is equal to 0.67, the Kling–Gupta efficiency (KGE) to 0.81, and the Nash–Sutcliffe efficiency (NSE) displays a value of 0.66 for the average daily discharge (Figure 7a). However, the simulated runoff forced with ERA5-Land dataset tends to underestimate the maximum daily discharge, instead, and the coefficient of determination R2 decreases to 0.58, the KGE to 0.71, and the NSE diminishes to 0.57 (Figure 7b). As mentioned above, we note that discharge comparisons have been carried out over the Seveso River basin closed at Bovisio-Masciago section.
3.4. Statistical Analysis
Statistical analyses, commonly applied in the scientific literature [39,40,41] are used to assess and test the outcomes in this paper; in particular, the mean absolute error (MAE), the coefficient of determination (R2), the Standardized Precipitation Index, the Mann–Kendall (MK) and the Cox–Stuart (CS) tests.
3.4.1. Mean Absolute Error
The mean absolute error (MAE) is a measure of the average deviation between two sequences of values concerning the same phenomenon (for example, the temperature predicted by a model and the observation of the instrument). It is therefore an indicator of how similar the two sequences are in absolute terms, regardless of how much the two samples can be correlated. Its range varies between 0 and +∞ and it is defined as follows in Equation (3):
where y and x are the two sequences of values and n is the number of the samples.
3.4.2. Coefficient of Determination
3.4.3. Nash-Sutcliffe Efficiency (NSE)
The Nash-Sutcliffe efficiency [42] is a widely used statistical index for evaluating the goodness-of-fit of hydrological models, and it is defined in Equation (5) as follows:
where are the simulated values using ERA5-Land as input into the FEST-WB hydrological model, are the simulated data using observations as input in the FEST-WB, is the mean of , and n is the numerosity of the two vectors.
3.4.4. Kling–Gupta Efficiency (KGE)
The Kling–Gupta efficiency is another goodness-of-fit measure for hydrological models developed by [43], and afterwards revised by [44]. The KGE is based on an improved combination of the three diagnostically meaningful components of the mean squared error (i.e., correlation, bias, and variability), and it is recently gaining literature dominance in the context of hydrological model calibration [45,46]. The KGE index ranges from −∞ to 1: the closer to 1, the more accurate the simulated values are. KGE can be computed as reported in Equation (6):
where r is the Pearson correlation coefficient, where is the standard deviation of the simulated values and is the standard deviation of the observed values, while where is the mean of the simulated values and is the mean of the observed values.
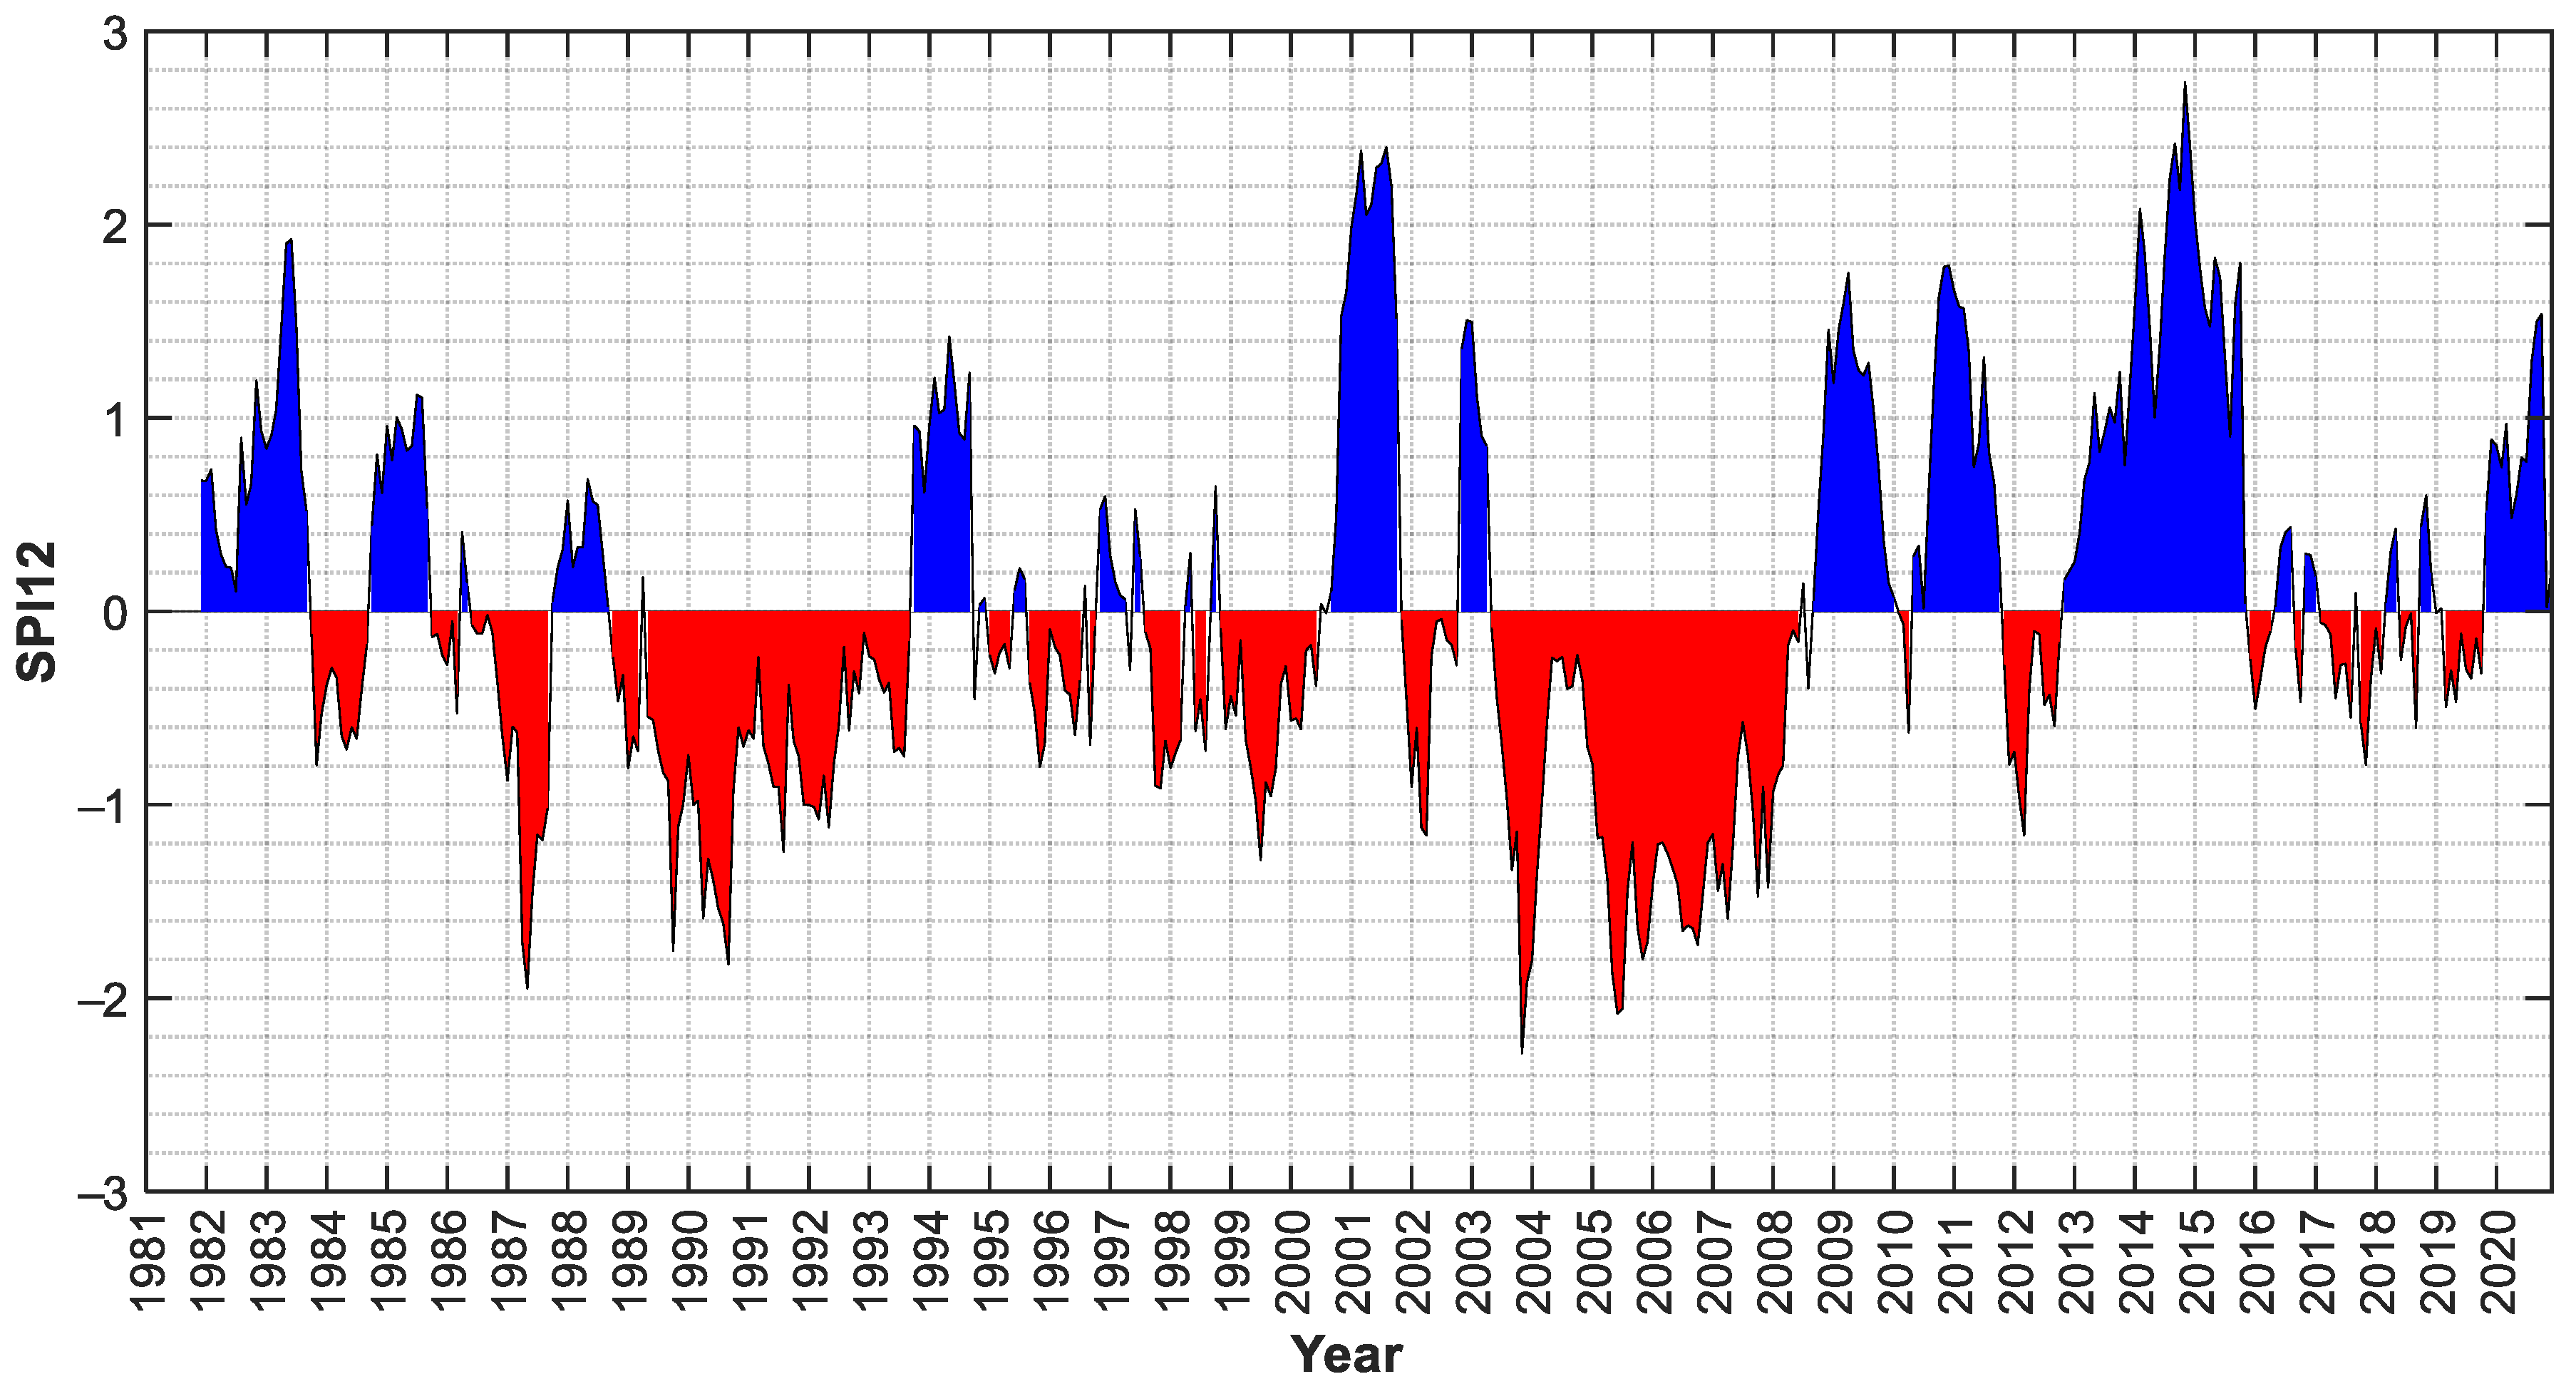
3.4.5. Standardized Precipitation Index (SPI)
The Standardized Precipitation index (SPI), developed by McKee et al. [47] and Edwards and McKee [48], analyses the relative departures of precipitation from normality. The SPI is a widely used index to characterize meteorological drought on a range of timescales. It quantifies observed precipitation as a standardized departure from a selected probability distribution function that models the raw precipitation data which are typically fitted to a gamma or a Pearson Type III distribution, and then transformed to a normal distribution. The SPI values can be interpreted as the number of standard deviations by which the observed anomaly deviates from the long-term mean [49].
Normally, the drought part of the SPI range is arbitrarily split into moderately dry (−1.0 > SPI > −1.49), severely dry (−1.5 > SPI > −1.99) and extremely dry conditions (SPI < −2.0). A drought event starts when the SPI value reaches −1.0 and ends when they become positive again [48].
In this study, the main calculations of the SPI index were performed using the R-package “SPEI” developed by Beguería and Vicente-Serrano [50], using a gamma-type distribution to model monthly precipitation time series, and the SPI index was calculated on a basis of 12 months, which is one of the typical time scales for precipitation deficit analysis.
3.4.6. Cox–Stuart Test
The Cox–Stuart test is a nonparametric statistical test widely used for trend analysis proposed by Cox and Stuart [51]. In this work, it was used to identify the presence of trends in data with low numbers of values (<30) as it is very robust [52].
Let x1, x2,…, xn be a series of independent observations. To perform the trend analysis, the following samples of differences were calculated: y1 = x1+c − x1, y2 = x2+c − x2,…, yn = xn − xn−c, where c = n/2 if n is even, c = (n + 1)/2 if n is odd. Hence, we obtained a vector of differences y1, y2,…, ym.
The tested hypotheses were:
Hypothesis 0 (H0).
There is no presence of monotonic trend in the data.
Hypothesis 1 (H1).
A monotonic trend is present in the data.
And the test statistic was computed as follows in Equation (7):
where with x denoting the generic input argument of the function sgn.
Based on the significance level, α, of the test we can accept or reject the null hypothesis H0 knowing that the statistical test, T, follows a binomial distributions of parameters m and p = 0.5 [53].
3.4.7. Mann–Kendall Test
The Mann–Kendall statistical test has been widely applied in trend detection of the hydro-meteorological time series [54,55,56]. In this work, it was used to assess whether a statistically significant trend was present in samples with more than 30 elements. Its implementation was performed with the use of the R-package “trend” [57].
Letting x1, x2,…, xn be a sequence of measurements over time [58] proposed to test the null hypothesis, H0, where the data come from a population where the random variables are independent and identically distributed. The alternative hypothesis, H1, was that the data follow a monotonic trend over time. Under H0, the Mann–Kendall test statistic is reported in Equation (8):
where n is the size of the sample, sgn is the sign of function, and xj and xk are the values of sequence j, k.
Kendall in 1975 [59] showed that S is asymptotically distributed as a normal random variable of parameters µ = 0 and variance σ2 shown in Equation (9) equals to:
where m is the number of tied groups in the dataset and ti is the number of data points in the i-th tied group.
When using this formula (Equation (9)), a positive value of S indicates that there is an upward trend in which the observations increase in time. On the other hand, a negative value of S means a decreasing trend.
If S is significantly different from zero, based upon the available information, H0 can be rejected at a chosen significance level and the presence of a monotonic trend, H1, can be accepted [60].
4. Results and Discussion
In this section, we present the climatological and hydrological characterization of the study area over the last 40 years using the ERA5-Land dataset. As described above, we focused our analyses on the Seveso River basin closed at the Bovisio-Masciago gauge section. This was chosen because upstream there were no hydraulic structural works and, consequently, an undisturbed behaviour of the basin could be observed.
Afterwards, we investigated if there exists a statistically significant impact of climate change in terms of temperature, but above all precipitation and discharge values, and tried to disentangle these from land use variations, which have had a relevant impact over this area in the last four decades.
4.1. The Climate Change Forcing
As far as temperatures are concerned, the global warming [61] is unequivocally shown in the last 40 years over the Seveso River basin (Figure 8) with an increase of temperature of up to 1.84 °C: mean annual values ranged from about 11 °C at the beginning of the eighties to 13 °C in the last years of the second decade of the new millennium. In particular, an average increasing trend was calculated equal to 0.46 °C per decade over the whole dataset, while in the last 10 years it has been even more, reaching a rate of 0.71 °C/decade.
In contrast, from a precipitation point of view, looking at the Standardized Precipitation Index (Figure 9) which analyses relative departures of precipitation from normality, we can highlight alternate periods of dry and wet conditions, but neither prevails during the last 40 years.
However, because rainfall is the main atmospheric variable that affects runoff values over these small elongated river catchments with fast response times (about 3 h), we carried out a deeper investigation on the precipitation data. We tried to answer this question: is climate change statistically significant from a precipitation point of view?
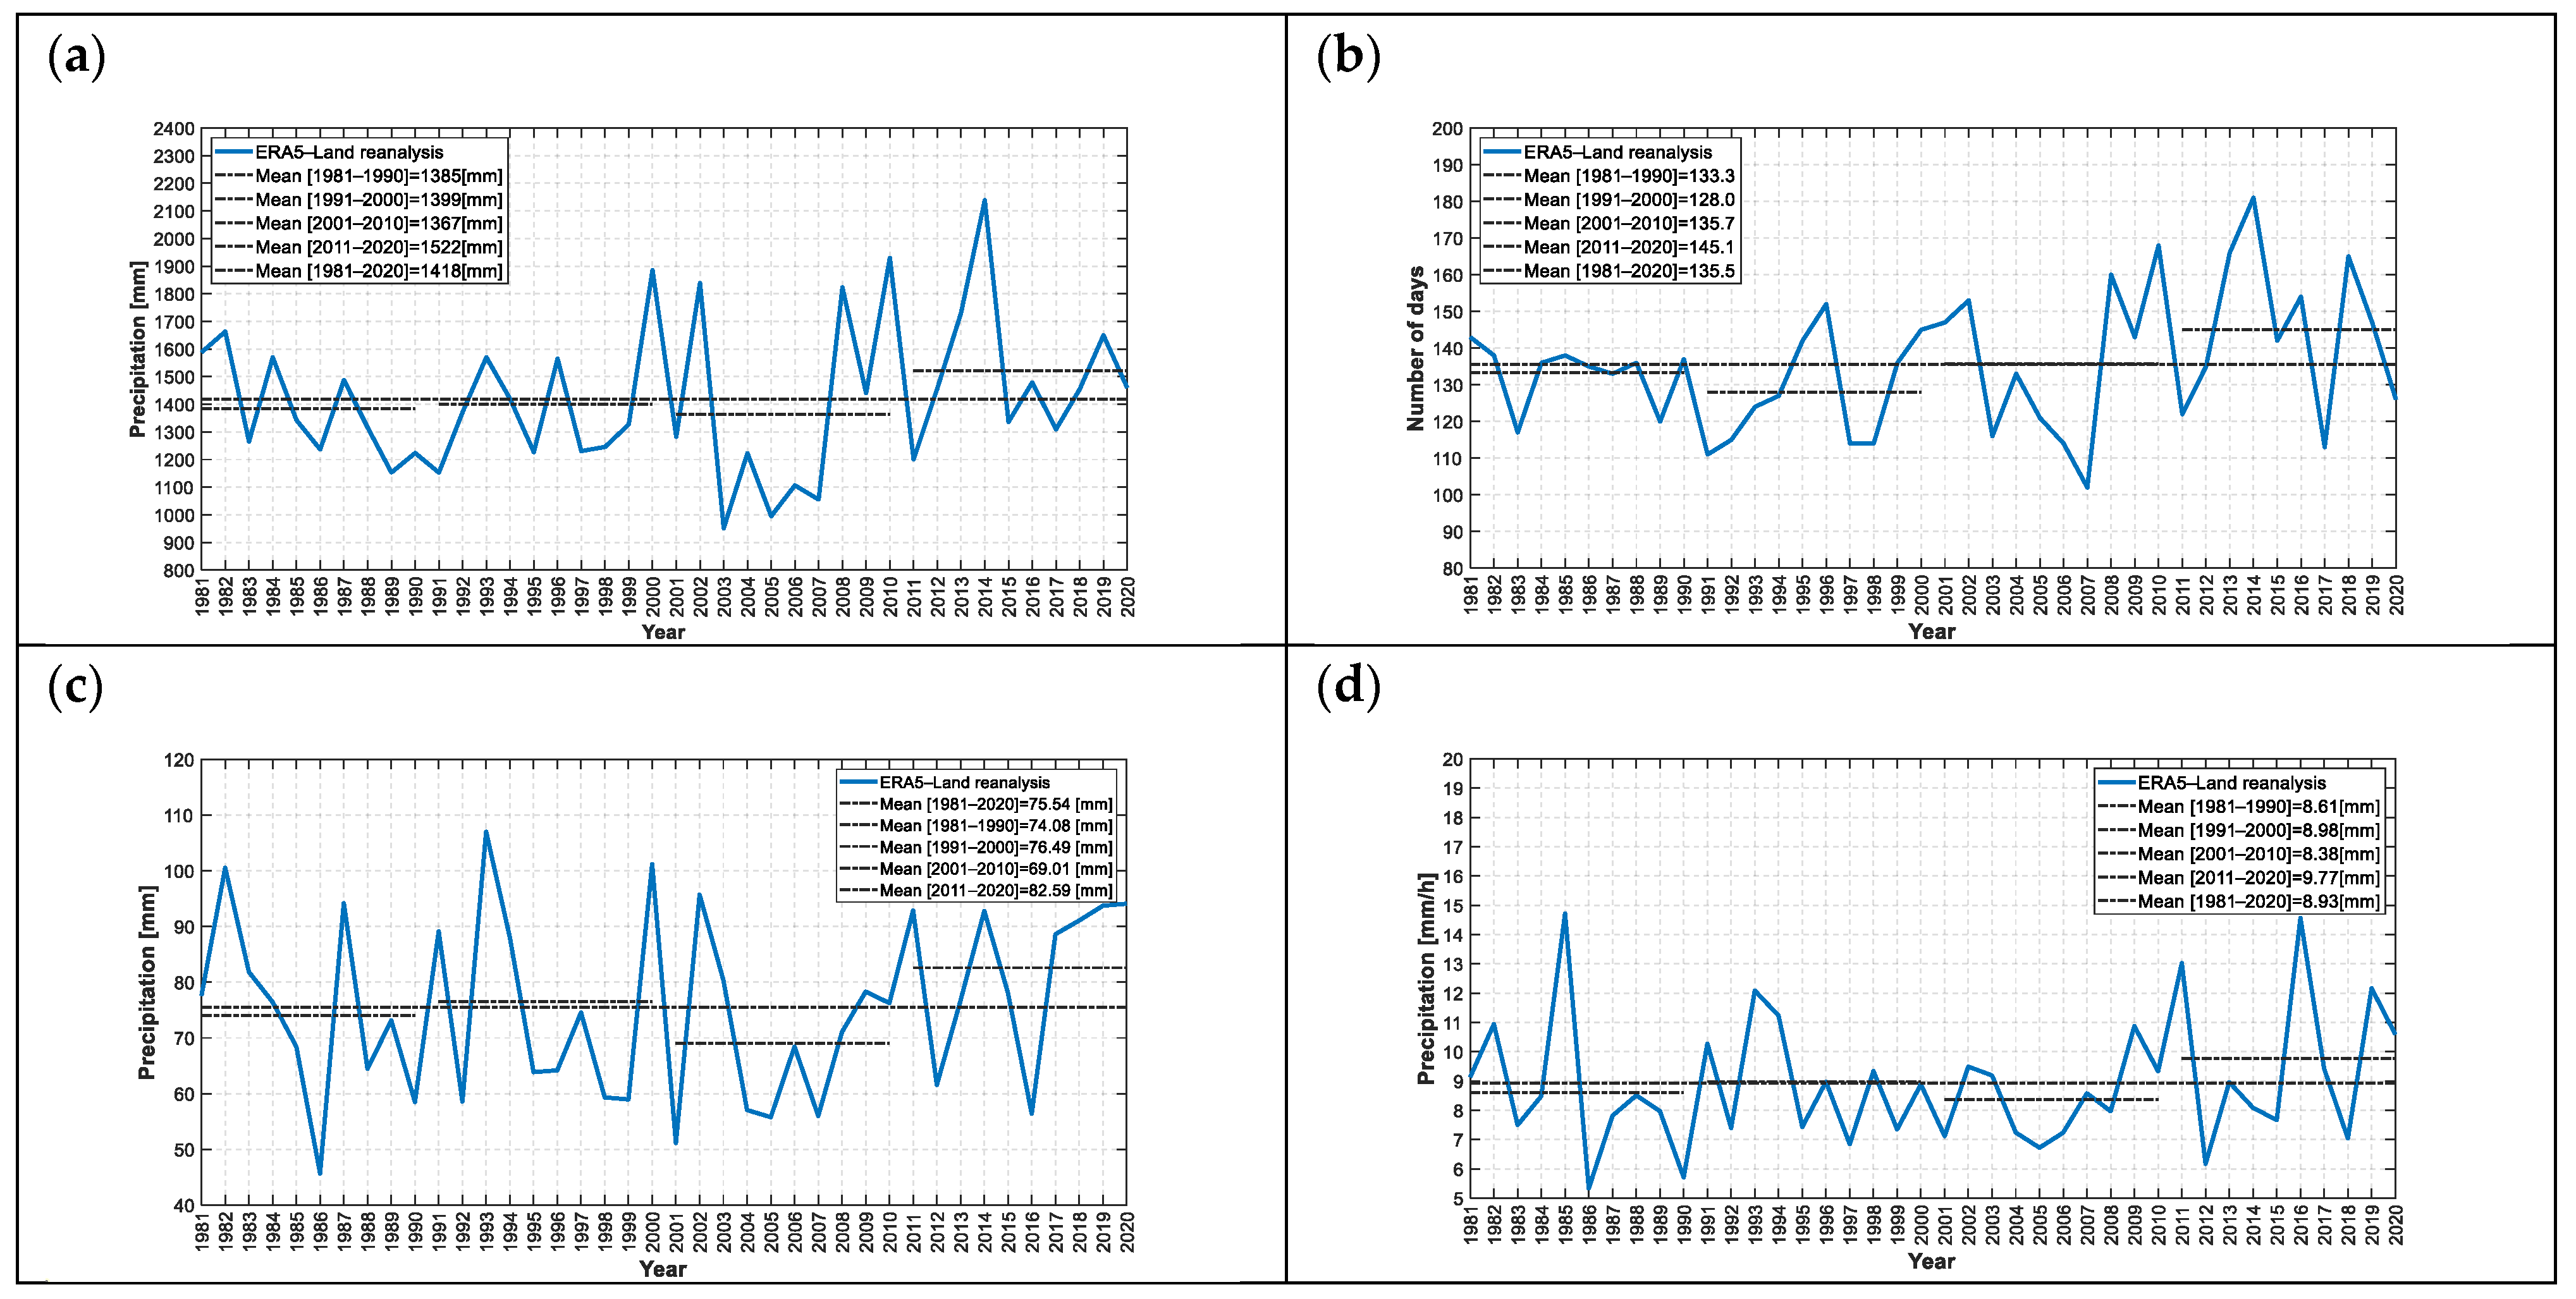
Figure 10 shows four analyses of precipitation data over the last 40 years reconstructed with the ERA5-Land dataset over the Seveso River basin closed at the Bovisio-Masciago gauge section: the total annual precipitation (a), the annual number of days with daily precipitation greater than 1 mm, defined as a wet day according to WMO [62] (b), the annual maximum precipitation data in 24 consecutive hours (c) and the annual hourly maximum precipitation (d).
All these above-mentioned pictures depict the same conclusion: the highest scores were present in the last decade (2011–2020) and were always above the average for the 40 years. Hence, one can ask whether we are experiencing a change in the precipitation pattern, and if so how statistically significant is this trend. In order to answer this question, we calculated the p-value of each plot shown in Figure 10 through the MK test, which assesses whether a trend is statistically relevant in the 40-year dataset. Results of these tests accept the null hypothesis H0, and no statically significant trends were found in all the four series, as the computed p-values (Table 2) were 0.537, 0.172, 0.552 and 0.568 respectively for Figure 10a–d: all of them below the significant threshold considering α = 5%.
4.2. The Impact of Land Use Change
After the analysis of temperature and precipitation, we investigated the impact of land use change at the hydrological basin scale.
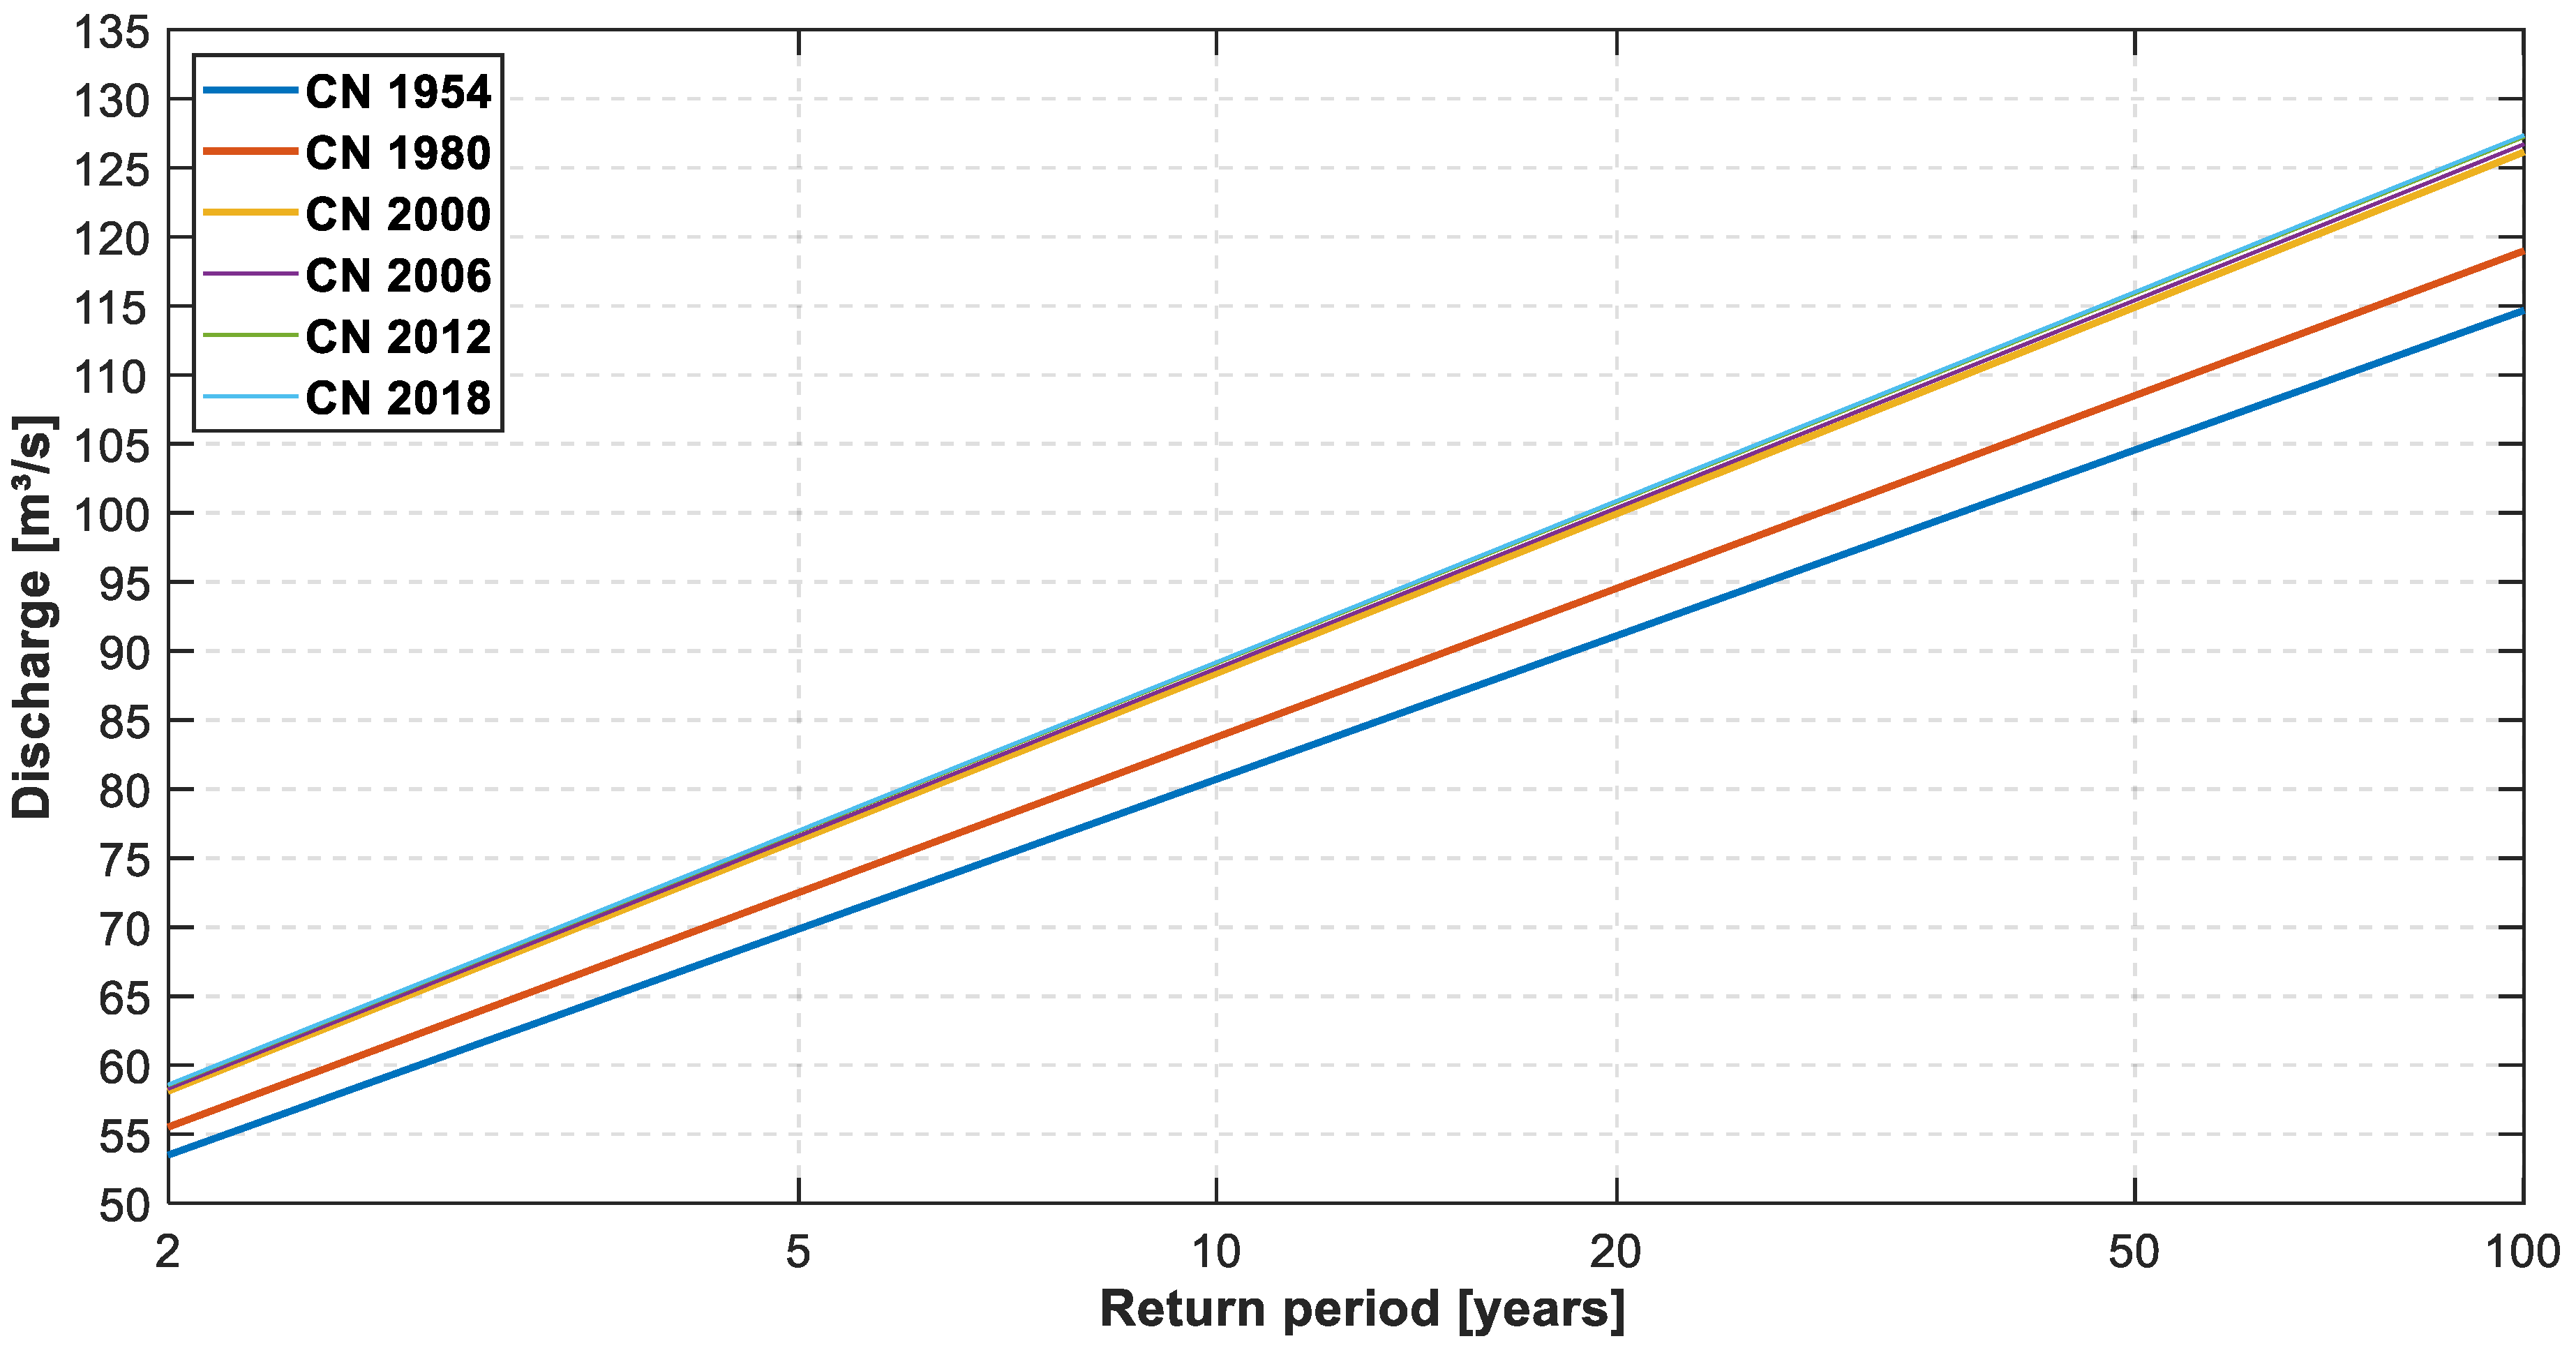
It is well-known how a change of land use due to urban development has the consequence of increasing the curve number that, in turn, can affect basin runoff production. To assess the impact of urban development on floods, six simulations, one for each available CN map, were launched forcing the hydrological FEST-WB model to the same dataset by ERA5-Land. Calculating the relationship between discharge and its return period at fixed CN conditions, we were able to quantify the impact of land use change over this watershed.
Figure 11 clarifies the influence of urbanization in terms of a diminishing return period over this catchment. Particularly significant were the past years where urbanization had shown a relevant growth in this area, already described in the above Table 1. For instance, if we take into consideration the discharge threshold of 90 m3/s, which correspond to the second warning, we can appreciate how the return period has halved over the years and the probability of yearly exceedance has doubled (Table 3). On average, we notice a reduction of the return time period of 6.9 years from 1954 to 1980, 7.2 years from 1980 to 2000 and about 1 year only in the last two decades (Figure 11).
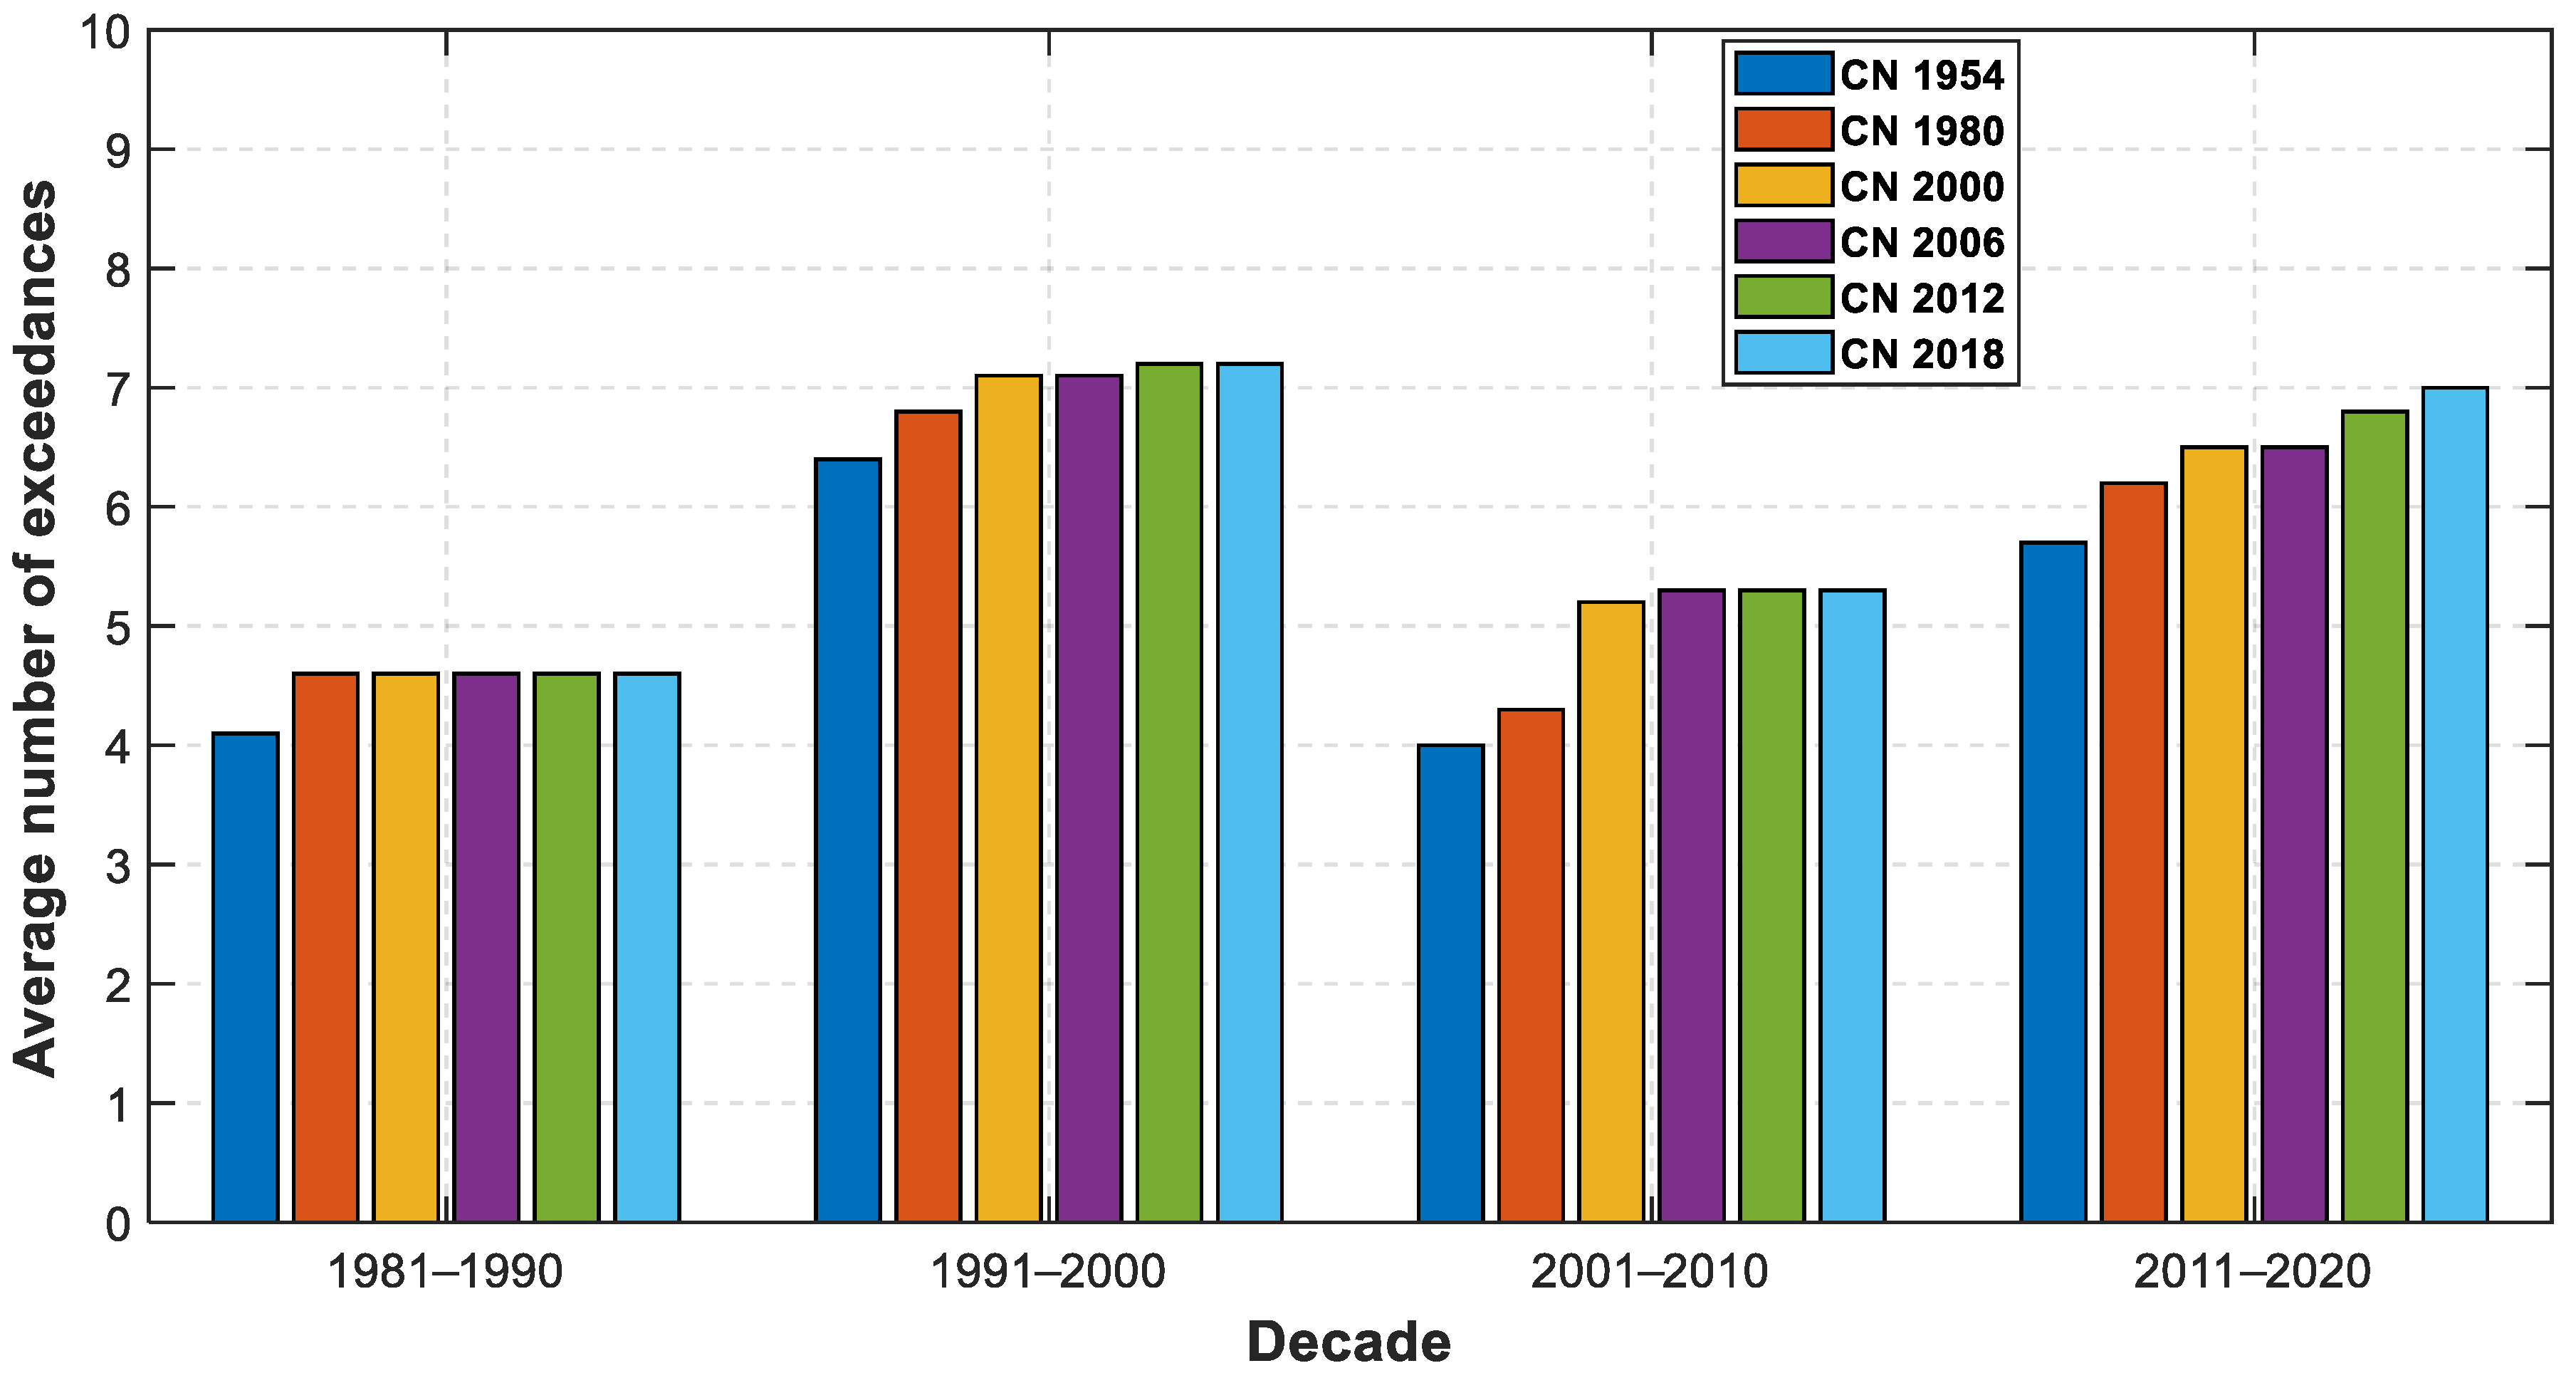
To investigate the response in terms of runoff, the same exercise of six simulations for the six CN variations was repeated computing the average number per decade that flows exceeding the first warning threshold over the Seveso River basin at the Bovisio-Masciago gauge section.
The plot in Figure 12 can be read in two ways: first, we can keep unchanged the CN, and look at the differences in number of exceedances over the four decades, and second, we can choose a decade and appreciate how variation of exceedances of the first warning threshold (equal to 35 m3/s) at Bovisio-Masciago were changing the CN conditions for each simulation of the hydrological FEST-WB model forced with ERA5-Land dataset.
As far as concerning the runoff, and in particular, keeping unchanged the CN condition through the 40 years, the first point confirms the same outcome examined in Section 4.1 about precipitation analysis, and no trends were found even for the average number of times flows exceeding the first warning threshold; on the other hand, a slight increase of exceedances was shown when we considered the time-variant CN increments in discharge simulations, as in Figure 11, where a diminishing of return period was depicted at different CN conditions.
4.3. The Hydrological Response Trend Analysis
In the previous paragraphs, we separately analysed the climate change impact looking at precipitation trends, land cover change, and their individual interactions over the hydrological response. In this section, we consider the combined effects of precipitation and CN variation on the runoff simulated at the Bovisio-Masciago gauge section of the Seveso River basin.
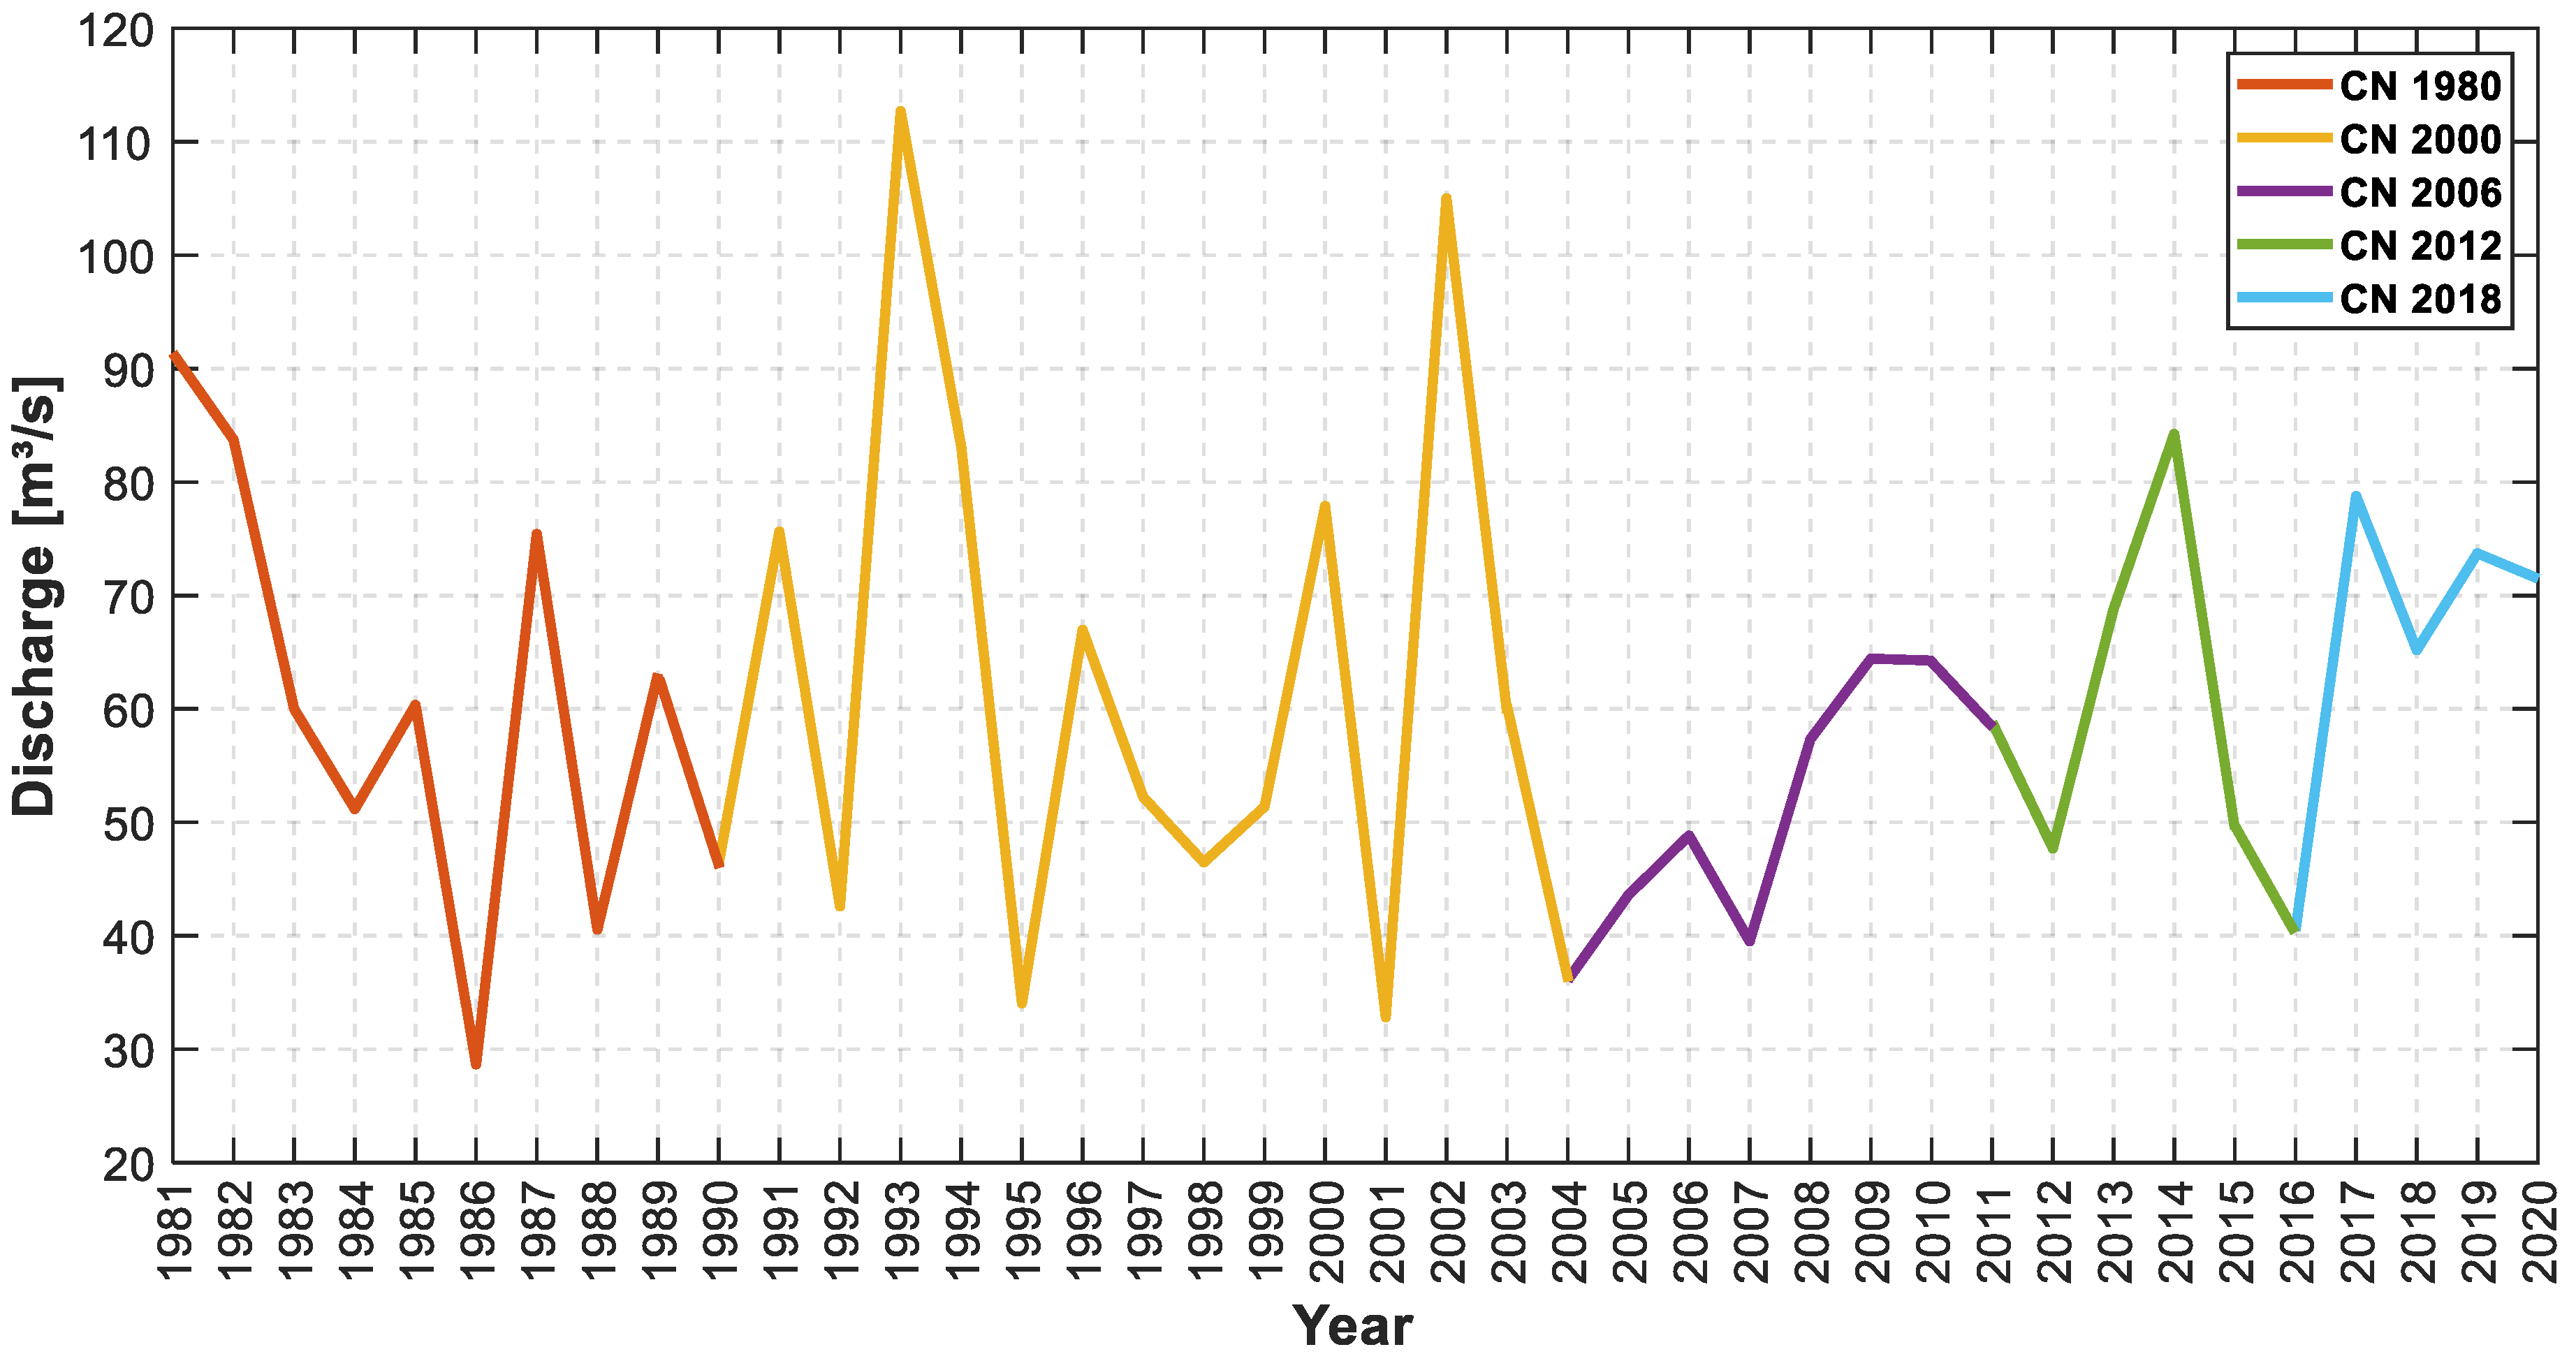
Figure 13 highlights the annual maximum discharge simulated with the hydrological FEST-WB model forced with ERA5-Land data under mutant CN conditions of the year 1980, 2000, 2006, 2012 and 2018. Even changing the CN conditions through the entire 40-year simulation period, no statistically significant signal was found. The p-value obtained with MK test is equal to 0.81, hence the hypothesis of an absence of trend is confirmed.
This key finding, which initially appears contrary to what is mentioned in the introduction, states that no significant discharge trend was observed, notwithstanding the CN increment through the years which turns out to be compensated by the precipitation variability.
As this reanalysis was carried out with a hydro-climatological simulation coupling the ERA5-Land with the FEST-WB model, we deeply investigated this issue using the measured data coming from the ARPA Lombardia network available in the last two decades, which has confirmed the trend observed above in Figure 13.
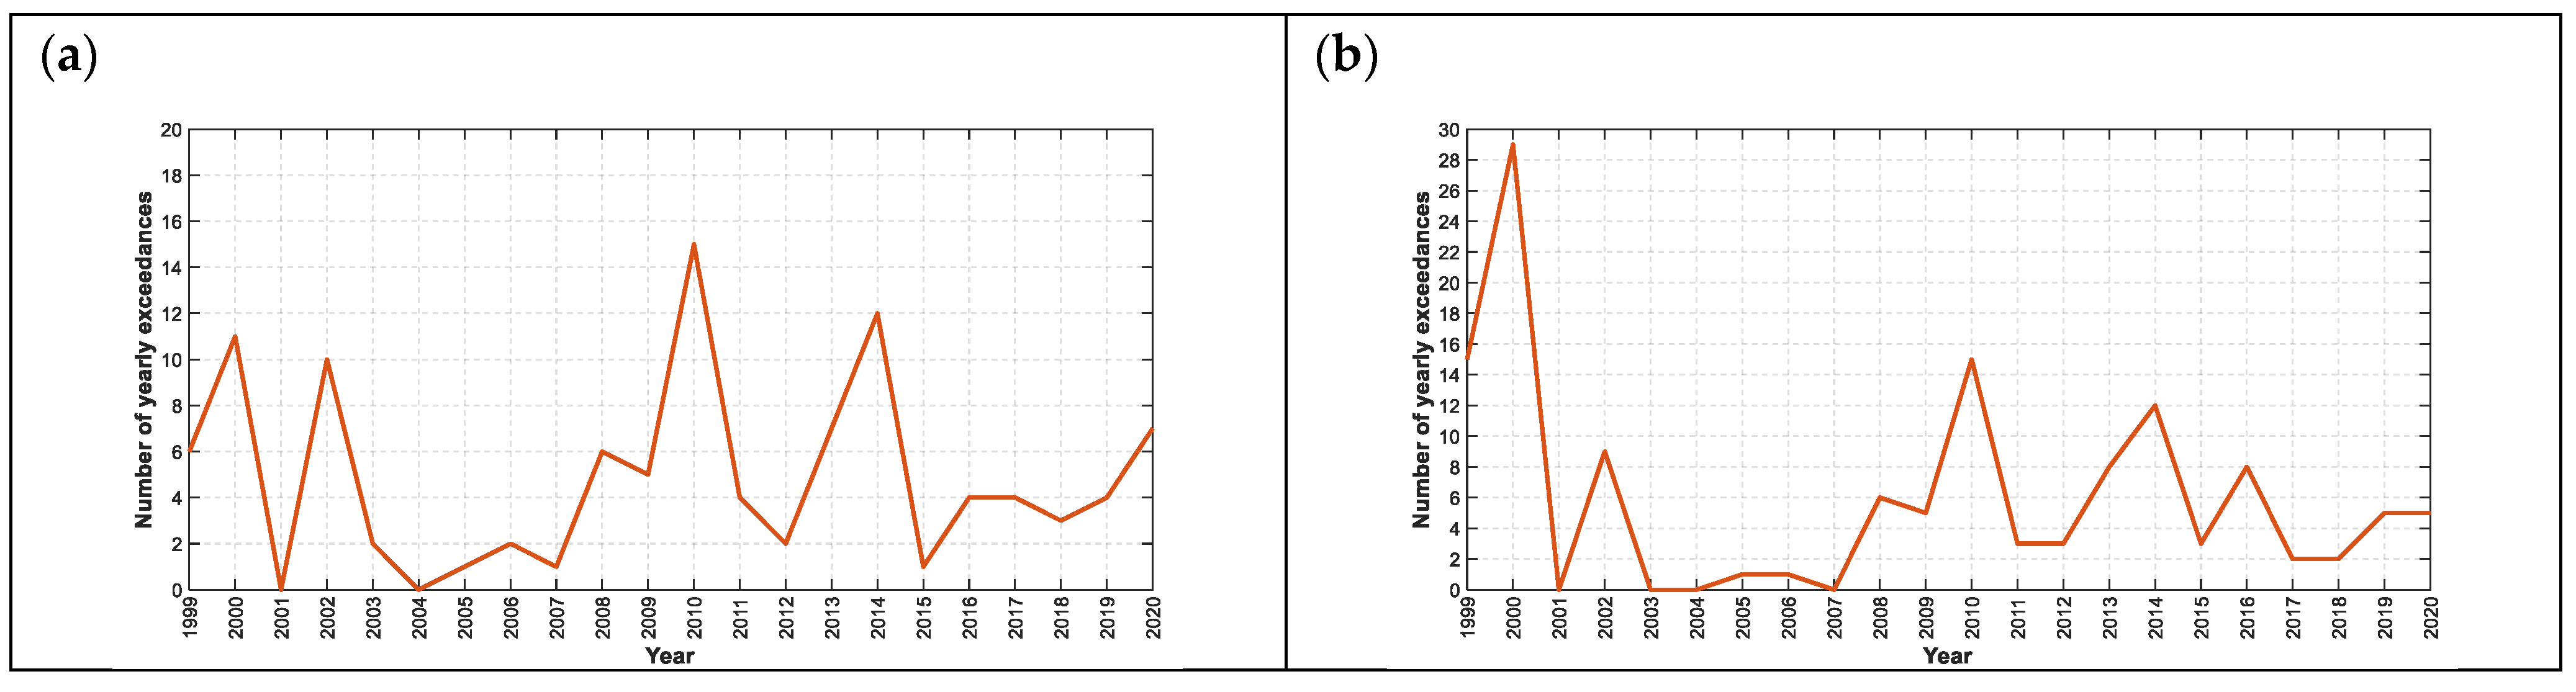
In fact, we can examine how many times the measured hydrometric level exceeded the first warning threshold for two gauge sections very close to Bovisio-Masciago town: one in Paderno Dugnano town, just 5 km south, but still upstream of the hydraulic node of the CSNO, and the other in Cantù city which is about 15 km north (Figure 14).
To statistically define if the presence or not of a significant trend exists, we calculated it through the Cox–Stuart test. As mentioned above in Section 3, as the available data series has here less than 30 values, we preferred to not use the MK test as before. However, both the obtained p-values are 0.344 and 0.508 for Paderno Dugnano and Cantù, respectively, which are below the α = 5% threshold; this again confirms the absence of a trend with the null hypothesis H0 accepted.
Therefore, we can state that over the last twenty-years, the Seveso River (upstream of the CSNO) shows no significant trends in the occurrence of severe hydrological episodes. However, the last decade does show an increase in precipitation values, but not enough to generate an intensification of flood occurrence, considering also that CN conditions have remained quite stable since year 2000, as shown in Table 2.
The results lead to the conclusion that there are no relevant trends from a statistical point of view to declare a change in precipitation pattern, and a modification in flow rates.
5. Conclusions
The present paper deals with a hydro-climatological reanalysis over three urban hydrological catchments Seveso, Olona and Lambro (SOL) rivers located northern than Milan City in the Lombardy Region (northern Italy).
To implement the entire chain, a climatological dataset, ERA5-Land, provided by ECMWF has coupled with a physically distributed rainfall-runoff hydrological model FEST-WB, developed by the Politecnico di Milano. Temperature, precipitation, and discharge simulations were analysed over 40 years, between 1981 and 2020 for the SOL river basins with a particular focus on a trunk of the Seveso River catchment closed at Bovisio-Masciago, which is situated upstream the CSNO spillway and remains undisturbed by hydraulic interferences.
The goal of this study was to, firstly, reconstruct the variability of main meteorological and hydrological variables over the four decades, try to identify the presence or not of statistically significant trends, and, consequently, quantify the impact of land use change over the hydrological response. This latter had a relevant influence over this area starting from the fifties up to year 2000 with the percentage of urbanized area rising to about 33%. In contrast, since the beginning of the new millennium, this constant growth in urbanization has essentially stopped and the CN value remains almost stable at about 46% over the last twenty years.
As far as climate change is concerned, temperatures have unequivocally risen all over the territory, about 2 °C in 40 years. Nevertheless, precipitation did not follow the same growing trend, even if the last decade (2011–2020) has shown the highest values in comparison with the other ones, but no statistically significant trends were detected using the Mann–Kendal analysis. Thus, combining both effects of climate and land use change, no statistically relevant trends were observed in terms of annual maximum runoff in the section of the Seveso River basin closed at Bovisio-Masciago, both using the 40 years ERA5-Land dataset and the 20-years measurements by local gauge network as input.
Therefore, although peoples’ perception is that there has been an increase in the numbers of flood events exceeding the warning threshold, the data do not support such a trend in this analysis: in fact, precipitation and runoff exceedance did not show any statistical trend. This last outcome is even in line with the European Environmental Agency (2019) for this region of Italy as described in the Introduction, but it would be interesting to be exploited in other countries, as the proposed methodology, which separates the effect of climate and land use change in the hydrological response, can be adopted in other study-areas.
Finally, we remind readers that the same considerations about precipitation trends and CN variations can be applied to Milan city that is just 20 km south of Bovisio-Masciago, and, hence, flood issues could essentially be searched for in hydraulic problems of the last decades. On that note, a future development, specific for the city of Milan, could be to better investigate the cause-effect relationship about local floods affecting the metropolitan area, whose frequency seems to have intensified in the last two decades.
Author Contributions
A.C. conceived this study, carried out the simulations with the ERA5-Land dataset coupled with the FEST-WB model, and wrote main parts of this paper; E.G. carried out all the data analysis and results presented in this paper; G.L. has worked in this area of study for years and contributed by preparing the observed hydro-meteorological dataset; G.R. developed the FEST-WB hydrological model and contributed many hydrological perspectives; M.M. brought many suggestions to this study and reviewed the entire paper. All authors have read and agreed to the published version of the manuscript.
Funding
This research received no external funding.
Institutional Review Board Statement
Not applicable.
Informed Consent Statement
Not applicable.
Data Availability Statement
The data presented in this study are available on request from the corresponding author.
Conflicts of Interest
The authors declare that they have no competing interest (both financial and non-financial ones).
Abbreviations
| AMC | Antecedent Moisture Condition |
| ARPA | Agenzia Regionale per la Protezione Ambientale (Regional Agency for Environmental Protection) |
| CLC | Corine Land Cover |
| CN | Curve Number |
| CS | Cox Stuart |
| CSNO | Canale Scolmatore di Nord-Ovest (North-West Spillway Channel) |
| DEM | Digital Elevation Model |
| ECMWF | European Centre for Medium-Range Weather Forecasts |
| FEST-WB | Flash flood Event-based Spatially-distributed rainfall-runoff Transformation-Water Balance |
| IPCC | Intergovernmental Panel on Climate Change |
| KGE | Kling-Gupta Efficiency |
| LS | Least Squares |
| MAE | Mean Absolute Error |
| MK | Mann Kendall |
| MNW | Meteonetwork |
| NSE | Nash-Sutcliffe Efficiency |
| SCS | Soil Conservation Service |
| SOL | Seveso Olona Lambro |
| SPI | Standardized Precipitation Index |
References
- Munich Re. Topics Geo 2016—Natural Catastrophes 2016—Analyses, Assessments, Positions; Munich Re: München, Germany, 2017. [Google Scholar]
- The Atlas of Mortality and Economic Losses from Weather, Climate and Water Extremes (1970–2019). WMO-No. 1267. 2021. Available online: https://library.wmo.int/index.php?lvl=coll_see&id=13 (accessed on 15 January 2022).
- Rentschler, J.E.; Melda, S. 1.47 Billion People Face Flood Risk Worldwide: For over a Third, It Could Be Devastating. 2020. Available online: https://blogs.worldbank.org/climatechange/147-billion-people-face-flood-risk-worldwide-over-third-it-could-be-devastating (accessed on 15 January 2022).
- Rosso, R. Bombe d’acqua: Alluvioni d’Italia dall’unità al Terzo Millennio; Marsilio Editori spa: Venezia, Italy, 2017. (In Italian) [Google Scholar]
- Brunetti, M.; Bertolini, A.; Soldati, M.; Maugeri, M. High-resolution analysis of 1-day extreme precipitation in a wet area centered over eastern Liguria, Italy. Theor. Appl. Climatol. 2019, 135, 341–353. [Google Scholar] [CrossRef] [Green Version]
- Giorgi, F.; Lionello, P. Climate change projections for the Mediterranean region. Glob. Planet. Chang. 2008, 63, 90–104. [Google Scholar] [CrossRef]
- Brugnara, Y.; Brunetti, M.; Maugeri, M.; Nanni, T.; Simolo, C. High-resolution analysis of daily precipitation trends in the central Alps over the last century. Int. J. Clim. 2011, 32, 1406–1422. [Google Scholar] [CrossRef]
- Brunetti, M.; Caloiero, T.; Coscarelli, R.; Gullà, G.; Nanni, T.; Simolo, C. Precipitation variability and change in the Calabria region (Italy) from a high resolution daily dataset. Int. J. Clim. 2010, 32, 57–73. [Google Scholar] [CrossRef]
- Taszarek, M.; Allen, J.T.; Marchio, M.; Brooks, H.E. Global climatology and trends in convective environments from ERA5 and rawinsonde data. npj Clim. Atmos. Sci. 2021, 4, 1–11. [Google Scholar] [CrossRef]
- European Environment Agency. 5 November 2019. Available online: https://www.eea.europa.eu/data-and-maps/indicators/river-floods-3/assessment (accessed on 15 January 2022).
- Zhang, Y.; Zhao, Y.; Wang, Q.; Wang, J.; Li, H.; Zhai, J.; Zhu, Y.; Li, J. Impact of Land Use on Frequency of Floods in Yongding River Basin, China. Water 2016, 8, 401. [Google Scholar] [CrossRef] [Green Version]
- Marchioni, M.; Becciu, G. Infiltration-exfiltration system for stormwater runoff volume and peak attenuation. Int. J. Saf. Secur. Eng. 2018, 8, 473–483. [Google Scholar] [CrossRef]
- Garcia-Ayllon, S.; Radke, J. Geostatistical Analysis of the Spatial Correlation between Territorial Anthropization and Flooding Vulnerability: Application to the DANA Phenomenon in a Mediterranean Watershed. Appl. Sci. 2021, 11, 809. [Google Scholar] [CrossRef]
- Basu, A.S.; Gill, L.W.; Pilla, F.; Basu, B. Assessment of Variations in Runoff Due to Landcover Changes Using the SWAT Model in an Urban River in Dublin, Ireland. Sustainability 2022, 14, 534. [Google Scholar] [CrossRef]
- Areu-Rangel, O.S.; Cea, L.; Bonasia, R.; Espinosa-Echavarria, V.J. Impact of Urban Growth and Changes in Land Use on River Flood Hazard in Villahermosa, Tabasco (Mexico). Water 2019, 11, 304. [Google Scholar] [CrossRef] [Green Version]
- Jenkins, K.; Surminski, S.; Hall, J.; Crick, F. Assessing surface water flood risk and management strategies under future climate change: Insights from an Agent-Based Model. Sci. Total Environ. 2017, 595, 159–168. [Google Scholar] [CrossRef] [PubMed]
- Varnes, D.J. Landslide Hazard Zonation: A Review of Principles and Practice; UNESCO Press: Paris, France, 1984; p. 63. [Google Scholar]
- Nemec, J. Global Runoff Data Sets and Use of Geographic Information Systems. In Proceedings of the ISLSCP Conference, Rome, Italy, 2–6 December 1985. ESA SP-248. [Google Scholar]
- Ceppi, A.; Ravazzani, G.; Salandin, A.; Rabuffetti, D.; Montani, A.; Borgonovo, E.; Mancini, M. Effects of temperature on flood forecasting: Analysis of an operative case study in Alpine basins. Nat. Hazards Earth Syst. Sci. 2013, 13, 1051–1062. [Google Scholar] [CrossRef] [Green Version]
- Ravazzani, G.; Amengual, A.; Ceppi, A.; Homar, V.; Romero, R.; Lombardi, G.; Mancini, M. Potentialities of ensemble strategies for flood forecasting over the Milano urban area. J. Hydrol. 2016, 539, 237–253. [Google Scholar] [CrossRef]
- Lombardi, G.; Ceppi, A.; Ravazzani, G.; Davolio, S.; Mancini, M. From Deterministic to Probabilistic Forecasts: The ‘Shift-Target’ Approach in the Milan Urban Area (Northern Italy). Geosciences 2018, 8, 181. [Google Scholar] [CrossRef] [Green Version]
- Becciu, G.; Ghia, M.; Mambretti, S. A century of works on river Seveso: From unregulated development to basin reclamation. Int. J. Environ. Impacts Manag. Mitig. Recover. 2018, 1, 461–472. [Google Scholar] [CrossRef] [Green Version]
- Muñoz-Sabater, J.; Dutra, E.; Agustí-Panareda, A.; Albergel, C.; Arduini, G.; Balsamo, G.; Boussetta, S.; Choulga, M.; Harrigan, S.; Hersbach, H.; et al. ERA5-Land: A state-of-the-art global reanalysis dataset for land applications. Earth Syst. Sci. Data 2021, 13, 4349–4383. [Google Scholar] [CrossRef]
- Mancini, M. La Modellazione Distribuita Della Risposta Idrologica: Effetti Della Variabilità Spaziale e Della Scala di Rappresentazione del Fenomeno Dell’assorbimento, Tesi di Dottorato. Ph.D. Thesis, Politecnico di Milano, Milano, Italy, 1990. (In Italian). [Google Scholar]
- Rabuffetti, D.; Ravazzani, G.; Corbari, C.; Mancini, M. Verification of operational Quantitative Discharge Forecast (QDF) for a regional warning system–the AMPHORE case studies in the upper Po River. Nat. Hazards Earth Syst. Sci. 2008, 8, 161–173. [Google Scholar] [CrossRef] [Green Version]
- Bonanno, R.; Lacavalla, M.; Sperati, S. A new high-resolution Meteorological Reanalysis Italian Dataset: MERIDA. Q. J. R. Meteorol. Soc. 2019, 145, 1756–1779. [Google Scholar] [CrossRef]
- Tarek, M.; Brissette, F.P.; Arsenault, R. Evaluation of the ERA5 reanalysis as a potential reference dataset for hydrological modelling over North America. Hydrol. Earth Syst. Sci. 2020, 24, 2527–2544. [Google Scholar] [CrossRef]
- Essou, G.R.C.; Sabarly, F.; Lucas-Picher, P.; Brissette, F.; Poulin, A. Can Precipitation and Temperature from Meteorological Reanalyses Be Used for Hydrological Modeling? J. Hydrometeorol. 2016, 17, 1929–1950. [Google Scholar] [CrossRef]
- EUCLMS, European Union, Copernicus Land Monitoring Service©. Available online: https://land.copernicus.eu/pan-european/corine-land-cover/ (accessed on 15 January 2022).
- Muñoz Sabater, J. ERA5-Land Hourly Data from 1981 to Present. Copernicus Climate Change Service (C3S) Climate Data Store (CDS). 2019. Available online: https://cds.climate.copernicus.eu/cdsapp#!/dataset/10.24381/cds.e2161bac?tab=overview (accessed on 15 January 2022).
- Ravazzani, G. MOSAICO, a library for raster based hydrological applications. Comput. Geosci. 2013, 51, 1–6. [Google Scholar] [CrossRef]
- USDA; SCS. Urban hydrology for small watersheds. Tech. Release 1986, 55, 2–6. [Google Scholar]
- Montaldo, N.; Toninelli, V.; Albertson, J.D.; Mancini, M.; Troch, P.A. The effect of background hydrometeorological conditions on the sensitivity of evapotranspiration to model parameters: Analysis with measurements from an Italian alpine catchment. Hydrol. Earth Syst. Sci. 2003, 7, 848–861. [Google Scholar] [CrossRef]
- Chow, V.T.; Maidment, D.R.; Mays, L.W. Applied Hydrology; Civil Engineering Series; McGraw-Hill International Editions: New York, NY, USA, 1988; p. 572. [Google Scholar]
- Ravazzani, G.; Ghilardi, M.; Mendlik, T.; Gobiet, A.; Corbari, C.; Mancini, M. Investigation of Climate Change Impact on Water Resources for an Alpine Basin in Northern Italy: Implications for Evapotranspiration Modeling Complexity. PLoS ONE 2014, 9, e109053. [Google Scholar] [CrossRef] [PubMed]
- Ravazzani, G.; Gianoli, P.; Meucci, S.; Mancini, M. Assessing Downstream Impacts of Detention Basins in Urbanized River Basins Using a Distributed Hydrological Model. Water Resour. Manag. 2014, 28, 1033–1044. [Google Scholar] [CrossRef]
- Ravazzani, G.; Barbero, S.; Salandin, A.; Senatore, A.; Mancini, M. An integrated Hydrological Model for Assessing Climate Change Impacts on Water Resources of the Upper Po River Basin. Water Resour. Manag. 2014, 29, 1193–1215. [Google Scholar] [CrossRef]
- Amengual, A.; Borga, M.; Ravazzani, G.; Crema, S. The role of storm movement in controlling flash flood response: An analysis of the 28 September 2012 extreme event in Murcia, southeastern Spain. J. Hydrometeorol. 2021, 22, 2379–2392. [Google Scholar] [CrossRef]
- Wilks, D.S. Statistical Methods in the Atmospheric Sciences. Vol. 91; Academic Press: San Diego, CA, USA, 2006; p. 627. [Google Scholar]
- Jolliffe, I.T.; Stephenson, D.B. (Eds.) Forecast Verification: A Practitioner’s Guide in Atmospheric Science; John Wiley & Sons: Hoboken, NJ, USA, 2012. [Google Scholar]
- WWRP/WGNE Joint Working Group on Verification Cited 2013: Forecast Verification—Issue. Methods and FAQ. Available online: http://www.cawcr.gov.au/projects/verification (accessed on 15 January 2022).
- Nash, J.E.; Sutcliffe, J.V. River flow forecasting through conceptual models part I—A discussion of principles. J. Hydrol. 1970, 10, 282–290. [Google Scholar] [CrossRef]
- Gupta, H.V.; Kling, H.; Yilmaz, K.K.; Martinez, G.F. Decomposition of the mean squared error and NSE performance criteria: Implications for improving hydrological modelling. J. Hydrol. 2009, 377, 80–91. [Google Scholar] [CrossRef] [Green Version]
- Kling, H.; Fuchs, M.; Paulin, M. Runoff conditions in the upper Danube basin under an ensemble of climate change scenarios. J. Hydrol. 2012, 424–425, 264–277. [Google Scholar] [CrossRef]
- Knoben, W.J.M.; Freer, J.E.; Woods, R.A. Inherent benchmark or not? Comparing Nash–Sutcliffe and Kling–Gupta efficiency scores. Hydrol. Earth Syst. Sci. 2019, 23, 4323–4331. [Google Scholar] [CrossRef] [Green Version]
- Pool, S.; Vis, M.; Seibert, J. Evaluating model performance: Towards a non-parametric variant of the Kling-Gupta efficiency. Hydrol. Sci. J. 2018, 63, 1941–1953. [Google Scholar] [CrossRef]
- McKee, T.B.; Doesken, N.J.; Kleist, J. The Relation of Drought Frequency and Duration to Time Scales. In Proceedings of the 8th Conference on Applied Climatology, Anaheim, CA, USA, 17–22 January 1993; pp. 179–184. [Google Scholar]
- Edwards, D.C.; McKee, T.B. Characteristics of 20th Century Drought in the United States at Multiple Scales. Atmospheric Science Paper, 1–30 May 1997; p. No. 634. [Google Scholar]
- Keyantash, John; National Center for Atmospheric Research Staff (Eds.) Last Modified 7 August 2018. The Climate Data Guide: Standardized Precipitation Index (SPI). Available online: https://climatedataguide.ucar.edu/climate-data/standardized-precipitation-index-spi (accessed on 15 January 2022).
- Beguería, S.; Vicente-Serrano, S.M. SPEI: Calculation of the Standardised Precipitation-Evapotranspiration Index. R package Version 1.7. 2017. Available online: https://CRAN.R-project.org/package=SPEI (accessed on 15 January 2022).
- Cox, D.R.; Stuart, A. Some quick sign tests for trend in location and dispersion. Biometrika 1955, 42, 80–95. [Google Scholar] [CrossRef] [Green Version]
- Rutkowska, A. Properties of the Cox–Stuart Test for Trend in Application to Hydrological Series: The Simulation Study. Commun. Stat.—Simul. Comput. 2014, 44, 565–579. [Google Scholar] [CrossRef]
- Farnsworth, D.L. A Cautionary Note Concerning the Cox and Stuart Test. Teach. Stat. 2001, 23, 76–79. [Google Scholar] [CrossRef]
- Caloiero, T.; Coscarelli, R.; Ferrari, E.; Sirangelo, B. Trend analysis of monthly mean values and extreme indices of daily temperature in a region of southern Italy. Int. J. Clim. 2017, 37, 284–297. [Google Scholar] [CrossRef]
- Caloiero, T.; Coscarelli, R.; Gaudio, R.; Leonardo, G.P. Precipitation trend and concentration in the Sardinia region. Theor. Appl. Climatol. 2019, 137, 297–307. [Google Scholar] [CrossRef]
- Wang, F.; Shao, W.; Yu, H.; Kan, G.; He, X.; Zhang, D.; Ren, M.; Wang, G. Re-evaluation of the Power of the Mann-Kendall Test for Detecting Monotonic Trends in Hydrometeorological Time Series. Front. Earth Sci. 2020, 8, 14. [Google Scholar] [CrossRef]
- Pohlert, T. Trend: Non-Parametric Trend Tests and Change-Point Detection. R Package Version 1.1.4. 2020. Available online: https://CRAN.R-project.org/package=trend (accessed on 15 January 2022).
- Mann, H.B. Nonparametric tests against trend. Econom. J. Econom. Soc. 1945, 13, 245–259. [Google Scholar] [CrossRef]
- Kendall, M.G. Rank Correlation Methods; Oxford University Press: New York, NY, USA, 1975. [Google Scholar]
- Hipel, K.W.; McLeod, H. Time Series Modelling of Water Resources and Environmental Systems; Elsevier: Amsterdam, The Netherlands, 1994. [Google Scholar]
- IPCC. Summary for Policymakers. Fifth Assessment Report of the Intergovernmental Panel on Climate Change; Cambridge University Press: Cambridge, UK, 2013. [Google Scholar]
- Klein, T.; Zwiers, F.W.; Xuebin, Z. Guidelines onanalysis of extremes in a changing climate in supportof informed decisions for adaptation. In World Meteorological Organization Collection(s) and Series; World Meteorological Organization: Geneva, Switzerland, 2009. [Google Scholar]
Figure 1.
The SOL, Seveso, Olona, and Lambro river basins draining to the Milano urban area.

Figure 2.
CN values for the years 1954, 1980, 2000, 2006, 2012 and 2018 for the Seveso River catchment closed at Bovisio-Masciago town; the geographical reference system is Roma 1940 Gauss Boaga Ovest.
Figure 2.
CN values for the years 1954, 1980, 2000, 2006, 2012 and 2018 for the Seveso River catchment closed at Bovisio-Masciago town; the geographical reference system is Roma 1940 Gauss Boaga Ovest.


Figure 3.
Example of ERA5 land temperature chart (a) and horizontal spatial resolution (b) over the SOL watersheds.
Figure 3.
Example of ERA5 land temperature chart (a) and horizontal spatial resolution (b) over the SOL watersheds.

Figure 4.
Weather stations in the study area: green dots are data from the ARPA (Regional Agency for Environmental Protection) of the Lombardy region, while red dots are from Meteonetwork association (www.meteonetwork.it, accessed on 15 January 2022).
Figure 4.
Weather stations in the study area: green dots are data from the ARPA (Regional Agency for Environmental Protection) of the Lombardy region, while red dots are from Meteonetwork association (www.meteonetwork.it, accessed on 15 January 2022).

Figure 5.
Comparison between ERA5-Land and observed minimum, mean, and maximum annual temperature data (Meteonetwork and ARPA weather stations).
Figure 5.
Comparison between ERA5-Land and observed minimum, mean, and maximum annual temperature data (Meteonetwork and ARPA weather stations).

Figure 6.
Comparison between ERA5-Land and observed annual precipitation data (Meteonetwork and ARPA weather stations).
Figure 6.
Comparison between ERA5-Land and observed annual precipitation data (Meteonetwork and ARPA weather stations).

Figure 7.
Comparison between simulated runoff by FEST-WB model forced with ERA5-Land (y-axis) and observed data (x-axis) for the years 2003–2020: average (a) and maximum (b) daily discharge values at the Bovisio-Masciago gauge section.
Figure 7.
Comparison between simulated runoff by FEST-WB model forced with ERA5-Land (y-axis) and observed data (x-axis) for the years 2003–2020: average (a) and maximum (b) daily discharge values at the Bovisio-Masciago gauge section.

Figure 8.
Reconstruction of mean annual temperature (1981–2020) by the ERA5-Land reanalysis over the section of the Seveso River basin closed at Bovisio-Masciago.
Figure 8.
Reconstruction of mean annual temperature (1981–2020) by the ERA5-Land reanalysis over the section of the Seveso River basin closed at Bovisio-Masciago.

Figure 9.
Reconstruction of the SPI index over 12 months by ERA5-Land reanalysis (1981–2020) for the section of the Seveso River basin closed at Bovisio-Masciago.
Figure 9.
Reconstruction of the SPI index over 12 months by ERA5-Land reanalysis (1981–2020) for the section of the Seveso River basin closed at Bovisio-Masciago.

Figure 10.
Precipitation analysis with ERA5-Land dataset (1981–2020): total annual precipitation (a), annual numbers of wet days with daily precipitation greater than 1 mm (b), 24-h annual maximum precipitation (c) and annual hourly maximum precipitation (d).
Figure 10.
Precipitation analysis with ERA5-Land dataset (1981–2020): total annual precipitation (a), annual numbers of wet days with daily precipitation greater than 1 mm (b), 24-h annual maximum precipitation (c) and annual hourly maximum precipitation (d).

Figure 11.
Relationship between discharge and return period at different CN conditions over the section of the Seveso River basin closed at Bovisio-Masciago.
Figure 11.
Relationship between discharge and return period at different CN conditions over the section of the Seveso River basin closed at Bovisio-Masciago.

Figure 12.
Average decade number of annual exceedance events the 35 m3/s discharge threshold at different CN conditions over the section of the Seveso River basin closed at Bovisio-Masciago.
Figure 12.
Average decade number of annual exceedance events the 35 m3/s discharge threshold at different CN conditions over the section of the Seveso River basin closed at Bovisio-Masciago.

Figure 13.
Annual maximum discharge at time-variant CN conditions: simulations by the FEST-WB model enforced with the ERA5-Land data at the Bovisio-Masciago gauge section.
Figure 13.
Annual maximum discharge at time-variant CN conditions: simulations by the FEST-WB model enforced with the ERA5-Land data at the Bovisio-Masciago gauge section.

Figure 14.
Number of annual exceedances (1999–2020) of the first hydrometric level threshold over the Seveso River basin for Paderno Dugnano (a) and Cantù (b) gauge sections, respectively.
Figure 14.
Number of annual exceedances (1999–2020) of the first hydrometric level threshold over the Seveso River basin for Paderno Dugnano (a) and Cantù (b) gauge sections, respectively.


Table 1.
Percentage of urbanized area over the Seveso River basin closed at the Bovisio-Masciago gauge section.
Table 1.
Percentage of urbanized area over the Seveso River basin closed at the Bovisio-Masciago gauge section.
| Year | Percentage of Urbanized Area |
|---|---|
| 1954 | 11.8% |
| 1980 | 32.0% |
| 2000 | 44.7% |
| 2006 | 45.6% |
| 2012 | 46.6% |
| 2018 | 46.8% |
Table 2.
Summary of MK test results on precipitation series.
| Variable | Is the Trend Present? (α = 5%) | p-Value (MK-Test) |
|---|---|---|
| Total annual precipitation | No | 0.537 |
| Annual number of wet days (p > 1 mm) | No | 0.172 |
| 24-h maximum annual precipitation | No | 0.552 |
| hourly maximum annual precipitation | No | 0.568 |
Table 3.
Return period and probability of yearly exceedance the second warning threshold of 90 m3/s at given CN conditions.
Table 3.
Return period and probability of yearly exceedance the second warning threshold of 90 m3/s at given CN conditions.
| Year of CN | Return Period [Years] | Probability of Yearly Exceedance [%] |
|---|---|---|
| CN 1954 | 18.56 | 5.4 |
| CN 1980 | 14.90 | 6.7 |
| CN 2000 | 11.00 | 9.1 |
| CN 2006 | 10.77 | 9.3 |
| CN 2012 | 10.54 | 9.5 |
| CN 2018 | 10.49 | 9.5 |
Publisher’s Note: MDPI stays neutral with regard to jurisdictional claims in published maps and institutional affiliations. |
© 2022 by the authors. Licensee MDPI, Basel, Switzerland. This article is an open access article distributed under the terms and conditions of the Creative Commons Attribution (CC BY) license (https://creativecommons.org/licenses/by/4.0/).
Share and Cite
MDPI and ACS Style
Ceppi, A.; Gambini, E.; Lombardi, G.; Ravazzani, G.; Mancini, M. SOL40: Forty Years of Simulations under Climate and Land Use Change. Water 2022, 14, 837. https://doi.org/10.3390/w14060837
AMA Style
Ceppi A, Gambini E, Lombardi G, Ravazzani G, Mancini M. SOL40: Forty Years of Simulations under Climate and Land Use Change. Water. 2022; 14(6):837. https://doi.org/10.3390/w14060837
Chicago/Turabian StyleCeppi, Alessandro, Enrico Gambini, Gabriele Lombardi, Giovanni Ravazzani, and Marco Mancini. 2022. "SOL40: Forty Years of Simulations under Climate and Land Use Change" Water 14, no. 6: 837. https://doi.org/10.3390/w14060837
Note that from the first issue of 2016, this journal uses article numbers instead of page numbers. See further details here.