
Differential Response of Nutrients to Seasonal Hydrological Changes and a Rain Event in a Subtropical Watershed, Southeast China


1
Guangdong Provincial Key Laboratory of Marine Disaster Prediction and Prevention, Shantou University, Shantou 515063, China
2
Southern Marine Science and Engineering Guangdong Laboratory, Guangzhou 511458, China
3
State Key Laboratory of Marine Environmental Science, College of Ocean and Earth Sciences, Xiamen University, Xiamen 361002, China
4
State Key Laboratory of Marine Resource Utilization in South China Sea, Hainan University, Haikou 570228, China
*
Author to whom correspondence should be addressed.
Water 2022, 14(5), 834; https://doi.org/10.3390/w14050834
Submission received: 29 January 2022
/
Revised: 20 February 2022
/
Accepted: 4 March 2022
/
Published: 7 March 2022
(This article belongs to the Special Issue Non-point Source Pollution across Headwater Catchments to Large River Networks)
Abstract
:A large amount of terrestrial nutrients are discharged into the ocean through rivers. However, the impact of seasonal hydrological variations on riverine nutrient concentrations and fluxes remains unclear, especially in the medium-sized subtropical rivers that are highly influenced by human activities. In this study, we investigated the monthly changes in nutrient concentrations (soluble reactive phosphorus, SRP; dissolved silicate, DSi; and dissolved inorganic nitrogen, DIN) in the North Stream (NS) and West Stream (WS) of the Jiulong River (JLR). The results show that the concentrations of SRP and DSi in the NS and the WS displayed a similar seasonal variability, which was different from the pattern of DIN. Hydrological conditions, chemical fertilizer loss and biogeochemical processes are responsible for the seasonal changes in the nutrients in the two streams, especially during extreme rain events. Nutrient concentrations in the NS exhibited a clockwise trajectory along with river discharge during rain events, while a reverse pattern in the WS was observed since it experienced a moderately long rain event. Different rainfall features between the two main tributaries resulted in the majority of nutrients being exported at the start of the rain event in the NS and the end of rain event in the WS. Indeed, the annual high flow (Q/Qm > 3) accounts for ~17.3% of the annual nutrient flux in the JLR even though this period spans only ~4.0% of a year, which suggests the importance of rain events on nutrient export in these subtropical rivers. Although the annual fluxes of DIN and SRP in the JLR were smaller than many rivers worldwide, higher areal yields of DIN and SRP were observed, indicating that the JLR is highly influenced by human activities. Our study systematically evaluated the response of nutrient concentrations to hydrological changes in two tributaries of the JLR, which is useful in better understanding the nutrient dynamics in medium-sized subtropical rivers.
1. Introduction
Nutrients in coastal ecosystems, including dissolved inorganic nitrogen (DIN), soluble reactive phosphorus (SRP) and dissolved silicate (DSi), are mainly sourced from riverine inputs [1,2,3], which can directly control the level of marine primary productivity [3,4,5]. Due to human activity and climate change [6,7,8], riverine nutrient inputs in the ocean have increased several times since the preindustrial era [9,10], with the majority transported into the ocean during storm events [11,12,13,14,15,16,17] and accounting for up to 50% of the annual nutrient fluxes [18,19,20]. In East Asia, increased riverine nutrient inputs can be transported into the estuaries and their adjacent coastal areas by the higher frequency of tropical cyclones and extreme storms [21]. Therefore, it is necessary to study the way in which nutrients respond to hydrological changes, such as storm events, in order to improve our understanding of nutrient dynamics and provide scientific information for model predictions and the management of aquatic ecosystems.
Previous studies on nutrient dynamics have focused on large rivers, such as the Yangtze River [22,23,24], the Yellow River [22,25,26] and the Mississippi River [27,28,29], rather than medium- and small-sized rivers (catchment < 10,000 km2). However, medium- and small-sized rivers in tropical and subtropical regions can transport large amounts of nutrients into the ocean since they are more numerous (~44,975 in China) and generally characterized by high areal yields of nutrients caused by human activities [30]. Additionally, medium- and small-sized rivers are able to respond more quickly to climate change compared to large rivers because of their smaller catchment areas and shorter residence times [30].
The Jiulong River (JLR) is a medium-sized river in Southeast China that experiences eutrophic conditions caused by intensive human activities, such as agriculture, livestock, urban land use and dam construction [31,32]. It is also highly influenced by subtropical monsoons [33] and thus, large amounts of terrestrial nutrients can be pulsed from drainage basins into the river during extreme rain events [13,14,15,16,34]. Recent studies on the response of nutrients to hydrological events in the JLR have mainly focused on either one simple element (P or N) rather than all nutrients or on an investigation area only covering one of the streams [18,19,34,35,36,37]. In the context of accelerating climate change, it is necessary to study the response of all nutrients to hydrological changes (especially rain events) and compare the nutrient dynamics of the different tributaries. Therefore, we investigated the concentrations of nutrients in the two tributaries of the JLR (the NS and the WS) monthly from February 2014 to March 2015, including an extreme rain event (21–24 May 2014) during which high-resolution sampling was conducted. The objectives of this study were: (1) to explore nutrient dynamics in response to different hydrologic events in a medium-sized subtropical river, including seasonal hydrological changes and rain events; (2) to quantify the contributions of rain events to annual nutrient exports.
2. Material and Methods
2.1. Study Area
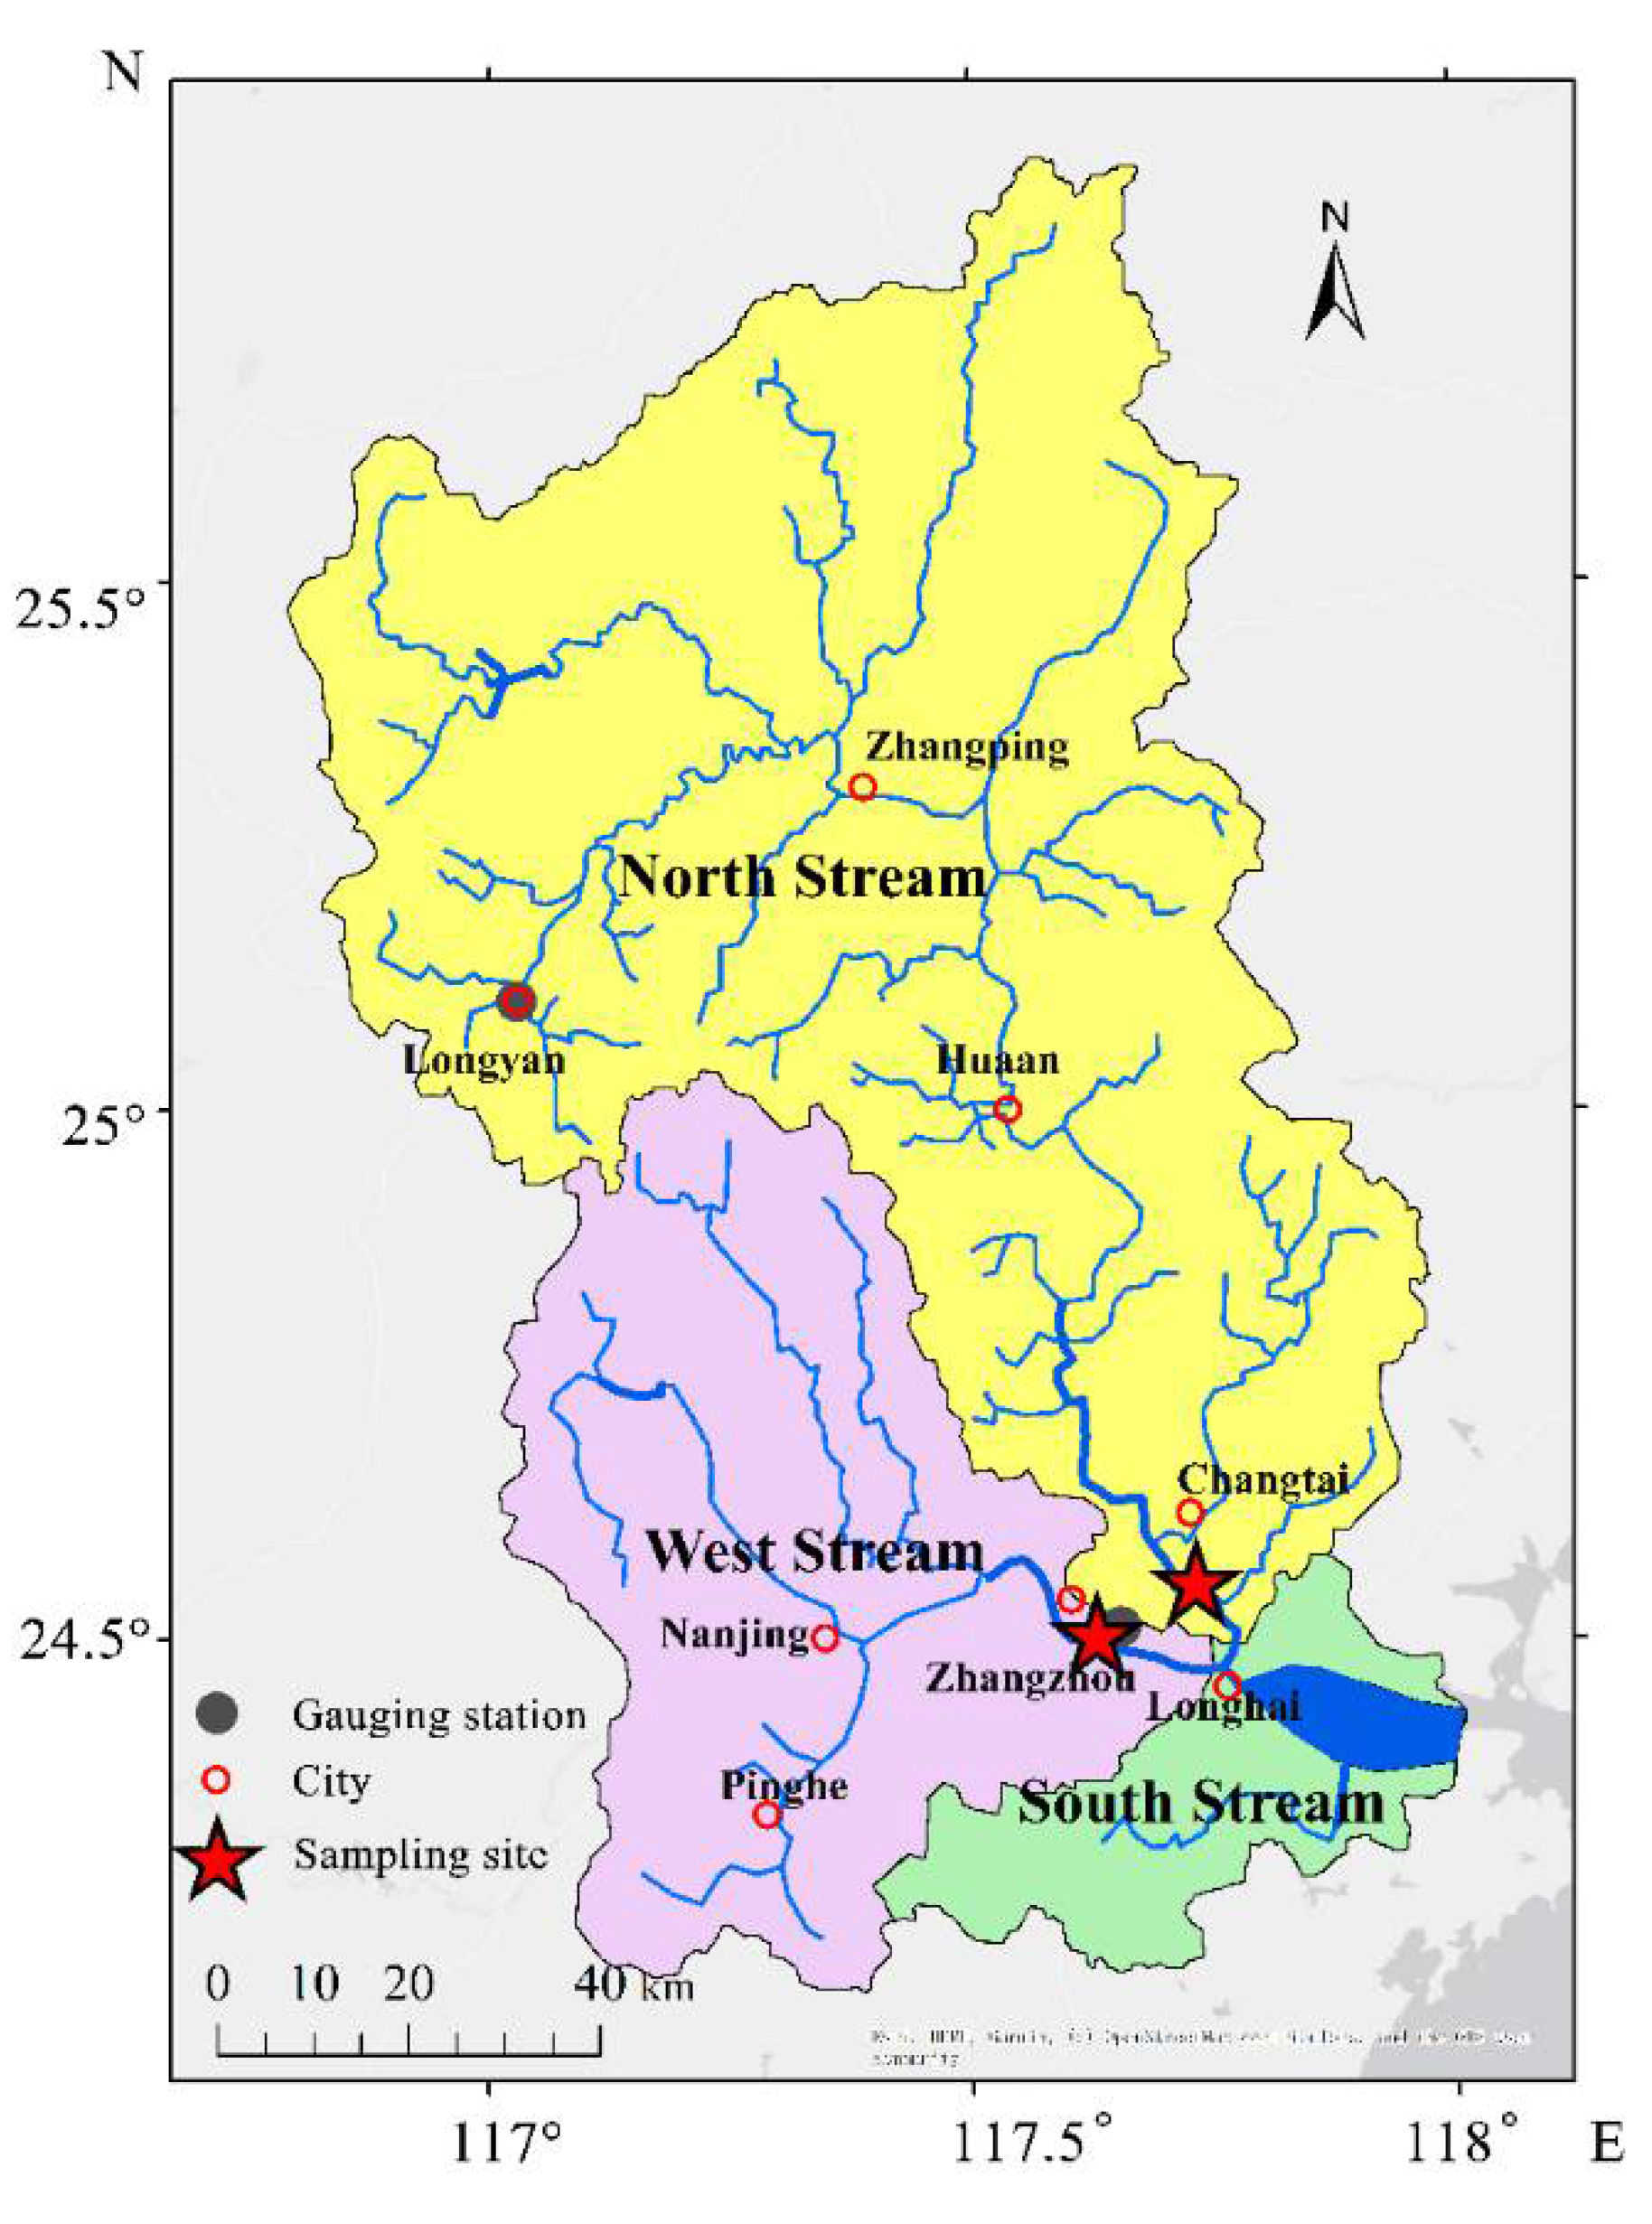
The NS, with a length of 285 km and a basin area of 9803 km2, is the largest tributary of the JLR and flows through five cities (Longyan, Zhangping, Changtai, Huaan and Zhangzhou). Longyan city, located along the upper reach of the NS, has a population of over 0.5 million and a large number of livestock that discharge excessive nutrients into the stream [31,32]. Additionally, over 60 dams have been constructed along the NS for hydropower and agricultural irrigation [32,38]. The WS has a length of 175 km and a drainage area of 3964 km2, covering Pinghe, Nanjing, Zhangzhou and Longhai city. Land use in the upper reaches of the WS is mainly dominated by cropland production that uses large amounts of inorganic fertilizers and manure [20,30,32,35]. However, in the middle reaches of the WS, there are some industrial food processing factories and villages in addition to the presence of agriculture. In the lower reaches, domestic waste is the main source of nutrient pollution due to the dense population (~0.8 million) [35]. Compared to the NS, fewer dams have been constructed along the WS [32]. The total river discharge in the JLR is up to 1.22 × 10¹⁰ m3, of which two thirds comes from the NS and one third from the WS [39]. Thus, the main sources of nutrients in the two tributaries are obviously different due to their variations in agricultural levels, densities of population and river discharge.
2.2. Sample Collection
From February 2014 to March 2015, surface water samples were collected monthly from the Guokeng Bridge (117.73° E, 24.56° N) in the lower reaches of the NS and the gauging station (Shuixianhua Bridge, 117.63° E, 24.51° N) on the WS (Figure 1). During the rain event (21–24 May 2014), a higher sampling frequency (at an interval of 2–3 h in the NS and 2 h in the WS) was established to trace the response of nutrients to the hydrological change. Water samples were collected using 5 L Niskin bottles in both the NS (n = 22) and the WS (n = 16). The water samples were filtered through 0.45 μm cellulose acetate membranes. Ammonium (NH4-N) and DSi samples were stored in a refrigerator at 4 °C, while the nitrite (NO2-N), nitrate (NO3-N) and SRP samples were preserved in a freezer at −20 °C. For the total suspended matters (TSM), the water samples were filtered through pre-weighed 0.7 μm GF/F glass fiber filters (Whatman) that were pre-combusted at 450 °C for 5 h.
2.3. Data Analysis
The concentrations of NO2-N, NO3-N, SRP and DSi were determined using an AA3 Auto-Analyzer (Bran+Luebbe Co., Hamburg, Germany) [40]. The concentrations of NH4-N were measured using a Tri-233 continuous Auto-Analyzer [40]. Detection limits were 0.1 μmol N L−1 for NO3-N, 0.04 μmol N L−1 for NO2-N, 0.5 μmol N L−1 for NH4-N, 0.08 μmol P L−1 for SRP and 0.08 μmol Si L−1 for DSi. Notably, the concentrations of the above three N variations were summed up and are shown as DIN (DIN = NO3-N + NO2-N + NH4-N) throughout the whole of this main text. The net weight of particles on the GF/F filters divided by the volumes of filtered water produced the concentrations of TSM.
2.4. Runoff Data Sources and Nutrient Flux Calculations
Daily runoff during 2014–2015 was collected for the gauging stations (Punan station for the NS and Zhengdian station for the WS) from the website of the Bureau of Hydrology, Ministry of Water Resources, China (http://xxfb.hydroinfo.gov.cn, accessed on 13 March 2015). Hourly rainfall data during the rain event were obtained from the website of the Fujian Provincial Water Resources Bureau (http://www.fjwater.gov.cn, accessed on 24 May 2014), collected from Longyan city (NS) and Zhangzhou city (WS). The rain event was divided into the rising limb of the hydrograph and the falling limb of the hydrograph based on peak discharge.
Riverine nutrient fluxes in the two tributaries were estimated using Equation (1), as described in a previous study [41]:
where represents the nutrient flux (mol P s−1 for SRP, mol Si s−1 for DSi and mol N s−1 for DIN), is the nutrient concentration (μmol P L−1 for SRP, μmol Si L−1 for DSi and μmol N L−1 for DIN) and is the instantaneous river discharge (m3 s−1).
A liner regression with a zero intercept was built by plotting against , which could provide a simplified equation representing the relationship between river discharge and nutrient flux, following Equation (2):
where a is the correlation coefficient between riverine flux and river discharge (Figure S1).
During the rain event, river discharge remained relatively steady within one-hour increments although it was variable throughout a whole day. The instantaneous nutrient loads could be obtained by multiplying the instantaneous discharge (, m3 s−1) by the interpolated nutrient concentrations between the sampling intervals [19]. Then, the hourly nutrient fluxes were estimated by multiplying the instantaneous nutrient fluxes by 3600 s. By summing up all hourly nutrient fluxes within one day, the daily nutrient fluxes (Fdaily-1, mol P for SRP, mol Si for DSi, mol N for DIN) during the rain event were obtained following Equation (3):
where is the concentrations calculated by the linear interpolation. The sum of the daily nutrient fluxes during the whole rain event represents the nutrient fluxes exported during the rain event. Similarly, the sum of the daily nutrient fluxes during high flow (Q/Qm > 3) over the whole studied year represents the annual nutrient fluxes exported under high flow conditions.
Compared to the rain event, river discharge during non-rainfall periods was generally stable. Therefore, we assumed that river discharge remained steady during non-rainfall periods. In this case, the daily nutrient loads (Fdaily-2, mol P for SRP, mol Si for DSi, mol N for DIN) were calculated using Equation (4):
The sum of all daily nutrient fluxes represents the yearly nutrient fluxes (FSRP for mol P, FDSi for mol Si, FDIN for mol N). For ease of comparison to the results from other studies, all nutrient fluxes (FSRP for kg P, FDSi for kg Si, FDIN for kg N) were transformed into the unit of kg by multiplying by the molar mass of each element (31.0 g mol−1 for P, 28.0 g mol−1 for Si, 14.0 g mol−1 for N).
Correlations among different parameters were determined by Kendall’s correlation in SPSS Statistic 25. The Student’s t-test was used to analyze the significance of the two sets of data. The variabilities of the nutrient concentrations and fluxes were determined by the one-way analysis of variance in SPSS Statistic 25, which was separated at the 5% significance level.
3. Results
3.1. Hydrology
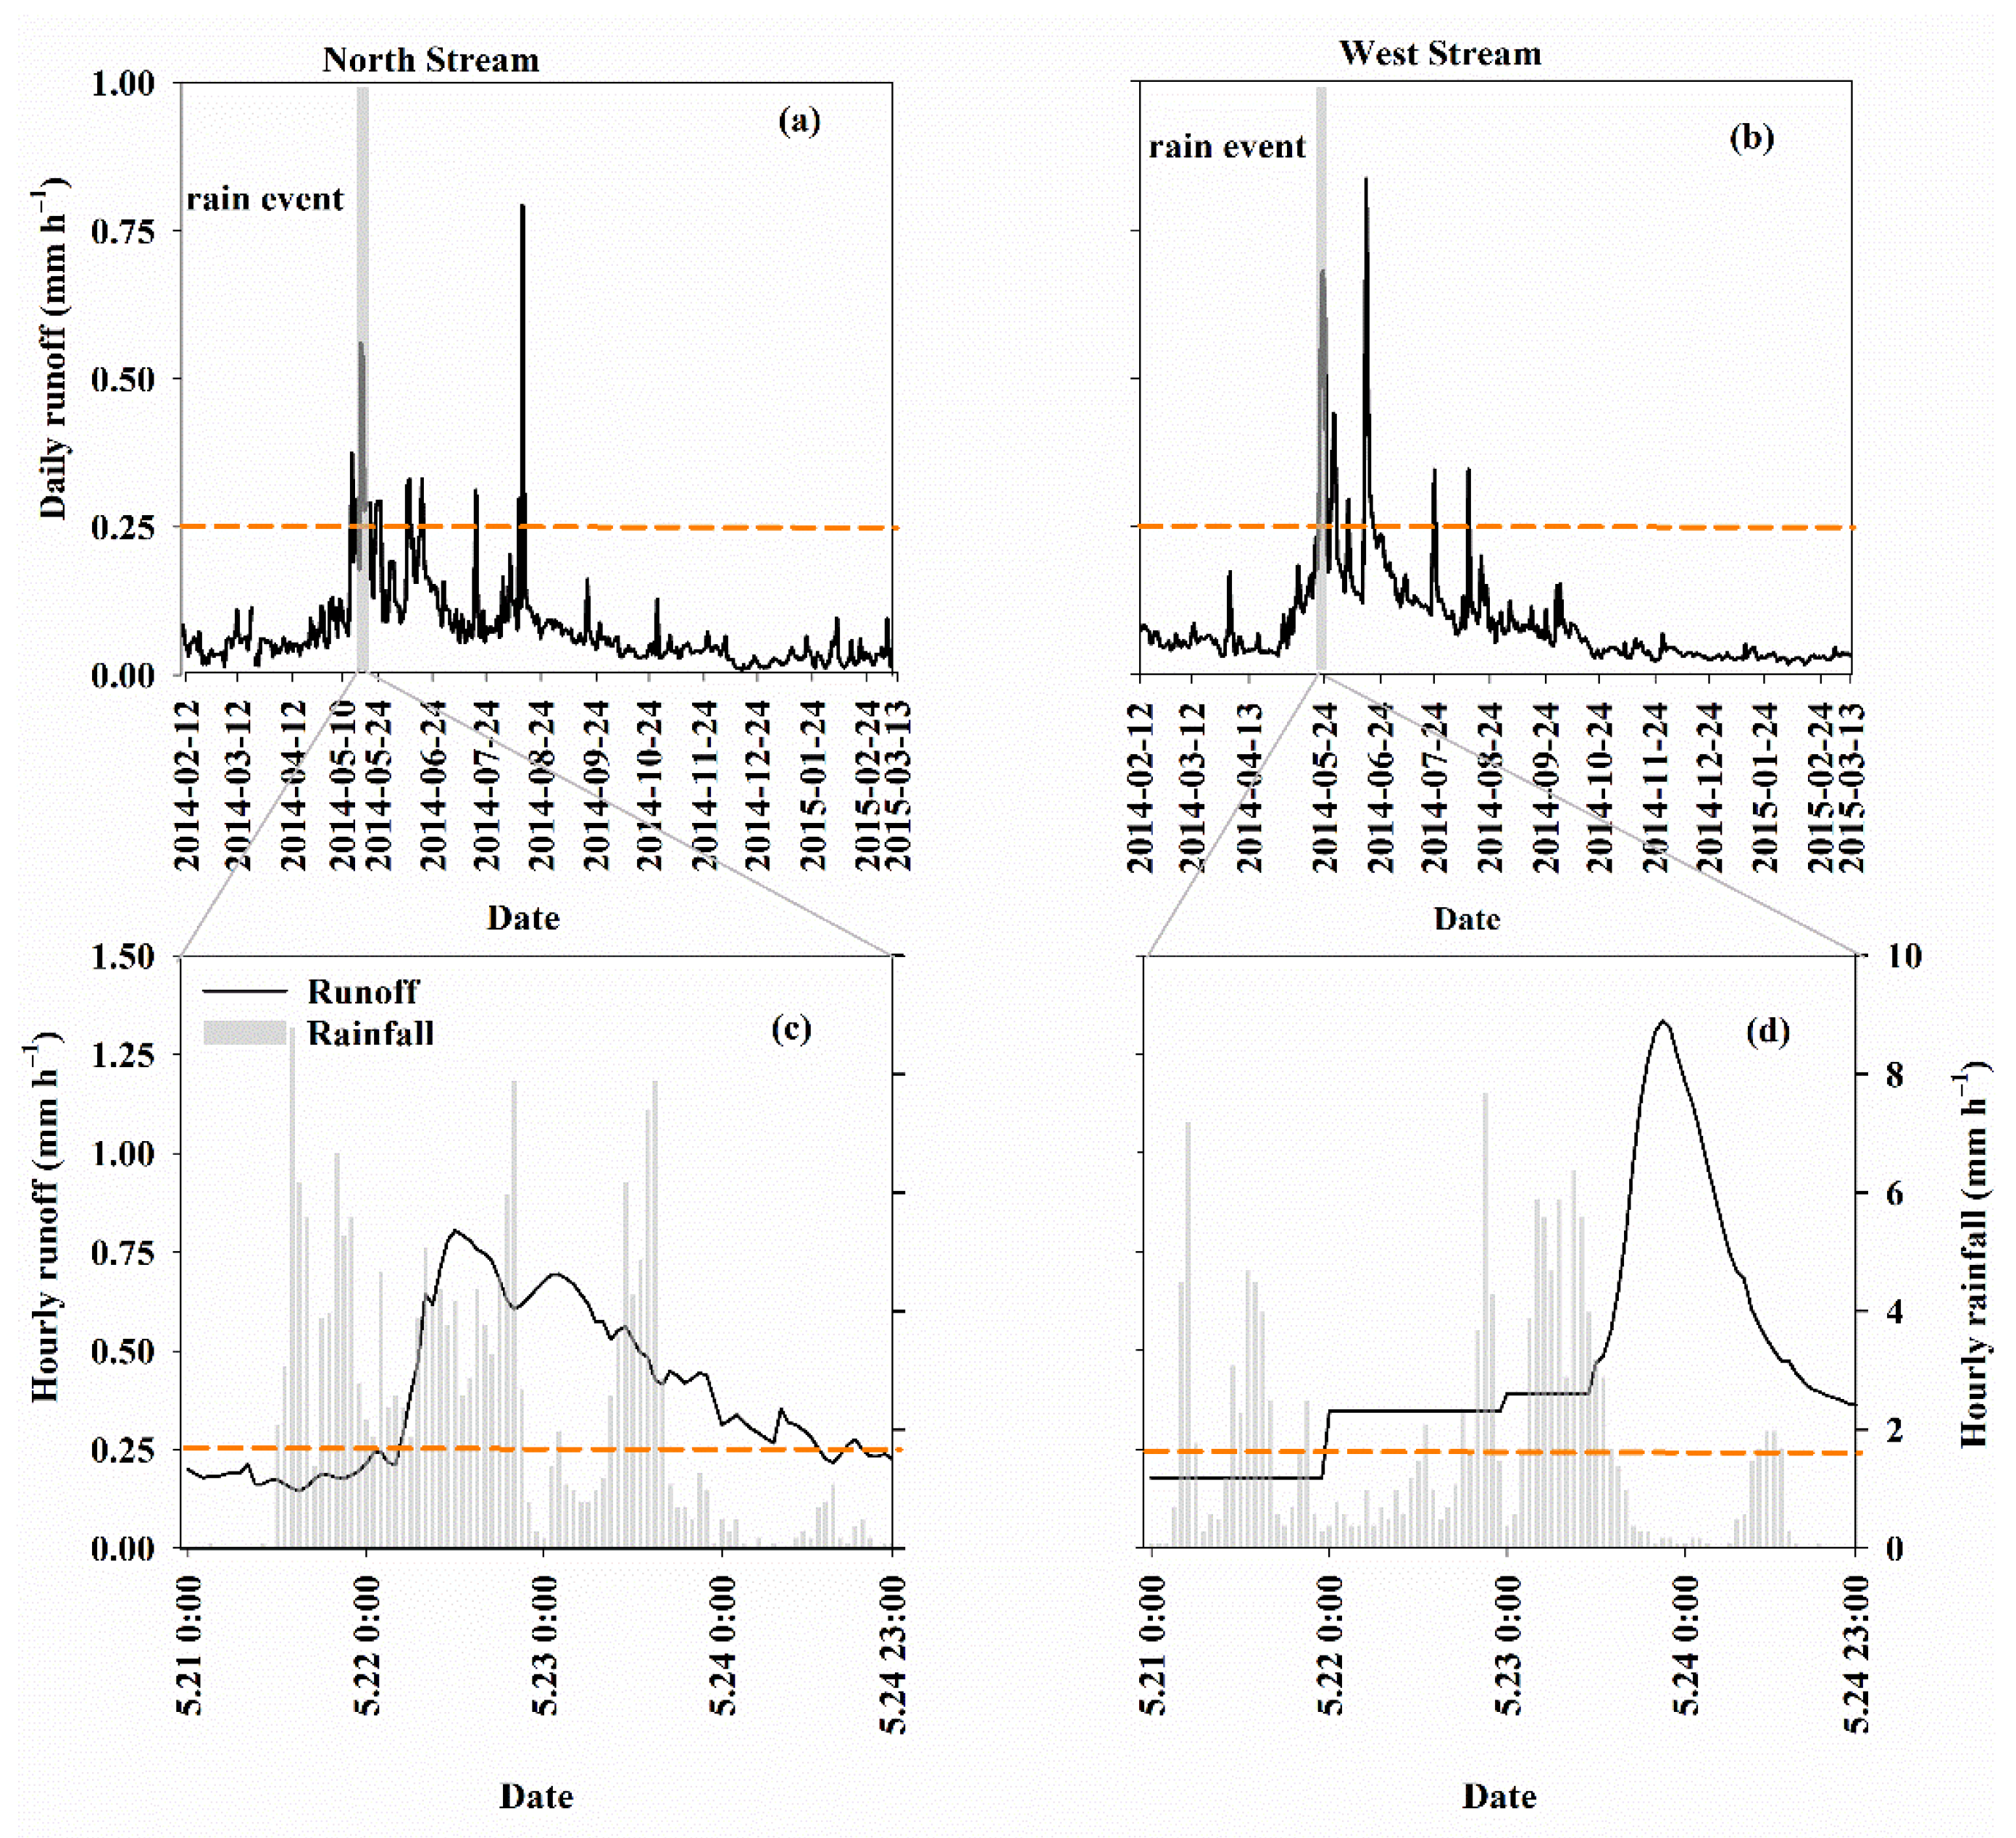
The range of daily average runoff (0.00–0.79 mm h−1) in the NS was similar to the WS (0.02–0.84 mm h−1) and exhibited an obvious seasonal variability (ANNOVA, p < 0.05) (Figure 2a,b). In general, the daily runoff was higher in spring and summer than autumn and winter due to the high frequency of plum rain in late spring and typhoons in late summer. Therefore, most of the high flows (Q/Qm > 3) appeared in spring and summer.
It is worth noting that the rain event was the first strong rainfall after the dry season and the largest rainfall in 2014 [42]. The variability of the hourly runoff during the rain event was larger than the non-rainfall period in both tributaries, with a range of 0.1–0.8 mm h−1 and 0.2–1.3 mm h−1 in the NS and WS, respectively. As shown in Table 1, the hydrologic parameters of rainfall duration time, peak runoff, mean hourly runoff and soil moisture (antecedent precipitation index, API) in the NS were all lower than in the WS. Thus, the cumulative runoff in the NS was lower than in the WS. However, the rainfall intensity (the sum of rainfall divided by the rainfall duration time) in the NS was higher than in the WS. Although the timing of the peak runoff in the NS occurred 33 h earlier than in the WS, the former had a lag time (22 h) between the peak rainfall and peak runoff that was similar to the WS (24 h). This suggests that the rainfall mainly shaped the characteristics of the runoff, depending on the soil moisture conditions before the rain event [13].
3.2. Temporal Variations in TSM and Nutrients
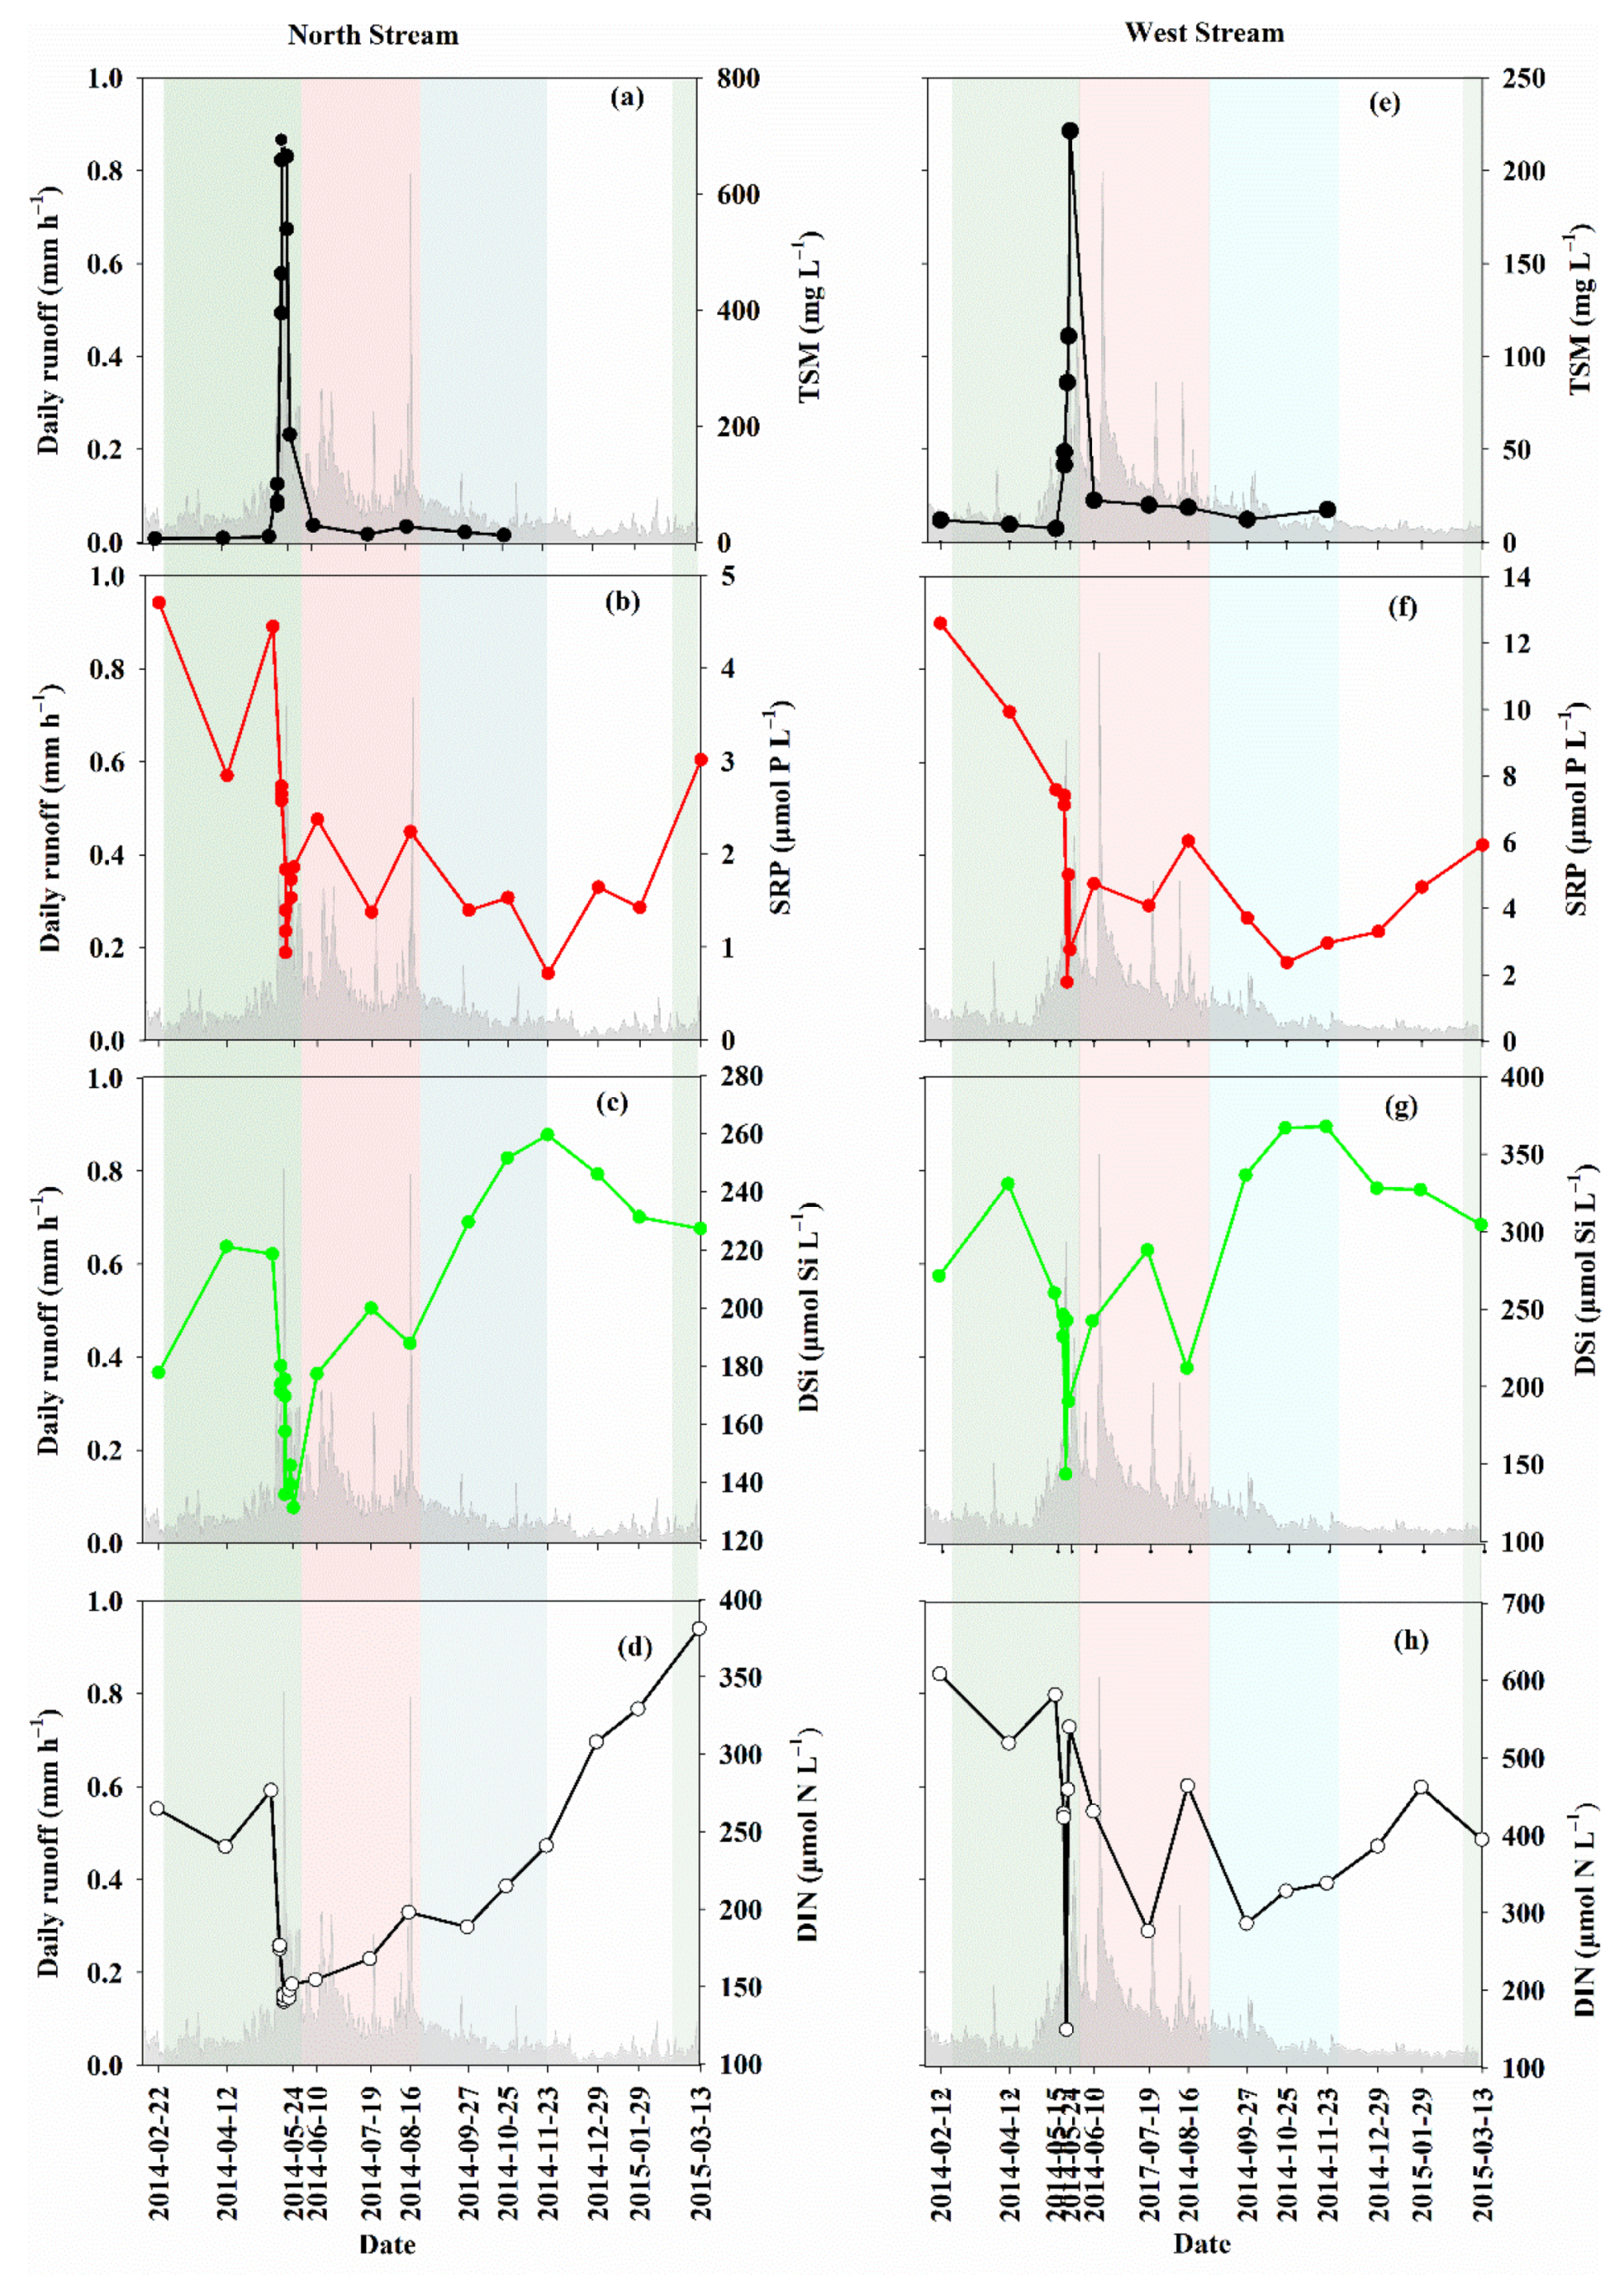
TSM concentrations varied widely in the NS from 7.3 to 693.2 mg L−1 (average = 219.7 ± 258.4 mg L−1, n = 18) and ranged from 7.4 to 221.4 mg L−1 (average = 48.3 ± 58.5 mg L−1, n = 13) in the WS (Figure 2). The range of TSM during late spring and early summer in both streams (29.4–693.2 mg L−1 in the NS and 22.6–221.4 mg L−1 in the WS) was 3–115 times larger than during the winter and early spring (6.0–12.0 mg L−1 in the NS and 7.4–12.0 mg L−1 in the WS). The maximum TSM concentrations (693.2 mg L−1 in the NS and 221.4 mg L−1 in the WS) were observed during the rain event. The annual average concentration of TSM in the NS (219.7 ± 258.4 mg L−1, n = 18) was five times higher than that in the WS (48.3 ± 58.5 mg L−1, n = 13).
The nutrient concentration patterns were different from TSM but the SRP concentrations in both streams showed a similar pattern. First, a decrease in spring, then fluctuating levels in summer, followed by a decline in autumn and finally, a continuous increase from winter to the following spring (1.7 μmol P L−1 to 3.0 μmol P L−1 for the NS and 3.3 μmol P L−1 to 5.9 μmol P L−1 for the WS) (Figure 3b,f). The annual mean concentrations of SRP in the NS (2.1 ± 0.1 μmol P L−1, n = 22) were significantly lower compared to those in the WS (5.4 ± 2.8 μmol P L−1, n = 17).
The temporal variations of DSi were different from SRP in both streams (Figure 3c,g). The DSi concentrations in the NS clearly decreased in spring, then increased continuously from summer to autumn, followed by a decline during winter. A similar pattern of DSi was observed in the WS. In addition, the minimum and maximum values of DSi occurred in the late spring and autumn in both streams, respectively. Overall, the annual average DSi concentrations in the NS (191.2 ± 37.3 μmol Si L−1, n = 22) were lower than those in the WS (276.0 ± 61.3 μmol Si L−1, n = 17).
In the NS, the concentrations of DIN varied slightly between 240.4–276.7 μmol N L−1 in the early–middle spring, sharply decreased to a minimum value of 140.2 μmol N L−1 in the late spring and then continuously increased from summer to the following spring, with a maximum value of 381.2 μmol N L−1 (Figure 3d). The temporal variability of DIN concentrations in the WS was different from that in the NS (Figure 3h). DIN concentrations in the WS varied widely between 422.9–608.4 μmol N L−1 in the early–middle spring, then decreased until the early autumn and finally, increased to 462.4 μmol N L−1 in winter (Figure 3h). The annual mean concentration of DIN in the NS (204.8 ± 66.1 μmol N L−1, n = 22) was lower than that in the WS (416.2 ± 113.7 μmol N L−1, n = 17).
In summary, concentrations of TSM and nutrients in the two tributaries differed temporally. During the whole investigated period, the annual average values of daily discharge and TSM in the NS were higher than those in the WS, while the mean values of all nutrient concentrations were lower in the former compared to the latter.
3.3. Temporal Variations of TSM and Nutrients during the Rain Event
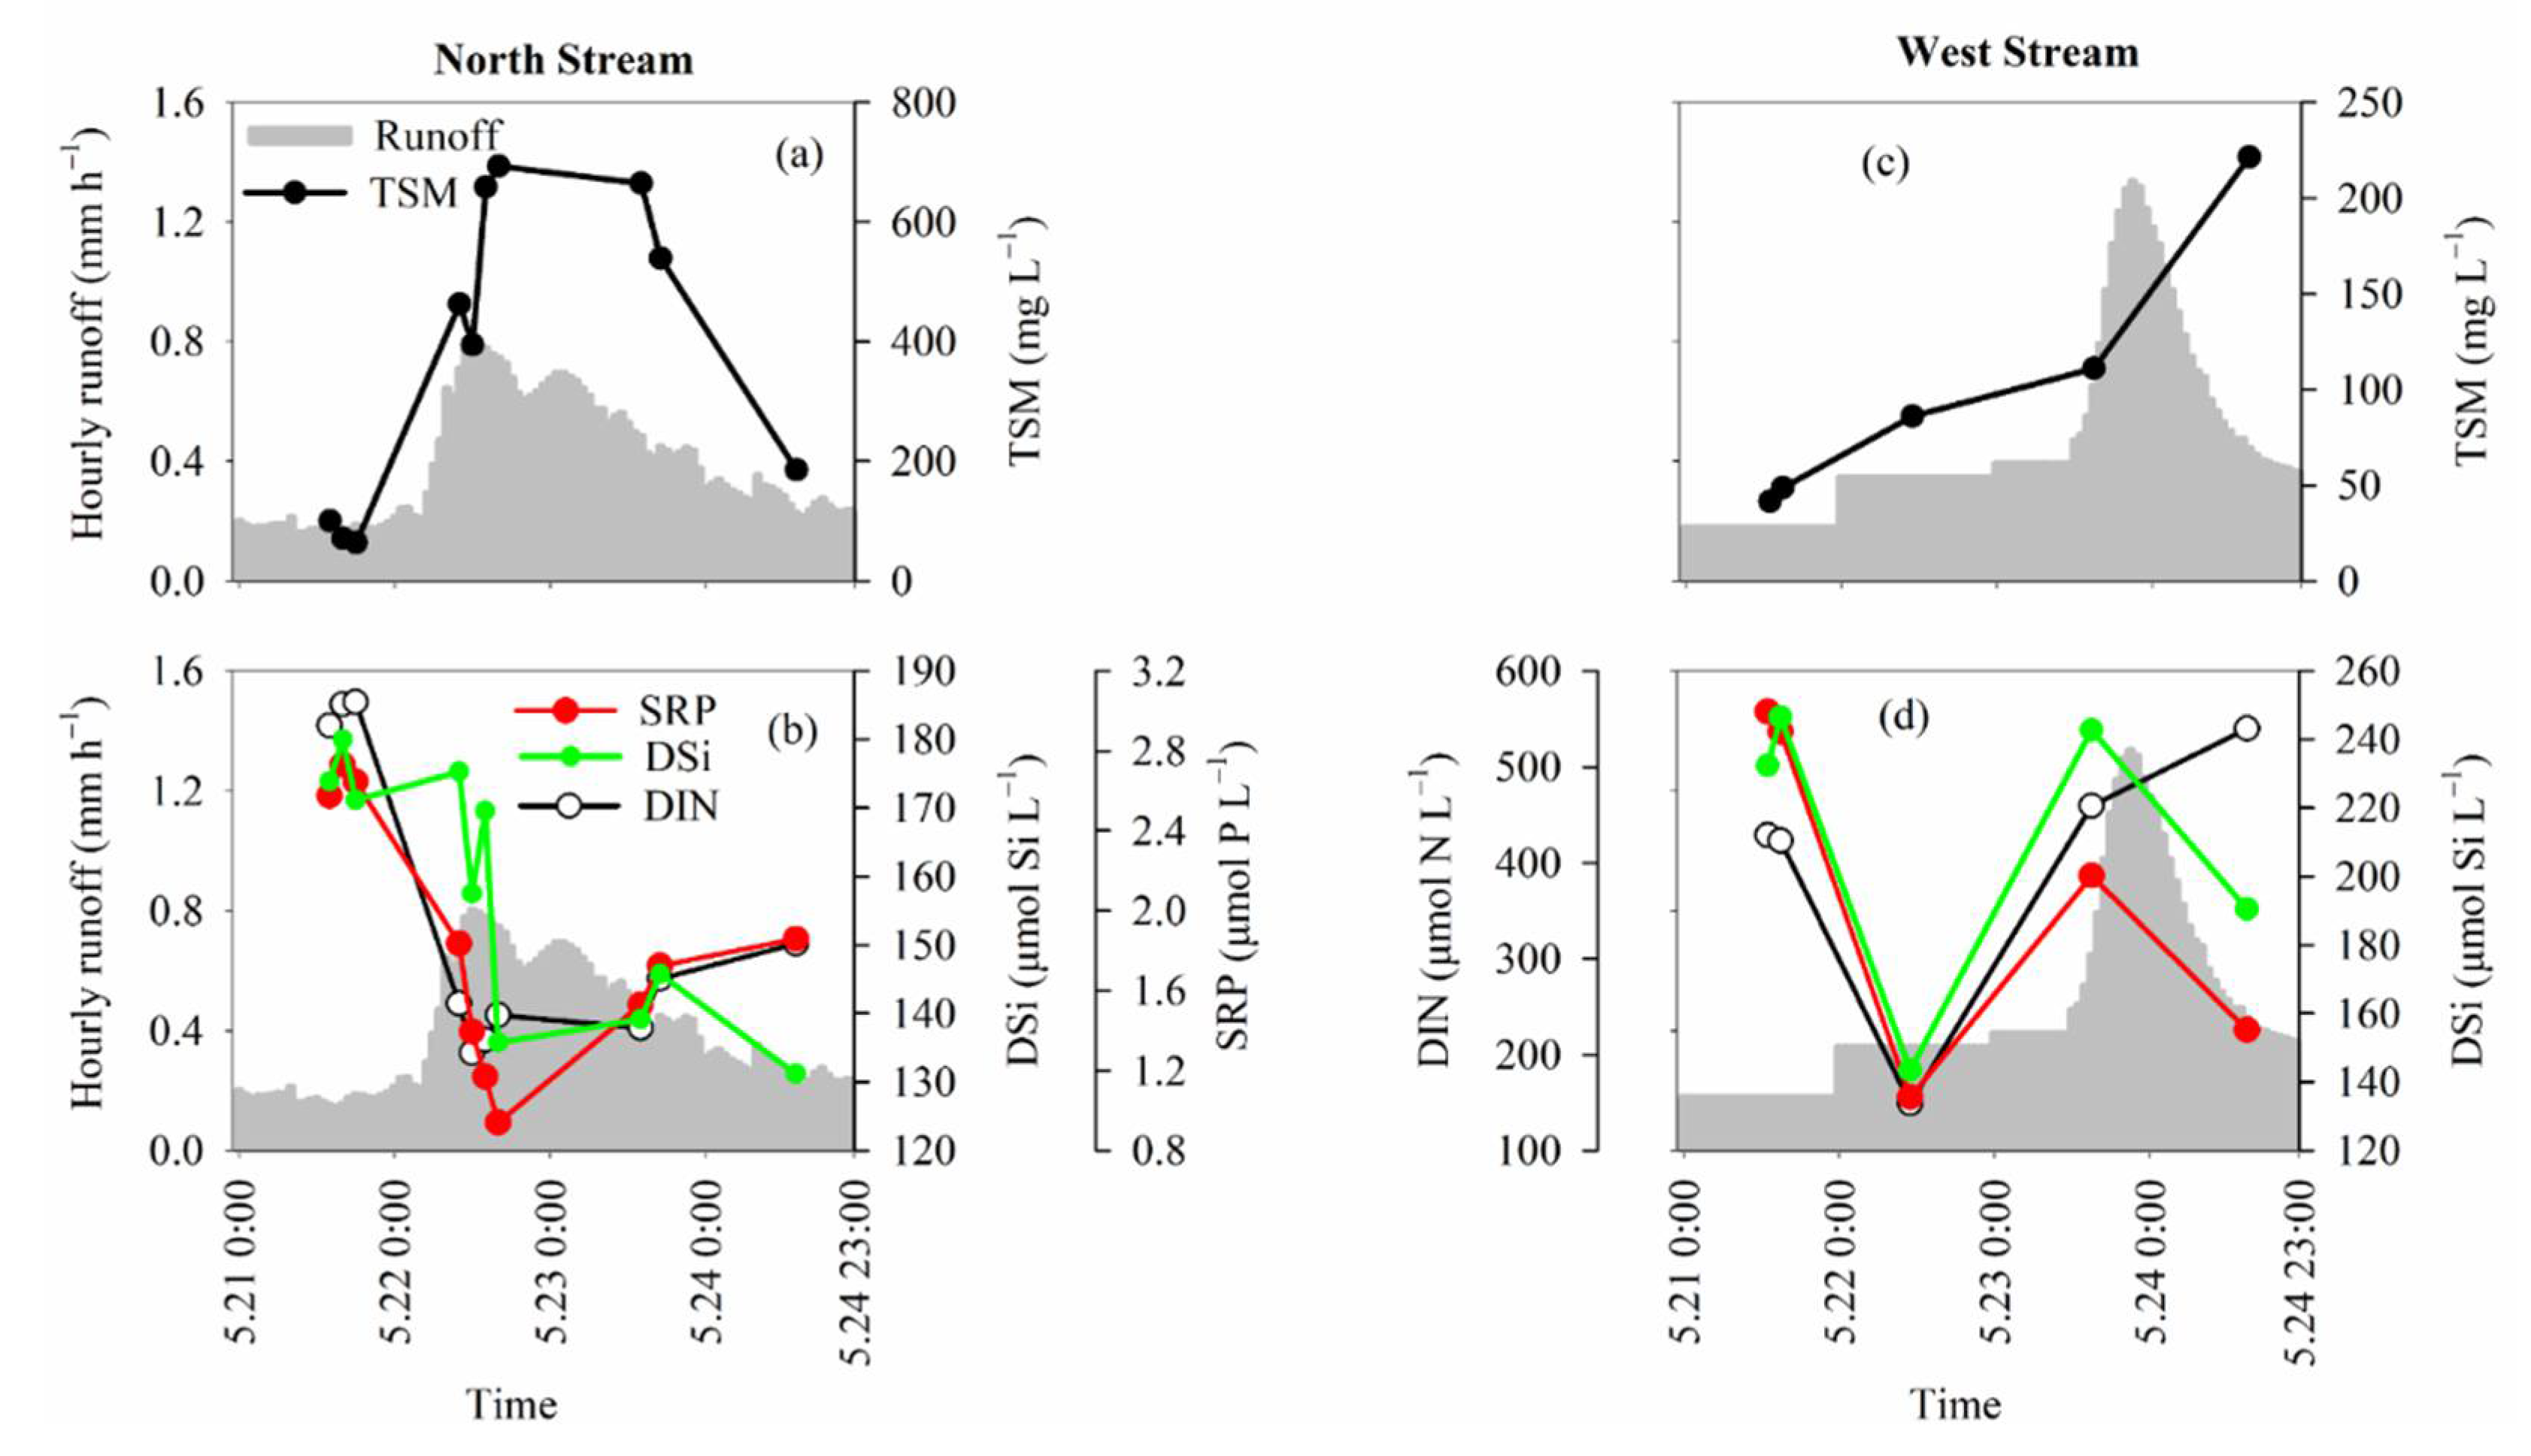
To better understand the responses of nutrients to rainfall, the variations in TSM and nutrients during the rain event were plotted separately (Figure 4). The TSM concentrations in the NS showed a slight decrease from 100 mg L−1 at the start of the rain event to 63.7 mg L−1 within the first 6 h and then increased significantly to 462.5 mg L−1 as the discharge rose rapidly. TSM continued to increase until 2 h after peak discharge to a maximum of 693.2 mg L−1, then finally decreased to 185.3 mg L−1 at the end of the rain event (Figure 4a). In contrast, The TSM concentrations in the WS continuously increased from 41.5 mg L−1 to 211.4 mg L−1, which was different from the pattern in the NS (Figure 4c). Additionally, a hysteresis was observed between the peak TSM concentration and the peak discharge in both streams. Overall, the range of TSM concentrations in the NS (63.7–693.2 mg L−1) was larger than that in the WS (41.5–221.4 mg L−1) and the mean concentration (383.1 ± 245.1 mg L−1, n = 10) in the former was higher compared to the latter (568.6 ± 120.0 mg L−1, n = 6).
The patterns of nutrient concentrations in the NS were different from those in the WS (Figure 4b,d). Nutrient concentrations in the NS increased slightly within the first 2 h of the rain event. As the hourly runoff increased, the DIN concentrations decreased sharply from 176.4 μmol N L−1 to 140.2 μmol N L−1 within 18 h, then gradually increased to 151.6 μmol N L−1 at the end of the falling hydrograph. The pattern of SRP was similar to that of DIN. Notably, the minimum SRP concentration was reached ~4 h later than the DIN minimum. The DSi concentrations were more variable compared to those of SRP and DIN; specifically, the DSi concentrations varied between 171.2 μmol Si L−1 and 180.0 μmol Si L−1 within the first 21 h, then fluctuated with an overall decrease to 135.8 μmol Si L−1 during peak discharge, increased gradually to 145.8 μmol Si L−1 and then decreased again at the end of the rain event.
Compared to the nutrient concentration patterns in the NS, similar patterns were observed in the WS (Figure 4d). The ranges of SRP (7.6 μmol P L−1 to 1.8 μmol P L−1) and DIN (428.7 μmol N L−1 to 149.0 μmol N L−1) significantly decreased within the first 22 h, then increased to 5.0 μmol P L−1 for SRP and 459.3 μmol N L−1 for DIN at the peak runoff. Finally, the SRP concentrations decreased to 2.8 μmol P L−1 but DIN continuously increased to 539.8 μmol N L−1 at the end of the rain event. However, the DSi concentrations in the WS increased in the first 2 h, then showed a similar pattern to those of SRP during both the rising and falling limbs of the hydrograph.
Overall, the average nutrient concentrations in the NS (SRP, 1.8 ± 0.6 μmol P L−1; DSi, 157.9 ± 17.5 μmol Si L−1; DIN, 154.1 ± 14.6 μmol N L−1; n = 10) were lower than those in the WS (SRP, 4.8 ± 2.3 μmol P L−1; DSi, 211.1 ± 39.2 μmol Si L−1; DIN, 400 ± 132.2 μmol N L−1; n = 5) during the rain event (Figure 5b,c) (ANNOVA, p < 0.05).
4. Discussion
4.1. Seasonal Variations in Nutrients during the Non-Rainfall Period
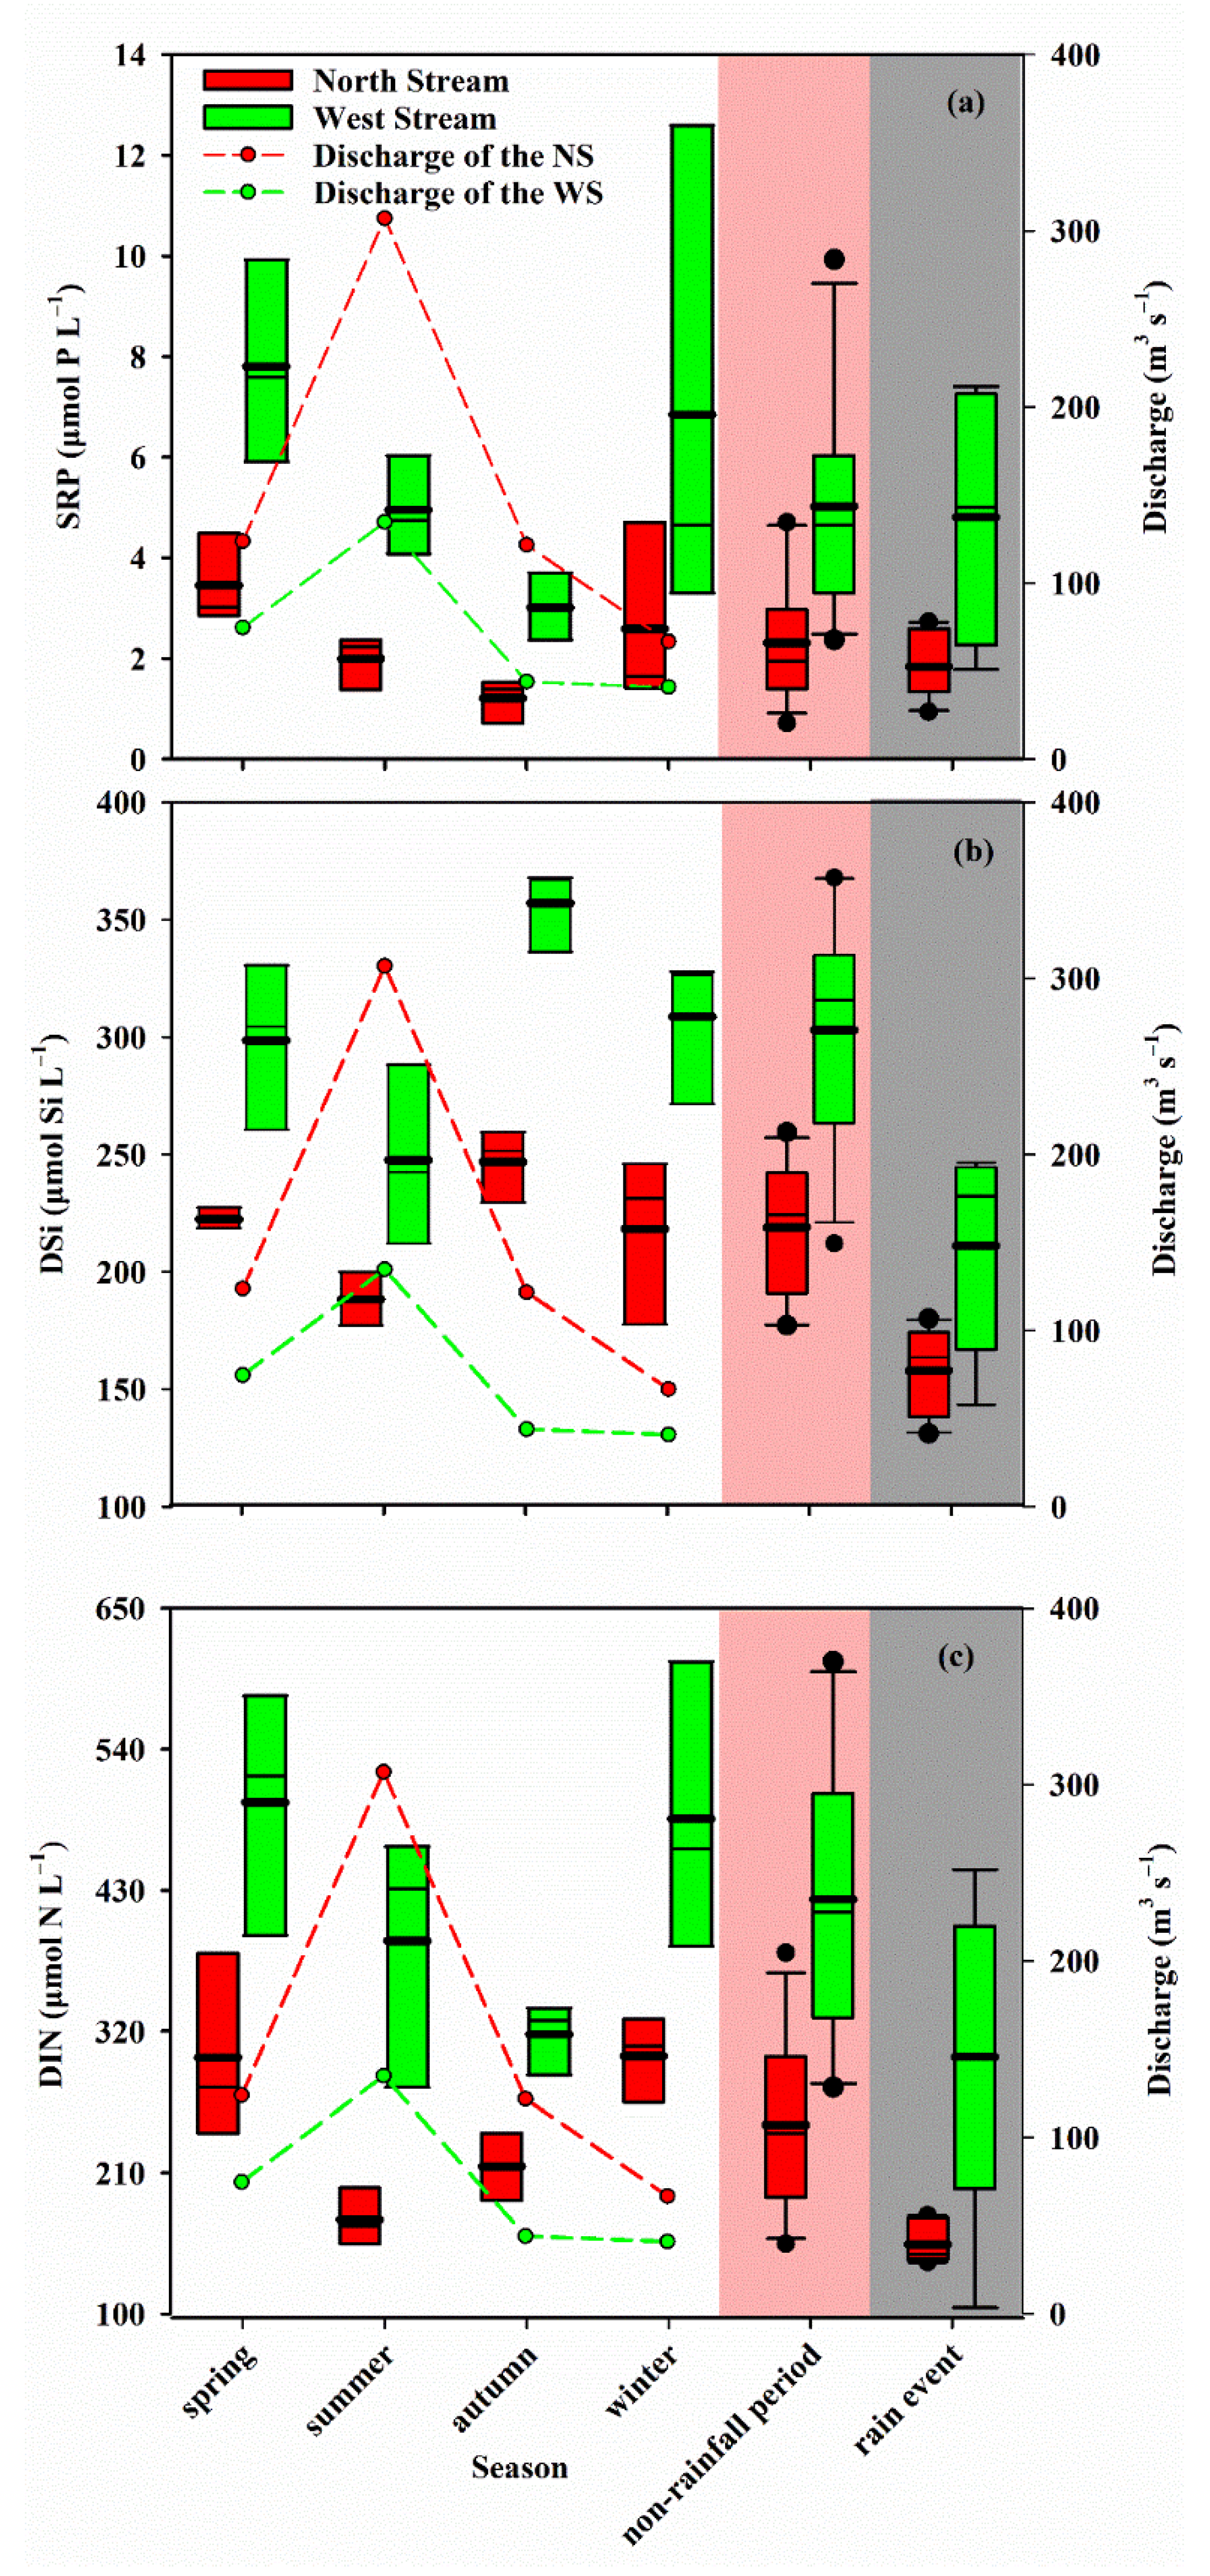
There were obvious seasonal variations in discharge in the two JLR streams during the non-rainfall period (Figure 5a), with the maximum average value in summer and the minimum in winter. Overall, the average discharge of all four seasons in the NS was about twice those in the WS. The concentrations of SRP, DSi and DIN also showed the clear seasonal variability of both streams (Figure 5), but they were different from the river discharge.
SRP in the NS had a seasonal pattern that was similar to that in the WS (Figure 5a); however, the average SRP concentrations for all seasons in the NS were lower than those in the WS. The highest average SRP concentrations were observed in spring (3.4 ± 1.6 μmol P L−1 in the NS, n = 3, and 7.8 ± 1.6 μmol P L−1 in the WS, n = 3), followed by winter, with mean values of 2.6 ± 1.5 μmol P L−1 (n = 3) in the NS and 6.8 ± 1.5 μmol P L−1 (n = 3) in the WS. The lowest average SRP concentrations occurred in autumn (1.2 ± 0.1 μmol P L−1 in the NS, n = 3, and 3.0 ± 0.5 μmol P L−1 in the WS, n = 3), with slightly higher values (2.0 ± 0.4 μmol P L−1 in the NS, n = 3, and 5.0 ± 0.8 μmol P L−1 in the WS, n = 3) in summer. Based on the relationship between river discharge and SRP concentrations (Table 2), we found that river discharge was not responsible for the decreased variability. Another influencing factor of the inorganic adsorption processes during the dry season was related to the removal of SRP from the JLR [35], resulting in the lower concentrations in autumn and winter. Alternatively, seasonal changes in phytoplankton biomass could have partly contributed to the seasonal variability of SRP due to phytoplankton assimilation. Higher phytoplankton biomass was observed in summer and autumn compared to winter and spring [44,45]. Additionally, the excess fertilizer from agricultural land also increased SRP concentrations [35], which was consistent with the higher average value of SRP in the two tributaries during spring and the lower overall SRP concentrations in the NS than in the WS since the application of P fertilizers in the upper reaches of the WS (34,854 kg) exceeded that in the NS during 2014 (derived from the Yearbook of Zhangzhou and Longyan). The seasonal changes in SRP in the JLR were different from other large rivers, which are mainly controlled by the dissolution of parent rocks via discharge and biological uptake. For example, the lowest and highest average values of SRP in the Yangtze River were observed in spring and autumn, respectively [22,23,46]. They are highly consistent with the variability of river discharge and phytoplankton uptake. In summary, the seasonal variability of SRP in the JLR was mainly driven by the application of P fertilizers, followed by phytoplankton uptake and inorganic adsorption processes.
The seasonal variability of DSi concentrations in the NS was similar to that in the WS, with autumn > winter > spring > summer (Figure 5b). The maximum mean concentrations of DSi appeared in autumn (214.8 ± 21.3 μmol Si L−1 in the NS and 317.5 ± 22.6 μmol Si L−1 in the WS, n = 3) while the minimum average value was observed in summer (188.3 ± 9.3 μmol Si L−1 in the NS, n = 3, and 247.6 ± 31.3 μmol Si L−1 in the WS, n = 3). Based on the statistical analysis (Table 2), over 50% of the seasonal variability of DSi concentration was caused by the changes in river discharge. This was consistent with opposing seasonal trends (excluding autumn) between DSi concentrations and river discharge (Figure 5b), indicating a dilution effect of river discharge on nutrient concentrations. The riverine DSi was also influenced by land use/coverage changes, which could account for over 40% of DSi fluxes in other regions, e.g., many rivers located in southern New England, USA [47]. The DSi concentrations in the JLR were positively correlated with the percentage of croplands but negatively correlated with the percentage of forest because the former can accelerate silicate erosion from soils while the latter retains DSi in soils [38]. Thus, the high coverage areas of paddy fields (middle-season rice and late rice) in autumn likely led to the higher DSi concentrations. Note that the high DSi uptake by phytoplankton in autumn was offset by the supplementation of DSi from soil erosion [44,45]. Overall, the variability of DSi concentrations in both streams was largely influenced by dilution from river discharge and land use/coverage changes.
The seasonal variability of DIN concentrations was different from those of SRP and DSi (Figure 5c). The seasonal changes in DIN concentrations in the NS (winter > spring > autumn > summer) also differed from those in the WS (spring > winter > summer > autumn). In the NS, the lowest average value of DIN appeared in summer (173.5 ± 18.2 μmol N L−1, n = 3), while the highest average value was observed in winter (300.8 ± 26.8 μmol N L−1, n = 3). In the WS, the lowest mean (317.5 ± 22.6 μmol N L−1, n = 3) and highest mean values (498.5 ± 77.7 μmol N L−1, n = 3) appeared in autumn and spring, respectively. The high correlation coefficients between DIN concentrations and river discharge in the NS (Table 2) suggest the important role of river discharge in the seasonal variations of DIN concentration, which was consistent with observations from the Padež stream [48]. However, we did not find a significant correlation between DIN and river discharge in the WS (Table 2) and similar relationships were found between NH4-N and NO3-N [36]. Alternatively, N fertilizer loss from agriculture could contribute to the differences in the seasonal patterns of DIN concentrations [49] because ~54% (in the NS) and ~78% (in the WS) of riverine N are tied to N fertilizers [20,30]. The variability of DIN concentrations in the two streams were potentially caused by the biological uptake of DIN, which was consistent with the finding that high phytoplankton biomass corresponds to low DIN concentration in summer and autumn [44,45]. Thus, the lowest DIN concentrations were observed in autumn in the WS due to the minimal usage of N fertilizers [20] and the active biological uptake. These seasonal variations of DIN were inversely correlated with the Yangtze River, where the highest concentrations of DIN appeared in summer due to the dissolution of pedogenic calcite and the loss of chemical fertilizer from soils [23]. Overall, the seasonal variability of DIN in the NS was mainly driven by river discharge, while in the WS, the DIN was co-influenced by N fertilizer application and biological uptake.
The annual mean concentrations of nutrients during the non-rainfall period in the NS were only half of those in the WS (SRP = 2.3 ± 1.2 μmol P L−1 vs. 5.7 ± 2.9 μmol P L−1, DSi = 218.9 ± 26.7 μmol Si L−1 vs. 303.9 ± 46.8 μmol Si L−1, DIN = 247.1 ± 65.5 μmol N L−1 vs. 423.0 ± 104.4 μmol N L−1 in the NS vs. WS, respectively). In the whole JLR (the sum of two tributaries), the average annual nutrient concentrations (SRP = 4.0 ± 2.8 μmol P L−1, DSi = 261.0 ± 56.8 μmol Si L−1 and DIN = 335.1 ± 123.8 μmol N L−1) were in agreement with previous results obtained in 2016–2018 [35,37,50]. However, they were higher than those in the Yellow River [25], the Yangtze River [23] and the Pearl River [51,52], indicating that the JLR is eutrophic and highly influenced by human activities. The average annual concentration of DSi in the JLR was 1–3 times higher than those in the large Chinese rivers and global subtropical rivers [1], such as the Mississippi River, the Zaire River and the Amazon River [26]. This was driven by the region’s high granite lithology coupled with the subtropical monsoon, leading to high weathering rates and high SiO2 in the JLR [38]. The average SRP concentration during the rain event was comparable to measurements from the non-rainfall period, but the mean values of DSi and DIN were lower in the former than the latter, suggesting that DSi and DIN are more sensitive to dilution by river discharge during high flow conditions than SRP [38].
4.2. The Impacts of the Rain Event on Nutrient Dynamics: Concentrations and Fluxes
The effects of rain events on the nutrient dynamics in rivers are usually variable over the course of development of the rain event [7,11,12,15]. In this section, we focus on the responses of nutrients to the rain event and the differences between the two streams during the rising and falling limbs of the hydrograph.
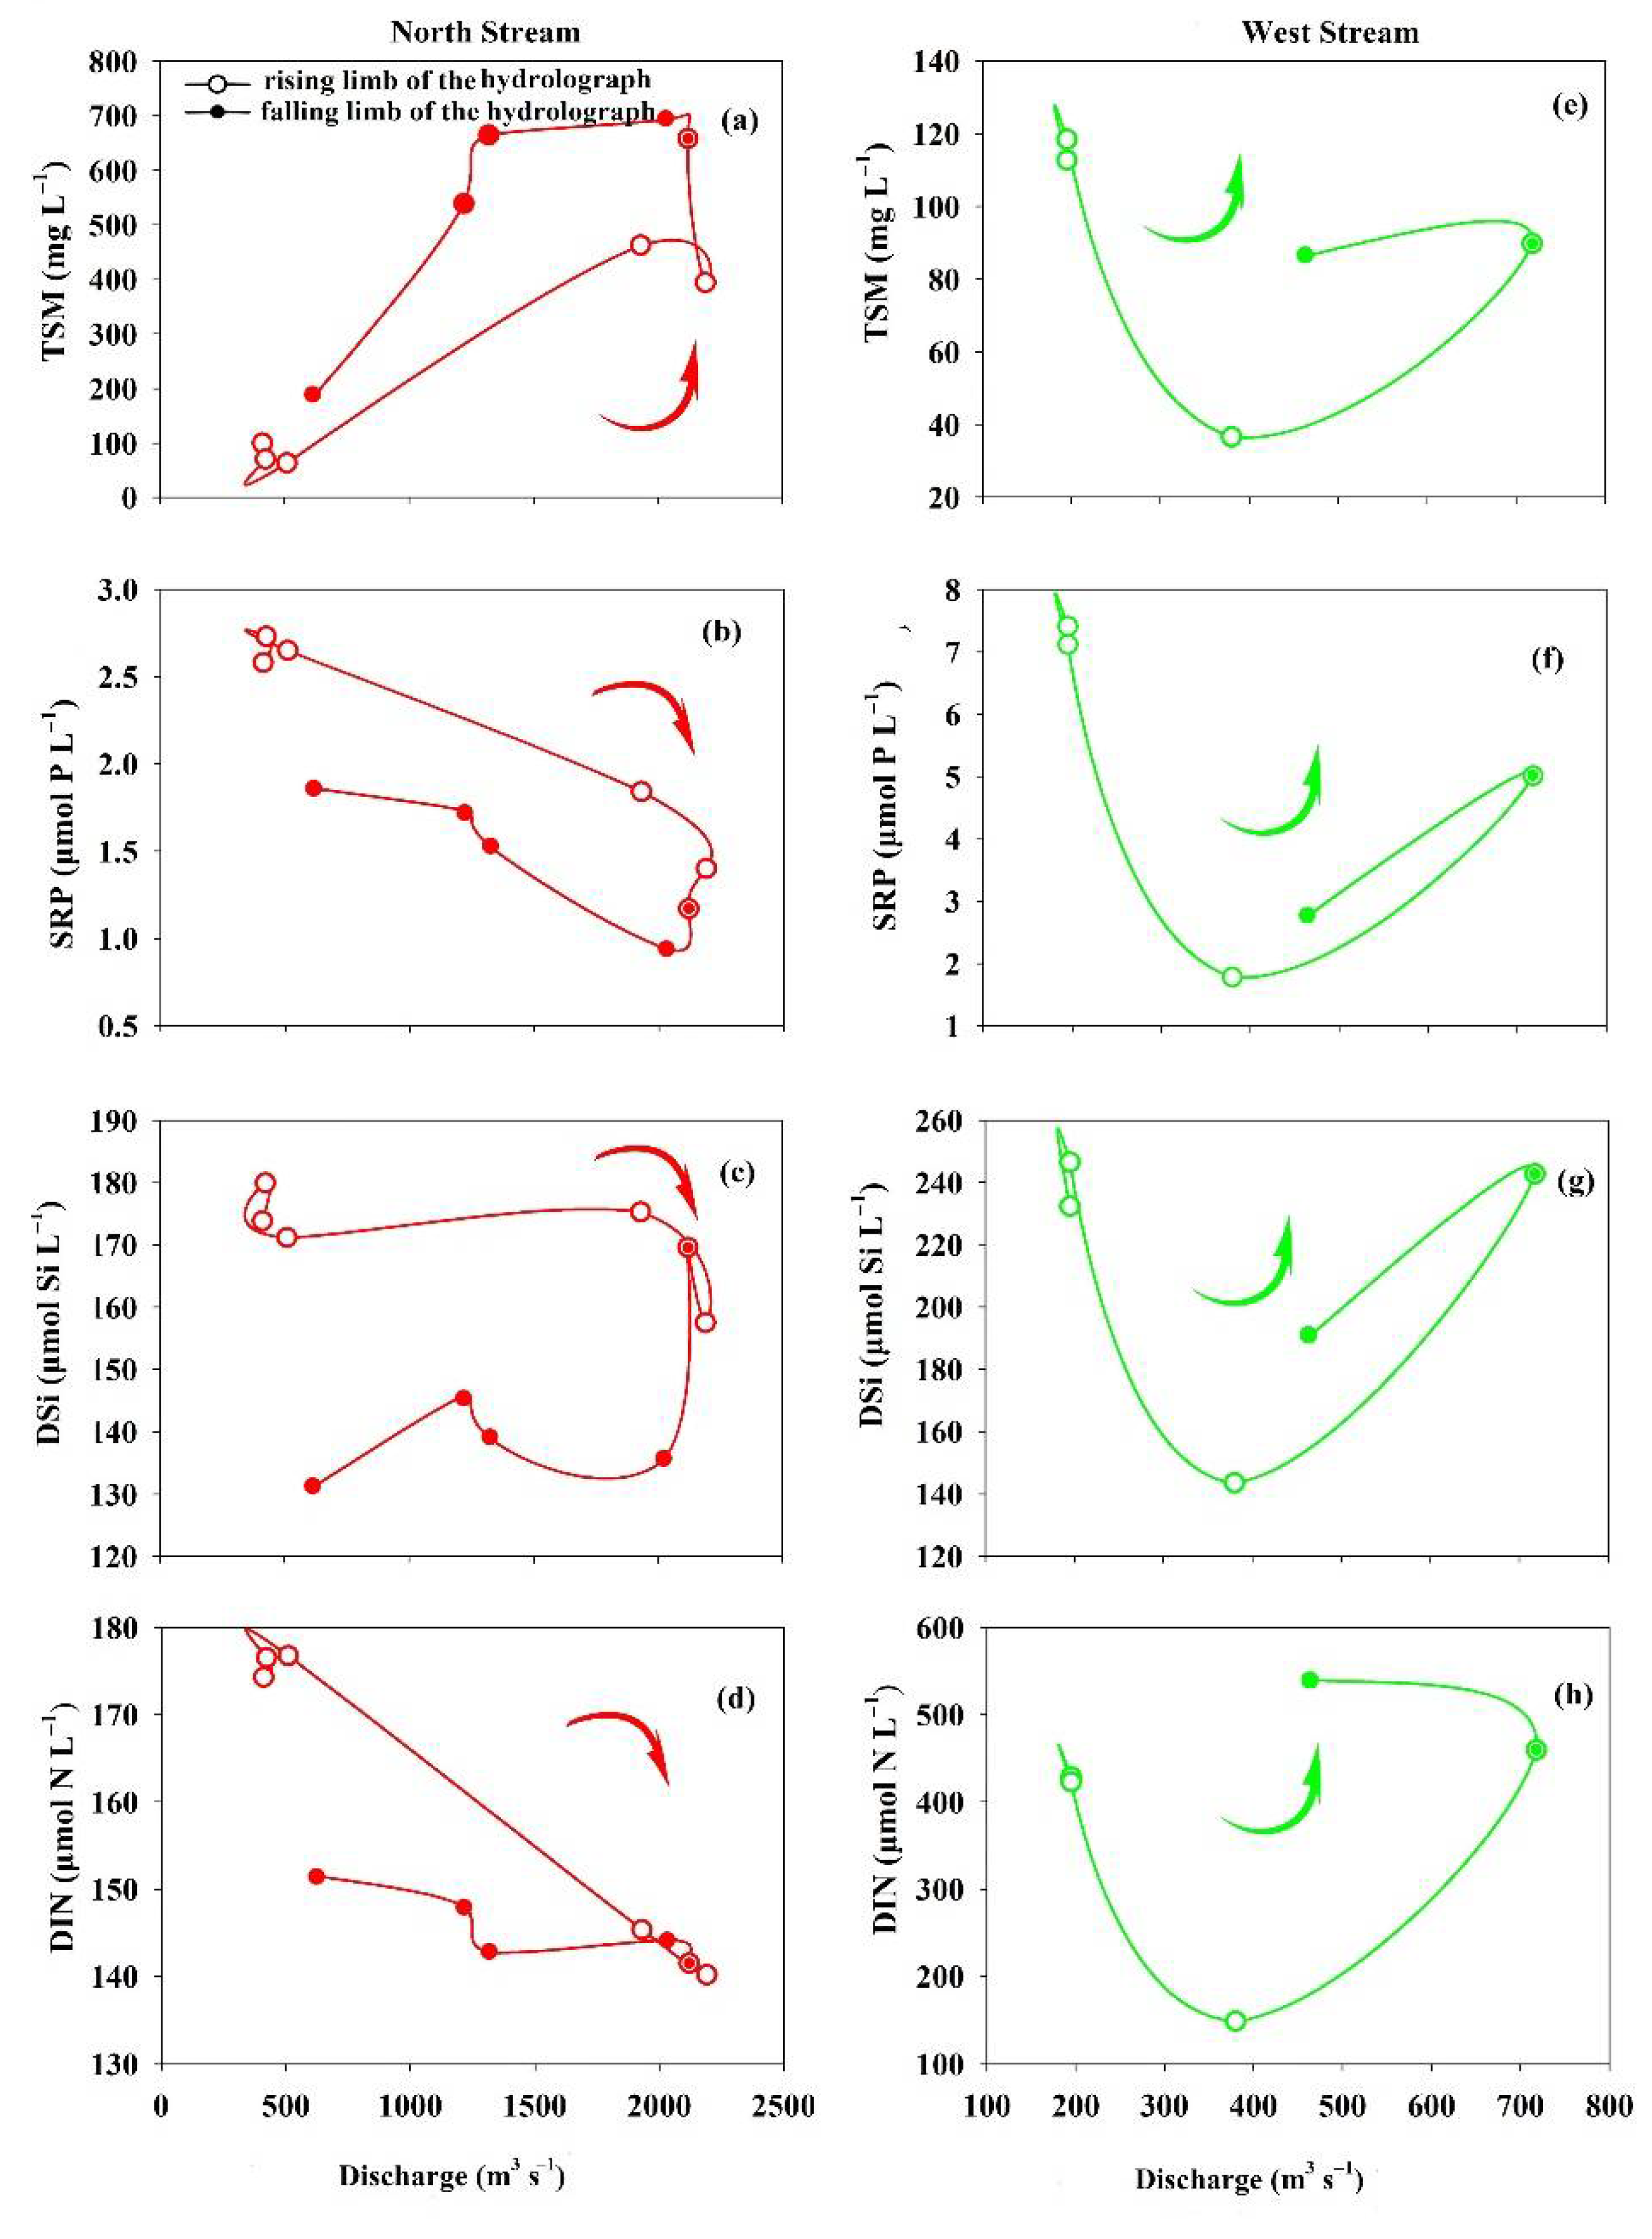
The changing trajectory of TSM and nutrients along with river discharge during the course of development of the rain event (Figure 6) showed an obvious hysteresis effect, as identified by the large differences in TSM and nutrient concentrations between the rising and falling limbs of the hydrograph at a given discharge [18,53]. This suggests that the dynamics of TSM and nutrients were different in the rising versus the falling limbs of the hydrograph. Similar patterns were observed in the Swale River [54,55].
In the NS, the TSM concentrations displayed an anticlockwise trajectory along with river discharge (Figure 6a), i.e., the TSM concentrations increased during the rising limb of the hydrograph due to soil erosion and significantly decreased during the falling limb of the hydrograph due to the dilution by river discharge. This suggests that the factor influencing TSM varied as the rain event developed, which was similar to previous observations [56,57]. In contrast, the concentrations of SRP, DSi and DIN exhibited a clockwise trajectory (Figure 6b–d). For example, DIN and SRP continuously decreased during the rising limb of the hydrograph but slightly increased during the falling limb of the hydrograph, indicating a strong dilution effect by river discharge before peak discharge. Although surface flow can also partially flush DIN and SRP from surface soils when API is high, the strong dilution effect due to increased river discharge exceeded the supplemental effect of the DIN and SRP added by surface flow. However, the dilution effect on SRP and DIN concentrations was weaker than the supplementation from subsurface soils through interflow during the falling limb of the hydrograph (Figure 6b–d). This was dependent on the characteristics of the rainfall [18,19]. The short but intense rainfall before peak discharge in the NS flushed more nutrients from subsurface soils into the stream by interflow during the falling limb of the hydrograph. It was reported that large amounts of SRP were released from soils into the streams due to the influence of an intense storm [18]. However, the concentrations of DSi remained steady during the rising limb of the hydrograph, suggesting that the dilution from river discharge was offset by other sources of DSi, such as the dissolution of Si-rich granite from the lower reaches of the stream [38]. A similar phenomenon was observed in the Yangtze River, which showed that the erodibility of parent rocks in the river basin could provide partial DSi supplementation during precipitation events [23]. The DSi concentrations decreased continually during the falling limb of the hydrograph due to the dilution effect. The supplementation of DSi from the upper reaches through interflow was likely limited since the upper reaches are rich in sedimentary rocks that are characterized by low Si.
In the WS, the TSM concentrations showed an anticlockwise trajectory, which was different from the NS pattern. The TSM concentrations rapidly decreased during the first half of the rising limb of the hydrograph but increased during the second half of the rising limb of the hydrograph and finally, declined through the end of rain event (Figure 6e). This suggests that the dilution effect by river discharge dominated during the first half of the rising limb of the hydrograph, while the supplementation from soil erosion largely contributed to the increase in TSM during the second half of the rising limb of the hydrograph. However, the supplementation from erosion was weaker than the dilution by river discharge during the falling limb of the hydrograph. Similarly, there was an anticlockwise trajectory for all nutrients (Figure 6f–h). The nutrient concentrations decreased during the first half of the rising limb of the hydrograph and then sharply increased during the second half of the rising limb of the hydrograph. The SRP and DSi concentrations rapidly decreased again but the DIN concentrations continuously increased during the falling limb of the hydrograph, implying that the nutrient dynamics were largely driven by the dilution effect during the first half of the rising and falling limbs of the hydrograph, except for DIN. However, there was another source to replenish nutrients and this increased their concentrations during the second half of the rising limb of the hydrograph. This was potentially due to supplementation from surface soils via surface runoff due to its higher soil moisture content (API = 81.3), similar to our results in the NS and a previous study [18]. However, the resuspension and remineralization of the particulate organic N (PON) that accumulated along the dams during the rising limb of the hydrograph could have added DIN and overcome the dilution effect during the falling limb of the hydrograph. This was consistent with our observation of the highest TSM concentration after peak discharge (Figure 4c) and was also similar to previous observations from the same region [37]. Therefore, the resuspension and remineralization of PON is likely a major source of DIN during flood seasons in rivers that are highly influenced by dam construction.
Overall, the nutrient dynamics during the rain event depended on the dilution effect of river discharge, soil moisture, rainfall intensity, the dissolution of Si-rich granite and the resuspension/remineralization of PON. The relative contributions of the above factors to the nutrient dynamics could change as the rain event developed.
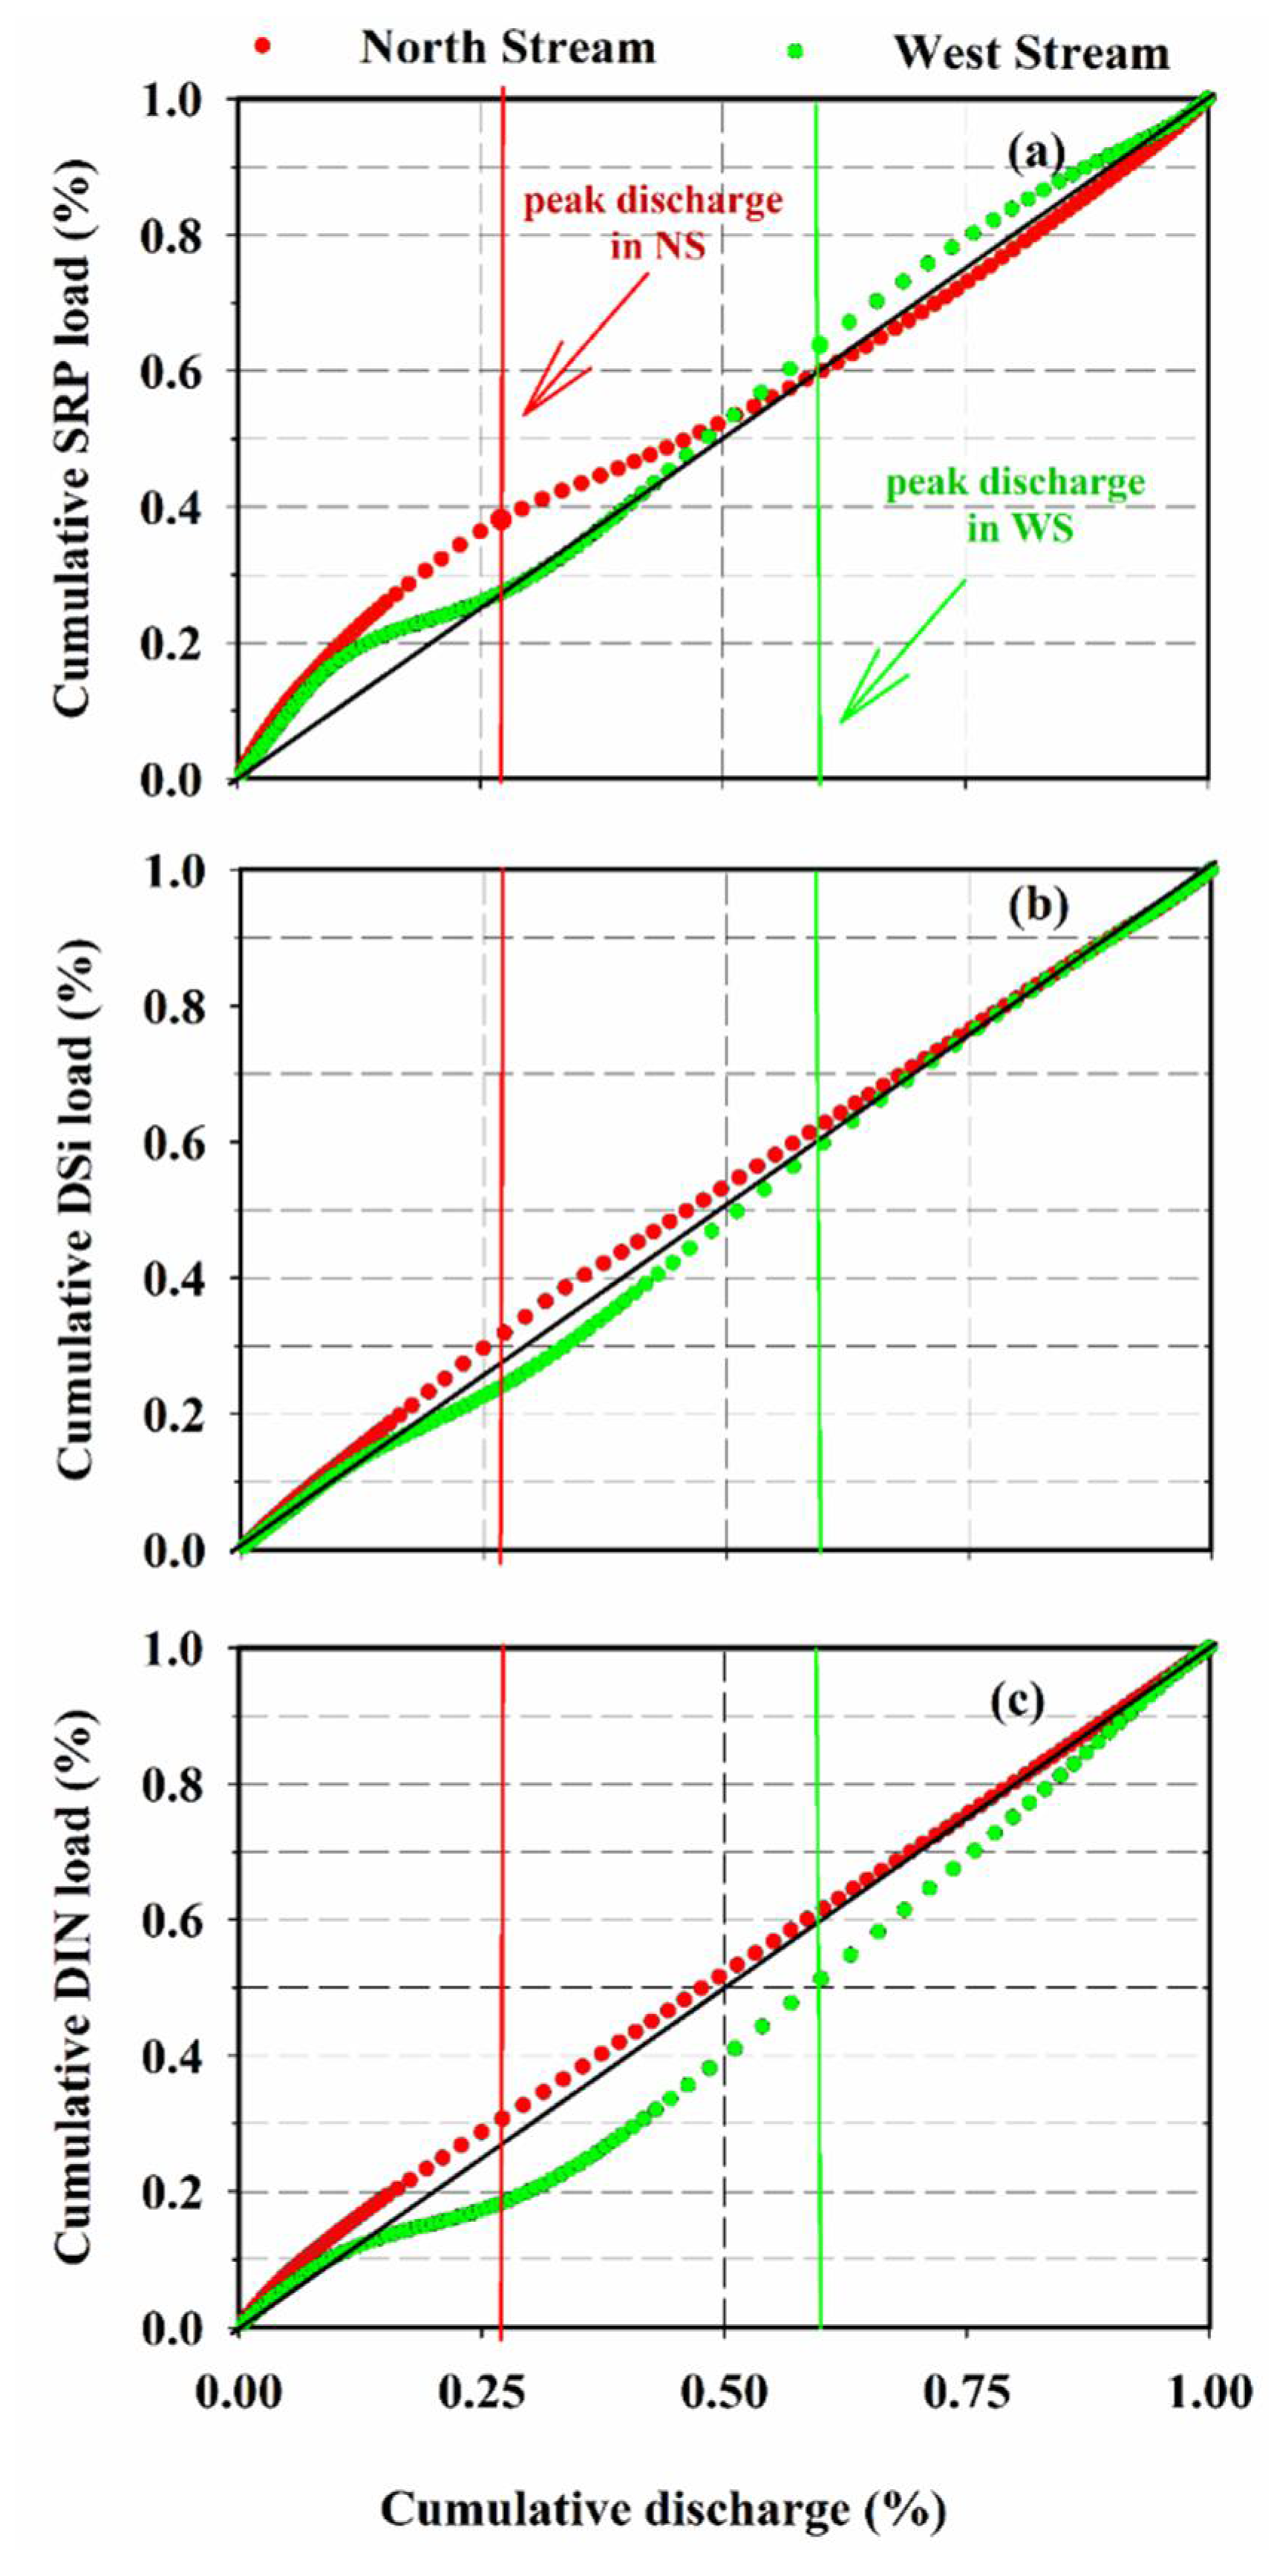
Hydrology therefore plays a vital role in the export of nutrients from rivers to estuaries, as indicated by the significant correlations between nutrient fluxes and runoff (Figures S1 and S2). The “first flush” effect is defined as the time when the majority of nutrients are exported during the first 25% discharge from the rain event [58], which can be divided into three levels: strong, >75%; moderate, 31–75%; no/weak, <30%. During our investigated rain event, the “first flush” effect of nutrients was moderate in the NS (SRP, ~40%; DSi, ~30%; DIN, ~30%) and weak in the WS (SRP, 26%; DSi, 22%; DIN, 17%) (Figure 7). This difference could be attributed to the stronger rainfall intensity during the rising limb of the hydrograph and lower API in the NS than in the WS, suggesting that the pattern of nutrient export in the two streams was largely dependent on the rainfall features [19,35]. The majority of nutrients loaded into the NS and WS (except for SRP) were exported at the beginning and the end of the rain event, respectively (Figure 7). This is supported by the observations that the cumulative nutrient loads in the NS all fell above the 1:1 line, but the cumulative DSi and DIN loads in the WS fell below the 1:1 line (Figure 7). These findings imply that similar nutrients had different responses to the rain events in the two streams, confirming the importance of the rainfall features and soil conditions on nutrient dynamics [19,35,59]. Even within the same stream and during the same rain event, different nutrients could also have different responses. For example, in the WS, the majority of SRP loads were exported toward the start of the rain event, contrary to those of DSi and DIN, because the excess application of P fertilizer in croplands can deliver partial SRP into the stream through interflow [18,35]. Overall, the response of nutrients to the rain event were highly associated with human interference and natural conditions, especially the rainfall characteristics and soil conditions.
The nutrient fluxes were estimated to be 32.3 × 10⁴ kg P yr−1, 31.8 × 10⁶ kg Si yr−1 and 14.6 × 10⁶ kg N yr−1 in the NS and 41.2 × 10⁴ kg P yr−1, 18.9 × 10⁶ kg Si yr−1 and 18.5 × 10⁶ kg N yr−1 in the WS (Table 3). Note that the fraction of nutrients exported during the high flow (Q/Qm > 3) in the monitored rain event were 3.8–4.2% in the NS and 4.4–4.9% in the WS, relative to the annual nutrient fluxes (Table 3), although the duration of the high flow only accounted for 0.7–0.8% of the year (i.e., it lasted for 62–72 h). Meanwhile, using the above extrapolation method, we calculated the fraction of annual high flow to annual nutrient loads to be 16.3–16.6% in the NS and 17.7–18.2% in the WS (Table 3). This implies that short-lived rain events play a vital role in riverine nutrient export in subtropical rivers that are influenced by a monsoon climate [34].
4.3. Comparison of Nutrient Fluxes between the JLR and Rivers Worldwide
The whole JLR (the sum of two tributaries) produced a total of 0.7 × 10⁶ kg P yr−1 and 33.1 × 10⁶ kg N yr−1, of which ~43.6% of SRP and ~44.2% of DIN was contributed by the NS (Table 4). The contributions of the NS to the SRP and DIN fluxes were inconsistent with its proportional contribution to annual river discharge (70.1%) due to the lower DIN and SRP concentrations in the NS compared to those in the WS. This suggests that the SRP and DIN fluxes were co-influenced by their concentrations and river discharge. Changes in land use from forest to agricultural land can also increase nutrient concentrations and their fluxes via increased chemical fertilizer loss from soil erosion [32]. Our estimated SRP and DIN fluxes were of the same magnitude as previous reported results [32,36,41]. However, the contribution of DSi fluxes from the NS (~62.7%) into the JLR (50.7 × 10⁶ kg Si yr−1) was highly consistent with its proportion of river discharge. This suggests that DSi fluxes were mainly driven by river discharge when the average DSi concentrations were similar between the two streams. Our estimated DSi fluxes were consistent with previous reported results (72.7 × 10⁶ kg Si yr−1) [41]. Overall, the DIN and SRP fluxes into the JLR were dominated by river discharge and their concentrations in the tributaries, while DSi export was mainly driven by hydrology since it was more sensitive to the rain event compared to SRP and DIN.
The nutrient fluxes in the JLR were generally smaller than those in other large rivers worldwide (Table 4), except for the Yellow River as it has smaller catchment area and lower river discharge. This suggests that nutrient exports in different rivers are generally positively correlated with their catchment area and river discharge. However, the SRP fluxes in the Yellow River, the Orinoco River and the Yangtze River were excluded since they are also highly influenced by human activities, such as through SRP retention in particles and sediments in the reservoirs [60,61] and the excess application of P fertilizers [31]. Likewise, the DIN fluxes are influenced by N chemical fertilizers [62,63]. For example, although the Lena River has the same magnitude of river discharge as the Pearl River and the Mississippi River, its DIN fluxes are much lower. The flux from the Lena River is only 0.3–1.4% of the two large rivers mentioned above since the Lena River is located on the circumpolar latitude and remains pristine with fewer human activities.
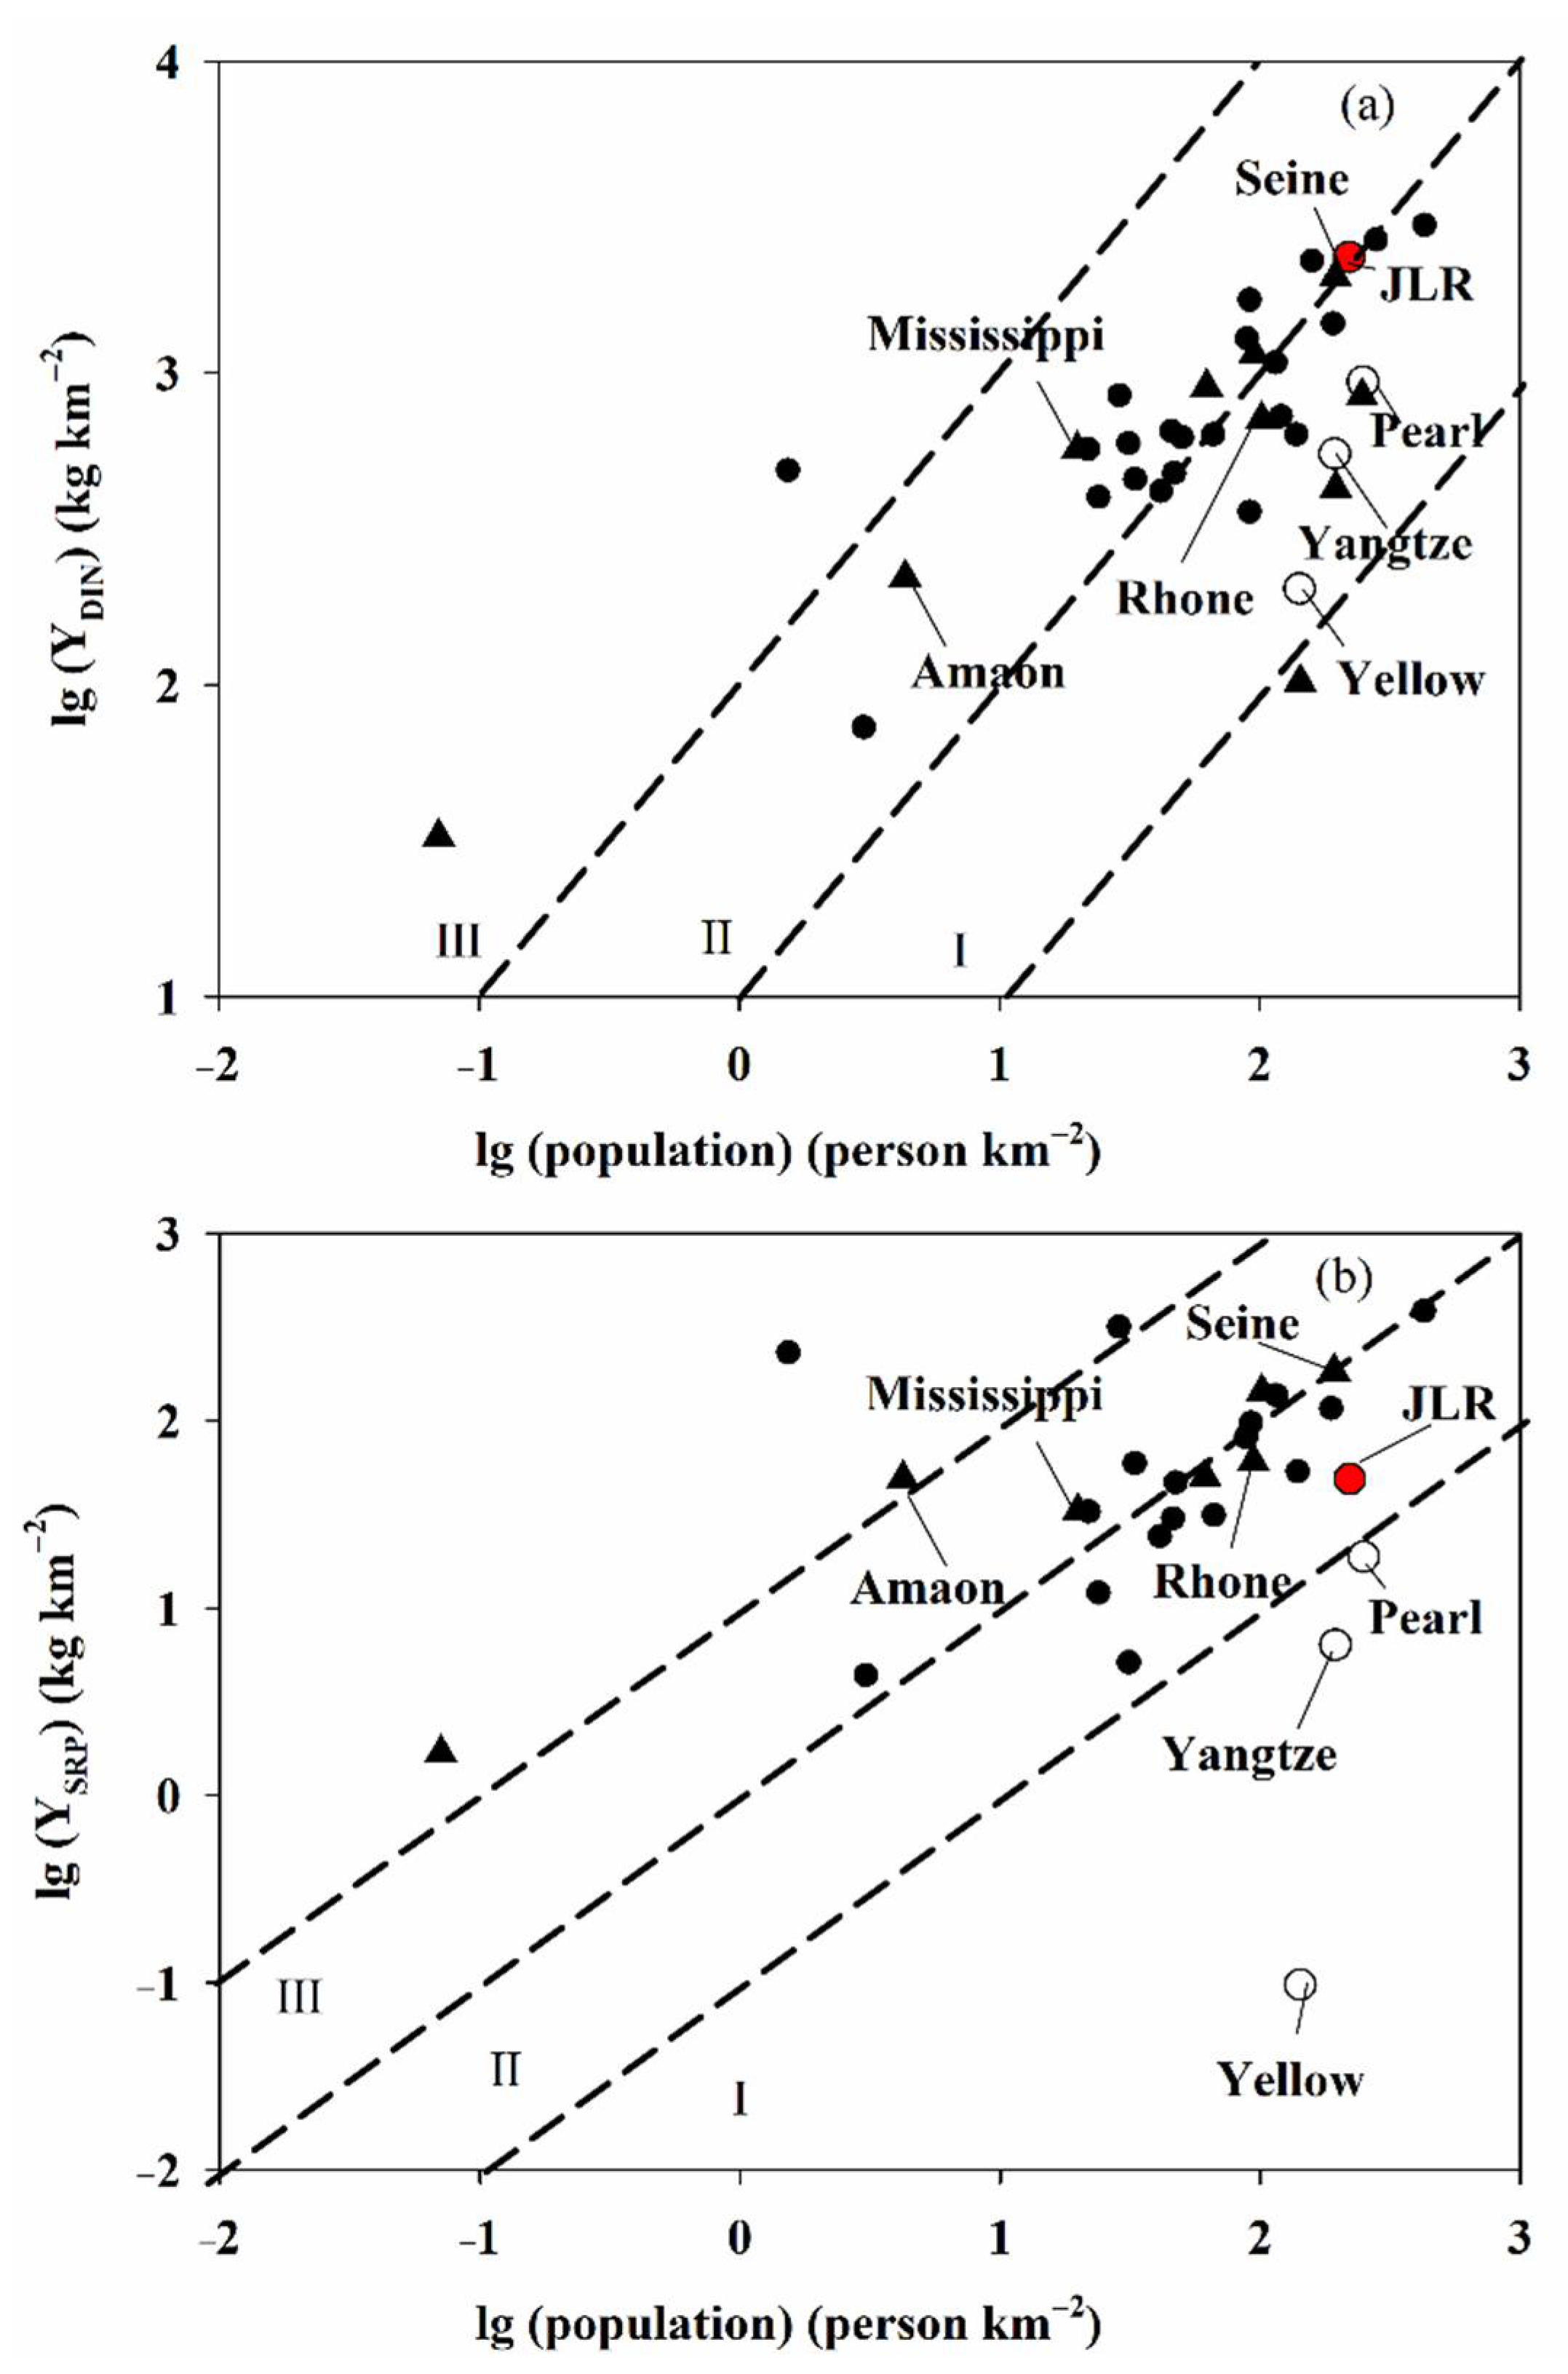
To eliminate the impacts of catchment area size, the DIN and SRP fluxes were normalized to the yield per unit area (Figure 8). The results show that the areal yields of DIN and SRP in the JLR were high compared to other major world rivers [25,68], even though its catchment area is only 0.8% of the Yangtze River, 2.3% of the Pearl River and 1.9% of the Yellow River. Similarly, the areal yields of DIN and SRP in the JLR were 4.3 and 7.7 times of the Yangtze River, both 2.5 times of the Pearl River and 11.3 and 500 times of the Yellow River, respectively.
When considering the impacts of population density, about 10 kg of DIN per person was exported into the JLR (Figure 8). This was lower than other large rivers worldwide (such as the Mississippi River and the Amazon River) but higher than the three largest rivers in China: approximately 16 times that of the Yangtze River and the Pearl River and 120 times that of the Yellow River. Although SRP was exported at a lower level (0.1 kg P person−1) compared to the Mississippi River, Amazon River and Seine River, it was still a higher level than found in the three largest rivers in China. This suggests that the JLR is a eutrophic river that is highly influenced by human activities. Such high nutrient fluxes can be transported into the adjacent estuary and coastal areas and thus, may lead to a series of environmental problems, including eutrophication and harmful algal blooms [69,70], especially under the influence of the summer monsoon season. Our results will hopefully be helpful for understanding the nutrient dynamics in the subtropical rivers within the context of climate change.
5. Conclusions
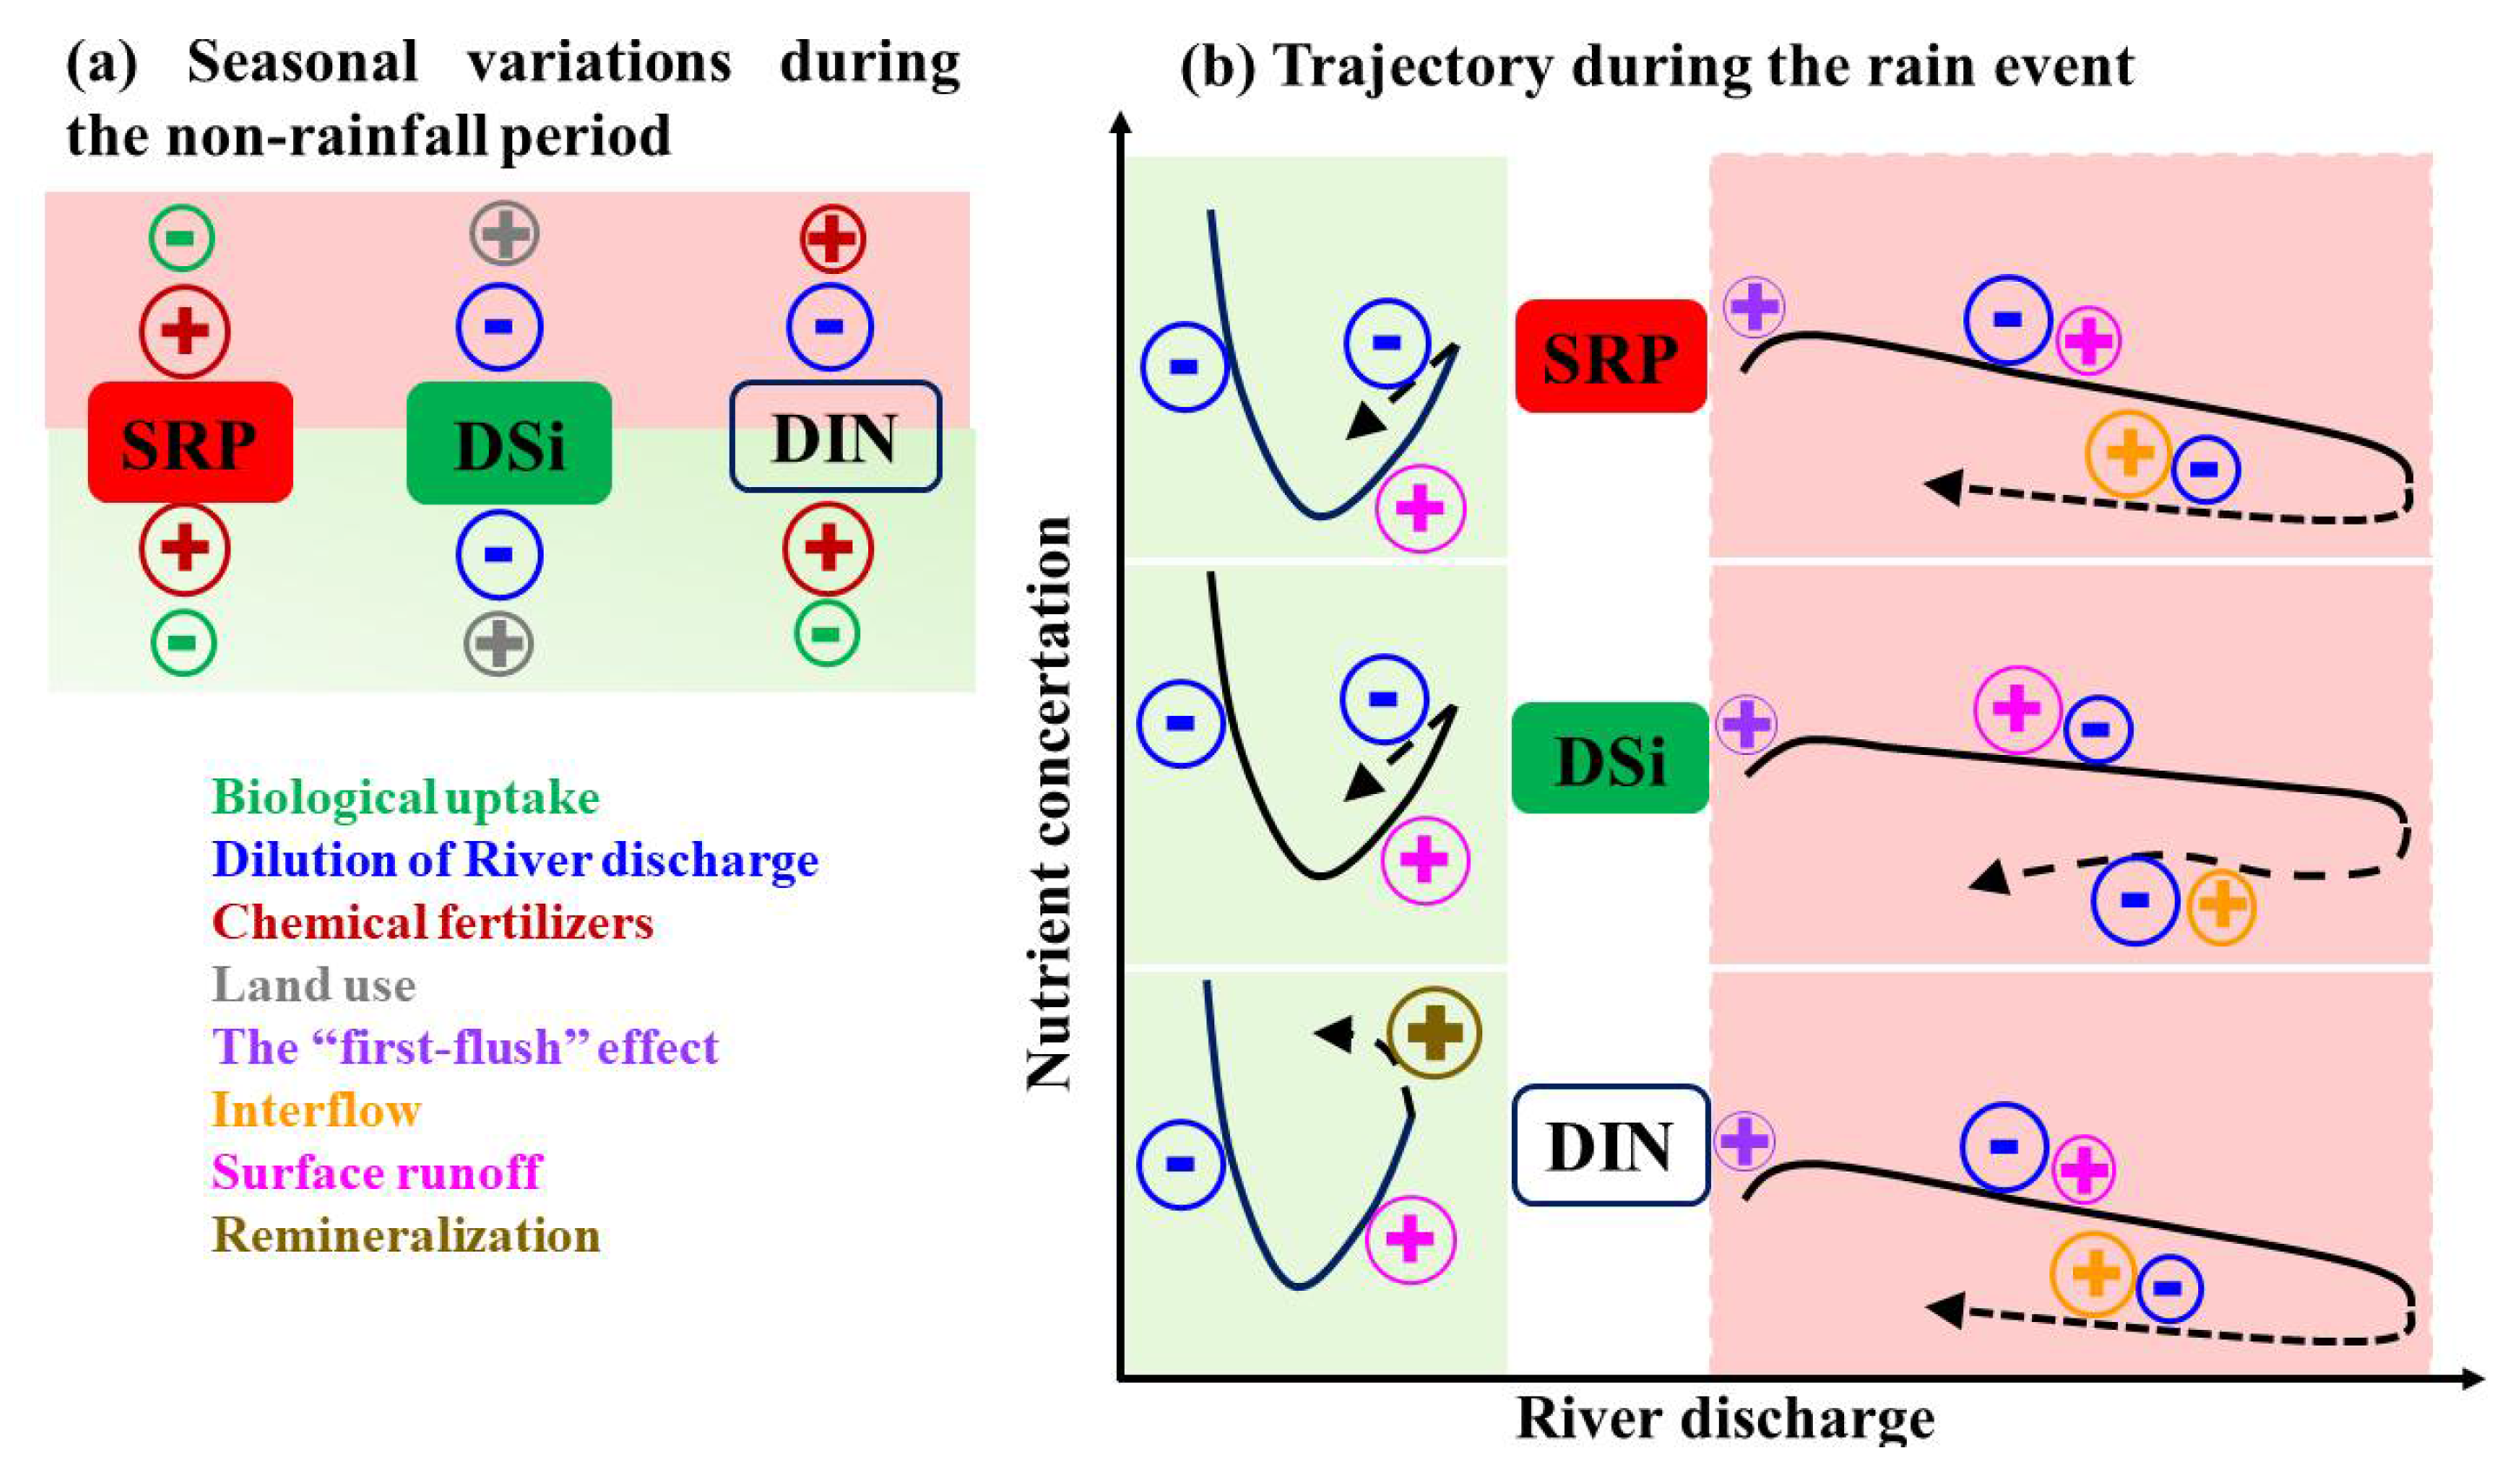
This study mainly detailed the nutrient dynamics in the two main distributaries of the JLR under different hydrological conditions (a non-rainfall period and a rain event). The seasonal variations of the nutrients were co-influenced by river discharge and its dilution, the excess application of chemical fertilizers, land use changes and biological uptake (Figure 9a). In detail, the seasonal changes in SRP in the two streams were dominated by the overuse of P fertilizers, followed by biological uptake. The seasonal variability of DSi concentrations in the two streams were mainly driven by dilution from river discharge and land use changes. Similarly, dilution from river discharge together with excess N fertilizer application dominated the seasonal variability of DIN in the NS. However, the seasonal variability of DIN concentrations in the WS was mainly attributable to the overuse of N chemical fertilizers, followed by biological uptake.
The responses of nutrients to the rain event were highly dependent on the rainfall characteristics and soil moisture conditions, but the responses were different between the two streams (Figure 9b). In the NS, the majority of nutrients were exported toward the start of the rain event and showed a moderate “first flush” effect due to its stronger rainfall and lower API compared to those in the WS. Specifically, the decline in SRP and DIN concentrations during the rising limb of the hydrograph in the NS was driven by dilution from river discharge and surface runoff, while their slight increase during the falling limb of the hydrograph was mainly influenced by supplementation via interflow (Figure 9b). In contrast, the DSi changes were controlled by surface runoff from the lower reaches, where the bedrock is dominated by granite, and the dilution by river discharge during the rising and falling limbs of the hydrograph, respectively. However, in the WS, the dilution effects on SRP and DSi were offset by the supplementation from surface runoff during the second half of the rising limb of the hydrograph due to the catchment’s higher soil moisture content. The remineralization of the resuspended PON that accumulated along the dams under base flow and at the beginning of the rain event likely partially added DIN during the falling limb of the hydrograph in the WS. These mentioned factors in the JLR are likely to occur in many subtropical river systems, although their relative intensities may have temporal–spatial variations. The use of this conceptual diagram could help us to understand the mechanisms of nutrient dynamics and make it easier to compare between different systems.
Lower fluxes in DIN and SRP and higher DSi fluxes were observed in the NS compared to those in the WS. The fractions of annual high flow (Q/Qm > 3) to annual nutrient export were estimated to be ~17.3% in the JLR, although the duration time of the high flow only accounted for ~4.0% of the year. This highlights the importance of short-lived rain events on nutrient exports in medium-sized eutrophic subtropical rivers.
Supplementary Materials
The following supporting information can be downloaded at: https://www.mdpi.com/article/10.3390/w14050834/s1, Figure S1: Relationships between nutrient fluxes and river discharge in (a) the NS and (b) the WS, Figure S2: Time series of nutrient fluxes in the NS (a–c) and the WS (e–f). (a) and (d) are SRP fluxes, (b) and (e) are DSi fluxes, (c) and (f) are DIN fluxes. Gray shading indicates the runoff.
Author Contributions
Conceptualization, X.G. and X.Y.; methodology, X.Y. and H.B.; software, X.G.; validation, X.G. and X.Y.; formal analysis, X.G. and X.Y.; investigation, H.B.; resources, X.Y. and H.B.; data curation, X.Y. and H.B.; writing—original draft preparation, X.G.; writing—review and editing, X.Y., J.W., H.B. and S.K.; visualization, X.G. and X.Y.; supervision, X.Y.; project administration, X.Y. and H.B.; funding acquisition, X.Y. and J.W. All authors have read and agreed to the published version of the manuscript.
Funding
This research was funded by the National Natural Science Foundation of China (NSFC 41806092, 42176046, 42076038), the Basic and Applied Basic Research Foundation of Guangdong Province (2019A1515010611, 2021A1515011886). Key Special Project for Introduced Talents Team of Southern Marine Science and Engineering Guangdong Laboratory (Guangzhou) (GML2019ZD0606) and the Shantou University Scientific Research Foundation for Talents (NTF18013).
Data Availability Statement
The datasets studied during the present study are available from the corresponding author upon reasonable request.
Acknowledgments
The authors wish to thank Jing Qiao and other colleagues at the State Key Laboratory of Marine Environmental Science (Xiamen University, China) for their help with the sampling and measurements.
Conflicts of Interest
The authors declare no conflict of interest.
References
- Dagg, M.; Benner, R.; Lohrenz, S.; Lawrence, D. Transformation of dissolved and particulate materials on continental shelves influenced by large rivers: Plume processes. Cont. Shelf Res. 2004, 24, 833–858. [Google Scholar] [CrossRef]
- Chen, C.; Tung, A. Buoyancy leads to high productivity of the Changjiang diluted water: A note. Hai Yang Xue Bao 2008, 27, 133–140. [Google Scholar] [CrossRef]
- Han, A.; Dai, M.; Kao, S.J.; Gan, J.; Li, Q.; Wang, L.; Zhai, W.; Wang, L. Nutrient dynamics and biological consumption in a large continental shelf system under the influence of both a river plume and coastal upwelling. Limnol. Oceanogr. 2012, 57, 486–502. [Google Scholar] [CrossRef] [Green Version]
- Rabalais, N.N.; Turner, R.E.; Dortch, Q.; Wiseman, J.W.; Sen Gupta, B.K. Nutrient Changes in the Mississippi River and System Responses on the Adjacent Continental Shelf. Estuaries 1996, 19, 386–407. [Google Scholar] [CrossRef]
- Goolsby, D.A.; Battaglin, W.A. Long-term changes in concentrations and flux of nitrogen in the Mississippi River Basin, USA. Hydrol. Process. 2001, 15, 1209–1226. [Google Scholar] [CrossRef]
- Paerl, H.W. Assessing and managing nutrient-enhanced eutrophication in estuarine and coastal waters: Interactive effects of human and climatic perturbations. Ecol. Eng. 2006, 26, 40–54. [Google Scholar] [CrossRef]
- Howarth, R.W. Coastal nitrogen pollution: A review of sources and trends globally and regionally. Harmful Algae 2008, 8, 14–20. [Google Scholar] [CrossRef]
- Penuelas, J.; Poulter, B.; Sardans, J.; Ciais, P.; van der Velde, M.; Bopp, L.; Boucher, O.; Godderis, Y.; Hinsinger, P.; Llusia, J.; et al. Human-induced nitrogen-phosphorus imbalances alter natural and managed ecosystems across the globe. Nat. Commun. 2013, 4, 2934. [Google Scholar] [CrossRef] [Green Version]
- Sharples, J.; Middelburg, J.J.; Fennel, K.; Jickells, T.D. What proportion of riverine nutrients reaches the open ocean? Glob. Biogeochem. Cycles 2017, 31, 39–58. [Google Scholar] [CrossRef] [Green Version]
- Yu, Q.; Wang, F.; Yan, W.; Zhang, F.; Lv, S.; Li, Y. Carbon and Nitrogen Burial and Response to Climate Change and Anthropogenic Disturbance in Chaohu Lake, China. Int. J. Environ. Res. Public Health 2018, 15, 2734. [Google Scholar] [CrossRef] [Green Version]
- De Carlo, E.H.; Hoover, D.J.; Young, C.W.; Hoover, R.S.; Mackenzie, F.T. Impact of storm runoff from tropical watersheds on coastal water quality and productivity. Appl. Geochem. 2007, 22, 1777–1797. [Google Scholar] [CrossRef]
- Adame, M.F.; Fry, B.; Bunn, S.E. Water isotope characteristics of a flood: Brisbane River, Australia. Hydrol. Process. 2016, 30, 2033–2041. [Google Scholar] [CrossRef] [Green Version]
- Yang, J.L.; Zhang, G.L.; Shi, X.Z.; Wang, H.J.; Cao, Z.H.; Ritsema, C.J. Dynamic changes of nitrogen and phosphorus losses in ephemeral runoff processes by typical storm events in Sichuan Basin, Southwest China. Soil Tillage Res. 2009, 105, 292–299. [Google Scholar] [CrossRef]
- Reithmaier, G.M.S.; Chen, X.; Santos, I.R.; Drexl, M.J.; Holloway, C.; Call, M.; Álvarez, P.G.; Euler, S.; Maher, D.T. Rainfall drives rapid shifts in carbon and nutrient source-sink dynamics of an urbanised, mangrove-fringed estuary. Estuar. Coast. Shelf Sci. 2021, 249, 107064. [Google Scholar] [CrossRef]
- Eyre, B.D.; Ferguson, A.J.P. Impact of a flood event on benthic and pelagic coupling in a sub-tropical east Australian estuary (Brunswick). Estuar. Coast. Shelf Sci. 2006, 66, 111–122. [Google Scholar] [CrossRef]
- Correll, D.L.; Jordan, T.E.; Weller, D.E. Transport of nitrogen and phosphorus from Rhode River watersheds during storm events. Water Resour. Res. 1999, 35, 2513–2521. [Google Scholar] [CrossRef]
- Yu, Q.; Wang, F.; Li, X.; Yan, W.; Li, Y.; Lv, S. Tracking nitrate sources in the Chaohu Lake, China, using the nitrogen and oxygen isotopic approach. Environ. Sci. Pollut. Res. Int. 2018, 25, 19518–19529. [Google Scholar] [CrossRef]
- Chen, N.; Wu, Y.; Chen, Z.; Hong, H. Phosphorus export during storm events from a human perturbed watershed, southeast China: Implications for coastal ecology. Estuar. Coast. Shelf Sci. 2015, 166, 178–188. [Google Scholar] [CrossRef]
- Chen, N.; Wu, J.; Hong, H. Effect of storm events on riverine nitrogen dynamics in a subtropical watershed, southeastern China. Sci. Total Environ. 2012, 431, 357–365. [Google Scholar] [CrossRef]
- Chen, N.W.; Hong, H.S. Nitrogen export by surface runoff from a small agricultural watershed in southeast China: Seasonal pattern and primary mechanism. Biogeochemistry 2010, 106, 311–321. [Google Scholar] [CrossRef]
- Gu, C.L.; Kang, J.C.; Yan, G.D.; Chen, Z.W. Spatial and temporal variability of Northwest Pacific tropical cyclone activity in a global warming scenario. J. Trop. Meteorol. 2016, 22 (Suppl. S1), 15–23. [Google Scholar] [CrossRef]
- Wu, G.J.; Cao, W.Z.; Wang, F.F.; Su, X.; Yan, Y.; Guan, Q. Riverine nutrient fluxes and environmental effects on China’s estuaries. Sci. Total Environ. 2019, 661, 130–137. [Google Scholar] [CrossRef]
- Li, M.; Xu, K.; Watanabe, M.; Chen, Z. Long-term variations in dissolved silicate, nitrogen, and phosphorus flux from the Yangtze River into the East China Sea and impacts on estuarine ecosystem. Estuar. Coast. Shelf Sci. 2007, 71, 3–12. [Google Scholar] [CrossRef]
- Guo, F.; Li, Z.E.; Shi, J.; Qin, Y.T. Mutative Trend of Water Quality at Xuliujing Monitoring Intersect on Yangtze River and the Pollutants Flux flowing into the sea during 2005–2012. Resour. Environ. Yangtze Basin 2015, 24, 227–231. (In Chinese) [Google Scholar]
- Wei, L.; Zhang, L.J.; Chen, H.T.; Xiao, C.C.; Zhang, X. Nutrients Variations and Fluxes Estimation in the Yellow River Estuary from 2001 to 2011. Zhongguo Haiyang Daxue Xuebao Ziran Kexue Ban 2013, 43, 81–86. [Google Scholar] [CrossRef]
- Gong, Y.; Yu, Z.; Yao, Q.; Chen, H.; Mi, T.; Tan, J. Seasonal Variation and Sources of Dissolved Nutrients in the Yellow River, China. Int. J. Environ. Res. Public Health 2015, 12, 9603–9622. [Google Scholar] [CrossRef] [Green Version]
- Justic, D.; Rabalais, N.N.; Turner, E.R. Changes in nutrient structure of river-dominated coastal waters: Stoichiometric nutrient balance and its consequences. Estuar. Coast. Shelf Sci. 1995, 40, 339–356. [Google Scholar] [CrossRef]
- Garcia, A.M.; Alexander, R.B.; Arnold, J.G.; Norfleet, L.; White, M.J.; Robertson, D.M.; Schwarz, G. Regional Effects of Agricultural Conservation Practices on Nutrient Transport in the Upper Mississippi River Basin. Environ. Sci. Technol. 2016, 50, 6991–7000. [Google Scholar] [CrossRef] [PubMed]
- Huang, W.J.; Cai, W.J.; Powell, R.T.; Lohrenz, S.E.; Wang, Y.; Jiang, L.Q.; Hopkinson, C.S. The stoichiometric of inorganic carbon and nutrient removal in the Mississippi River plume and adjacent continental shelf. Biogeosciences 2012, 9, 2781–2792. [Google Scholar] [CrossRef] [Green Version]
- Chen, N. Nutrient cycling processes, fluxes and effects in the Jiulong river-estuary system under global change. Mar. Geol. Quat. Geol. 2018, 38, 23–31. [Google Scholar] [CrossRef]
- Chen, N.; Peng, B.; Hong, H.; Turyaheebwa, N.; Cui, S.; Mo, X. Nutrient enrichment and N:P ratio decline in a coastal bay–river system in southeast China: The need for a dual nutrient (N and P) management strategy. Ocean Coast. Manag. 2013, 81, 7–13. [Google Scholar] [CrossRef]
- Yu, D.; Yan, W.J.; Chen, N.W.; Peng, B.; Hong, H.; Zhuo, G. Modeling increased riverine nitrogen export: Source tracking and integrated watershed-coast management. Mar. Pollut. Bull. 2015, 101, 642–652. [Google Scholar] [CrossRef]
- Yang, L.; Guo, W.; Chen, N.; Hong, H.; Huang, J.; Xu, J.; Huang, S. Influence of a summer storm event on the flux and composition of dissolved organic matter in a subtropical river, China. Appl. Geochem. 2013, 28, 164–171. [Google Scholar] [CrossRef]
- Lin, J.; Krom, M.D.; Wang, F.; Cheng, P.; Yu, Q.; Chen, N. Simultaneous observations revealed the non-steady state effects of a tropical storm on the export of particles and inorganic nitrogen through a river-estuary continuum. J. Hydrol. 2022, 606, 127438. [Google Scholar] [CrossRef]
- Yuan, X.; Krom, M.D.; Zhang, M.; Chen, N. Human disturbance on phosphorus sources, processes and riverine export in a subtropical watershed. Sci. Total Environ. 2021, 769, 144658. [Google Scholar] [CrossRef]
- Gao, X.; Chen, N.; Yu, D.; Wu, Y.; Huang, B. Hydrological controls on nitrogen (ammonium versus nitrate) fluxes from river to coast in a subtropical region: Observation and modeling. J. Environ. Manag. 2018, 213, 382–391. [Google Scholar] [CrossRef]
- Yu, D.; Chen, N.W.; Krom, M.D.; Lin, J.; Cheng, P.; Yu, F.; Guo, W.; Hong, H.; Gao, X. Understanding how estuarine hydrology controls ammonium and other inorganic nitrogen concentrations and fluxes through the subtropical Jiulong River Estuary, S.E. China under baseflow and flood-affected conditions. Biogeochemistry 2019, 142, 443–466. [Google Scholar] [CrossRef]
- Chen, N.; Wu, Y.; Wu, J.; Yan, X.; Hong, H. Natural and human influences on dissolved silica export from watershed to coast in Southeast China. J. Geophys. Res. Biogeosci. 2014, 119, 95–109. [Google Scholar] [CrossRef]
- Chen, Y.; Chen, N.; Li, Y.; Hong, H. Multi-timescale sediment responses across a human impacted river-estuary system. J. Hydrol. 2018, 560, 160–172. [Google Scholar] [CrossRef]
- Dai, M.; Wang, L.; Guo, X.; Zhai, W.; He, B.; Kao, S.J. Nitrification and inorganic nitrogen distribution in a large perturbed river/estuarine system: The Pearl River Estuary, China. Biogeosciences 2008, 5, 1227–1244. [Google Scholar] [CrossRef] [Green Version]
- Yan, X.; Zhai, W.; Hong, H.; Li, Y.; Guo, W.; Huang, X. Distribution, fluxes and decadal changes of nutrients in the Jiulong River Estuary, Southwest Taiwan Strait. Chin. Sci. Bull. 2012, 57, 2307–2318. [Google Scholar] [CrossRef] [Green Version]
- Chen, N.; Krom, M.D.; Wu, Y.; Yu, D.; Hong, H. Storm induced estuarine turbidity maxima and controls on nutrient fluxes across river-estuary-coast continuum. Sci. Total Environ. 2018, 628–629, 1108–1120. [Google Scholar] [CrossRef]
- Perrone, J.; Madramootoo, C.A. Improved curve number selection for runoff prediction. Can. J. Civ. Eng. 1998, 25, 728–734. [Google Scholar] [CrossRef]
- Wang, Y.; Lin, M.; Chen, X.Q.; Lin, G.M. Spatial and temporal variation of phytoplankton and impacting factors in Jiulongjiang Estuary of Xiamen, Chnia. Acta Ecol. Sin. 2011, 31, 3399–3414. (In Chinese) [Google Scholar]
- Tian, Y.; Huang, B.; Yu, C.; Chen, N.; Hong, H. Dynamics of phytoplankton communities in the Jiangdong Reservoir of Jiulong River, Fujian, South China. Chin. J. Oceanol. Limnol. 2014, 32, 255–265. [Google Scholar] [CrossRef]
- Zhang, J.; Zhang, Z.F.; Liu, S.M. Human impacts on the large world rivers Would the Changjiang (Yangtze River) be an illustration? Glob. Biogeochem. Cycles 1999, 13, 1099–1105. [Google Scholar] [CrossRef]
- Carey, J.C.; Fulweiler, R.W. Human activities directly alter watershed dissolved silica fluxes. Biogeochemistry 2011, 111, 125–138. [Google Scholar] [CrossRef]
- Rusjan, S.; Brilly, M.; Mikoš, M. Flushing of nitrate from a forested watershed: An insight into hydrological nitrate mobilization mechanisms through seasonal high-frequency stream nitrate dynamics. J. Hydrol. 2008, 354, 187–202. [Google Scholar] [CrossRef]
- Li, Y.; Yan, W.; Wang, F.; Lv, S.; Li, Q.; Yu, Q. Nitrogen pollution and sources in an aquatic system at an agricultural coastal area of Eastern China based on a dual-isotope approach. Environ. Sci. Pollut. Res. Int. 2019, 26, 23807–23823. [Google Scholar] [CrossRef]
- Yan, X.; Wan, X.S.; Liu, L.; Xu, M.N.; Tan, E.; Zheng, Z.; Zou, W.; Tian, L.; Li, D.W.; Trull, T.W.; et al. Biogeochemical Dynamics in a Eutrophic Tidal Estuary Revealed by Isotopic Compositions of Multiple Nitrogen Species. J. Geophys. Res. Biogeosci. 2019, 124, 1849–1864. [Google Scholar] [CrossRef]
- Li, J.; Jiang, X.; Jing, Z.; Li, G.; Chen, Z.; Zhou, L.; Zhao, C.; Liu, J.; Tan, Y. Spatial and seasonal distributions of bacterioplankton in the Pearl River Estuary: The combined effects of riverine inputs, temperature, and phytoplankton. Mar. Pollut. Bull. 2017, 125, 199–207. [Google Scholar] [CrossRef] [PubMed]
- Lu, F.H.; Ni, H.G.; Liu, F.; Zeng, E.Y. Occurrence of nutrients in riverine runoff of the Pearl River Delta, South China. J. Hydrol. 2009, 376, 107–115. [Google Scholar] [CrossRef]
- Hall, F.R. Dissolved solids—Discharge relationships. 1. Mixing models. Water Resour. Res. 1970, 6, 845–850. [Google Scholar] [CrossRef]
- House, W.A.; Warwick, M.S. Hysteresis of the solute concentration/discharge relationship in rivers during storms. Water Resour. 1998, 32, 2279–2290. [Google Scholar] [CrossRef]
- Bowes, M.J.; House, W.A.; Hodgkinson, R.A.; Leach, D.V. Phosphorus-discharge hysteresis during storm events along a river catchment: The River Swale, UK. Water Res. 2005, 39, 751–762. [Google Scholar] [CrossRef]
- Qiao, J.; Bao, H.; Huang, D.; Li, D.-W.; Lee, T.-Y.; Huang, J.-C.; Kao, S.-J. Runoff-driven export of terrigenous particulate organic matter from a small mountainous river: Sources, fluxes and comparisons among different rivers. Biogeochemistry 2019, 147, 71–86. [Google Scholar] [CrossRef]
- Bao, H.; Niggemann, J.; Huang, D.; Dittmar, T.; Kao, S.J. Different Responses of Dissolved Black Carbon and Dissolved Lignin to Seasonal Hydrological Changes and an Extreme Rain Event. Biogeosciences 2019, 124, 479–493. [Google Scholar] [CrossRef]
- Yoon, V.K.; Stein, E.D. Natural catchments as sources of background levels of storm-water metals nutrients and solids. J. Environ. Eng. 2008, 134, 961–973. [Google Scholar] [CrossRef]
- Chen, N.; Hong, H.; Huang, Q.; Wu, J. Atmospheric nitrogen deposition and its long-term dynamics in a southeast China coastal area. J. Environ. Manag. 2011, 92, 1663–1667. [Google Scholar] [CrossRef]
- Maavara, T.; Parsons, C.T.; Ridenour, C.; Stojanovic, S.; Durr, H.H.; Powley, H.R.; Van Cappellen, P. Global phosphorus retention by river damming. Proc. Natl. Acad. Sci. USA 2015, 112, 15603–15608. [Google Scholar] [CrossRef] [Green Version]
- Maavara, T.; Akbarzadeh, Z.; Van Cappellen, P. Global Dam-Driven Changes to Riverine N:P:Si Ratios Delivered to the Coastal Ocean. Geophys. Res. Lett. 2020, 47, e2020GL088288. [Google Scholar] [CrossRef]
- Sliva, L.; Williams, D.D. Buffer zone versus whole catchment approaches to studying land use impact on water quality. Water Res. 2001, 35, 3462–3472. [Google Scholar] [CrossRef]
- Kaushal, S.S.; Mayer, P.M.; Vidon, P.G.; Smith, R.M.; Pennino, M.J.; Newcomer, T.A.; Duan, S.; Welty, C.; Belt, K.T. Land Use and Climate Variability Amplify Carbon, Nutrient, and Contaminant Pulses: A Review with Management Implications. J. Am. Water Resour. Assoc. 2014, 50, 585–614. [Google Scholar] [CrossRef]
- Billen, G.; Garnier, J. River basin nutrient delivery to the coastal sea: Assessing its potential to sustain new production of non-siliceous algae. Mar. Chem. 2007, 106, 148–160. [Google Scholar] [CrossRef]
- OConnor, B.S.; Muller-Karger, F.E.; Nero, R.W.; Hu, C.; Peebles, E.B. The role of Mississippi River discharge in offshore phytoplankton blooming in the northeastern Gulf of Mexico during August 2010. Remote Sens. Environ. 2016, 173, 133–144. [Google Scholar] [CrossRef]
- Lara, R.J.; Rachold, V.; Kattner, G. Dissolved organic matter and nutrients in the Lena River, Siberian Arctic: Characteristics and distribution. Mar. Chem. 1998, 59, 301–309. [Google Scholar] [CrossRef]
- Liu, X.; Beusen, A.H.W.; Van Beek, L.P.H.; Mogollon, J.M.; Ran, X.; Bouwman, A.F. Exploring spatiotemporal changes of the Yangtze River (Changjiang) nitrogen and phosphorus sources, retention and export to the East China Sea and Yellow Sea. Water Res. 2018, 142, 246–255. [Google Scholar] [CrossRef]
- Liu, S.M.; Hong, G.H.; Zhang, J.; Ye, X.W.; Jiang, X.L. Nutrient budgets for large Chinese estuaries. Biogeosciences 2009, 6, 2245–2263. [Google Scholar] [CrossRef] [Green Version]
- Wu, G.; Cao, W.; Huang, Z.; Kao, C.M.; Chang, C.T.; Chiang, P.C.; Wang, F. Decadal changes in nutrient fluxes and environmental effects in the Jiulong River Estuary. Mar. Pollut. Bull. 2017, 124, 871–877. [Google Scholar] [CrossRef]
- Chen, N.; Wang, J.; Liu, X.; Zhang, C.; Huang, B.; Beusen, A.H.W.; Middelburg, J.J.; Bouwman, A.F. Exploring Seasonal and Annual Nitrogen Transfer and Ecological Response in River-Coast Continuums Based on Spatially Explicit Models. J. Geophys. Res. Biogeosci. 2022, 127, e2021JG006634. [Google Scholar] [CrossRef]
Figure 1.
Sampling map. The precipitation data were collected from gauging stations (gray circles). The surface water samples were collected from the Guokeng Bridge on the NS and the Shuixianhua Bridge on the WS (red stars). The red circles represent surrounding cities in the watershed. Yellow, purple and green indicate the NS, WS and South Stream watersheds, respectively.

Figure 2.
The daily average runoff in the NS (a) and the WS (b) during the investigation period. The hourly runoff in the NS (c) and the WS (d) during the rain event. The dashed orange lines represent Q/Qm = 3.
Figure 2.
The daily average runoff in the NS (a) and the WS (b) during the investigation period. The hourly runoff in the NS (c) and the WS (d) during the rain event. The dashed orange lines represent Q/Qm = 3.

Figure 3.
Temporal variations in riverine TSM and nutrients in the NS (a–d) and the WS (e–h): (a,e) are TSM concentrations, (b,f) are SRP concentrations, (c,g) are DSi concentrations and (d,h) are DIN concentrations. The gray shading represents the daily average runoff. The green, red, blue and white bars indicate spring, summer, autumn and winter, respectively.

Figure 4.
Temporal changes in TSM and nutrients during the rain event in the NS (a,b) and the WS (c,d). The gray shading represents the hourly runoff.
Figure 4.
Temporal changes in TSM and nutrients during the rain event in the NS (a,b) and the WS (c,d). The gray shading represents the hourly runoff.

Figure 5.
Seasonal changes in nutrients ((a) DIN, (b) SRP and (c) DSi) and river discharge in the NS and WS during the non-rainfall period. The red and gray shaded areas represent the overall changes in nutrients during the non-rainfall period and rain event, respectively. The black and bold black horizontal lines in the boxes indicate the median and the mean, while the two horizontal lines at the ends of the box sides represent the third and first quartile.

Figure 6.
The trajectory of TSM (a,e), SRP (b,f), DSi (c,g) and DIN (d,h) values along with river discharge during the rain event in the NS (a–d) and the WS (e–h).
Figure 6.
The trajectory of TSM (a,e), SRP (b,f), DSi (c,g) and DIN (d,h) values along with river discharge during the rain event in the NS (a–d) and the WS (e–h).

Figure 7.
The relationship between the cumulative nutrient loads ((a) DIN, (b) SRP and (c) DSi) and river discharge. The black line represents the 1:1 line, indicating that the nutrient loads were proportional to the increase in river discharge. The datapoints above/below the 1:1 line indicate that the nutrient loads were predominantly exported toward the start/end of the rain event, respectively.

Figure 8.
The relationship between the areal yields of (a) DIN and (b) SRP and population densities in worldwide rivers. The black dots, black triangles, and red dots represent the average areal yields of DIN and SRP in large Chinese rivers [25,68], worldwide river basins [64], and the JLR (this study), respectively. The black circles denote the areal yields of TN and TP in three large Chinese rivers [41]. Line I, line II and line III in (a) denote 1 kg N person−1, 10 kg N person−1 and 100 kg N person−1, respectively, while in (b) they denote 0.1 kg P person−1, 1 kg P person−1 and 10 kg P person−1, respectively.

Figure 9.
A conceptual diagram for the mechanisms controlling nutrient dynamics during (a) the non-rainfall period and (b) the rain event. The red and green shading in (a,b) represent the NS and WS, respectively. The solid and dotted lines in (b) represent the rising and falling limbs of the hydrograph, respectively.


Table 1.
The characteristics of the rainfall and runoff in the two tributaries during the rain event.
Table 1.
The characteristics of the rainfall and runoff in the two tributaries during the rain event.
| River | Rainfall Duration Time (h) | Rainfall Intensity (mm d−1) | Mean Runoff (mm h−1) | Peak Runoff (mm h−1) | Time Lag (h) | Cumulative Runoff (mm) | API (mm) |
|---|---|---|---|---|---|---|---|
| North Stream | 81.0 | 50.0 | 0.4 | 0.8 | 22.0 | 37.2 | 76.9 (III) |
| West Stream | 87.0 | 37.9 | 0.5 | 1.3 | 24.0 | 43.6 | 81.3 (III) |
Table 2.
Kendall’s correlation coefficients between river discharge and nutrient concentrations during the non-rainfall period and rain event in the NS and WS of the JLR.
Table 2.
Kendall’s correlation coefficients between river discharge and nutrient concentrations during the non-rainfall period and rain event in the NS and WS of the JLR.
| Variables | Stream | Non-Rainfall Period | Rain Event |
|---|---|---|---|
| Discharge versus SRP | NS | −0.03 | −0.69 ** |
| WS | 0.33 | −0.32 | |
| Discharge versus DSi | NS | −0.68 * | −0.24 |
| WS | −0.545 * | −0.11 | |
| Discharge versus DIN | NS | −0.70 ** | −0.79 ** |
| WS | 0.18 | 0.32 |
* p ≤ 0.05, ** p ≤ 0.01.
Table 3.
The fluxes and proportions of nutrient loads during the rain event.
| Stream | Discharge (109 m3) | FSRP (×104 kg P yr−1) | FDSi (×106 kg Si yr−1) | FDIN (×106 kg N yr−1) | |
|---|---|---|---|---|---|
| Annual | NS | 7.2 | 32.3 | 31.8 | 14.6 |
| WS | 3.1 | 41.2 | 18.9 | 18.5 | |
| Monitored Rain Event (High Flow) | NS | 0.3 | 1.2 | 1.2 | 0.6 |
| WS | 0.2 | 1.9 | 0.9 | 0.9 | |
| Proportion | NS | 4.1% | 4.2% | 3.8% | 4.1% |
| WS | 5.1% | 4.4% | 4.8% | 4.9% | |
| Annual High Flow | NS | 1.2 | 5.3 | 5.2 | 2.4 |
| WS | 0.6 | 7.4 | 3.4 | 3.4 | |
| Proportion | NS | 16.6% | 16.6% | 16.3% | 16.6% |
| WS | 18.3% | 17.7% | 18.1% | 18.2% |
Table 4.
A summary of the annual nutrient fluxes (×106 kg) from worldwide rivers.
| Catchment (×104 km2) | Discharge (×109 m3) | FSRP (×106 kg P) | FDSi (×106 kg Si) | FDIN (×106 kg N) | Reference | |
|---|---|---|---|---|---|---|
| Amazon River | 614.4 | 6300.0 | 307.2 | 32170 | 1376.3 | [1] |
| [64] | ||||||
| Zaire River | 401.5 | 1250.0 | 31.0 | 5775.0 | 126.0 | [1] |
| Orinoco River | 94.8 | 1200.0 | 7.4 | 2889.6 | 110.9 | [1] |
| Yangtze River | 180.9 | 928.2 | 5.3 | 2370.0 | 624.6 | [23] |
| Mississippi River | 322.1 | 536.1 | 106.3 | 837.5 | 1823.1 | [64] |
| [65] | ||||||
| Lena River | 250 | 510.0 | 8.0 | 942.5 | 5.7 | [1] |
| [66] | ||||||
| Pearl River | 59.0 | 482.1 | 5.6 | 1040.0 | 406.9 | [67] |
| [68] | ||||||
| Yellow River | 75.2 | 42.6 | 0.2 | 57.9 | 55.1 | [25] |
| Jiulong River | 1.4 | 10.3 | 0.7 | 50.7 | 33.1 | This study |
Publisher’s Note: MDPI stays neutral with regard to jurisdictional claims in published maps and institutional affiliations. |
© 2022 by the authors. Licensee MDPI, Basel, Switzerland. This article is an open access article distributed under the terms and conditions of the Creative Commons Attribution (CC BY) license (https://creativecommons.org/licenses/by/4.0/).
Share and Cite
MDPI and ACS Style
Guo, X.; Yan, X.; Bao, H.; Wu, J.; Kao, S. Differential Response of Nutrients to Seasonal Hydrological Changes and a Rain Event in a Subtropical Watershed, Southeast China. Water 2022, 14, 834. https://doi.org/10.3390/w14050834
AMA Style
Guo X, Yan X, Bao H, Wu J, Kao S. Differential Response of Nutrients to Seasonal Hydrological Changes and a Rain Event in a Subtropical Watershed, Southeast China. Water. 2022; 14(5):834. https://doi.org/10.3390/w14050834
Chicago/Turabian StyleGuo, Xiaolan, Xiuli Yan, Hongyan Bao, Junwen Wu, and Shuhji Kao. 2022. "Differential Response of Nutrients to Seasonal Hydrological Changes and a Rain Event in a Subtropical Watershed, Southeast China" Water 14, no. 5: 834. https://doi.org/10.3390/w14050834
Note that from the first issue of 2016, this journal uses article numbers instead of page numbers. See further details here.