Article

Comparison of the Seismic Responses of an Arch Dam under Excitation from the Design Response Spectrum in the New and Old Chinese National Standards

1
Engineering Research Center on Dike Safety and Disease Prevention of the Ministry of Water Resources, Yellow River Institute of Hydraulic Research, Zhengzhou 450003, China
2
School of Water Conservancy Engineering, Zhengzhou University, Zhengzhou 450001, China
3
Guangxi Key Laboratory of Water Engineering Materials and Structures, Guangxi Institute of Water Resources Research, Nanning 530000, China
*
Author to whom correspondence should be addressed.
Water 2022, 14(5), 832; https://doi.org/10.3390/w14050832
Submission received: 10 December 2021 / Revised: 1 March 2022 / Accepted: 3 March 2022 / Published: 7 March 2022
(This article belongs to the Special Issue Safety Evaluation of Dam and Geotechnical Engineering)

Abstract

:
The new Chinese national standard, Standard for the seismic design of hydraulic structures (GB51247-2018), has been published. Compared with the Specifications for the seismic design of hydraulic structures (SL203-1997), the standard design response spectrum curve was revised in the new national standard. In order to compare the seismic responses of an arch dam under excitation from the design response spectrum in the new and old standards, the dynamic calculation of a 240 m high arch dam is carried out by a three-dimensional finite element method. In the dynamic calculation, the B-differentiable equation is used to simulate the tension motion of arch dam contraction joints, and the multi-transmitting boundary method and the Westergaard added mass method are used to simulate the dam–infinite foundation and dam–reservoir interactions, respectively. The results show that the dynamic stress responses of the arch dam under excitation from the design response spectrum in the new standard are increased compared with those of the old standard. The seismic safety of an arch dam may decrease under excitation from the design response spectrum in the new standard. Thus, the seismic validation on built arch dams should be carried out by using the new standard when it is possible.

1. Introduction

The seismic design standard is a special technical standard, which is constantly revised and improved based on existing scientific knowledge, economic conditions, and accumulated aseismic experience and data. In order to guide the design and construction of hydraulic structures in earthquake zones, the Standard for the seismic design of hydraulic structures (GB51247-2018) [1] has been published as a new national standard based on extensive investigation of the status of the seismic design of hydraulic structures in China and referring to the seismic design methods and standards of hydraulic structures in other country. Compared with the Specifications for the seismic design of hydraulic structures (SL203-1997) [2], the standard design response spectrum curve was revised in the new national standard.
The design response spectrum in various seismic design standards reflects the statistical law of the seismic acceleration response spectrum with different magnitudes and epicentral distances [3,4,5], which is an important basic parameter in seismic calculation using the dynamic time–history method [6]. The seismic safety of arch dams is very important, because any potential failure of arch dams may induce a major disaster [7]. In the seismic validation of arch dams, the acceleration time–history generated from the design response spectrum is usually used to calculate the dynamic responses of arch dams. Thus, it is necessary for dam designers to understand the difference between the seismic responses of arch dams under excitation from the design response spectrums in the new and old standards.
In order to compare the seismic responses of arch dams under excitation from the design response spectrum in the new and old standards, the dynamic calculation of a 240 m high arch dam was carried out by the three-dimensional finite element method. In the dynamic calculation, B-differentiable equations [8,9,10] are used to simulate the tension motion of arch dam contraction joints; the multi-transmitting boundary method [11] and Westergaard added mass method [12] are used to simulate the dam–infinite foundation and dam–reservoir interactions, respectively.
The rest of this paper is organized as follows. The design response spectrums in the old and new standards are compared in Section 2. The computational method, mode, and results of the arch dam–reservoir–foundation system are presented in Section 3, Section 4 and Section 5 respectively. Some conclusions are drawn in Section 6.

2. Comparison of Design Response Spectrum in Old and New Standards

In the standard for the seismic design of hydraulic structures, the product of the maximum amplification coefficient spectrum and the peak ground acceleration is used to represent the maximum absolute acceleration response spectrum. The maximum value of the standard design response spectrum βmax, the characteristic period Tg, and the attenuation index γ are the three main parameters that determine the design response spectrum. Taking an arch dam built on a Class I type site [13] as an example, the design response spectrums in the new and old standards are compared.
(1)
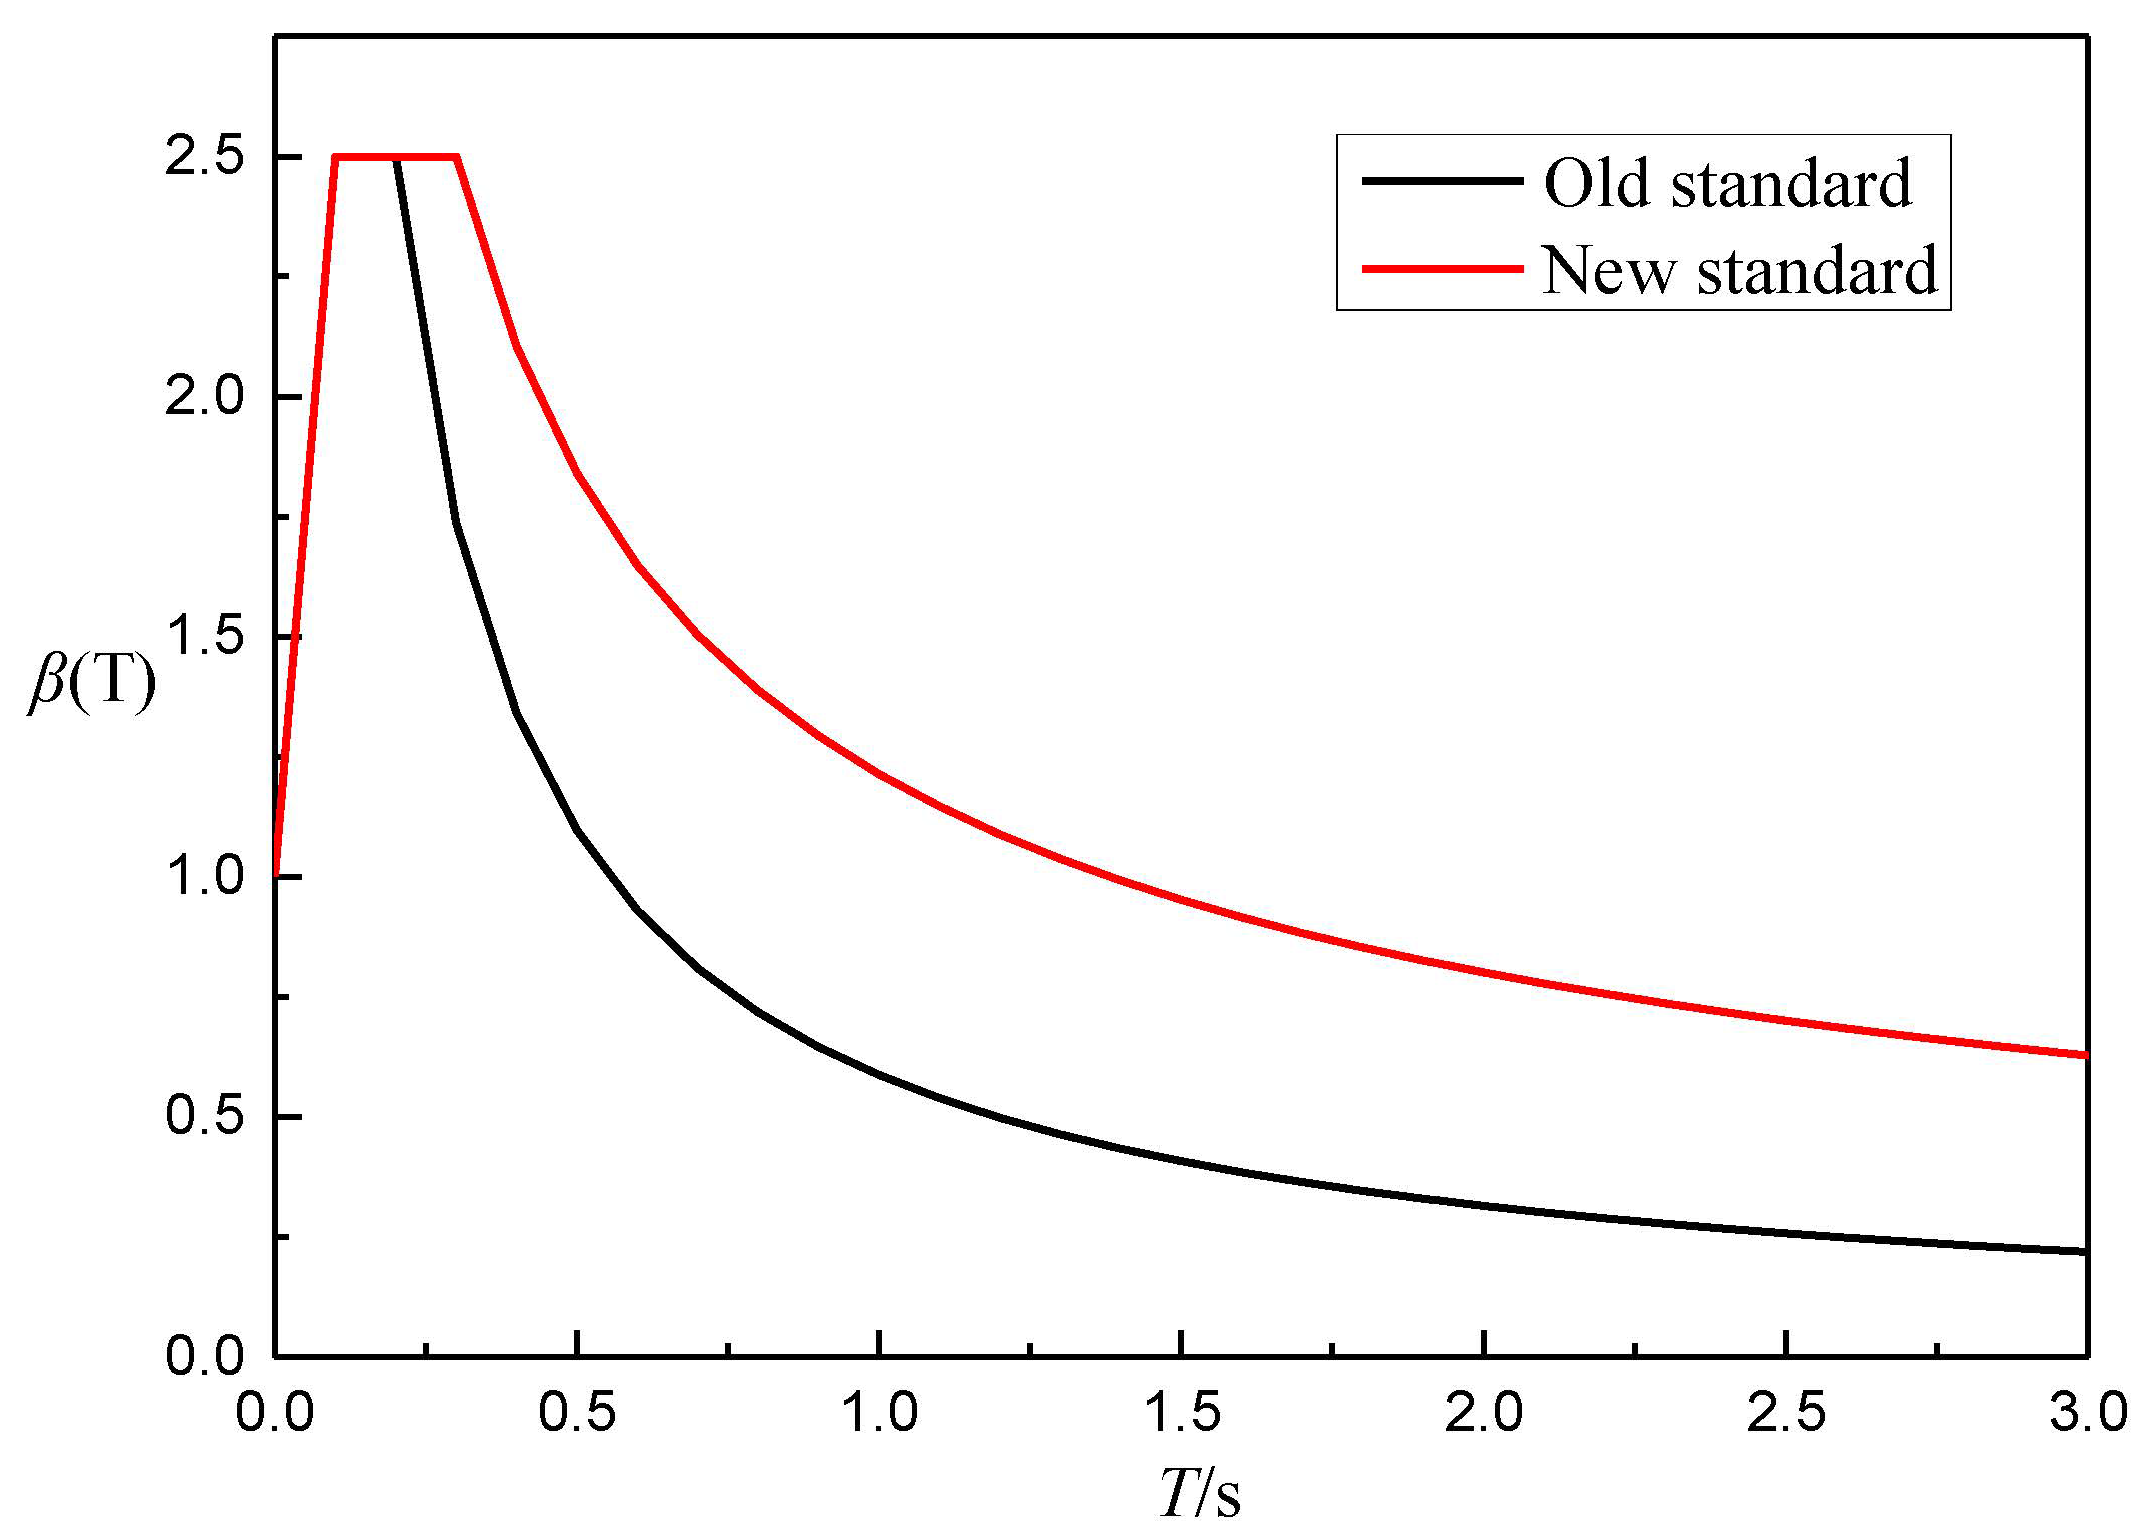
The maximum value βmax of the design response spectrum suitable for seismic design of arch dams are set as 2.5 in the new and old standards.
(2)
In the old standard, the value of the characteristic period Tg mainly considered the influence of site type, the characteristic period of the design response spectrum was suggested to be 0.2 s for arch dams built on a class I site; The new standard takes into account the effects of site type, epicentral distance, and magnitude; hence, the characteristic period of the design response spectrum is suggested to be 0.3 s for arch dams built on a class I site.
(3)
The design response spectrum reflects the statistical law of the response spectrum of ground motion acceleration with different magnitudes and epicentral distances and, in fact, reflects the attenuation relation of the response spectrum. The attenuation index γ of the design response spectrum in the old standard was derived from the seismic intensity transformation in the seismic hazard analysis of the site and was suggested to be 0.9. The seismic response spectrum proposed in the new standard is based on the latest next generation attenuation relation (NGA) in the USA [14], which is a normalized mean response spectrum. The attenuation index γ is suggested to be 0.6.
Thus, as shown in Figure 1, the differences between the design response spectrum in the new standard and the old standard are mainly reflected in the characteristic period Tg and the attenuation index γ for arch dams built on a Class I site.

3. Computational Method

3.1. B-Differentiable Equations

Under the action of strong earthquakes, arch dam contraction joints may open, close, and have frictional dislocation, which can be solved as a contact problem [15,16]. A method of B-differentiable equations [8] is used to solve the three-dimensional dynamic friction contact between dam blocks induced by an earthquake. The following is a brief introduction of the method of B-differentiable equations for the three-dimensional elastic frictional contact problem, taking the contact of two bodies (represented by body 1 and body 2, respectively) as an example.
Based on the assumption of small deformation and small strain, the point–point contact model is adopted for the contact surface after FE discretization, that is, the nodes of the two contact surfaces are one-to-one corresponding along the normal direction of the contact surface, forming a plurality of contact pairs. The contact conditions at ith contact pair can be expressed in the form of B-differentiable equations as follows:
H 2 i ( d u c i , d P i ) = min { r Δ u n i , P n i } = 0
H 3 i ( d u c i , d P i ) = P a i λ P a i ( r ) = 0
H 4 i ( d u c i , d P i ) = P b i λ P b i ( r ) = 0
where
P a i ( r ) = P a i r Δ d u a i
P b i ( r ) = P b i r Δ d u b i
λ = min { μ min { P n i , 0 } ( P a i ( r ) ) 2 + ( P b i ( r ) ) 2 , 1 }
where μ is the friction coefficient. Δ u n i , Δ d u a i , Δ d u b i denote the increment of the normal relative displacement and the tangential relative displacement of the ith contact pair, respectively. P n i , P a i , P b i represents the normal and tangential contact forces of the ith contact pair, respectively. Equations (1)–(3) is non-differentiable causing by the operator min. The contact equations in the form of B-differentiable equations can be solved by the B-differentiable damped Newton method [8].

3.2. Multi-Transmitting Boundary Method

The radiation damping effect of an infinite foundation and the input mechanism of ground motion should be considered in the dam–infinite foundation interaction model [17]. In the direct method [18,19], an artificial boundary condition is applied to the outer boundary of the finite domain model, which can simulate the propagation of the scattered waves caused by the vibration of the arch dam. The multi-transmitting formula [11] as an artificial boundary condition is based on the plane wave assumption. The multi-transmitting formula is suitable to simulate the far field condition of a homogeneous infinite foundation, and has the characteristics of space–time decoupling which greatly reduce the amount of calculation. Because the local artificial boundary multi-transmitting formula does not consider the coupling effect of boundary nodes, the artificial boundary should be selected far enough away from the structure. Thus, the multi-transmitting boundary method is used to simulate the dam–infinite foundation interaction.

3.3. Westergaard Added Mass Method

The dam–reservoir interaction is simulated by the Westergaard added mass method [12,20]. The added mass of hydrodynamic pressure is calculated according to Westergaard’s formula. The Westergaard added mass model has been recognized as too conservative according to experimental and numerical analysis [21]. Thus, the Westergaard formula (7) is reduced by 25%.
m w ( h ) = 7 8 ρ H 0 h
where mw(h) is the added mass at the node, with depth h, ρ is the mass density of water, H0 is the depth of reservoir, and h is the depth of the node.

3.4. Prediction–Correction Explicit Integration Method

A prediction–correction explicit integration method is used to solve the dynamic equilibrium equation of an arch dam–reservoir–infinite foundation system. In the prediction–correction explicit integration method, the dynamic equilibrium equation can be written as:
M u ¨ t + d t + C u ˙ ˜ t + d t + K u ˜ t + d t = F t + d t + P c t + d t
where M, C, and K denote the mass, damping, and stiffness matrices respectively. F t + d t and P c t + d t represent the external load and the contact force on the contact surface at time t + dt, respectively. u ¨ t + d t , u ˙ ˜ t + d t , and u ˜ t + d t represent the acceleration, predicted velocity and predicted displacement at time t + dt, respectively. u ˙ ˜ t + d t and u ˜ t + d t can be obtained from the known displacement, velocity, and acceleration at time t. In Equation (8), u ¨ t + d t and P c t + d t are unknown variables, which can be obtained by simultaneously solving Equation (8) and Equations (1)–(3).

4. Computational Model

The QBT hydropower plant is being constructed upstream of the Burqin River in northwest China. The QBT dam is a concrete hyperbolic arch dam with a volume of 3.78 million m3. The maximum height is 240 m. The chord length of the crest is 600 m. The thickness is 14 m at the crest, and 65 m at the base. The normal storage and the lowest generating level of the reservoir are 235 m and 150 m, respectively. The level of the Earthquake Intensity at the QBT dam site is VII. The Earthquake Intensity indicates the degree of the earthquake’s impact on the ground and buildings. The geological conditions at the QBT dam site are complex. There are several faults intersecting interlayer shear weakness zones at the dam abutment. The level of the seismic fortification is Class A The level of seismic fortification is determined on the basis of the comprehensive consideration of the seismic environment, the degree of importance of the construction project, the allowable risk level, the safety target to be achieved, and the national economic bearing capacity. In this paper, the effect of the faults on the seismic stability of the dam–foundation system is not taken into consideration.

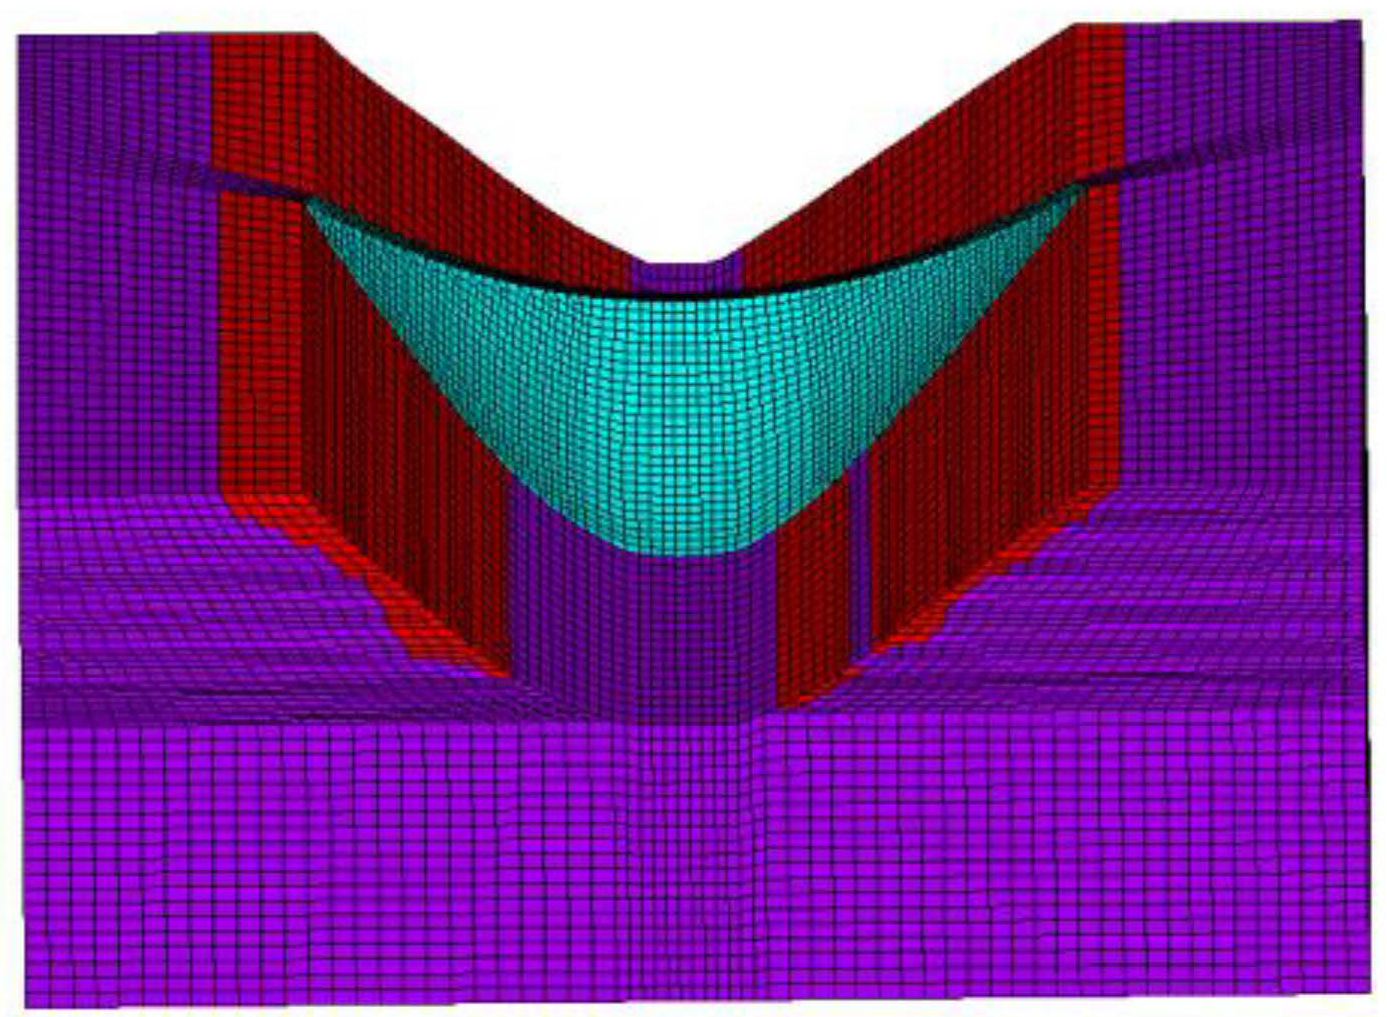
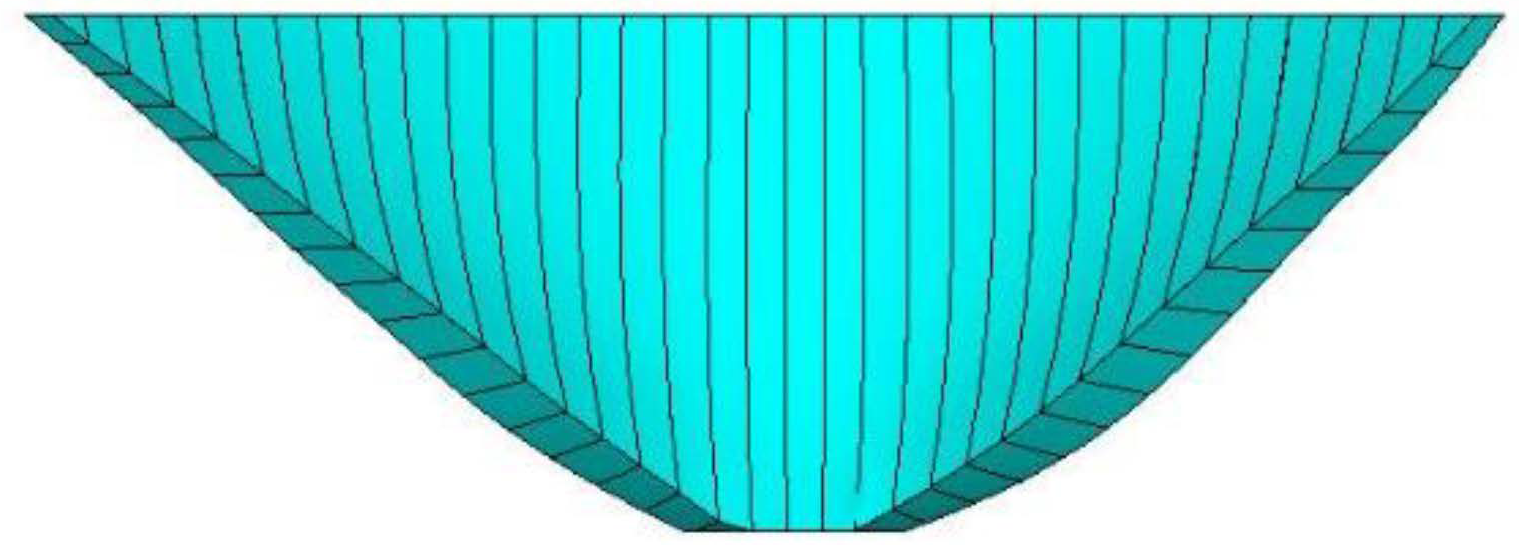
4.1. Finite Element Model

In order to satisfy the requirements for calculation accuracy and efficiency, as shown in Figure 2, the dimensions of the FE model of the QBT arch dam–foundation system were extended by one time of the dam height in the transverse direction, vertical direction, and river direction. A 3D solid element with 8 nodes was used to create the mesh of the model. In order to accurately simulate the propagation of a seismic wave, the size of the FE mesh of the foundation was not more than 20 m in the vertical direction, which satisfied the fact that the maximum element size should be no fewer than 10 elements per wavelength. There were 162,428 nodes and 148,695 elements in the FE model of the arch dam–foundation system, and the number of dam elements and nodes were 4518 and 8596, respectively. Three layers of grids were divided along the thickness direction of the arch dam, and 34 contraction joints with 2288 contact pairs were simulated, as shown in Figure 3. The interface between the dam and the foundation was neglected. The contraction joints were simulated with B-differentiable equations method. The friction coefficient was 1.0. The response of the dam was calculated using our in-house code.

4.2. Material Parameters

Concrete and bedrock were assumed to be isotropic linear elastic materials. The physical and mechanical parameters of concrete and bedrock are listed in Table 1. Bedrock II (the red zone in Figure 2) and Bedrock III (the violet zone in Figure 2) represented the rock classification.

4.3. Loading Conditions

The static load includes the self-weight of the dam, the hydrostatic pressure, the sediment pressures and the temperature load. The normal storage and the lowest generating level of the reservoir are 235 m and 150 m, respectively. The sediment depth is 57.5 m. The buoyant unit weight and frictional angle of sediment are 9.0 kN/m3 and 12°, respectively. The sediment pressure was treated as hydrostatic pressure [18] and was applied on the upstream surface of the dam. The static load was firstly applied on the arch dam–foundation system. Then, the dynamic load was applied to shake the dam–foundation system.
In the phase of dynamic calculation, the effect of sediment was neglected and the dam–foundation system damping was incorporated using Rayleigh damping. The damping ratio of the dam–foundation system was assumed to be 5%. The peak ground acceleration of the design earthquake was 0.357 g, when the exceedance probability of the ground motion was 2% in a 100-year period. Using the design response spectrum in the new and old standards as the target spectrum, artificial seismic waves with a duration of 20 s were fitted as the input of ground motion. In the dynamic analysis of the dam–reservoir–foundation system, it was assumed that the seismic wave was incident vertically, and the combined effects of the horizontal ground motion (along and across rivers) and vertical ground motion were simultaneously considered. The vertical ground motion was taken as 2/3 of that in the horizontal direction.

5. Numerical Results

5.1. Dynamic Characteristics

Under the condition of the normal storage level of the reservoir, as shown in Table 2, the base frequency of the arch dam was 1.2 Hz, and the natural frequency of the arch dam was relatively dense in the range of 1–5 Hz (natural vibration period 0.2 s–1 s). In the range of this period, the difference between the new and old standards was significant. Thus, the artificial waves generated by different design response spectrum had a certain influence on the tensile and compressive principal stress of the dam body and the distribution range of high stresses.

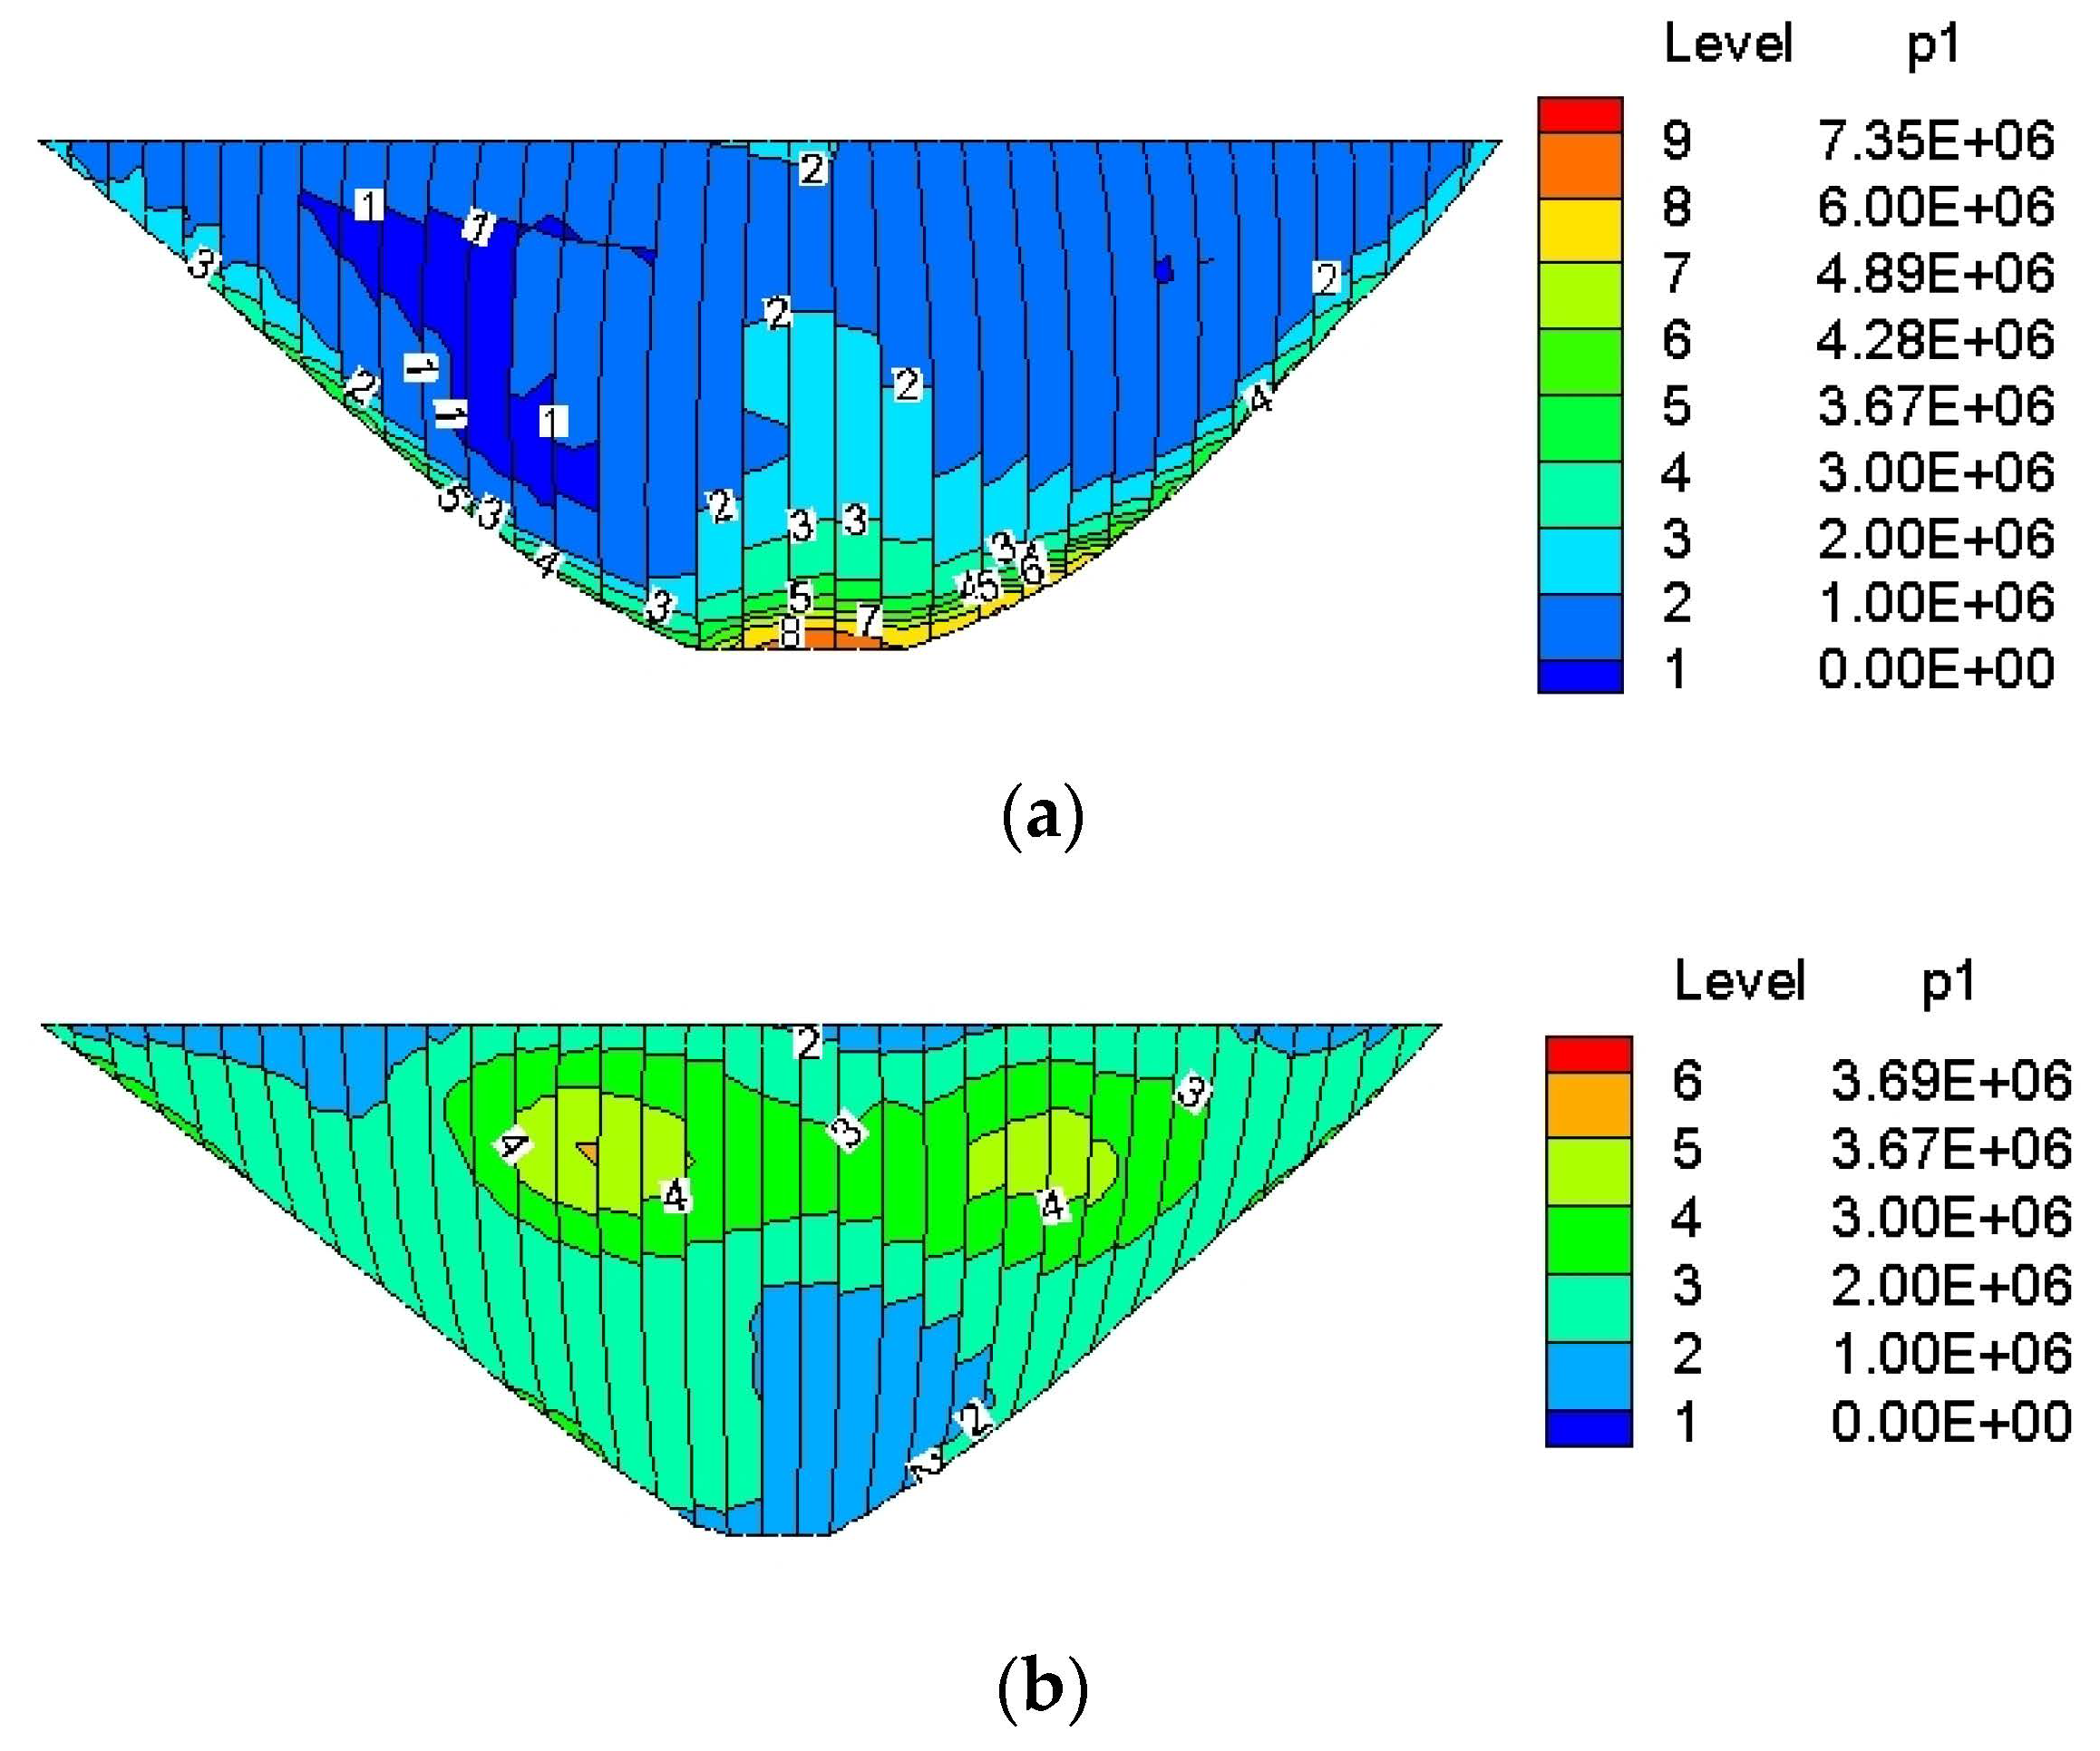
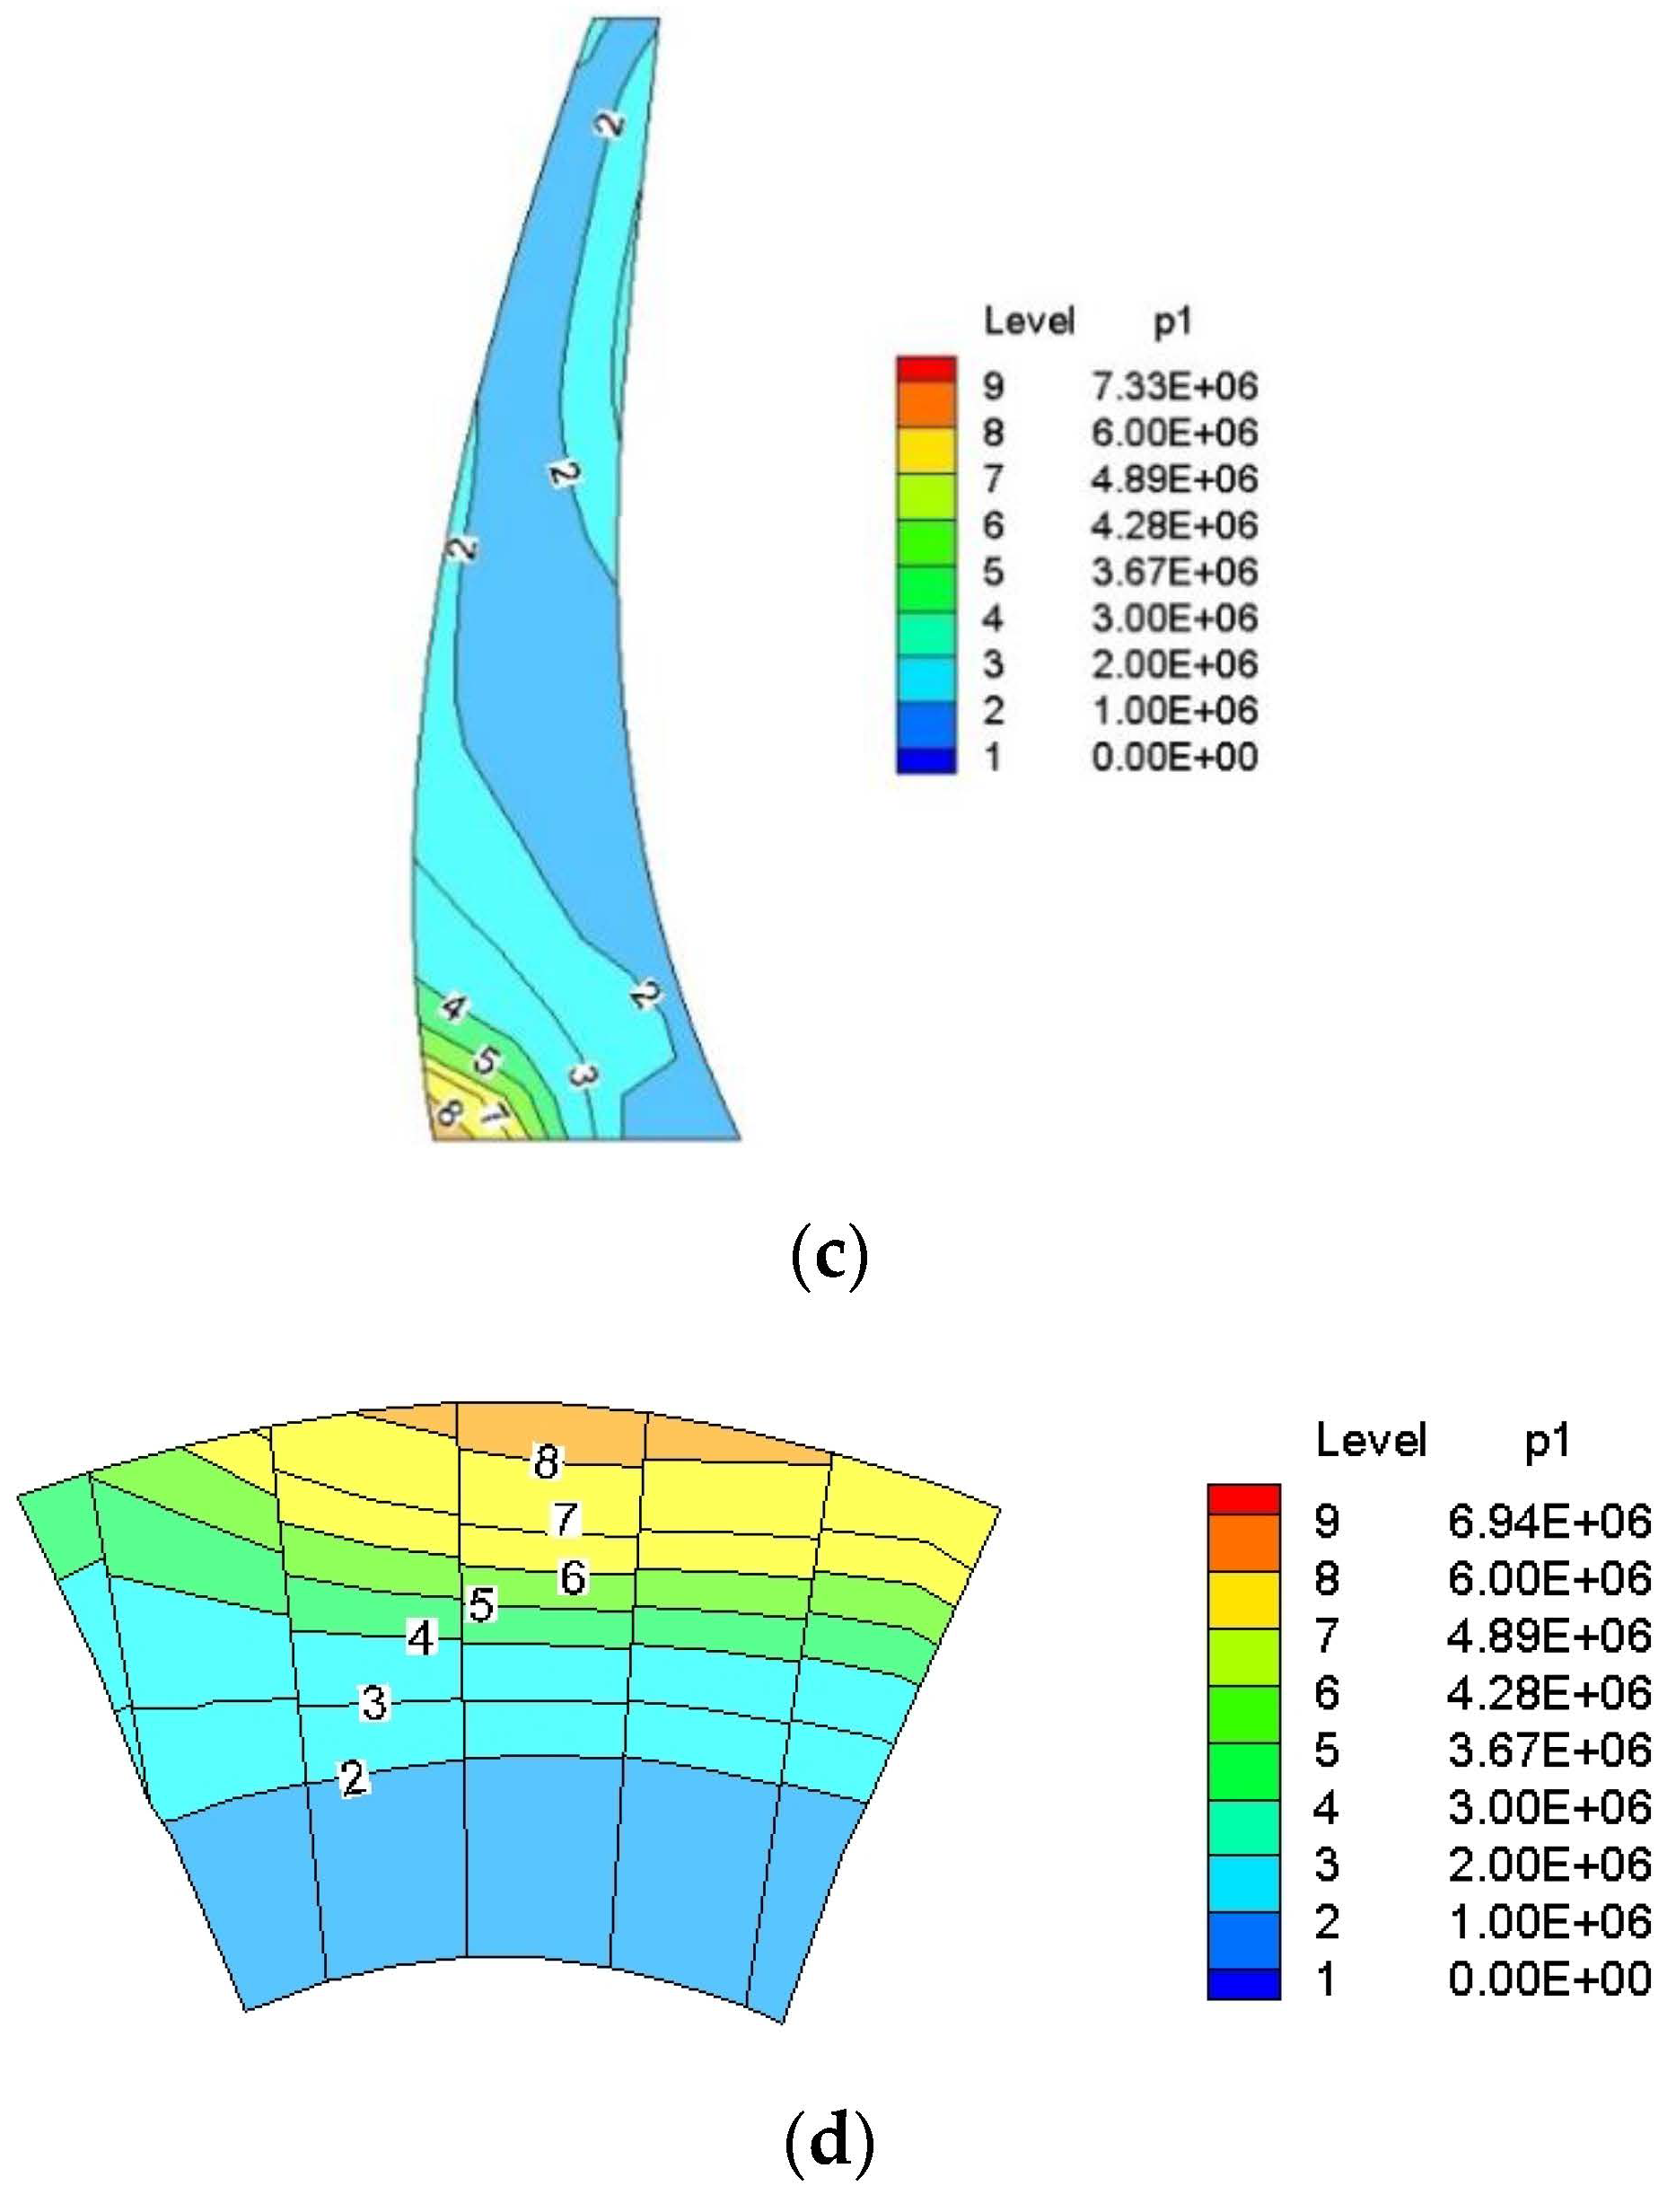
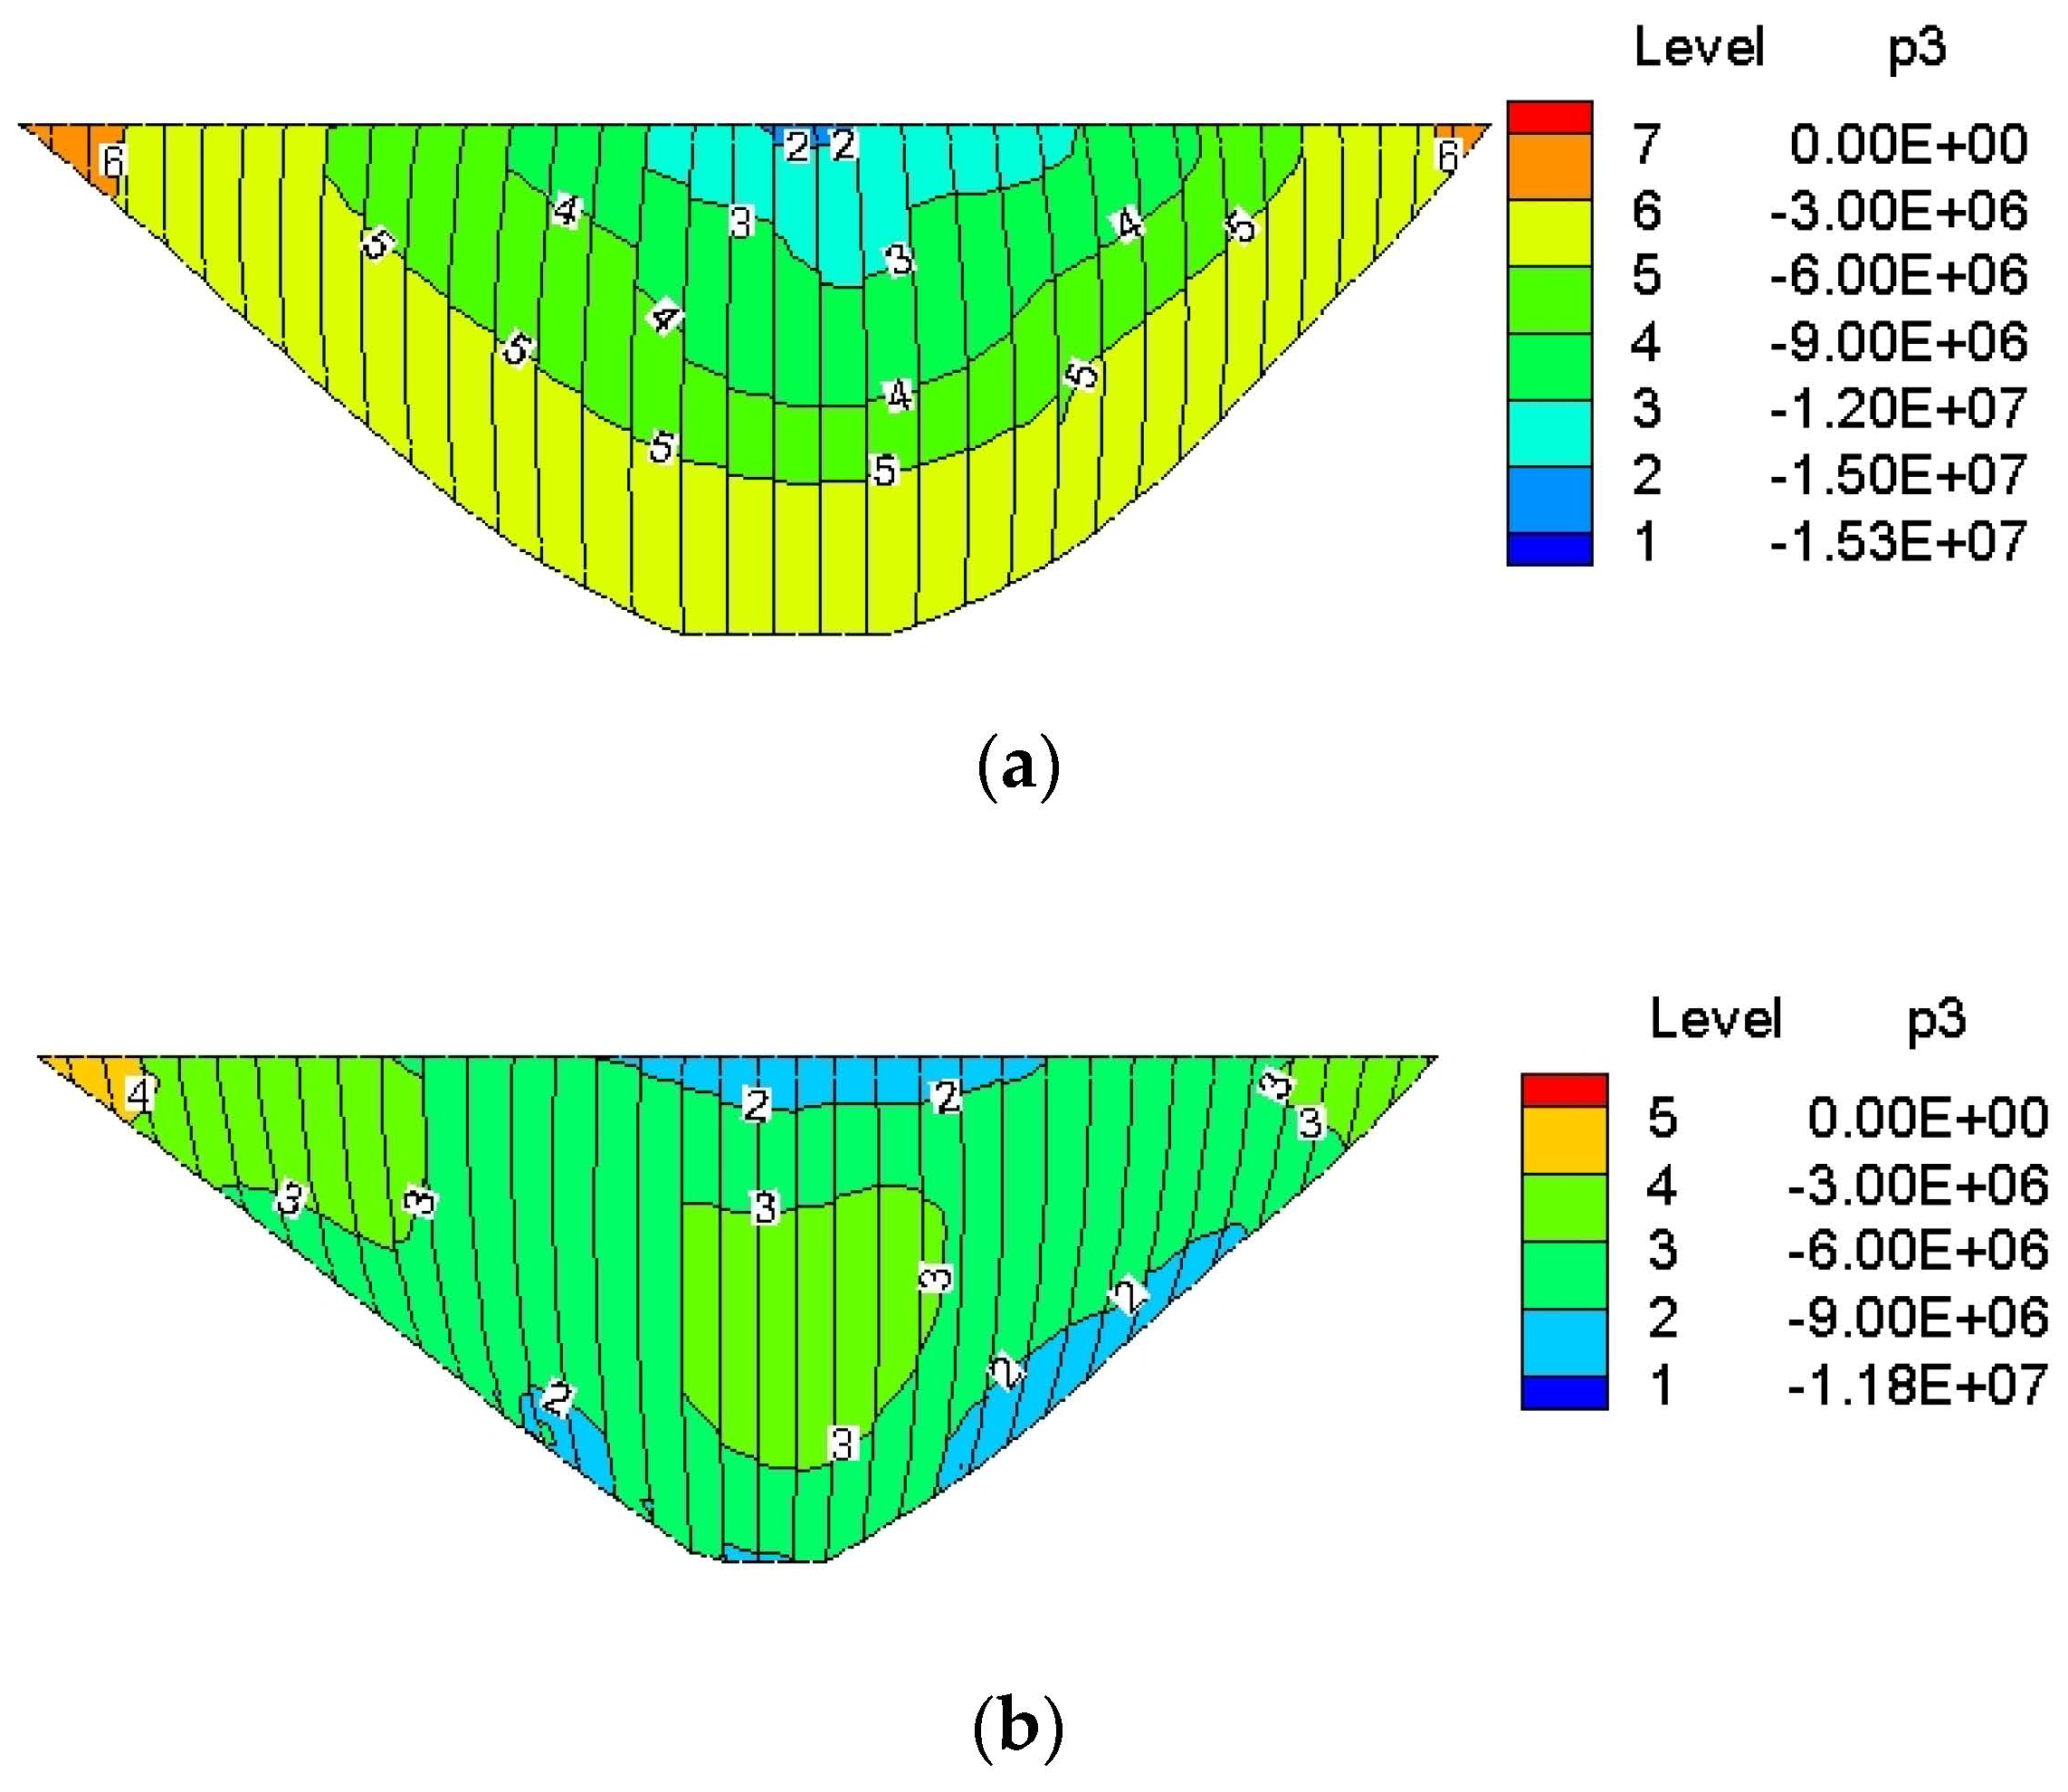
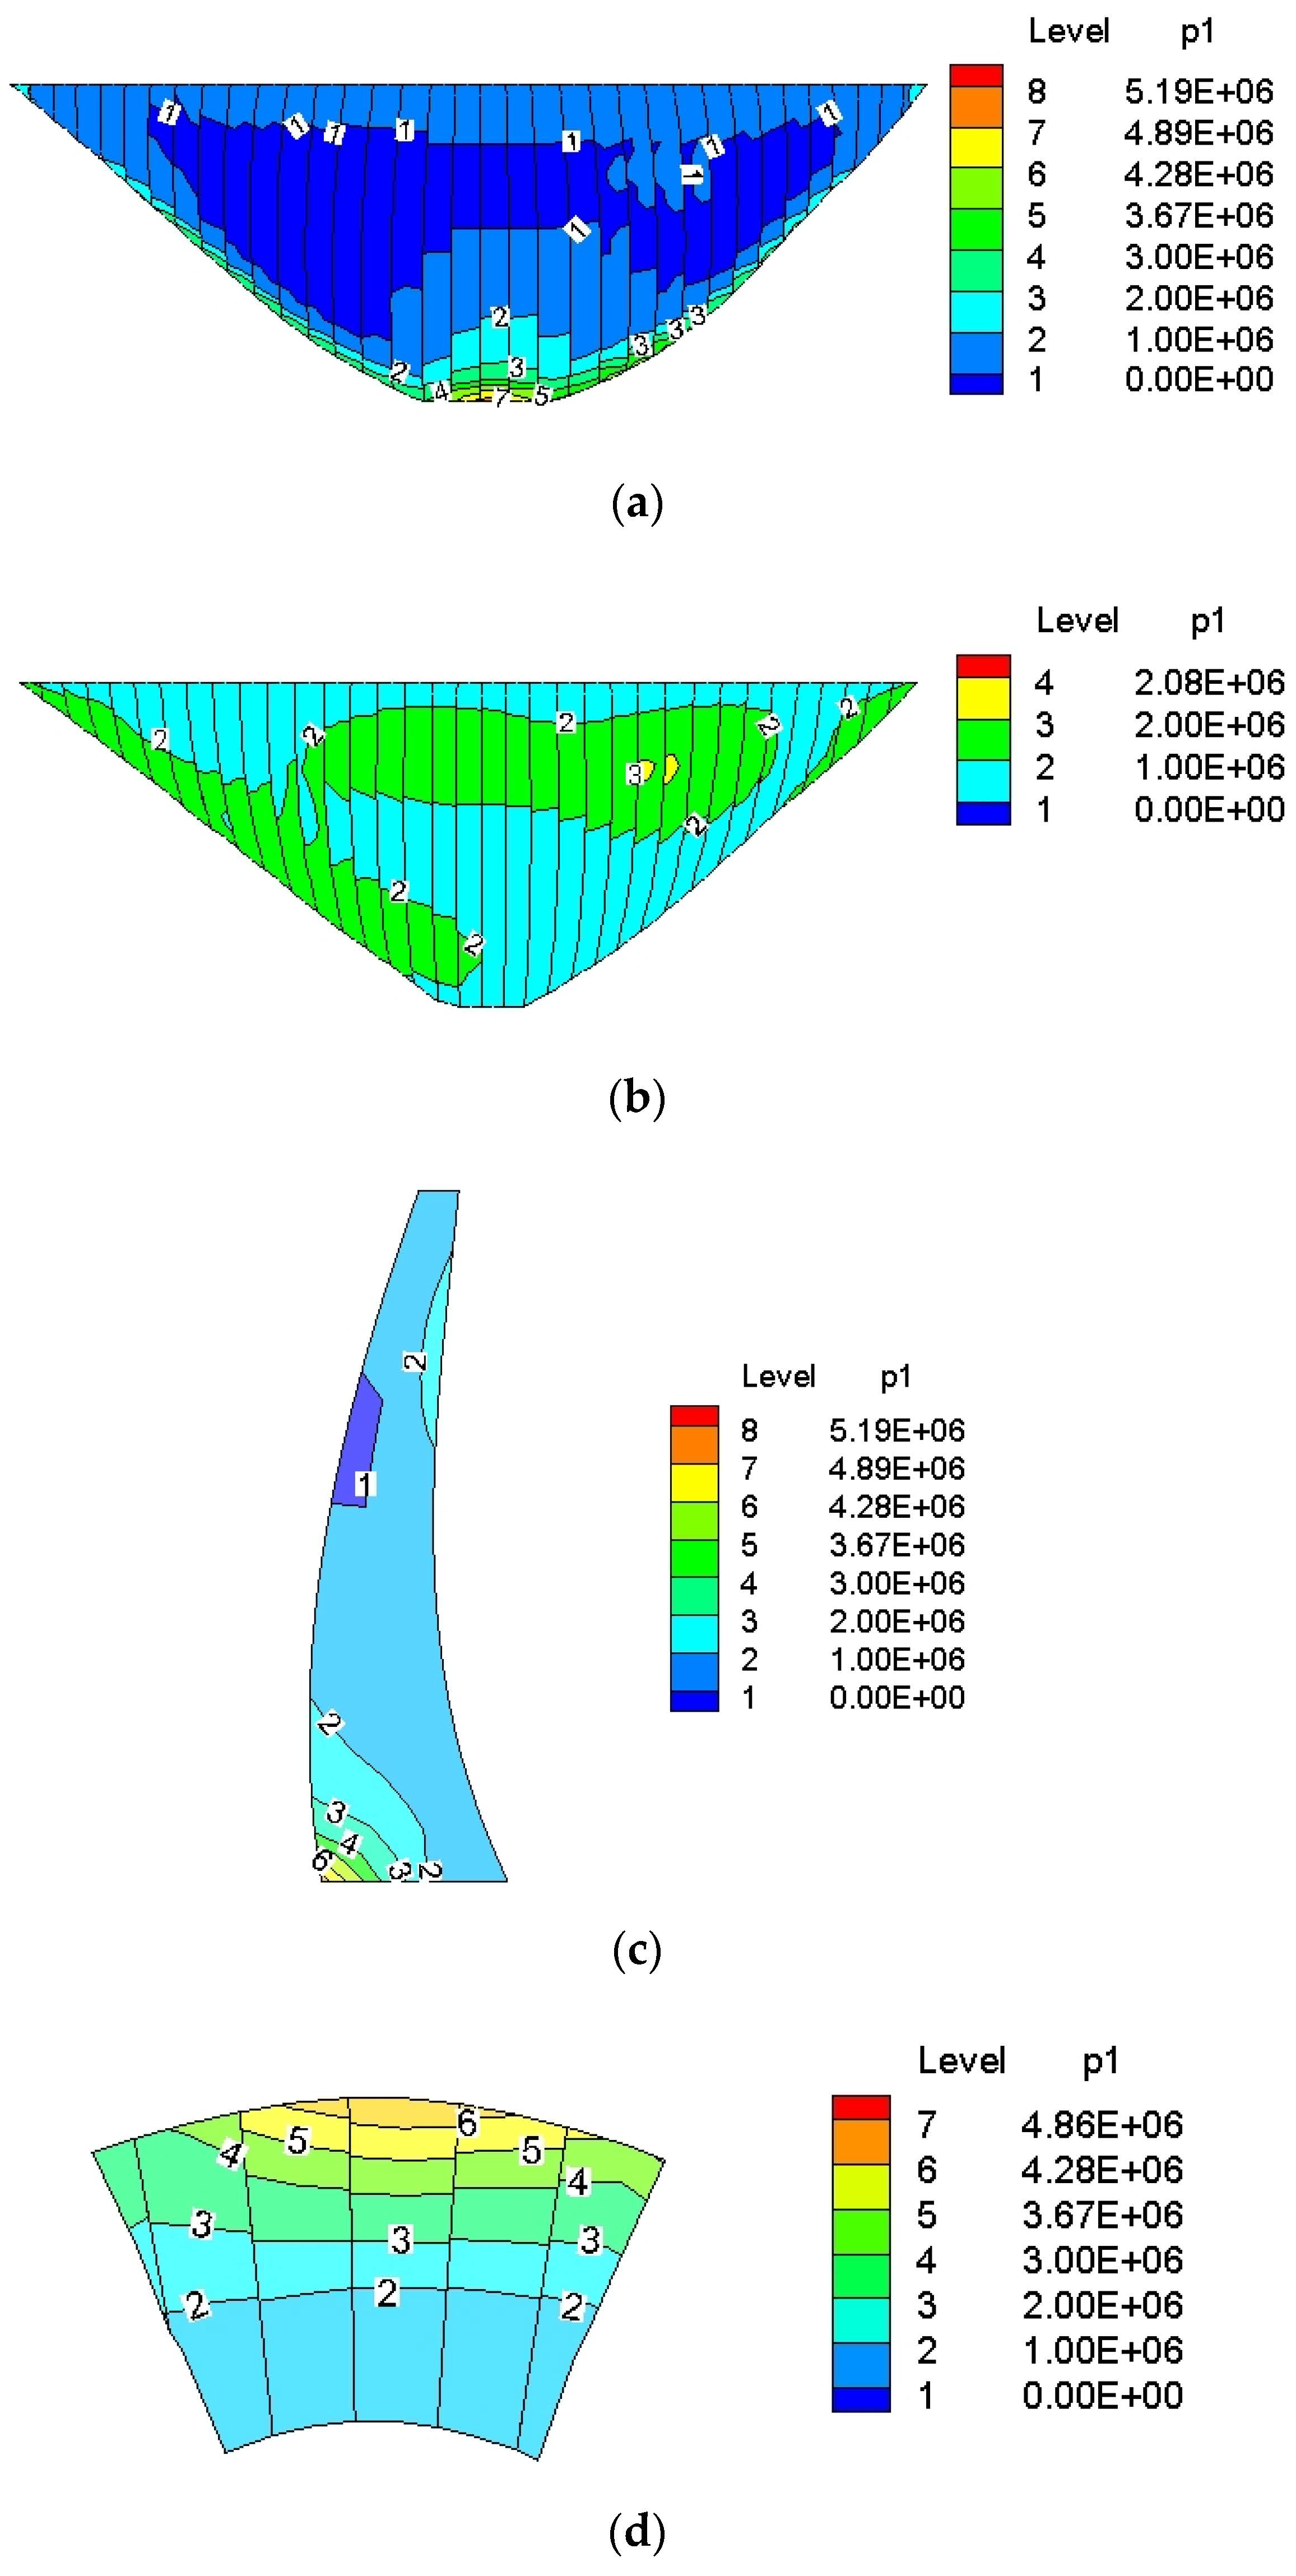
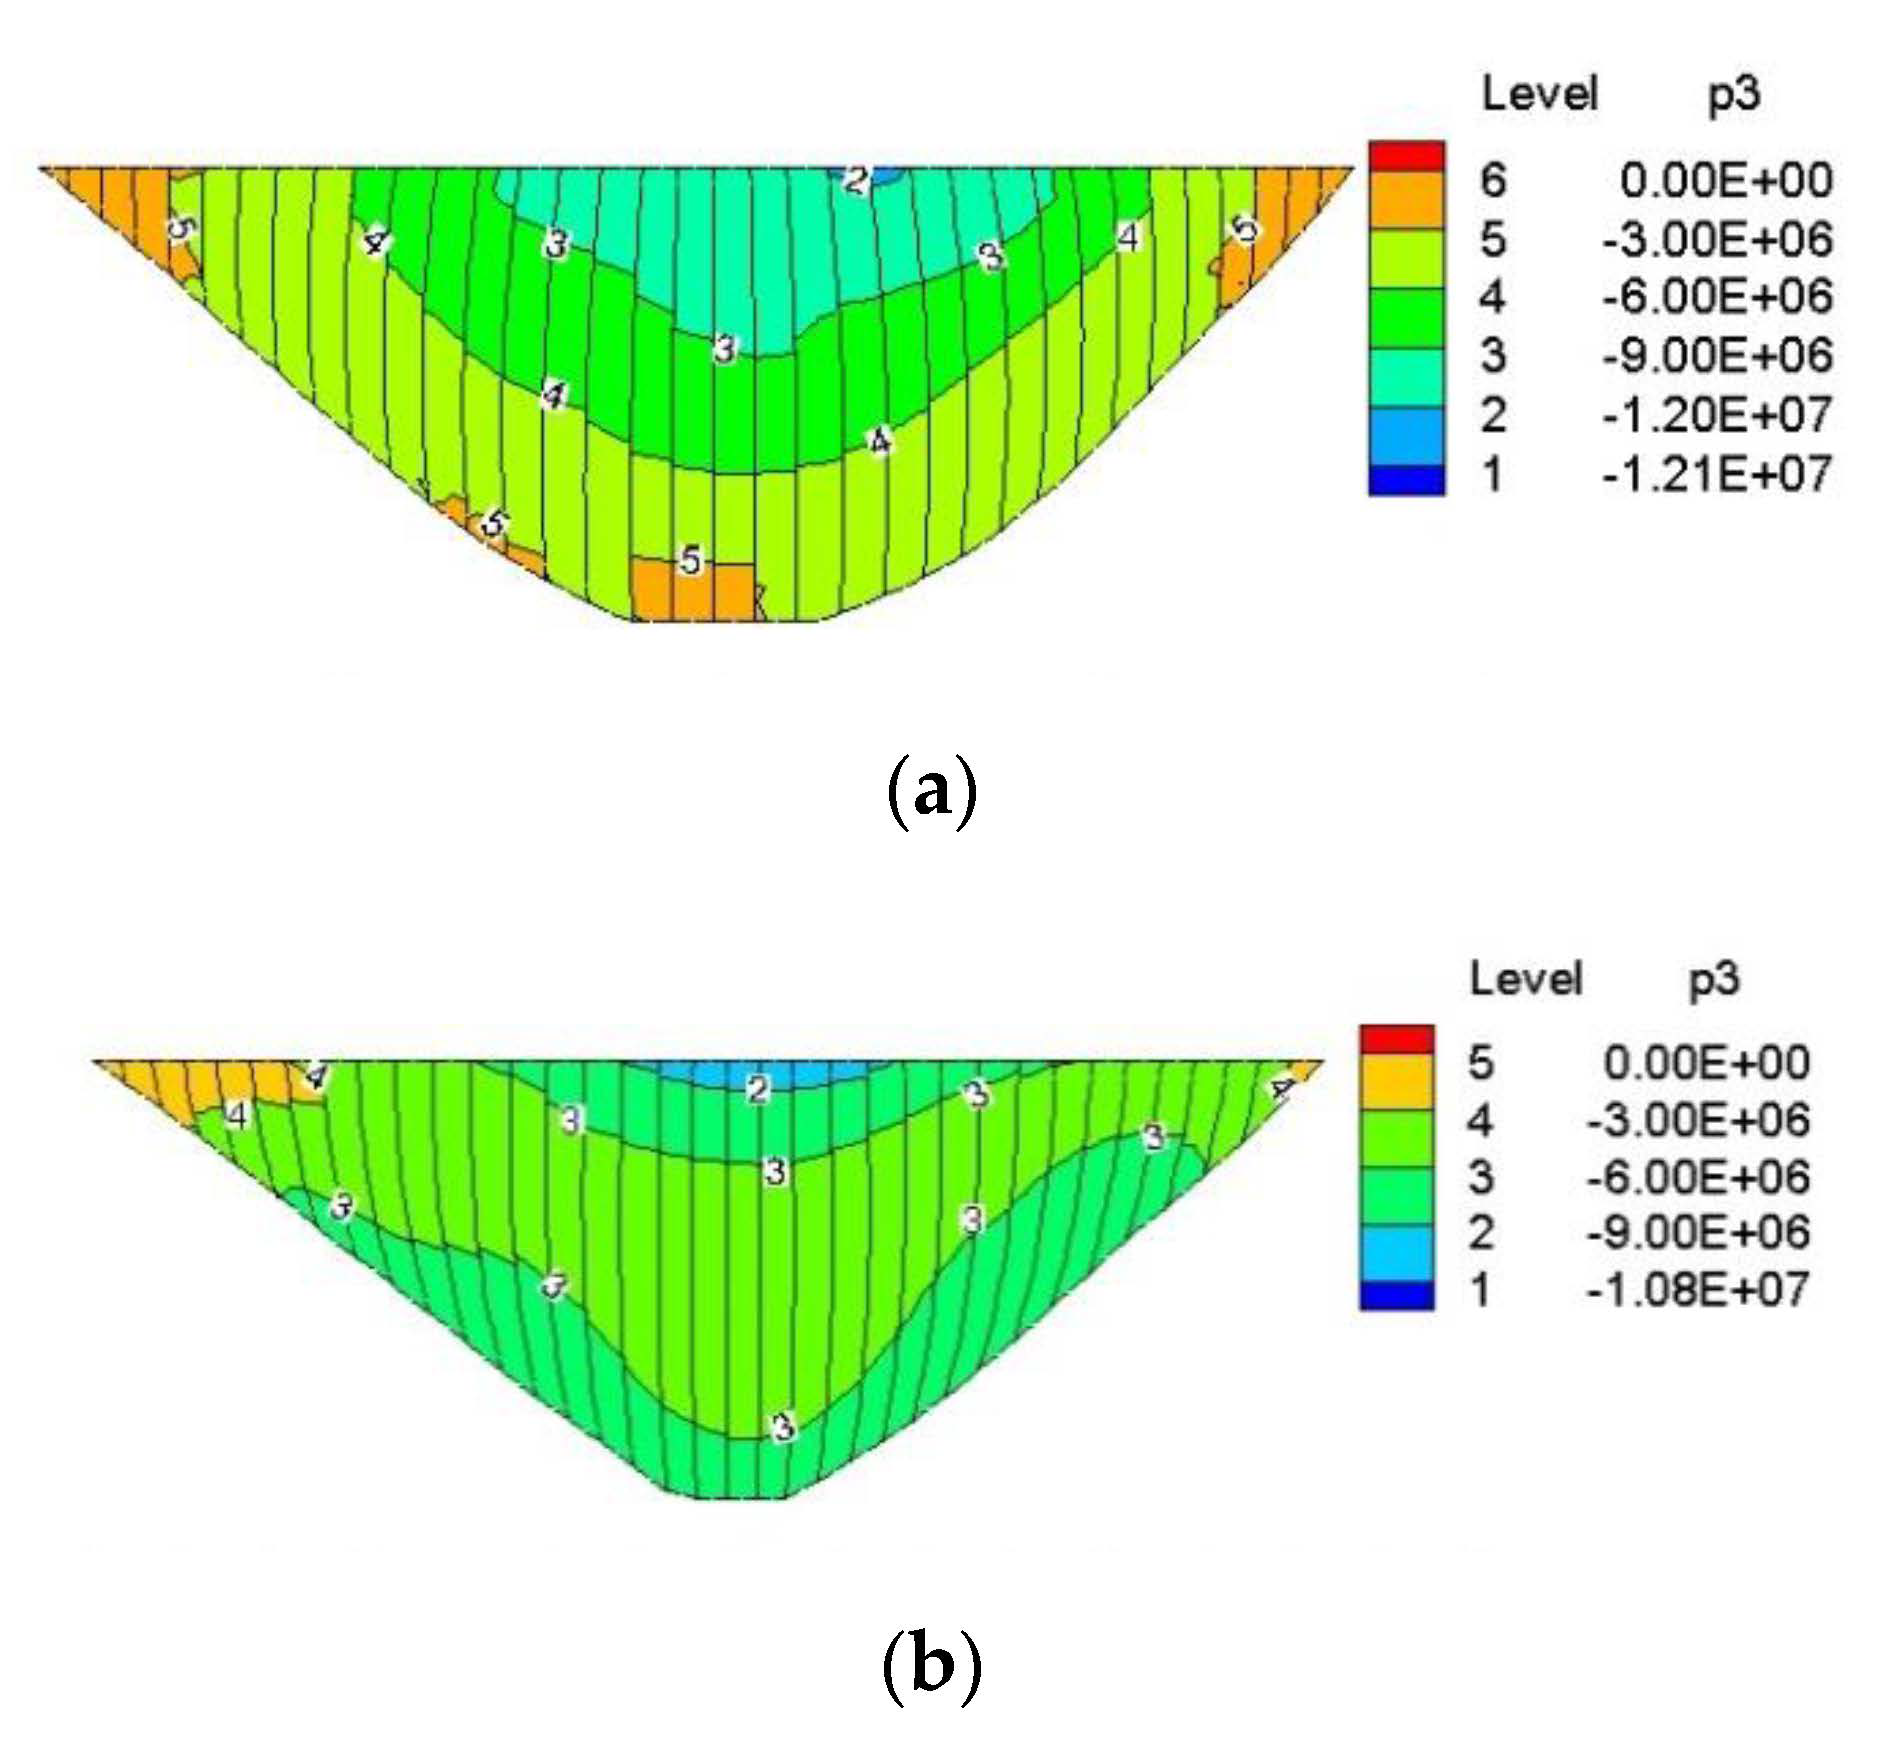
5.2. Dynamic Stress Distribution

Under the excitation from the design response spectrum in the new standard, as shown in Figure 4, the maximum tensile principal stress of the arch dam was 7.35 Mpa, which appeared at the upstream surface of the dam heel. The high stress zones appeared at the upstream surface of the dam heel and the middle and upper elevation of the downstream surface. The local ultra-high tensile stress zones (greater than the dynamic tensile strength of C40 concrete 4.89 Mpa) appeared at the upstream surface of the dam heel, which extended about 10 m from the bottom of the dam upward along the elevation direction, and about 1/4 of the section thickness of the dam body along the dam thickness direction. The tensile stress in other parts did not exceed the dynamic tensile strength of the concrete (4.89 MPa).
Under excitation from the design response spectrum in the new standard, as shown in Figure 5, the maximum compressive principal stress of the arch dam was 15.3 Mpa, which appeared at the top of arch crown beam. The high stress zones were mainly concentrated in the area near the top of the arch crown beam and the local area near the boundary of the dam–foundation at the middle and lower elevation.
Under excitation from the design response spectrum in the old standard, as shown in Figure 6, the maximum tensile principal stress of the arch dam was 5.19 Mpa, which appeared at the upstream surface of the dam heel. The distribution of the maximum tensile principal stresses were similar to those in Figure 4. However, the range of the high stress zones and the local ultra-high tensile stress zones were less than those in Figure 4.
Under excitation from the design response spectrum in the old standard, as shown in Figure 7, the maximum compressive principal stress of the arch dam was 12.1 Mpa, which appeared near the top of the arch crown beam. The distributions of the maximum compressive principal stresses were similar to those in Figure 5. However, the ranges of the high stress zone and the local ultra-high tensile stress zone were less than those in Figure 5.
As shown in Table 3, the maximum tensile principal stress of the arch dam using the design response spectrum in the new and old standards was 7.35 MPa and 5.19 MPa, respectively. The maximum compressive principal stress of the arch dam using the design response spectrum in the new and old standards was 15.3 MPa and 12.1 MPa, respectively. The maximum tensile and compressive principal stresses of the arch dam using the design response spectrum in the new standard were significantly increased compared with those using the design response spectrum in the old standard.

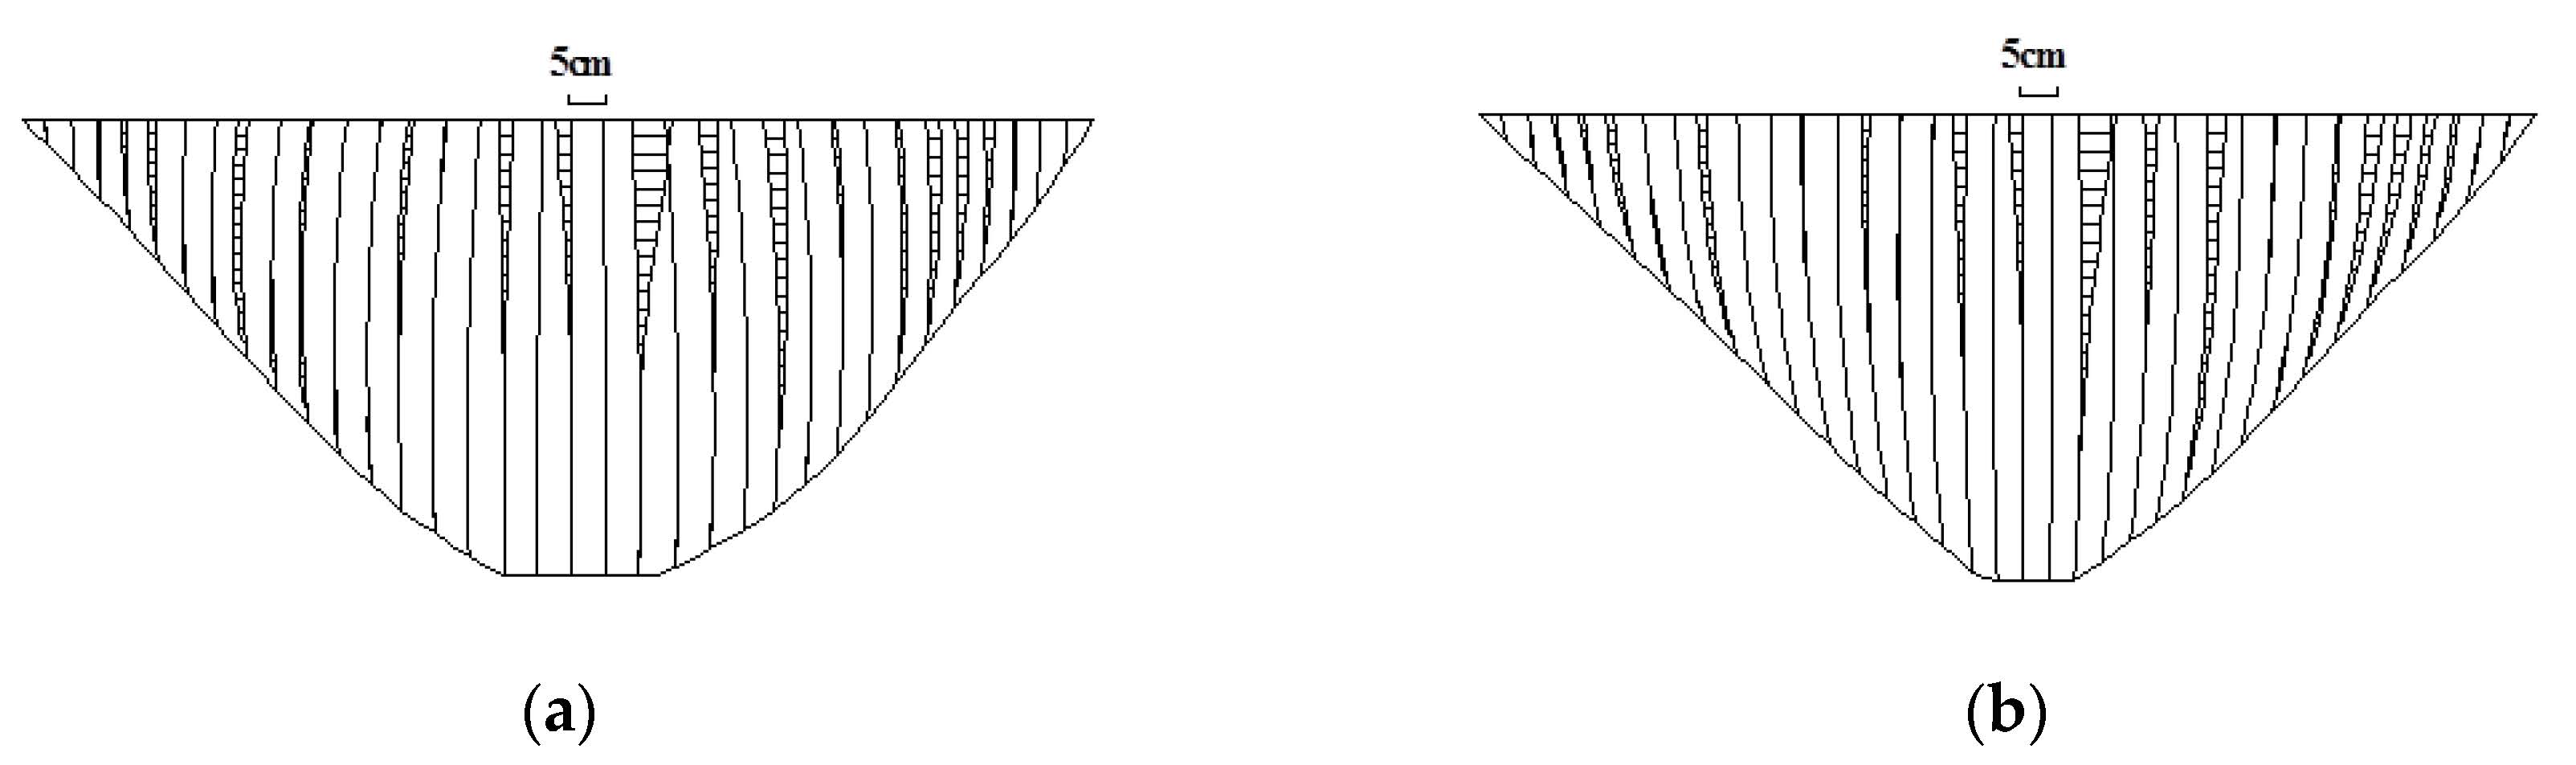
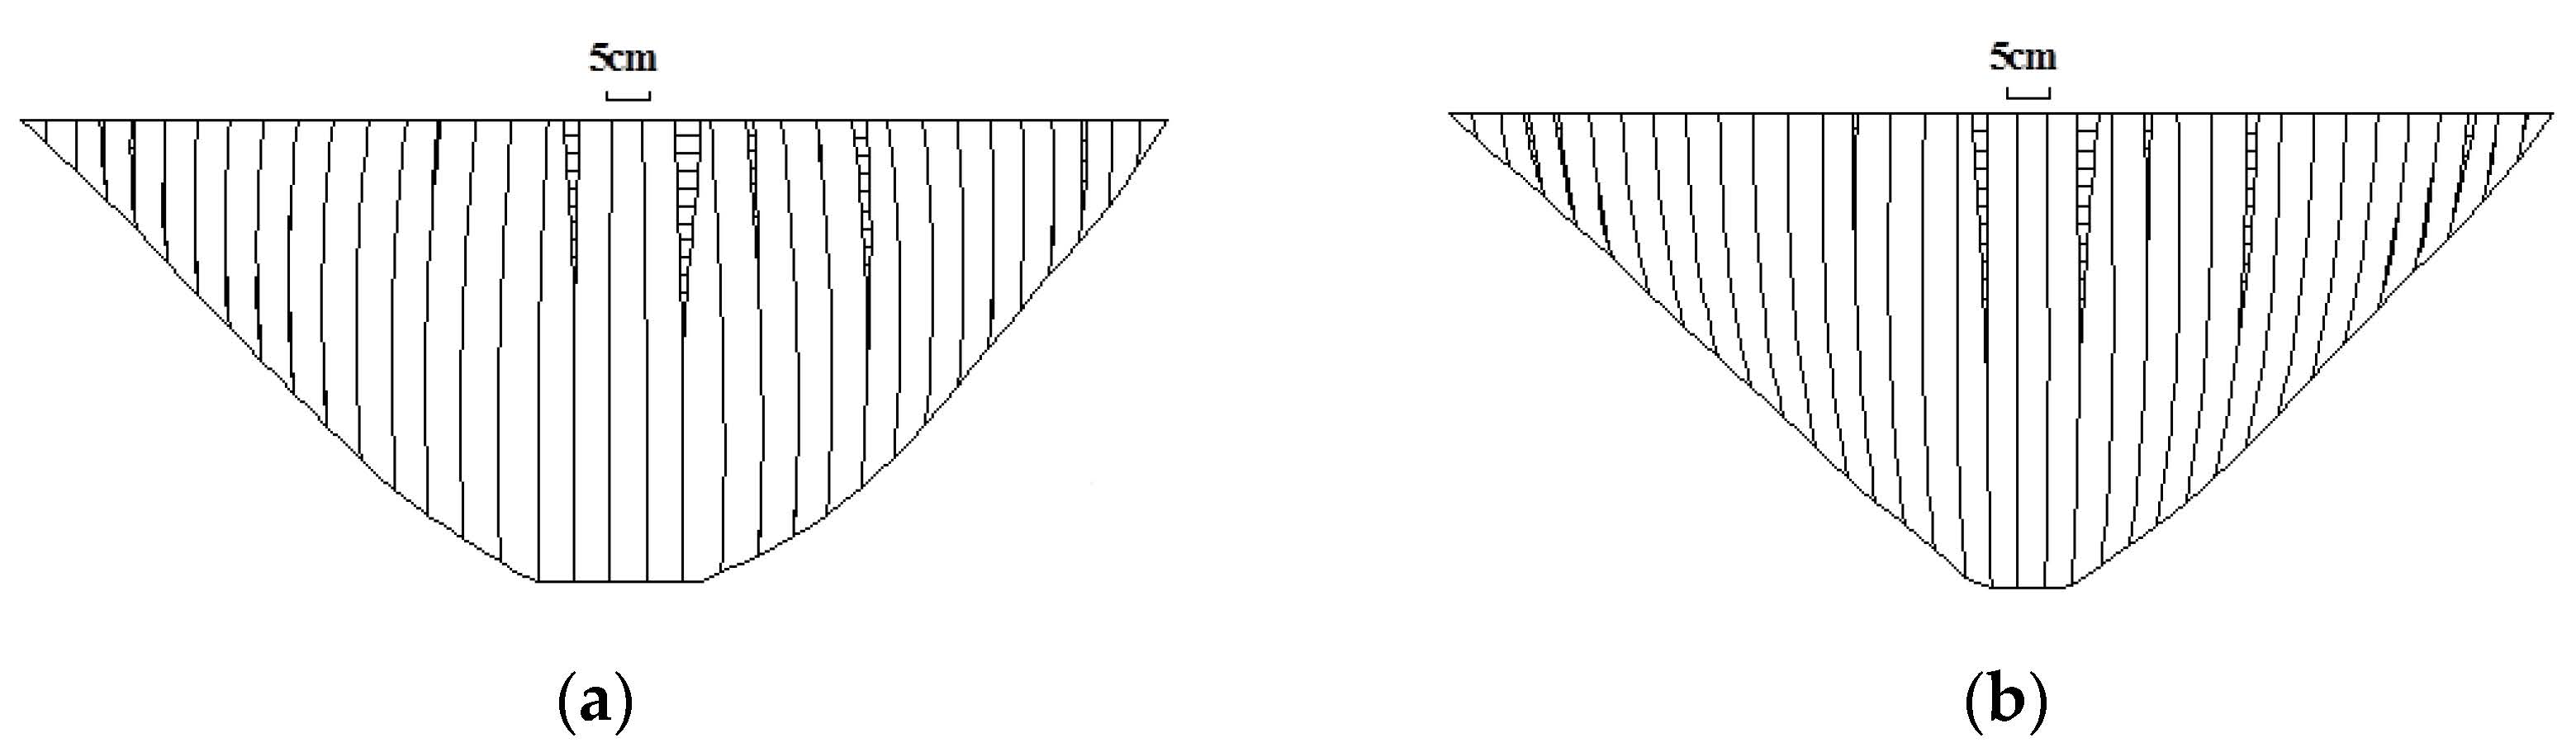
5.3. Contraction Joint Opening

As shown in Figure 8 and Figure 9, the ranges of the contraction joints opening zones under excitation from the design response spectrum in the new standard were greater than those under excitation from the design response spectrum in the old standard. The maximum values of the contraction joints opening under excitation from the design response spectrum in the new and old standards were 5.18 cm and 3.26 cm, respectively.

6. Conclusions

In order to compare the seismic responses of an arch dam under excitation from the design response spectrums in new and old standards, the dynamic calculation of a 240 m high arch dam was carried out by a 3D finite element method.
(1)
The differences between the design response spectrums in the new standard and the old standard were mainly reflected in the characteristic period Tg and the attenuation index γ for arch dams at a Class I site.
(2)
The high stress and ultra-high stress of the arch dam basically occurred at the same zone using the design response spectrum in the old and new standards. The dynamic responses including the maximum principal stress, the distribution range of high stress, the maximum value of the contraction joints opening, and the range of the contraction joints opening zone using the design response spectrum in the new standard were greater than those using the design response spectrum in the old standard.
(3)
The seismic safety of the arch dam may decrease under excitation from the design response spectrum in the new standard. Thus, seismic validation on the built arch dams should be carried out when possible.

Author Contributions

Conceptualization, B.X. and J.W.; methodology, B.X.; validation, N.L. and J.W.; formal analysis, B.X.; investigation, C.Z.; data curation, B.X.; writing—original draft preparation, B.X.; writing—review and editing, J.C.; visualization, B.X.; supervision, N.L.; project administration, J.W.; funding acquisition, B.X. and J.W. All authors have read and agreed to the published version of the manuscript.

Funding

This research was supported by the National Natural Science Foundation of China with grant No. 52109169, the Natural Science Foundation of Henan with grant No. 212300410279, the Open Fund of Engineering Research Center on Dike Safety and Disease Prevention of the Ministry of Water Resources with grant No. LSDP202103, and the Open Research Fund of Guangxi Key Laboratory of Water Engineering Materials and Structures, Guangxi Institute of Water Resources research with grant No. GXHRI-WEMS-2020-12.

Institutional Review Board Statement

Not applicable.

Informed Consent Statement

Not applicable.

Data Availability Statement

The data are available from the corresponding author upon request.

Conflicts of Interest

The authors declare no conflict of interest.

References

  1. GB 51247-2018; Standard for Seismic Design of Hydraulic Structures. China Planning Press: Beijing, China, 2018.
  2. SL 203-1997; Specifications for Seismic Design of Hydraulic Structures. China Water & Power Press: Beijing, China, 1997.
  3. Hariri-Ardebili, M.A.; Saouma, V.E. Probabilistic seismic demand model and optimal intensity measure for concrete dams. Struct. Saf. 2016, 59, 67–85. [Google Scholar] [CrossRef]
  4. Pang, R.; Xu, B.; Zhou, Y. Seismic time-history response and system reliability analysis of slopes considering uncertainty of multi-parameters and earthquake excitations. Comput. Geotech. 2021, 136, 104245. [Google Scholar] [CrossRef]
  5. Wang, X.; Xue, B.; Xu, B.; Pang, R. Role of strong motion duration on seismic responses of high concrete faced rockfill dams. Structures 2021, 32, 1092–1102. [Google Scholar] [CrossRef]
  6. Chen, H. Seismic safety of high concrete dams. Earthq. Eng. Eng. Vib. 2014, 13, 1–16. [Google Scholar] [CrossRef]
  7. Wang, R.; Chen, L.; Zhang, C. Seismic design of Xiluodu ultra-high arch dam. Water Sci. Eng. 2018, 11, 288–301. [Google Scholar] [CrossRef]
  8. Christensen, P.W.; Klarbring, A.; Pang, J.S.; Strömberg, N. Formulation and comparison of algorithms for frictional contact problems. Int. J. Numer. Methods Eng. 1998, 42, 145–173. [Google Scholar] [CrossRef]
  9. Lin, G.; Xue, B.; Hu, Z. A mortar contact formulation using scaled boundary isogeometric analysis. Sci. China Phys. Mech. Astron. 2018, 61. [Google Scholar] [CrossRef]
  10. Xue, B.; Du, X.; Wang, J.; Yu, X. A scaled boundary finite-element method with B-Differentiable equations for 3D frictional contact problems. Fractal Fract. 2022, 6, 133. [Google Scholar] [CrossRef]
  11. Liao, Z. Extrapolation non-reflecting boundary conditions. Wave Motion 1996, 24, 117–138. [Google Scholar] [CrossRef]
  12. Westergaard, H.M. Water pressures on dams during earthquakes. Trans. ASCE 1933, 98, 418–432. [Google Scholar] [CrossRef]
  13. GB 18306-2015; Seismic Ground Motion Parameters Zonation Map of China. China Standards Press: Beijing, China, 2015.
  14. Abrahamson, N.; Silva, W. Summary of the Abrahamson & Silva NGA Ground-Motion Relations. Earthq. Spectra 2012, 24, 67–97. [Google Scholar]
  15. Omidi, O.; Lotfi, V. Seismic plastic–damage analysis of mass concrete blocks in arch dams including contraction and peripheral joints. Soil Dyn. Earthq. Eng. 2017, 95, 118–137. [Google Scholar] [CrossRef]
  16. Khassaf, S.I. Effect of contraction joints on the structural performance of arch dam. Int. J. GEOMATE 2020, 19, 219–227. [Google Scholar] [CrossRef]
  17. Xu, Q.; Chen, J.; Li, J.; Zhao, C.F. Influence of seismic input on response of Baihetan arch dam. J. Cent. South Univ. Engl. Ed. 2014, 21, 2437–2443. [Google Scholar] [CrossRef]
  18. Pan, J.; Xu, Y.; Jin, F.; Wang, J. Seismic stability assessment of an arch dam-foundation system. Earthq. Eng. Eng. Vib. 2015, 14, 517–526. [Google Scholar] [CrossRef]
  19. Saouma, V.; Miura, F.; Lebon, G.; Yagome, Y. A simplified 3D model for soil-structure interaction with radiation damping and free field input. Bull. Earthq. Eng. 2011, 9, 1387–1402. [Google Scholar] [CrossRef]
  20. Chopra, A.K. Hydrodynamic pressures on dams during earthquake. J. Eng. Mech. Div. 1967, 93, 205–224. [Google Scholar] [CrossRef]
  21. Chen, H.; Hou, S.; Yang, D. Study on arch dam-reservoir water interaction under earthquake condition. J. Hydraul. Eng. 1989, 7, 29–39. (In Chinese) [Google Scholar]
Figure 1. Comparison of the design response spectrum in the new and old standards (Class I site).
Water 14 00832 g001
Figure 2. The FE model of the arch dam–foundation system.
Water 14 00832 g002
Figure 3. Distribution of the arch dam contraction joints.
Water 14 00832 g003
Figure 4. Envelopes of maximum tensile principal stresses using the new standard (Pa). (a) Upstream surface, (b) downstream surface, (c) section of arch crown beam, and (d) arch section at dam bottom elevation.
Water 14 00832 g004aWater 14 00832 g004b
Figure 5. Envelopes of maximum compressive principal stresses using the new standard (Pa). (a) Upstream surface and (b) downstream surface.
Water 14 00832 g005
Figure 6. Envelopes of maximum tensile principal stresses using the old standard (Pa). (a) Upstream surface, (b) downstream surface, (c) section of arch crown beam, and (d) arch section at dam bottom elevation.
Water 14 00832 g006
Figure 7. Envelopes of maximum compressive principal stresses using the old standard (Pa). (a) Upstream surface and (b) downstream surface.
Water 14 00832 g007
Figure 8. Envelopes of the contraction joint opening using the new standard (cm). (a) Upstream surface and (b) downstream surface.
Water 14 00832 g008
Figure 9. Envelopes of the contraction joint opening using the old standard (cm). (a) Upstream surface and (b) downstream surface.
Water 14 00832 g009
Table 1. Material parameters.
Parameter
Material
Mass Density (kg/m3)Elasticity Modulus (GPa)Poisson’s RatioLinear Expansivity (/°C)Thermal Conductivity (W/m·°C)Specific Heat (kJ/(kg·°C))
Concrete2400210.1671.0 × 10−53.0970
Bedrock II275513.50.241.0 × 10−52.67840
Bedrock III270010.00.261.0 × 10−52.67840
Table 2. The first 20 order frequencies and the corresponding vibration modes.
OrderFrequency (Hz)Vibration Mode in the Arch Direction
11.1960antisymmetry
21.3093symmetry
31.7188symmetry
42.2163antisymmetry
52.5623symmetry
62.7981symmetry
72.9636antisymmetry
83.2813antisymmetry
93.4350antisymmetry
103.5391symmetry
113.8739symmetry
124.1229symmetry
134.3710symmetry
144.6033antisymmetry
154.7468antisymmetry
164.8678antisymmetry
175.0934symmetry
185.3399antisymmetry
195.5150symmetry
205.6603symmetry
Table 3. The maximum tensile and compressive principal stresses.
MPSTS-US (MPa)TS-DS (MPa)TS-ACB (MPa)TS-DBE (MPa)CS-US
(MPa)
CS-DS (MPa)
Standard
New standard7.353.697.336.9415.311.8
Old standard5.192.085.194.8612.110.8
Notes: MPS means maximum principle stress; TS means tensile stress; CS means compressive stress; US means upstream surface; DS means downstream surface; ACB means arch crown beam; and DBE means dam bottom elevation.
Publisher’s Note: MDPI stays neutral with regard to jurisdictional claims in published maps and institutional affiliations.

