Article

Land Use Change to Reduce Freshwater Nitrogen and Phosphorus will Be Effective Even with Projected Climate Change

by
Andrew J. Wade
1,*,
Richard A. Skeffington
1,
Raoul-Marie Couture
2,
Martin Erlandsson Lampa
3,
Simon Groot
4,
Sarah J. Halliday
5,
Valesca Harezlak
4,
Josef Hejzlar
6,
Leah A. Jackson-Blake
7,8,
Ahti Lepistö
9,
Eva Papastergiadou
10,
Joan Lluís Riera
11,
Katri Rankinen
9,
Maria Shahgedanova
1,
Dennis Trolle
12,
Paul G. Whitehead
13,
Demetris Psaltopoulos
14 and
Dimitris Skuras
15
1
Department of Geography and Environmental Science, University of Reading, Reading RG6 6DW, UK
2
Département de Chimie, Université Laval, Québec, QC G1A 9A9, Canada
3
Länsstyrelsen Västmanlands län, 72211 Västerås, Sweden
4
Deltares, P.O. Box 177, 2600 MH Delft, The Netherlands
5
Department of Geography and Environmental Science, University of Dundee, Dundee DD1 4HN, UK
6
Biology Centre of the Czech Academy of Sciences, Institute of Hydrobiology, 37005 České Budějovice, Czech Republic
7
Norwegian Institute for Water Research NIVA, 0579 Oslo, Norway
8
The James Hutton Institute, Aberdeen AB15 8QH, UK
9
Finnish Environment Institute SYKE, FI-00790 Helsinki, Finland
10
Department of Biology, University of Patras, GR26500 Patras, Greece
11
Department of Evolutionary Biology, Ecology and Environmental Sciences, University of Barcelona, 08028 Barcelona, Spain
12
Department of Ecoscience, Aarhus University, 8660 Silkeborg, Denmark
13
School of Geography and the Environment, University of Oxford, Oxford OX1 3QY, UK
14
School of Economics, Aristotle University of Thessaloniki, GR54124 Thessaloniki, Greece
15
School of Economics, University of Patras, GR26504 Patras, Greece
*
Author to whom correspondence should be addressed.
Water 2022, 14(5), 829; https://doi.org/10.3390/w14050829
Submission received: 11 January 2022 / Revised: 15 February 2022 / Accepted: 26 February 2022 / Published: 6 March 2022

Abstract

:
Recent studies have demonstrated that projected climate change will likely enhance nitrogen (N) and phosphorus (P) loss from farms and farmland, with the potential to worsen freshwater eutrophication. Here, we investigate the relative importance of the climate and land use drivers of nutrient loss in nine study catchments in Europe and a neighboring country (Turkey), ranging in area from 50 to 12,000 km2. The aim was to quantify whether planned large-scale, land use change aimed at N and P loss reduction would be effective given projected climate change. To this end, catchment-scale biophysical models were applied within a common framework to quantify the integrated effects of projected changes in climate, land use (including wastewater inputs), N deposition, and water use on river and lake water quantity and quality for the mid-21st century. The proposed land use changes were derived from catchment stakeholder workshops, and the assessment quantified changes in mean annual N and P concentrations and loads. At most of the sites, the projected effects of climate change alone on nutrient concentrations and loads were small, whilst land use changes had a larger effect and were of sufficient magnitude that, overall, a move to more environmentally focused farming achieved a reduction in N and P concentrations and loads despite projected climate change. However, at Beyşehir lake in Turkey, increased temperatures and lower precipitation reduced water flows considerably, making climate change, rather than more intensive nutrient usage, the greatest threat to the freshwater ecosystem. Individual site responses did however vary and were dependent on the balance of diffuse and point source inputs. Simulated lake chlorophyll-a changes were not generally proportional to changes in nutrient loading. Further work is required to accurately simulate the flow and water quality extremes and determine how reductions in freshwater N and P translate into an aquatic ecosystem response.

1. Introduction

Freshwater eutrophication due to nitrogen (N) and phosphorus (P) over-enrichment is a major problem worldwide [1]. The eutrophication effects include biodiversity loss, changes in aquatic plant assemblages, and increased primary production, leading to oxygen depletion in rivers, lakes, and wetlands through the microbial decomposition of dead plant matter. The increased nutrient flux from rivers to the sea can also cause estuarine and coastal eutrophication [2].
N and P over-enrichment is associated with farm and farmland runoff and wastewater effluent discharges, and N deposition can be important in upland areas [3]. Therefore, land use change will affect eutrophication trajectories through changes in nutrient inputs, source areas, and transport pathways [4]. Climate change threatens to worsen eutrophication through increased precipitation intensity, increasing nutrient loss, and lower summer precipitation, causing lower flows which, in turn, reduce effluent dilution [5,6,7].
National and international policy has been implemented to reduce eutrophication, with emphasis on measures for farm and farmland nutrient source control and transport limitation and wastewater treatment. To inform policy development, multiple assessments of the integrated impact of climate and land use change on eutrophication are needed to determine the effectiveness of measures for nutrient source reduction and catchment retention, given projected changes in precipitation and air temperatures, with such assessments accounting for hydrological change [5,6,8]. The evidence from model-based assessments of eutrophication trajectories for different climate and land use scenarios continues to grow and includes studies focused on individual catchments [9,10], with the recent consideration of detailed sediment and phosphorus transport processes in small (<50 km2) catchments and regional and global-scale assessments of total nitrogen (TN) and total phosphorus (TP) fluxes using empirical and process-based models [11,12,13,14]. Collectively, these studies demonstrate that major agricultural changes are needed to reduce freshwater nutrient inputs, though uncertainty remains about the precise magnitude of the changes needed, especially in large catchments with a mix of nutrient sources and delivery pathways [4,11,15]. Furthermore, it is uncertain if plans to reduce nutrient loss will remain effective under projected climate change. Thus, the aim of this study was to quantify how the catchment-based changes, envisaged by stakeholders in nine study areas across Europe and Turkey (referred to hereafter as the ‘study region’; Figure 1) in response to four socio-economic storylines, would alter river and lake N and P concentrations and lake chlorophyll-a (chl-a) concentrations, given projected climate change. The purpose is to provide an assessment of whether land use changes, proposed by stakeholders in catchments representative of key land use types in Europe and Turkey, will be effective to reduce stream and lake N and P concentrations and lake chl-a concentrations or whether climate-induced changes in water availability or flow pathways change will confound the effects from the proposed land cover change. To achieve the study aim, four objectives were defined:
  • To apply, and assess the performance of, process-based, dynamic catchment water quality models at nine sites for the simulation of daily river flow, nitrate (NO3-N), and total phosphorus (TP), as well as the soluble reactive phosphorus (SRP) concentrations in rivers and lakes and the lake chl-a concentrations.
  • To quantify how climate change alone will affect river N and P concentrations and loads, using the current land cover (business as usual) and the down-scaled outputs of three Global Circulation Model-Regional Climate Model combinations, driven by the A1B scenario, to provide projections of future climate (2031–2060) representative of an ensemble mean and extremes.
  • To quantify how four scenarios of climate, land use, N-deposition and water use change would affect river N and P concentrations and loads.
  • To quantify the effect of the four scenarios on lake chl-a concentrations for five of the study areas, which include major lakes.
The 2031–2060 period was chosen as the future period of interest, thought to be sufficiently far into the future for discernable climate and land use change effects, yet not so far into the future that agricultural changes were unrelated to current technologies.
Through consideration of medium (50 km2) to large (c. 10,000 km2) catchments, the study investigates how different nutrient sources and transport pathways dominate in larger catchments and whether different land cover changes might be effective to reduce nutrient loss in different geographic settings [14]. All model applications were performed using a common modelling framework to provide consistency in the model performance assessment and scenario application [17]. The models used account for N and P retention in the river system through storage in groundwater and accumulation in the soil and bed sediment (i.e., legacy P). With respect to the ecological consequences of eutrophication, silica and the ratio of silica to P have been observed to control diatom growth and the balance between diatoms and blue-green algae in phytoplankton assemblages [18]. However, silica is not considered in this study as the focus is on understanding the links between climate and land use change and the N and P response as a first step, and the silica data are not yet as extensive as those for N and P.

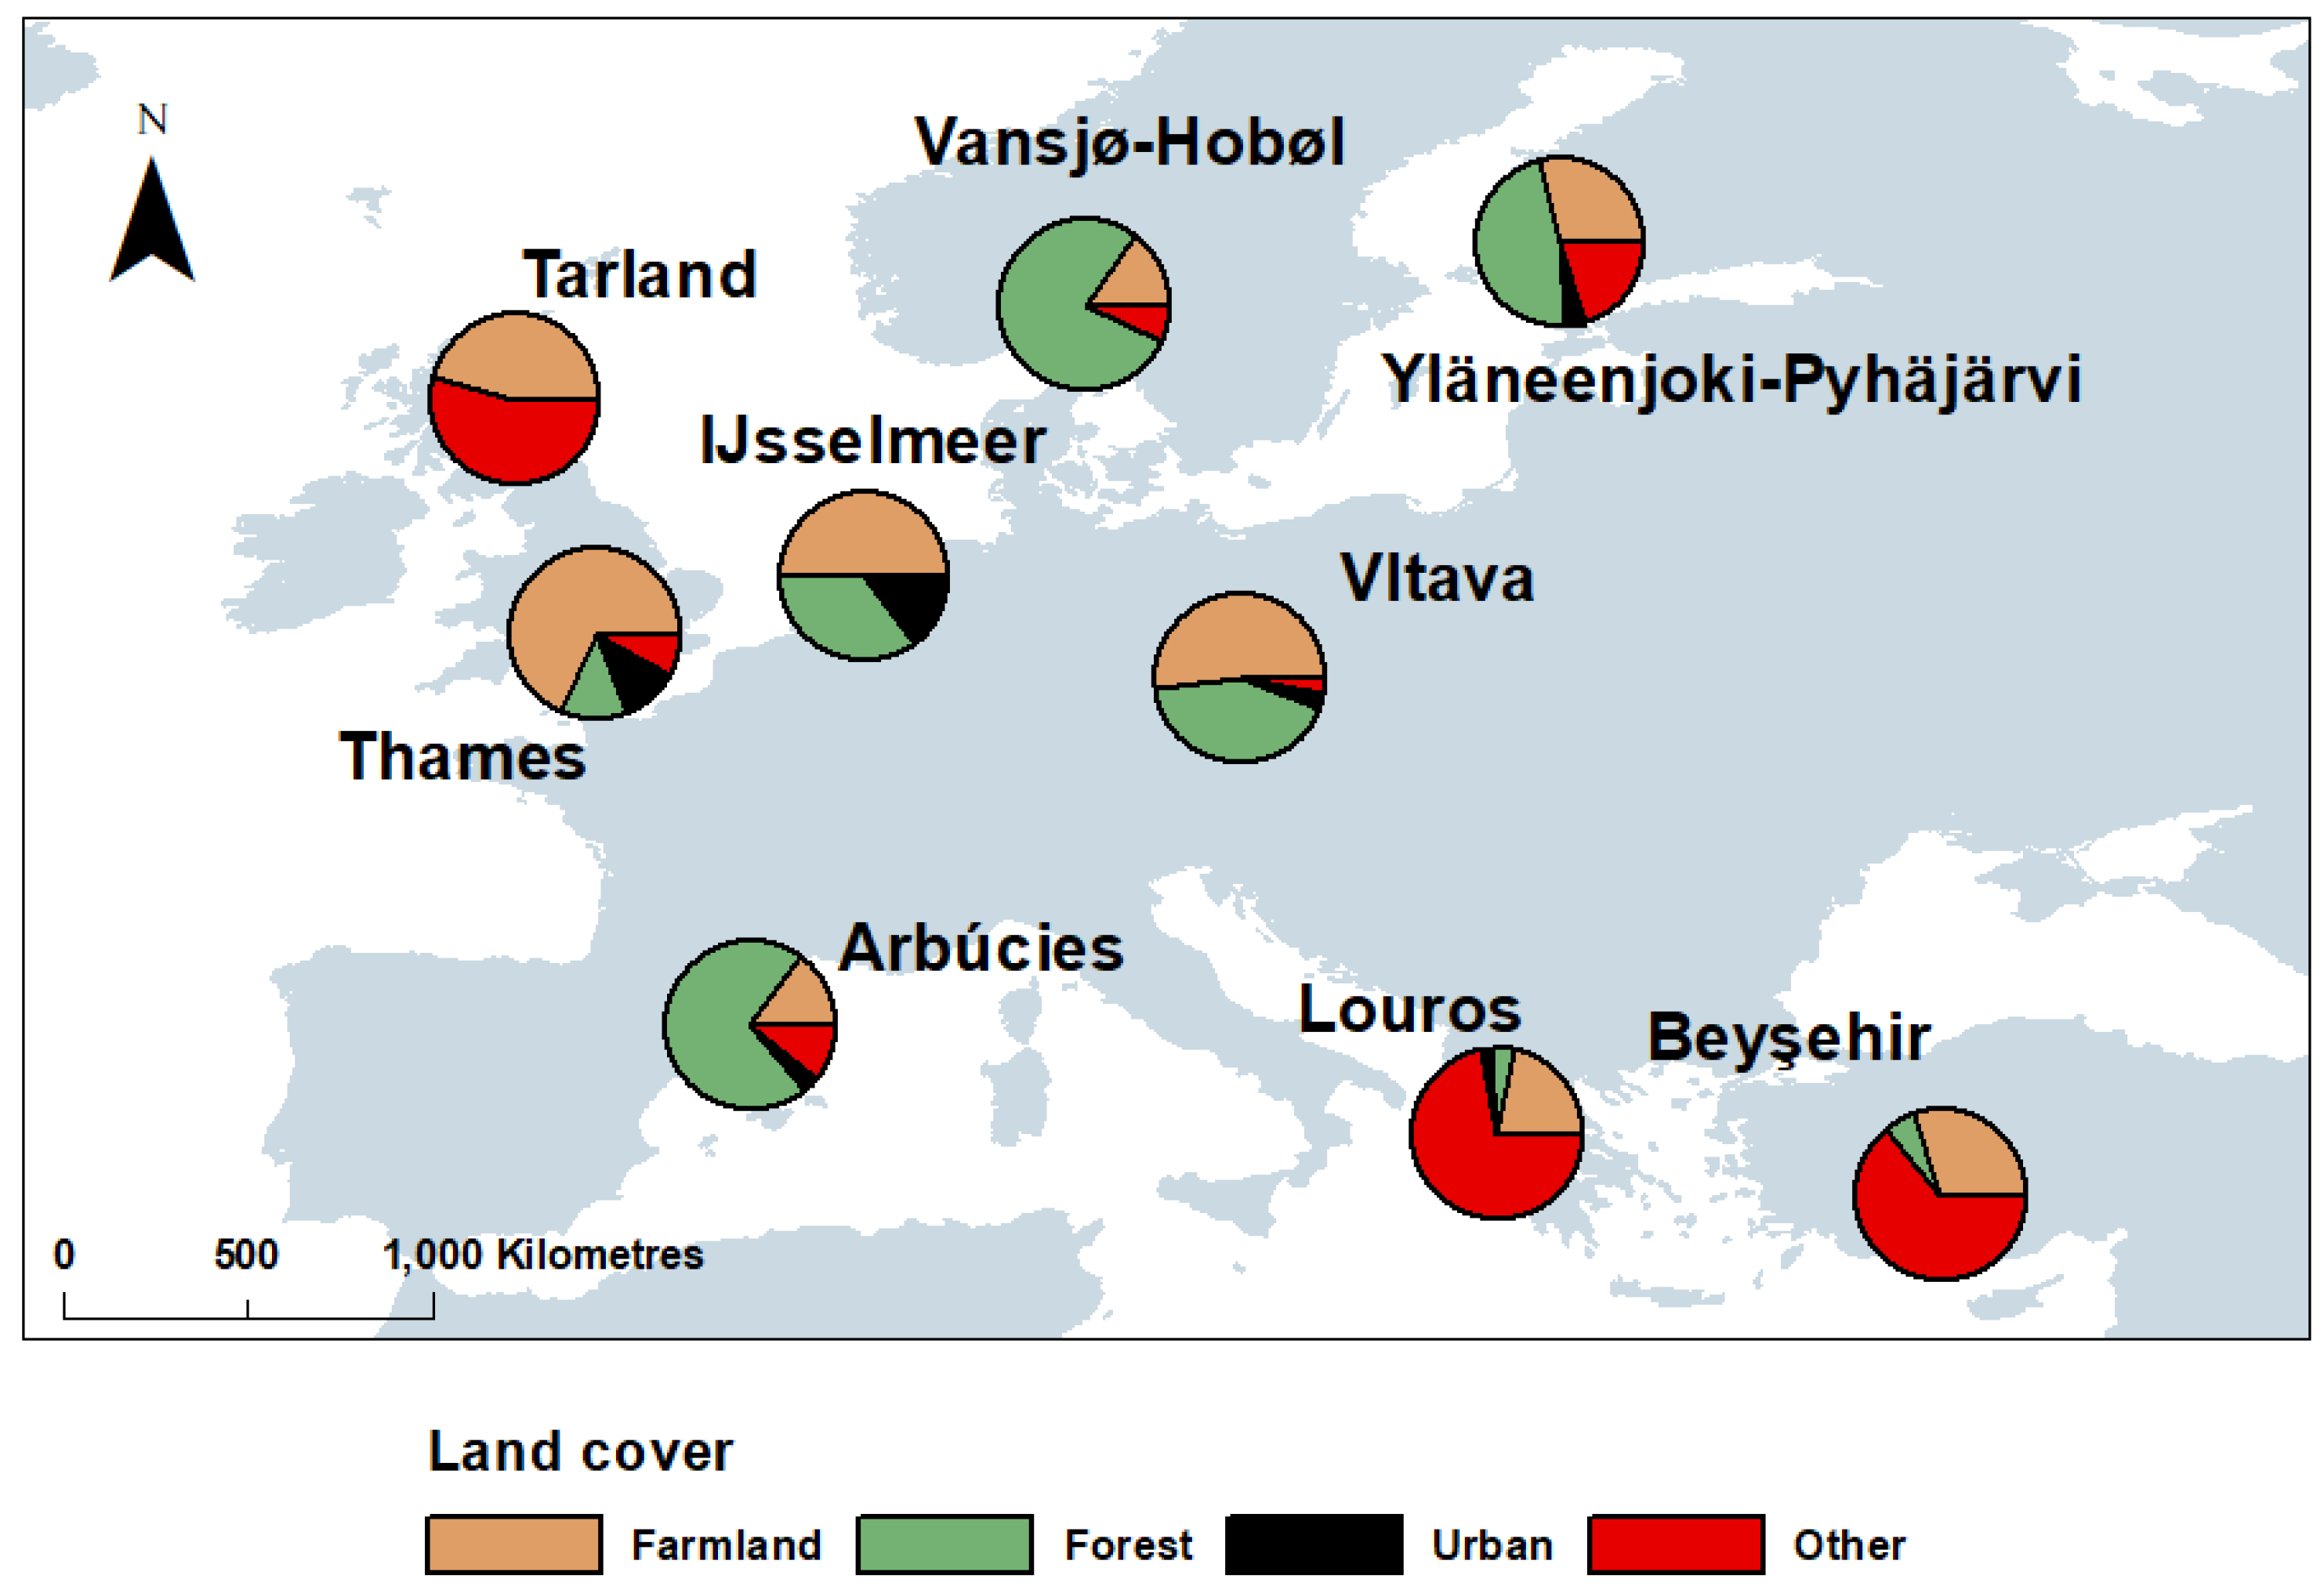
2. Study Areas and Observational Datasets

Nine study sites were used to represent the climate and land-management types found across the study region, and whilst this is not an exhaustive representation of the all the different land use types present, it represents a trade-off between the resources available to perform the work and the study of the key catchment types found from north to south (Figure 1; Table 1, Table 2 and Table 3). Eight catchments were chosen because they had been studied previously and had both significant datasets and previous model applications (i.e., Yläneenjoki, Hobøl, Tarland, Thames, Vltava, Arbúcies, and Beyşehir), or had been the focus of socio-economic studies of catchment interventions to reduce freshwater nutrient concentrations (i.e., Louros). Of the nine sites, the stream water N and P concentrations and loads were modelled in eight catchments (i.e., all except IJsselmeer), and of these eight, four of the catchments included lakes (Table 3). The lake N, P, and chl-a concentrations were modelled for these. IJsselmeer was included as one of Europe’s largest lakes with extensive algal and zooplankton monitoring and because a lake model was already set-up [19]. However, simulating the effect of land use change in the River Rhine, which flows into IJsselmeer via the River Ijssel, was beyond the project resources and the input N and P concentrations under the scenarios of land cover change were used from a previous project [16,19]. Across the nine sites, the NO3-N concentrations were higher in the north than the south, and these correlate weakly and non-significantly with the percentage of arable agriculture (Spearman’s, r = 0.37, n = 6, p = 0.25); stream water TP concentrations also correlated weakly with the percentage of arable agriculture (r = 0.37, n = 5, p = 0.23).

2.1. Yläneenjoki-Pyhäjärvi

Lake Pyhäjärvi (154 km2) is a large, shallow, mesotrophic lake in SW Finland with a mean depth of 5.5 m and a deepest point of 26 m (Figure 1; Table 1). The lake is used for water supply and recreation, and increased eutrophication of the lake has been a major concern since the late 1980s as cyanobacteria blooms have become more frequent. Two major rivers, the Yläneenjoki and the Pyhäjoki, discharge into the lake. The Yläneenjoki river basin is considerably larger (233 km2) than the Pyhäjoki (78 km2) and is considered in this study (Table 1). The land use in the Yläneenjoki is mainly managed forest, arable (spring cereals and root crops), and grassland agriculture.
Regular monitoring of the water quality of the river Yläneenjoki started in the 1970s. The nutrient load into Lake Pyhäjärvi via the river has been estimated from the (generally) fortnightly water sampling results and daily water flow records at the Vanhakartano measuring site. The water quality was monitored on a monthly basis at three additional points in the main channel in the 1990s and in 13 tributaries flowing into the Yläneenjoki [22].

2.2. Vansjø-Hobøl

The Vansjø-Hobøl catchment (690 km2) in southeastern Norway is in one of Norway’s most agricultural regions. This, together with P-rich clay soils, has led to a long history of eutrophication and problematic cyanobacteria blooms in lake Vansjø, the main lake in the catchment. The Hobøl River is the main tributary to Lake Vansjø (sub-catchment 301 km2). Lake Vansjø is used for drinking water and hydropower generation and is an important recreational area. The lake has a surface area of 36 km2 and consists of several sub-basins, the two largest being Storefjorden (eastern basin) and Vanemfjorden (western basin; Table 1 and Table 2). The Storefjorden basin flows into the Vanemfjorden basin through a shallow channel and, ultimately, the Vansjø-Hobøl catchment discharges into the Oslo Fjord.
The observed daily meteorology data for Lake Vansjø were obtained from the Norwegian Meteorological Institute from stations located between Vanemfjorden and Storefjorden. The daily flow data were obtained from the Norwegian Water Resources and Energy Directorate, NVE) gauging station at Høgfoss.
The river TP and suspended sediment data are monitored downstream of Høgfoss, at Kure [34]. For the Vanemfjorden and Storefjorden lake basins, water chemistry data and temperature profiles are monitored by Bioforsk and NIVA and available via https://vannmiljo.miljodirektoratet.no/ (last accessed on 10 January 2022). Land use mapping for the Vansjø-Hobøl catchment was provided by the Norwegian Forest and Landscape Research Institute and complemented by a report on the fertilization regimes of agricultural fields [35]. The historical nutrient outputs from the sewage treatment plants were obtained from the online database KOSTRA (http://www.ssb.no/offentlig-sektor/kostra, accessed on 10 January 2022). P loadings from scattered dwellings were taken from an online GIS information system maintained by Bioforsk (http://www.bioforsk.no/webgis, last accessed on 10 January 2022). The land use of the Vansjø-Hobøl catchment is dominated by forestry (78%) and agriculture (15%), predominately cereal production (89%), with a smaller production of grass (9.8%) and vegetables (0.7%). Together, agricultural practices contribute an estimated 48% of the total P input to the river basin, followed by natural runoff (39%), and wastewater treatment plants (WWTPs; 13%) [23].

2.3. Tarland Burn

The Tarland Burn tributary drains the most westerly area of intensive agriculture in the River Dee catchment, northeast Scotland. The catchment has an area of approximately 74 km2 and the stream itself is around 17 km long. In 2008, the Tarland Burn was classified as being of ‘moderate’ ecological status, primarily due to morphological alterations, namely channel straightening and resultant loss or degradation of habitat. Water quality is also of concern, primarily due to diffuse inputs of nutrients and sediments from agriculture. Agriculture in the tributary comprises a mosaic of arable and grassland, including beef cattle, sheep, barley, and small areas of other crops. The village of Tarland has a wastewater treatment works (600-person input), and septic tanks are common. The Tarland has been the focus of the Tarland Catchment Initiative since 2000. The initiative aims to provide a scientific assessment of the efficacy of the various measures used to improve the aquatic and riparian habitat, as well as build relationships with landowners and the local community.
For model calibration and testing, routine Scottish Environmental Protection Agency (SEPA) monitoring data from Aboyne, near the catchment outflow, were supplemented by data gathered by the James Hutton Institute (JHI; formerly Macaulay Institute) as part of the Tarland Catchment Initiative. The discharge data were available at Aboyne from 2003 to 2013 (SEPA) and from Coull, in the centre of the catchment, from 2000 to 2013 (JHI data). At Coull, daily and sub-daily (during storm events) water chemistry samples were gathered for the period February 2004–June 2005. Fortnightly/monthly/bi-monthly frequency sampling took place during the rest of the period of 2004–2010, both at Coull and at other points within the catchment, including at SEPA’s routine monitoring site at Aboyne. Hourly data were converted to daily means for hydrology and water quality model calibration and testing [26].

2.4. River Thames

The River Thames is the principal river system in southern England and provides the main water supply for London and drains an area of approximately 10,000 km2. The river source is at Cricklade in the Cotswold Hills and the freshwater boundary downstream at Teddington, below which the Thames discharges into the North Sea. The bedrock geology varies from high-permeability chalk to low-permeability clays. The catchment is predominantly rural in the upper reaches and becomes more urban further downstream. It is heavily farmed, with approximately 36% of the catchment used for intensive agriculture, and densely populated.
The water quality is characterised by high pH and high base cation concentrations where chalk aquifers are present. The mean annual flow (1999–2008) ranges from about 1.5 m3 s−1 at Cricklade in the headwaters to 66 m3 s−1 at Teddington. Seasonally, high flows normally occur in the winter and early spring (January to April) and low flows in the summer and late autumn (July–November), with a significant groundwater component. Mean rainfall for the catchment is approximately 700 mm year−1 (1961–1990 record) at Teddington. Daily stream flow is measured at eight sites, and monthly stream water NO3-N and SRP concentrations are measured at 17 sites on the main river channel. Data from 2001–2008 were used for the model calibration and testing [10,36]. The river is eutrophic with significant algal blooms.

2.5. IJsselmeer

Lake IJsselmeer is the largest shallow lake in western Europe and was constructed by the cutting off of the South Sea from the open ocean in 1932. Lake IJsselmeer provides fresh water supply, recreation and fisheries and is classified as a NATURA 2000 site. The lake has a surface area of approximately 1140 km2 and a mean depth of 4.5 m, but with some gullies of approximately 10 m. The river IJssel, a distributary of the River Rhine with an average discharge of 300 m3 s−1, is the main water input and the lake discharges to the Wadden Sea through two sluices in the Afsluitdijk. The hydrodynamics of the lake are wind-dominated. The retention period of the lake is approximately 3 to 4 months, and the water-level is relatively stable at 20 and 40 cm below sea level during summer and winter, respectively [19].
Data from the National Surface Water Monitoring Program were used, including data on the daily river discharges and the nutrient concentrations (biweekly) to Lake Ijsselmeer and from Ketmwt, Steilbk, and Vrouwzd from 2000 to 2013. Data from the water boards also include direct discharges from wastewater water treatment plants and pumping stations to the lake. Daily meteorological data were available daily from 1950 (precipitation and temperature) and 1975 (radiation) to 2013.

2.6. Vltava-Orlík

The upper River Vltava catchment (12,116 km2) extends from the border mountain range of the Bohemian Forest between the Czech Republic, Austria, and Germany to the Orlík Reservoir, situated approximately 70 km south (and upstream) of Prague [28]. The landscape is characterized by numerous artificial reservoirs. Most are shallow and were created in the Middle Ages/early Modern Ages for fish production. Four large and deep hydropower, water supply, and flood protection reservoirs were constructed by damming the Vltava River and its tributaries during the second half of the 20th century (Lipno, Orlík, Římov, and Hněvkovice). The bedrock of the catchment is mostly gneiss, mica-schist, and granite. The main land cover classes are farmland, forest (>80% of Norway spruce plantation), and urban area (Table 1), with farmland dominance (60%) below an elevation of 600 m, and forest dominance (88%) at elevations greater than 900 m. The water quality of the Vltava River has suffered from high P loading, mainly from point sources (WWTPs), and from diffuse sources from agriculture and fishpond fisheries production. Exceedance of the phosphorus concentration standards is the largest single reason for Czech water bodies not reaching good ecological status as defined in the EU Water Framework Directive (WFD).
Land cover was determined from the current database of the Czech Republic (ZABAGED, www.cuzk.cz, last accessed on 10 January 2022) and LANDSAT 7 ETM+ satellite images (for 2007–2009). Land management (fertilization rate, livestock numbers, and crop yields) and demographic data (population and wastewater discharges) for the period 1950–2010 were obtained from the Czech Statistical Office, with mean values at the district level (approximately 1500 km2).
Daily hydrological data at the Orlík, Lipno, and Římov reservoirs (period 1961–2010) and at 30 additional hydrological stations (10 to 25 years of data) were obtained from the Czech Hydrometeorological Institute and the Vltava River Basin Authority. Daily climate data were obtained from the Czech Hydrometeorological Institute for the period of 1961 to 2010 for eight stations spread across the catchment. Monthly water quality data were obtained from the Institute of Hydrobiology BC AV CR (BCAS) and from the Czech Republic (CR) State Surface Water Quality Monitoring System. The BCAS datasets include long-term monitoring data at the Římov and Lipno reservoirs. The CR datasets include 25 stations distributed across the catchment with monthly sampling for 1975–2010. In addition, the data from 194 stations for 2000 to 2009 are available from the Vltava River Basin Authority. Atmospheric deposition data were derived from BCAS monitoring for the upper mountainous part and the lower part.

2.7. Arbúcies

The Arbúcies river, a tributary of the La Tordera river, is situated by the coast of Catalunya in northeast Spain, approximately 55 km northeast of Barcelona in the Montseny mountain range (Figure 1). The Arbúcies (catchment area of 112 km2) is approximately 28 km long. Its headwaters in the west, at Font de Regàs, emerge from numerous springs, from which water is bottled and commercially sold. At the small town of Arbúcies (6700 inhabitants), around halfway down the river, a small sewage treatment plant discharges into the stream and overflows of untreated sewage occur during heavy rainstorms when treatment capacity is exceeded. The western part of the catchment is occupied by the Montseny National Park, a biosphere reserve which has been protected since 1978. The large altitudinal difference creates a mosaic landscape, with Mediterranean tree species prevailing at lower altitudes and a sub-alpine climate with typically Central European species and heather (Calluna vulgaris) heathlands at higher altitudes. The bedrock in the area is mainly granitic. The catchment is mostly semi-natural, with 80% of it forested (predominantly evergreen broadleaf). Agricultural areas are mainly near the river in the valley plains, and a small (5 km2) extended plain at the bottom of the catchment, near the confluence with La Tordera, comprises more than half of the total agricultural area in the catchment [29]. Infiltration in the stream bed can occur during the dry summers, causing the stream channel to dry out.
There is one gauging station approximately 3 km upstream of the confluence with La Tordera where flow was measured daily from October 1994 to March 2011. There are three Catalan Water Agency (ACA) sites with chemistry observations in the catchment, including NO3-N, NH4+-N, and PO43−-P concentrations. Between 1995 and 2006, samples were taken at a site at Hostalric, near the confluence with La Tordera. The sampling frequency was irregular, approximately monthly during the period of 1995–2002 and seasonally from 2003 to 2006. In 2007, the sample site was moved to the gauging station, and an additional, new site located 3 km upstream of the Arbúcies was started. These sites were sampled seasonally from 2007 to 2011. Each sample was analysed for NO3-N, NH4+-N, and phosphate (PO43−-P) and also for TP for the period of 2000–2006.

2.8. Louros

The Louros river (977 km2) is a Mediterranean river situated in the Epirus region in the western part of the Greek mainland (Figure 1). The river emerges from a spring-fed lake (Terovo, 300 masl) near the mountain of Tomaros, which has an elevation of almost 2000 masl. The river is fed by numerous springs on its course to the sea, the largest one being close to the village of Agios Georgios, approximately halfway to the outlet. Downstream of Agios Georgios is a small hydroelectric dam. The river then flows through an agricultural plain before it discharges in the Amvrakikos Gulf, a Ramsar and Natura 2000 site. The approximate total length of the river is 73 km, and the mean annual discharge is approximately 24 m3 s−1. The catchment is largely rural and relatively sparsely populated; the largest settlements are the towns of Fillipiada (8400 inhabitants) and Louros (5200 inhabitants). A large part of the catchment is mountainous with steep slopes and sparse vegetation, but a substantial part of the lowland is arable land. The Louros provides water for irrigation of about 120 km2 of cultivated land. In the region, more than 100 large and small agriculture industries and fish farms are operating. Water is also taken for drinking water supply and industrial uses. It receives treated domestic effluent and effluent from light industrial activities, including meat processing, abattoirs, and pig farms, and a small quantity of olive mill wastewater, mostly during the autumn and early winter months [30].
The only available discharge data is from a dam outlet from a hydroelectrical power plant. From the dam, the water outflow is regulated by a sluice, from which the water flows to the plant turbines. Dam overflow typically happens once or a few times each year, and the recorded discharge is the sum of the flow through the turbines and the dam overflow. Discharge here is thus partly regulated by the capacity at which the power plant is operating. However, the dam is shallow and has limited storage capacity (an approximate retention time of one day) and therefore provides a reasonable approximation of river flow.
For the water chemistry observations, different data sources were available from agencies and the scientific publications and projects of the University of Patras, Department of Biology (UPAT-BIO). The data are from a number of sites, generally with sampling at monthly to seasonal frequency and for a maximum of 3 years for any given site [30,37].

2.9. Beyşehir

Lake Beyşehir is the largest freshwater lake in Turkey. The lake is located in the southwest of the country (Figure 1) and is primarily fed by waters from the Sultan and Anamas mountains. The relatively high-altitude (1050–3000 masl) catchment (area 4600 km2, consists mostly of range land (48%) and agriculture (30%), the latter mostly wheat, barley, chickpeas, or sugar beet. The trophic status of the lake is within an oligotrophic to mesotrophic range, with low phytoplankton biomass and nutrient concentrations [31]. The lake is used for irrigation and aquaculture and is a national park.
Few discharge or water chemistry data were available for the lake, and so, these were collected as part of this study. Daily discharge was measured in five tributaries from May 2010 to April 2012, supplemented with monthly data from 1995–2001. For both main tributaries and in-lake stations, conductivity, total dissolved solids estimate (TDS), pH, dissolved oxygen, temperature, and salinity were measured in the field using a YSI 556 MPS multi-probe field meter (YSI Incorporated, Yellow Springs, OH, USA). Water samples from 14 tributary channels (13 inflows and one outflow) and from two stations within the lake were collected to measure monthly TN, nitrite-nitrate (NO2-NO3 as N), (NH4+-N), TP, SRP, alkalinity, and total suspended solids. From the lake stations, water samples were collected using a Ruttner sampler covering the entire column, and these water samples were also used for chl-a and plankton analysis. In addition, Secchi disc depth and maximum water depth was measured at each sampling period. To determine TP, the acid hydrolysis method was used, and to determine SRP, filtered water was processed using the molybdate reaction method [38]. N analysis was performed using the Scalar Autoanalyzer Method (San++ Automated Wet Chemistry Analyzer, Skalar Analytical, B.V., Breda, The Netherlands). The chl-a was measured spectrophotometrically after using the ethanol extraction method [39].

3. Materials and Methods

3.1. Modelling Workflows

Most of the catchment biophysical simulations were performed with the INCA-N [40] and INCA-P [27] models (Table 4). SWAT [41] was used at Beyşehir and Stream-N [42] was used in addition to INCA-P for the Tarland Burn because these model applications were well developed with good representation of the catchment N and P sources and transport pathways. Similarly well-established lake models were used and drew on existing work. Three lake models were used to simulate the nutrient and chlorophyll dynamics in Lake Beyşehir, (DYRESM-CAEDYM [43,44], PROTECH [45] and PCLake [46]), two were used for Lake Pyhäjärvi (Lake Load Response model [47], MyLake [48]), one for Lake Vansjø (MyLake) in the Hobøl catchment, and one for the Orlík reservoir (CE-QUAL-W2 [49]) in the Vltava catchment (Table 3). Delft3D was applied to simulate the effects of climate and nutrient changes in the IJsselmeer.
Once calibrated and tested (Section 3.2), the models were run for a baseline period of 1981–2010 and then for a scenario period of 2031–2060. The difference in the mean flow and concentrations simulated for the scenario and baseline periods were used to derive percentage changes. Model calibration was conducted using MCMC-DREAM at the Hobøl and Tarland and manually elsewhere [50].

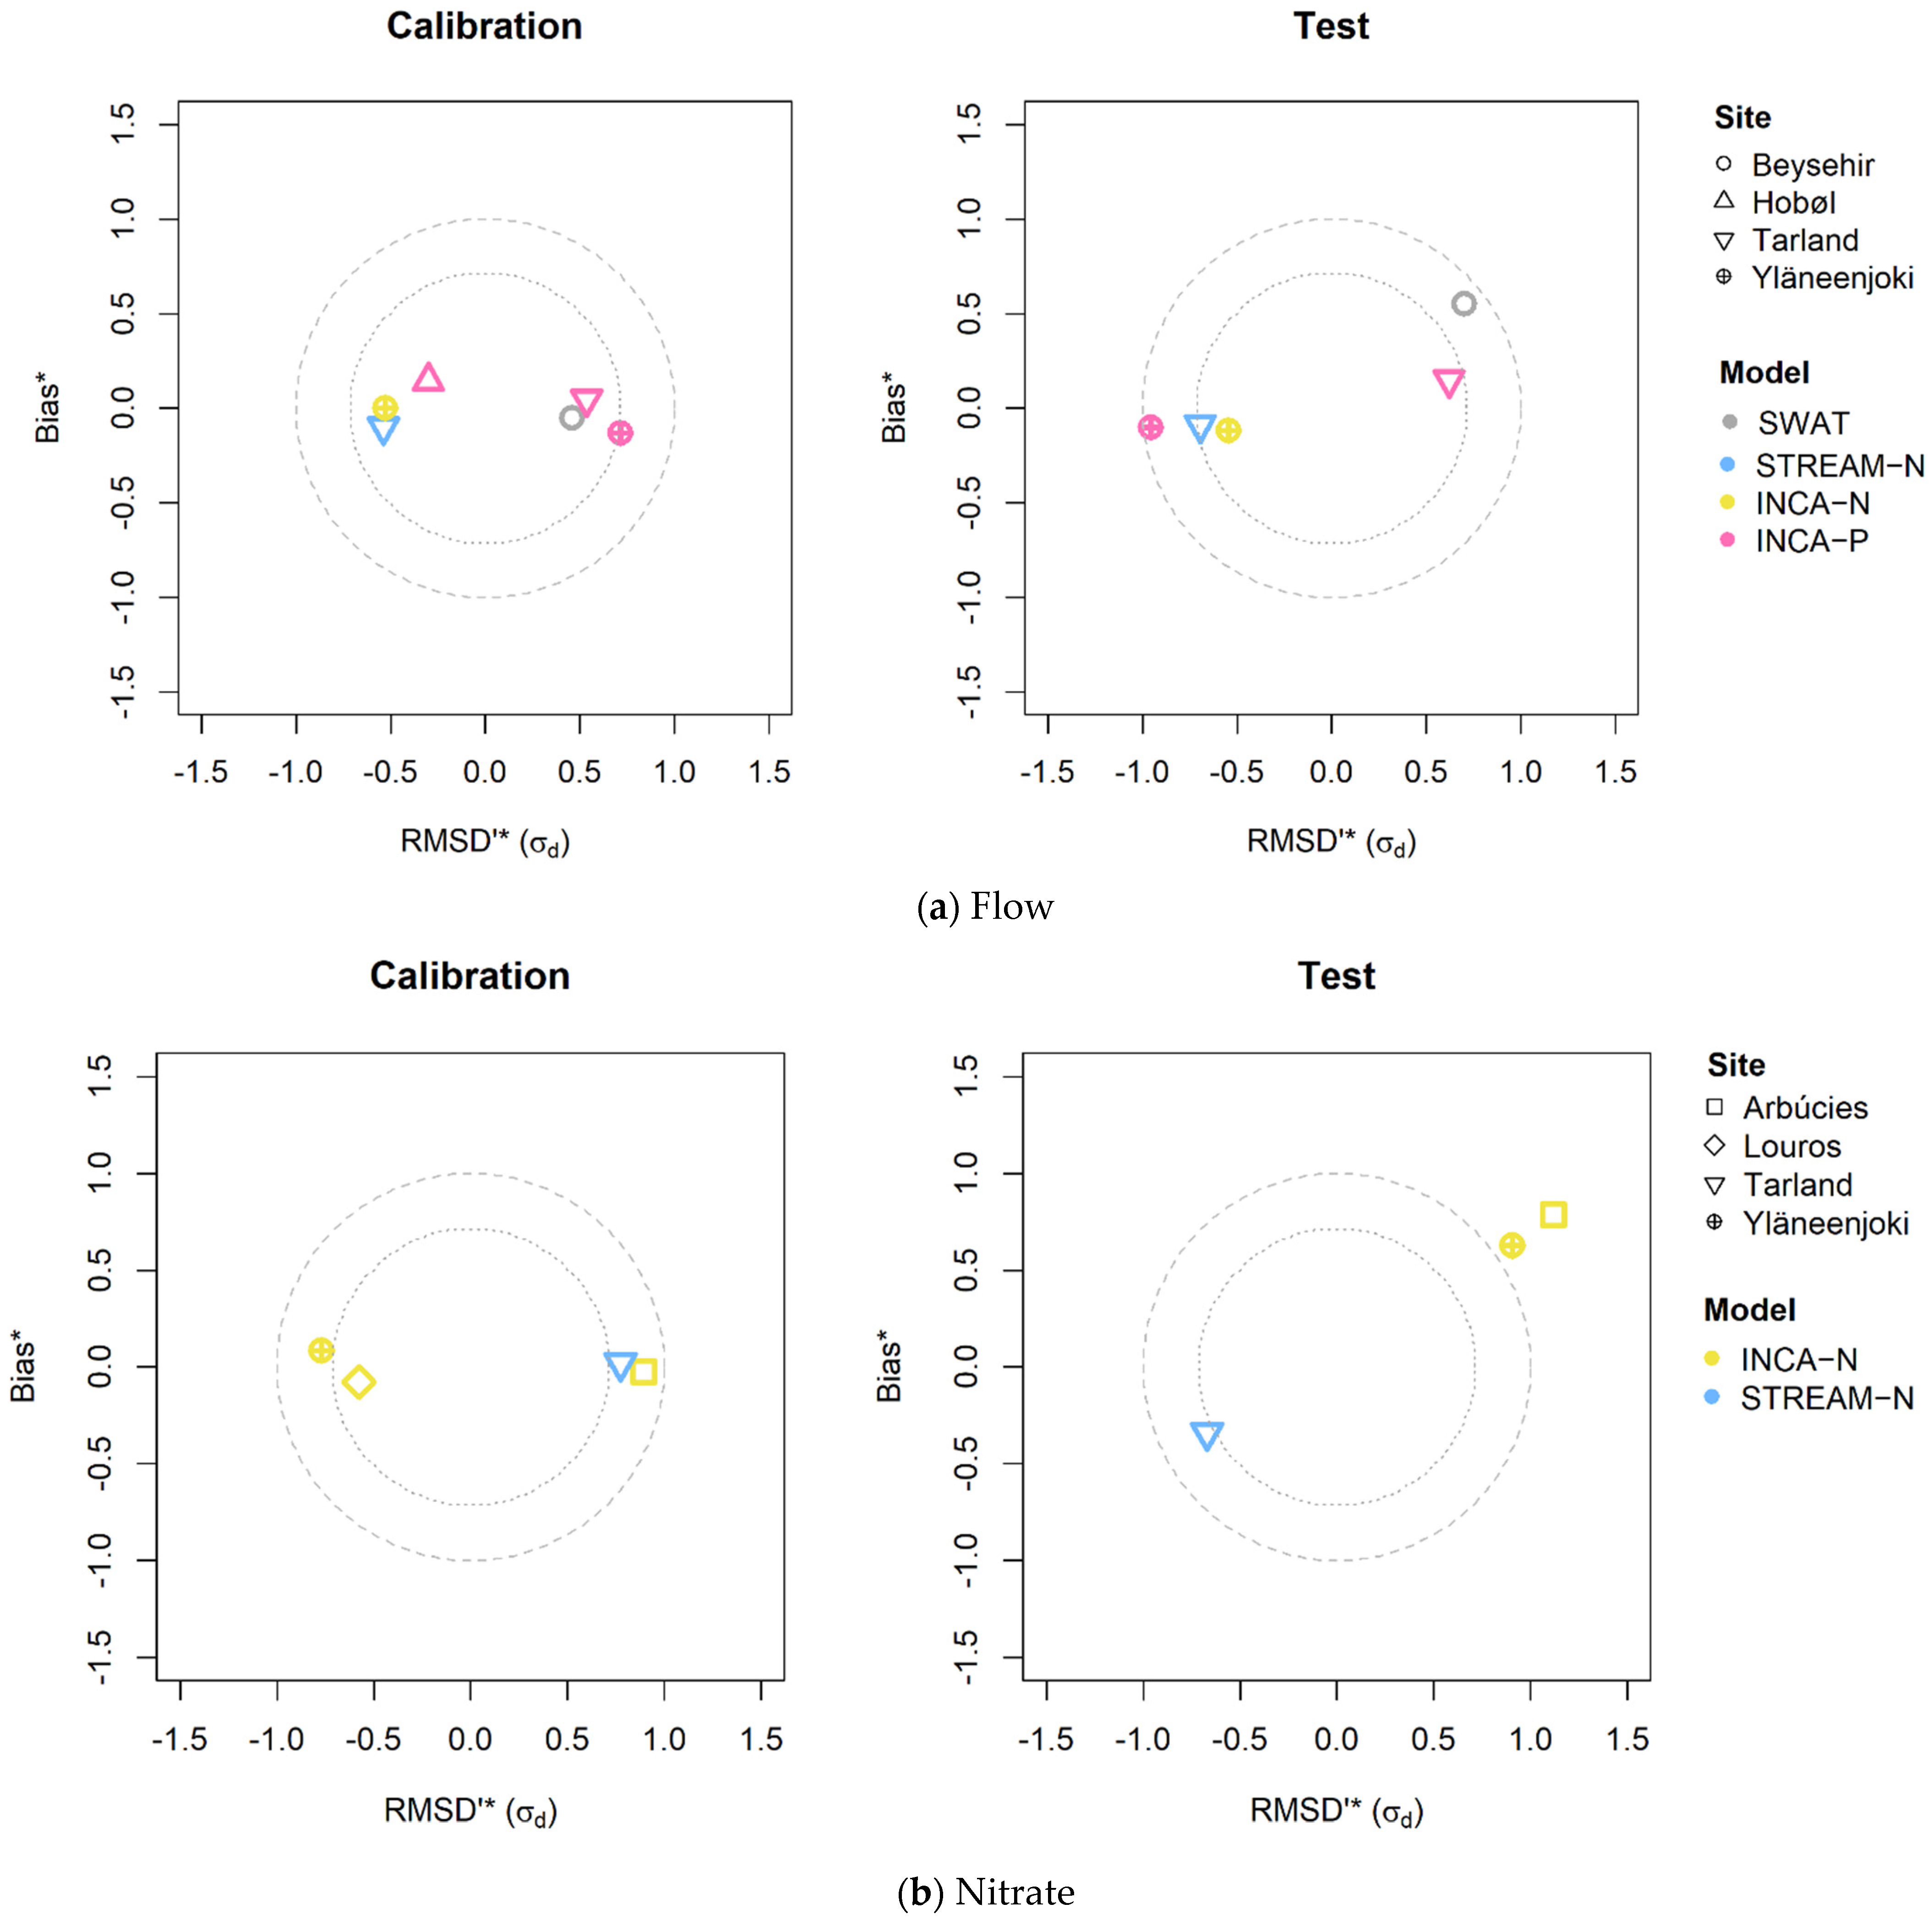
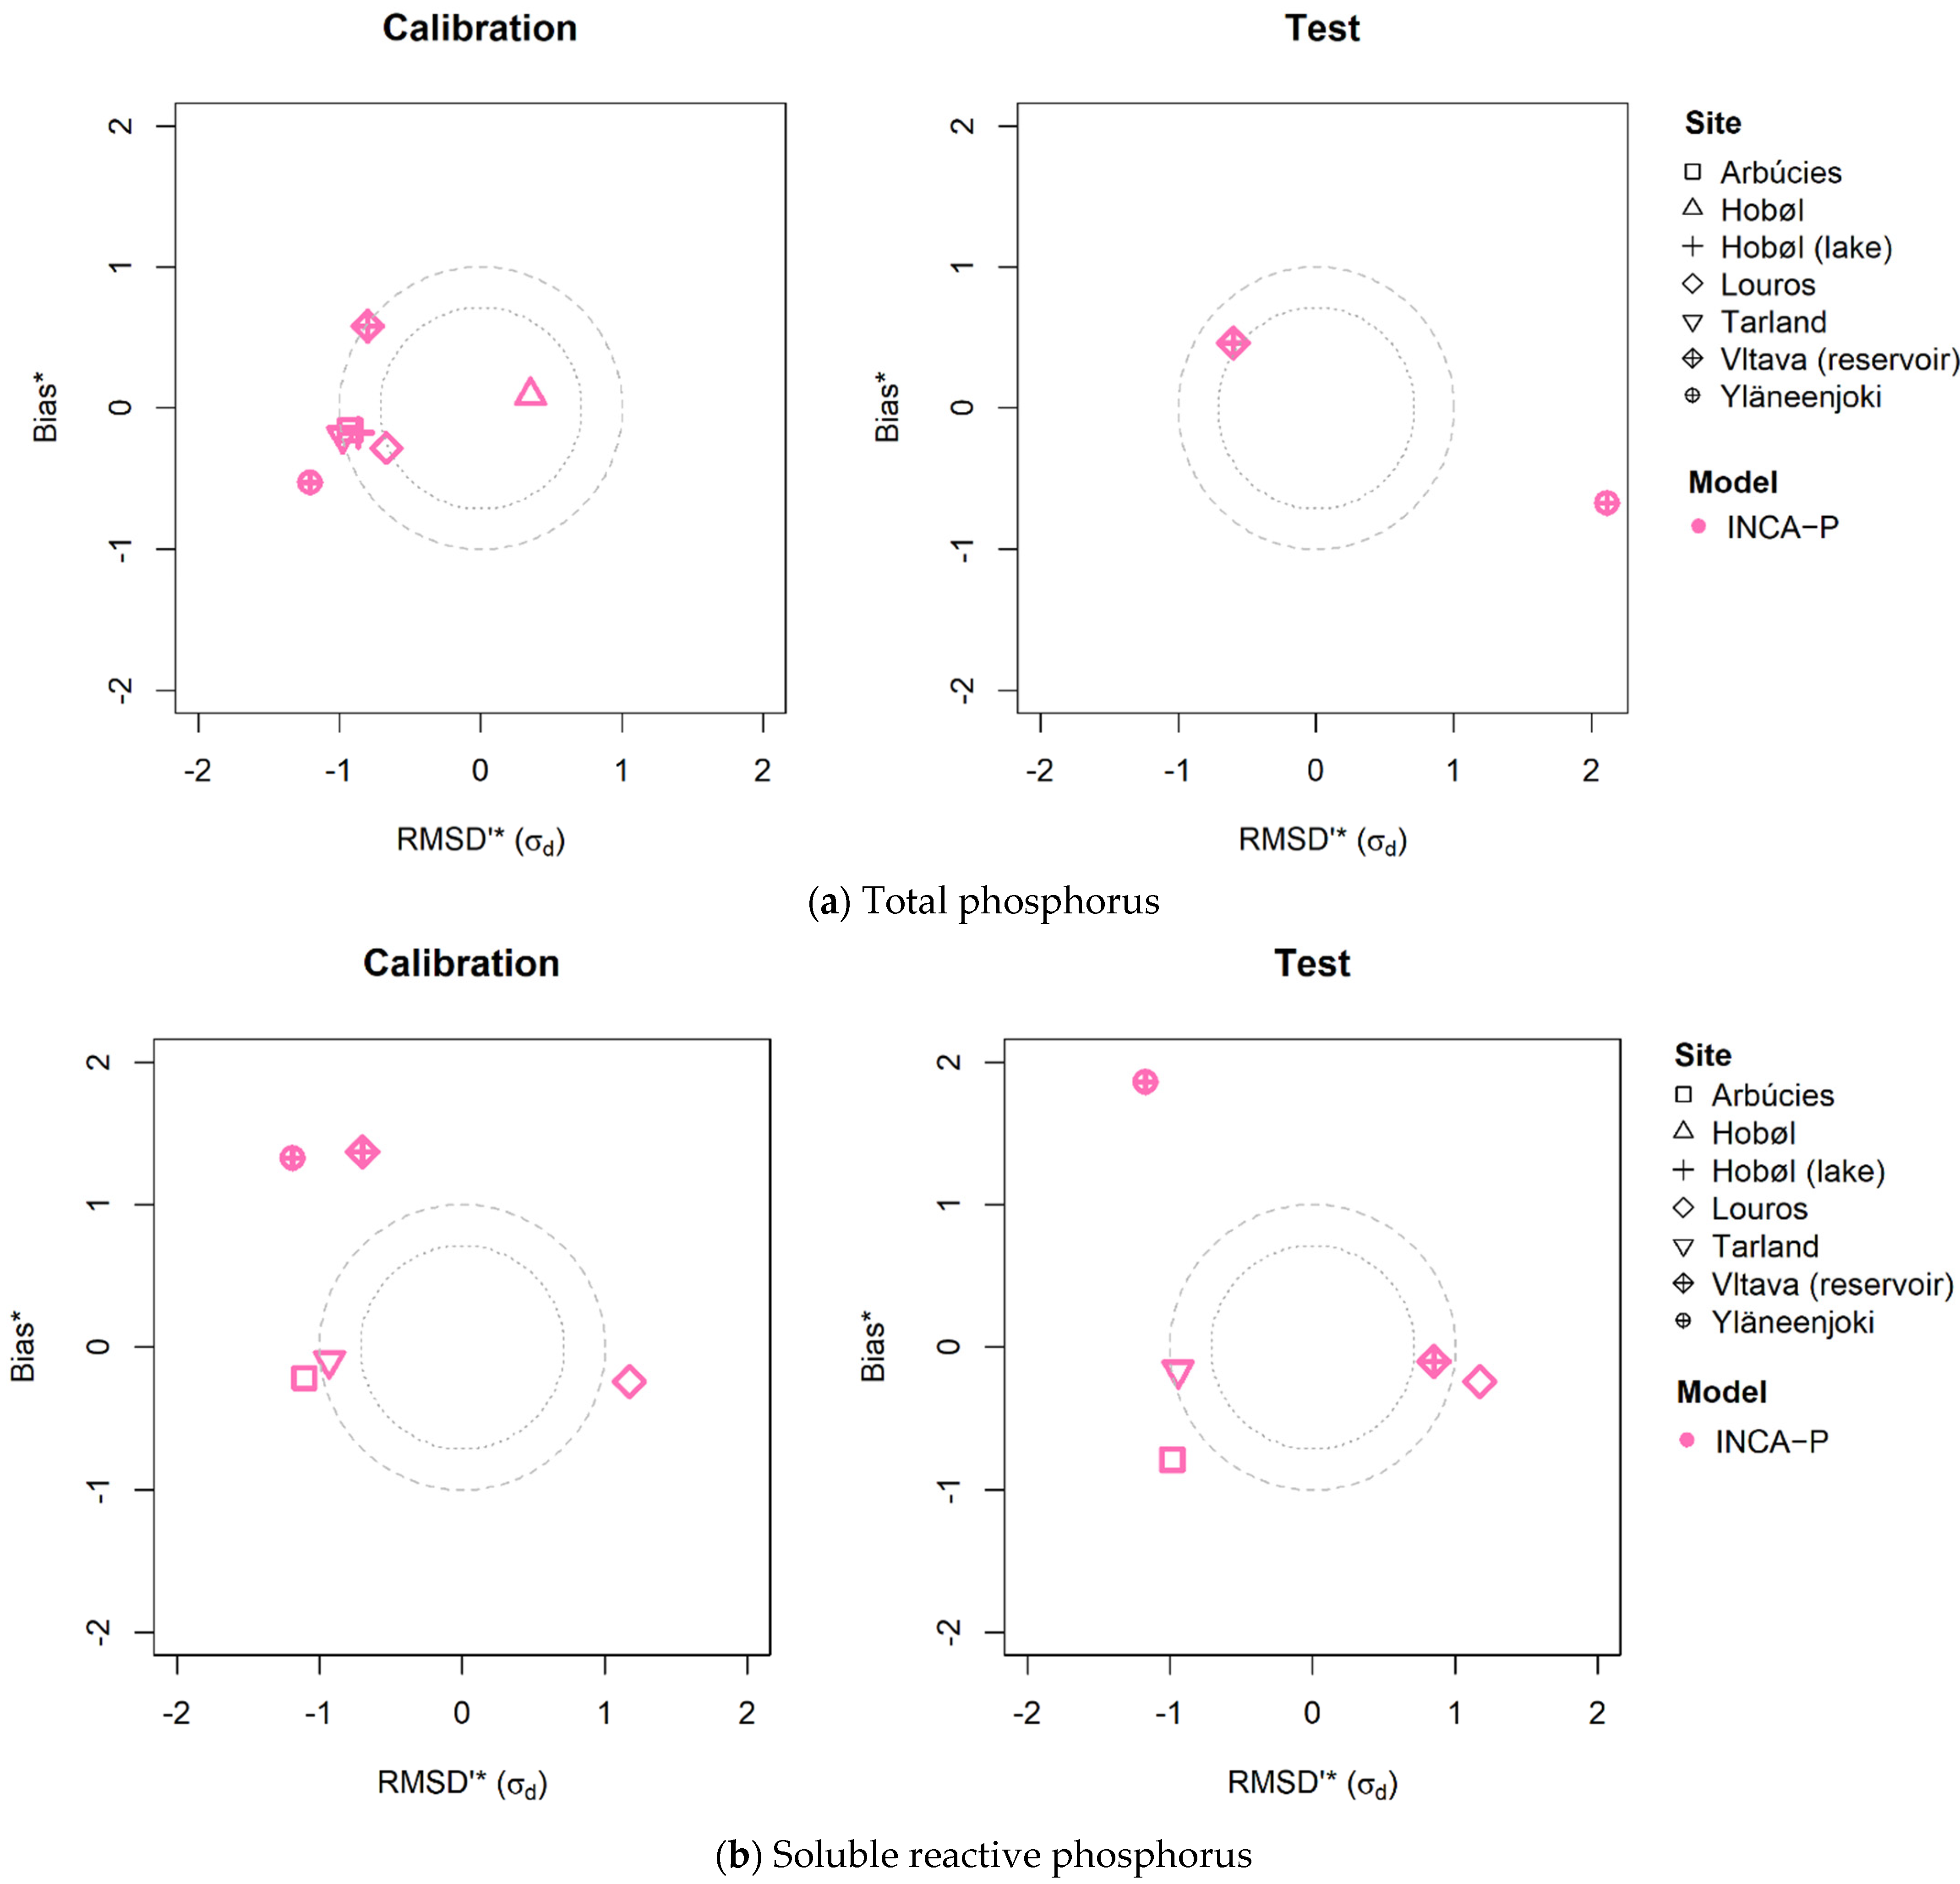
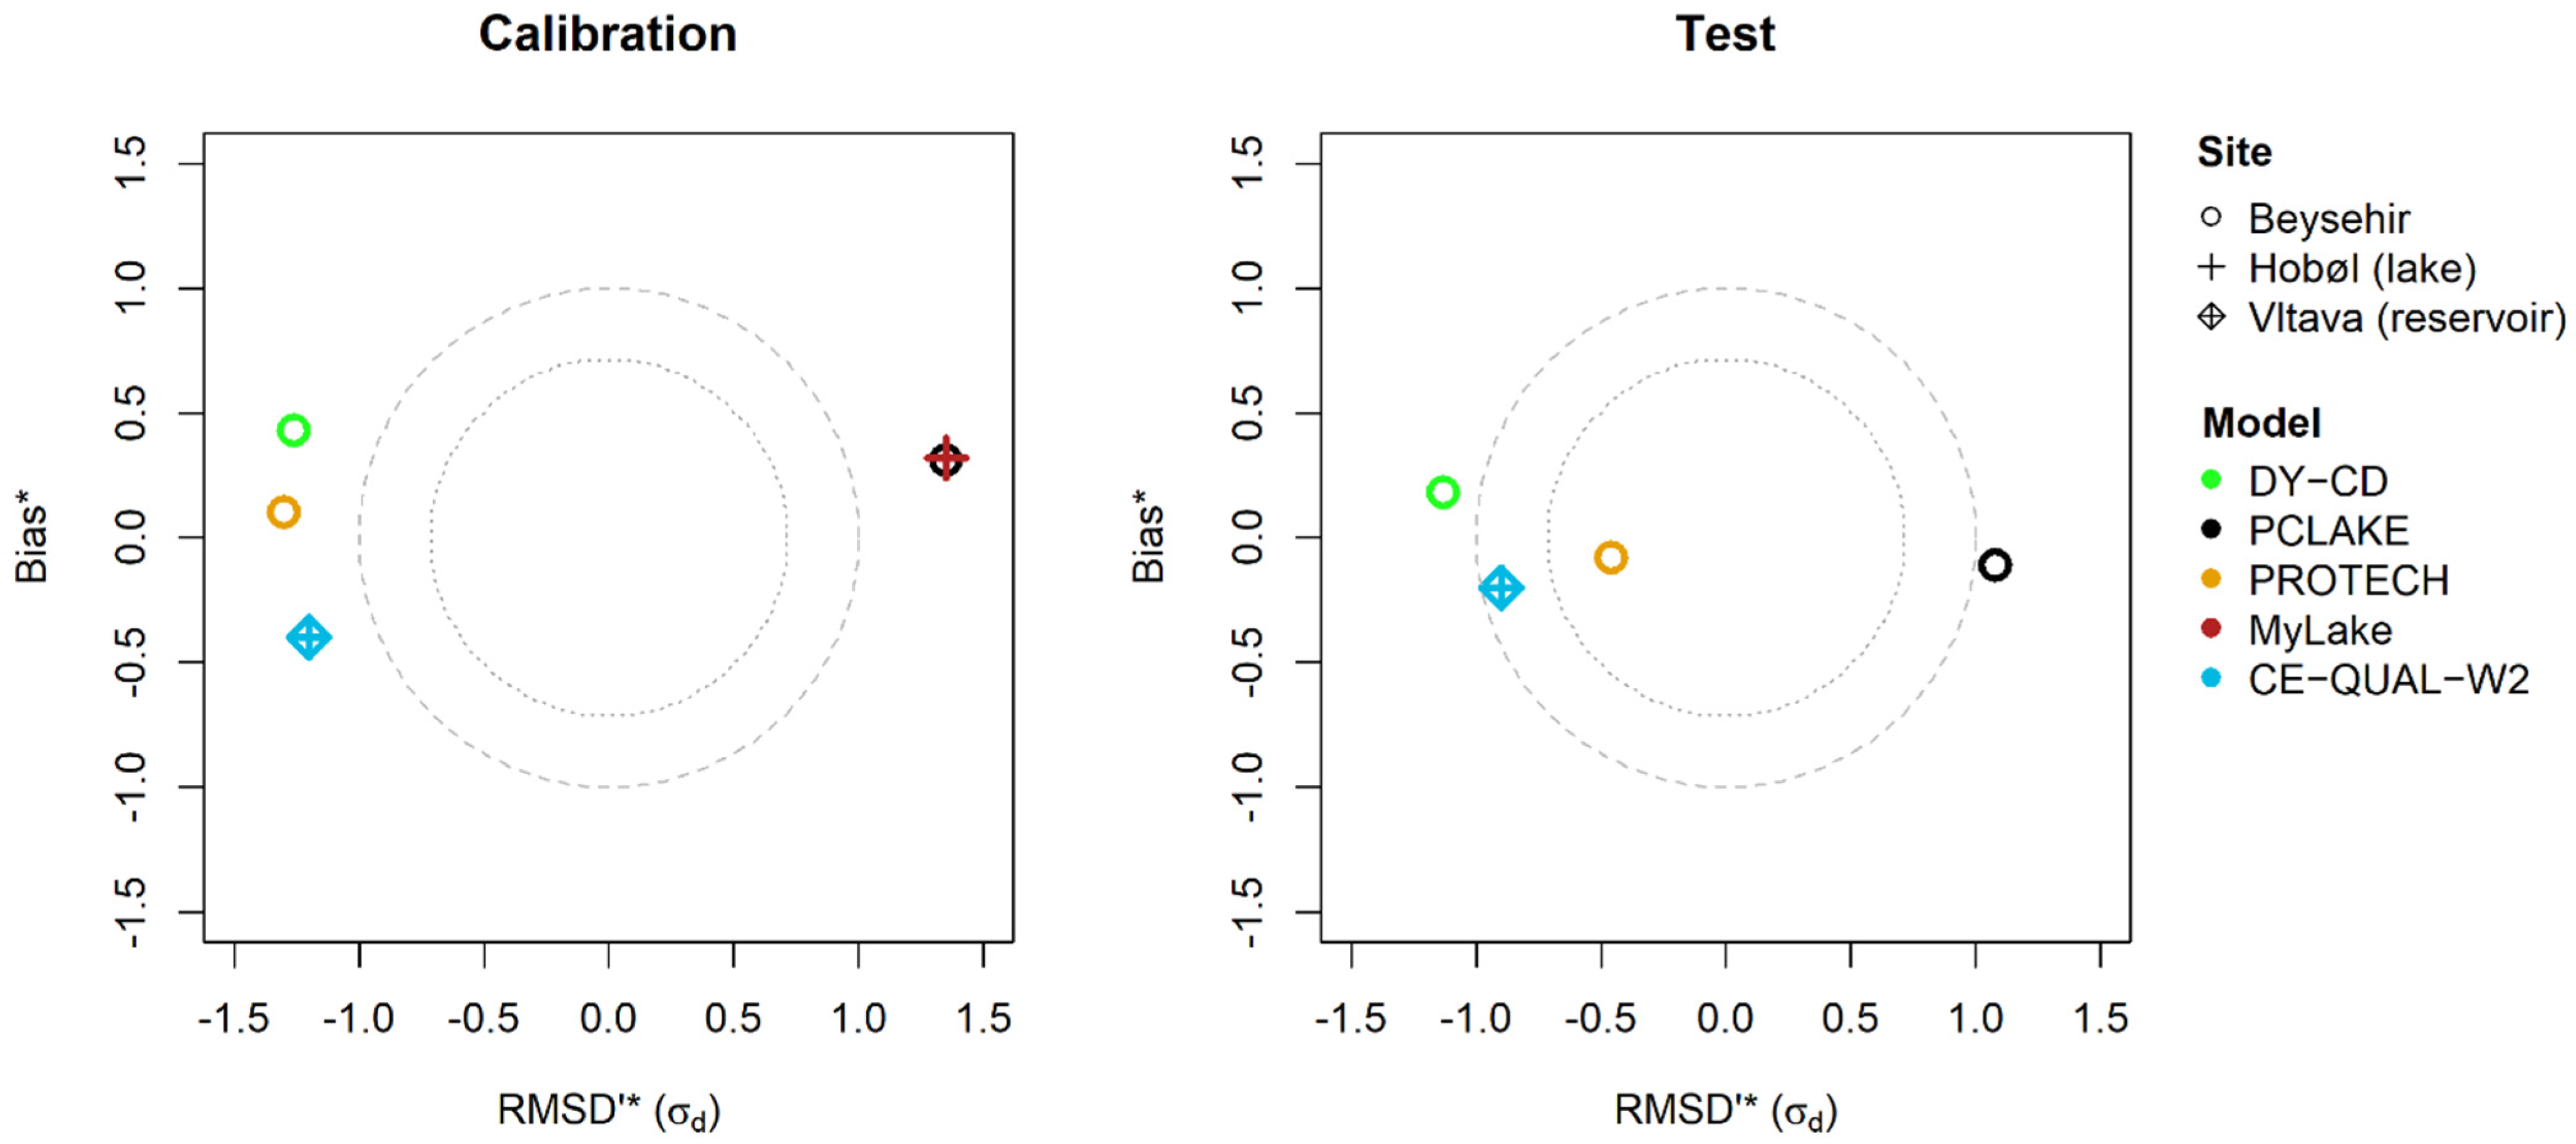
3.2. Model Performance—Calibration and Testing

All the models were calibrated and tested using a split sample, apart from the DELFT-3D model for Ijsselmeer, which was calibrated for one year (2006). Model performance was assessed using target diagrams of Normalised Root Mean Square Difference between the simulation and observation (RMSD’*(σ)) and the normalised bias, (Bias*) (Figure 2, Figure 3 and Figure 4) [51]. Normalisation is by the standard deviation of the observations. Target diagrams allow for a quick visual comparison, on a common scale, of model performance for a range of determinands. The normalised bias is positive when the modelled output overestimates the observations and negative for a general underestimation. A perfect model fit would result in a zero bias. The RMSD’*(σ) is positive if the variance of the modelled output is less than the variance of the observed data and zero when the two variances equate. To help visual interpretation, two circles are drawn on the plots about the point (0, 0) with radii of 0.7 and 1.0. Simulations resulting in points inside the smaller circle were described as ‘excellent’ fits, whilst those that lay between the larger and smaller circle were considered ‘good’. These diagrams were used alongside a visual comparison of the modelled and observed patterns in flow, stream water NO3-N, TP, and SRP concentrations and lake chl-a concentrations, estimates of model performance using the co-efficient of determination (r2), and the use of RMSD’*(σ) and the normalised bias calculated from modelled loads [10,22,28,31]. TP captures both particulate and solute phosphorus dynamics, and SRP is a measure of the phosphorus assumed to be biologically available.

3.3. Climate Change Projections

Three climate model-regional climate model combinations were used: ECHAM5-KNMI (abbreviated to KNMI in this text), HadRM3P-HadCM3Q0 (HadRM3), and SMHIRCA-BCM (SMHI) [52]. These combinations were selected because they show the best agreement with observations (KNMI) or tend to emphasize a move to hot and dry (HadRM3) or wetter (SMHI) conditions. The modelled projections from KMNI are close to the ENSEMBLES average (http://ensembles-eu.metoffice.com/, last accessed on 10 January 2022). HadRM3 represents one extreme in the ensemble, producing warmer, drier summers. SMHI represents the other extreme, being relatively cold and wet. The A1B scenario was chosen, and this represents rapid economic growth and balanced fossil and non-fossil fuel use to satisfy energy requirements [53]. Data were extracted for a current climate baseline period (1981–2010) and a future period (2031–2060). The climate model output is generally biased, and to take this into account and generate site-specific climate change projections, we used the delta change method using monthly mean change factors. This simple bias correction method assumes that the relative difference between the model baseline and the model future is realistic, despite any bias, and it only corrects for a bias in the mean. Actual evapotranspiration was estimated using the Penman–Monteith method and simulated air temperature.

3.4. Land Use, Atmospheric Deposition, and Water Use Projections

Land use change scenarios were derived for each catchment based on a local interpretation of the four IPCC SRES Storylines A1, A2, B1, and B2 and local land use capability for, and management of, agriculture and forestry. An interpretation of the land cover change was performed by local catchment stakeholders through workshops held in six of the catchments (Table S1). The storylines represent moves to food security in a heavily competitive world (LU1), or domestic market scenarios (LU2), or more collaborative international markets to promote global sustainability (LU3), and local stewardship based on more green agricultural policies to help reduce nutrient losses (LU4). These map to the IPCC SRES Storylines A1, A2, B1, and B2, respectively. For the ‘world’ (LU1) and ‘domestic’ (LU2) market scenarios, it is assumed that crops are grown wherever land capability for agriculture supports this. The N deposition change under the four storylines was derived from EMEP (European Monitoring and Evaluation Programme, http://www.emep.int/, last accessed 10 January 2022) using a combination of measured and modelled emissions and meteorological data, the projected land use, and a chemical transport model developed at the Meteorological Synthesizing Centre-West (MSC-W). Water use, in each storyline, was estimated from projected farm practice and population growth estimates. A summary of the climate and land use scenarios, the latter of which incorporates the N deposition and water use projections considered at each study area, is presented in Table S2 and varies in the number of scenarios considered due to the resources available in each study area, though at all sites the climate scenario which was most like present-day (KNMI at most sites, but HadRM3 in Scotland) was considered along with at least a ‘best’ (LU3 or LU4) and a ‘worst’ (LU1 or LU2) land use scenario.

4. Results

4.1. Model Performance and Uncertainty Evaluation

The evaluation of the model performance demonstrated that all the catchment models produced a generally excellent representation of the observed flows, measured at the most downstream gauging station in each demonstration catchment (Figure 2a; RMSD’*(σ): −1.0 to 0.7; Bias*: −0.1 to 0.1). This was true for both the model calibration and the test periods. There was little bias in model calibrations for flow, though the modelled flows tended to have a smaller variance than the observed flows as the extreme low and high flows were not simulated well. Differences in the performance between INCA-N and INCA-P arose due to the different calibration and test periods used in the applications of the two models to match the available stream water NO3-N, TP, and SRP data [20,21,22].
The simulations of the stream water NO3-N, TP, and SRP concentrations were satisfactory in general, though in all cases they were better at describing the seasonal (monthly) variations in concentrations than the daily extremes [10,18,22,23,26,28,30,31]. There was an apparent deterioration in the model performance during the testing (Figure 2 and Figure 3), and this suggests that conditions were present in the test period which were generally not seen in the calibration period across all sites. Building models that adequately represent the flow and concentration extremes for rivers and lakes remains challenging due to issues around adequate characterization of the model inputs, the representation of catchment water and pollutant storage and transport, and the complex and multiple lake ecosystem interactions.
The simulations of the observed stream water nitrate concentrations (RMSD’*(σ): −1.0 to 1.0; Bias*: −0.4 to 0.8; Figure 2b) were better than those of the observed stream water TP (RMSD’*(σ): −1.2 to 0.4; Bias*: −0.5 to 0.1; Figure 3a) and SRP concentrations (RMSD’*(σ): −1.2 to 1.2; Bias*: −0.8 to 1.9; Figure 3b). There were too few stream water NH4+-N concentration data for a meaningful comparison of the model performance between sites. The highest TP and SRP concentrations, which typically coincide with the highest flows, were underestimated. The observed seasonal patterns in the PO43−-P concentrations in the catchments draining to the Orlík reservoir were well represented by the lake models but again not in terms of the extremes [28]. The chl-a concentrations at Lake Beyşehir, Lake Vansjø, and the Orlík reservoir appear to be simulated poorly (RMSD’*(σ): −1.2 to 1.2; Bias*: −0.4 to 0.5; Figure 4); however, a closer inspection of the simulated chl-a concentration time-series for these shows that the seasonal patterns in chl-a concentration were modelled well, though the models do not reproduce the exact timing and magnitude of peaks in the chl-a concentrations, leading to poor values of the RMSD’*(σ) and normalised bias [23,28,31]. As when simulating the stream water NO3-N, TP, and SRP concentrations, due to the complex, time-varying nature of the controlling factors, it was difficult to capture the precise timing and magnitude of algal blooms. Thus, dynamic lake P and chlorophyll models were used only to explore the general trends in mean annual concentrations and seasonal patterns in concentrations and algal growth [54]. The coefficients of determination, where calculated, show the same results as for the RMSD’*(σ) and normalised bias; namely, the general seasonal patterns in the flow, stream water NO3-N, TP, and SRP concentrations and the lake chl-a concentrations are well represented, but the extremes are not [10,22,28,31].

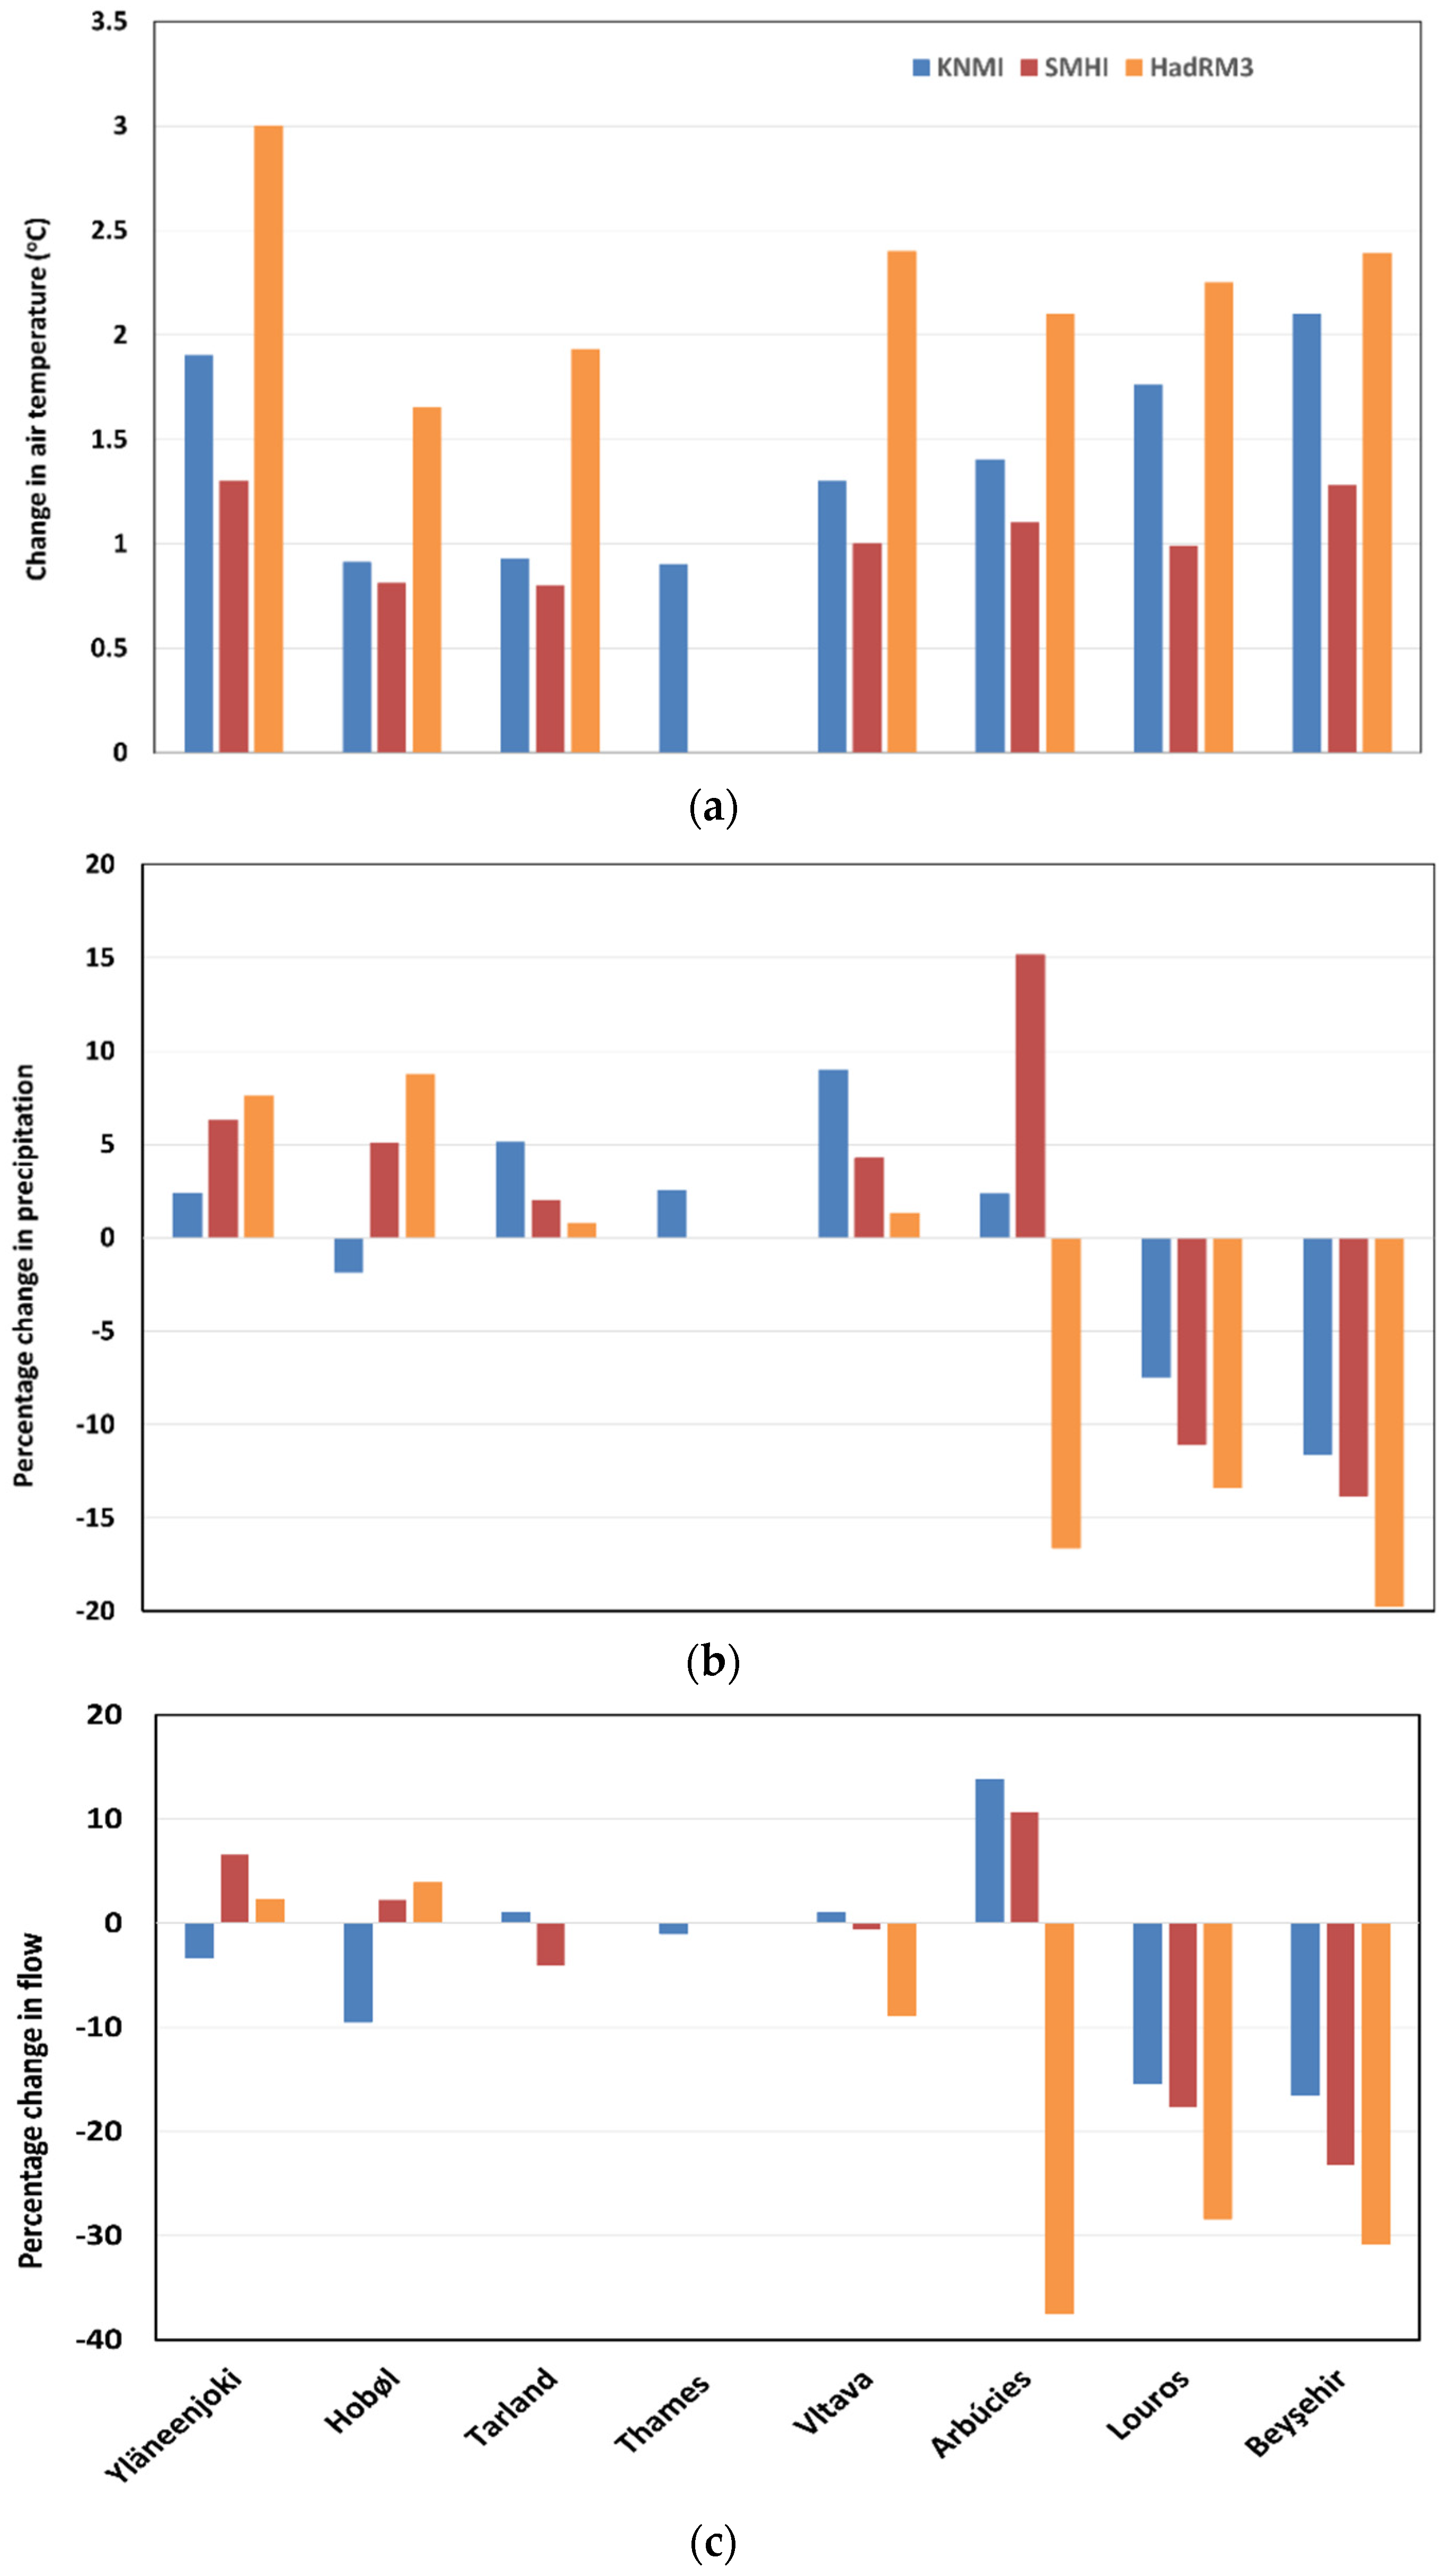
4.2. Projected Change in Hydrology

All three GCM-RCM models predict a rise in temperature over the region, with HadRM3 consistently and significantly higher than the others, with a mean rise of 2.2 °C between the baseline (1981–2010) and scenario (2031–2060) periods, followed by KNMI (1.4 °C) and SMHI (1.0 °C) (Figure 5). This is the order generally observed for these models and for the CMIP5 models for the simulations of European climate change [55]. There is a general north–south gradient, with the greatest temperature rises in the south, though the differences between the models are generally greater than the differences between the sites (Figure 5 and Figure S1). Finland is an exception, with a higher temperature rise (+1.3 to +3.0 °C) projected than in Norway or the UK.
The northern sites of the Hobøl, Yläneenjoki, and Tarland generally have a small increase in precipitation, and the increase in air temperature, and therefore evapotranspiration, almost balances the precipitation increase, leading to a small percentage increase in discharge or even a slight reduction in some model-site combinations (Figure 5 and Figure S2). HadRM3 produces the largest decreases in simulated discharge in the south and KNMI the smallest. For precipitation, there is a distinct north–south divide, with small increases in the north and mid-latitude sites and large decreases in the south at the Louros and Beyşehir (Figure 5). At the Arbúcies, there is considerable variability between the models with HadRM3 predicting a 17% decline in precipitation and SMHI a 15% increase. This reflects the issues around the robust simulation of precipitation in mountains and confirms the need to use an ensemble of GCM-RCMs or selected combinations that represent the median, wet, and dry extremes. All models concur, however, in predicting substantial decreases in precipitation in the Louros and Beyşehir.
The greatest declines in mean annual river flow occurred at the southern catchments, of the order of −16 to 38% at the Arbúcies, the Louros, and Beyşehir (Figure 5c). These sites had a large percentage decrease in precipitation (Arbúcies: −16% HadRM3 only; Louros: −7 to −13%; and Beyşehir: −12% to −20%) and higher temperatures (approximately +2 °C), which exaggerated the flow change due to increased summer evapotranspiration. Elsewhere, the changes in the flows were smaller and the mean annual flow tended to increase marginally (0–15%). To understand the flow changes, seasonal effects need to be considered. At the Arbúcies, for instance, KNMI predicts a 2% increase in precipitation, but a 14% increase in discharge is simulated. The greater increase in discharge compared to precipitation occurs because there is less summer precipitation but an increase in winter. Lower winter evapotranspiration means winter precipitation is more effective in generating runoff and replenishing soil moisture, hence the discharge increase. Similar, though less spectacular, effects are probably occurring at all the sites. At the Tarland Burn, for instance, KNMI, HadRM3, and SMHI all predict decreased summer and increased winter rainfall, resulting in an overall mean annual flow change of less than 6%. The HadRM3 model predicts a large decline in annual precipitation in the western Mediterranean, with a resultant 38% decline in discharge simulated at the Arbúcies in contrast to the simulations based on the KNMI and SMHI outputs, in which a 14 and 10% discharge increase was projected. This highlights greater uncertainty in the projected flow and water quality response at this mountainous site. In all cases, land use change had minimal impact on the simulated mean flows relative to climate (Figure 6).

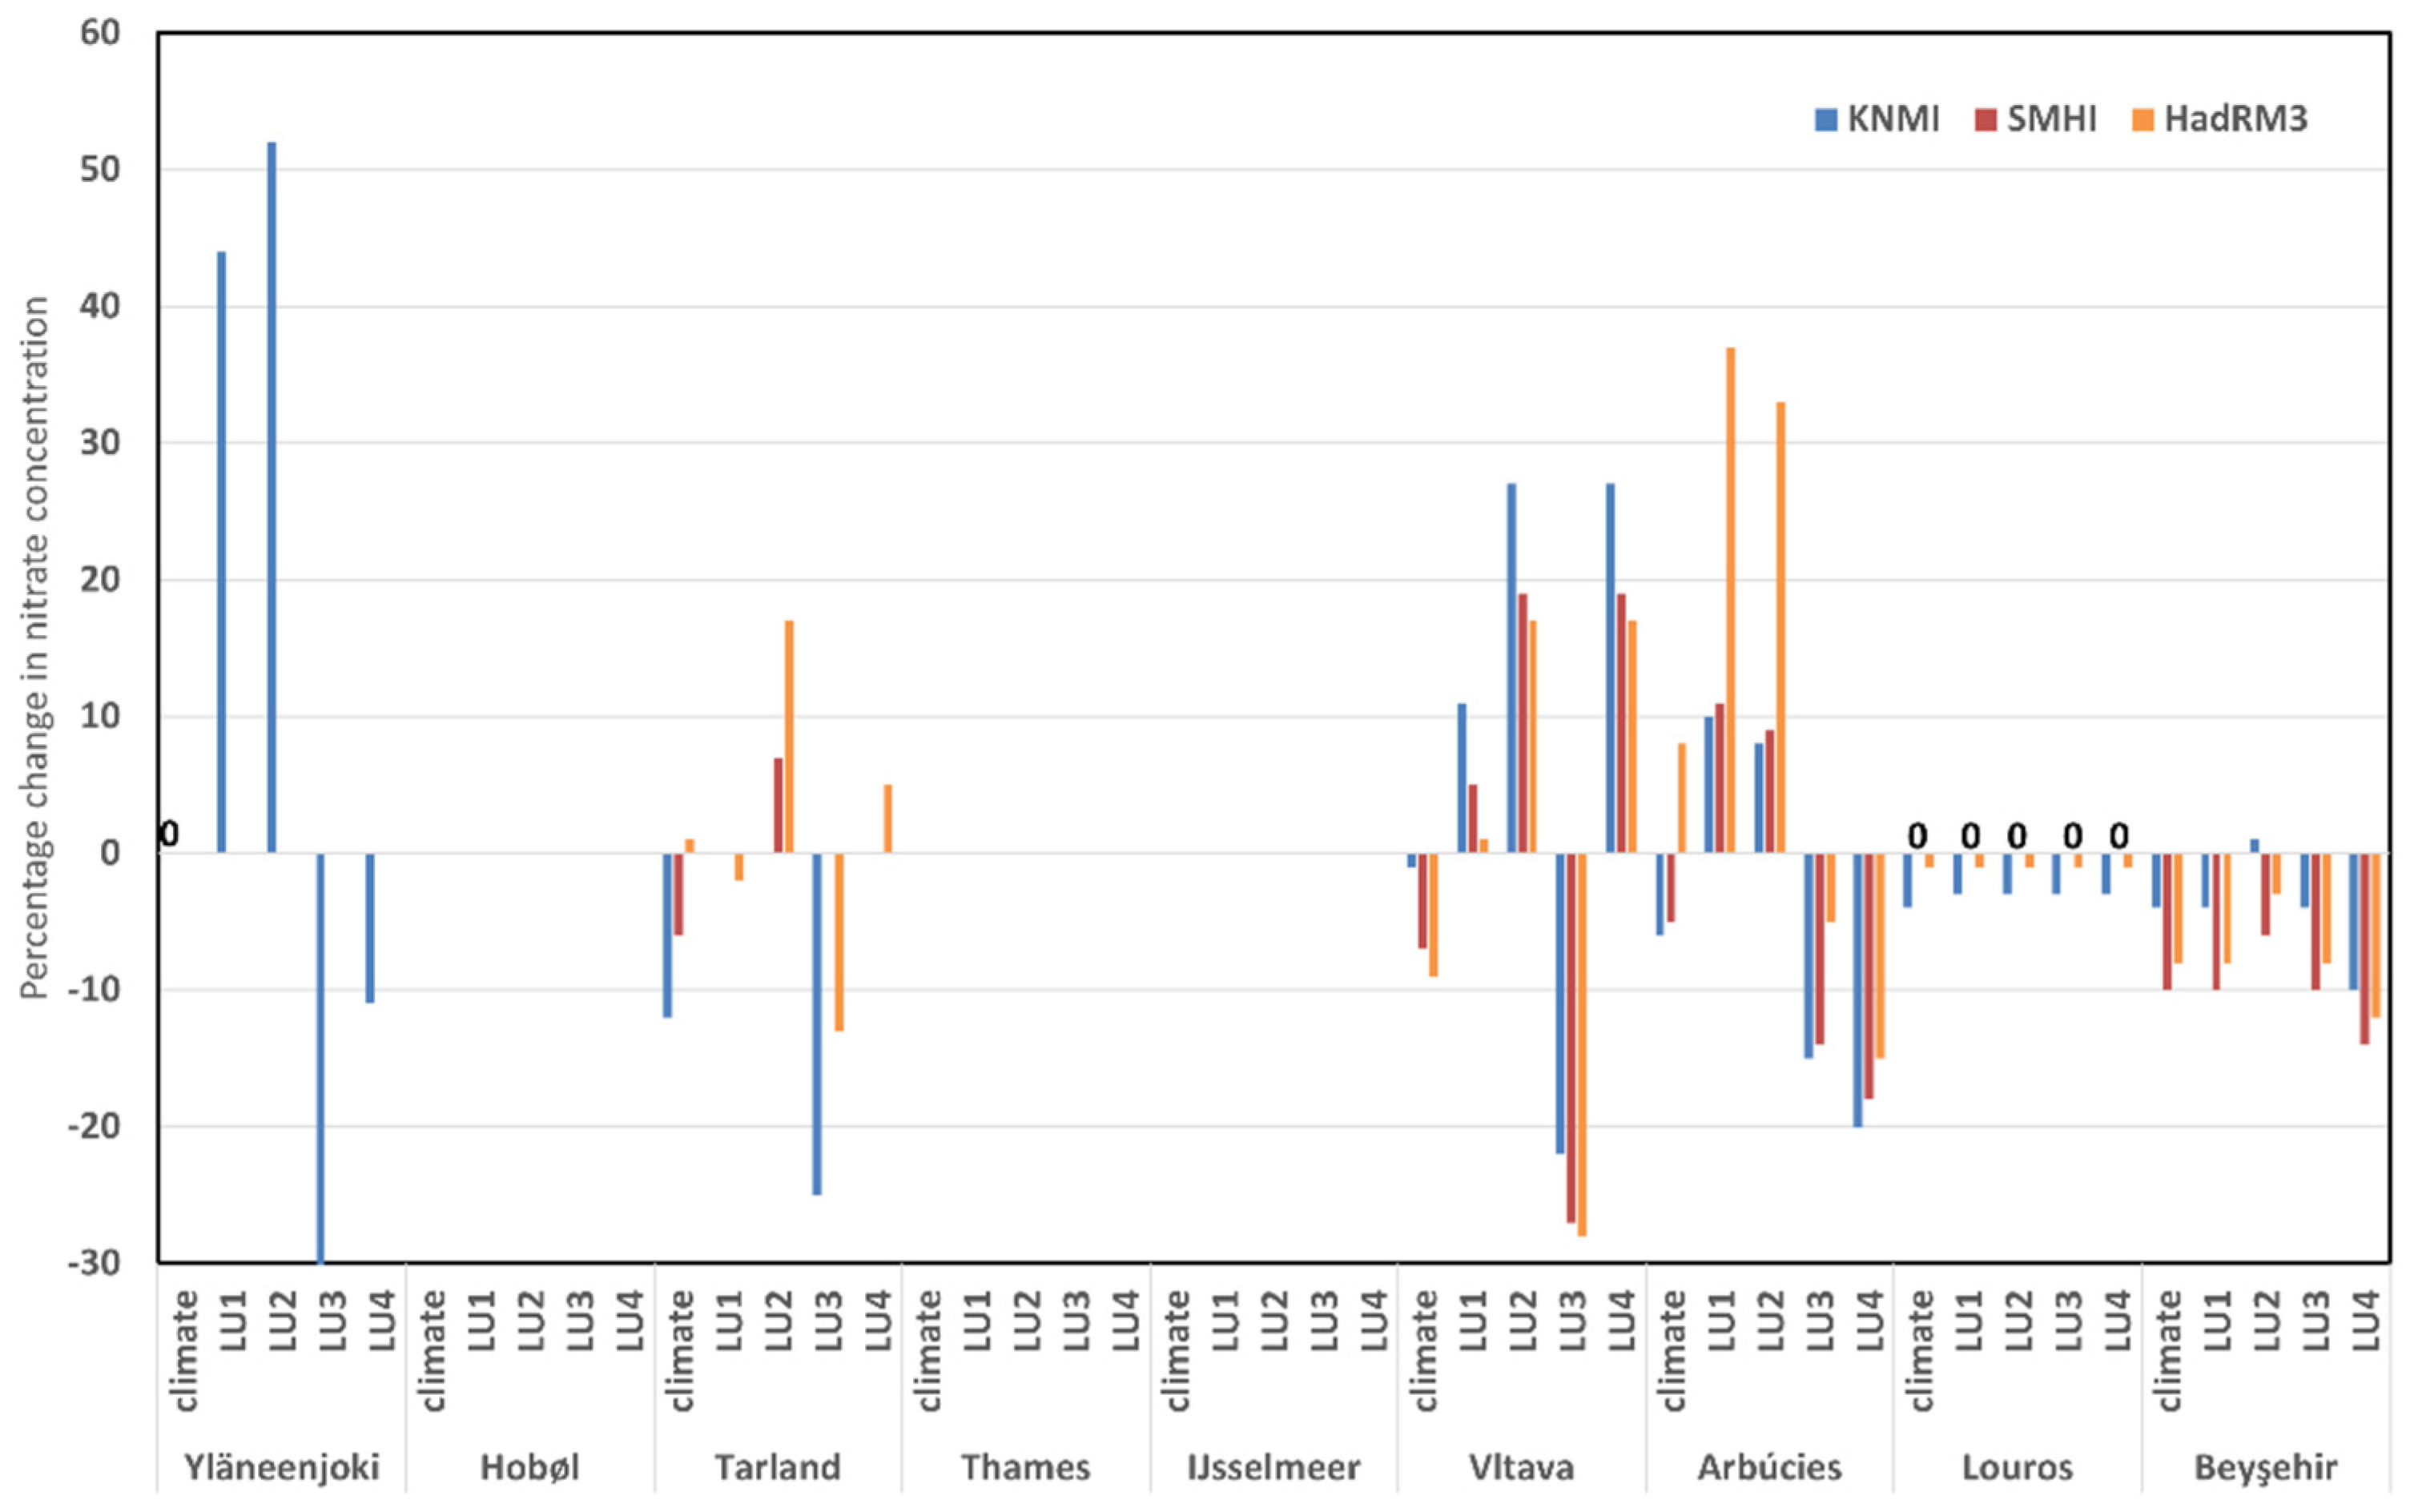
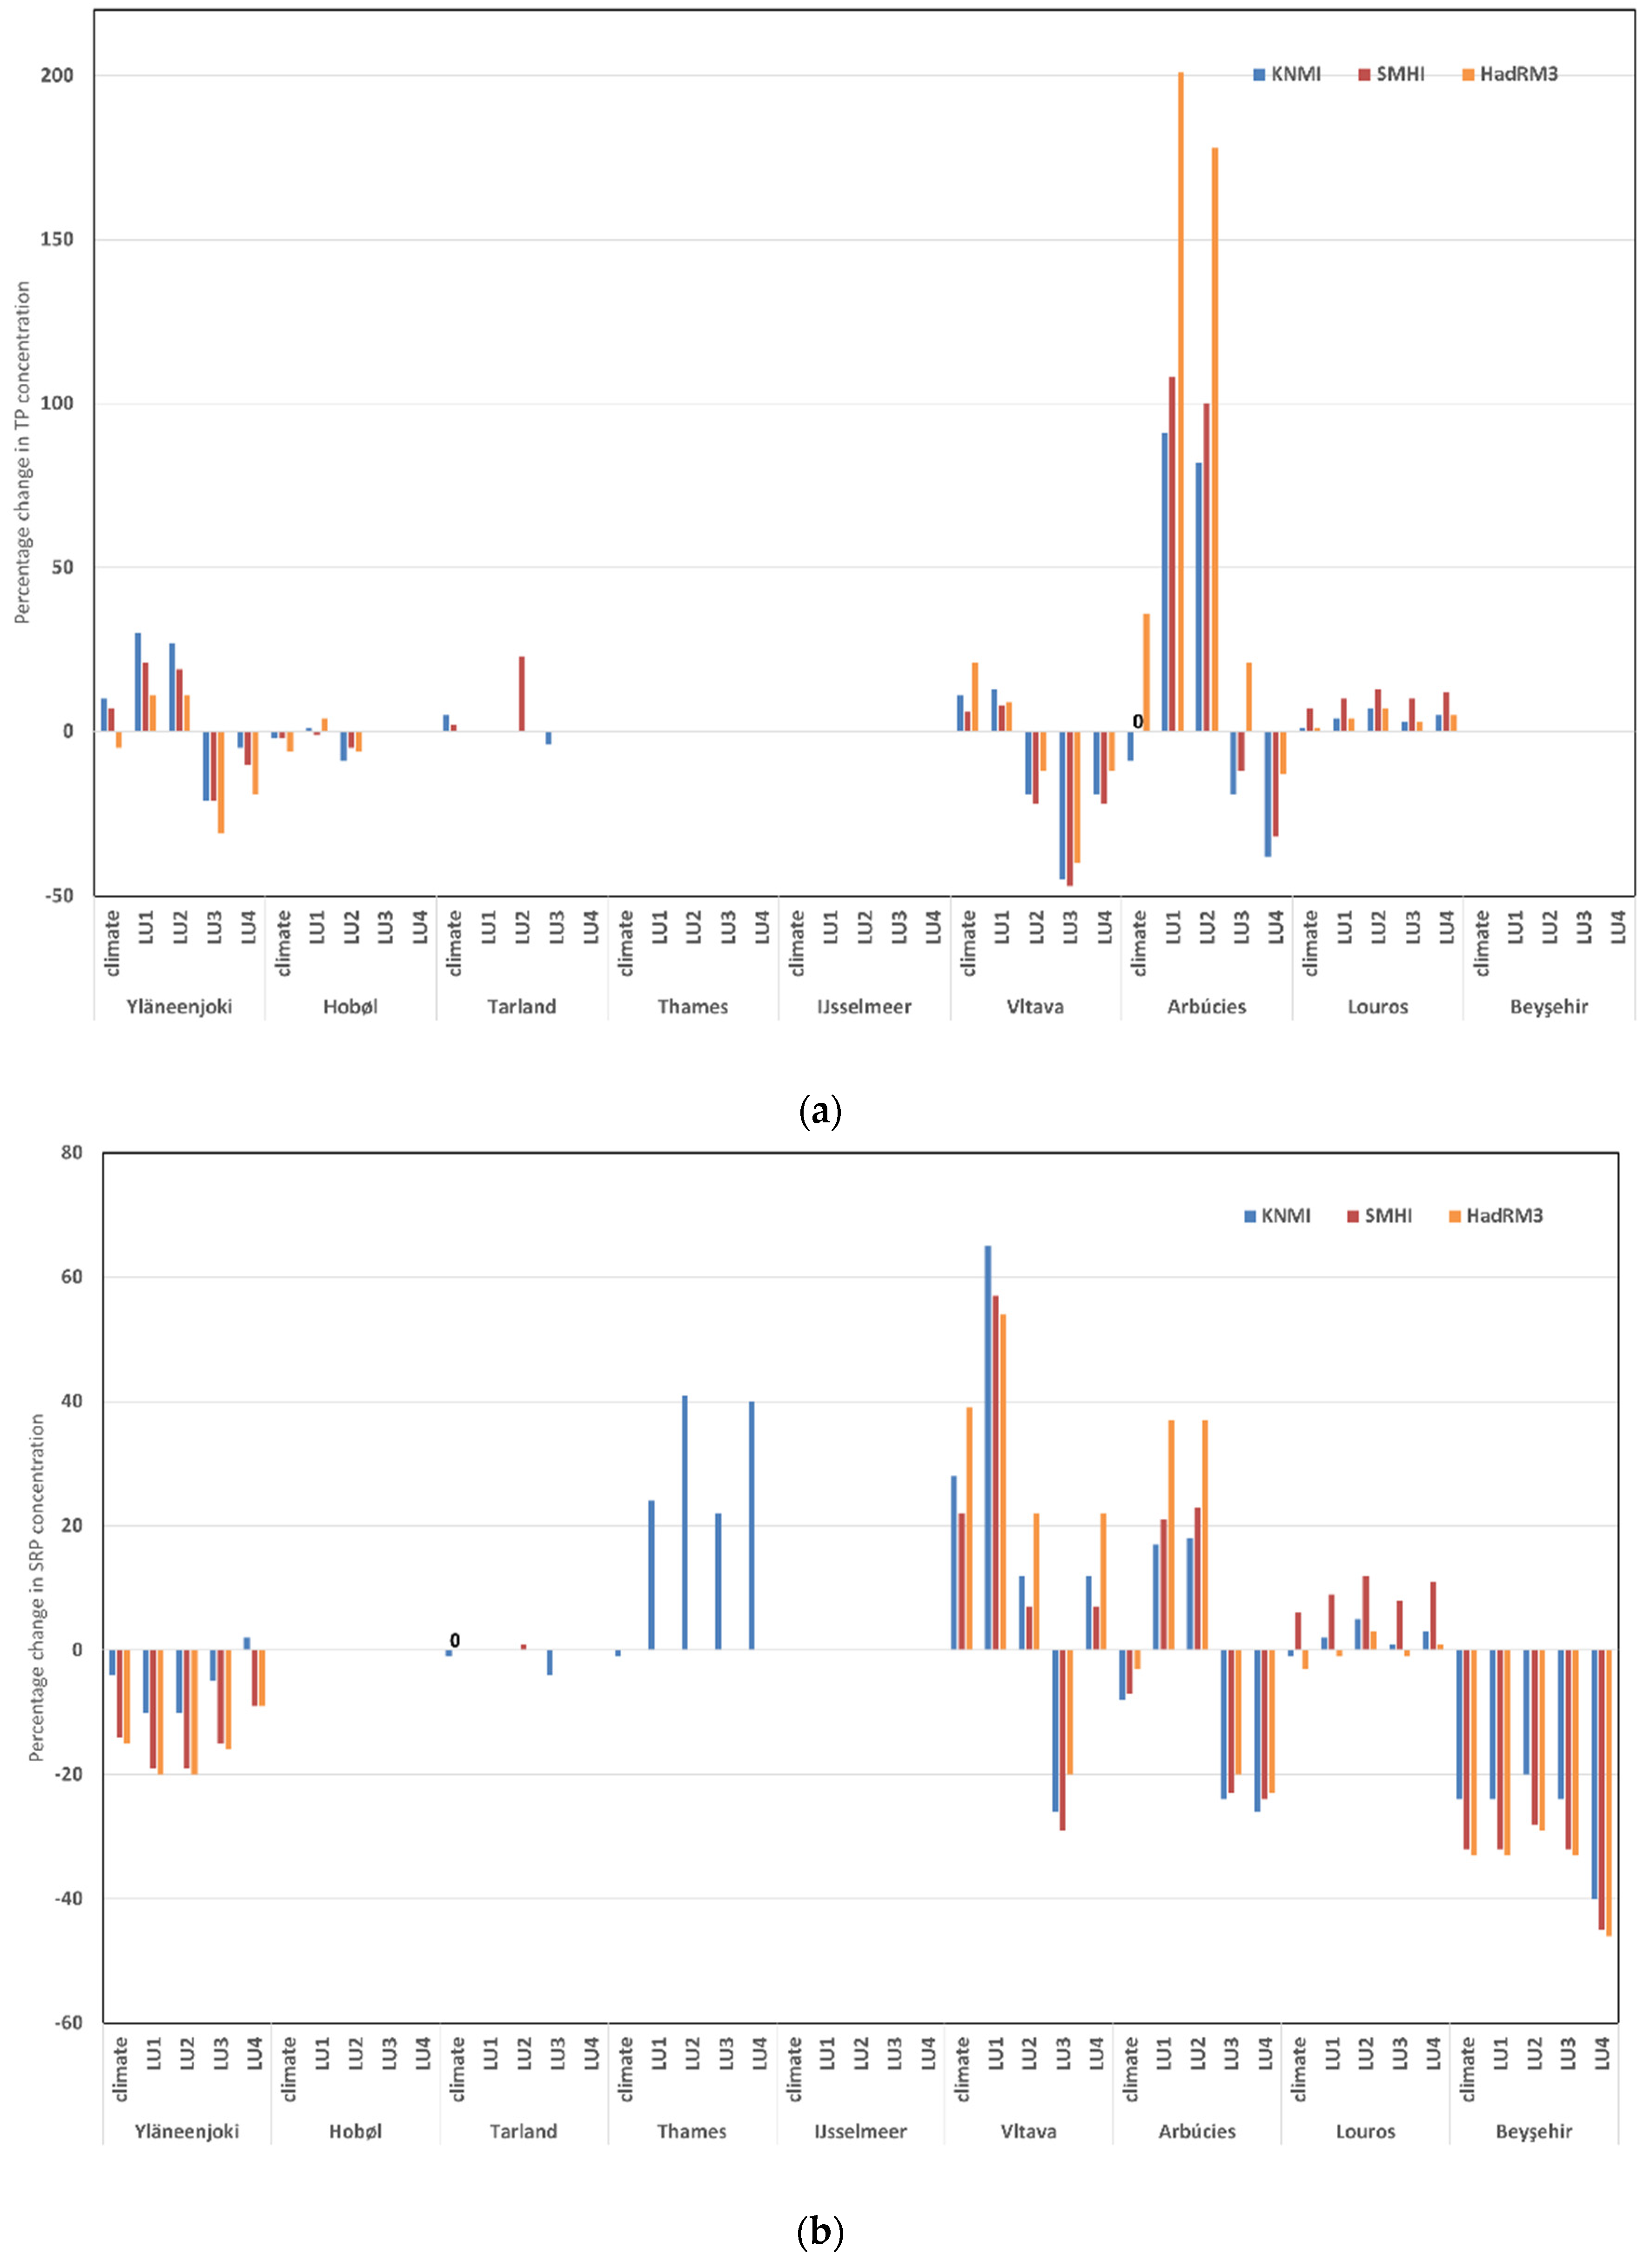
4.3. Projected Change in River Nutrient Concentrations and Loads: Climate Change Only

This section reports the modelled effects of climate change alone (‘climate’ in Figure 7, Figure 8 and Figure 9). In these analyses, changes in the mean concentration of 5% or less were assumed marginal and not indicative of any change. NO3-N concentrations were projected to generally decline due to climate change alone, but the changes are small, being more than −10% only at Tarland Burn and Beyşehir (Figure 7). The NO3-N loads show both marginal increases and decreases under climate change alone, depending on the site and climate model (Figure S3). Whilst the moderate increases in NO3-N concentration and load are likely due to increased precipitation during winter; it is not easy to pinpoint the causes of the lower NO3-N concentrations, though reduced leaching due to reduced water flux is one factor where hydrologically effective rainfall declines, and increased denitrification and plant uptake could be contributing factors.
The changes in TP concentration due to climate alone were mostly small increases (1–10%) except for the HadRM3 simulations at the Arbúcies (40%) and the Vltava (20%). The latter had the highest TP concentrations to start with due to the mixture of TP inputs from agricultural, wastewater, and fish farming (Figure 8a). The increases in the Vltava and Arbúcies occur primarily in the summer months and are associated with low flow situations, indicating that they are due to less dilution of the wastewater inputs. At the Vansjø-Hobøl in Norway, in contrast, the stream water TP concentration and load declined with climate change, but in the lake, the TP concentration increased (not shown). This is a curious result that contrasts with other sites where stream water TP concentration increases when higher precipitation is projected under climate change. At the Vansjø-Hobøl, the reduced fertiliser rates, vegetated buffer strips, constructed wetlands, and improved wastewater treatment that are already in place have led to a declining trend in observed stream water TP concentrations from 1990–2010, and this was simulated by INCA-P [24]. Under climate change alone, the simulated stream water TP concentrations and loads continue to decrease due to these measures. The increased lake TP concentration under climate change alone suggests accumulation of TP in the lake or a possible internal source from the bed sediment, though this is not well resolved in the MyLake model [24].
SRP showed much larger effects than TP for climate change alone, both positive and negative, and the effects depended much more strongly on the climate model (Figure 8a,b). The highest SRP concentrations were found in the Thames, where the large population generates substantial SRP in wastewater. Second highest, perhaps surprisingly, was Beyşehir because the low specific runoff appears to make the lake water more concentrated. Concentration changes due to climate alone ranged from 39% increases at the Vltava to 33% decreases at Beyşehir, both with the HadRM3 Model. The increase at the Vltava is consistent with less dilution of the wastewater inputs, and the decreases at Beyşehir show that the P is not derived from a fixed volume source such as wastewater but is being leached from the land. Changes at the Tarland Burn and the Thames in contrast are very small. At the Yläneenjoki in Finland, SRP declines even though TP increases. This is likely to be because with greater discharge the soil erosion increases, leading to an increase in PP. Soil erosion is a recognised problem in this catchment. In catchments where agriculture is the major nutrient source, with climate change alone, the loads tend to change in proportion to the change in water flux, whereas concentrations can increase (e.g., TP and SRP at the Vltava due to increased winter transport by storms and reduced summer dilution), remain constant (nitrate at the Tarland), or even decline, as at Beyşehir where the reduction in SRP is approximately 40 to 50% and 20 to 40% for nitrate (Figures S3–S5).

4.4. Projected Change in River Nutrient Concentrations and Loads: Integrated Scenarios

In contrast to river flow, the additional effects of land use changes on river nutrient concentrations are larger than those of climate alone. In general, and given projected climate change, the land use changes representing the “sustainable production” storyline (LU3) reduce nutrient concentrations and loads, and those from the “intensification” storylines (LU1 and LU2) increase them (Figure 6, Figure 7 and Figure 8). The response is more nuanced for “local stewardship” (LU4), depending on the local interpretation of the scenario, and in some cases, ‘greener’ agricultural practice lowers the nutrient concentrations, whilst in others the nutrient concentrations increase in response to increased fertiliser use to improve local yields (e.g., the Vltava, Figure 6, Figure 7 and Figure 8). For all four scenarios, there are also considerable differences in response between sites, reflecting the local mixture of nutrient sources (e.g., agriculture versus wastewater). In most cases, the nutrient concentrations react in the same way independently of the climate model used, but in some instances (notably at the Louros for SRP), the differences between the predictions using different climate models are greater than those between the land scenarios (Figure 6, Figure 7 and Figure 8).
The modelled changes in NO3-N concentrations are greater when there is land use change as well as climate change, except at Beyşehir and the Louros (where all the changes are small; Figure 7). At these sites, the NO3-N concentrations decline in virtually all scenarios, whereas further north there is a mixture of responses depending on the scenario, with in general, the “Environmental” scenarios (LU3, LU4) generating reductions. At the Vltava, the LU4 scenario, however, generated an increase in N as this scenario has a higher proportion of arable land (Table S1). The percentage changes in NO3-N concentrations are generally smaller than those of the TP or SRP concentrations, except at the Yläneenjoki, which may be because the land use scenarios in that catchment involve increases in agricultural area for LU1 and LU2, an increase in vegetation cover during winter (LU3), and the conversion of approximately 15–20% of arable land to forest (LU4; Figure 6, Figure 7 and Figure 8; Table S1).
For TP, the modelled changes in concentration and load are also greater when there is land use as well as climate change (Figure 8a and Figure S4). Clearly the effects of the land use changes will depend on the magnitude of the change modelled, but both the climate and the land use changes are best estimates of the likely scenarios; so, it seems valid to compare them. The “Economic” storylines (LU1 and LU2) usually lead to TP increases, whereas the “Environmental” storylines (LU3 and LU4) lead to declines. However, at the Vltava, the LU2 scenario leads to a decline as well, and at the Louros all scenarios lead to P increases where all scenarios involve an increase in agricultural production to some degree. At the Vansjø-Hobøl, the wetter projected futures (HadRM3, SMHI) result in an increase in TP concentration as the projected land use changes are unable to prevent TP transfers from land to stream during storms. At the Arbúcies catchment, the TP increases in the “Economic” scenarios are very large (Figure 8a). This is due largely to assumptions about population growth (larger in these scenarios) and the effectiveness of the sewage treatment works (poorer in the “Economic” scenarios due to lax regulation and smaller investment); here, the effects of agriculture are minor by comparison.
On the Thames, both the land use changes (LU1 and LU2) involve an increase in intensive agriculture and hence SRP output (Figure 8b). LU3 and LU4 represent the same land use change but with the construction of a reservoir, which changes the seasonal flow pattern but has only a small effect on annual P concentrations. Climate change alone has almost no effect on SRP concentrations in the Thames (Figure 8b). At Beyşehir, the SRP concentrations decline in all scenarios, in tandem with the reduction in water discharge. This includes the climate-change-only scenario and indicates less leaching from a catchment source. The “Environmental” scenarios have greater reductions. At the Vltava, for LU1, the change in SRP followed a similar pattern to TP, but the percentage changes were generally greater, again reflecting the importance of the sewage treatment works in this catchment. At the Finnish site of the Yläneenjoki, the pattern of change in SRP was strikingly different from that of TP, with the economic scenarios generating a larger reduction than the environmental scenarios. It is not clear which features of the catchment or scenario modelling are causing this. For SRP, the pattern whereby land use change has a greater effect than climate change is not as general as with TP. At Beyşehir, the modelled changes due to climate change are large; so, the agricultural changes have less effect relatively.

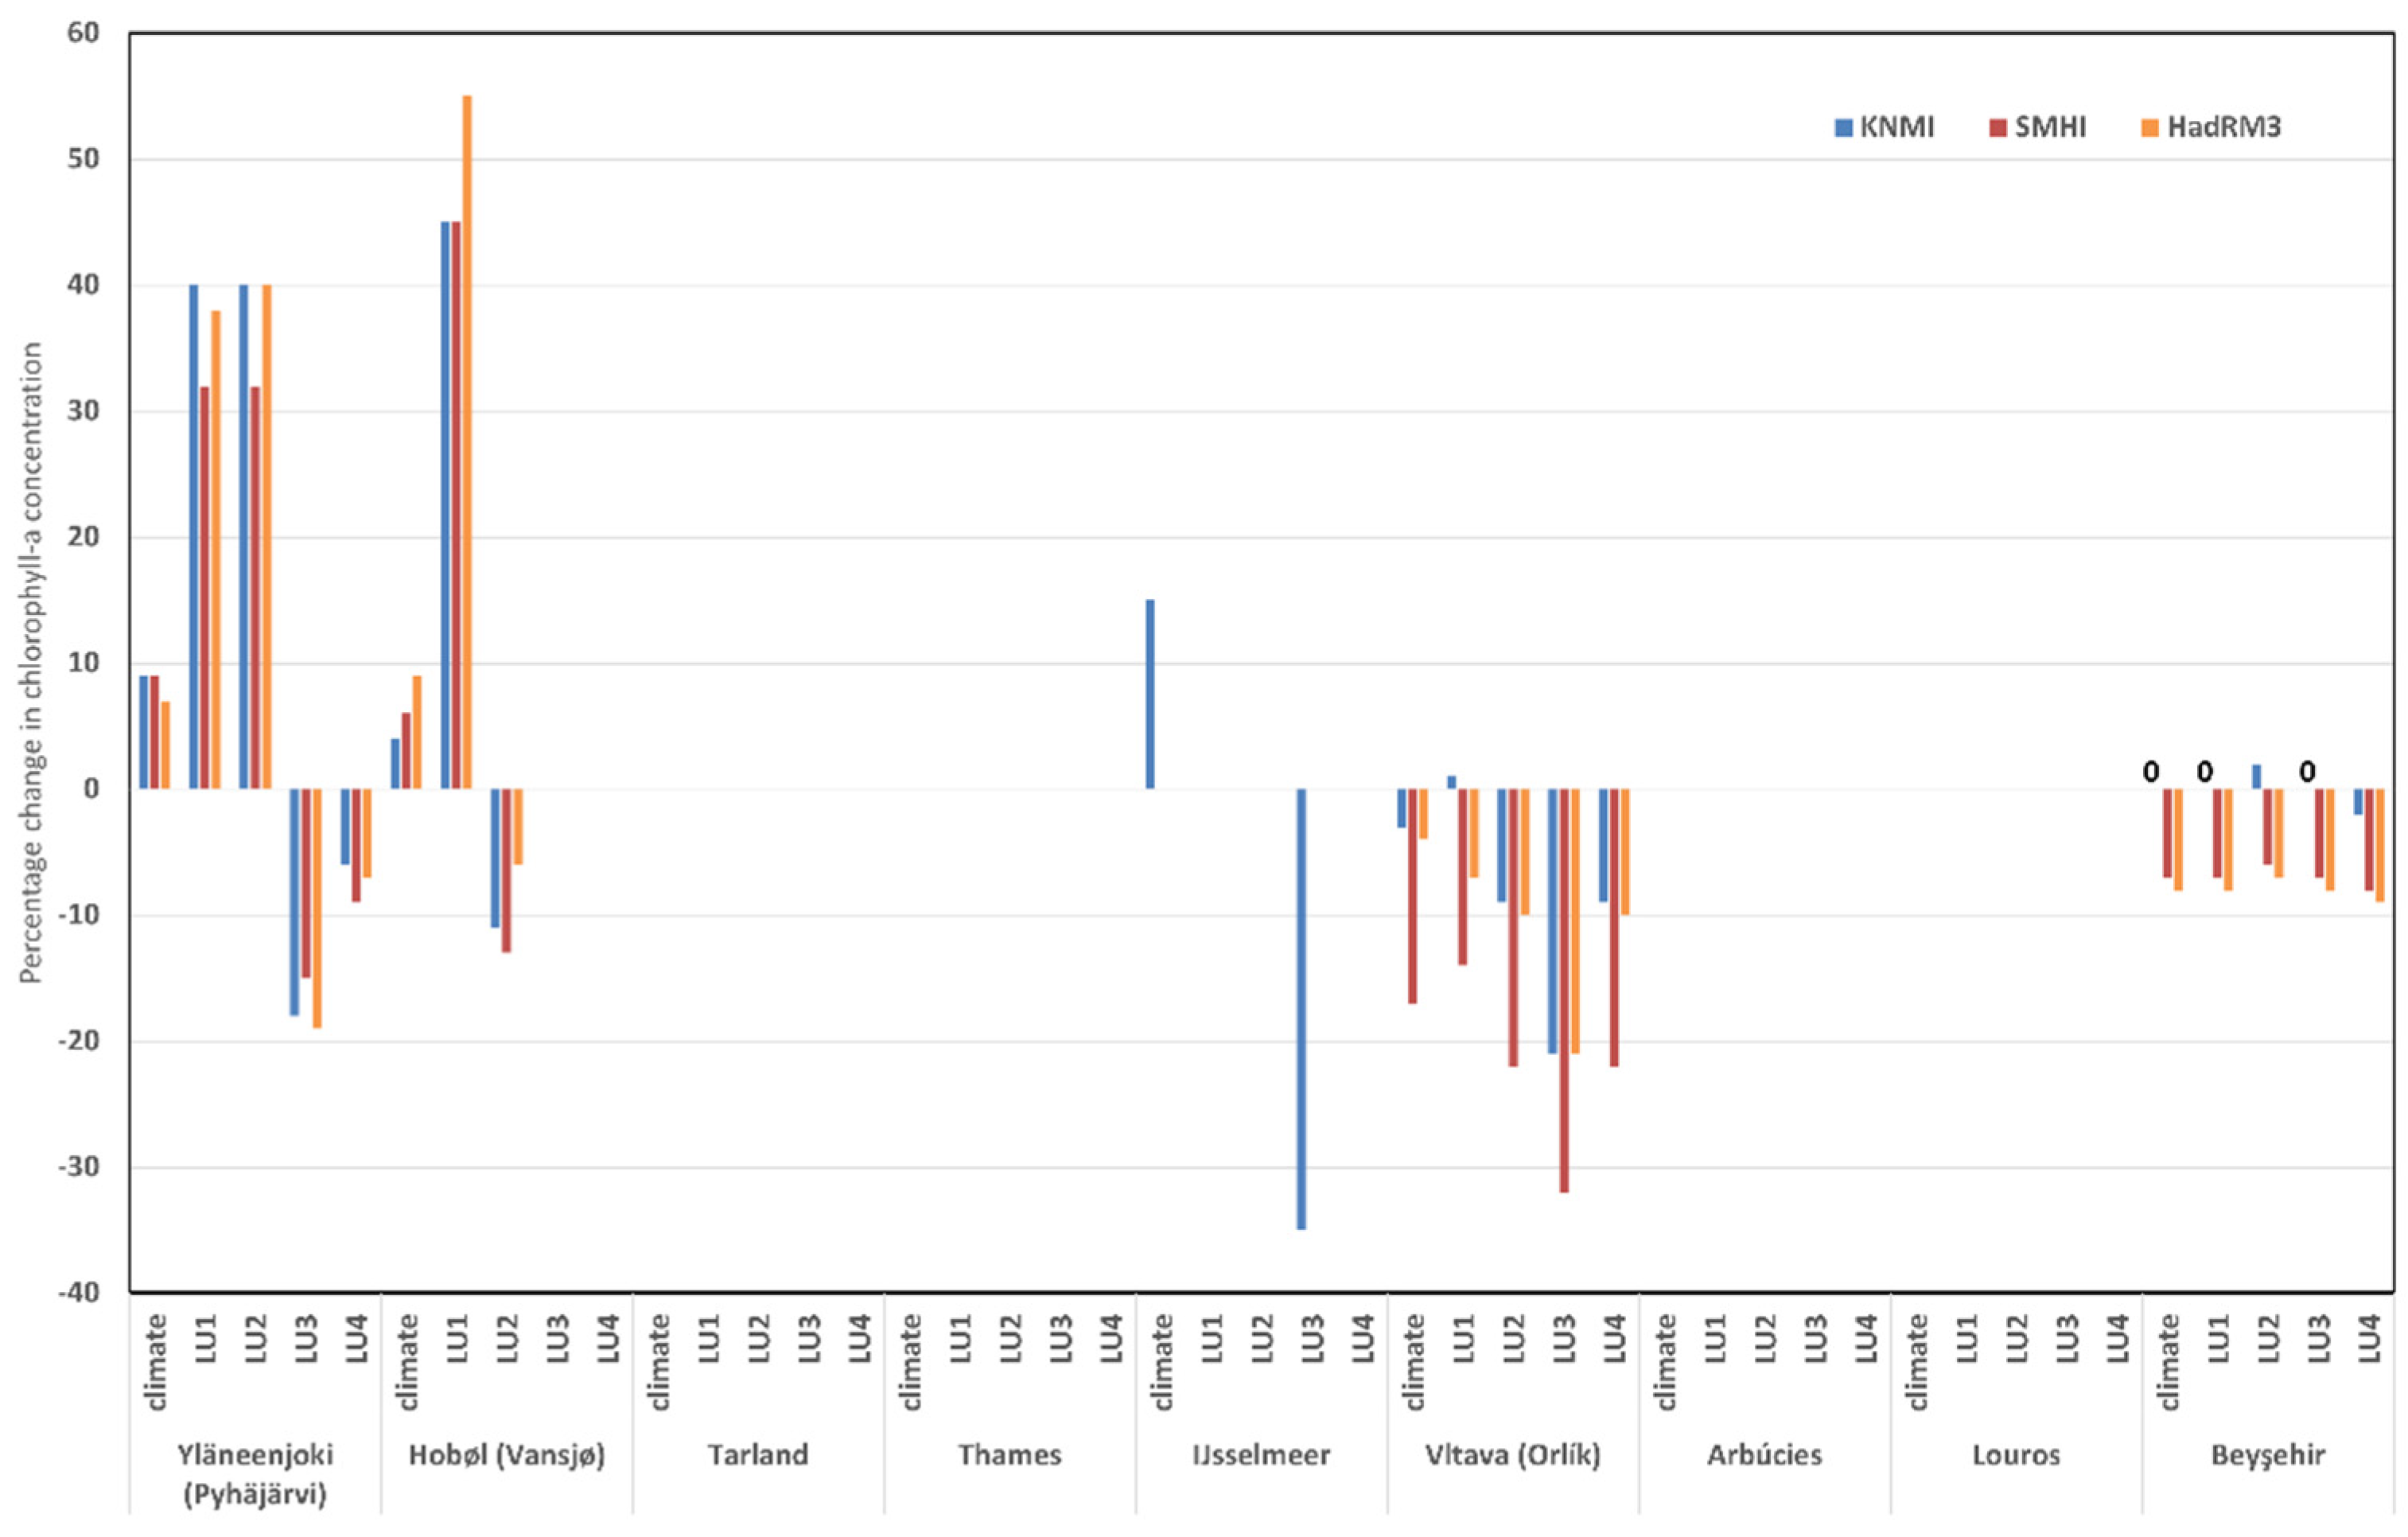
4.5. Projected Change in Lake Nutrient and Chlorophyll Concentrations

Mostly, the changes in nutrient concentrations in lakes due to climate change are only quite small and are smaller than the relative concentration changes in the rivers that feed the lakes [56]. The differences between the predictions of the GCMs are small too. This may be because lakes have mechanisms that buffer concentrations, such as longer residence times and P release from sediments and denitrification, and these reduce the differences between scenarios. Changes in discharge also tend to reduce the differences between scenarios, making lake loadings less variable than the concentrations. The exception is Beyşehir, where reductions in both river discharge and river concentration cause a large change in load (Figures S3 and S5) [32]. The changes in river discharge in the Yläneenjoki, Hobøl, and Vltava are small (1–10%), which makes the input loads of P and N less variable than the concentrations (Figures S3–S5).
Generally, those land use changes designed to reduce lake TP concentrations do so, sometimes considerably, and the pursuit of the “Economic“ land use scenarios increases concentrations [56]. The differences between the GCMs are reduced compared to those in the driving variables, with little consistent pattern. At Pyhäjärvi, the SMHI model leads to smaller changes than the other models, except with LU4. The lake SRP concentrations show a higher percentage of change than for TP at Vansjø-Høbol and the Vltava. In the Vltava catchment (the Orlík Reservoir), the TP increases mostly occur in summer and are associated with low flow situations and lower dilutions of wastewater inputs. In Vansjø-Høbol, the nutrient retention measures employed are responsible for the increases and decreases of SRP [23,56]. In the Orlík reservoir (Vltava), the phosphorus concentrations were highest in the LU1 scenarios, exceeding the 1991–1995 state by approximately 60%, which is more than the corresponding increase in the inflow concentrations. In contrast, the LU3 scenarios showed a smaller decrease than that in the TP and SRP concentrations in the inflow. This suggests that the P retention in the reservoir is controlled by a non-linear function of P loading that is apparently also influenced by the changes in the seasonal hydrological pattern and/or climate variables.
Changes in the chl-a concentration due to land use are generally considerably greater than those due to climate change alone (Figure 9); however, the projected chlorophyll changes are less certain than the other variables. In the northern catchments, Lake Pyhäjärvi in Finland and lake Vansjø in Norway, climate change leads to a small (5–10%) increase in chl-a, intensification land use scenarios produce a further large (30–55%) increase, and sustainable production land use scenarios lead to a reduction (between 1 and 20%; Figure 9). In each case, the changes closely mirror those of TP. Temperature-induced increases in algal growth cause an increase in chl-a at the IJsselmeer due to climate change alone, whereas a move to sustainable production leads to a 35% reduction in primary productivity due to decreased external nutrient loading. The IJsselmeer simulations show that higher temperatures increase stress on Dreissena polymorpha (Zebra mussel) and Osmerus eperlanus (European smelt), reducing food availability for benthivorous and piscivorous birds. At the central European site of Orlík Reservoir (Vltava), a 6–17% chlorophyll decrease due to climate change is attributed to increased P retention in the reservoir due to lower summer flows and higher delivery due to increased winter flows, and land use changes generally caused a 6–32% decrease in chl-a, even when TP increased, again most likely due to increased P retention in the reservoir. Finally, at Beyşehir, the changes in chl-a are largely negative (c. −10%) due to reduced nutrient loading and water flux, and the chl-a changes are substantially smaller than the changes in the water (−16 to −31%) and nutrient (1 to −45%) inputs. At both the Vltava and Beyşehir, there are considerable differences in chl-a concentrations in response to different climate model projections, with the response to KNMI forcing showing a mix of small (0 to 3%) increases and decreases and more consistent and larger decreases (4–17%) in response to SMHI and HadRM3 forcing. Again, this highlights a different lake response, dependent on the driving variables of temperature, precipitation, and discharge, and that HadRM3 has the largest effect on these.

5. Discussion

5.1. The Effect of Climate and Land Cover Change on Stream Water N and P Concentrations

The modelled outcomes suggest that large-scale land use change under “sustainable production” scenarios will reduce nutrient concentrations and loads in general, and there is no evidence that “sustainable production” changes would be less effective under a future climate. In general, the modelled NO3-N concentration changes are greater when there is land use change as well as climate change, except at Beyşehir and the Louros (where all the changes are small). At these two sites, the NO3-N concentrations decline in virtually all scenarios, whereas further north there is a mixture of responses depending on the scenario with, in general, the “sustainable production” scenarios (LU3 and LU4) generating reductions. At the Vltava, the LU4 scenario generated an increase in NO3-N because this scenario has a higher proportion of arable land to provide food locally. For TP, the modelled changes in concentration due to land use change are generally greater than with climate change alone (Figure 8a). For SRP, land use change also generally causes a greater change than climate alone, but at Beyşehir the change due to climate is substantial (less precipitation and higher temperatures); so, the agricultural changes have relatively little effect except for the move to global sustainability (LU4) that shows the greatest SRP percentage decline for concentration. The percentage changes in the nitrate concentrations are generally somewhat smaller than those of the TP or SRP concentrations, except at the Yläneenjoki, where the localised land use scenarios involve large changes in agricultural practice, including greater use of winter cover crops, and a high level of sewage treatment of phosphorus is already in place. The result that ‘local stewardship’ can in some cases increase stream and lake nutrient concentrations is important. This outcome highlights that growing crops in areas with a greater capability for agricultural production, though with higher energy requirements for transportation of crops to market, but with lower nutrient input requirements, might be a more sustainable strategy overall than a focus on local production where more nutrient inputs are needed to improve yields.
The changes in TP concentration due to climate change alone are mostly small, whereas changes in SRP concentration are larger and more variable, both between sites and between climate models. The differences seem mostly due to differences in the types of P source present at each site. Where there is a substantial wastewater input, as at the Vltava site, reducing water volumes increases the instream nutrient concentrations as wastewater inputs are a reasonably constant volume and the reduced dilution of these causes higher TP and SRP concentrations, especially during summer. Where agriculture is the major source of nutrients, loads can decline in proportion to the declining water flux, and hence, concentrations do not change or even decline, as at Beyşehir, where the reduction in SRP is substantial. The NO3-N concentration and load shows little change due to climate change alone, the modelled changes being mostly small declines. Given that the mix of point and diffuse sources is likely to change as catchment size increases, and nutrient retention in lakes, reservoirs, and the groundwater will be important in the largest basins, then a more nuanced understanding of how sources and stores change with catchment size is needed, and current modelled projections that consider diffuse sources only are likely to be too generalized. There is the danger that we are drawing the wrong conclusions because the mix of sources and retention is not yet adequately characterized in our assessments of future nutrient source and transport. It is unclear if larger catchments are as sensitive to nutrient loss during precipitation events as has been observed in small scale studies of agricultural catchments. This further emphasizes the need for more studies of nutrient loss across spatial scales. Given the low explained variance of the nutrient simulations, large uncertainty remains regarding nutrient availability and transport under high flows in large catchments, and more field data are needed from nested catchment studies to determine if greater precipitation intensity will increase nutrient loading along a continuum of small (<10 km2) to large (>10,000 km2) catchment areas [57,58].

5.2. The Strength of Observational Evidence to Support the Model-Based Assessments

A 140-year dataset for the River Thames, UK, provides evidence for a strong link between stream water nitrate concentrations and land use, rather than climate, where increased arable area and fertiliser application rates correlate to a four-fold increase in stream water NO3-N concentrations [59]. At the global scale, the density of water quality observations is low outside developed countries, and therefore, it is difficult to determine current trends in stream and lake water N, P, and chl-a concentrations. Those data that do exist also show a strong link between stream water N and P concentrations and land use and land cover change, with increases in total phosphorus loadings to lakes evident in east Asia and South America where fertiliser application is high, and some reductions in central Asia are likely due to lower fertiliser application following the separation of the former Soviet Union into multiple, independent states [60]. In the USA, there is little evidence of a clear trend in stream water N and P concentrations [61]. Across Europe, recent decreases in stream and lake water N and P have been observed, and these have largely been ascribed to more efficient, or lower, fertiliser and manure use and a greater removal of nutrients during wastewater treatment [62,63]. In China, reductions in stream water P have also been observed in response to improved wastewater treatment [64]. Thus, at the larger (>50 km2) spatial scales, there is observational evidence that supports the model-based assertions made here and elsewhere [12], namely that land use is the dominant control on stream water nutrient concentrations, rather than climate, and a stream water nutrient response can be expected in response to land use change if the change is sufficient to outweigh any P legacy effect [65,66].

5.3. Comparison with Other Projections of Future Change in Nutrient Concentrations

Comparison of the modelled trend gradient and absolute change in the stream water nutrients, between this study and others, is difficult and highlights a current lack of consistency in approach because such assessments are at an exploratory stage. Current studies tend to focus on either nutrient concentration or load, report results either for rivers or lakes, but not both, focus on catchments of a specific scale only, ignore the mixture of diffuse and point sources, and consider different future periods for scenario analysis. Some comparison was possible with the study of Mack et al., 2019 [11], and there is agreement on the small degree of expected change in catchments in Finland and Norway in response to climate and land use change. Comparison of general trends (i.e., an increase or decrease) is possible and observational and model-based studies demonstrate that stream water concentrations do respond to land cover change and that there is societal choice on the balance between food production, profitability, urbanisation, and the environment [4,11,14,67]. However, questions remain about the degree of land use change necessary and about how long before a response is observed. Reductions in P inputs of between 20 to 80% and in N inputs of between 9 to 57% have been suggested in general to mitigate increased losses due to projected increases in precipitation intensity [14]. In the Louros catchment, discussions with stakeholders suggest that a reduction of 50 to 75% in P input is feasible [30]. Decreases in SRP have already been observed in the Vansjø-Høbol and Ylaneejoki catchments in response to greater use of winter cover crops, buffer strips, and wastewater treatment. To help answer the question about how much nutrient reduction is needed, all model-based assessments need to report the input reduction together with the change in the nutrient output concentration and load.
Numerous modelling studies have looked at the projected changes in the stream water nutrient concentrations of the River Thames with the modelled response to climate change alone, suggesting only a relatively small change in nitrate concentrations [36]. Consideration of the co-evolution of climate and land cover change also suggests that the stream water nitrate changes will be small [67]. This is likely because of the large store of groundwater nitrate which continues to move to the stream network irrespective of land cover change [68]. Much bigger changes are projected for SRP because the simulated land cover change has a much greater impact [10]. This emphasizes the need to consider long-term changes due to the legacy of pollutants in groundwater, soils, and bed sediments to determine when changes in the stream water concentrations might occur [4,9,68] and whether N and P can be reduced together by targeting the same sources. A previous study of the River Kennet, which is a tributary of the Thames, has suggested stream water NO3-N reductions may occur through denitrification because of higher temperatures [9], and further work is needed to quantify the importance of this N transformation pathway across a range of catchment types and river lengths.
There is also a need to consider both stream water concentrations and loads, as concentration may change in a different direction to load due to changes in flow. Concentration is important for biological impacts, whereas the load describes delivery to lake, coastal, and estuarine areas. Load will almost always increase with increased flow, but concentration is important especially during ecologically sensitive periods such as summer low flows. Model-based assessments also need to account for exhaustion of the N and P supply, which is evident from detailed studies of nutrient transport, and at the continental and global scale, nutrient retention in lakes and reservoirs is also important [13,69].
The model projections presented are a first step towards quantifying how proposed land use change will affect stream water N and P concentrations given projected climate change. Given that the results suggest that the ‘environmental’ land use changes proposed here reduce N and P concentrations and remain effective despite climate change, then a next step is to explore more specific land-management practices (e.g., Nature Based Solutions), and which of these might be most effective, or whether only large-scale land use change will result in change. This next step will need to consider that N and P differ in their availability to crops dependent on the applied form (i.e., fertilizers, manures, and wastewater applications) with P typically being less available than the supplied N. More nuanced assessments will also need to consider crop N and P requirements and yield response, predominant transport pathways, and the legacy N and P that has built in groundwaters (N) and catchment soils and stream and lake-bed sediments (P) that can provide a significant internal loading to freshwaters.

5.4. Will Reductions in Nutrient Concentrations Lead to Better Freshwater Ecology?

Where nutrients have been reduced, a commensurate reduction in stream and lake water algal blooms or improvement in plant diversity has not always been observed [70]. This has been ascribed to local factors typically, including internal loading of P that maintains high P concentrations in the reach or lake water column [71], long residence times of NO3-N stored in groundwater-dominated catchments [68,72], and the complexity of aquatic ecology in which many factors, including planned and inadvertent species introductions, affect the ecosystem. Reach-scale and lake light and temperature regimes have also been found to be as, if not more, important for primary production than nutrient concentrations in some cases [7,73]. Thus, whilst moves to more sustainable production will likely reduce freshwater N and P concentrations, the ecological response is far less predictable, as demonstrated here where the modelled lake nutrient and chl-a concentrations are far more variable than those in the stream water. The result from the IJsselmeer study is an interesting one, namely that the reduction in primary productivity due to NO3-N reduction will provide less food for birds, which emphasizes the need for a whole ecosystem view.

6. Conclusions

The simulations of the observed stream water flow, NO3-N, TP, and SRP and lake chl-a concentrations were satisfactory and sufficient to further explore future changes in the mean annual flows and concentrations (Objective 1). Building models that adequately represent the flow and concentration extremes for rivers and lakes remains challenging due to issues around adequate characterization of the model inputs, the representation of catchment water and pollutant storage and transport, and the complex and multiple physiochemical and biological interactions in lake ecosystems. The under-representation of high flow events in water quality monitoring networks often means there are insufficient data to constrain water quality models.
The projected effects of future climate and land use change on stream flow and stream and lake N, P, and chl-a concentrations differ between the northern and southern sites. Considering climate change alone, then in the north and mid-latitudes of Europe, the projected increases in temperatures are balanced to some extent by increased precipitation, leading to relatively small effects on water flows. In the south, at low altitudes, increased temperatures and lower precipitation act in the same direction to reduce water flows considerably. In the case of Lake Beyşehir in neighbouring Turkey, this may even lead to the lake drying up in the foreseeable future, and this effect would far outweigh any nutrient-related problems. In general, in the north and mid-latitudes of Europe, the effects of climate change alone on nutrient concentrations and loads are rather small except where point sources dominate, and reduced flows lead to less dilution of sewage inputs or in those catchments where soil bound P transport during storms is substantial and may therefore increase in the future (Objective 2). The effects due to large-scale land use change are generally much larger, with environmentally focused land use change generally reducing N and P concentrations (Objective 3). Thus, there is considerable potential to reduce the nutrient concentrations and loads across Europe despite projected climate change. Adoption of land use practices, equivalent to the sustainable production land use scenarios, would mitigate climate-induced changes even in some southern European sites at higher elevations. More accurate quantification of nutrient transport during periods of intense rainfall in large catchments is needed to reduce uncertainty in nutrient concentration and load simulation.
Modelled lake chl-a changes were not generally proportional to the changes in nutrient inputs (Objective 4). Ecological change can be less than the nutrient change (e.g., chlorophyll at Lake Beyşehir and the Orlík Reservoir in the Czech Republic) or greater due to complex food web interactions (e.g., at the IJsselmeer). Of all the projections in this study, the lake chlorophyll concentrations have the greatest uncertainty, and thus, the current emphasis to understand better the aquatic ecosystem response to multiple drivers of change is appropriate. Given the socio-economic implications of a shift to more sustainable agriculture practices, a better quantified understanding of how reductions in N and P translate to an ecosystem response seems imperative.

Supplementary Materials

The following supporting information can be downloaded at: https://www.mdpi.com/article/10.3390/w14050829/s1, Table S1. Description of land use (including wastewater treatment), water use and nitrogen deposition changes under the scenarios: LU1 = SRES A1, World market; LU2 = SRES A2, National enterprise, LU3 = SRES B1, Global sustainability, LU4 = SRES B2, Local stewardship. Nitrogen deposition was modelled based on European Monitoring and Evaluation Programme data and a chemical transport model developed at the Meteorological Synthesizing Centre–West (MSC-W). Wet and dry forms and land cover where accounted for in the catchment nitrogen deposition estimate. Further details are given in Jackson-Blake et al., 2008. Table S2. Summary of GCM-RCM model combinations and land use scenarios consisdered at each study area. For some study areas, there are two rows to note that the climate model combinsations and land use scenarios varied when considering different aspects of water quality. This was done to make best use of existing model set-ups and simulations to integrate these within the study and increase the number of model simulations overall. Figure S1. Mean air temperatures, present (1981–2010) and future (2031–2060), at the study areas based on runs with three different climate models: ECHAM5-KNMI (blue); SMHIRCA-BCM (red); and HadRM3P-HadCM3Q0 (orange). At some sites, observed temperatures are used instead of modelled values (purple). Figure S2. Mean annual precipitation, present (1981–2010) and future (2031–2060), at the study sites based on runs with three different climate models: ECHAM5-KNMI (blue); SMHIRCA-BCM (red); and HadRM3P-HadCM3Q0 (orange). At some sites, observed precipitation was used instead of modelled values (purple). Figure S3. The percentage change in stream water nitrate load at each of the study areas between the baseline (1981–2010) and future (2031–2060) periods due to climate change (climate) and climate and land cover change (LU1–4). Blank columns indicate that GCM-RCM combination was not used for a study site. A ‘0’ notes a percentage change of zero. Figure S4. The percentage change in stream water total phosphorus load at each of the study areas between the baseline (1981–2010) and future (2031–2060) periods due to climate change (climate) and climate and land cover change (LU1–4). Blank columns indicate that GCM-RCM combination was not used for a study site. A ‘0’ notes a percentage change of zero. Figure S5. The percentage change in stream water soluble reactive phosphorus load at each of the study areas between the baseline (1981–2010) and future (2031–2060) periods due to climate change (climate) and climate and land cover change (LU1–4). Blank columns indicate that GCM-RCM combination was not used for a study site. A ‘0’ notes a percentage change of zero.

Author Contributions

Conceptualization, A.J.W. and R.A.S.; methodology, R.-M.C., M.E.L., S.G., S.J.H., V.H., J.H., L.A.J.-B., A.L., E.P., J.L.R., K.R., M.S., D.T., P.G.W., D.P. and D.S.; software, A.J.W., L.A.J.-B., A.L., K.R. and P.G.W.; formal analysis, R.-M.C., M.E.L., S.G., S.J.H., V.H., J.H., L.A.J.-B., A.L., E.P., J.L.R., K.R., M.S., D.T., P.G.W., D.P. and D.S.; writing—original draft preparation, A.J.W. and R.A.S.; writing—review and editing, R.-M.C., M.E.L., S.G., S.J.H., V.H., J.H., L.A.J.-B., A.L., E.P., J.L.R., K.R., M.S., D.T., P.G.W., D.P. and D.S.; visualization, A.J.W. and R.A.S.; project administration, A.J.W. and R.A.S. All authors have read and agreed to the published version of the manuscript.

Funding

This research was funded by the European Union’s Seventh Programme for research and technological development including demonstration activities under grant number 244121. The FIRI2021 HYDRO-RI platform was supported by the Academy of Finland (grant 346165).

Institutional Review Board Statement

Not applicable.

Informed Consent Statement

Not applicable.

Data Availability Statement

The data presented in this study are available on request from the authors responsible for each case study, though some of the data may be held by third parties and permission would need to be sought to obtain those data. Further details about the data used and detailed reports about the model applications, including the data used and the sources, are given in individual case study project reports, and these are cited in Table 2.

Conflicts of Interest

The authors declare no conflict of interest. The funders had no role in the design of the study; in the collection, analyses, or interpretation of data; in the writing of the manuscript; or in the decision to publish the results.

References

  1. Smith, V.H.; Tilman, G.D.; Nekola, J.C. Eutrophication: Impacts of excess nutrient inputs on freshwater, marine, and terrestrial ecosystems. Environ. Pollut. 1999, 100, 179–196. [Google Scholar] [CrossRef]
  2. Robins, P.E.; Skov, M.W.; Lewis, M.J.; Gimenez, L.; Davies, A.G.; Malham, S.K.; Neill, S.P.; McDonald, J.E.; Whitton, T.A.; Jackson, S.E.; et al. Impact of climate change on UK estuaries: A review of past trends and potential projections. Estuar. Coast. Shelf Sci. 2016, 169, 119–135. [Google Scholar] [CrossRef] [Green Version]
  3. Carpenter, S.R.; Caraco, N.F.; Correll, D.L.; Howarth, R.W.; Sharpley, A.N.; Smith, V.H. Nonpoint pollution of surface waters with phosphorus and nitrogen. Ecol. Appl. 1998, 8, 559–568. [Google Scholar] [CrossRef]
  4. Ockenden, M.C.; Hollaway, M.J.; Beven, K.J.; Collins, A.L.; Evans, R.; Falloon, P.D.; Forber, K.J.; Hiscock, K.M.; Kahana, R.; Macleod, C.J.A.; et al. Major agricultural changes required to mitigate phosphorus losses under climate change. Nat. Commun. 2017, 8, 161. [Google Scholar] [CrossRef] [Green Version]
  5. Whitehead, P.G.; Wilby, R.L.; Battarbee, R.W.; Kernan, M.; Wade, A.J. A review of the potential impacts of climate change on surface water quality. Hydrol. Sci. J. 2009, 54, 101–123. [Google Scholar] [CrossRef]
  6. Michalak, A.M. Study role of climate change in extreme threats to water quality. Nature 2016, 535, 349–350. [Google Scholar] [CrossRef]
  7. Bowes, M.J.; Loewenthal, M.; Read, D.S.; Hutchins, M.G.; Prudhomme, C.; Armstrong, L.K.; Harman, S.A.; Wickham, H.D.; Gozzard, E.; Carvalho, L. Identifying multiple stressor controls on phytoplankton dynamics in the River Thames (UK) using high-frequency water quality data. Sci. Total Environ. 2016, 569, 1489–1499. [Google Scholar] [CrossRef] [Green Version]
  8. Withers, P.J.A.; Neal, C.; Jarvie, H.P.; Doody, D.G. Agriculture and eutrophication: Where do we go from here? Sustainability 2014, 6, 5853–5875. [Google Scholar] [CrossRef] [Green Version]
  9. Wilby, R.L.; Whitehead, P.G.; Wade, A.J.; Butterfield, D.; Davis, R.J.; Watts, G. Integrated modelling of climate change impacts on water resources and quality in a lowland catchment: River Kennet, UK. J. Hydrol. 2006, 330, 204–220. [Google Scholar] [CrossRef]
  10. Crossman, J.; Whitehead, P.G.; Futter, M.N.; Jin, L.; Shahgedanova, M.; Castellazzi, M.; Wade, A.J. The interactive responses of water quality and hydrology to changes in multiple stressors, and implications for the long-term effective management of phosphorus. Sci. Total Environ. 2013, 454, 230–244. [Google Scholar] [CrossRef]
  11. Mack, L.; Andersen, H.E.; Beklioglu, M.; Bucak, T.; Couture, R.M.; Cremona, F.; Ferreira, M.T.; Hutchins, M.G.; Mischke, U.; Molina-Navarro, E.; et al. The future depends on what we do today—Projecting Europe’s surface water quality into three different future scenarios. Sci. Total Environ. 2019, 668, 470–484. [Google Scholar] [CrossRef] [PubMed]
  12. Reder, K.; Barlund, I.; Voss, A.; Kynast, E.; Williams, R.; Malve, O.; Florke, M. European scenario studies on future in-stream nutrient concentrations. Trans. Asabe 2013, 56, 1407–1417. [Google Scholar]
  13. Beusen, A.H.W.; Bouwman, A.F.; Van Beek, L.P.H.; Mogollon, J.M.; Middelburg, J.J. Global riverine N and P transport to ocean increased during the 20th century despite increased retention along the aquatic continuum. Biogeosciences 2016, 13, 2441–2451. [Google Scholar] [CrossRef] [Green Version]
  14. Sinha, E.; Michalak, A.M.; Balaji, V. Eutrophication will increase during the 21st century as a result of precipitation changes. Science 2017, 357, 405–408. [Google Scholar] [CrossRef] [PubMed] [Green Version]
  15. Kronvang, B.; Behrendt, H.; Andersen, H.E.; Arheimer, B.; Barr, A.; Borgvang, S.A.; Bouraoui, F.; Granlund, K.; Grizzetti, B.; Groenendijk, P.; et al. Ensemble modelling of nutrient loads and nutrient load partitioning in 17 European catchments. J. Environ. Monit. 2009, 11, 572–583. [Google Scholar] [CrossRef]
  16. Hurkmans, R.; Terink, W.; Uijlenhoet, R.; Torfs, P.; Jacob, D.; Troch, P.A. Changes in Streamflow Dynamics in the Rhine Basin under Three High-Resolution Regional Climate Scenarios. J. Clim. 2010, 23, 679–699. [Google Scholar] [CrossRef] [Green Version]
  17. Wade, A.J.; Skeffington, R.A.; Couture, R.M.; Erlandsson, M.; Groot, S.; Halliday, S.J.; Harelzak, V.; Hejzlar, J.; Jackson-Blake, L.A.; Lepisto, A.; et al. The REFRESH Common Modelling Framework for the Demonstration Catchments; University College London: London, UK, 2013; p. 27. Available online: http://www.refresh.ucl.ac.uk/webfm_send/1968 (accessed on 10 January 2022).
  18. Schelske, C.L.; Stoermer, E.F.; Fahnenstiel, G.L.; Haibach, M. Phosphorus enrichment, silica utilization, and biogeochemical silica depletion in the Great Lakes. Can. J. Fish. Aquat. Sci. 1986, 43, 407–415. [Google Scholar] [CrossRef]
  19. Harelzak, V.; Groot, S.; Duel, H. Final Report on the Biophysical Modelling of Lake Ijsselmeer; University College London: London, UK, 2014; p. 44. Available online: http://www.refresh.ucl.ac.uk/webfm_send/2389 (accessed on 10 January 2022).
  20. Rankinen, K.; Granlund, K.; Futter, M.N.; Butterfield, D.; Wade, A.J.; Skeffington, R.; Arvola, L.; Veijalainen, N.; Huttunen, I.; Lepisto, A. Controls on inorganic nitrogen leaching from Finnish catchments assessed using a sensitivity and uncertainty analysis of the INCA-N model. Boreal Environ. Res. 2013, 18, 373–386. [Google Scholar]
  21. Etheridge, J.R.; Lepisto, A.; Granlund, K.; Rankinen, K.; Birgand, F.; Burchell, M.R. Reducing uncertainty in the calibration and validation of the INCA-N model by using soft data. Hydrol. Res. 2014, 45, 73–88. [Google Scholar] [CrossRef]
  22. Lepistö, A.; Etheridge, J.R.; Granlund, K.; Kotamäki, N.; Malve, O.; Rankinen, K.; Varjopuro, R. Report on the Biophysical Catchment-Scale Modelling of Yläneenjoki–Pyhäjärvi Demonstration Site; University College London: London, UK, 2014; p. 67. Available online: http://www.refresh.ucl.ac.uk/webfm_send/2161 (accessed on 10 January 2022).
  23. Couture, R.M.; Tominaga, K.; Starrfelt, J.; Moe, S.J.; Kaste, Ø.; Wright, R.; Farkas, C.; Engebretsen, A. Report on the Catchment-scale Modelling of the Vansjø-Hobøl and Skuterud Catchments, Norway; University College London: London, UK, 2014; p. 59. Available online: http://www.refresh.ucl.ac.uk/webfm_send/2209 (accessed on 10 January 2022).
  24. Couture, R.M.; Tominaga, K.; Starrfelt, J.; Moe, S.J.; Kaste, O.; Wright, R.F. Modelling phosphorus loading and algal blooms in a Nordic agricultural catchment-lake system under changing land-use and climate. Environ. Sci.-Processes Impacts 2014, 16, 1588–1599. [Google Scholar] [CrossRef] [Green Version]
  25. Couture, R.-M.; Moe, S.J.; Lin, Y.; Kaste, Ø.; Haande, S.; Lyche Solheim, A. Simulating water quality and ecological status of Lake Vansjø, Norway, under land-use and climate change by linking process-oriented models with a Bayesian network. Sci. Total Environ. 2018, 621, 713–724. [Google Scholar] [CrossRef]
  26. Jackson-Blake, B.M.; Dunn, S.M.; Hershkovitz, Y.; Sample, J.; Helliwell, R.C.; Balana, B. Biophysical Catchment-Scale Modelling in the River Dee Catchment, Scotland; University College London: London, UK, 2014; p. 111. Available online: http://www.refresh.ucl.ac.uk/webfm_send/2163 (accessed on 10 January 2022).
  27. Jackson-Blake, L.A.; Wade, A.J.; Futter, M.N.; Butterfield, D.; Couture, R.M.; Cox, B.A.; Crossman, J.; Ekholm, P.; Halliday, S.J.; Jin, L.; et al. The Integrated Catchment model of phosphorus dynamics (INCA-P): Description and demonstration of new model structure and equations. Environ. Model. Softw. 2016, 83, 356–386. [Google Scholar] [CrossRef] [Green Version]
  28. Hejzlar, J.; Jarošík, J.; Kopáček, J. River Vltava Modelling, Final Report; University College London: London, UK, 2014; p. 32. Available online: http://www.refresh.ucl.ac.uk/webfm_send/2387 (accessed on 10 January 2022).
  29. Erlandsson, M.; Wade, A.J.; Riera, J.L.; Puig, M.; Skeffington, R.A.; Halliday, S.J. River Arbúcies Biophysical Modelling, Final Report; University College London: London, UK, 2014; p. 67. Available online: http://www.refresh.ucl.ac.uk/webfm_send/2255 (accessed on 10 January 2022).
  30. Erlandsson, M.; Wade, A.J.; Hershkovitz, Y.; Papadaki, C.; Manolaki, P.; Papastergiadou, E. River Louros Modeling, Final Report; University College London: London, UK, 2014; p. 53. Available online: http://www.refresh.ucl.ac.uk/webfm_send/2162 (accessed on 10 January 2022).
  31. Beklioğlu, M.; Bucak, T.; Erdoğan, S.; Çakıroğlu, A.I.; Trolle, D.; Andersen, H.E.; Thodsen, H.; Elliott, J.A. Lake Beyşehir Modelling: Final Report; University College London: London, UK, 2014; p. 30. Available online: http://www.refresh.ucl.ac.uk/webfm_send/2158 (accessed on 10 January 2022).
  32. Bucak, T.; Trolle, D.; Andersen, H.E.; Thodsen, H.; Erdogan, S.; Levi, E.E.; Filiz, N.; Jeppesen, E.; Beklioglu, M. Future water availability in the largest freshwater Mediterranean lake is at great risk as evidenced from simulations with the SWAT model. Sci. Total Environ. 2017, 581, 413–425. [Google Scholar] [CrossRef] [PubMed]
  33. Bucak, T.; Trolle, D.; Tavsanoglu, U.N.; Cakiroglu, A.I.; Ozen, A.; Jeppesen, E.; Beklioglu, M. Modeling the effects of climatic and land use changes on phytoplankton and water quality of the largest Turkish freshwater lake: Lake Beysehir. Sci. Total Environ. 2017, 621, 802–816. [Google Scholar] [CrossRef] [PubMed]
  34. Skarbøvik, E.; Haande, S.; Bechmann, M. Overvåking Vansjø/Morsa 2011–2012; Resultater fra overvåkingen I perioden oktober 2011 til oktober 2012; Bioforsk: Ås, Norway, 2013; Volume 8, p. 212. [Google Scholar]
  35. Skarbøvik, E.; Bechmann, M.E. Some Characteristics of the Vansjø-Hobøl (Morsa) Catchment; Bioforsk Soil and Environment: Ås, Norway, 2010; p. 44. [Google Scholar]
  36. Jin, L.; Whitehead, P.G.; Futter, M.N.; Lu, Z.L. Modelling the impacts of climate change on flow and nitrate in the River Thames: Assessing potential adaptation strategies. Hydrol. Res. 2012, 43, 902–916. [Google Scholar] [CrossRef]
  37. Ovezikoglou, V.; Ladakis, M.; Dassenakis, M.; Skoullos, M. The fluctuation of nutrients and organic carbon in the waters of some rivers in the Western Greece. In Proceedings of the 8th International Conference on Environmental Science and Technology, Lemnos Island, Greece, 8–10 September 2003; pp. 628–632. [Google Scholar]
  38. Mackereth, F.J.H.; Heron, J.; Talling, J.F. Water Analysis: Some revised methods for limnologists. Freshw. Biol. Assoc. Sci. Publ. 1978, 36, 117. [Google Scholar]
  39. Jespersen, A.M.; Christoffersen, K. Measurements of chlorophyll-a from phytoplankton using ethanol as extraction solvent. Arch. Hydrobiol. 1987, 109, 445–454. [Google Scholar]
  40. Wade, A.J.; Durand, P.; Beaujouan, V.; Wessel, W.W.; Raat, K.J.; Whitehead, P.G.; Butterfield, D.; Rankinen, K.; Lepisto, A. A nitrogen model for European catchments: INCA, new model structure and equations. Hydrol. Earth Syst. Sci. 2002, 6, 559–582. [Google Scholar] [CrossRef]
  41. Arnold, J.G.; Moriasi, D.N.; Gassman, P.W.; Abbaspour, K.C.; White, M.J.; Srinivasan, R.; Santhi, C.; Harmel, R.D.; van Griensven, A.; Van Liew, M.W.; et al. SWAT: Model use, calibration, and validation. Trans. Asabe 2012, 55, 1491–1508. [Google Scholar] [CrossRef]
  42. Dunn, S.M.; McDonnell, J.J.; Vache, K.B. Factors influencing the residence time of catchment waters: A virtual experiment approach. Water Resour. Res. 2007, 43, W06408. [Google Scholar] [CrossRef] [Green Version]
  43. Hamilton, D.P.; Schladow, S.G. Prediction of water quality in lakes and reservoirs. 1. Model description. Ecol. Model. 1997, 96, 91–110. [Google Scholar] [CrossRef]
  44. Schladow, S.G.; Hamilton, D.P. Prediction of water quality in lakes and reservoirs. 2. Model calibration, sensitivity analysis and application. Ecol. Model. 1997, 96, 111–123. [Google Scholar] [CrossRef]
  45. Elliott, J.A.; Irish, A.E.; Reynolds, C.S. Modelling phytoplankton dynamics in fresh waters: Affirmation of the PROTECH approach to simulation. Freshw. Rev. 2010, 3, 75–96. [Google Scholar] [CrossRef]
  46. Janse, J.H. A model of nutrient dynamics in shallow lakes in relation to multiple stable states. Hydrobiologia 1997, 342, 1–8. [Google Scholar]
  47. Kotamaki, N.; Patynen, A.; Taskinen, A.; Huttula, T.; Malve, O. Statistical dimensioning of nutrient loading reduction: LLR assessment tool for lake managers. Environ. Manag. 2015, 56, 480–491. [Google Scholar] [CrossRef] [PubMed]
  48. Saloranta, T.M.; Andersen, T. MyLake—A multi-year lake simulation model code suitable for uncertainty and sensitivity analysis simulations. Ecol. Model. 2007, 207, 45–60. [Google Scholar] [CrossRef]
  49. Cole, T.M.; Wells, S.A. CE-QUAL-W2: A Two-Dimensional, Laterally Averaged, Hydrodynamic and Water Quality Model, 3.7; Department of Civil and Environmental Engineering, Portland State University: Portland, OR, USA, 2011. [Google Scholar]
  50. Jackson-Blake, L.A.; Starrfelt, J. Do higher data frequency and Bayesian auto-calibration lead to better model calibration? Insights from an application of INCA-P, a process-based river phosphorus model. J. Hydrol. 2015, 527, 641–655. [Google Scholar] [CrossRef]
  51. Jolliff, J.K.; Kindle, J.C.; Shulman, I.; Penta, B.; Friedrichs, M.A.M.; Helber, R.; Arnone, R.A. Summary diagrams for coupled hydrodynamic-ecosystem model skill assessment. J. Mar. Syst. 2009, 76, 64–82. [Google Scholar] [CrossRef]
  52. van der Linden, P.; Mitchell, J.F.B. ENSEMBLES: Climate Change and Its Impacts: Summary of Research and Results from the ENSEMBLES Project; Met Office Hadley Centre: Exeter, UK, 2009; p. 160. [Google Scholar]
  53. Nakicenovic, N.; Alcamo, J.; Davis, G.; de Vries, H.J.M.; Fenhann, J.; Gaffin, S.; Gregory, K.; Grubler, A.; Jung, T.Y.; Kram, T.; et al. IPCC Special Report: Emissions Scenarios; Cambridge University Press: Cambridge, UK, 2000; p. 570. [Google Scholar]
  54. Jackson-Blake, L.A.; Dunn, S.M.; Helliwell, R.C.; Skeffington, R.A.; Stutter, M.I.; Wade, A.J. How well can we model stream phosphorus concentrations in agricultural catchments? Environ. Model. Softw. 2015, 64, 31–46. [Google Scholar] [CrossRef]
  55. Kumar, D.; Kodra, E.; Ganguly, A.R. Regional and seasonal intercomparison of CMIP3 and CMIP5 climate model ensembles for temperature and precipitation. Clim. Dyn. 2014, 43, 2491–2518. [Google Scholar] [CrossRef]
  56. Skeffington, R.A.; Wade, A.J.; Couture, R.M.; Erlandsson, M.; Groot, S.; Halliday, S.J.; Harelzak, V.; Hejzlar, J.; Jackson-Blake, L.A.; Lepisto, A.; et al. Integrated Catchment Biophysical Modelling: Synthesis Report; University College London: London, UK, 2014; p. 44. Available online: http://www.refresh.ucl.ac.uk/webfm_send/2383 (accessed on 10 January 2022).
  57. Arnell, N.W.; Halliday, S.J.; Battarbee, R.W.; Skeffington, R.A.; Wade, A.J. The implications of climate change for the water environment in England. Prog. Phys. Geogr. 2015, 39, 93–120. [Google Scholar] [CrossRef] [Green Version]
  58. Wade, A.J.; Palmer-Felgate, E.J.; Halliday, S.J.; Skeffington, R.A.; Loewenthal, M.; Jarvie, H.P.; Bowes, M.J.; Greenway, G.M.; Haswell, S.J.; Bell, I.M.; et al. Hydrochemical processes in lowland rivers: Insights from in situ, high-resolution monitoring. Hydrol. Earth Syst. Sci. 2012, 16, 4323–4342. [Google Scholar] [CrossRef] [Green Version]
  59. Howden, N.J.K.; Burt, T.P.; Worrall, F.; Whelan, M.J.; Bieroza, M. Nitrate concentrations and fluxes in the River Thames over 140 years (1868–2008): Are increases irreversible? Hydrol. Processes 2010, 24, 2657–2662. [Google Scholar] [CrossRef]
  60. UNEP. A Snapshot of the World’s Water Quality: Towards a Global Assessment; United Nations Environment Programme: Nairobi, Kenya, 2016; p. 162. [Google Scholar]
  61. Shoda, M.E.; Sprague, L.A.; Murphy, J.C.; Riskin, M.L. Water-quality trends in US rivers, 2002 to 2012: Relations to levels of concern. Sci. Total Environ. 2019, 650, 2314–2324. [Google Scholar] [CrossRef]
  62. Stalnacke, P.; Aakeroy, P.A.; Blicher-Mathiesen, G.; Iital, A.; Jansons, V.; Koskiaho, J.; Kyllmar, K.; Lagzdins, A.; Pengerud, A.; Povilaitis, A. Temporal trends in nitrogen concentrations and losses from agricultural catchments in the Nordic and Baltic countries. Agric. Ecosyst. Environ. 2014, 198, 94–103. [Google Scholar] [CrossRef]
  63. Longphuirt, S.N.; O’Boyle, S.; Stengel, D.B. Environmental response of an Irish estuary to changing land management practices. Sci. Total Environ. 2015, 521, 388–399. [Google Scholar] [CrossRef] [Green Version]
  64. Cheng, P.; Li, X.Y.; Su, J.J.; Hao, S.N. Recent water quality trends in a typical semi-arid river with a sharp decrease in streamflow and construction of sewage treatment plants. Environ. Res. Lett. 2018, 13, 014026. [Google Scholar] [CrossRef] [Green Version]
  65. Chen, B.H.; Chang, S.X.; Lam, S.K.; Erisman, J.W.; Gu, B.J. Land use mediates riverine nitrogen export under the dominant influence of human activities. Environ. Res. Lett. 2017, 12, 094018. [Google Scholar] [CrossRef] [Green Version]
  66. Sharpley, A.; Jarvie, H.P.; Buda, A.; May, L.; Spears, B.; Kleinman, P. Phosphorus Legacy: Overcoming the Effects of Past Management Practices to Mitigate Future Water Quality Impairment. J. Environ. Qual. 2013, 42, 1308–1326. [Google Scholar] [CrossRef] [Green Version]
  67. Bussi, G.; Janes, V.; Whitehead, P.G.; Dadson, S.J.; Holman, I.P. Dynamic response of land use and river nutrient concentration to long-term climatic changes. Sci. Total Environ. 2017, 590, 818–831. [Google Scholar] [CrossRef]
  68. Jackson, B.M.; Browne, C.A.; Butler, A.P.; Peach, D.; Wade, A.J.; Wheater, H.S. Nitrate transport in Chalk catchments: Monitoring, modelling and policy implications. Environ. Sci. Policy 2008, 11, 125–135. [Google Scholar] [CrossRef] [Green Version]
  69. Bowes, M.J.; Jarvie, H.P.; Halliday, S.J.; Skeffington, R.A.; Wade, A.J.; Loewenthal, M.; Gozzard, E.; Newman, J.R.; Palmer-Felgate, E.J. Characterising phosphorus and nitrate inputs to a rural river using high-frequency concentration-flow relationships. Sci. Total Environ. 2015, 511, 608–620. [Google Scholar] [CrossRef] [PubMed] [Green Version]
  70. O’Hare, M.T.; Baattrup-Pedersen, A.; Baumgarte, I.; Freeman, A.; Gunn, I.D.M.; Lazar, A.N.; Sinclair, R.; Wade, A.J.; Bowes, M.J. Responses of Aquatic Plants to Eutrophication in Rivers: A Revised Conceptual Model. Front. Plant Sci. 2018, 9, 451. [Google Scholar] [CrossRef]
  71. Powers, S.M.; Bruulsema, T.W.; Burt, T.P.; Chan, N.I.; Elser, J.J.; Haygarth, P.M.; Howden, N.J.K.; Jarvie, H.P.; Lyu, Y.; Peterson, H.M.; et al. Long-term accumulation and transport of anthropogenic phosphorus in three river basins. Nat. Geosci. 2016, 9, 353–356. [Google Scholar] [CrossRef]
  72. Gu, B.J.; Zhu, Y.M.; Chang, J.; Peng, C.H.; Liu, D.; Min, Y.; Luo, W.D.; Howarth, R.W.; Ge, Y. The role of technology and policy in mitigating regional nitrogen pollution. Environ. Res. Lett. 2011, 6, 014011. [Google Scholar] [CrossRef] [Green Version]
  73. Richardson, J.; Miller, C.; Maberly, S.C.; Taylor, P.; Globevnik, L.; Hunter, P.; Jeppesen, E.; Mischke, U.; Moe, S.J.; Pasztaleniec, A.; et al. Effects of multiple stressors on cyanobacteria abundance vary with lake type. Glob. Change Biol. 2018, 24, 5044–5055. [Google Scholar] [CrossRef] [Green Version]
Figure 1. Catchment study areas and predominant land use types. Arbúcies, Louros, Tarland, and Thames are river catchment sites. The other sites are catchments which include a major lake. For land cover details see Table 1.
Water 14 00829 g001
Figure 2. Model calibration and test results expressed in terms of the normalised root mean square difference, RMSD’*(σ) and the normalised bias (Bias*) for (a) flow and (b) stream water nitrate concentrations. The inner and outer circles have radii of 0.7 and 1. At the Arbúcies and Louros catchments, both INCA-N and INCA-P were applied with the same hydrological model structure and parameters.
Water 14 00829 g002
Figure 3. Model calibration and test results expressed in terms of the normalised root mean square difference, RMSD’*(σ) and the normalised bias (Bias*) for stream water (a) total and (b) soluble reactive phosphorus concentrations. The inner and outer circles have radii of 0.7 and 1.
Water 14 00829 g003
Figure 4. Model calibration and test results expressed in terms of the normalised root mean square difference, RMSD’*(σ) and the normalised bias (Bias*) for lake chlorophyll concentrations. The inner and outer circles have radii of 0.7 and 1.
Water 14 00829 g004
Figure 5. (a) Absolute change in air temperature and percentage change in (b) precipitation and (c) river flow, for the period 2031–2060 relative to the baseline period 1981–2010. Sites are arranged north to south along the x-axis. Climate models were: ECHAM5-KNMI (blue); SMHIRCA-BCM (red); and HadRM3P-HadCM3Q0 (orange). Blank columns indicate that the GCM-RCM combination was not used for a study site.
Water 14 00829 g005
Figure 6. The percentage change in stream flow at each of the study areas between the baseline (1981–2010) and future (2031–2060) periods due to climate change (climate) and combined climate and land cover change (LU1–4). Blank columns indicate that the GCM-RCM combination was not used for a study site.
Water 14 00829 g006
Figure 7. The percentage change in stream water nitrate concentration at each of the study areas between the baseline (1981–2010) and future (2031–2060) periods due to climate change (climate) and climate and land cover change (LU1–4). Blank columns indicate that the GCM-RCM combination was not used for a study site. A ‘0’ denotes a percentage change of zero.
Water 14 00829 g007
Figure 8. The percentage change in stream water (a) total phosphorus and (b) soluble reactive phosphorus concentration at each of the study areas between the baseline (1981–2010) and future (2031–2060) periods due to climate change (climate) and climate and land cover change (LU1–4). Blank columns indicate that the GCM-RCM combination was not used for a study site. A ‘0’ denotes a percentage change of zero.
Water 14 00829 g008
Figure 9. The percentage change in lake chlorophyll-a concentration at each of the study areas between the baseline (1981–2010) and future (2031–2060) periods due to climate change (climate) and climate and land cover change (LU1–4). The Tarland, Thames, Arbúcies, and Louros study areas do not contain lakes. A ‘0’ denotes a percentage change of zero.
Water 14 00829 g009
Table 1. Catchment climate and land use summary of the nine river catchments.
Study CatchmentLat., Long.Koppen-GeigerAreaAltitudePrecipitationDischargeLand Use
MinMaxMeanMeanFarmlandForestUrbanOther
Decimal Degrees km2mmmm y−1m3 s−1%%%%
Yläneenjoki (FIN)60.99, 22.30Cold, without dry season, warm or cold summer (Dfb, Dfc)233501006302.12947420
Hobøl (NOR)59.45, 10.67Temperate, without dry season, warm summer (Cfb)30102008004.5157807
Tarland (GBR)57.15, −3.30Temperate, without dry season, cold summer (Cfc)741506109010.735319127 1
Thames (GBR)51.40, −1.32Temperate, without dry season, warm summer (Cfb)99313330717806813118
Vltava (CZE)50.33, 14.47Temperate, without dry season, warm summer (Cfb)12,116354137870090524233
Arbúcies (ESP)41.83, 2.47Temperate, dry summer, hot or warm summer (Csa, Csb)1126517008300.571571311
Louros (GRC)39.16, 20.75Temperate, dry summer, hot summer (Csa)97702000136724224272 2
Beyşehir (TUR)37.67, 31.62Temperate, dry summer, warm summer (Csb)46001050300049019306064 3
Rhine flowing to Ijsselmeer via the River Ijssel (NLD)52.82, 5.25Temperate, without dry season, warm summer (Cfb)185,000
(Rhine)
04059968 ***340 **5035 *15*
* the forest land class includes other fallow land and water. ** Estimated flow to IJsselmeer from Rhine via the River IJssel. [16] *** Modelled estimate [16]. The ‘Other’ land use category includes: (1) Tarland, uncultivated rough grazing and moorland heath; (2) Louros, shrubland and estuary marshland; (3) Beyşehir, rangeland.
Table 2. Summary of catchment water quality, including the mean SRP, TP, and NO3-N concentration for the period used for catchment model calibration and testing.
CatchmentSRPTPNO3PeriodLand Cover/Use DescriptionData References
mg P L−1mg P L−1mg N L−1
Yläneenjoki (FIN)0.020.082.42003–2008Arable, mainly forest, mire, some settlements.[20,21,22]
Hobøl (NOR)-0.04-1992–1995Arable and grassland, mainly forest, some settlements, low relief.[23,24,25]
Tarland (GBR)0.010.052.91999–2010Arable, heather heath, a little woodland, some settlements, low hills.[26,27]
Thames (GBR)0.19--2001–2008Mainly arable, some woodland and grassland, large population, low hills and floodplain.[10]
Vltava (CZE)0.070.151.61991–2010Arable, forest and grassland, aquaculture, settlements, mountains.[28]
Arbúcies (ESP)0.040.091.12001–2011Small arable area, forested, small settlement, mountainous.[29]
Louros (GRC)0.050.060.72005–2010Arable on floodplains, no significant settlements, mainly shrubland on karstic uplands.[30]
Beyşehir (TUR)0.10-0.42010–2012Arable irrigated mostly, settlements, mainly rangeland, high altitude, mountainous.[31,32,33]
Table 3. Summary of lake characteristics, including the mean SRP, TP, and NO3-N concentration for the period used for lake model calibration and testing.
CatchmentStudy LakeAreaDepthRetention TimeSRPTPNO3Chl-aPeriodData References
km2mYearsmg P L−1mg P L−1mg N L−1µg L−1
Yläneenjoki (FIN)Pyhäjärvi1545.53.20.0010.0180.45 *71980–2009[20,21,22]
Hobøl (NOR)Vansjø363.80.210.0140.035-132005–2012[23,24,25]
Vltava (CZE)Orlík reservoir2727.00.250.0300.0481.45101991–1995[28]
Beyşehir (TUR)Beyşehir6505.05.1---32010–2012[31,32,33]
IJsselmeer (NLD)IJsselmeer11404.50.300.0300.1161.81262000–2013[19]
* Total nitrogen.
Table 4. Summary of catchment and lake models applied at each study site and references to the individual model applications.
CatchmentCatchment Models AppliedLakeLake Models AppliedModel Application Reference
Yläneenjoki (FIN)INCA-N, INCA-PPyhäjärviLake Load Response, MyLake[20,21,22]
Hobøl (NOR)INCA-N, INCA-PVansjøMyLake[23,24,25]
Tarland (GBR)Stream-N, INCA-P--[26,27]
Thames (GBR)INCA-P--[10]
Vltava (CZE)INCA-N, INCA-POrlík reservoirCE-QUAL-W2[28]
Arbúcies (ESP)INCA-N, INCA-P--[29]
Louros (GRC)INCA-N, INCA-P--[30]
Beyşehir (TUR)SWATBeyşehirDYRESM-CAEDYM, PROTECH, PCLake[31,32,33]
IJsselmeer (NLD)NoneIJsselmeerDELFT-3D, HABITAT[19]
Publisher’s Note: MDPI stays neutral with regard to jurisdictional claims in published maps and institutional affiliations.

