Article

Study on the Processes Influencing and Importance of Ecological Water Replenishment for Groundwater Resources: A Case Study in Yongding River

1
State Key Laboratory of Environmental Criteria and Risk Assessment, Chinese Research Academy of Environmental Sciences, Beijing 100012, China
2
School of Water Resources and Environment, China University of Geosciences (Beijing), Beijing 100083, China
3
Institute of Water Resources, Beijing Institute of Hydrogeology and Engineering Geology, Beijing 100195, China
*
Author to whom correspondence should be addressed.
Water 2022, 14(5), 828; https://doi.org/10.3390/w14050828
Submission received: 20 December 2021 / Revised: 2 March 2022 / Accepted: 3 March 2022 / Published: 6 March 2022
(This article belongs to the Section Hydrogeology)

Abstract

:
There has been notable depletion of groundwater resources globally in recent decades. Groundwater can be conserved by ecological water replenishment. An understanding of the factors influencing the effect of ecological water replenishment on groundwater recharge is of great significance for water resource management. This study used the improved water table fluctuation and water equilibrium method and Spearman correlation analysis in R to evaluate the effect of ecological water replenishment on groundwater recharge. Furthermore, the correlations between groundwater recharge and topography, hydrogeological conditions, and meteorological factors were analyzed. Groundwater storage in the plain area of the Yongding River (Beijing section) increased by 2.17 × 10⁸ m3 in 2020, equating to an increase in the regional groundwater level of 73.6% (increase of 0.1–9.1 m, arithmetic mean of 2.3 m). The main sources of groundwater recharge are ecological water replenishment and precipitation. The ecological water replenishment first recharged the Ordovician limestone aquifer in the gorge area, following which karst water overflowed through the fault zone to resupply the Quaternary groundwater in the plain area, resulting in a lag in the groundwater recharge effect. Groundwater recharge was positively correlated with ground elevation and aquifer permeability and negatively correlated with the thickness of Quaternary strata and the distance between the recharge point and Yongdinghe fault zone. This study can help to better explain the effect and impact of ecological water replenishment on groundwater resource recharge and its implications for improving ecological water replenishment projects.

1. Introduction

Global groundwater abstraction has increased from ~312 km3 in 1960 to 734 km3 in 2000 [1] and 1400 km3 in 2016 [2]. Global warming, extreme weather events, and the construction of reservoirs and dams have all reduced natural groundwater recharge. Regions that have experienced the most severe depletion of groundwater resources include the North China Plain, Northwest India, the American prairies, Central Valley in California, and the Middle East [3,4,5,6,7]. Scheduling of surface water ecological flow can effectively be used to conserve groundwater resources, although the effectiveness of this approach is dependent on many factors, including topography, hydrogeological conditions, and precipitation [8]. Therefore, understanding the effect of ecological water replenishment on groundwater recharge is of great significance for water resource management.
Beijing is a typical water deficit prone area on the North China Plain. Water deficit alleviation measures taken by the Beijing municipal government since 2012 have included the South-to-North Water Diversion Project and the use of ecological water replenishment to recharge groundwater [9]. The Yongding River, the primary river supplying Beijing, was cut off from 1980 to 2019, and its underground water resources were depleted. Beijing launched ecological water replenishment of the Guanting Reservoir in 2019 to restore the ecology of the Yongding River and replenish groundwater. Various approaches have been used in past studies to investigate the impact of ecological water replenishment of the Yongding River (Beijing section) on groundwater resources using scenario simulation or hypothesis testing, including numerical simulation [10,11] and statistical analysis [12,13,14]. Subsequent to the implementation of ecological water replenishment of the Guanting Reservoir, there has been an increasingly urgent need to study changes to the groundwater table in Beijing and the effect on groundwater resource storage.
The Gravity Recovery and Climate Experiment (GRACE) satellite is widely used to calculate and evaluate changes in global groundwater storage by measuring changes in the gravitational field over time. However, the accuracy of the GRACE satellite is limited by its highest resolution of 330 km [15,16]. Numerical simulation can be used to estimate the variation in groundwater storage based on the effective porosity and permeability coefficient of an aquifer and measured changes to the groundwater table resulting from recharge, runoff, and discharge [17,18,19]. However, this approach is complex, long, and requires large quantities of basic data. The water table fluctuation method relies directly on groundwater table data, ignoring the large number of hydrogeological parameters, except for specific yield. This method can be used to rapidly evaluate and analyze the effect of ecological water replenishment on groundwater resources [20,21]. However, since the scale at which the water table fluctuation method can be applied is limited to an area representative of a single monitoring point, it cannot be used to accurately calculate the groundwater storage effect at the regional scale. An improved water table fluctuation method is established to solve this problem by subdividing the grid, overlaying the area data, and applying the Kriging interpolation calculation method.
The statistical indicators most commonly used to analyze the correlation between topography, hydrogeological conditions, meteorological factors, and the effect of replenishment of ecological water on groundwater resources include the Pearson correlation coefficient and Spearman correlation. The calculation of the Pearson correlation coefficient requires the variables to be continuous and normally distributed. However, the spatial variability in topography, hydrogeological conditions, meteorology, and other factors increases uncertainty in whether these statistical indicators are normally distributed. Unlike the Pearson correlation coefficient, the Spearman correlation coefficient has no requirement for analysis variables to be normally distributed [22]. Therefore, the Spearman correlation coefficient is more suitable for studying the factors influencing the effects of ecological water replenishment on groundwater resources.
Beijing officially initiated ecological water replenishment of the Yongding River in 2020. The present study collected groundwater table, meteorological, and hydrogeological data for 82 monitoring wells in the plain area of the Yongding River (Beijing section). Changes to the groundwater table during ecological water replenishment were then analyzed using the improved water table fluctuation method and Spearman correlation analysis. Changes to groundwater storage were calculated to reveal the mechanism influencing changes to groundwater storage during ecological water replenishment. The results of the present study are of great significance for the protection of groundwater resources during ecological flow scheduling of the Yongding River (Beijing section).

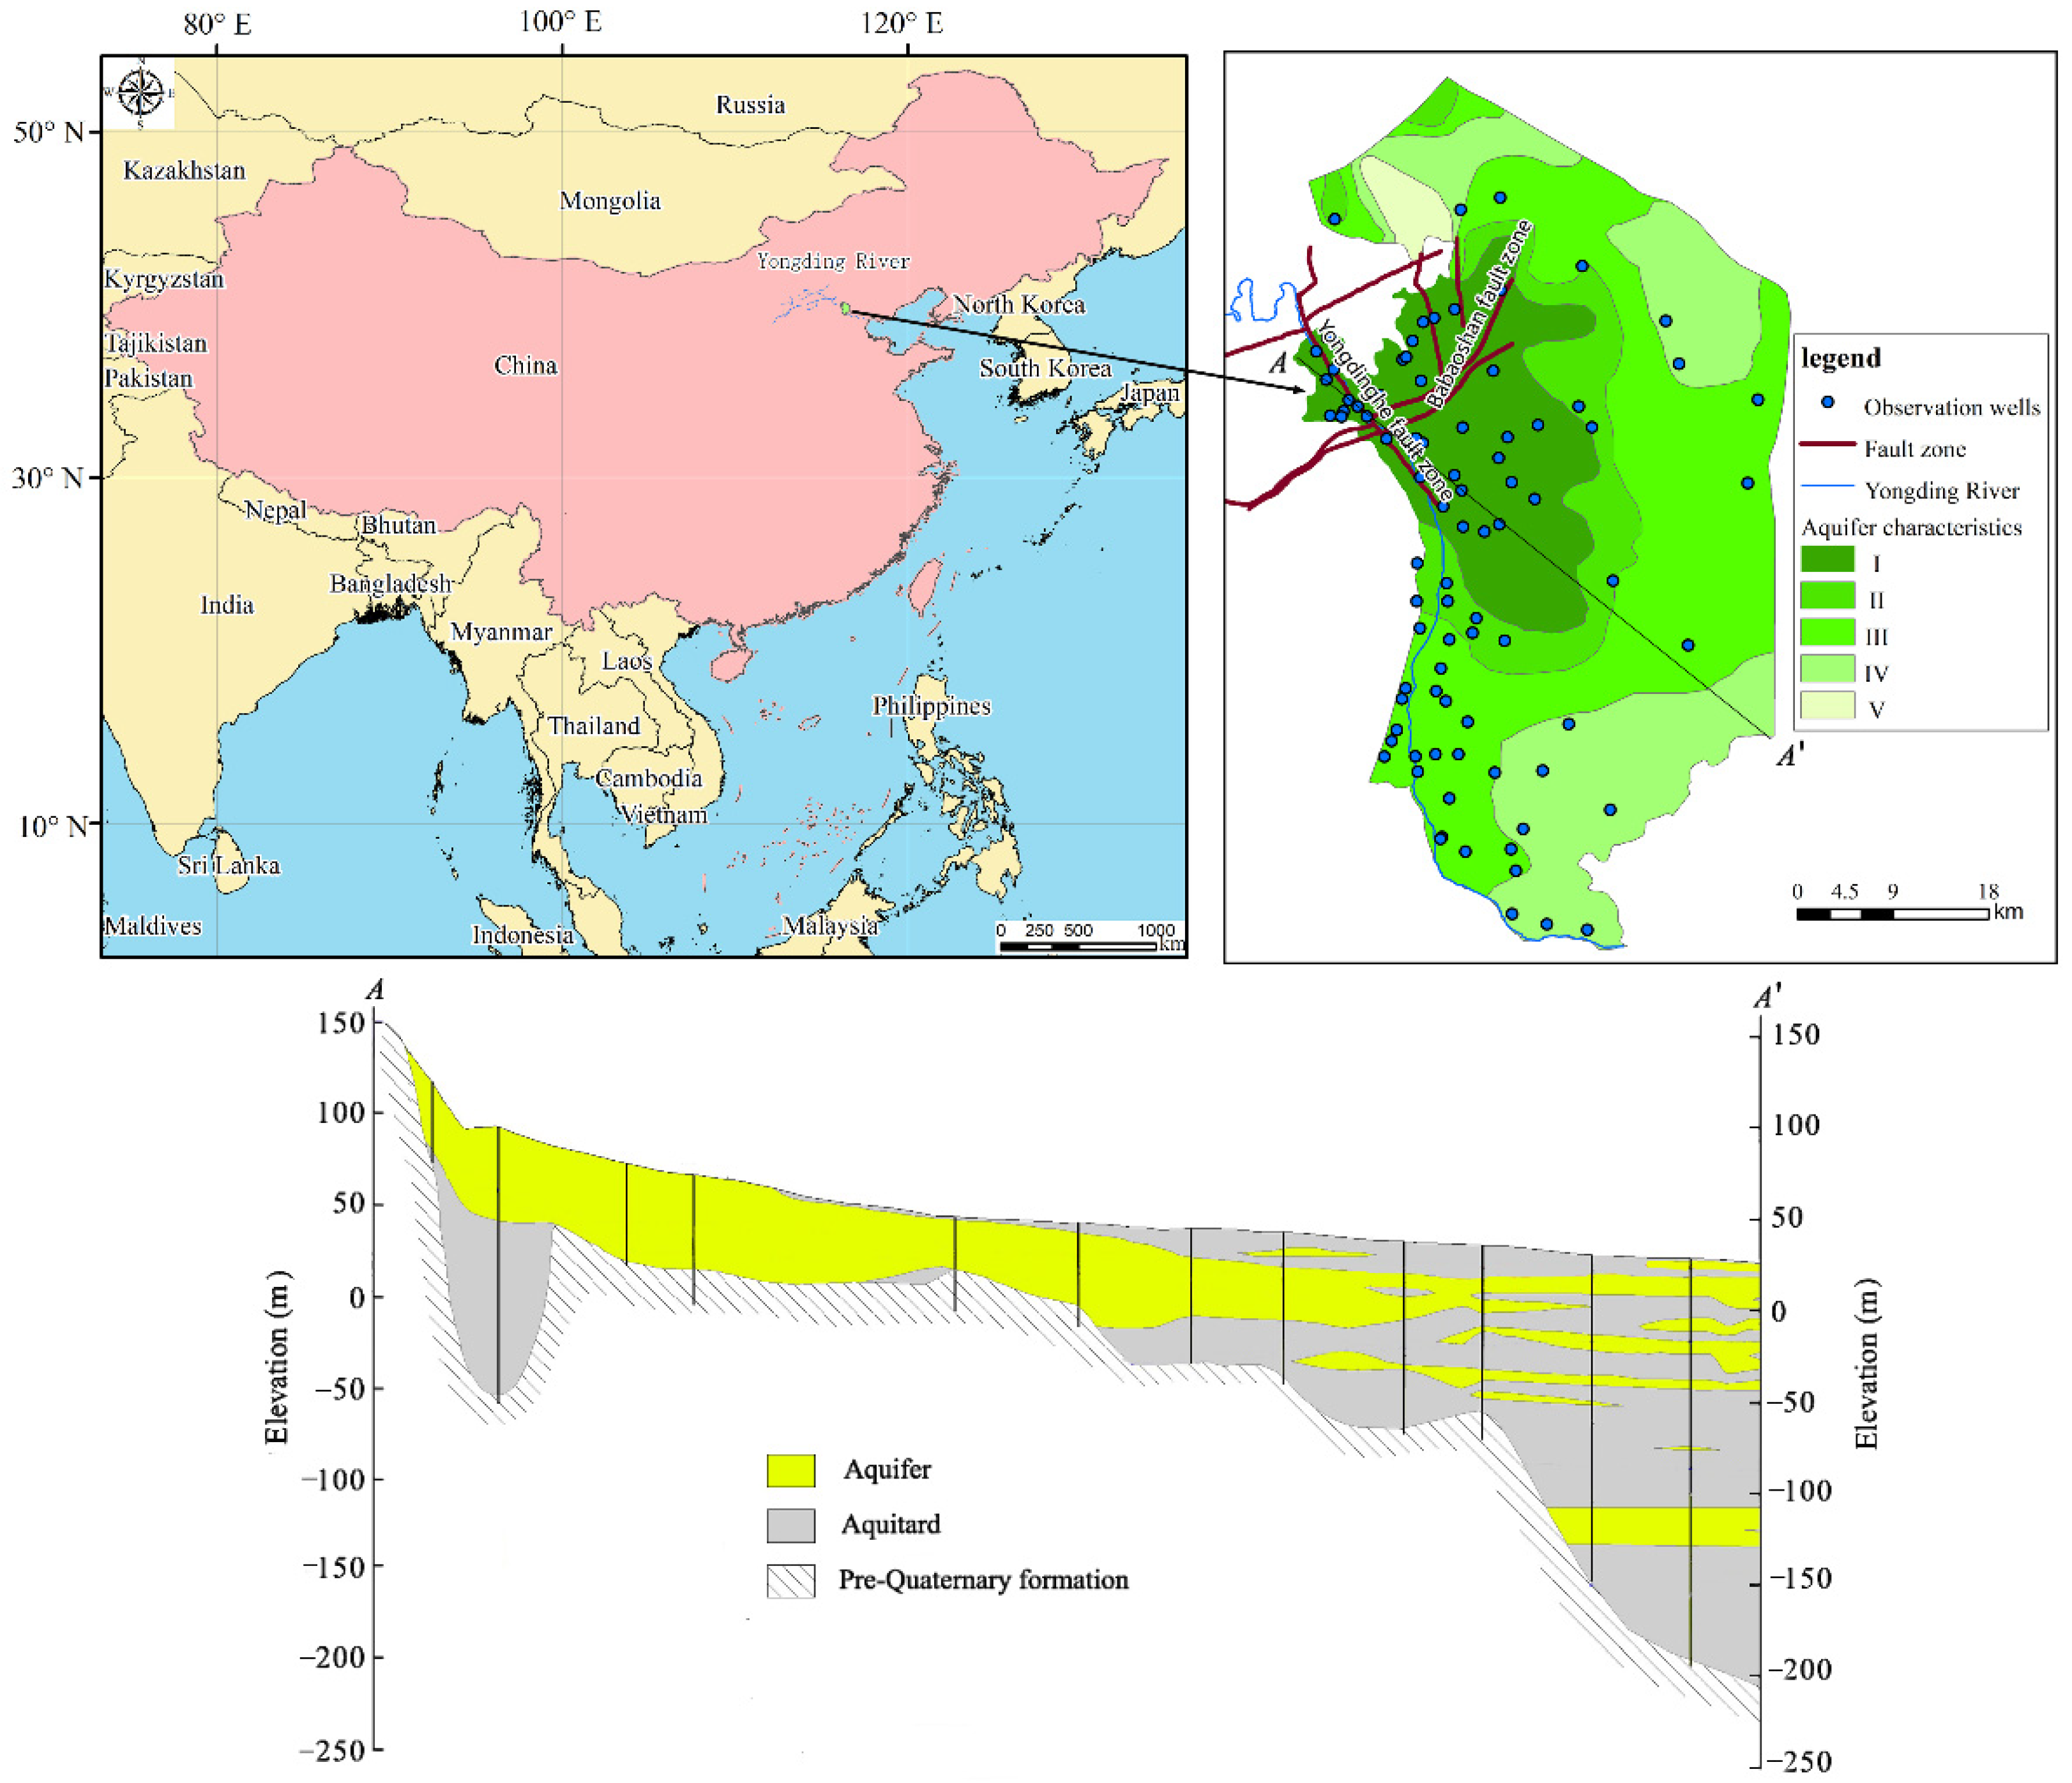
2. Overview of Study Area

The topography of the study area can be divided into a plain area and a gorge area. The aquifer in the plain area consists mainly of a Quaternary porous medium representing the main groundwater storage area. The medium of the aquifer in the gorge area consists of predominantly Ordovician limestone fissures, there are karst caves on the surface, and it is an important groundwater recharge area [23]. The present study focused on the plain area of Yongding River (Beijing section) (Figure 1), containing nine administrative districts (Shijingshan, Fengtai, Dongcheng, Xicheng, Haidian, Chaoyang, Changping, Daxing, and Tongzhou) with a total area of 2387 km2. The plain area is an alluvial and alluvial–proluvial landform that was formed by the accumulation of alluvial sediments of the Yongding River. The grains of the aquifer become gradually finer from northwest to southeast, and the aquifer transitions from a single sand–gravel layer (zone I, K > 200 m/d), to two-three layers of sand-gravel (zone II, 200 m/d > K > 150 m/d), to multiple layers of sand gravel and a few sand layers (zone III, 150 m/d > K > 100 m/d), to multiple layers of sand and a few layers of gravel (zone IV, K < 100 m/d), to multi layers of sand (zone V, K < 50 m/d) [10,24]. The study area essentially consists of Quaternary deposits varying from tens meters to more than 250 m, and it is underlain by a series of Paleozoic to Mesozoic geological formations forming impermeable bottoms of aquifers (Figure 1). The Yongdinghe fault zone, which occurs in the northwest, is a strike-slip fault.
The study area has a semi-humid and semi-arid monsoon climate and falls in the warm temperate zone. The multi-year average temperature, precipitation, and evaporation of the study area are 11.6 °C, 556 mm, and 1333 mm, respectively [25,26]. The average precipitation of the study area in 2020 was 559 mm (http://swj.beijing.gov.cn/, accessed on 25 May 2021) (Figure 2). Precipitation from June to September accounts for 70% of annual precipitation. The main sources of groundwater recharge in the plain area of the Yongding River (Beijing section) are atmospheric precipitation, river seepage, and aquifer lateral inflow, whereas the main groundwater outflow paths are human exploitation and lateral outflow of the aquifer.
In 2020, the 170 km long river channel of the Yongding River (Beijing section) was fully open to water for the first time in 25 years [12]. The volumes of ecological water replenishment of the Guanting Reservoir from 20 April to 20 May and from 14 October to 30 October 2020 were 1.67 × 10⁸ m3 and 0.67 × 10⁸ m3, respectively, whereas that for the entire year was 2.34 × 10⁸ m3 (http://swj.beijing.gov.cn/, accessed on 25 May 2021).

3. Materials and Methods

3.1. Analysis of Changes to the Groundwater Table

The present study analyzed groundwater table data released by the China National Groundwater Monitoring Project for 82 Quaternary phreatic aquifer monitoring wells (Figure 1) in the Yongding River (Beijing section) plain area from 20 April to 1 November 2020 (http://jcgc.cigem.cn/wechat/, accessed on 25 May 2021), the wells depth ranging between 21–84 m. Groundwater table data were selected for the first day (May 20) after the end of ecological water replenishment in the spring of 2020, before and after high-intensity precipitation during the rainy season (1 July and 1 September 2020) (Figure 2), and the first day (1 November 2020) after the end of ecological water replenishment in autumn. The changes in the groundwater table were compared to those from 20 April 2020 (before ecological water replenishment of the Yongding River) at four nodes using Kriging interpolation analysis.
Kriging is a geostatistical technique that is used to interpolate a surface from a scattered set of known points in which a continuous surface of values can be predicted between the known locations [27]. Ordinary kriging is a simple and common kind of kriging method that was used in this study. We used a tool called “Geostatistical Analyst” in ArcGIS 10.2 to achieve interpolation of ordinary kriging [28,29]. The differences between estimated and observed values were summarized using the cross-validation statistics described [30]. The cross-validation statistics include the estimates of root mean square error (RMSE), average standard error (ASE), and standard root mean square error (RMSSE). A smaller RMSE and ASE indicate a closer observed and predicted by the empirical semivariogram models; the closer the RMSSE is to 1, the better the estimated performance of the model [29,31].

3.2. Calculation of Changes in Groundwater Storage

3.2.1. Calculation of Groundwater Storage Using the Improved Water Table Fluctuation Method

The water table fluctuation method (Equation (1)) calculates groundwater recharge in the limited spatial range covered by a single monitoring point according to changes to the groundwater table and specific yield. However, this approach cannot accurately calculate variations in groundwater storage at a regional scale. The present study divided the calculation area into several grids with the same area under the assumption of uniform variation in the groundwater table and specific yield in a single grid. Variation in storage in the grid was calculated by applying the area data to Equation (1), following which Equation (2) was formulated. The unknown grid data were obtained through Kriging interpolation according to variation in the groundwater table and specific yield at known points.
R = S y × Δ h Δ t
Q = i = 1 n Δ h i × S y × S i
In Equation (1), R is the rate of groundwater recharge (mm d−1), Sy is the specific yield, Δh represents fluctuation in the groundwater table over a certain period (mm), and Δt is time (d). In Equation (2), Q is the change in groundwater storage (m3), Sy is the specific yield, Si is the area of each grid (m2), Δhi is the variation in the groundwater table in the ith grid, and n is the grid number.
Equation (2) was used to calculate the change in groundwater storage (Q) in the study area from 20 April to 1 November 2020. As shown in Figure 3a, the plain area of the Yongding River (Beijing section) was divided into 59,675 (n) 200 m × 200 m grids. The groundwater table and distribution of specific yield were obtained through Kriging interpolation based on groundwater table data and specific yield (Sy) of 82 monitoring wells [32,33] (Figure 3b). The changes in the groundwater table (Δhi) and specific yield (Sy) during ecological water replenishment were assigned to each grid. The sum of all changes in grid groundwater storage (Q) was calculated using Equation (2).

3.2.2. Calculation of Groundwater Storage Using the Water Equilibrium Method

The results of the water table fluctuation method were verified using the water equilibrium method (Equation (3)) to calculate variation in groundwater storage in the plain area of the Yongding River (Beijing section). The present study ignored phreatic evaporation since the arithmetic mean buried depth of groundwater in the plain of the Yongding River (Beijing Section) exceeds 20 m, 4 m beyond the evaporation limit.
Q c = Q r + P + Q s 1 + Q p Q w Q s 2
In Equation (3), Qc is the variation in groundwater storage in the plain area of the Yongding River (Beijing section), P is groundwater recharge through precipitation (m3), Qs1 and Qs2 are lateral inflow and lateral outflow (m3) of the aquifer, respectively, Qp represents leakage of the urban pipe network (m3), Qw is the volume of groundwater exploited (m3), and Qr is groundwater recharge through river infiltration (m3). Water loss for each hydrological station was calculated through analysis of runoff monitoring data (http://swj.beijing.gov.cn/, accessed on 25 May 2021), following which Qr was determined. The aquifer from Luopoling Reservoir to Sanjiadian Reservoir in the gorge area of the Yongding River (Beijing section) consists of exposed Ordovician limestone strata with good channel permeability. Therefore, it was assumed that Qr constitutes all water loss in the river in the gorge area. Qr in the plain areas was assumed to be zero since most river channels in plain areas are artificially lined or impermeable. Qr was calculated to be 0.58 × 10⁸ m3 through analysis of flow data of hydrological stations in Luopoling Reservoir and Sanjiadian Reservoir.
P was calculated to be 3.42 × 10⁸ m3 through analysis of data from 11 rainfall stations (http://swj.beijing.gov.cn/, accessed on 25 May 2021) in the plain area of the Yongding River (Beijing section) from April to November 2020 using the Tyson polygon method [34,35].
Qs1 and Qs2 were calculated to be 0.44 × 10⁸ m3 and 0.02 × 10⁸ m3, respectively using Darcy’s Law [36].
Qp of the entire Beijing area is ~0.47 ×10⁸ m3, the leakage amount of the pipe network comes from the statistical data of the Beijing Water Authority (http://swj.beijing.gov.cn/, accessed on 25 May 2021). Qp of the plain area of the Yongding River (Beijing section) was calculated to be 0.30 × 10⁸ m3 according to the proportion of the total population of Beijing in the study area (~64%).
Qw for the plain of the Yongding River (Beijing section) in 2020 was estimated by referring to the Statistical Yearbook of Beijing Water Supplies in 2020 (http://swj.beijing.gov.cn/, accessed on 25 May 2021). In 2020, the groundwater extraction in Beijing was about 4.26 × 10⁸ m3. The total population of the study area accounts for about 64% of the total population of Beijing. Qw was calculated to be 2.73 × 10⁸ m3 according to the proportion of the total population of Beijing falling in the study area.

3.3. Analysis of Factors Influencing the Effect of Ecological Water Replenishment on Groundwater Recharge

The influence of ecological water replenishment on groundwater recharge is regulated by natural and anthropogenic factors. The natural factors mainly include topography, hydrogeological conditions, and meteorological factors, whereas anthropogenic factors include groundwater exploitation and utilization. Sufficient data for groundwater exploitation and utilization data in the plain area of the Yongding River (Beijing section) could not be obtained in the present study. Therefore, the present study only considered natural factors. Groundwater runoff is affected by elevation, and the Yongdinghe fault zone provides a channel conducive to receiving Ordovician limestone water in the plain area. Groundwater in the study area is mainly concentrated in the Quaternary strata. The permeability and storage capacity of aquifers are important parameters regulating the groundwater recharge process. In addition, precipitation is an important source of groundwater recharge. Therefore, the natural factors selected in the present study included ground elevation, the distance between the recharge point and the Yongdinghe fault zone, the thickness of the Quaternary strata, the permeability coefficient of the aquifer, specific yield, and precipitation.
The ground elevation (F1) and the thickness of the Quaternary strata (F3) were characterized by referring to data for 82 monitoring wells published by the National Groundwater Monitoring Project (http://jcgc.cigem.cn/wechat, accessed on 25 May 2021). The distance between the recharge point and the Yongdinghe fault zone (F2) was obtained by spatial ranging in GIS. Precipitation (F4) data were obtained from the Beijing Water Resources Bureau (http://swj.beijing.gov.cn/, accessed on 25 May 2021). The specific yield (F5) and permeability coefficient (F6) of the phreatic aquifer were obtained from published studies [14,33].
The Spearman correlation coefficient, implemented in the R language, was used to analyze the correlation between the changes in the groundwater table and storage capacity, topography, hydrogeological conditions, and meteorological factors during ecological water replenishment of the Yongding River (Beijing section).

4. Results and Discussion

4.1. Changes to the Groundwater Table

4.1.1. Selecting the Best Fitted Variogram Models

The groundwater level change on 1 July 2020 was selected as the semi-variance function fitting data. The fitted semivariograms are shown in Figure 4. Semivariogram fits were performed using the Gaussian model, spherical model, J-Bessel model, and exponential model. Among them, the spherical model had the best fitting effect. Therefore, the spherical model was used to analyze the distribution of groundwater level changes. Before semivariogram modeling, the spatial autocorrelation and directional influence among the groundwater table changes data were checked. High semivariogram values are mostly represented by east–west lines. Therefore, the spherical model takes into account anisotropy.
Table 1 shows the fitting results of the empirical semivariogram. The semivariogram shows better fitting results and spatial correlation. Spatial dependency is commonly assessed in terms of the ratio of nugget (C0) to sill (C0 + C) expressed in percentage. In this respect, the groundwater level change values are considered strong spatial dependence when the ratio value is less than 25%, moderate spatial dependence when this value is between 25% and 75%, and weak spatial dependence when the value is greater than 75%. From Table 1, we see clearly that the spatial dependence of the spherical model for the best fitted semivariogram model is strong, with a ratio of 24%.

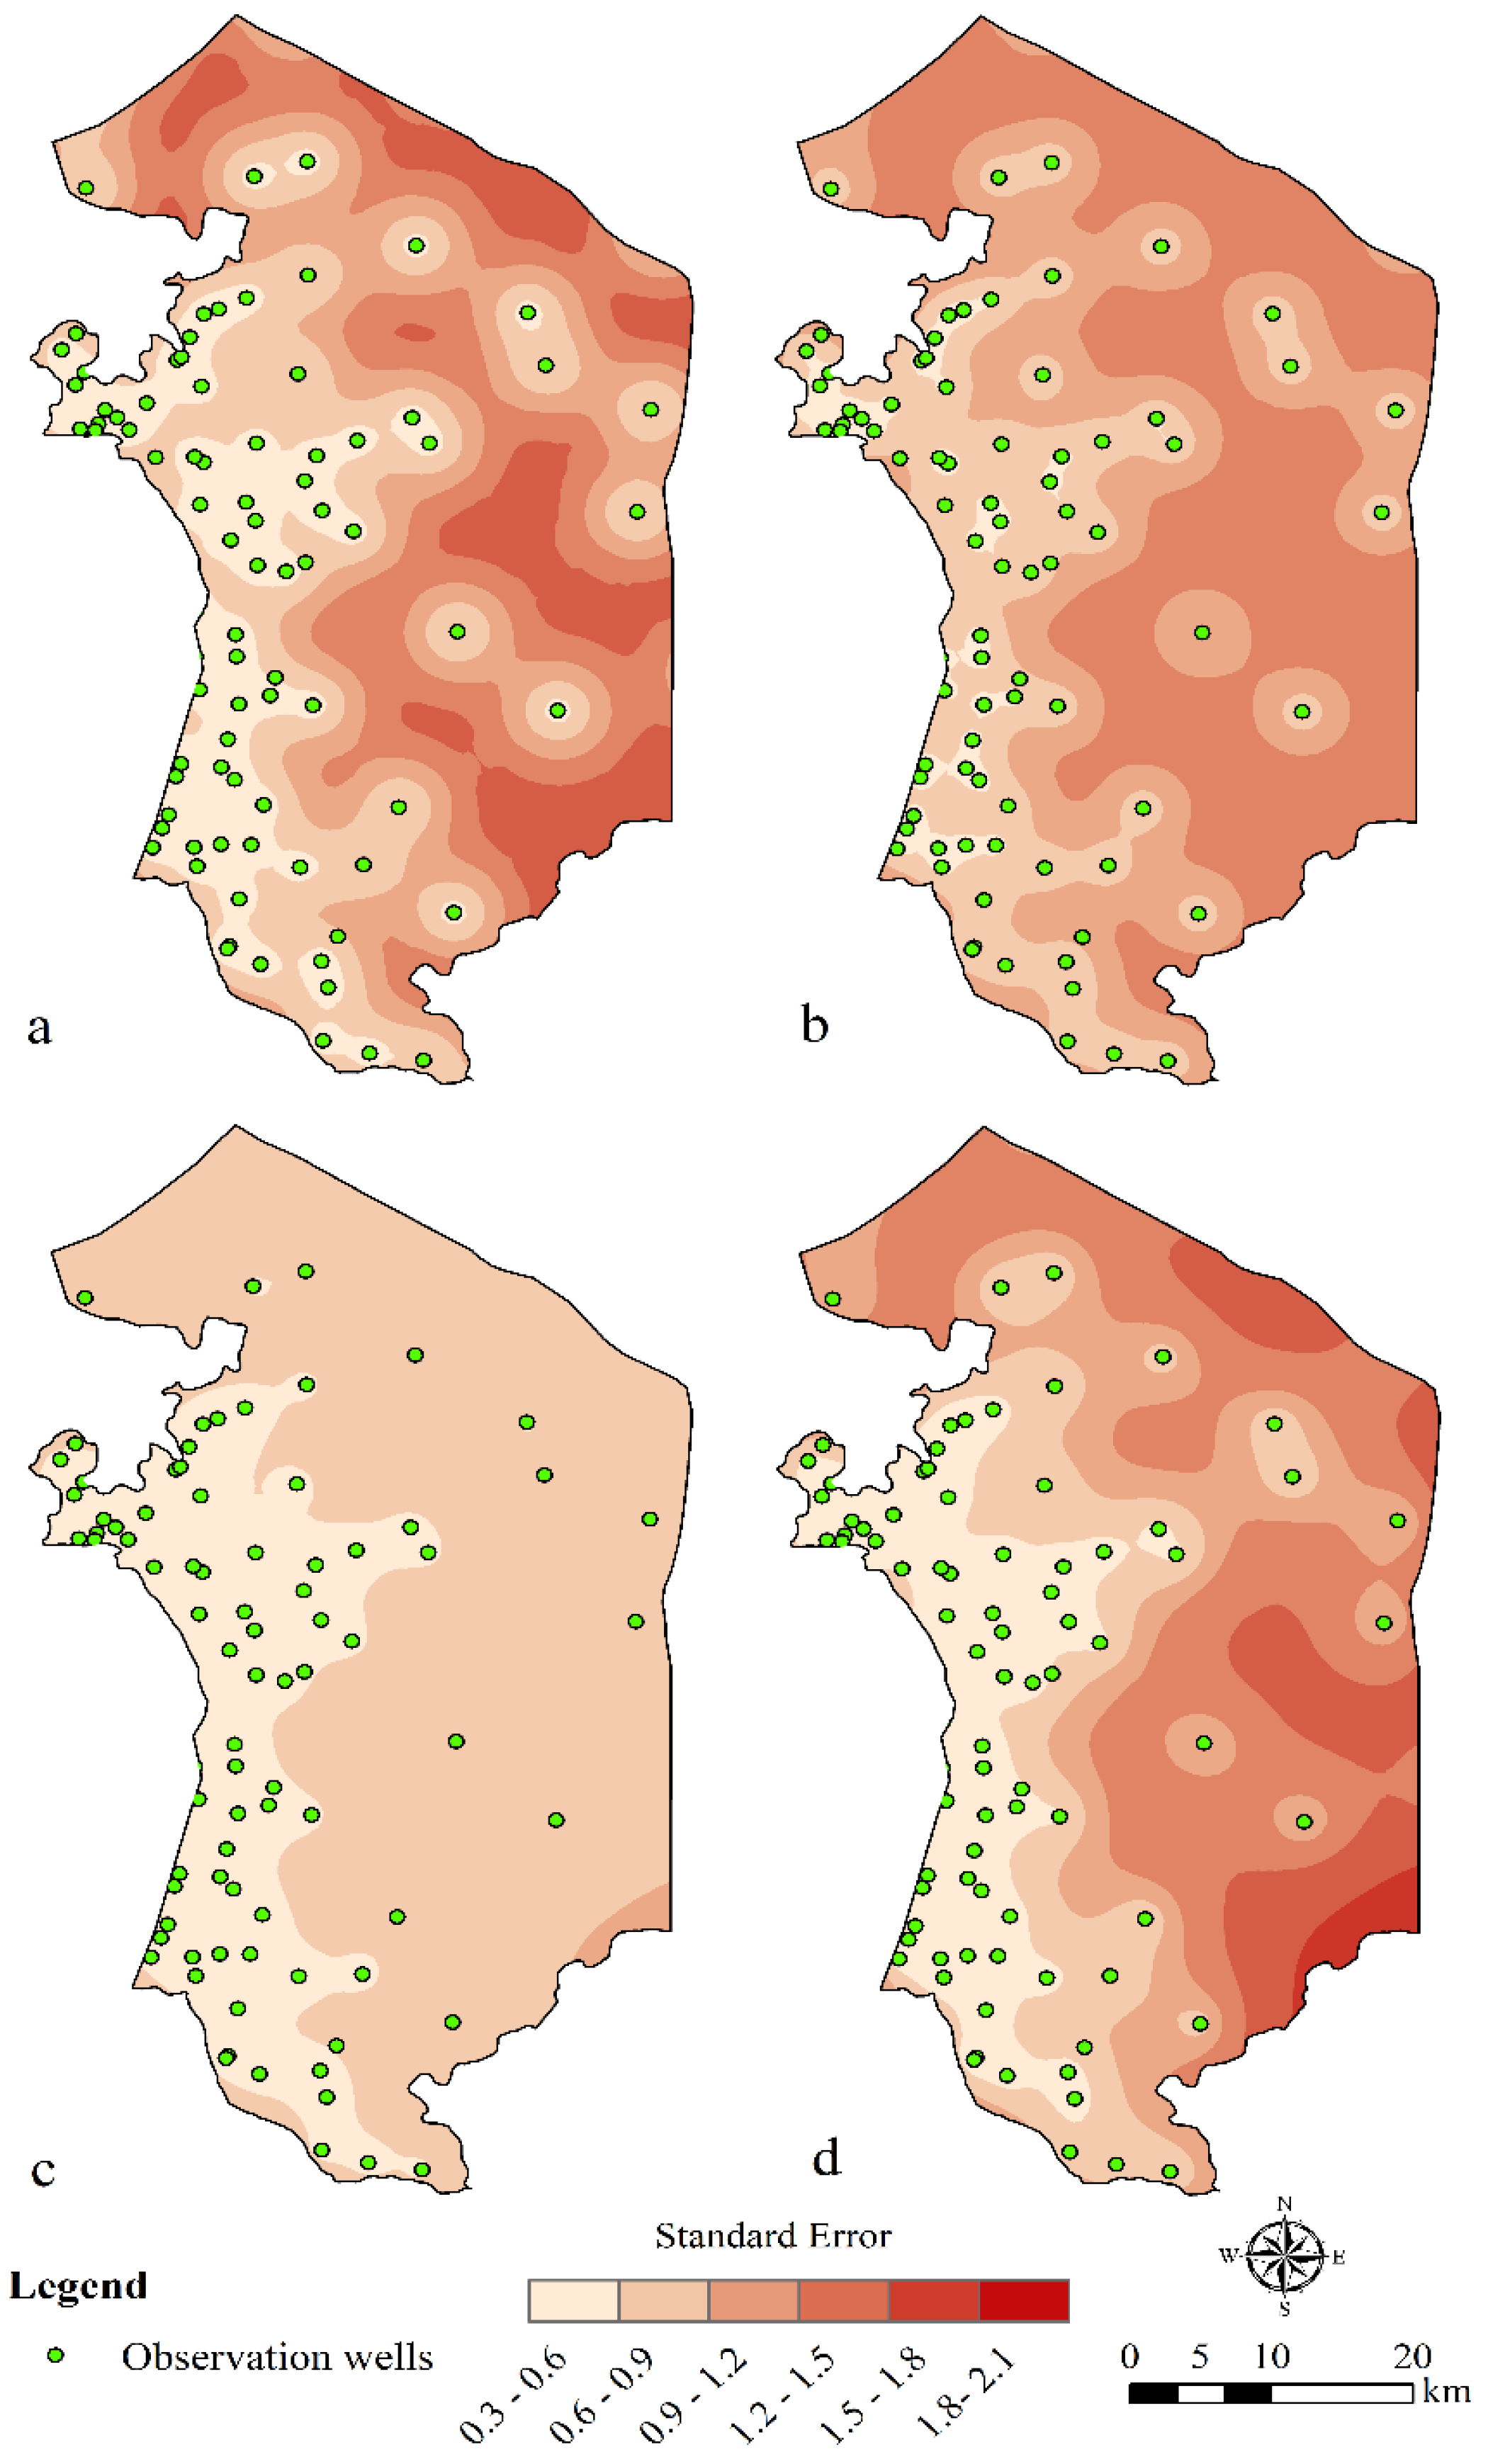
4.1.2. Cross-Validation of Model Performance

Cross-validation checks for the predictive models were performed to identify the model’s accuracy before generating the prediction maps. Table 2 summarizes the cross-validation results. In this method, the data were individually removed from the 82 actual values and estimated from the remaining 81 data by means of the ordinary kriging technique. As stated earlier, both the RMSE and ASE should be as small as possible. The groundwater level changes of 1-SEP showed the smallest RMSE and ASE, which were 1.13 and 1.23, respectively. In addition, all RMSSE are close to 1, indicating that the model has correctly estimated the predicted variability.
The standard error map of groundwater level change values spatial prediction is shown in Figure 5. The spatial prediction errors map of groundwater level change values shows the expected low errors near the observation wells. The standard errors near observation Wells were all less than 0.7. These maps show that the error associated with the estimate is low only in the western sector, while in the eastern sector there are errors of more than 1.5–2 m. This may be due to the fact that there are fewer observation points on the east side, resulting in a large error, but the ecological water replenishment area is mainly on the west side, which has little impact on the calculation of water resources.

4.1.3. The Changes Law of Groundwater Level

The period of ecological water replenishment during spring extends from 20 April to 20 May 2020. A total of 38 monitoring points in the districts of Shijingshan, Fengtai, Haidian, and Dongcheng showed increasing groundwater table levels on 20 May (Figure 6a), with increases ranging between 0.1–4.8 m and an arithmetic mean increase of 2.3 m. The arithmetic mean is calculated using the groundwater level of observation points. The area in which the groundwater table level increases occurred was ~676 km2, accounting for 28.3% of the total area of the plain of the Yongding River (Beijing section) of 2387 km2. A total of 44 monitoring points in the districts of Daxing, Chaoyang, Xicheng, and Changping showed a decreasing groundwater table level (Figure 6a), ranging between 0.1–1.1 m with an arithmetic mean of 0.6 m. The area in which decreases in the groundwater table level occurred was ~1711 km2, accounting for 71.7% of the total area covered by the plain of the Yongding River (Beijing section). There were significant increases in the groundwater table in the northwest part of the Yongding River Plain (Beijing section) after ecological water replenishment in spring on 20 May 2020. Meanwhile, falling regional groundwater levels remained evident over large areas, possibly due to spring agricultural irrigation and water outages for maintenance in the Beijing section of the middle route of the South-North Water Diversion Project. Approximately 1400 hm2 of winter wheat is planted on the plain area of the Yongding River (Beijing section) every year, requiring spring irrigation from April to May [37,38]. The middle route of the South-to-North Water Diversion Project supplied ~1 billion m3 per year of water to Beijing from 2014 to 2020, accounting for 73% of the urban water supply. However, this diversion was halted on 1 June 2020 for maintenance (http://www.mwr.gov.cn/, accessed on 25 May 2021). The resulting increased demand for water resulted in increased groundwater exploitation and a decrease in the groundwater level.
On 1 July 2020, 2 months after ecological water replenishment, a total of 40 monitoring points in the districts of Shijingshan, Fengtai, Haidian, and Dongcheng showed an increasing groundwater table level (Figure 6b) ranging between 0.1–3.1 m, with an arithmetic mean of 2.0 m. The increases in the groundwater table level covered an area of ~975 km2, accounting for 40.8% of the total area of the plain of the Yongding River (Beijing section). There were 42 monitoring points in the Daxing, Tongzhou, and Changping districts showing groundwater levels decreasing by 0.1–3.0 m, and an arithmetic mean decrease of 1.3 m. The area in which there were decreases in the water table level was ~1412 km2, accounting for 59.2% of the total area of the Yongding River (Beijing section) (2387 km2). The range and magnitude of the increase in the groundwater table level in the plain area of the Yongding River (Beijing section) on 1 July 2020, 41 days after ecological water replenishment in spring, further increased compared with that on 20 May. This result indicated a lag in the effect of ecological water replenishment on groundwater recharge. Groundwater recharge through river infiltration does not occur in the plain area of the Yongding River (Beijing section) due to the implementation of artificial lining or seepage prevention. The Yongding River fault zone facilitates the conduction of water. In addition, Ordovician limestone water in the gorge area acts as a source of recharge of Quaternary groundwater in the plain area through the Yongding River fault zone [39,40]. This leads to a lag in the effect of ecological water replenishment on groundwater recharge. The unsaturated zone in the plain of the Yongding River (Beijing section) may act as a buffer for groundwater recharge through precipitation. The arithmetic mean decrease in the groundwater table increased by 0.6 m to 1.3 m on 1 July 2020, 41 days after ecological water replenishment, compared with that on 20 May 2020. This decrease in the groundwater table could be attributed to agricultural irrigation and maintenance of the middle route of the South-North Water Diversion Project (http://www.mwr.gov.cn/, accessed on 25 May 2021).
A total of 77 monitoring points in the districts of Shijingshan, Fengtai, Xicheng, Dongcheng, Haidian, and Chaoyang showed increasing groundwater levels (Figure 6c) on 1 September, 4 months after ecological water replenishment, with the increases ranging between 0.1–5.1 m with an arithmetic mean of 1.9 m. Increases in the water table were evident over an area of ~1933 km2, accounting for 80.9% of the total area of the plain of the Yongding River (Beijing section). A total of five monitoring points in the Daxing District showed decreasing groundwater levels, ranging between 0.1–3.0 m and an arithmetic mean of 0.6 m. These decreases in the groundwater level were evident across an area of ~454 km2, accounting for 19.1% of the total area of the plain of Yongding River (Beijing section). The proportion of the total area of the plain of the Yongding River (Beijing section) in which a rising groundwater table was evident increased from 40.8% to 80.9% from 1 July to 1 September 2020. Precipitation increased to 386 mm (Figure 2) during the rainy season. Strong precipitation promoted groundwater recharge and reduced the range and degree of decline in the groundwater table.
The period of ecological water replenishment in autumn extends from 14 October to 30 October 2020. A total of 72 monitoring points in the districts of Shijingshan, Fengtai, Xicheng, Dongcheng, Haidian, and Chaoyang showed rising groundwater tables on 1 November 2020, (Figure 6d), with increases ranging between 0.1–9.1 m with an arithmetic mean increase of 2.3 m. These increases in the groundwater table extended over an area of 1757 km2, accounting for 73.6% of the total area of the plain of Yongding River (Beijing section). A total of ten monitoring points in the Daxing District showed decreasing groundwater levels ranging between 0.1–4.7 m with an arithmetic mean of 1.1 m. These decreases in the groundwater table covered an area of 630 km2, accounting for 26.4% of the total area of the plain of the Yongding River (Beijing section). The influence of ecological water replenishment in autumn resulted in an arithmetic mean rise in the groundwater table from 1.9 m to 2.3 m. The groundwater level decreased further compared with that on 1 September, decreasing by an arithmetic mean of 1.1 m. The funnel of groundwater decline appeared in the Daxing District, indicating overexploitation of groundwater by industrial production (http://www.mee.gov.cn, accessed on 25 May 2021).
The monitoring point data indicated that the groundwater table in the gorge area increased by an arithmetic mean of 20.2 m during ecological water replenishment. The groundwater head (120 m) in the gorge area was much higher than the arithmetic mean water head in the plain area (48 m). This higher hydraulic gradient provides a favorable condition for recharge of the Quaternary aquifer groundwater in the gorge area through the Yongding River fault zone. The higher hydraulic gradient provides more kinetic energy for groundwater flow and is more conducive to aquifer recharge.

4.2. Analysis of the Effect of Groundwater Storage

The results of the water table fluctuation method showed that groundwater storage in the plain of the Yongding River (Beijing Section) increased significantly from 20 April to 1 November 2020 (Figure 7) by 2.17 × 108 m3. The most significant increases were in the districts of Shijingshan, Fengtai, and Haidian, with a total increase of 2.60 × 10⁸ m3. These districts are in the upper part of the alluvial–proluvial fan of the Yongding River, in which the aquifer is mainly composed of single and double-layer sand pebbles. The medium particles of this aquifer are coarse and water-rich and form “underground reservoirs in the western suburbs” [41].
Underground storage in the districts of Xicheng, Dongcheng, and Chaoyang increased by 0.26 × 10⁸ m3. The high level of urbanization in these districts reduces groundwater seepage recharge through precipitation and runoff due to impermeable surfaces of human infrastructure [42]. Moreover, these districts are a long distance away from the Yongding River fault zone and are less affected by ecological water replenishment. Groundwater storage in Daxing District decreased by 0.45 × 10⁸ m3, mainly due to overexploitation of groundwater by agricultural irrigation and industrial production.
The water equilibrium relationship for 20 April to 1 November 2020 was established (Table 3) to verify the results of the water table fluctuation method. The difference in the variation in groundwater storage (Qc) in the plain area of the Yongding River (Beijing section) as calculated by the water equilibrium method and the water table fluctuation method was 0.18 × 10⁸ m3, a deviation of 8.6%. The results of the water equilibrium method showed that precipitation is the main source of groundwater recharge in the Yongding River (Beijing section), accounting for 72% of the total recharge. The river infiltration (Qr) is only considered in strata with good permeability, and there may be seepage in other areas, which may lead to underestimation of river infiltration. The pipeline leakage (Qp) is derived from government statistics, which may not fully enter the groundwater, leading to an overestimation of pipe network leakage.

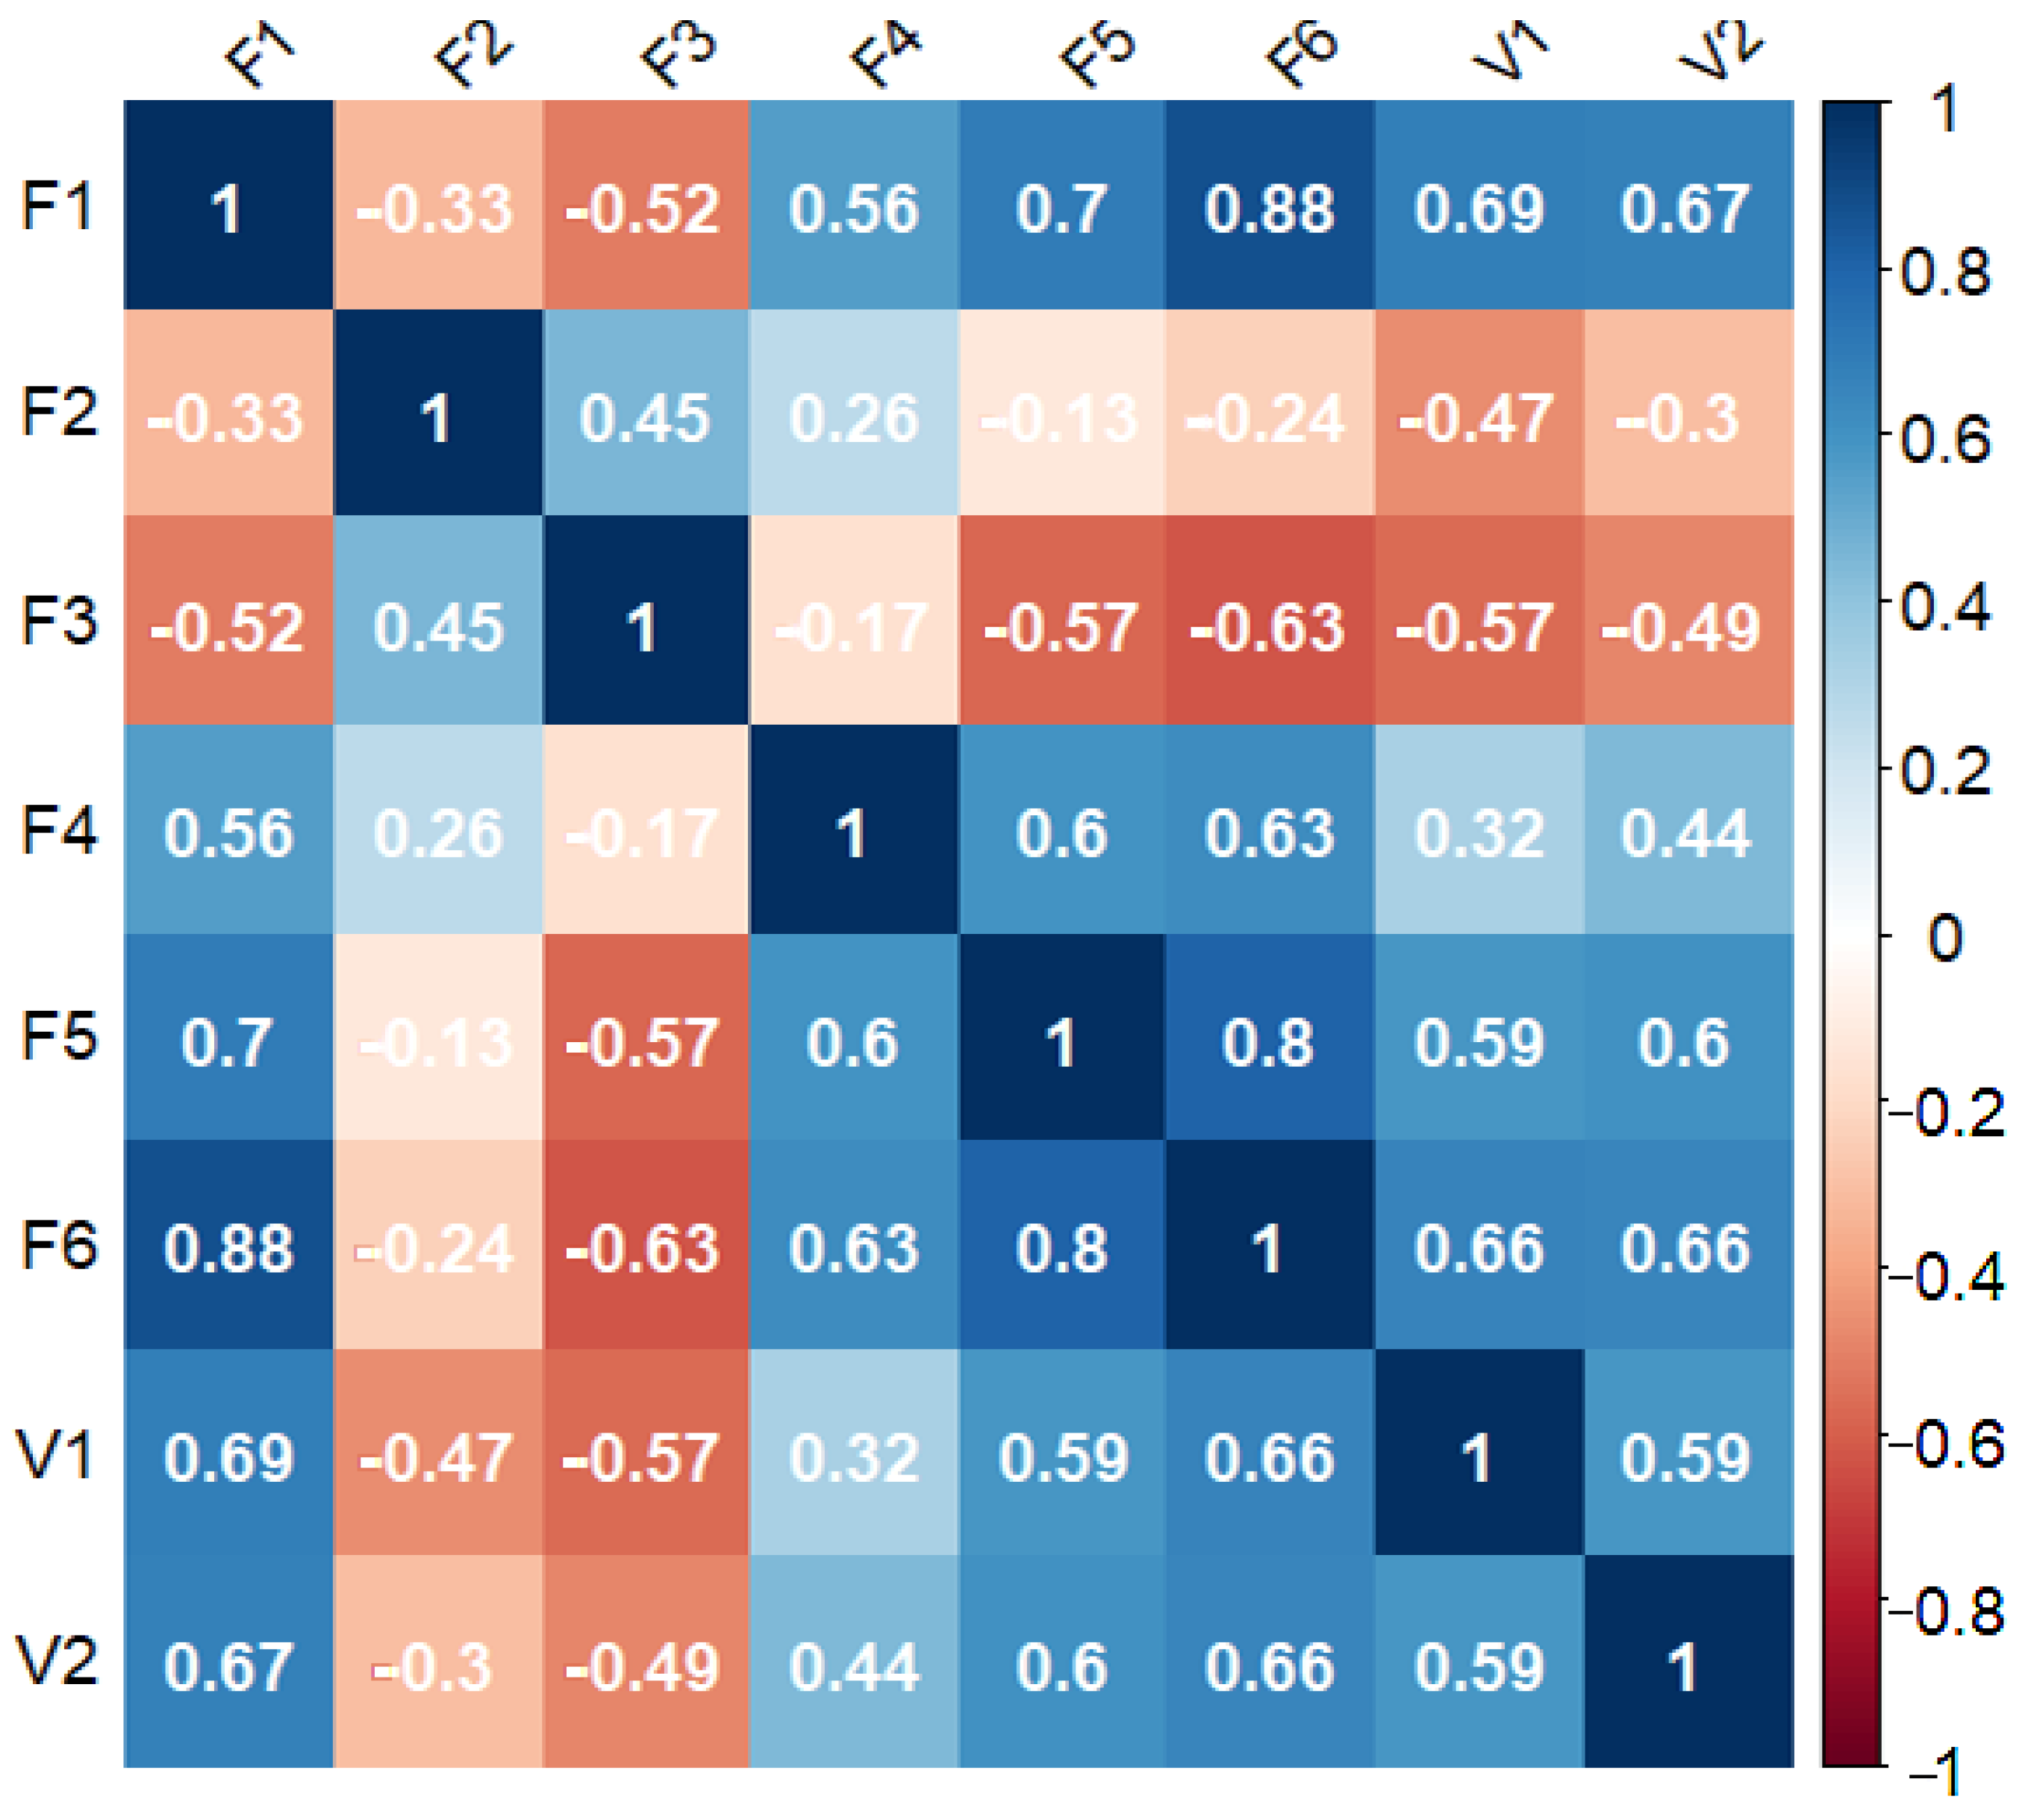
4.3. Factors Influencing Recharge of Groundwater Resources

Figure 8 shows the correlations between different natural factors and the fluctuation in the groundwater table and change in water storage. Ground elevation showed a positive correlation with groundwater recharge. The elevation of the plain area of the Yongding River (Beijing section) decreases from northwest to southeast, with groundwater monitoring points at higher elevations closer to the upper part of the alluvial–proluvial fan of the Yongding River. Groundwater recharge in the northwest region of the plain occurs mainly through ecological water replenishment and precipitation through the fault zone. The groundwater table and water storage in these areas showed clear increases [43].
The distance between the recharge point and the Yongdinghe fault zone was negatively correlated with groundwater recharge. The Yongdinghe fault zone acts as a channel conducting Quaternary groundwater in the plain area. The distance of the monitoring point from the Yongding River fault zone had an inverse relationship with the degree of influence of overflow recharge. This result explains the lag within the fluctuation of the groundwater table during ecological water replenishment (Figure 6a,b) and reflects the mechanism of ecological water replenishment of the Quaternary aquifer through overflow of the fault zone [44].
The thickness of the Quaternary strata was negatively correlated with groundwater recharge. The thickness of the Quaternary strata in the Yongding River Plain increases gradually from northwest to southeast. The effect of groundwater recharge was more obvious in areas with thin Quaternary strata in the northwest, near the overflow recharge area of the Yongding River fault zone. The area with thick Quaternary strata in the southeast was located a far distance from the overflowing recharge area of the Yongding River fault zone. Therefore, the effect of artificial exploitation of groundwater is stronger in this area, whereas the influence of ecological water replenishment on groundwater recharge is weaker. A Quaternary stratigraphic depression occurs in the upper part of the alluvial–proluvial fan (Shijingshan and Haidian areas) of the Yongdinghe River (Beijing section), and the burial depth of the bottom boundary of the lower Pleistocene strata is 100–250 m [45]. The aquifer in this area is composed mainly of sand gravel with a high specific yield and permeability coefficient. In addition, the aquifer is closely related to overflow recharge and lateral recharge of the mountain front of the Yongding River fault zone, thereby facilitating conservation and storage of groundwater resources.
Precipitation was positively correlated with groundwater recharge. Precipitation is a key factor affecting groundwater recharge [46]. The behavior of preferential flow and high recharge in correspondence of faults is common in karst systems [40,47]. Groundwater recharge through precipitation in the plain area of the Yongding River occurs by infiltration of the unsaturated zone through surface runoff and through replenishment of Quaternary groundwater by flowing into the river channel in the gorge area and overflowing through the fault zone [48].
The specific yield and permeability coefficient of the aquifer were positively correlated with groundwater recharge. Aquifers with higher permeability will generate preferential flows and receive increased recharge during ecological water replenishment and precipitation [49]. An increase in the permeability of the aquifer generally results first in an increase in groundwater storage followed by a decrease [50,51]. However, this rule does not appear to apply to the plain area of the Yongding River (Beijing section), as the permeability coefficient of the aquifer (10–200 m d−1) is positively correlated with groundwater storage.
The effect of ecological water replenishment on groundwater recharge in the plain area of the Yongding River (Beijing section) is regulated by surface elevation, the aquifer permeability coefficient, and specific yield. The topography of the plain area of the Yongding River (Beijing section) is high in the northwest and low in the southeast. The sand gravel beds with good permeability and water storage capacity deposited in the northwest of the plain are affected by piedmont alluvial and diluvial deposition and are mainly recharged through precipitation and ecological water replenishment.

5. Conclusions

The impact of ecological water replenishment in 2020 on groundwater recharge in the Yongding River (Beijing section) was obvious, with groundwater storage increasing by 2.17 × 10⁸ m3. During this period, 73.6% of the regional groundwater table increased by between 0.1–9.1 m and an arithmetic mean of 2.3 m. There was a declining trend in groundwater storage in the Daxing District. This indicates the need for more reasonable allocation of water resources and a reduction in groundwater exploitation in this district. The effect of ecological water replenishment on groundwater in the Yongding River was positively correlated with surface elevation, aquifer permeability, and specific yield. The distance of the recharge point from the Yongding River fault zone was inversely related to groundwater recharge. A lag effect was evident in the influence of ecological water replenishment on groundwater recharge. The behavior of preferential flow and high recharge in correspondence of faults is common in karst systems. Ecological water replenishment had the highest influence on recharge of the Ordovician limestone aquifer in the gorge area, and karst water overflowed through the fault zone to resupply the Quaternary groundwater in the plain area. The aquifer in the northwestern part of the Yongding River (Beijing section) plain area characterized by a high water yield and coarse grains can act as a good groundwater storage space and is most affected by ecological water replenishment. This study can help to better understand the effect and impact of ecological water replenishment on groundwater resource recharge and its implications for improving ecological water replenishment projects.

Author Contributions

C.X.: Writing—Original Draft, Methodology, Writing—Review & Editing. Y.S.: Investigation, Resources. B.S.: Data Curation, Writing—Review & Editing. X.W.: Data Curation, Writing—Review & Editing. R.L.: Conceptualization, Methodology, Supervision. M.L.: Project administration, Resources. B.X.: Project administration, Resources. C.F.: Writing—Review & Editing, Resources. All authors have read and agreed to the published version of the manuscript.

Funding

This research was funded by the Beijing Science and Technology Planning Project, grant number Z191100006919001, and the Fundamental Research Business Special Project of the Central Public Welfare Scientific Research Institutes (JY-2013YQ06072101).

Institutional Review Board Statement

Not applicable.

Informed Consent Statement

Not applicable.

Data Availability Statement

The data presented in this study are available on request from the corresponding author.

Conflicts of Interest

The authors declare no conflict of interest.

References

  1. Wada, Y.; Van Beek, L.P.H.; Van Kempen, C.M.; Reckman, J.W.T.M.; Vasak, S.; Bierkens, M.F.P. Global depletion of groundwater resources. Geophys. Res. Lett. 2010, 37, L20402. [Google Scholar] [CrossRef] [Green Version]
  2. Turner, S.W.D.; Hejazi, M.; Yonkofski, C.; Kim, S.H.; Kyle, P. Influence of Groundwater Extraction Costs and Resource Depletion Limits on Simulated Global Nonrenewable Water Withdrawals Over the Twenty-First Century. Earth’s Future 2019, 7, 123–135. [Google Scholar] [CrossRef] [Green Version]
  3. De Graaf, I.E.M.; Gleeson, T.; van Beek, L.R.; Sutanudjaja, E.H.; Bierkens, M.F.P. Environmental flow limits to global groundwater pumping. Nature 2019, 574, 90–94. [Google Scholar] [CrossRef] [PubMed]
  4. Medici, G.; Engdahl, N.B.; Langman, J.B. A Basin-Scale Groundwater Flow Model of the Columbia Plateau Regional Aquifer System in the Palouse (USA): Insights for Aquifer Vulnerability Assessment. Int. J. Environ. Res. 2021, 15, 299–312. [Google Scholar] [CrossRef]
  5. Manna, F.; Cherry, J.; McWhorter, D.; Parker, B. Groundwater recharge assessment in an upland sandstone aquifer of southern California. J. Hydrol. 2016, 541, 787–799. [Google Scholar] [CrossRef] [Green Version]
  6. Manna, F.; Walton, K.; Cherry, J.A.; Parker, B.L. Five-century record of climate and groundwater recharge variability in southern California. Sci. Rep. 2019, 9, 1–8. [Google Scholar] [CrossRef] [Green Version]
  7. Kattan, Z.; Kadkoy, N.; Nasser, S.; Safadi, M.; Hamed, A. Isotopes and geochemistry in a managed aquifer recharge scheme: A case study of fresh water injection at the Damascus University Campus, Syria. Hydrol. Process. 2010, 24, 1791–1805. [Google Scholar] [CrossRef]
  8. Moon, S.-K.; Woo, N.C.; Lee, K.S. Statistical analysis of hydrographs and water-table fluctuation to estimate groundwater recharge. J. Hydrol. 2004, 292, 198–209. [Google Scholar] [CrossRef]
  9. Yang, Y.; Li, G.-M.; Dong, Y.-H.; Li, M.; Yang, J.-Q.; Zhou, D.; Yang, Z.-S.; Zheng, F.-D. Influence of South to North Water Transfer on groundwater dynamic change in Beijing plain. Environ. Earth Sci. 2012, 65, 1323–1331. [Google Scholar] [CrossRef]
  10. Hao, Q.; Shao, J.; Cui, Y.; Xie, Z. Applicability of artificial recharge of groundwater in the Yongding River alluvial fan in Beijing through numerical simulation. J. Earth Sci. 2014, 25, 575–586. [Google Scholar] [CrossRef]
  11. Qin, H. Numerical simulation and scenario analysis of groundwater flow in Beijing plain. Sci. Technol. Eng. 2018, 18, 262–270. [Google Scholar]
  12. Hu, L.; Guo, J.; Zhang, S. Response of groundwater regime to ecological water replenishment of the Yongding River. Hydrogeol. Eng. Geol. 2020, 47, 5–11. [Google Scholar] [CrossRef]
  13. Sun, K.; Hu, L.; Guo, J.; Yang, Z.; Zhai, Y.; Zhang, S. Enhancing the understanding of hydrological responses induced by ecological water replenishment using improved machine learning models: A case study in Yongding River. Sci. Total Environ. 2021, 768, 145489. [Google Scholar] [CrossRef] [PubMed]
  14. Yu, Y.; Ma, M.; Zheng, F.; Liu, L.; Zhao, N.; Li, X.; Yang, Y.; Guo, J. Spatio-Temporal Variation and Controlling Factors of Water Quality in Yongding River Replenished by Reclaimed Water in Beijing, North China. Water 2017, 9, 453. [Google Scholar] [CrossRef]
  15. Landerer, F.W.; Swenson, S.C. Accuracy of scaled GRACE terrestrial water storage estimates. Water Resour. Res. 2012, 48, W04531. [Google Scholar] [CrossRef]
  16. Strassberg, G.; Scanlon, B.R.; Chambers, D. Evaluation of groundwater storage monitoring with the GRACE satellite: Case study of the High Plains aquifer, central United States. Water Resour. Res. 2009, 45, 45. [Google Scholar] [CrossRef] [Green Version]
  17. Cao, G.; Zheng, C.; Scanlon, B.R.; Liu, J.; Li, W. Use of flow modeling to assess sustainability of groundwater resources in the North China Plain. Water Resour. Res. 2013, 49, 159–175. [Google Scholar] [CrossRef]
  18. Hamdi, M.; Zagrarni, M.F.; Djamai, N.; Jerbi, H.; Goita, K.; Tarhouni, J. 3D geological modeling for complex aquifer system conception and groundwater storage assessment: Case of Sisseb El Alem Nadhour Saouaf basin, northeastern Tunisia. J. Afr. Earth Sci. 2018, 143, 178–186. [Google Scholar] [CrossRef]
  19. Refsgaard, J.C.; Højberg, A.L.; Møller, I.; Hansen, M.; Søndergaard, V. Groundwater Modeling in Integrated Water Resources Management-Visions for 2020. Ground Water 2010, 48, 633–648. [Google Scholar] [CrossRef]
  20. Healy, R.W.; Cook, P. Using groundwater levels to estimate recharge. Hydrogeol. J. 2002, 10, 91–109. [Google Scholar] [CrossRef]
  21. Rezaei, A.; Mohammadi, Z. Annual safe groundwater yield in a semiarid basin using combination of water balance equation and water table fluctuation. J. Afr. Earth Sci. 2017, 134, 241–248. [Google Scholar] [CrossRef]
  22. Artusi, R.; Verderio, P.; Marubini, E. Bravais-Pearson and Spearman Correlation Coefficients: Meaning, Test of Hypothesis and Confidence Interval. Int. J. Biol. Markers 2002, 17, 148–151. [Google Scholar] [CrossRef]
  23. Yang, Z.-Y.; Wang, K.; Yuan, Y.; Huang, J.; Chen, Z.-J.; Li, C. Non-Negligible Lag of Groundwater Infiltration Recharge: A Case in Mu Us Sandy Land, China. Water 2019, 11, 561. [Google Scholar] [CrossRef] [Green Version]
  24. Zhou, Y.; Dong, D.; Liu, J.; Li, W. Upgrading a regional groundwater level monitoring network for Beijing Plain, China. Geosci. Front. 2013, 4, 127–138. [Google Scholar] [CrossRef] [Green Version]
  25. Ren, M.; Xu, Z.; Pang, B.; Liu, J.; Du, L. Spatiotemporal Variability of Precipitation in Beijing, China during the Wet Seasons. Water 2020, 12, 716. [Google Scholar] [CrossRef] [Green Version]
  26. Zhao, N.; Yue, T.; Li, H.; Zhang, L.; Yin, X.; Liu, Y. Spatio-temporal changes in precipitation over Beijing-Tianjin-Hebei region, China. Atmos. Res. 2018, 202, 156–168. [Google Scholar] [CrossRef]
  27. Belkhiri, L.; Tiri, A.; Mouni, L. Spatial distribution of the groundwater quality using kriging and Co-kriging interpolations. Groundw. Sustain. Dev. 2020, 11, 100473. [Google Scholar] [CrossRef]
  28. Shukla, K.; Kumar, P.; Mann, G.S.; Khare, M. Mapping spatial distribution of particulate matter using Kriging and Inverse Distance Weighting at supersites of megacity Delhi. Sustain. Cities Soc. 2020, 54, 101997. [Google Scholar] [CrossRef]
  29. Hasan, K.; Paul, S.; Chy, T.J.; Antipova, A. Analysis of groundwater table variability and trend using ordinary kriging: The case study of Sylhet, Bangladesh. Appl. Water Sci. 2021, 11, 1–12. [Google Scholar] [CrossRef]
  30. Wackernagel, H. Ordinary Kriging. In Multivariate Geostatistics; Springer: Berlin/Heidelberg, Germany, 2003; pp. 79–88. [Google Scholar]
  31. Chabala, L.M.; Mulolwa, A.; Lungu, O. Application of Ordinary Kriging in Mapping Soil Organic Carbon in Zambia. Pedosphere 2017, 27, 338–343. [Google Scholar] [CrossRef]
  32. Deng, Y.; Liu, K.; Liu, Y.; Xin, X. Experiment of hydrogeology parameters in the Yongding River. J. Eng. Geol. 2017, 25, 496–502. [Google Scholar]
  33. Hu, H.; Mao, X.; Yang, Q. Development of a groundwater flow and reactive solute transport model in the Yongding River alluvial fan, China. Front. Earth Sci. 2019, 13, 371–384. [Google Scholar] [CrossRef]
  34. Men, B.; Wu, Z.; Liu, H.; Tian, W.; Zhao, Y. Spatio-temporal Analysis of Precipitation and Temperature: A Case Study Over the Beijing–Tianjin–Hebei Region, China. Pure Appl. Geophys. 2020, 177, 3527–3541. [Google Scholar] [CrossRef]
  35. Sun, J.; Wang, X.; Shahid, S. Precipitation and runoff variation characteristics in typical regions of North China Plain: A case study of Hengshui City. Theor. Appl. Climatol. 2020, 142, 971–985. [Google Scholar] [CrossRef]
  36. Yin, L.; Hu, G.; Huang, J.; Wen, D.; Dong, J.; Wang, X.; Li, H. Groundwater-recharge estimation in the Ordos Plateau, China: Comparison of methods. Hydrogeol. J. 2011, 19, 1563–1575. [Google Scholar] [CrossRef]
  37. Wang, L.-M.; Liu, J.; Yang, F.-G.; Yang, L.-B.; Yao, B.-M.; Wang, X.-L. Acguisition of Winter Wheat Area in the Beijing-Tianjin-Hebei Region with GF-1 Satellite Data. Acta Agron. Sin. 2018, 44, 762–773. [Google Scholar] [CrossRef]
  38. Wei, T.; Peng, Z.; Liu, F.; Zhang, B.; Zhang, P.; Du, L.; Zhang, Q. Trend of net Irrigation water requirement of wheat-maize rotation in North China-A case study of Daxing district. J. Irrig. Drain. 2019, 38, 63–72. [Google Scholar] [CrossRef]
  39. Chen, Y.; Ma, Y. Discussion on the recharge of the Yongding River to the groundwater in Beijing through the Xishan Mountains. J. Water Conserv. 1981, 3, 10–18. [Google Scholar]
  40. Medici, G.; Smeraglia, L.; Torabi, A.; Botter, C. Review of Modeling Approaches to Groundwater Flow in Deformed Carbonate Aquifers. Ground Water 2021, 59, 334–351. [Google Scholar] [CrossRef]
  41. Li, Y.; Shao, J.; Ye, C.; Xing, G.; Cui, Y. A discussion on the patterns of groundwater reservoir in the west suburb of Beijing. Earth Sci. Front. 2010, 17, 192–199. [Google Scholar]
  42. Wang, X.; Wang, Z.; Qi, Y.; Guo, H. Effect of urbanization on the winter precipitation distribution in Beijing area. Sci. China Ser. D Earth Sci. 2009, 52, 250–256. [Google Scholar] [CrossRef]
  43. Smerdon, B.; Allen, D.; Grasby, S.; Berg, M. An approach for predicting groundwater recharge in mountainous watersheds. J. Hydrol. 2009, 365, 156–172. [Google Scholar] [CrossRef]
  44. Folch, A.; Mas-Pla, J. Hydrogeological interactions between fault zones and alluvial aquifers in regional flow systems. Hydrol. Process. 2008, 22, 3476–3487. [Google Scholar] [CrossRef]
  45. Cai, X.; Zhang, L.; Guo, G.; You, S.; Fang, T.; Lv, J.; Liang, Y. New progress in the study of Quaternary geology in Beijing Plain. Geol. China 2016, 43, 1055–1066. [Google Scholar]
  46. Thomas, B.F.; Behrangi, A.; Famiglietti, J.S. Precipitation Intensity Effects on Groundwater Recharge in the Southwestern United States. Water 2016, 8, 90. [Google Scholar] [CrossRef] [Green Version]
  47. Sohrt, J.; Ries, F.; Sauter, M.; Lange, J. Significance of preferential flow at the rock soil interface in a semi-arid karst environment. Catena 2014, 123, 1–10. [Google Scholar] [CrossRef]
  48. Vu, V.H.; Merkel, B.J. Estimating groundwater recharge for Hanoi, Vietnam. Sci. Total Environ. 2019, 651, 1047–1057. [Google Scholar] [CrossRef]
  49. Hu, K.; Awange, J.L.; Khandu; Forootan, E.; Goncalves, R.; Fleming, K. Hydrogeological characterisation of groundwater over Brazil using remotely sensed and model products. Sci. Total Environ. 2017, 599–600, 372–386. [Google Scholar] [CrossRef] [Green Version]
  50. Razack, M.; Huntley, D. Assessing Transmissivity from Specific Capacity in a Large and Heterogeneous Alluvial Aquifer. Ground Water 1991, 29, 856–861. [Google Scholar] [CrossRef]
  51. Li, H.; Jiao, J.J. Analytical studies of groundwater-head fluctuation in a coastal confined aquifer overlain by a semi-permeable layer with storage. Adv. Water Resour. 2001, 24, 565–573. [Google Scholar] [CrossRef] [Green Version]
Figure 1. Map of the Yongding River (Beijing section) showing the boundary of the plain area, aquifer characteristics, and distribution of observation wells. Zone I is the single sand–gravel layer, K > 200 m/d; zone II consists of two to three layers of sand-gravel, 200 m/d > K > 150 m/d; zone III consists of multiple layers of sand gravel and a few layers of sand, 150 m/d > K > 100 m/d; zone IV consists of multiple layers of sand and a few layers of gravel, K < 100 m/d and zone V consists of multiple layers of sand, K < 50 m/d. A-A’ is a hydrogeological cross-section, this figure is adapted from the report “Groundwater Flow Modeling and Groundwater Resource Potential in the Plain Area of Beijing”.
Water 14 00828 g001
Figure 2. Monthly precipitation of the Yongding River catchment (Beijing section) in 2020.
Water 14 00828 g002
Figure 3. Grid subdivision and parameter zoning in the plain area of Yongding River (Beijing section): (a) grid map; (b) zoning of specific yield.
Water 14 00828 g003
Figure 4. Empirical semivariance of 1 July data its fitted model: (a) Gaussian model, (b) Spherical model, (c) J-Bessel model, (d) Exponential model.
Water 14 00828 g004
Figure 5. Spatial prediction errors map of groundwater level change values ((ad) are Spatial prediction errors map of groundwater level change values on 20 May, 1 July, 1 September, and 1 November 2020, respectively.).
Water 14 00828 g005
Figure 6. Changes to the groundwater table in the plain area of the Yongding River (Beijing section). During ecological water replenishment in 2020 ((ad) show changes to the groundwater levels on 20 May, 1 July, 1 September, and 1 November 2020, respectively, as compared with that on 20 April 2020 during which ecological water replenishment was not conducted).
Water 14 00828 g006
Figure 7. Changes to groundwater storage in the plain area of Yongding River (Beijing section) after ecological water replenishment on 1 November 2020.
Water 14 00828 g007
Figure 8. The correlations between groundwater replenishment and various natural factors during ecological water replenishment in the plain area of the Yongding River (Beijing section) (F1 is the ground elevation, F2 is the distance between the recharge point and the Yongding River fault zone, F3 is the thickness of Quaternary strata, F4 is precipitation, F5 is specific yield, F6 is the permeability coefficient, V1 is the change in groundwater storage, and V2 is the fluctuation in the groundwater table, n = 82, p-value < 0.05).
Water 14 00828 g008
Table 1. Semivariogram models and model parameters.
Semi-VariogramNugget (C0)p-Sill (C)Nugget-Sill Ratio (C0/(C0 + C) × 100%)
Gaussian0.972.1331%
Spherical0.752.3924%
J-Bessel1.341.5646%
Exponential0.762.60 23%
Table 2. Cross-validation for the predictive models.
Types20-May1-July1-September1-November
RMSE1.151.141.131.48
ASE1.681.561.231.65
RMSSE0.870.890.960.9
Table 3. Groundwater equilibrium elements of the plain area of the Yongding River (Beijing section).
SymbolRecharge and Excretion FactorsAmount of Recharge and Excretion (108 m3)
QrRiver recharge 0.58
PPrecipitation recharge3.42
Qs1Aquifer lateral inflow0.44
QpLeakage of urban pipe network0.30
QwArtificial exploitation2.73
Qs2Aquifer lateral discharge0.02
Publisher’s Note: MDPI stays neutral with regard to jurisdictional claims in published maps and institutional affiliations.

