Article

Development of Quantitative Real-Time PCR for Detecting Environmental DNA Derived from Marine Macrophytes and Its Application to a Field Survey in Hiroshima Bay, Japan

by
Masami Hamaguchi
1,*,
Toshihiro Miyajima
2,
Hiromori Shimabukuro
1 and
Masakazu Hori
3
1
Fisheries Technology Institute, Japan Fisheries Research and Education Agency, 2-17-5 Maruishi, Hatsukaichi 739-0452, Japan
2
Atmosphere and Ocean Research Institute, The University of Tokyo, Kashiwa 277-8564, Japan
3
Fisheries Resource Institute, Japan Fisheries Research and Education Agency, 2-12-4 Fukuura, Yokohama 236-8648, Japan
*
Author to whom correspondence should be addressed.
Water 2022, 14(5), 827; https://doi.org/10.3390/w14050827
Submission received: 2 February 2022 / Revised: 23 February 2022 / Accepted: 28 February 2022 / Published: 6 March 2022
(This article belongs to the Section Oceans and Coastal Zones)

Abstract

:
The sequestration and storage of carbon dioxide by marine macrophytes is called blue carbon; this ecosystem function of coastal marine ecosystems constitutes an important countermeasure to global climate change. The contribution of marine macrophytes to blue carbon requires a detailed examination of the organic carbon stock released by these macrophytes. Here, we introduce a quantitative real-time polymerase chain reaction (qPCR)-based environmental DNA (eDNA) system for the species-specific detection of marine macrophytes. and report its application in a field survey in Hiroshima Bay, Japan. A method of qPCR-based quantification was developed for mangrove, seagrass, Phaeophyceae, Rhodophyta and Chlorophyta species, or species-complex, collected from the Japanese coast to investigate their dynamics after they wither and die in the marine environment. A trial of the designed qPCR system was conducted using sediment samples from Hiroshima Bay. Ulva spp. were abundant in coastal areas of the bay, yet their eDNA in the sediments was scarce. In contrast, Zostera marina and the Sargassum subgenus Bactrophycus spp. were found at various sites in the bay, and high amounts of their eDNA were detected in the sediments. These results suggest that the fate of macrophyte-derived organic carbon after death varies among species.

1. Introduction

Carbon sequestration and long-term storage in marine systems, including mangroves, salt marshes, seaweed beds and seagrass meadows, is a form of “blue carbon” and constitutes an important coastal ecosystem service for global climate-change mitigation [1,2,3]. The value of blue carbon ecosystems for greenhouse gas sequestration has recently been calculated to create targeted policies [4], and there is increasing expectation worldwide for blue carbon as a climate-change countermeasure.
Therefore, it is necessary to develop tools that can verify the fate of macrophyte-derived organic carbon, not only in mangrove, salt marsh and seagrass systems, but also the pathway in seaweed habitats along coastlines, which recent research has proven to be another important carbon sink [5,6,7,8,9,10]. However, research on blue carbon science is relatively new in Japan, and details of carbon sequestration by macrophytes in the coastal environment are still not well understood.
Environmental DNA (eDNA) technology [11,12,13,14] is especially useful for studying the contribution of macrophytes to the blue carbon sink. Two eDNA techniques are presently used to investigate organic carbon in marine sediments: comparative metabarcoding using next-generation sequencing (NGS), and species-specific analysis using quantitative real-time PCR (qPCR). A few studies to date have directly compared these methods of eDNA detection, describing the advantages and disadvantages of each method [15,16,17].
Compared with conventional methods, metabarcoding with NGS can provide a large amount of genetic information in a shorter time. Therefore, metabarcoding analysis is a powerful tool for determining, for example, the presence and species composition of seaweed eDNA in marine sediments. For this reason, many researchers in the field of blue carbon science have used this method [7,18,19]. PCR primers to amplify the V7 and V9 regions of nuclear 18S rRNA [7,20], or the rbcL gene of plastid DNA [18], are currently being used in NGS. However, these primers can be inefficient because they amplify the DNA of many organisms other than seaweeds, and it is difficult to distinguish between closely related species. Nevertheless, NGS is effective as a primary screening method for detecting the types of macrophytes in eDNA material from marine sediments. Although metabarcoding through NGS originally had the disadvantage of not being quantitative, Ushio et al. [21] succeeded in adjusting the technique to provide quantitative data, thus greatly advancing eDNA technology [22].
TaqMan probes [23], which are hydrolysis probes, or derived dual-labeled probes (DLPs), can incorporate species-specific regions in up to three locations in the primer and probe regions and have extremely high species specificity compared with ordinary PCR. For example, ever faster and more accurate methods are desirable for diagnosing infectious diseases in humans; hence, qPCR using either TaqMan or DLP is frequently used for the diagnosis of SARS-CoV-2 infection, the cause of the current pandemic [24].
The qPCR method is useful for studying the dynamics of specific species in the marine environment because it is less expensive and simpler than NGS. In qPCR, using either TaqMan or DLP, up to 5 or 6 targets can be examined simultaneously, although the quantitative detection of 2 or 3 targets simultaneously is generally used [25]. Taking advantage of this property of qPCR, Nakayama and Hamaguchi [26] reported a method for the more accurate detection of a single target by simultaneously detecting two different gene regions in the target species, to improve identification accuracy. Hamaguchi et al. [27] designed PCR primers for nuclear DNA, and DLPs for chloroplast DNA, to investigate differences in the persistence of nuclear and chloroplast DNA, respectively, in an effort to detail the dynamics of organic carbon derived from the eelgrass Zostera marina, in both the water column and in sediment. If qPCR is applied to detect multiple macrophytes species, it is necessary to design a detection system consisting of DLPs and PCR primers for each target species. This is one of the reasons that there are few examples of the adaptation of qPCR in this field.
It is noteworthy that qPCR is easy to use and inexpensive compared to metabarcoding analysis by NGS, yet it is highly quantitative. Because gene quantification is necessary for an analysis of the relationship between genes and organic carbon, qPCR is useful in studying the degradation process and distribution in the ocean of organic carbon that is derived from species-specific macrophytes. In this work, we present a qPCR-based assay to detect various marine macrophyte species in eDNA. Second, we applied this qPCR system to sediment samples collected in Hiroshima Bay, Japan because blue carbon storage involves sequestration in sediments (for details of the process in wetlands, see [28]). In addition, we verified the newly devised method for evaluating the quantification limits of qPCR, an aspect that has seldom been considered in previous evaluations of eDNA.

2. Materials and Methods

The following qPCR experiments were performed following the guidelines of Busin et al. [29] and the checklist of Raymaekers et al. [30], where possible.

2.1. Sample Collection and DNA Extraction

The Japanese archipelago is surrounded by the Pacific Ocean, the East China Sea, the Japan Sea, and the Sea of Okhotsk, and is connected to the mainland of Asia by the relatively shallow-lying continental shelf. Although Japan has a small land area, it has a large oceanic area, and there has been much interest in evaluating the ocean as a sink for carbon dioxide. As the islands of Japan stretch from the subarctic to the subtropics, a wide variety of coastal macrophytes occur. A total of 142 species of marine macrophytes, submerged plants, and terrestrial plants were collected in the coastal waters of Japan after 2003. Each sample was dried with silica gel and then crushed with a TissueLyser (Qiagen, Valencia, CA, USA); DNA was extracted with the DNeasy Plant Mini Kit (Qiagen). Sediments from Hiroshima Bay were collected with a Smith–McIntire grab sampler on 29 October 2020 (Figure 1). Hiroshima Bay is located in the western part of the Seto Inland Sea (the largest inland sea area in Japan) and has brackish water and high river inflow. Hiroshima Bay has the most intensive oyster farming industry in the country. The city of Hiroshima is situated on the northernmost shore of the bay, although much of the city area was created by land reclamation and was once a vast expanse of tidal flats and eelgrass beds. Figure 2 shows the locations where different seagrass and seaweed taxa were confirmed in a biomonitoring survey by the Ministry of the Environment of Japan and by the authors’ own survey. Zostera marina, the Sargassum subgenus Bactrophycus spp., and Ulva spp. were widely distributed in the bay; Eisenia/Ecklonia spp. were abundant in the southern part of the bay and around Yashirojima Island; the Sargassum subgenus clade Sargassum spp. were found only off the northern shore of Yashirojima Island. A fixed amount (~100 mg) of lyophilized sediment was crushed with a TissueLyser, and DNA was extracted with the NucleoSpin Soil kit using the buffer SL-1 (MACHEREY-NAGEL, Deer Park, NY, USA). DNA hypoabsorbent plastic tubes and pipette tips were used in the experiments.

2.2. Quantitation of Extracted DNA and Plasmid DNA

Extracted DNA and plasmid DNA were quantified and qualified using a NanoDrop 2000 spectrophotometer (Thermo Fisher Scientific, Waltham, MA, USA) or GeneQuant II (Amersham Pharmacia, Uppsala, Sweden) spectrophotometer. The closed circles show the site at which each species was observed.

2.3. DNA Sequences of Internal Transcribed Spacer (ITS) and Maturasek (matK) Genes of Various Macrophyte DNA

Following the method of Hamaguchi et al. [27], the ITS gene of nuclear DNA and the matK gene of chloroplast DNA were subjected to polymerase chain reaction (PCR) amplification using primers that were reported previously for ITS [31,32] and matK [33]. A MyCycler™ thermal cycler (Bio-Rad, Hercules, CA, USA) was used to amplify PCR products in a total volume of 25 μL, comprising 1 U of KOD FX™ (1 U/μL; ToYoBo, Osaka, Japan), 2 × PCR buffer for KOD FX, 2 μM of each dNTP, 0.3 μM of each primer, and 1 μL (DNA concentration < 100 ng) of template DNA. This DNA polymerase is resistant to contamination by plant-derived polysaccharides and other substances that inhibit PCR, making it suitable for PCR using DNA extracted from various seagrasses, macroalgae, and mangrove species. The PCR amplification cycles included denaturation at 94 °C for 2 min; 35–45 cycles of denaturation at 94 °C for 10 s followed by annealing at 55 °C for 30 s and an extension at 68 °C for 60 s; and a final extension for 5 min at 68 °C. The PCR-amplified products were checked by loading 3 μL of each sample with 3 μL of loading dye on a 2% agarose gel (Agarose S; Nippon Gene, Tokyo, Japan) containing 0.5 μg/mL of ethidium bromide. The remaining 22 μL of PCR product was subsequently purified using a QIAquick PCR Purification Kit (Qiagen). If the PCR product was heteroplasmic, then it was subcloned using a Zero Blunt TOPO PCR Cloning Kit for sequencing (Thermo Fisher Scientific), according to the manufacturer’s protocol. Positive clones were checked by colony-directed PCR, then by electrophoresis, and the PCR products were purified using the above methods.
The purified PCR amplicons were sequenced using the PCR primers described above and the ABI PRISM BigDye Terminator v3.1 Cycle Sequencing Ready Reaction Kit (Applied Biosystems, Waltham, CA, USA) in a 3130xl Genetic Analyzer automated DNA sequencer (Applied Biosystems).

2.4. Design of Primers and DLPs for Detecting Various Macrophyte DNA

There are generally two types of qPCR detection systems: the intercalation method and the hydrolysis probe method (e.g., TaqMan probes). Although the former is easy to design, it has low specificity, and the operation is complicated because the obtained PCR product needs to be verified. Therefore, in this study, the hydrolysis probe method was adopted as the system for qPCR. The DLPs and PCR primers for detecting macrophyte DNA of various taxa were designed using the sequence data of individual specimens that we collected, and the sequences are registered in the international DNA database. Because a portion of the macrophytes species is classified according to country, we used the sequence information deposited by Japanese researchers as much as possible among the nucleotide sequences registered in the international DNA database. DLPs and PCR primers were designed for all macrophytes in the ITS region, and for angiosperms such as mangroves and eelgrasses in the matK region. Stiger et al. [34] divided the genus Sargassum into two subgenera, Sargassum and Bactrophycus, based on the ITS region. Although there are exceptions, based on the data presented here, members of Sargassum are likewise divided into these two subgenera because the subgenus Sargassum contains many subtropical species and the subgenus Bactrophycus includes many temperate species. To discriminate between Saccharina japonica and S. longipedalis (Phaeophyceae), DLPs and PCR primers were designed in the cytochrome c oxidase subunit I (COI) region of mitochondrial DNA, in addition to the ITS region, in accordance with the method used by Yotukura et al. [35] and Rana et al. [36].
Extrapolative internal standards used to determine the inhibitory effect of impurities and matrix effects remaining in the sample during field sample analysis on the PCR reaction were prepared from two species: for the internal standard, we used DNA from Crassostrea zhanjiangensis, a subtropical oyster species newly described in 2013 [37] but not yet confirmed in Japan, and from Ammodytes hexapterus [38], a subarctic fish found north of Hokkaido. DLPs and PCR primers were designed on the partial sequence of COI or cytochrome b (CYTB) of the mitochondrial DNA of these species, respectively. The designed DLPs and PCR primers were tested for specificity in silico using the international DNA database, and the specificity was also checked using samples that we collected that were closely related to each target species. First, qPCR, using the designed DLPs and PCR primers, was performed via the temperature-gradient function of the real-time PCR instrument, to investigate the appropriate reaction temperature and its range. Next, qPCR was performed with the designed DLPs or PCR primers, using the DNA of each land plant and marine macrophyte species collected from various locations to verify the species specificity. Species specificity was judged to be present if the difference in quantification cycle (Cq) values between the species for which the DLP or PCR primer was designed and those of the species to be compared was 10 or more. When designing DLPs and PCR primers, we followed the work of Bustin et al. [29] and Pedersen et al. [12] as closely as possible.

2.5. Plasmid Development for Construction of the Standard Curve

The PCR amplicons of newly designed PCR primers included the target region of the DLPs and the PCR primer sets designed in this study. Each amplicon was cloned into a pCR4-TOPO plasmid vector (Thermo Fisher Scientific) and chemically transformed into Escherichia coli TOP10-competent cells (Invitrogen), cultured overnight on Luria–Bertani (LB) agar plates (Thermo Fisher Scientific). After this period, several colonies were selected and checked via direct colony PCR using the primers for each of the inserted PCR amplicons. Six positive colonies were further cultured in 2 × LB broth overnight, and plasmids were extracted using a QIAprep plasmid purification kit (Qiagen). The construction of the calibration curve followed the method of Hamaguchi et al. [27] and used a DNA polymerase selected according to the characteristics of the DLPs and PCR primers designed in this study, making a 10-fold dilution series of 101 to 107 using six plasmids. The calibration curve was redesigned if the obtained amplification efficiency was out of the range of 0.85–1.100, if the slope was out of the range of −3.6–3.1, or if the coefficient of determination of the calibration curve was <0.98. These criteria were based on the methods of Broeders et al. [39] and Ma et al. [40] but were set to more stringent conditions.

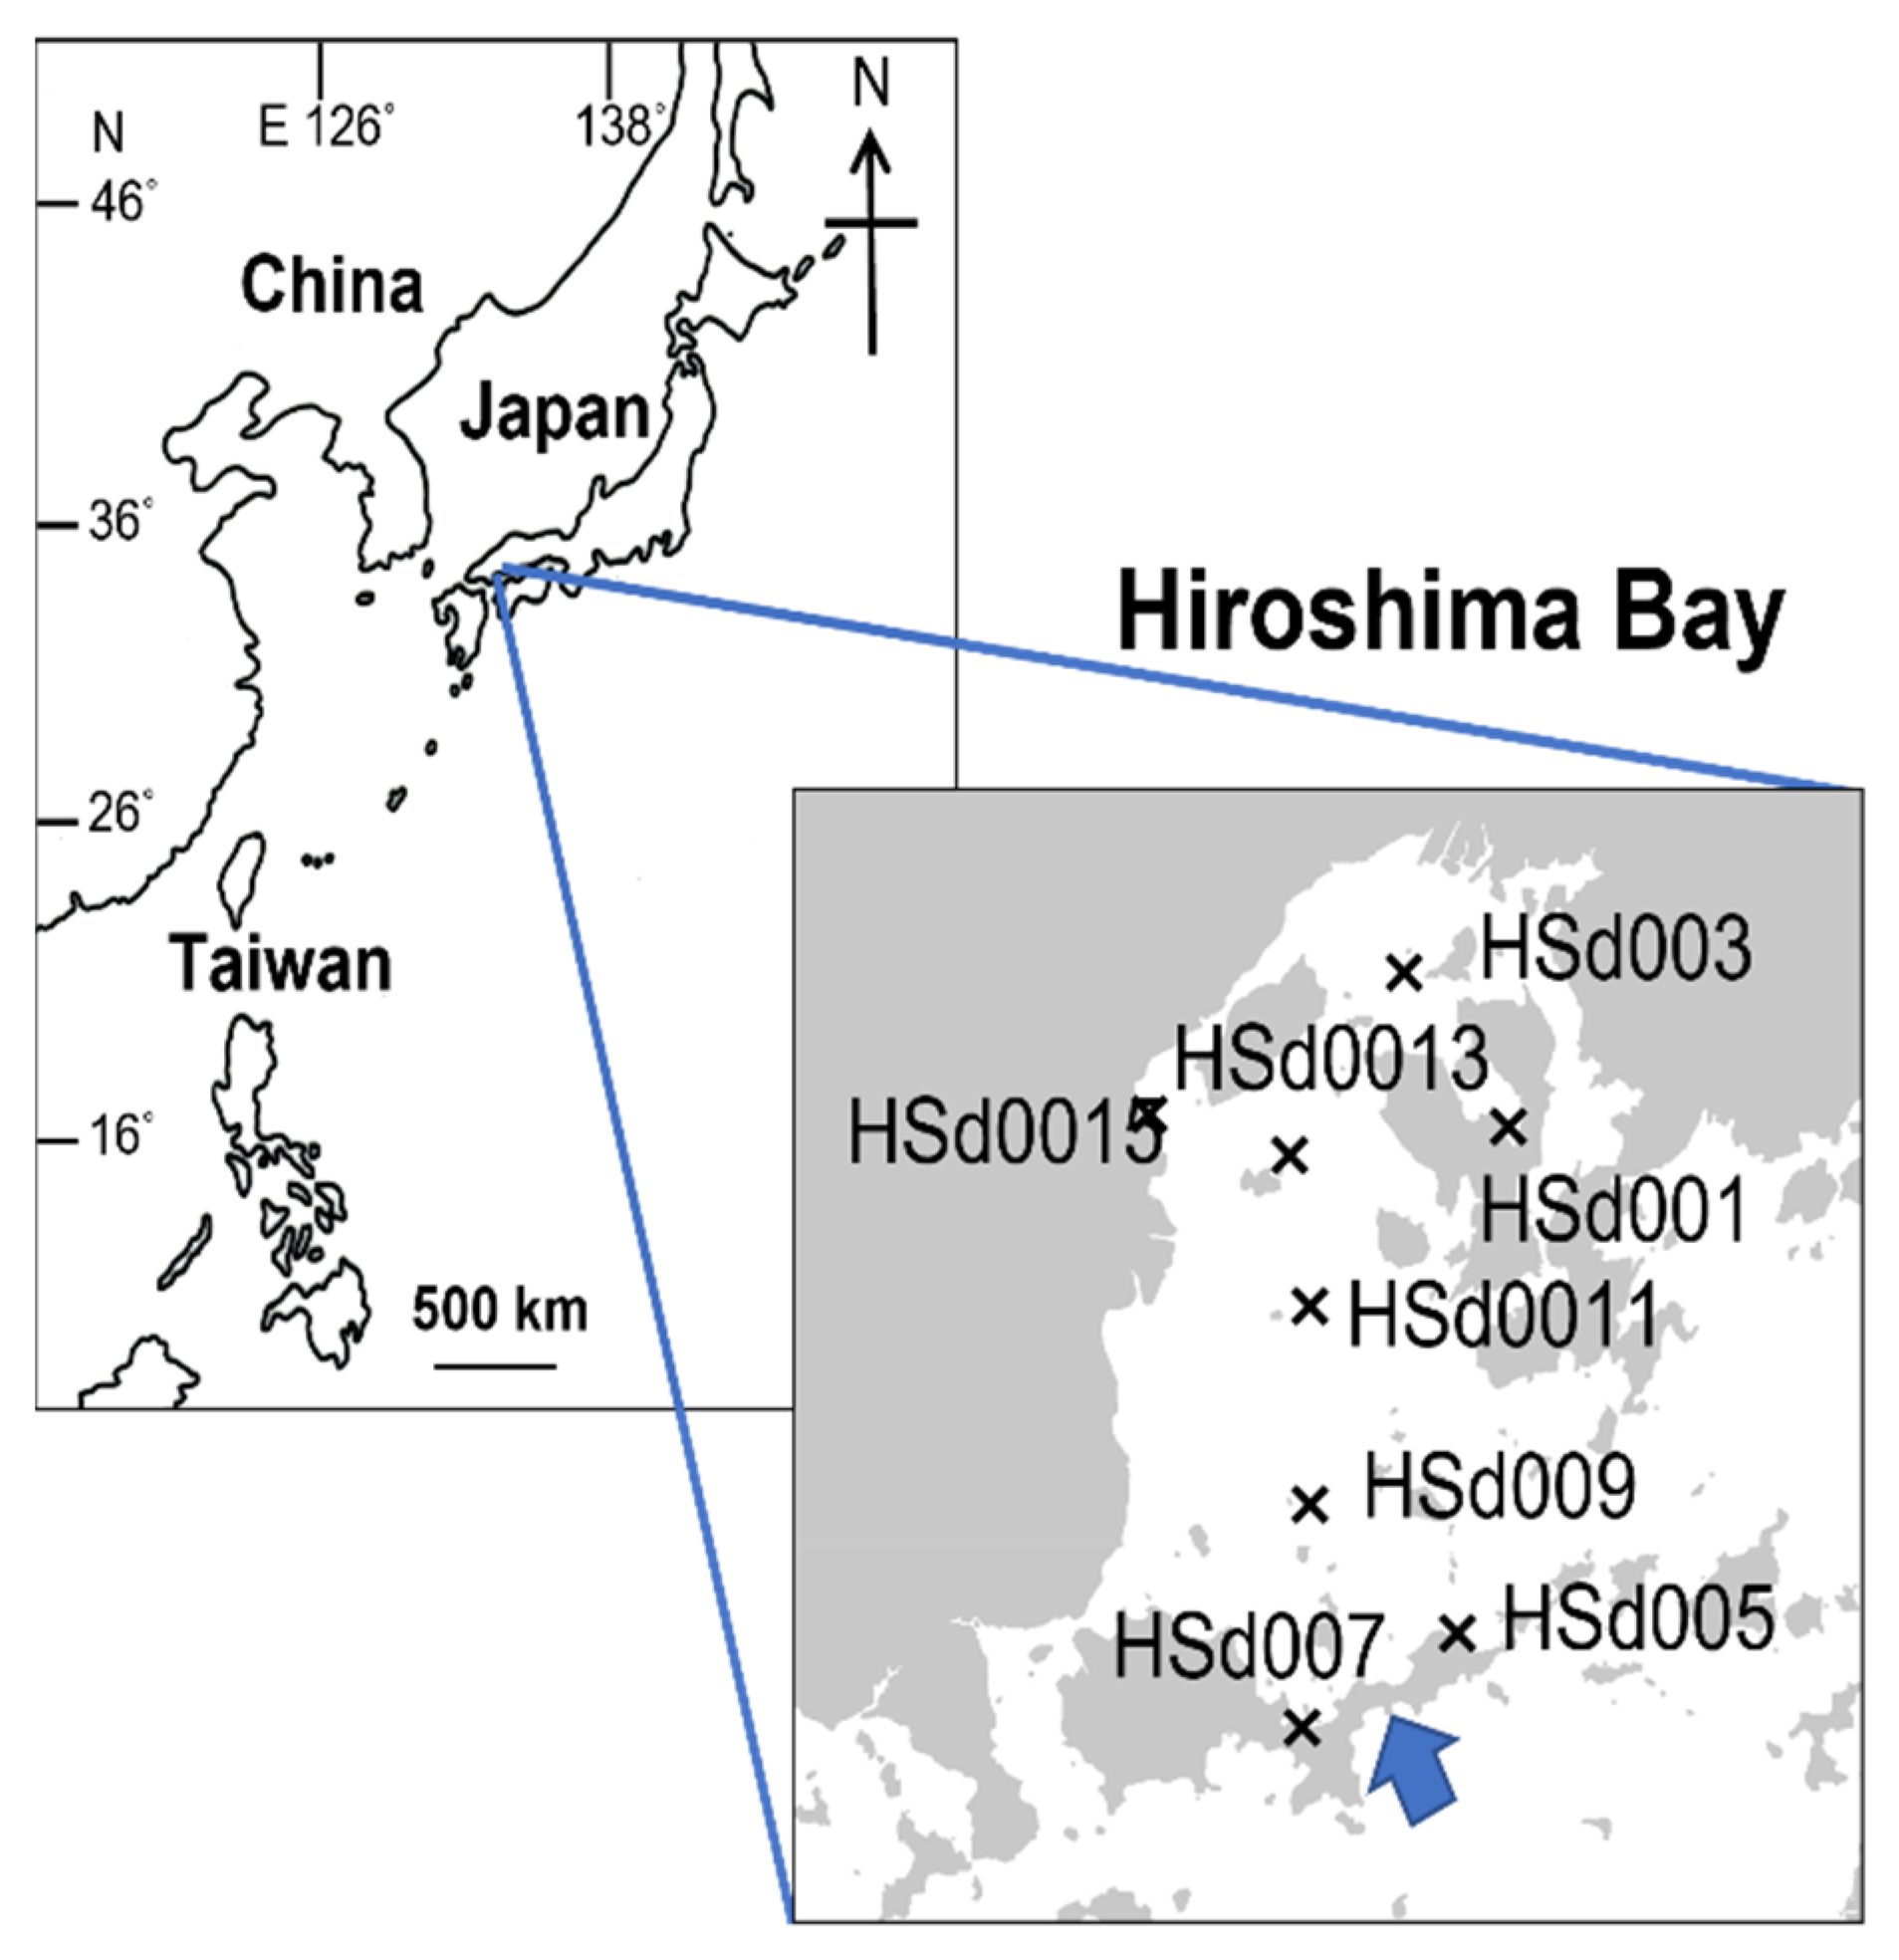
2.6. Application of the Newly Developed qPCR System to Field Sediment Samples

DNA was extracted from samples of marine sediment in Hiroshima Bay collected by the research vessel Shirafuji-Maru on 29 October 2020 (Figure 1) using the method described above and was then analyzed to identify macrophytes in the eDNA. The eDNA of seaweeds and seagrasses was analyzed by targeting Zostera marina, Sargassum spp., Bactrophycus spp., Ulva spp., Neopyropia yezoensis and its species complex, and Ecklonia/Eisenia spp. A duplex qPCR and well-to-well correction were performed in a final volume of 10 µL, containing 5 µL of SsoFast Probes Supermix with ROX or iQ Multiplex Powermix (Bio-Rad), 0.3 µL of each primer (300nM final concentration), 0.2 µL of each DLP (200nM final concentration), 1 µL of template DNA, and 3.5 µL of sterilized pure water. Amplification reactions were carried out using the CFX96 Touch Real-Time PCR detection system (Bio-Rad). For thermal cycling conditions, when the DNA polymerase used was SsoFast Probes Supermix with ROX, the reaction was carried out for 2 min at 95 °C, followed by 59 cycles of 10 s at 95 °C and 20 s at the reaction temperature of the respective DLP or PCR primer. On the other hand, when the DNA polymerase was iQ Multiplex Powermix, the reaction time was 2 min at 95 °C, followed by 10 s at 95 °C, and 20 s at the reaction temperature of the respective DLP or PCR primer for 59 cycles. Prior to the analysis, DNA samples extracted from the sediment samples were spiked with an internal standard made from Crassostrea zhanjiangensis or Ammodytes hexapterus DNA, and qPCR was performed to determine the presence of inhibitors of the PCR reaction. The thermal cycling conditions were 59 cycles of 95 °C for 2 min, followed by 10 s at 95 °C and 20 s at 62 °C using the SsoFast Probes Supermix with ROX. As a result of the analysis, if the detected amount of the internal standard shifted by more than one order of magnitude, it was judged that the PCR inhibitor had an effect, and the following operations were performed. The effects of PCR inhibitors and the matrix effect were reviewed by Schrader et al. [41] and Sidestedt et al. [42]; if their removal was necessary, a PCR inhibitor removal kit (Zymo Research, Irvine, CA, USA) was used or else DNA samples were diluted with tris-buffered (10 mM, pH 7.5) sterile water.

2.7. Calculation of Limit of Detection (LOD) and Limit of Quantification (LOQ) for eDNA

To standardize the eDNA data, the values of LOD and LOQ were determined using the number of copies of eDNA in sediments from Hiroshima Bay as a preliminary analysis. Then, six samples were selected whose DNA copy number was ≤103, and each sample was analyzed in eight replicates. First, the DNA copy numbers obtained from these results were converted to normal logarithms. Then, the mean standard deviation (δ), and coefficient of variation (CV) were calculated from these values. Finally, we selected the sample with the lowest DNA copy number with a CV of <10% and calculated the limit of detection as 3.3 δ and the limit of quantitation as 10 δ, according to the guidance document of the European Union Reference Laboratories [43].

2.8. Analysis of Physical and Chemical Properties of the Sediment Samples Collected from Hiroshima Bay

After the initial processing of the sediment samples, total nitrogen, organic carbon, C/N ratio, nitrogen and carbon stable isotope ration, specific surface area, total pore volume and average pore diameter were determined, according to the methods of Miyajima et al. [44,45]. Statistical analyses, using Type I regression, were performed in R 3.1.0 [46] within SPSS 22.0 (IBM, Armonk, NY, USA); p-values of less than 0.05 were considered statistically significant.

3. Results

3.1. Design of Primers and DLPs for Detecting DNA of Various Macrophyte Taxa

Eight species of mangrove, 14 species and 2 local populations of seagrasses, 47 species of Phaeophyceae, 22 species of Chlorophyta, 19 species and 1 culture strain of Rhodophyta, 2 species of calcareous algae, 6 species of freshwater submerged plant, and 23 species of terrestrial plants from Japan were collected to design the DLPs and PCR primers for qPCR (Table 1, Table 2, Table 3, Table 4 and Table 5), and the species specificity of the qPCR system was checked using these samples (Table 1, Table 2, Table 3, Table 4, Table 5 and Table 6). In Table 1, the species for which DLPs and PCR primers were designed are indicated by the solid circles in the columns referring to Table 1, Table 2, Table 3, Table 4 and Table 5, and species for which the specificity of the designed DLPs and PCR primers was verified are indicated by open circles. The characteristics of the calibration curves are shown in Table 6. The amplification efficiency, slope, and coefficient of determination of the DLPs and PCR primers designed in this study were all within the range of the set criteria. In this study, calibration curves were prepared using a dilution series from 101 to 107 copies/µL and showed high linearity, with a coefficient of determination of 0.99 to 1 (Table 6). Therefore, the dynamic range is 101 to 107 copies/µL for all DLPs and PCR primers. However, in this study, the ITS regions of Rhizophora stylosa, Bruguiera gymnorrhiza, Undaria pinnatifida, and Saccharina japonica showed different reactivities depending on the DNA polymerase used. When SsoFast Probes Supermix with ROX was used, the amplification efficiency and slope were out of the criteria range, but when iQ Multiplex Powermix was used, these characteristics were all within the appropriate range. For the internal standards for extrapolation, the following DLPs and PCR primers were designed using Crassostrea zhanjiangensis (CraZha-P: Cy5-CGCGGAAACTGTATCAGC-CACCT-BHQ3, CraZha-F: CAGCCATGCATTGGTTATAAT, CraZha-R:GGACTCAA-AACCTAAACGCA) and Ammodytes hexapterus (KitaIkana-Cytb-P: Cy5-CCGACAA-TTTCATCCCTGCCAACCCGC-BHQ3, KitaIkana-CytB-F: CTTTTCAGCCCTAATCTAC-TGGGG, KitaIkana-CytB-R: TGATGTGGGGAGGAGTCACG) DNA, and the plasmids obtained by subcloning the PCR products were used. The former was used as an internal standard to be extrapolated to field samples collected in waters north of Kyushu, and the latter for samples from south of Kyushu, Japan.

3.2. Detection of eDNA Derived from Mangroves

Table 1 shows the DLPs and PCR primers designed using the ITS and matK genes of the mangroves that are found around the islands of Iriomote and Ishigaki, and have relatively high biomass. Because the mangrove habitats were often defoliated as a result of physiological functions, such as the discharge of salt derived from seawater, we constructed a qPCR system in the matK gene of plastid DNA, in addition to the ITS gene of nuclear DNA, to track their differentiation during decomposition. The newly designed DLPs and PCR primers shown in Table 1 were validated with DNA extracted from 32 species of angiosperms collected in the Yaeyama Islands (Japan’s most-southwestern islands) and in Honshu, and none of them reacted by showing a difference in Cq value of within 10, which was the set criterion for the validation of species specificity. The DLPs and PCR primers for mangrove species and the resultant calibration curves are shown in Table 1 and Table 6, respectively. The amplification efficiency, slope, and coefficient of determination were within the range of the criteria set in this study, when DNA polymerase was selected according to each DLP and PCR primer.

3.3. Detection of eDNA Derived from Seagrass

Table 2 shows the DLPs and PCR primers specific to the dominant species of subtropical seagrasses found around Ishigaki and Iriomote islands; these were designed for both the ITS and matK genes, following the method of Hamaguchi et al. [27]. Table 3 shows the DLPs and PCR primers for qPCR of the temperate seagrasses Zostera marina and Z. caulescens, and the subarctic seagrass Phyllospadix iwatensis, which were variously found off Honshu, Tohoku, and Hokkaido. DLPs and PCR primers for the matK gene of P. iwatensis are under design. The newly designed DLPs and PCR primers that are shown in Table 2 and Table 3 were validated by qPCR, using DNA extracted from 39 and 20 species of angiosperms collected in the Yaeyama Islands and Honshu, respectively. As a result, none of them reacted by showing a difference in Cq value within 10, the set criterion for the verification of species specificity in this study. The DLPs and PCR primers for seagrasses are listed in Table 2 and Table 3, and the results of calibration curves are given in Table 6. Regardless of the type of DNA polymerase, the amplification efficiency, slope, and coefficient of determination of these DLPs and PCR primers were within the range of the criteria set in this study.

3.4. Detection of eDNA Derived from Phaeophyceae, Rhodophyta and Chlorophyta

Table 4 shows the DLPs and PCR primers for Phaeophyceae seaweed single species found in the coastal waters around Japan. Table 5 shows the DLPs and PCR primers for a major macroalgal species-complex that includes species of the subgenera Sargassum and Bactrophycus, Ulva, Ecklonia/Eisenia and Saccharina in Japan. The construction of most qPCR systems is often designed specifically for a single species. However, this design for a species-complex or genus is a new attempt. The DLPs and primers shown in Table 4 and Table 5 were difficult to design, owing to the presence of several closely related species and groups, such as the subgenus Sargassum, Ulva spp. and Saccharina spp. Therefore, to increase the species or group specificity, the DLPs and PCR primers were made longer and the Tm value was set higher than the recommended conditions for their design. The species specificity of the DLPs and PCR primers shown in Table 4 and Table 5 were verified using 59 and 68 species of seaweeds, respectively. As a result, none of them reacted by showing a difference in Cq value within 10—the criterion for the verification of species specificity set in this study. The results of the calibration curves are shown in Table 6; the amplification efficiency, slope, and coefficient of determination were likewise within the range of the criteria set in this study when DNA polymerase was selected according to each DLP and PCR primer.

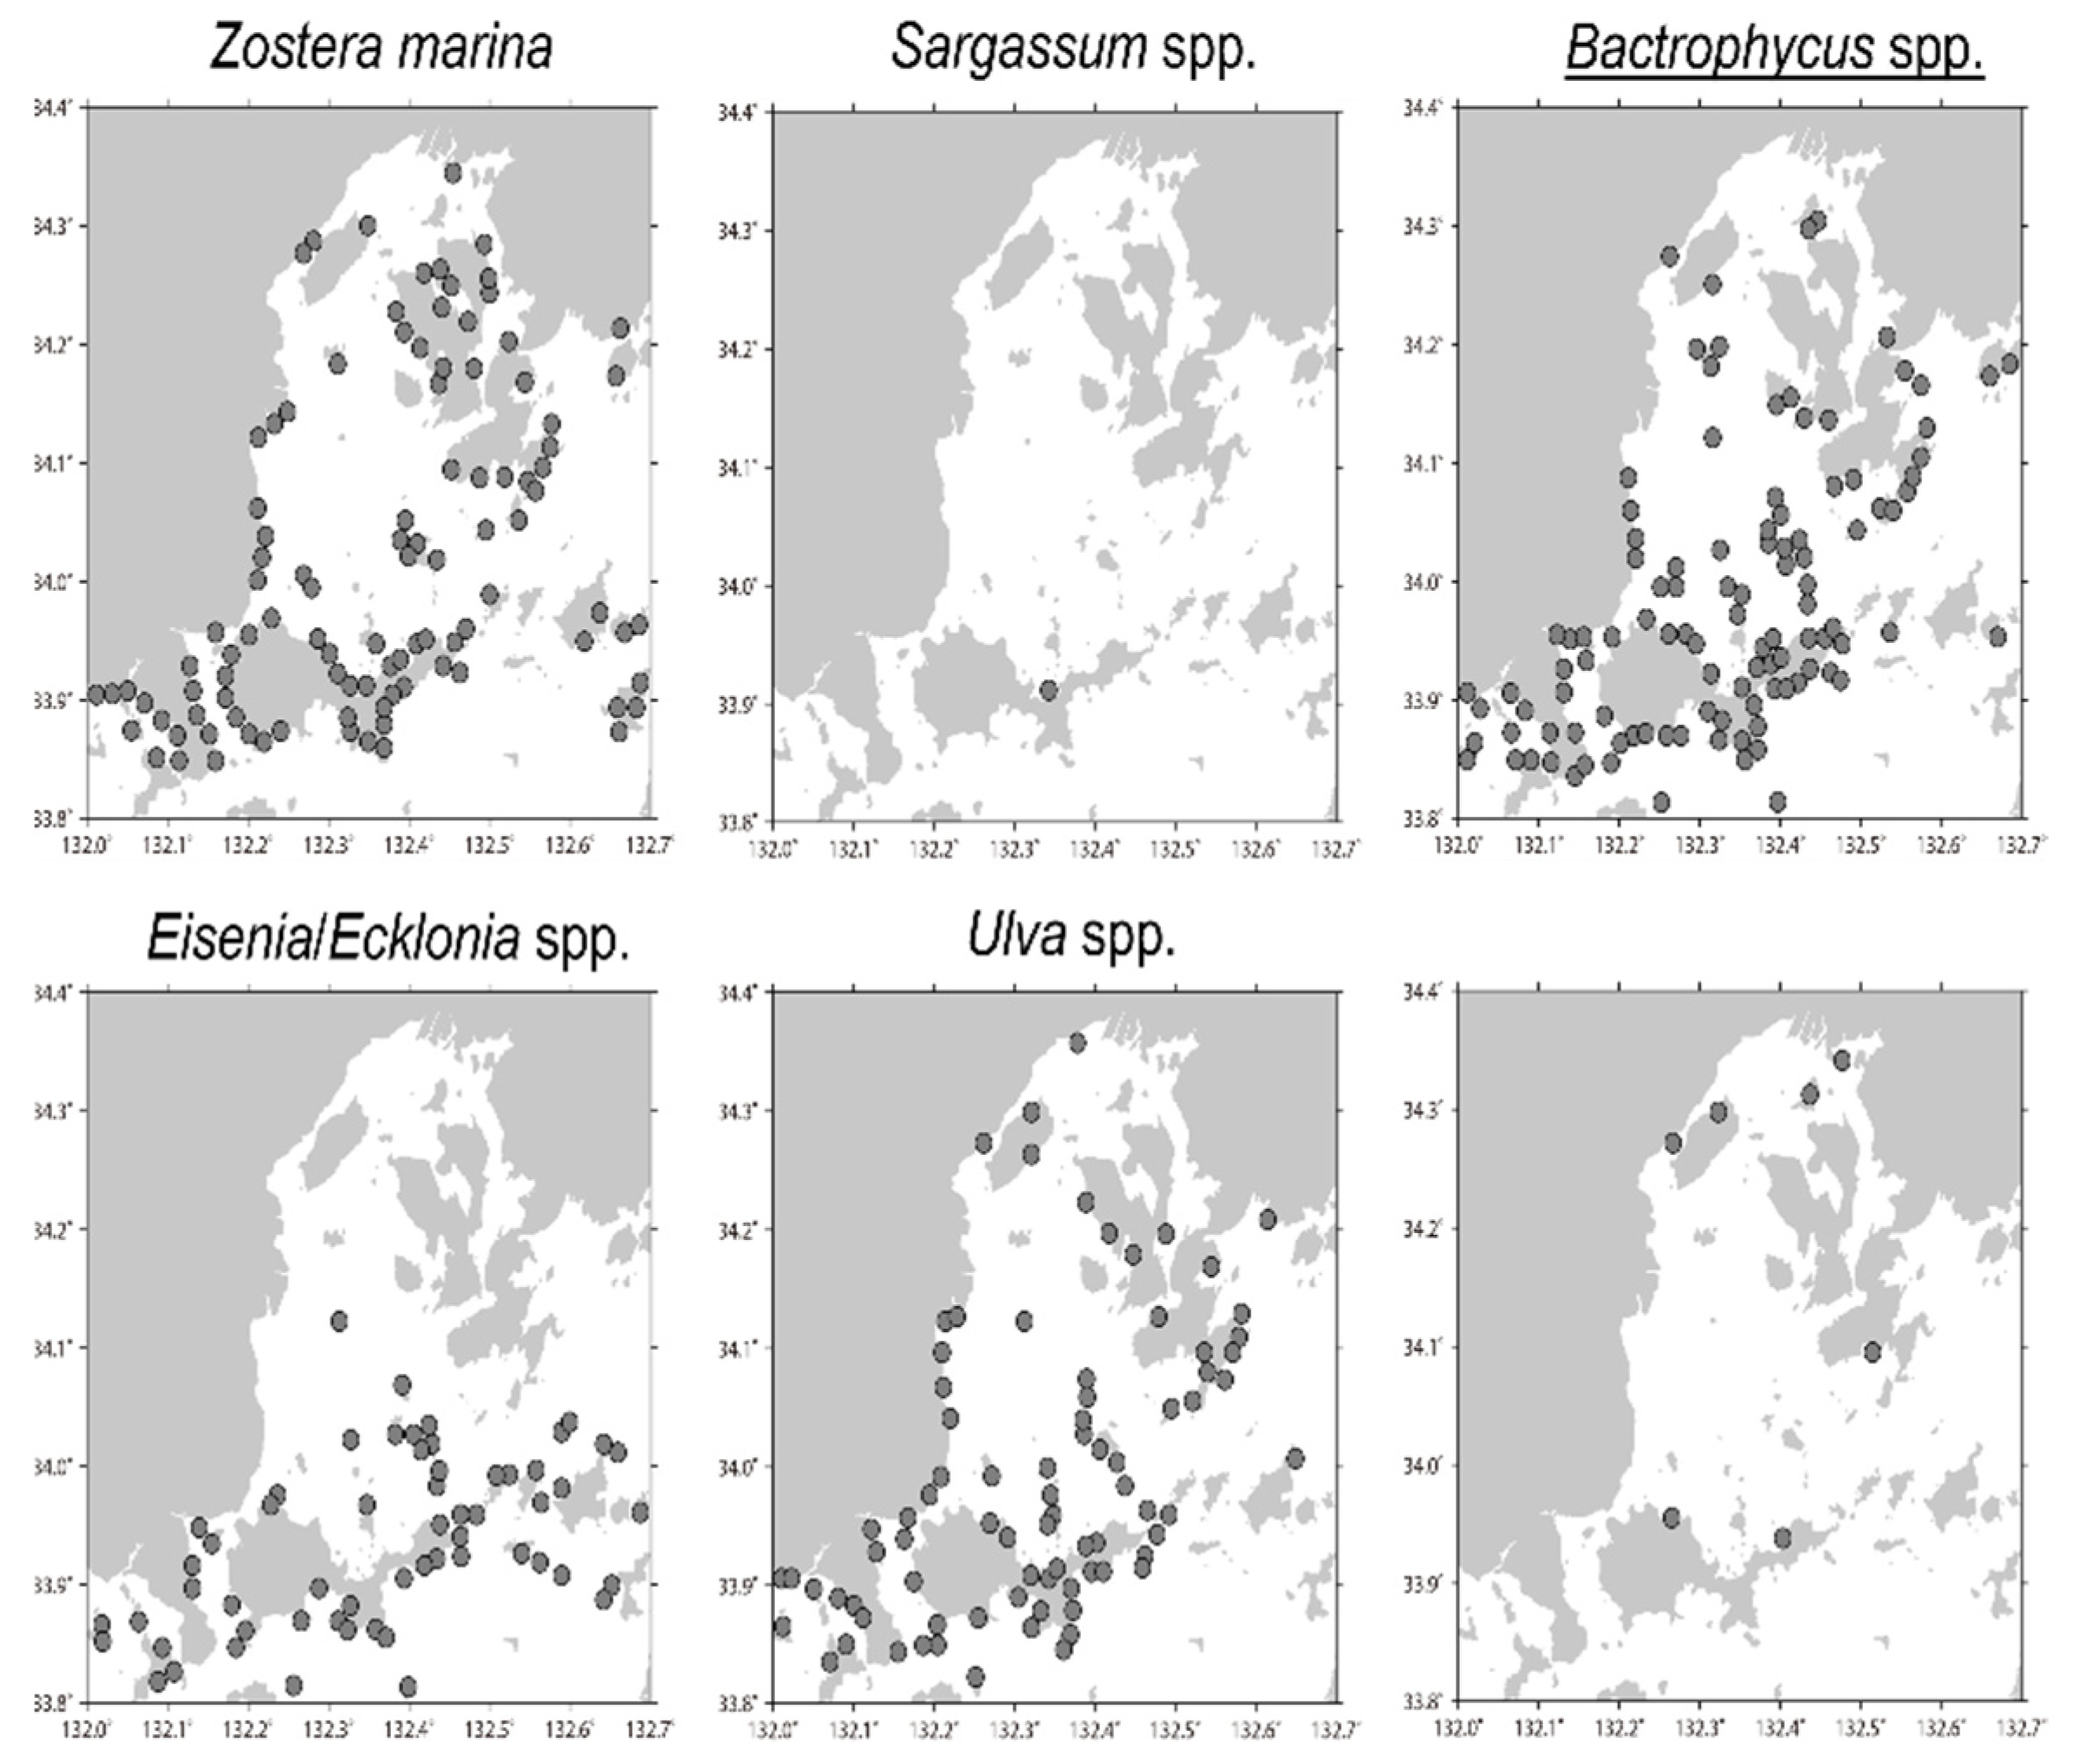
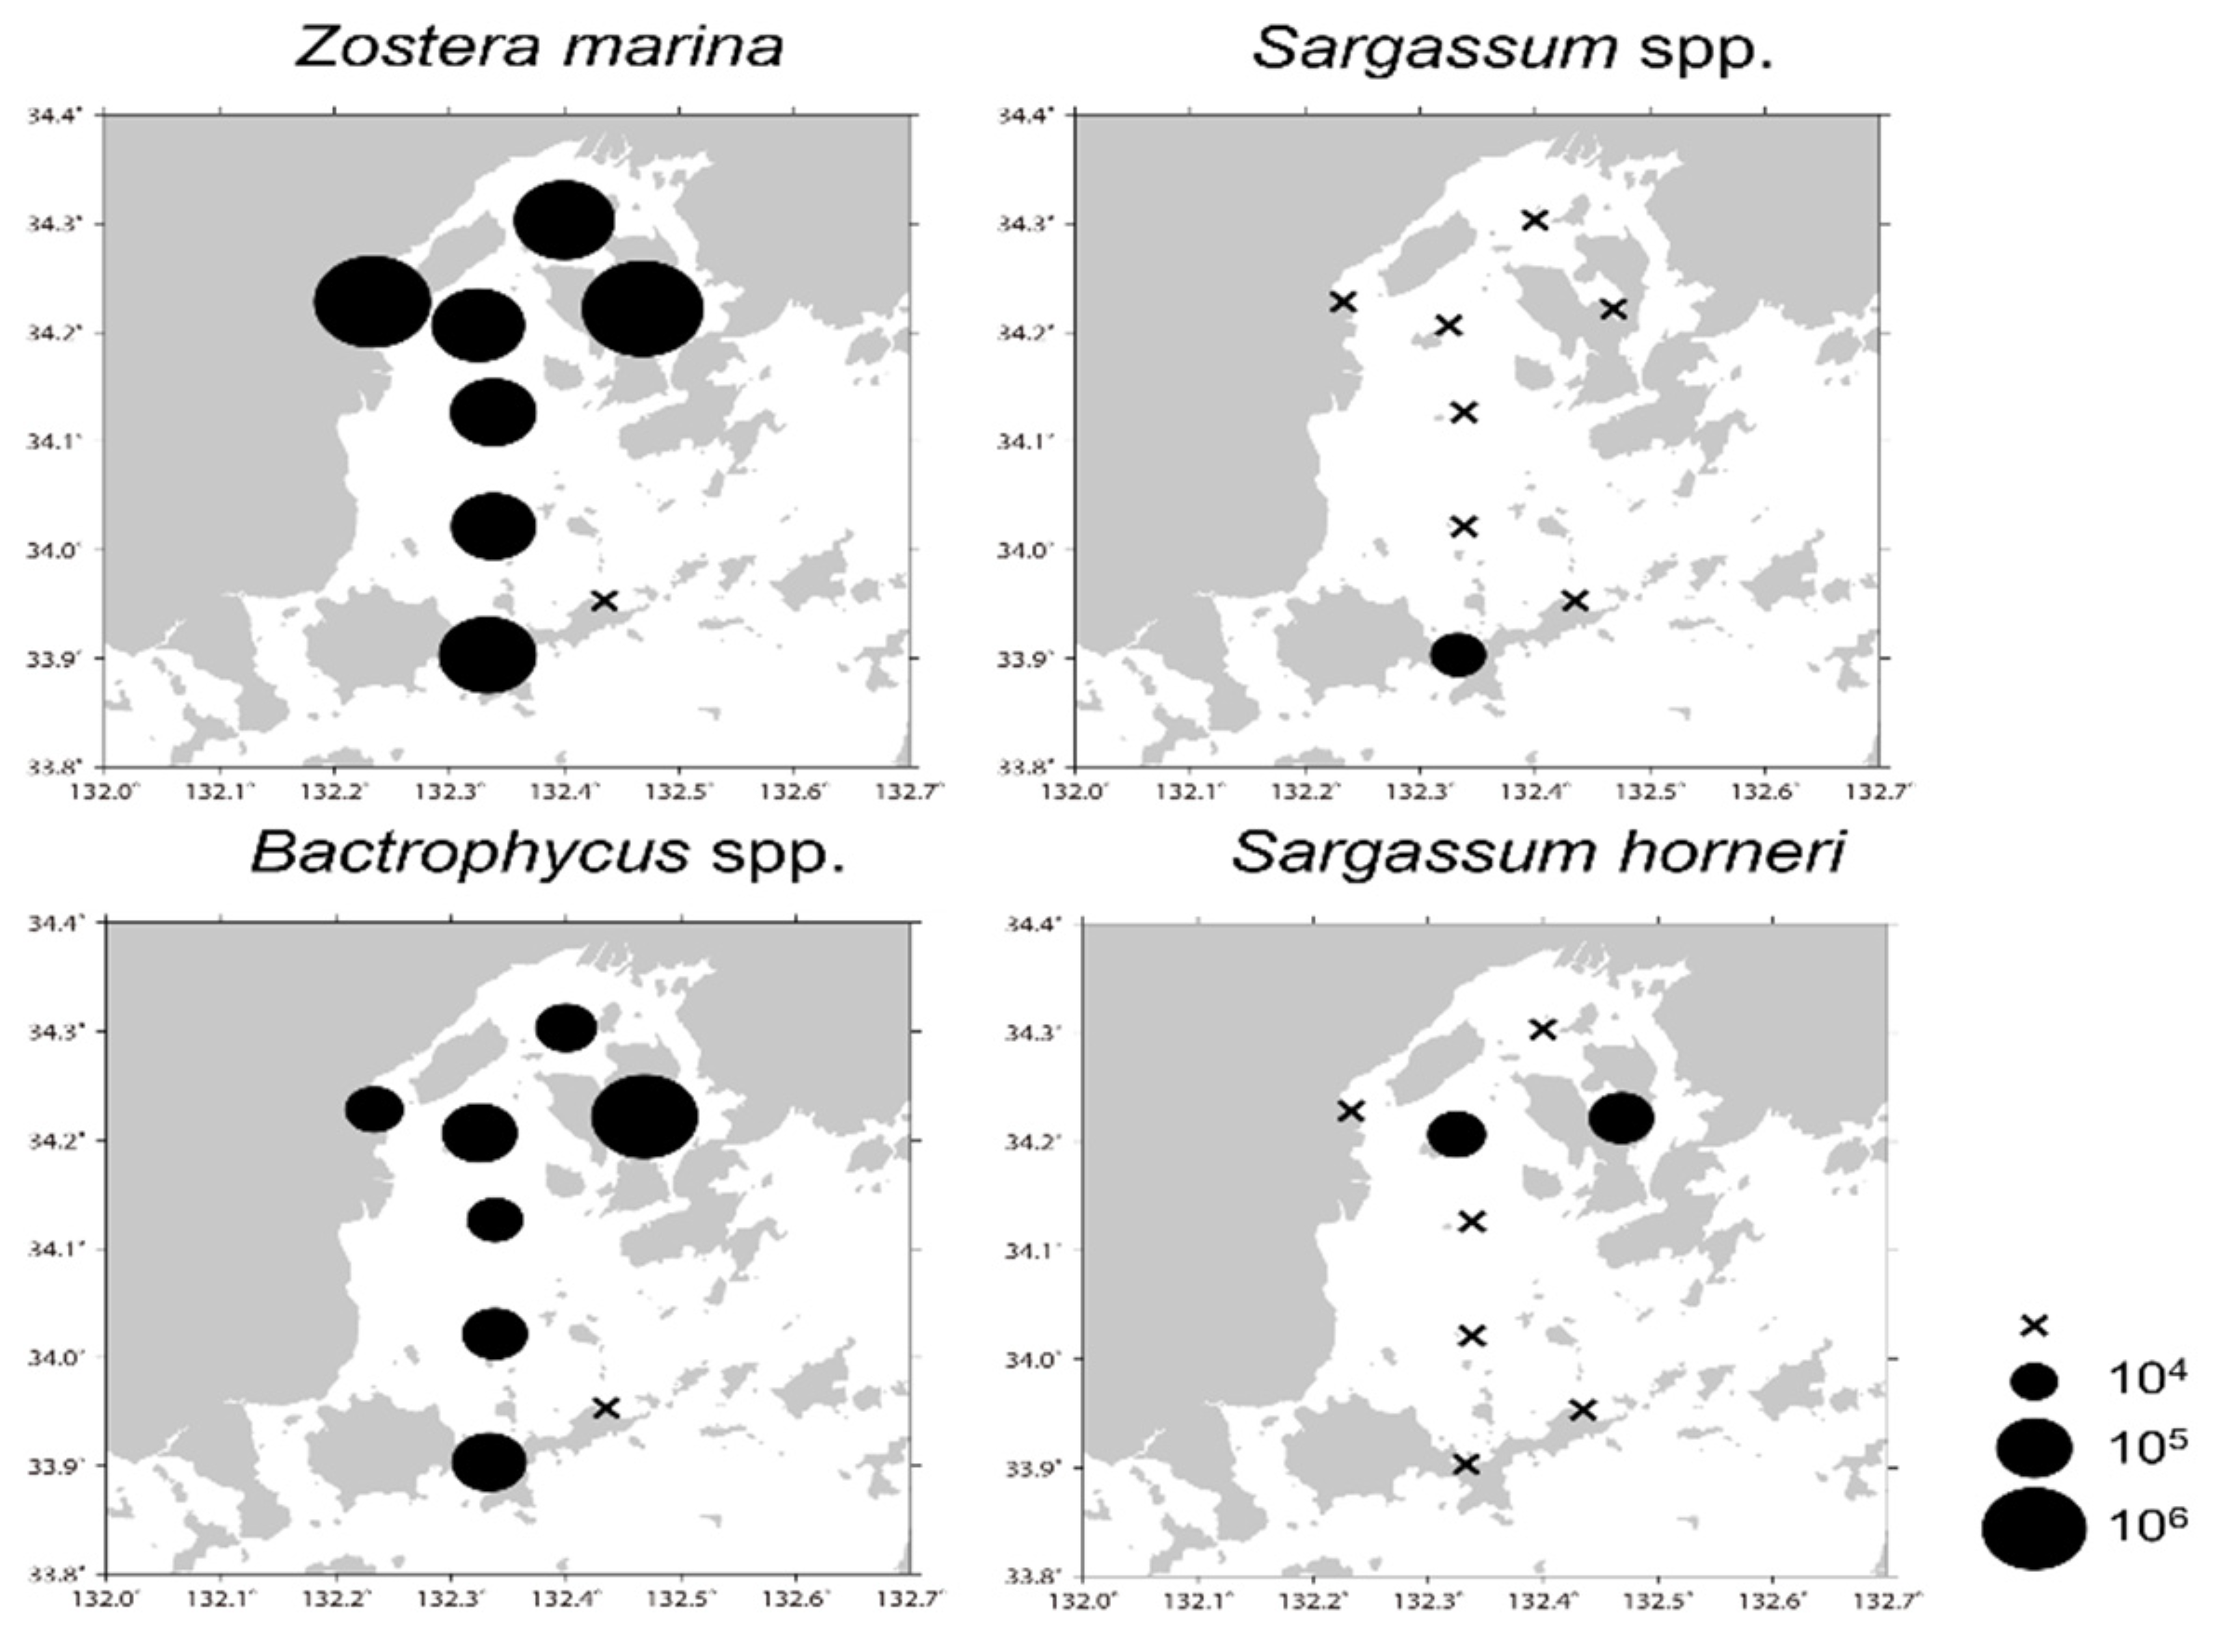
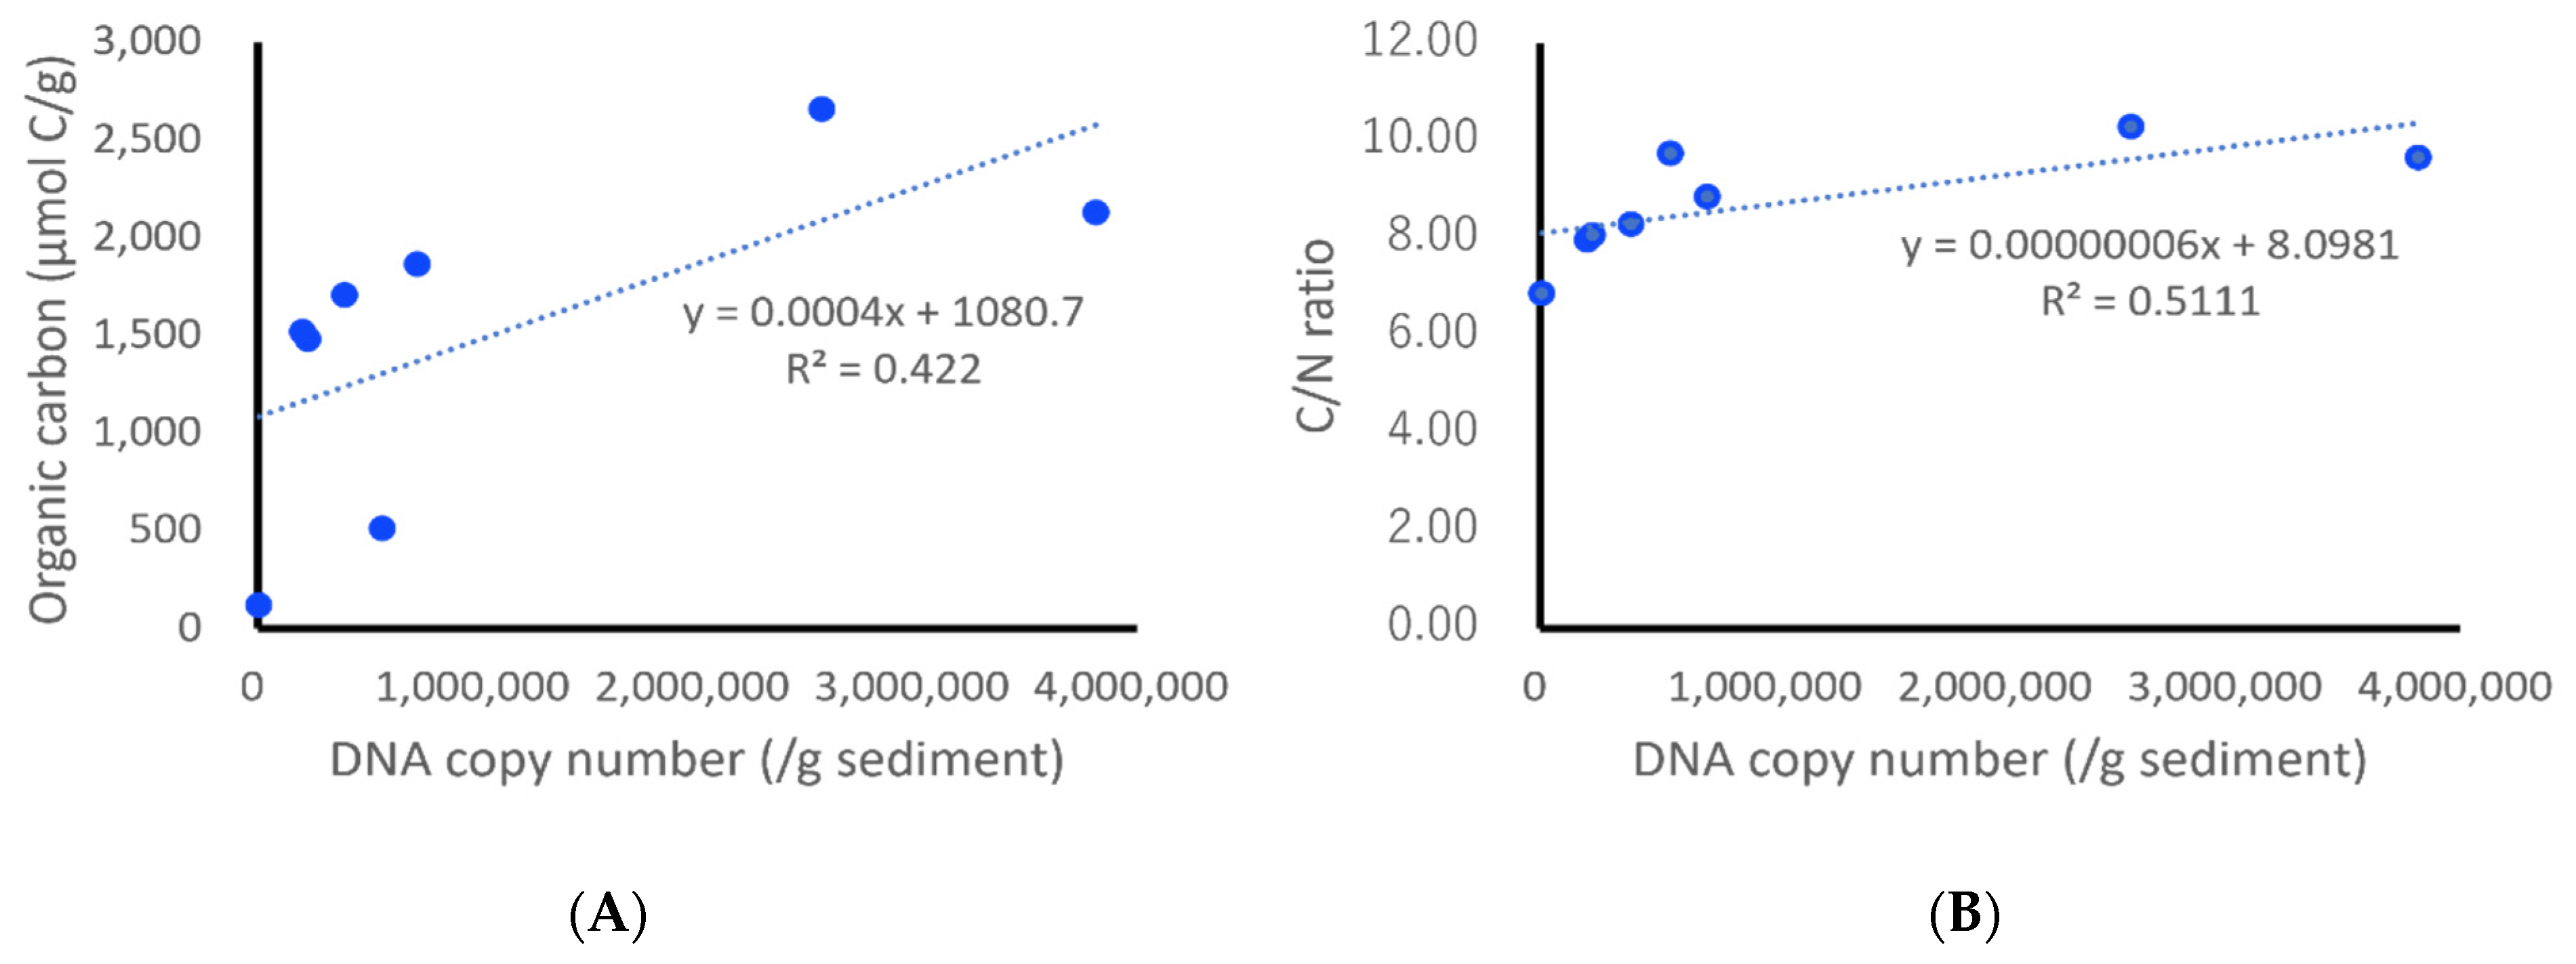
3.5. Application of the Designed qPCR System to Field Samples

The effect of PCR inhibitors or the matrix effect [42] was not detected in the DNA extracted from the sediment samples from Hiroshima Bay.
Environmental DNA from Z. marina and subgenus Bactrophycus spp. was detected in high concentrations in the sediments of almost all survey sites; in contrast, the subgenus Sargassum spp. was found off the northern shore of Yashirojima Island, and its eDNA was only detected close to this habitat (Figure 3).
Measurements of the physical and chemical properties of the sediment from Hiroshima Bay are presented in Table 7. The correlation between these properties and the number of DNA copies detected in Z. marina and the subgenus Bactrophycus spp., which had the highest number of eDNA detections, was examined. The DNA copy number of the subgenus Bactrophycus spp. Did not correlate with the measured properties of the sediment, whereas the DNA copy number of Z. marina correlated with organic carbon content (Pearson two-sided test: r = 0.650, not significant) and C/N ratio (Pearson two-sided test: r = 0.715, p < 0.05) in the sediment samples (Figure 4). The data shown in Table 7 were used to calculate the origin of organic carbon in the bottom sediments, following the method of Miyajima et al. [44], using a 4-source model and a 3-source model. The results of the correlation analysis with the 3-source model, which is considered highly reliable, using the eDNA of eelgrass are shown in Figure 5. There was a low correlation between the amount of organic carbon derived from Z. marina, as calculated by the 3-source model (Table 8), and the detection results of eDNA (Pearson two-sided test: r = 0.463, not significant). From the quantification results of the eDNA of the four species or species groups shown in Figure 3, the detection and quantification limits were calculated using the calculation method described here. The values of LOD and LOQ, respectively, were: 2.2 DNA copies/μL and 14.8 DNA copies/μL for subgenus Sargassum spp.; 2.5 DNA copies/μL and 16.2 DNA copies/μL for subgenus Bactrophycus spp.; 2.4 DNA copies/μL and 19.4 DNA copies/μL for Sargassum horneri; and 2.0 DNA copies/μL and 10.5 DNA copies/μL for Z. marina. In this study, the amount of eDNA in the sediments of Hiroshima Bay was calculated based on the results of this calculation, and the data above the limit of quantification was used.

4. Discussion

4.1. Recommended Reaction System

4.1.1. Points to Note in the Design of Detection Systems for qPCR

The DLPs and PCR primers designed in this study (Table 1, Table 2, Table 3, Table 4 and Table 5) can be used in combination with duplex or multiplex if the reaction temperature is the same and if the fluorescent dyes that are labeled are different. The recommended reaction system is to correct the reactivity between wells by ROX, use duplex PCR for the detection of seaweeds, and use internal standards if necessary. We used the DLPs and PCR primers shown in Table 5 in combination with the fluorescent dyes, FAM and HEX, respectively, at the same reaction temperature; the following duplex combinations were used to analyze the marine sediment samples from Hiroshima Bay: subgenera Sargassum and Bactrophycus species; Ulva spp. and Neopyropia spp.; and Ecklonia/Eisenia spp. and Saccharina spp. These combinations allow for up to three DLPs and PCR primers. However, because these were designed within the short ITS region, non-specific reactions may occur depending on the combination, so careful consideration should be given to the choice of combination. When performing duplex or multiplex qPCR, it is desirable to consider the DLP and PCR primer to be used from the earliest design stage. In addition to conventional software, such as Primer 3 [47], there are also design services provided by pharmaceutical companies [48] that can be used for designing DLPs and PCR primers. Therefore, it is necessary to carefully consider which ones to combine.

4.1.2. Which DNA Polymerase and Real-Time PCR Instruments to Use?

Hamaguchi et al. [27] compared two types of DNA polymerases and explained the reaction results of each qPCR; even so, the quantitative nature of qPCR differs depending on the DNA polymerase used. Therefore, we believe that the same DNA polymerase should be used for setting the reaction conditions (e.g., reaction temperature), confirming the species specificity, preparing the calibration curve, and conducting quantitative analysis of field samples. In this study, we used two different types of SsoFast Probes Supermix with ROX and iQ Multiplex Powermix, manufactured by Bio-Rad, according to the method used by Hamaguchi et al. [27]. As depicted in Table 6, for some DLPs and PCR primers (Rhizophora mucronate, Bruguiera gymnorrhiza, Saccharina japonica and Undaria pinnatifida), only iQ Multiplex Powermix met the quantitative criteria established in this study.
In addition, depending on the real-time PCR system used, only two fluorescent dyes may be detected. However, because hydrolysis probes can detect multiple target genes simultaneously, it is desirable to use an instrument that can detect multiple fluorescent dyes at the same time to fully utilize their characteristics.

4.2. Detection of eDNA Derived from Mangroves

At least six species of mangroves are found in Japan: Bruguiera gymnorhiza, Kandelia obovata, Rhizophora stylosa, Avicennia marina, Lumnitzera racemosa, and Sonneratia alba, although the mangrove palm Nypa fruticans is sometimes listed as a seventh species [49]. Lo et al. [50] reported that Rhizophora apiculata was also present. The species with the highest biomass on the islands of Ishigaki and Iriomote were B. gymnorhiza and R. stylosa; A. marina, L. racemose, and S. alba were found in small amounts in limited areas. Mangroves have a strong carbon dioxide sequestration effect and are an important taxon among blue carbons [51]. Miyajima et al. [52] used the qPCR system designed in this study to examine the sea sediments around the islands of Ishigaki and Iriomote, a location in Japan where mangroves thrive; mangrove-derived eDNA was detected in both offshore and deep-sea sediments. These results suggest that mangroves may act as a source of blue carbon by storing carbon dioxide in the system and transporting and accumulating its leaves, bark, and branches. Hence, mangroves not only store carbon in their vegetation but also accumulate it by transporting it to leaves and trees in other places and may function as a blue carbon. This finding was also suggested by Ortega et al. [19], and the present results confirm it.

4.3. Detection of eDNA Derived from Seagrasses

The qPCR system for subtropical seagrasses designed in this study has been used by Miyajima et al. [52] to analyze the environmental DNA of seafloor sediments off the islands of Ishigaki and Iriomote where these seagrasses grow. As a result, the eDNA of Enhalus acoroides and Cymodocea rotundata was detected even from sediments that were more than 1000 m deep, yet the eDNA of the sympatric Thalassia hemprichii was not detected. This may be because the degradation process differs among these three species, with T. hemprichii being the most easily degraded. However, green turtles feed on seagrasses (mainly E. acoroides and C. rotundata [53]), and the population of this species on the islands of Ishigaki and Iriomote has been increasing in recent years [54]; hence, the turtles are possibly implicated in the irregular dispersal of eDNA in this area.
Conversely, Z. marina, which is widely distributed from the temperate to the subarctic region of Japan, is closely related to Z. caulescens and is difficult to identify by the rbcL and matK regions of plastid DNA [55]. Therefore, the PCR primers and DLPs for the matK region were not designed for these species in this study. Furthermore, those used by Hamaguchi et al. [27] could not be employed to discriminate between Z. marina and Z. caulescens, as that study was conducted in the Seto Inland Sea, where Z. caulescens does not occur. In this study, the PCR primers and DLPs for Z. marina were redesigned based on the ITS region so that they would not react with Z. caulescens, which, likewise, grows in the study area.

4.4. Detection of eDNA Derived from Phaeophyceae, Rhodophyta and Chlorophyta

The qPCR system is usually designed for the accurate identification of a specific species. For mangroves and subtropical seagrasses and seagrasses and seaweeds in southwestern Japan, we constructed a species-specific qPCR system. However, numerous species of seaweeds grow in Japanese waters, and we expected that it would be difficult to follow the dynamics of their degradation products for each individual species by qPCR. Therefore, we designed DLPs and PCR primers to group species together that are taxonomically close and have similar ecological characteristics, and so examine them all together.
For example, the genus Sargassum has been divided into four clades, based on the sequence of the ITS region of nuclear DNA, as reported by Stiger et al. [34]. Among them, the species most widely distributed in the temperate zone in Japan are classified in the subgenus Bactrophycus, and the species distributed in the subtropical zone in the southern part of the temperate zone are classified in the subgenus Sargassum. In this study, we designed DLPs and PCR primers that could discriminate between these two subgenera, based on the difference in the ITS gene; accordingly, by using these, we were able to clearly identify eDNA in the sediments of Hiroshima Bay for the genus Sargassum. In the results of the analysis, we inferred how the algal bodies of the subgenus Sargassum (which have a limited distribution) are dispersed and deposited on the spatial scale of Hiroshima Bay after the plants are detached from the substrate.
Large kelp species that inhabit the seas off northern Japan have been used for food since ancient times and are traded at high prices as a foodstuff, supporting Japanese food culture. Because the price of kelp varies depending on where it is harvested, it is subdivided according to morphological information and is then given a scientific name. As a result of recent classifications based on genetic information, the number of cases that do not match the conventional classification is increasing, and the scientific names are frequently changed [56], causing taxonomic confusion. However, recent advances in chloroplast DNA and the total genome analysis of kelp species have led to genetically informed taxonomic studies [57,58]. Moreover, the temperate kelp species of Ecklonia and Eisenia are grown along the west coast of Japan, but their classification is changing as new species are being proposed, based on genetic information [59,60].
We used the available genetic information and designed DLPs and PCR primers for the species complex of Saccharina, Ecklonia and Eisenia, which are the most abundant genera of kelp in Japan.
The genera Ulva (green algae) and Neopyropia (red algae) are also confusingly classified, respectively [61,62,63,64,65,66]. Therefore, we constructed a qPCR system, with Ulva pertusa and Neopyropia yezoensis as the main species complex.
Moreover, in Japan, seaweed is widely cultivated for food; therefore, in designing the qPCR system, the farmed species were also considered. According to statistical information from the wild and cultured seaweed industry, the wild harvest of seaweeds in Japan in 2020 was 63,500 metric tons, of which kelp was the largest component, at more than 70% of the total harvest. In contrast, seaweed cultivation in 2020 produced 396,800 metric tons, of which the largest amount was N. yezoensis, followed by Undaria pinnatifida and Saccharina spp.; together, these three species accounted for 93.8% of the total amount farmed. Therefore, these wild-harvested and cultured species should be evaluated as another blue carbon resource; accordingly, we considered these species in the qPCR system. Kelp, in particular, has attracted attention for the blue-carbon function of the seaweed itself and for the blue-carbon function of kelp-derived dissolved organic carbon that is released during the growth process [67].
The DLPs and PCR primers for qPCR that are introduced here will be improved in the future, through implementation and verification of the results. In addition, it will be necessary to set a detection limit for the sake of quantitative improvements of the method.

4.5. Application of the Designed qPCR System to Field Samples

Analysis of the eDNA of seaweeds and seagrasses in the sediments of Hiroshima Bay revealed that Zostera marina and the subgenus Bactrophycus spp. were distributed throughout the bay (Figure 2) and were detected as eDNA in the sediments at most survey sites (Figure 3). Ulva spp. were widely distributed in Hiroshima Bay, especially in the tidal flats in the northern part of the bay, where they sometimes occur in large amounts and have large biomass [68]; even so, the eDNA of Ulva spp. could not be detected at all the study sites with >95% confidence, so the concentrations could not be calculated. One reason for this may be that Ulva pertusa, which is thought to be the largest component of Ulva spp., is easily degraded in seawater and does not remain as a persistent material in marine sediments. The application of the system is also meant to reveal which macrophytes have high blue carbon storage potential, and which ones do not. The results of this study indicate that when evaluating the blue carbon effect of the seaweeds found in Hiroshima Bay, we should focus on Z. marina and the subgenus Bactrophycus spp., and not necessarily on Sargassum horneri and the genus Ulva spp.
The seagrass Z. marina is known to be effective in accumulating and depositing allochthonous organic matter, in addition to its own vegetation. Unlike other seaweeds, seagrasses also contain cellulose and other components that are not easily degraded; therefore, their decomposition is slower and remains in the sediment for longer [13,45,69,70]. It is believed that there was a vast Z. marina bed in Hiroshima Bay until circa 1500 CE; however, the seagrass beds have clearly decreased because of land reclamation and coastal development. The environmental DNA of Z. marina, detected in the sediments of Hiroshima Bay in this study, may have originated from past eelgrass beds and should be examined in detail.
In contrast, S. horneri is thought to comprise the majority of the subgenus Bactrophycus spp. in the Seto Inland Sea, where it is the seaweed species with the largest biomass [71]. Though it is an annual species, its annual production is predictably enormous, owing to high biomass. However, the detection rate of environmental DNA from this species in the sediments of Hiroshima Bay was low in this study. The reason for this may be that this species is highly buoyant, and, after withering and dying, it does not decompose in Hiroshima Bay but instead moves to other locations as drift algae. The species is also known as drifting seaweed, with deposits found on the deep-sea bottom near Japan [72]. On the other hand, Sargassum macrocarpum, S. thunbergii, and S. muticum belonged to the subgenus Bactrophycus spp. growing in Hiroshima Bay [73]. The present results suggest that these species may be decomposing in the Bay after the algal bodies have detached from the substrate, rather than being transported as drift algae to other areas, as is the case with S. horneri. This is also indicated by the results of the present study for the subgenus Sargassum spp. Therefore, although there is an impression that the genus Sargassum moves as drift algae, it is possible that more species are decomposed in situ after the algal bodies detach from the substrate. Therefore, the genus Sargassum may be related to the sequestration of organic carbon as blue carbons, in scales such as inland seas and bays in the extreme coastal regions, and the fate of individual species after the algal bodies have detached from the substrate should be investigated in detail in the future. The “Blue Carbon” report [1] states that the sedimentation of large brown algae has not been assessed, and, therefore, their blue carbon effect is unknown; our observations suggest that the contribution of brown algae, such as the subgenus Bactrophycus spp. and kelp Saccharina spp., to blue carbon should indeed be considered. Furthermore, the calculated values of blue carbon in the seas around Japan may be underestimated, as the assessment by Bertram et al. [4], for example, does not include these seaweeds. In the future, the contribution of large brown algae, such as the subgenus Bactrophycus spp. and kelps Saccharina spp., to the blue carbon assessment around Japan merits detailed investigation. In addition, the sediments of Hiroshima Bay were surveyed only once in our study, yet Wei et al. [74] reported seasonal variations in fish-derived eDNA in the sediments of Tokyo Bay, which is a similar estuary to Hiroshima Bay. If annual surveys were conducted in Hiroshima Bay, it is possible that the results would differ from the present results.
Environmental DNA is frequently used to search for rare and endangered species [12,14,16,75,76,77]. In Hiroshima Bay, Sargassum carpophyllum, S. patens and S. piluliferum are known to occur in limited areas. Many subtropical species are included in the genus Sargassum; if the water temperatures in the seas around Japan rise due to global warming, rare or newly invasive species from tropical areas might be found. For instance, Hamaguchi et al. [78,79] reported invasive subtropical oyster species in the seas around Japan. Therefore, it is expected that the locations where seaweeds thrive will likewise change due to rising water temperatures, and eDNA technology could also be effective in studying changes in the distribution of seaweeds.
Investigations of the dynamics of decomposing macrophytes using eDNA technology are considered useful, barring one major problem. To assess blue carbon storage or blue carbon stock, it is necessary to have a high correlation between organic carbon and eDNA. In a previous research example, the correlation between organic carbon and eDNA was high for the long-term, stable Z. marina beds in the Seto Inland Sea [27], but the correlation was low in almost all the other areas considered. The incompatibility between eDNA and organic carbon has been reported by Reef et al. [18] and Queirós et al. [7]; therefore, we considered this the biggest impediment to using eDNA for blue carbon assessment. To solve this problem, the introduction of methods other than eDNA, which is thought to have a high correlation with organic carbon content, is being considered (as summarized by Reich et al. [80] and Geraldi et al. [81]).
At present, we consider that the most appropriate way to identify blue carbon storage or blue carbon stock is to use a combination of comprehensive analysis using NGS and species-specific qPCR, considering the aforementioned advantages and disadvantages of these methods. Above all, qualitative and quantitative analyses of metabarcoding through NGS, using internal standards, have recently been reported [21], and we expect that more blue carbon storage or blue carbon stock will be successful, using metabarcoding through NGS for quantitative analysis. However, using this method to identify macrophyte species that contribute to the blue carbon release may be inappropriate because primers targeting the V7 and V9 regions of 18S rRNA also contain information derived from other organisms. Therefore, we are planning to design special primers, such as that for MiFish [82], to study macrophytes more efficiently.

4.6. Future Research Focus and Concepts

To detect the eDNA from marine macrophytes, one major question is what genetic regions to use. Hamaguchi et al. [27] designed DLPs and PCR primers in the ITS region of eelgrass nuclear DNA and the matK region of chloroplast DNA, to compare the two regions. First, they reported that the detection of these two regions differed, depending on the site of the eelgrass and also the extinction in marine sediments. Hamaguchi et al. [27] also used amplicons of 90 bp and 102 bp for the ITS and matK regions, respectively, which are different in length. Peixoto et al. [17] pointed out that different amplicon sizes may cause differences in the degradation process. Therefore, the amplicon size should be the same when making comparisons, whether this is because of the length of both PCR products or because the number of copies of each DNA in the cell or the location of each DNA must be clarified through studies using experimental degradation of eelgrass. In this study, we designed DLPs and PCR primers for the ITS region of nuclear DNA and the matK region or psbA region [83] of chloroplast DNA in mangroves and subtropical seagrasses, as well as in Z. marina, and used them to analyze eDNA in marine sediments around the islands of Ishigaki and Iriomote. However, when we analyzed the eDNA of seafloor sediments around the islands using these primers, the detection results of both primers did not coincide with each other but instead diverged significantly. This result warrants discussion in a future study; therefore, only the results of the ITS region of nuclear DNA were presented in this article.
Though it was otherwise not discussed here, to examine the correlation between eDNA from the marine macrophytes from which it was derived, we thought that a gene region with a small number of copies or a single copy would be easier to convert than a region with many copies, such as the ITS region. We thought that it would be easier to convert the ITS region into a single-copy gene region. Fortunately, single-copy genes have been reported in angiosperms [84,85,86], and we designed our DLPs and PCR primers using a part of the cellulose synthase genes [84] that are assumed to be single-copy genes in mangroves and seagrasses. We also designed DLPs and PCR primers using some regions of cellulose synthase that are assumed to be single-copy in mangroves and seagrasses. Using this method, we analyzed the angiosperms collected at Ishigaki and Iriomote, and marine sediment samples from around the two islands, and found low species specificity and low detectability in the marine sediments. These results suggest that single-copy gene regions may be unsuitable for the detection of eDNA. Thus, we believe that further investigation is needed to determine which gene region should best be used for the detection system of eDNA as a way to verify the fate of macrophytes after they wither and die in the marine environment. We expect that various problems will be encountered when using the DLPs and primers proposed here to analyze field samples, but that improvements will be achieved despite such setbacks.
Japanese people have long used seagrasses and seaweeds for food [87], fuel [88], and fertilizer [89], and some seaweeds, such as kelp, are essential ingredients in Japanese cuisine [56]. For this reason, seaweed cultivation is carried out in many parts of Japan [90], and it is necessary to discuss the evaluation of such seaweed cultivation when assessing carbon dioxide sinks [91,92]. The cultivation of seaweeds has been increasing worldwide in recent years, for food, as a raw material for biochemicals, and for the production of bioethanol [92]. Nobutoki et al. [93] have suggested that the seaweeds utilized as energy, food, and biomass should be named “blue resources”; attempts are being made to add them to the list of blue carbon for their carbon sequestration effects. Moreover, the habitats of mangrove forests, salt marshes, seagrass beds, and tidal flats have been continuously lost because of coastal development, despite their important ecological functions in terms of biodiversity and material cycles [94]. Therefore, we have been conducting research to support the conservation of these ecosystems, and we believe that the concept of blue carbon is beneficial for promoting this [95].

5. Conclusions

This article introduces our qPCR technology for the analysis of eDNA to identify various marine macrophytes found in Japanese waters and presents the results of a field survey in Hiroshima Bay using the method.
The present results demonstrate that it was possible to identify the species of seaweeds that constitute blue carbon in coastal sediment. It was also found that the degradation process in the marine environment differs depending on the type of macrophyte. As described above, qPCR technology is useful for the evaluation of blue carbon in different ecosystems; future research should strive to combine the advantages of comprehensive analysis using NGS and this method of analysis, with high species specificity, using qPCR.

Author Contributions

M.H. (Masami Hamaguchi) carried out the molecular analysis on all the specimens and drafted the manuscript. T.M. carried out the pre-treatment of marine sediment samples collected from Hiroshima Bay, biochemical analysis of the marine sediment samples and drafted the manuscript. H.S. and M.H (Masakazu Hori) carried out the species identification of collected various macrophytes in this study, data analysis and drafted the manuscript. All authors collected specimens at various collection sites in Japan. All authors have read and agreed to the published version of the manuscript.

Funding

This study was supported financially by JSPS KAKENHI Grant-in-Aid for Scientific Research No. 18H03354 and project JPJ008722 commissioned by the Ministry of Agriculture, Forestry and Fisheries of Japan.

Institutional Review Board Statement

Not applicable.

Informed Consent Statement

Not applicable.

Data Availability Statement

The datasets used in this study are all publicly available via the internet.

Acknowledgments

We would like to express our gratitude to the crew of the research vessel Shirafuji-Maru for their great help during the survey in Hiroshima Bay. We also thank Go Onitsuka for his help in data processing and creating a diagram.

Conflicts of Interest

The authors declare no conflict of interest.

References

  1. Nellemann, C.; Corcoran, E.; Duarte, C.M.; Valdés, L.; De Young, C.; Fonseca, L.; Grimsditch, G. (Eds.) Blue Carbon: The Role of Healthy Oceans in Binding Carbon. A Rapid Response Assessment; United Nations Environment Programme: Nairobi, Kenya, 2009. [Google Scholar]
  2. Hori, M.; Kuwae, T. Blue Carbon -CO2 Uptake and Carbon Storage in Shallow Coastal Ecocystems and Their Utilization; Chijin-Kan: Tokyo, Japan, 2017; pp. 1–254. (In Japanese) [Google Scholar]
  3. Hori, M.; Bayne, C.J.; Kuwae, T. Blue carbon: Characteristics of the Ocean’s sequestration and storage ability of carbon Dioxide. In Blue Carbon in Shallow Coastal Ecosystems; Kuwae, T., Hori, M., Eds.; Springer: Singapore, 2018; pp. 1–32. [Google Scholar]
  4. Bertram, C.; Quaas, M.; Reusch, T.B.H.; Vafeidis, A.T.; Wolff, C.; Rickels, W. The blue carbon wealth of nations. Nat. Clim. Chang. 2021, 11, 704–709. [Google Scholar] [CrossRef]
  5. Krause-Jensen, D.; Lavery, P.; Serrano, O.; Marba, N.; Masque, P.; Duarte, C.M. Sequestration of macroalgal carbon: The elephant in the blue carbon room. Biol. Lett. 2018, 14, 20180236. [Google Scholar] [CrossRef] [PubMed] [Green Version]
  6. Liu, S.; Jiang, Z.; Wu, Y.; Deng, Y.; Chen, Q.; Zhao, C.; Cui, L.; Huang, X. Macroalgae bloom decay decreases the sediment organic carbon sequestration potential in tropical seagrass meadows of the South China Sea. Mar. Pollut. Bull. 2019, 138, 598–603. [Google Scholar] [CrossRef] [PubMed]
  7. Moura Queiros, A.; Stephens, N.; Widdicombe, S.; Tait, K.; McCoy, S.J.; Ingels, J.; Ruhi, S.; Airs, R.; Beesley, A.; Carnovale, G.; et al. Connected macroalgal-sediment systems: Blue carbon and food webs in the deep coastal ocean. Ecol. Monogr. 2019, 89, e01366. [Google Scholar]
  8. Bartolo, A.G.; Zammit, G.; Peters, A.F.; Küpper, F.C. The current state of DNA barcoding of macroalgae in the Mediterranean Sea: Presently lacking but urgently required. Bot. Mar. 2020, 63, 253–272. [Google Scholar] [CrossRef]
  9. Besterman, A.F.; McGlathery, K.J.; Reidenbach, M.A.; Wiberg, P.L.; Pace, M.L. Predicting benthic macroalgal abundance in shallow lagoons from geomorphology and hydrologic flow patterns. Limnol. Oceanogr. 2021, 66, 123–140. [Google Scholar] [CrossRef]
  10. Hilmi, N.; Chami, R.; Sutherland, M.D.; Hall-Spencer, J.M.; Lebleu, L.; Benitez, M.B.; Levin, L.A. The role of blue carbon in climate change mitigation and carbon stock conservation. Front. Clim. 2021, 3, 710546. [Google Scholar] [CrossRef]
  11. Rees, H.C.; Maddison, B.C.; Middleditch, J.; Patmore, J.R.M.; Gough, K.C. The detection of aquatic animal species using environmental DNA—A review of eDNA as a survey tool in ecology. J. Appl. Ecol. 2014, 51, 1450–1459. [Google Scholar] [CrossRef]
  12. Pedersen, M.W.; Overballe-Peterson, S.; Ermini, L.; Sarkissian, C.D.; Haile, J.; Hellstrom, M.; Spens, J.; Thomsen, P.F.; Bohmann, K.; Cappellini, E.; et al. Ancient and modern environmental DNA. Phil. Trans. R. Soc. B 2015, 370, 20130383. [Google Scholar] [CrossRef] [PubMed] [Green Version]
  13. Trevathan-Tackett, S.M.; Jeffries, T.C.; Macreadie, P.L.; Manojlovic, B.; Ralph, P. Long-term decomposition captures key steps in microbial breakdown of seagrass litter. Sci. Total Environ. 2020, 705, 135806. [Google Scholar] [CrossRef] [PubMed]
  14. Jeunen, G.-J.; Knapp, M.; Spencer, H.G.; Taylor, H.R.; Lamare, M.D.; Stat, M.; Bunce, M.; Gemmell, N.J. Species-level biodiversity assessment using marine environmental DNA metabarcoding requires protocol optimization and standardization. Ecol. Evol. 2019, 9, 1323–1335. [Google Scholar] [CrossRef] [PubMed] [Green Version]
  15. Murray, D.C.; Bunce, M.; Cannell, B.L.; Oliver, R.; Houston, J.; White, N.E.; Barrero, R.A.; Bellgard, M.I.; Haile, J. DNA-based faecal dietary analysis: A comparison of qPCR and high throughput sequencing approaches. PLoS ONE 2011, 10, e25776. [Google Scholar] [CrossRef] [PubMed] [Green Version]
  16. Harper, L.R.; Handley, L.L.; Hahn, C.; Boonham, N.; Rees, H.C.; Gough, K.C.; Lewis, E.; Adams, I.P.; Brotherton, P.; Phillips, S.; et al. Needle in a haystack? A comparison of eDNA metabarcoding and targeted qPCR for detection of the great crested newt (Triturus cristatus). Ecol. Evol. 2018, 8, 6330–6341. [Google Scholar] [CrossRef] [PubMed]
  17. Peixoto, S.; Chaves, C.; Velo-Anton, G.; Beja, P.; Egeter, B. Species detection from aquatic eDNA: Assessing the importance of capture methods. Environ. DNA 2021, 3, 435–448. [Google Scholar] [CrossRef]
  18. Reef, R.; Atwood, T.B.; Samper-Villarreal, J.; Adame, M.F.; Sampayo, E.M.; Lovelock, C.E. Using eDNA to determine the source of organic carbon in seagrass meadows. Limnol. Oceanogr. 2017, 62, 1254–1265. [Google Scholar] [CrossRef]
  19. Ortega, A.; Geraldi, N.R.; Duarte, C.M. Environmetal DNA identifies marine macrophyte contributions to blue cabon sediments. Limnol. Oceanogr. 2020, 9999, 1–11. [Google Scholar]
  20. Ortega, A.; Geraldi, N.R.; Diaz-Rua, R.; Orberg, S.B.; Wesselmann, M.; Krause-Jensen, D.; Duarte, C.M. A DNA mini-barcoding for marine macrophytes. Mol. Ecol. Resour. 2020, 20, 920–935. [Google Scholar] [CrossRef] [PubMed]
  21. Ushio, M.; Murakami, H.; Masuda, R.; Sado, T.; Miya, M.; Sakurai, S.; Yamanaka, H.; Minamoto, T.; Kondoh, M. Quantitative monitoring of multispecies fish environmental DNA using high-throughput sequencing. Metabarcoding Metagenom. 2018, 2, 1–15. [Google Scholar] [CrossRef]
  22. Sato, M.; Inoue, N.; Nambu, R.; Furuichi, N.; Imaizumi, T.; Ushio, M. Quantitative assessment of multiple fish species around artificial reefs combining environmental DNA metabarcoding and acoustic survey. Sci. Rep. 2021, 11, 19477. [Google Scholar] [CrossRef]
  23. Holland, P.M.; Abramson, R.D.; Watson, R.; Gelfand, D.H. Detection of specific polymerase chain reaction product by utilizing the 5′ –3′ exonuclease activity of Thermus aquaticus DNA polymerase. Proc. Natl. Acad. Sci. USA 1991, 88, 7276–7280. [Google Scholar] [CrossRef] [Green Version]
  24. Kevadiya, B.D.; Machhi, J.; Herskovitz, J.; Oleynikov, M.D.; Blomberg, W.R.; Bajwa, N.; Soni, D.; Das, S.; Hasan, M.; Patel, M.; et al. Diagnostics for SARS-CoV-2 infections. Nat. Mater. 2021, 20, 593–605. [Google Scholar] [CrossRef] [PubMed]
  25. Nagy, A.; Vitásková1, E.; Černíková1, L.; Křivda1, V.; Jiřincová, H.; Sedlák, K.; Horníčková, J.; Havlíčková, M. Evaluation of TaqMan qPCR system integrating two identically labelled hydrolysis probes in single assay. Sci. Rep. 2017, 7, 41392. [Google Scholar] [CrossRef] [PubMed]
  26. Nakayama, N.; Hamaguchi, M. Multiplex reverse transcription quantitative PCR detection of a single-stranded RNA virus HcRNAV infecting the bloom-forming dinoflagellate Heterocapsa circularisquama. Limnol. Oceanogr. Methods 2016, 14, 370–380. [Google Scholar] [CrossRef] [Green Version]
  27. Hamaguchi, M.; Shimabukuro, H.; Hori, M.; Yoshida, G.; Terada, T.; Miyajima, T. Quantitative real-time polymerase chain reaction (PCR) and droplet digital PCR duplex assays for detecting Zostera marina DNA in coastal sediments. Limnol. Oceanogr. Methods 2018, 16, 253–264. [Google Scholar] [CrossRef] [Green Version]
  28. Task Force on National Greenhouse Gas Inventories: Wetlands. Available online: https://www.ipcc-nggip.iges.or.jp/public/wetlands/index.html (accessed on 1 February 2022).
  29. Bustin, S.A.; Benes, V.; Garson, J.A.; Hellemans, J.; Huggett, J.; Kubista, M.; Mueller, R.; Nolan, T.; Pfaffi, M.W.; Shipley, G.L.; et al. The MIQE guidelines: Minimum information for publication of quantitative Real-time PCR experiments. Clin. Chem. 2009, 55, 611–622. [Google Scholar] [CrossRef] [PubMed] [Green Version]
  30. Raymaekers, M.; Smets, R.; Maes, B.; Cartuyvels, R. Chechlist for optimization and validation of real-time PCR assays. J. Clin. Lab. Anal. 2009, 23, 145–151. [Google Scholar] [CrossRef] [PubMed]
  31. Abliz, P.; Fukushima, K.; Takizawa, K.; Nieda, N.; Miyaji, M.; Nishimura, K. Rapid identification of the genus Fonsecaea by PCR with specific oligonucleotide primers. J. Clin. Microbiol. 2003, 41, 873–876. [Google Scholar] [CrossRef] [Green Version]
  32. Lucas, C.; Thangaradjou, T.; Papenbrock, J. Development of a DNA barcoding system for seagrasses: Successful but not simple. PLoS ONE 2012, 7, e29987. [Google Scholar] [CrossRef] [Green Version]
  33. Yu, J.; Xue, J.-H.; Zhou, S.-L. New universal matK primers for DNA barcoding angiosperms. J. Syst. Evol. 2011, 49, 176–181. [Google Scholar] [CrossRef]
  34. Stiger, V.; Horiguchi, T.; Yoshida, T.; Coleman, A.W.; Matsuda, M. Phylogenetic relationships within the genus Sargassum (Fucales, Phaeophyceae), inferred from ITS-2 nrDNA, with an emphasis on the taxonomic subdivision of the genus. Phycol. Res. 2003, 51, 1–10. [Google Scholar] [CrossRef]
  35. Yotsukura, N.; Shimizu, T.; Katayama, T.; Druehl, L.D. Mitochondrial DNA sequence variation of four Saccharina species (Laminariales, Phaeophyceae) growing in Japan. J. Appl. Phycol. 2010, 22, 243–251. [Google Scholar] [CrossRef]
  36. Rana, S.; Valentin, K.; Riehl, J.; Balanfune, A.; Reynes, L.; Thibaut, T.; Bartsch, I.; Eichinger, L.; Glockner, G. Analysis of organellar genomes in brown algae reveals an independent introduction of similar foreign sequences into the mitochondrial genome. Genomics 2021, 113, 646–654. [Google Scholar] [CrossRef] [PubMed]
  37. Wu, X.; Xiao, S.; Yu, Z. Mitochondrial DNA and morphological identification of Crassostrea zhanjiangensis sp. nov. (Bivalvia: Ostreidae): A new species in Zhanjiang, China. Aquat. Living Resour. 2013, 26, 273–280. [Google Scholar] [CrossRef] [Green Version]
  38. Orr, W.J.; Wildes, S.; Kai, Y.; Raring, T.; Nakabo, T.; Katugin, O.; Guyon, J. Systematics of North Pacific sand lances of the genus Ammodytes based on molecular and morphological evidence, with the description of a new species from Japan. Fish. Bull. 2015, 113, 129–156. [Google Scholar] [CrossRef]
  39. Broeders, S.; Huber, I.; Grohmann, I.; Berben, G.; Taverniers, I.; Mazzara, M.; Roosens, N.; Morisset, D. Guidelines for validation of qualitative real-time PCR methods. Trends Food Sci. Technol. 2014, 37, 115–126. [Google Scholar] [CrossRef]
  40. Ma, H.; Bell, K.N.; Loker, R.N. qPCR and qRT-PCR analysis: Regulatory points to consider when conducting biodistribution and vector shedding studies. Mol. Ther. Methods Clin. Develop. 2020, 20, 152–168. [Google Scholar] [CrossRef] [PubMed]
  41. Schrader, C.; Schelke, A.; Ellerbroek, L.; Johne, R. PCR inhibitors- occurrence, properties, and removal. Appl. Microbiol. 2012, 113, 1014–1026. [Google Scholar] [CrossRef]
  42. Sidstedt, M.; Radstrom, P.; Hedman, J. PCR inhibition in qPCR, dPCR and MPS-mechanisms and solutions. Anal. Bioanal. Cem. 2020, 412, 2009–2023. [Google Scholar] [CrossRef] [Green Version]
  43. The European Union Reference Laboratories: Guidance Document on the Estimation of LOD and LOQ for Measurements in the Field of Contaminants in Feed and Food. Available online: https://ec.europa.eu/jrc/sites/default/files/lod_loq_guidance_document_food_contaminants_2016.pdf (accessed on 1 February 2022).
  44. Miyajima, T.; Hori, M.; Hamaguchi, M.; Shimabukuro, H.; Adachi, H.; Yamano, H.; Nakaoka, M. Geographic variability in organic carbon stock and accumulation rate in sediments of East and Southeast Asian seagrass meadows. Glob. Biogeochem. Cycles 2015, 29, 397–415. [Google Scholar] [CrossRef]
  45. Miyajima, T.; Hori, M.; Hamaguchi, M.; Shimabukuro, H.; Yoshida, G. Geophysical constraints for organic carbon sequestration capacity of Zostera marina seagrass meadows and surrounding habitats. Limnol. Oceanogr. 2017, 62, 954–972. [Google Scholar] [CrossRef] [Green Version]
  46. R Core Team. A Language and Environment Statistic Computing; R Foundation for Statistical Computing: Vienna, Austria, 2014; Available online: http://www.rproject.Org (accessed on 3 March 2018).
  47. Primer3Plus. Available online: https://primer3plus.com/cgi-bin/dev/primer3plus.cgi (accessed on 1 February 2022).
  48. DNA Software. Available online: https://www.dnasoftware.com/multiplex-pcr-designs-in-hours-not-months/?gclid=EAIaIQobChMIyaGwsfv_9AIV0VBgCh2W0wB0EAAYASAAEgJMEfD_BwE (accessed on 1 February 2022).
  49. Nakasuga, T.; Oyama, H.; Haruki, M. Studies on the mangrove community. 1. The distribution of the mangrove community in Japan. Jpn. J. Ecol. 1974, 24, 237–246, (In Japanese with English Abstract). [Google Scholar]
  50. Lo, E.Y.Y.; Duke, N.C.; Sun, M. Phylogeographic pattern of Rhizophora (Rhizophoraceae) reveals the importance of both vicariance and long-distance oceanic dispersal to modern mangrove distribution. BMC Evol. Biol. 2014, 14, 83. [Google Scholar] [CrossRef] [PubMed] [Green Version]
  51. Inoue, T. Carbon sequestration in Mangroves. In Blue Carbon in Shallow Coastal Ecosystems; Kuwae, T., Hori, M., Eds.; Springer: Singapore, 2018; pp. 73–100. [Google Scholar]
  52. Miyajima, T.; Hamaguchi, M.; Nakamura, T.; Katayama, H.; Hori, M. Export and dispersal of coastal macrophyte-derived organic matter in deep, offshore sediment around Tokara and Yaeyama Islands, southwest Japan: Evaluation using quantative DNA probing techniques. Bull. Geol. Surv. Jpn. 2021, submitted.
  53. Seagrassbed 2020. Available online: http://www.biodic.go.jp/moni1000/findings/newsflash/pdf/amamoba_2020.pdf (accessed on 1 February 2022).
  54. Stokes, H.; Mortimer, J.A.; Hays, G.C.; Unsworth, R.K.F.; Laloe, J.-O.; Esteban, N. Green turtle diet is dominated by seagreass in the Western Indian Ocean except amongst gravid females. Mar. Biol. 2019, 166, 135. [Google Scholar] [CrossRef] [Green Version]
  55. Kato, Y.; Aioi, K.; Omori, Y.; Takahata, N.; Satta, Y. Phylogenetic analyses of Zostera species based on rbcL and matK nucleotide sequences: Implications for the origin and diversification of aeagrasses in Japanese waters. Genes Genet. Syst. 2003, 78, 329–342. [Google Scholar] [CrossRef] [PubMed] [Green Version]
  56. Yotaukura, N. A review on nomenclature of laminariacean kelp growing in cold water areas of Japan. Jpn. J. Phycol. 2007, 55, 167–172. [Google Scholar]
  57. Wang, X.; Shao, Z.; Fu, W.; Yao, J.; Hu, Q.; Duan, D. Chloroplast genome of one brown seaweed, Saccharina japonica (Laminariales, Pheophyta): Its structural features and phylogenetic analyses with other photosynthetic plastids. Mar. Genom. 2013, 10, 1–9. [Google Scholar] [CrossRef]
  58. Ye, N.; Zhang, W.; Miao, M.; Fan, X.; Zheng, Y.; Xu, D.; Wang, J.; Zhou, L.; Wang, D.; Gao, Y.; et al. Saccharina genomes provide novel insight into kelp biology. Nar. Commun. 2015, 6, 6986. [Google Scholar] [CrossRef] [PubMed] [Green Version]
  59. Rothman, M.D.; Mattio, L.; Wernberg, T.; Anderson, R.J.; Uwai, S.; Mohring, M.B.; Bolton, J.J. A molecular investigation of the genus Ecklonia (Phaeophyceae, Laminariales) with special focus on the southern hemisphere. J. Phycol. 2015, 51, 236–246. [Google Scholar] [CrossRef] [PubMed]
  60. Kawai, H.; Akita, S.; Hashimoto, K.; Hanyuda, T. A multigene molecular phylogeny of Eisenia reveals evidence for a new species, Eisenia nipponica (Laminariales), from Japan. Eur. J. Phycol. 2020, 55, 234–241. [Google Scholar] [CrossRef]
  61. Ichihara, K.; Arai, S.; Uchimura, M.; Fay, E.J.; Ebata, H.; Hiraoka, M.; Shimada, S. New species of freshwater Ulva, Ulva limnetica (Ulvales, Ulvophyceas) from the Ryukyu Islands, Japan. Phycol. Res. 2009, 57, 94–103. [Google Scholar] [CrossRef]
  62. Masakiyo, Y.; Shimada, S. Species diversity the genus Ulva (Ulvophyceae, Chlorophyta) in Japanese waters, with special reference to Ulva tepida Masakiyo et S. Shimada sp. nov. Bull. Natl. Mus. Nat. Sci. Ser. B 2014, 40, 1–13. [Google Scholar]
  63. Ichihara, K.; Suzuki, R.; Yamazaki, T.; Ota, S.; Mogi, Y.; Kagami, Y.; Kuwano, K.; Kawano, S. Ulva partita sp. nov., a novel Enteromorpha-like Ulva species from Japanese coastal areas. Cytologia 2015, 80, 261–270. [Google Scholar] [CrossRef] [Green Version]
  64. Hanyuda, T.; Heesch, S.; Nelson, W.; Sutherland, J.; Arai, S.; Boo, S.M.; Kawai, H. Genetic diversity and biogeography of native and introduced populations of Ulva pertusa (Ulvales, Chlorophyta). Phycol. Res. 2016, 64, 102–109. [Google Scholar] [CrossRef]
  65. Yang, L.; Deng, Y.-Y.; Xu, G.-P.; Russell, S.; Lu, Q.-Q.; Bradie, J. Redefining Pyropia (Bangiales, Rhodophyta): Four new genera, Resurrection of Porphyrella and Description of Calidia Psedolobata sp. nov. from China. J. Phycol. 2020, 56, 862–879. [Google Scholar] [CrossRef] [PubMed]
  66. Fort, A.; HcHale, M.; Cascella, K.; Potin, P.; Usadel, B.; Guiry, M.D.; Sulpice, R. Foliose Ulva species show considerable inter-specific genetic diversity, low intra-specific genetic variation, and the rare occurrence of interspecific hybrids in the wild. J. Phycol. 2021, 57, 219–233. [Google Scholar] [CrossRef]
  67. Gao, Y.; Zhang, Y.; Du, M.; Lin, F.; Jiang, W.; Li, W.; Li, F.; Lv, X.; Fang, J.; Jiang, Z. Dissolved organic carbon from cultured kelp Saccharina japonica: Production, bioavailability, and bacterial degradation rates. Aquacult. Environ. Inetract. 2021, 13, 101–110. [Google Scholar] [CrossRef]
  68. Yoshida, G.; Uchimura, M.; Hiraoka, M.; Terawaki, T.; Arai, S.; Iseki, K. Accumulation of Ulva spp. (Chlorophyta) and other seaweed thalli on the shallow sea bottom of Hiroshima Bay (A preliminary survey). Biosph. Sci. 2010, 49, 31–38, (In Japanese with English Abstract). [Google Scholar]
  69. Miyajima, T.; Hamaguchi, M. Carbon sequestration in sediment as an ecosystem function of seagrass meadows. In Blue Carbon in Shallow Coastal Ecosystems; Kuwae, T., Hori, M., Eds.; Springer: Singapore, 2018; pp. 33–71. [Google Scholar]
  70. Miyajima, T.; Hamaguchi, M.; Hori, M. Evaluation of the baseline carbon sequestration rates of Indo-Pacific temperate and tropical seagrass meadow sediments. Ecol. Res. 2021, 37, 9–20. [Google Scholar] [CrossRef]
  71. Yoshida, G.; Hori, M.; Shimabukuro, H.; Hamaoka, H.; Yatsuya, K.; Watanabe, K.; Nakaoka, M. Carbon sequestration by seagrass and macroalgae in Japan: Estimates and future Needs. In Blue Carbon in Shallow Coastal Ecosystems; Kuwae, T., Hori, M., Eds.; Springer: Singapore, 2018; pp. 101–128. [Google Scholar]
  72. Kokubu, Y.; Komatsu, T. Fate of floating seaweeds: A case in waters off southeast Hokkaido island, Japan. GekkanKiyou 2015, 47, 265–270. (In Japanese) [Google Scholar]
  73. Shimabukuro, H.; Yoshida, G.; Miura, S.; Terawaki, T. Change of vegetation seaweed beds along the stone-built seawall mound in Hiroshima Bay, Hatsukaichi City, Hiroshima Prefecture, Japan. Jpn. J. Phycol. 2015, 63, 1–9. [Google Scholar]
  74. Wei, N.; Nakajima, F.; Tobino, T. Variation of environment DNA in sediment at different temporal scales in nearshore area of Tokyo Bay. J. Water Environ. Tech. 2019, 3, 153–162. [Google Scholar] [CrossRef] [Green Version]
  75. Doi, H.; Uchii, K.; Takahara, T.; Matsuhashi, S.; Yamanaka, H.; Minamoto, T. Use of droplet digital PCR for estimation of fish abundance and biomass in environmental DNA surveys. PLoS ONE 2015, 10, e0122763. [Google Scholar] [CrossRef] [Green Version]
  76. Guardiola, M.; Jesus-Uriz, M.; Taberlet, P.; Coissac, E.; Wangensteen, O.S.; Turon, X. Deep-Sea, deep-sequencing: Metabarcoding extracellular DNA from sediments of marine canyons. PLoS ONE 2015, 10, e0139633. [Google Scholar] [CrossRef] [PubMed] [Green Version]
  77. Thomsen, P.F.; Willerslev, E. Environmental DNA—An emerging tool in conservation for monitoring past and present biodiversity. Biol. Conserv. 2015, 183, 4–18. [Google Scholar] [CrossRef]
  78. Hamaguchi, M.; Shimabukuro, H.; Usuki, H.; Hori, M. Occurrences of the indo-west pacific rock oyster Saccostrea cucullata in mainland Japan. Mar. Biodivers. Rec. 2014, 7, e84. [Google Scholar] [CrossRef]
  79. Hamaguchi, M.; Manabe, M.; Kajihara, N.; Shimabukuro, H.; Yamada, Y.; Nishi, E. DNA barcoding of flat oyster species reveals the presence of Ostrea stemtina Payraudeau, 1826 (Bivalvia: Ostreidae) in Japan. Mar. Biodivers. Rec. 2017, 10, 4. [Google Scholar] [CrossRef] [Green Version]
  80. Reich, S.; DiMartinob, E.; Toddb, J.A.; Wesselingh, F.P.; Renema, W. Indirect paleo-seagrass indicators (IPSIs): A review. Earth-Sci. Rev. 2015, 143, 161–186. [Google Scholar] [CrossRef]
  81. Geraldi, N.R.; Ortega, A.; Serrano, O.; Macreadie, P.I.; Lovelock, C.E.; Krause-Jensen, D.; Kennedy, H.; Lavery, P.S.; Pace, M.L.; Kaal, J.; et al. Fingerprinting blue carbon: Rationale and tools to determine the source of organic carbon in marine depositional environments. Front. Mar. Sci. 2019, 6, 263. [Google Scholar] [CrossRef] [Green Version]
  82. Miya, M.; Sato, Y.; Fukunaga, T.; Sado, T.; Poulsen, J.Y.; Sato, K.; Minamoto, T.; Yamamoto, S.; Yamanaka, H.; Araki, H.; et al. MiFish, a set of universal PCR primers for metabarcoding environmental DNA from fishes: Detection of more than 230 subtropical marine species. R. Soc. Open Sci. 2015, 2, 150088. [Google Scholar] [CrossRef] [Green Version]
  83. Kress, W.J.; Erickson, D.L. A two-locus global DNA barcode for land plants: The coding rbcL gene complements the non-coding trnH-psbA spacer region. PLoS ONE 2007, 6, e508. [Google Scholar] [CrossRef] [Green Version]
  84. Yin, Y.; Huang, J.; Xu, Y. The cellulose synthase superfamily in fully sequenced plants and algae. BMC. Plant Biol. 2009, 9, 99. [Google Scholar] [CrossRef] [PubMed] [Green Version]
  85. Ito, Y.; Ohi-Toma, T.; Murata, J.; Tanaka, N. Hybridization and polyploidy of an aquatic plant, Ruppia (Ruppiaceae), inferred from plastid and nuclear DNA phylogenies. Am. J. Bot. 2010, 97, 1156–1167. [Google Scholar] [CrossRef] [PubMed] [Green Version]
  86. Li, Z.; De La Torre, A.R.; Sterck, L.; Canovas, F.M.; Avila, C.; Merino, I.; Carvera, M.T.; Ingvarsson, P.K.; Van de Peer, Y. Single-copy genes as molecular markers for phylogenomic studies in seed plants. Genome Biol. Evol. 2017, 9, 1130–1147. [Google Scholar] [CrossRef] [PubMed] [Green Version]
  87. Japanese Food Guide. Available online: https://www.japanesefoodguide.com/edible-japanese-seaweed-types (accessed on 1 February 2022).
  88. Sato-Umi Net. Available online: https://www.env.go.jp/water/heisa/satoumi/en/02_e.html (accessed on 1 February 2022).
  89. Yamamuro, M.; Hiratsuka, J.-I.; Ishitobi, Y.; Hosokawa, S.; Nakamura, Y. Ecosystem shift resulting from loss of eelgrass and other submersed aquatic vegetation in two estuarine lagoons, Lake Nakaumi and Lake Shinji, Japan. J. Oceanog. 2006, 62, 551–558. [Google Scholar] [CrossRef]
  90. Murata, M.; Nakazoe, J.-I. Production and use of marine algae in Japan. Jpn. Agric. Res. Q. (JARQ) 2001, 35, 281–290. [Google Scholar] [CrossRef] [Green Version]
  91. Sondak, C.F.A.; Ang, P.O., Jr.; Beardall, J.; Bellgrove, A.; Boo, S.M.; Gerung, G.S.; Hepburn, C.D.; Hong, D.D.; Hu, Z.; Kawai, H.; et al. Carbon dioxide mitigation potential of seaweed aquaculture beds (SABs). J. Appl. Phycol. 2017, 29, 2363–2373. [Google Scholar] [CrossRef]
  92. Brakel, J.; Sibonga, R.C.; Dumilag, R.V.; Montalescot, V.; Campbell, I.; Cottier-Cook, E.J.; Le Ward, V.; Liu, T.; Msuya, F.E.; Brodie, J.; et al. Exploring, harnessing and conserving marine genetic resources towards a sustainable seaweed aquaculture. Plants People Planet 2021, 3, 337–349. [Google Scholar] [CrossRef]
  93. Nobutoki, M.; Yoshihara, S.; Kuwae, T. Carbon offset utilizing coastal waters: Yokohama blue carbon project. In Blue Carbon in Shallow Coastal Ecosystems; Kuwae, T., Hori, M., Eds.; Springer: Singapore, 2018; pp. 321–346. [Google Scholar]
  94. Halpern, B.S.; Longo, C.; Hardy, D.; McLeod, K.L.; Samhouri, J.F.; Katona, S.K.; Kleisner, K.; Lester, S.E.; O’Leary, J.; Ranelletti, M.; et al. An index to assess the health and benefits of the global ocean. Nature 2012, 488, 615–622. [Google Scholar] [CrossRef] [Green Version]
  95. Akhand, A.; Watanabe, K.; Chanda, A.; Tokoro, T.; Chakraborty, K.; Moki, H.; Tanaya, T.; Ghosh, J.; Kuwae, T. Lateral carbon fluxes and CO2 evasion from a subtropical mangrove-seagrass-coral continuum. Sci. Total Environ. 2021, 752, 142190. [Google Scholar] [CrossRef]
Figure 1. Sampling sites in Hiroshima Bay, Japan.
Water 14 00827 g001
Figure 2. Distribution of various macrophyte taxa in Hiroshima Bay. The solid circles show each species’ observed site.
Water 14 00827 g002
Figure 3. DNA copy number per g of marine sediment, according to sampling site: circles denote the relative amount, and ‘x’ symbols mark the sampling sites.
Water 14 00827 g003
Figure 4. Correlation analysis between the number of copies of the eDNA of Zostera marina and the amount of organic carbon (A) and the C/N ratio (B) in marine sediment samples from Hiroshima Bay.
Water 14 00827 g004
Figure 5. Correlation analysis between the amount of eelgrass Zostera marina-derived organic carbon (calculated using the three-parameter method of Miyajima et al. [44]) in marine sediment samples from Hiroshima Bay, and the eelgrass eDNA copy number.
Water 14 00827 g005
Table 1. DLPs and PCR primers for three mangrove species in Japan.
Target SpeciesTarget GeneAbbreviations for DLPs and PCR Primers Nucleotide Sequences 5′–3′Reaction Temperature (°C)Amplicon Size (bp)
Rhizophora mucronataITSYaeITS-PCy5-GCGCTGCGACTCCACGATGAGTACC-BHQ364.0116
YaeITS-FTCGCGCCAAGGAAATCAAAGA
YaeITS-RATATCCGTTGCCGAGAGTCG
MatKYehiruMatK-PFAM-TCATCAGAAGAGGCGTACACTTTGAAGCCA-BHQ164.0169
YehiruMatK-FGTCTTTGCTAATGATTTTCCGTCT
YehiruMatK-RACCACACATAAAAATGACATTGACC
Bruguiera gymnorrhizaITSOhiITS-PHEX-GGCCGCTGCGTCTCCACCATCA-BHQ164.0114
OhiITS-FGCGCCAAGGAAATCACAGG
OhiITS-RGATATCCGTTGCCGAGAGTCG
MatKOhiMatK-PHEX-AAGAACCCGCGCTTCTTCCGTCAAAAA-BHQ164.0142
OhiMatK-FCTTGTAAACACAAAAGTCCTGTCC
OhiMatK-RCCTCGATATAACGTTTGTGAAATAGAAG
Sonneratia albaITSMayaITS-PFAM-ACCTCGCCTTCTCCAGTGTGACAATGATGA-BHQ164.0101
MayaITS-FCGGCACTGGATGCTTCCC
MayaITS-RGTGCGAGAGCCAAGATATCCA
MatKMayaMatK-PCy5-CCCGTTAGTAAGTCGACCCGGACCGAT-BHQ364.0124
MayaMatK-FTTCCCGTTATTCCTTGATTGGATGC
MayaMatK-RCGCACAAATCGGTCGATAATATCA
Table 2. DLPs and PCR primers for subtropical seagrass species in Japan.
Target SpeciesTarget GeneAbbreviations for DLPs and PCR PrimersNucleotide Sequences 5′–3′Reaction Temperature (°C)Amplicon Size (bp)
Enhalus acoroidesITSUs-ITS-PHEX-ACCGTTCGTTTCCACGTCACTCGCTC-BHQ164.099
Us-ITS-FACCTGCGGAAGGATCATTGTC
Us-ITS-RAGGGTTGTTGTTCGGTGGTC
MatKUmishyoB-PFAM-ACCCGGATACATCACAAAATTGAGCTTTCG-BHQ164.098
UmishyoB-FAGTCCCAGTTATTCCTCTCATTGA
UmishyoB-RCGGATAAATCCGTCCAAATCCC
Cymodocea rotundataITSBa-ITS-PFAM-CGTTCGTTACGTTGGCTACCACTCTCCCT-BHQ164.091
Ba-ITS-FTGCCCATCTCGGAGTTCGTG
Ba-ITS-RGTGGACTCGCCTGACCTGG
MatKBeniA-PCy5-CCAAACTGGCTTACTAATGGGATACCCGGA-BHQ364.0120
BeniA-FCCCTCTCATTGGATCTTTATCTAAAGA
BeniA-RCATATACGACCAAACCGATCAATAATA
Thalassia hemprichiiITSRs-ITS-PCy5-CATTCACCACACGTCGGGATGCACC-BHQ364.0108
Rs-ITS-FGCCGTCCCTGTGTTCCCTA
Rs-ITS-RTCACGACGCACGAAGCAC
MatKRyukyuS-PHEX-AACCCGTCCAAATCGCCTTACTAACAGGA-BHQ164.0122
RyukyuS-FTTCCTCTCATTGGATCCTTGTCA
RyukyuS-RACATATCCGACCAAATCGATCAATC
Halophila ovalis Iriomote-typeITSHal-ITS-PCy5-ACGTGAAGCAACGAGTGCGATCCACC-BHQ364.0117
Hal-ITS-FTCTCGACGATGTCCTGCCTC
Hal-ITS-RGGGGATACTCAGCTTGGGGA
Cymodocea serrulataITSRa-ITS-PFAM-CACTTGAGCACACCGCTTCCACTCCAC-BHQ164.093
Ra-ITS-FGGCCTTCCGGTTCTCTCTCT
Ra-ITS-RCATCGCATCGCATCCATCGA
Halodule uninervisITSUmj-ITS-PHEX-TTGCCATCCACCATCCATGCTGCGTC-BHQ164.098
Umj-ITS-FGGCTGAAGTACGTTGGGCTC
Umj-ITS-RGGCGATCCAAGGGAAGCATC
Table 3. DLPs and PCR primers for temperate and subarctic seagrass species in Japan.
Target SpeciesTarget GeneAbbreviations for DLPs and PCR PrimersNucleotide Sequences 5′–3′Reaction Temperature (°C)Amplicon Size (bp)
Zostera marinaITSAmaITS-P3FAM-ACCCACCATGCCATGTACCGAACATGC-BHQ164.0122
AmaITS-F3TGTAAAGAATCAGAGAATGACCTTC
AmaITS-R3CAGTTTCAGAATGGTAAACATTCTAA
Zostera caulescensITSTachiITS-P3HEX-CGTTTGCCTTGGCAACAATTGTGCCGTG-BHQ164.0129
TachiITS-F31CTTAAAGGATGCACAATCAAGT
TachiITS-R3ATCGAATGAATACGTTTCACCA
Phyllospadix iwatensisITSSugamo-PCy5-AGCCTGCGTGTCGTGCCGTGTAGCGCAGTGTAG-BHQ362.0103
Sugamo-FGTGGATTGTTGCAGACGGTTTGTC
Sugamo-RACAACGACAGATGGCGCACTAAG
Table 4. DLPs and PCR primers for Phaeophyceae seaweed single species in Japan.
Target SpeciesTarget GeneAbbreviations for DLPs and PCR PrimersNucleotide Sequences 5′–3′Reaction Temperature (°C)Amplicon Size (bp)
Undaria pinnatifidaITSWakameITS-PHEX-TCGCCCAACATCGCGTAAC-BHQ156.083
WakameITS-FGCGTCGGTTTTGTAAA
WakameITS-RTCGAGGGAATTAACCC
Saccharina japonicaITSMakonbuITS-PFAM-CGAGGCGCCCCTCGCCCAACTTCGCA-BHQ168.0116
MakonbuITS-FTATAAATTGTCTGTGAGGCCGCTTCGT
MakonbuITS-RTGATTCGAGGGCCTTTTCACAGGCT
Saccharina longissimaITSNagaKoCo1-PHEX-GCTGGGACAGGTTGGACGGTGTACCCACCT-GHQ168.0163
NagaKoCo1-FCCTCTTTAATTTTGCTTCTAGCGTCTTCATT
NagaKoCo1-RCCTAAAATAGAAGCAGCACCCGAGAG
Ecklonia kuromeITSKuromeITS-PFAM-CGCCTCCCTCGGGTTTTAATTA-BHQ165.0101
KuromeITS-FCGTTTGTAACCTCATCTTT
KuromeITS-RGCCCAACTTCGCATAA
Sargassum horneriITSAkamokuITS2-PHEX-AGCCTCTAGCAACGCTCCAA-BHQ158.0106
AkamokuITS2-FTCGCTATATGCAGGTTTA
AkamokuITS2-RGACTGCCTACCGTCAA
Sargassum muticumITSTamahaITS2-PCy5-TGTCATCAGCGCCGCAAAG-BHQ358.0122
TamahaITS2-FGGTGGGTATTTTTGTACC
TamahaITS2-RGGAAGACACGGGTTAA
Table 5. DLPs and PCR primers for Phaeophyceae, Rhodophyta and Chlorophyta seaweed species complex in Japan.
Target Species ComplexTarget GeneAbbreviations for DLPs and PCR PrimersNucleotide Sequences 5′–3′Reaction Temperature (°C)Amplicon Size (bp)
Sargassum spp.ITSSubSar-DLPFAM-GGTGGACTCAGGGGACGAGCAGG-BHQ162.0151
SubSar-F GKGTTCGATCTCGATCTCAAG
SubSar-RCAAAGACAATAGAAGCCTGGACAAT
Bactrophycus spp.ITSTemSar-DLPHEX-CGACCCGTCGTACAACGGATCCTC-BHQ162.0102
TemSar-FTGTGCGGGTGAGTTTGAAG
TemSar-RCAAACTCACCCGCGYACAT
Ulva spp.ITSUlva-ITS-PFAM-CGGATATCTTGGCTCTCGCAACGATGAAGAACGC-BHQ165.0159
Ulva-ITS-FCTGAAGCAGCTTCGYAMGGGGACAC
Ulva-ITS-RAATGTGCGTTCAAGATTCGATGACTC
Neopyropia spp. ITSSusabi-ITS-PHEX-TGGGCGTTGCCCTCTGGAACGTGCT-BHQ165.0105
Susabi-ITS-F2TCTGACGTAGAGACAGGTGCCGTC
Susabi-ITS-R2CCGTCAAGCACAATCTGCCTCTTTTGA
Ecklonia/Eisenia spp.ITSEckEiseITS-PFAM-TTCTCGGGGTATAAACGCTCGCCTCCCTCGG-BHQ166.0119
EckEiseITS-FGTCTGAGACGTCGCCGTTTGTAACCTCA
EckEiseITS-RCCCCTCGCCCAACTTCGCATAACAAA
Saccharina spp.ITSSacchaITS-PHEX-GTCGCGGCGGCGGACTTTGAGTGTTCCG-BHQ166.0150
SacchaITS-FACTCGCCCCTCTTCTCTCCTGTCTCA
SacchaITS-RGAAGCGAGCGCCGTCAACAACTCTG
Table 6. Characteristics of the calibration curves, created with the DLPs and PCR primers designed in this study.
GroupTarget Species or Species ComplexGeneSloopEfficiencyR2DNA Polymerase
MangroveRhizophora mucronataITS−3.600.890.99B
MatK−3.410.960.99A,B
Bruguiera gymnorrhizaITS−3.640.880.99B
MatK−3.061.120.99A,B
Sonneratia albaITS−3.340.990.99A,B
MatK−3.331.000.99A,B
Seagrass
(subtropical zone)
Enhalus acoroidesITS−3.291.020.99A,B
MatK−3.321.000.99A,B
Cymodocea rotundataITS−3.420.960.99A,B
MatK−3.450.951.00A,B
Thalassia hemprichiiITS−3.281.020.99A,B
MatK−3.241.040.99A,B
Halophila ovalis (Iriomote-type)ITS−3.440.950.99A,B
Cymodocea serrulataITS−3.340.990.99A,B
Halodule uninervisITS−3.390.971.00A,B
Seagrass (temperate and subarctic zone)Zostera marinaITS−3.400.970.99A,B
Zostera caulescensITS−3.241.040.99A,B
Phyllospadix iwatensisITS−3.311.011.00A,B
Phaeophyceae
(single species)
Undaria pinnatifidaITS−3.510.930.99B
Saccharina japonicaITS−3.420.961.00B
Saccharina longissimaCOI−3.340.990.99A,B
Ecklonia kuromeITS−3.420.961.00A,B
Sargassum horneriITS−3.490.940.99A,B
Phaeophyceae, Rhodophyta and Chlorophyta
(Species complex)
Sargassum spp. ITS−3.470.940.99A,B
Bactrophycus spp. ITS−3.400.970.99A,B
Ulva spp. ITS−3.400.970.99A,B
Neopyropia spp. ITS−3.400.971.00A,B
Ecklonia/Eisenia spp. ITS−3.370.980.99A,B
Saccharina spp. ITS−3.211.050.99A,B
Internal standardCrassostrea zhanjiangensisCOI−3.460.950.99A,B
Ammodytes hexapterusCYTB−3.480.970.99A,B
DNA polymeraseA:SsoFast Probes Supermix with ROX, B:iQ Multiplex Powermix
Table 7. Physical and chemical properties of the sediments in Hiroshima Bay.
Sampling SiteSampling PositionTotal Nitrogen (µmol N/g)Organic Coarbon (µmol C/g)C/N RatioNitrogen Stable Isotope Ratio (d15N)Carbon Stable Isotope Ratio (d13C)Specific Surface Area (m2/g)Total Pore Volume (cm3/g)Average Pore Diameter (nm)
LongitudeLatitude
HSd-00134-13.3132-28.12202,1309.667.75−21.2926.020.11918.30
HSd-00334-18.2132-24.02101,8638.878.07−21.0433.990.14617.16
HSd-00533-57.2132-26.1171176.879.11−19.953.600.01516.45
HSd-00733-54.2132-20.0525129.767.21−21.745.640.02819.84
HSd-00934-01.3132-20.31901,5177.987.85−20.8632.090.12315.39
HSd-01134-07.6132-20.31831,4798.077.84−20.8231.710.11314.24
HSd-01334-12.4132-19.52061,7058.307.93−20.8535.030.11012.58
HSd-01534-13.7132-14.02582,65810.306.19−22.4631.840.10613.29
Table 8. The amount of Zostera marina-derived organic carbon, calculated by the three-parameter method of Miyajima et al. [44] in the seabed sediments of Hiroshima Bay.
Sampling SiteOrganic Carbon Derived from Z. marina (µmol C/g)
4-Source ModelSD*3-Source ModelSD*
HSd-001253 185 407 211
HSd-003235 168 397 175
HSd-00519 12 34 10
HSd-00756 41 84 50
HSd-009200 140 343 141
HSd-011195 136 334 139
HSd-013225 157 384 162
HSd-015255 189 391 231
SD* means Standard deviation.
Publisher’s Note: MDPI stays neutral with regard to jurisdictional claims in published maps and institutional affiliations.

