
Forecasting Guangdong’s Marine Science and Technology, Marine Economy, and Employed Persons by Coastal Regions—Based on Rolling Grey MGM(1,m) Model

School of Economics, Ocean University of China, Qingdao 266100, China
*
Author to whom correspondence should be addressed.
Water 2022, 14(5), 824; https://doi.org/10.3390/w14050824
Submission received: 15 February 2022
/
Revised: 2 March 2022
/
Accepted: 4 March 2022
/
Published: 6 March 2022
(This article belongs to the Special Issue Marine Economic Development and Conservation)
Abstract
:The development of marine scientific and technological innovation is an important force for realizing the high-quality development of the marine economy. The purpose of this paper is to predict the development trend of marine science and technology development, marine economy, and employed persons by coastal regions in Guangdong Province, and to give policy suggestions for the future direction of the development of marine technology in Guangdong. Considering the new information priority principle, this paper uses the data from 2011 to 2016 to predict the development trend of marine science and technology, marine economy, and employed persons by coastal regions in Guangdong Province from 2017 to 2022 with the rolling RMGM(1,m) model. It is found that the level of marine science and technology and marine economy in Guangdong maintains stable growth, but marine science and technology capabilities still need to be strengthened. On the one hand, the research reveals the development trend of Guangdong’s marine science and technology innovation and marine economy, and it provides a direction for the high-quality development of Guangdong’s marine economy. On the other hand, the research confirms the validity of the MGM(1,m) model and enriches the research field of grey forecasting models.
1. Introduction
1.1. The Importance of Marine Science and Technology
China’s economic development needs the sea [1]. As an important part of modern economic development and social activities, the ocean is the key to achieving economic breakthroughs and innovation [2]. The ocean is a strategic location for high-quality development, and the marine economy has become an important part of the national economy. Innovation is an important driving force for realizing high-quality development of the marine economy [3]. The report of the 19th National Congress of the Communist Party of China stated that innovation is the primary driving force for development and the strategic support for building a modern economic system. Marine technological innovation is an important core of China’s high-quality marine development. China attaches great importance to the leading role of marine technological innovation in the development of the marine economy.
China attaches great importance to the innovative development of marine science and technology and has put forward many policies and plans on the construction of marine science and technology. As early as 2008, China promulgated the “Outline of the National Plan for the Development of the Sea by Science and Technology (2008–2015)”, and, during the period of 13th Five-Year Plan, the “National Plan for the Development of the Sea by Science and Technology (2016–2020)” and the “13th Five-Year Plan Special Plan for Scientific and Technological Innovation in the Marine Field” were successively issued, which highlight the direction for the work of scientific and technological innovation; these strategies all indicate the importance of marine science and technology. In 2018, the Ministry of Natural Resources issued the “Opinions on Promoting the High-Quality Development of the Marine Economy”, pointing out that technological innovation should play a leading role in the high-quality development of the marine economy. Wang et al. (2021) suggested that the marine economy is a technology-intensive economy, and its development speed and quality are highly related to the development level of marine science and technology. Therefore, in order to develop the marine economy and promote the construction of a marine power, the strategy of promoting the sea through science and technology must be implemented [4].
In this paper, marine R&D activities are selected to measure the development level of marine scientific and technological innovation. Wang et al. (2011) pointed out that science and technology are the primary productive forces, and research and experimental development (R&D) is the most creative and innovative core of scientific and technological activities. Therefore, in the era of knowledge economy, R&D activities are the main driving force for economic and social development [5]. Endogenous growth theory shows that innovation is the internal driving force affecting a country’s economic growth. Romer pointed out that greater innovation factor input in a region leads to a higher economic growth rate [6]. Existing research has proven that innovative elements such as production, patents, and R&D can promote economic growth [7,8,9]. In recent years, the interaction between R&D investment and economic growth has also become an important field of academic research. Marine R&D can be used as one of the important indicators to measure marine scientific and technological innovation. The development trend of marine R&D investment has become an important basis for the development level of marine science and technology. Therefore, in the present research, we focus on the perspective of marine science and technology innovation and select the marine R&D to measure the level of marine science and technology development.
Marine scientific and technological innovation is also inseparable from scientific and technological innovation talents, who play a crucial role in the development of the country’s marine scientific and technological innovation. Marine science and technology, marine economy, and employed persons by coastal regions are systems that affect each other. In the long run, predicting the future trend of marine science and technology and marine economic growth will play a crucial role in the high-quality development of China ‘s oceans.
1.2. The Development of Marine Science and Technology in Guangdong Province
Guangdong is a major province of marine economy and a pilot area for the development of the national marine economy. According to the “Guangdong Marine Economic Development Report (2021)”, Guangdong’s GOP will exceed 1.7 trillion CNY in 2020, ranking first in the country for 26 consecutive years. In 2020, Guangdong’s GOP accounted for 15.6% of the regional GDP and 21.6% of the national GDP. In 2020, the coastal economic belt created about 82.3% of the province’s total economic output, and it generated 90.7% of the province’s total import and export volume. It can be seen that the development of Guangdong’s marine economy plays an important role in driving Guangdong’s economic development level. To analyze the innovation strategy of marine science and technology, this paper takes Guangdong Province as an example to analyze the innovation level of Guangdong’s marine science and technology. According to China’s Marine Statistical Yearbook, in 2016, there were 3870 scientific and technological personnel in marine scientific research institutions in Guangdong Province, of which about 40% had senior professional titles, and both doctoral and master’s degrees accounted for more than 30%. The number of employed persons by coastal regions has risen steadily, from 3164 in 2012 to 4542 in 2016 with an annual growth rate of 39%.
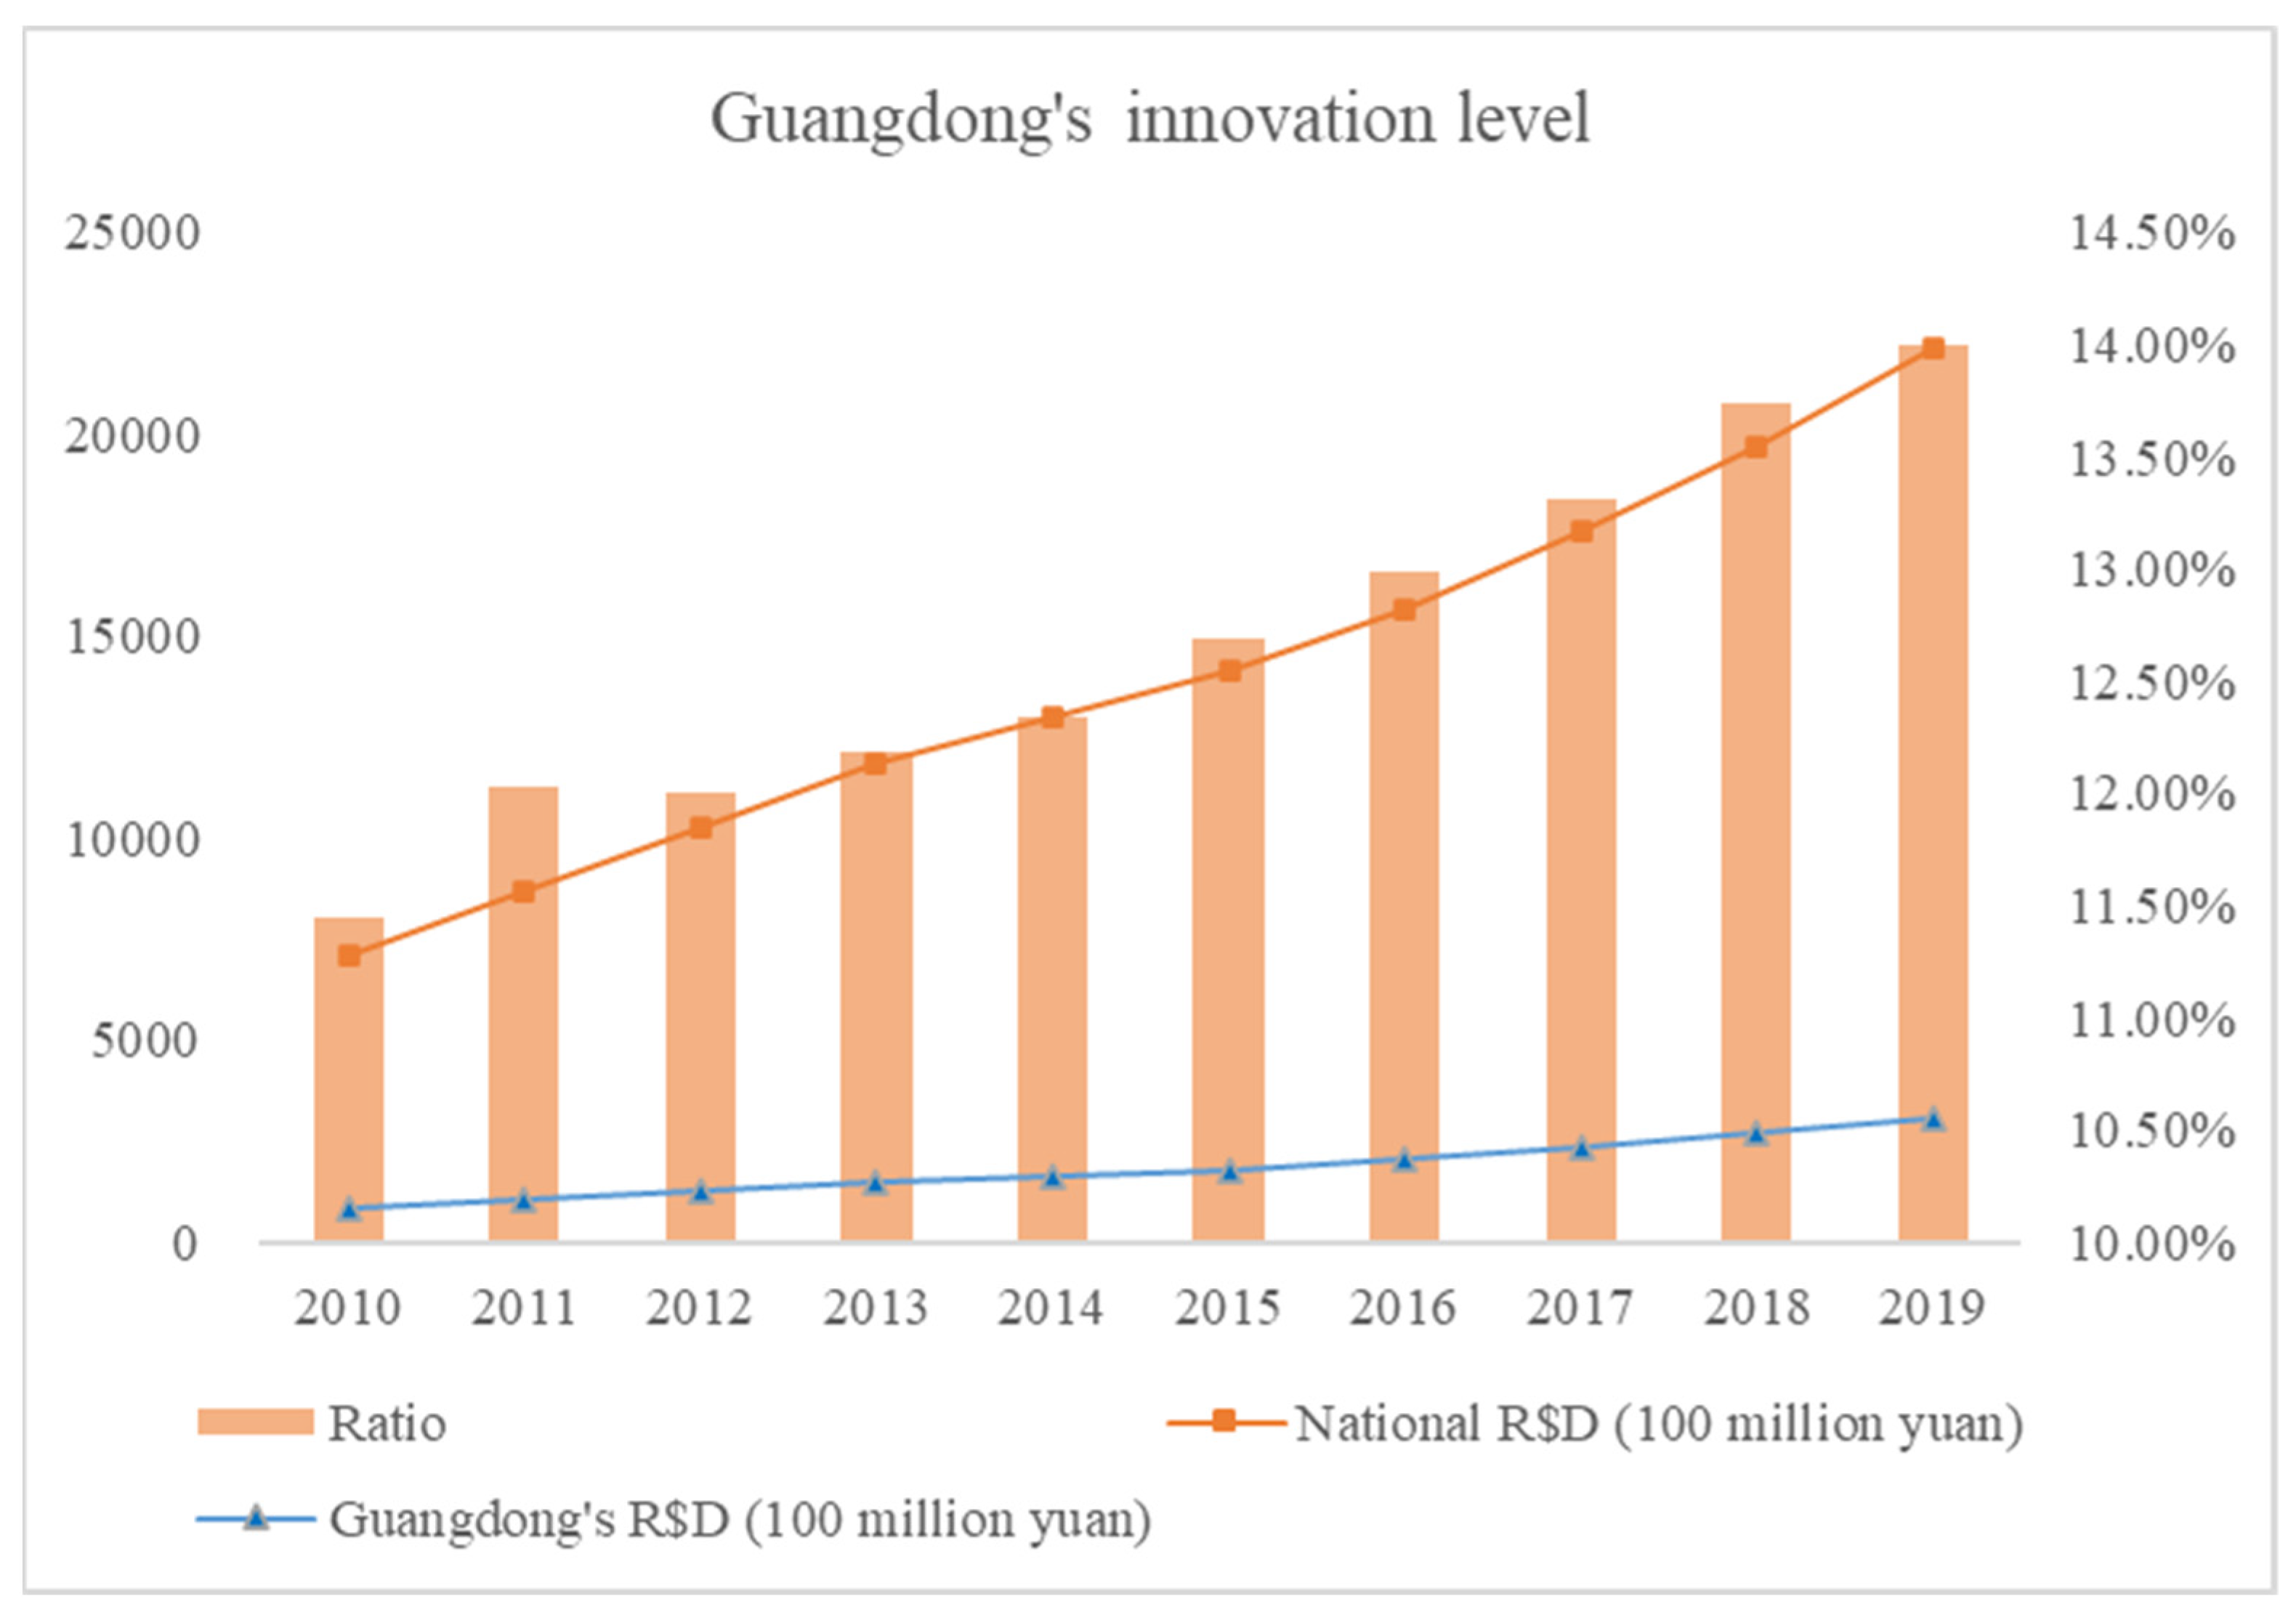
R&D activities are not only the foundation and core of the entire scientific and technological activities, but also the main driving force for economic and social development. This paper uses marine R&D to measure the development level of marine science and technology in Guangdong. Figure 1 shows the R&D expenditure of Guangdong Province and its proportion in the whole country from 2010 to 2019. As can be seen from Figure 1, R&D in China and Guangdong Province shows a trend of continuous growth. The R&D (100 million CNY) of Guangdong Province increased from 808.7478 in 2010 to 3098.489 in 2019, a nearly fourfold increase. The proportion of R&D in Guangdong Province in the whole country is increasing year by year, which shows that Guangdong Province attaches great importance to the development level of local science and technology.
Figure 2 shows the marine R&D in Guangdong Province from 2011 to 2016. As shown in Figure 2, the marine R&D (1000 CNY) in Guangdong Province has maintained continuous growth every year from 858,228 in 2011 to 1,966,360 in 2016. The contribution of marine R&D in Guangdong Province to China’s R&D has basically maintained an increasing trend, especially in 2016, where the proportion was the largest. In 2016, China’s R&D decreased by 21% compared with 2015, but the marine R&D in Guangdong Province in 2016 was able to maintain an increase of 11% compared with 2015. This shows that the level of marine science and technology in Guangdong Province has maintained steady growth year by year.
China’s investment in marine R&D is the key to the high-quality development of China’s ocean. As a big province of marine science and technology innovation, it is very important to predict the future development trend of marine science and technology and the development of marine economy in Guangdong. The purpose of this paper is to predict the future development of marine science and technology innovation and marine economy in Guangdong Province, and to explore the capacity of marine science and technology innovation in Guangdong Province. This paper can help relevant departments to formulate effective policies and measures for the high-quality development of Guangdong’s ocean in the future. The remaining paper is organized as follows: an analysis and a summary of the relevant literature are presented in Section 2. The modeling algorithms of the GM(1,1) model, MGM(1,m) model, and rolling MGM(1,m) model are illustrated in Section 3. The empirical analysis of forecasting Guangdong’s marine science and technology, marine economy, and employed persons by coastal regions is provided in Section 4. Conclusions and suggestions are presented in Section 5.
2. Literature Review
2.1. The Development of Marine Technology Innovation
As China attaches great importance to marine development, many scholars undertook a quantitative analysis of marine economy in China. Wei et al. (2021) used the super-efficiency slack-based measure model and global Malmquist index model to research the impact of the evolution of the marine industrial structure on marine economic [10]. Wu and Li (2022) completed a detailed analysis of the spatiotemporal evolution and types of marine economy and provided a new strategy for measuring many aspects of marine economic resilience [11]. Sun et al. (2021) put forward the AHP-entropy based TOPSIS method to study the sustainable development of the marine economy [12]. Ye et al. (2021) used a differential Gaussian mixture model to study the impact of government preference and environmental regulation on the green development of the marine economy. The results showed that environmental regulation lags behind in promoting the green development of marine economy [13]. Most of the existing research focused on the sustainable study of the marine economy, but seldom discussed predictions of the marine economy. Accurate prediction of the marine economy is helpful to provide a new direction for its rapid development.
In recent years, high-quality marine development has gradually become a hot topic. High-quality marine development is inseparable from marine technological innovation [14]. Many scholars have begun to study marine technological innovation. Relevant research mainly focused on two aspects. First, some scholars constructed marine innovation index systems to analyze the level of marine scientific and technological innovation. For example, Xie (2014) established an evaluation index system for the development level of marine science and technology, and used the principal component analysis method to comprehensively analyze the level of marine science and technology innovation in 11 coastal provinces and cities of China [15]. Sun et al. (2017) constructed an evaluation system of marine economy and marine science and technology in China’s coastal areas, and evaluated the level of marine economy and marine science and technology in 11 coastal provinces and cities. The study found that the relationship between marine economy and marine science and technology in various regions is characterized by diversity [16]. Liu and Cui (2016) constructed an evaluation system of marine science and technology competitiveness from three aspects of China’s marine economy, including science and technology input, science and technology output, and social and economic development, and they used a spatial econometric model to analyze the influencing factors of marine science and technology competitiveness [17]. The paper provided corresponding policy suggestions for enhancing the competitiveness of marine science and technology.
The second aspect is the efficiency of marine technology innovation or related factors [8]. Shao (2020) used marine patents to represent technological innovation and applied the panel threshold model to examine the nonlinear effects of marine economic growth and technological innovation on marine pollution [18]. Gl et al. (2021) used stochastic frontier analysis (SFA) to calculate the efficiency of marine science and technology innovation [19]. Lw et al. (2021) constructed a panel fixed effect model and random effect model to measure marine science and technology innovation and pointed out ways to strengthen the capacity building of marine science and technology innovation [20]. Pl et al. (2021) used a comprehensive weight model to measure the level of marine technological innovation in China’s coastal areas from 2006 to 2016. The results revealed a nonlinear relationship between marine technological innovation and the high-quality development of the marine economy. [21]. Lu et al. (2020) used the stochastic frontier model to measure the input–output efficiency of marine science and technology innovation in 11 coastal provinces and cities in China from 2011 to 2016, and they introduced the time-lag effect to analyze the driving factors of innovation efficiency. The study found that capital investment plays a more important role than personnel investment in marine scientific and technological innovation [22]. The study of the supply chain can provide a new development approach for marine science and technology innovation and further economic benefits of marine related production activities [23,24].
In summary, scholars’ research on marine technological innovation mostly adopted traditional statistical analysis methods and models, such as the DEA model, SFA model, spatial econometric model, and panel threshold regression model. Most of the existing research analyzed its influencing factors or the measurement of innovation efficiency, but there have been few studies on forecasting the development of marine science and technology innovation.
2.2. Grey Forecasting Model
Traditional econometric models require larger samples to ensure the accuracy of the model; hence, traditional statistical prediction models have higher requirements on the amount of data, and these data are the key to obtaining the prediction results. However, R&D, an indicator of marine scientific and technological innovation published in China’s Marine Statistical Yearbook, has only 6 years of data. China’s marine system is greatly affected by uncertain factors, and there is great uncertainty, which greatly limits the availability of models in the traditional sense. Therefore, there are few quantitative studies on the marine field, with a lack of prediction and analysis. In 1982, Chinese scholar Deng founded the grey system theory, which is a new method to study the uncertainty of little data and poor information [25]. Grey prediction is an important part of grey system theory. It discovers and masters the law of system development through the processing of original data and the establishment of grey models, and it makes scientific quantitative predictions about the future state of the system. The grey prediction model is suitable for a system with poor information and for variable prediction with a lack of data, while the calculation of the grey prediction model is simple. Good prediction accuracy can be achieved with fewer data, which makes it widely used. At present, the grey prediction model is being continuously improved. Grey prediction models have been widely used in the integrated circuit industry, environment [26], energy [27], transportation [28], industry [29,30], marine disasters [31], and other fields. Li et al. (2019) comprehensively combined the grey theory and models, explained the validity and extensive application of the grey prediction models, and pointed out that the application of the grey model in the marine economy is an inevitable trend [32]. Considering the scarcity of data on marine science and technology, marine economy, and employed persons by coastal regions, the grey prediction model can be used as a method to predict these three variables.
In grey system theory, the GM(1,1) model and MGM(1,m) model are two important forecasting models in grey forecasting models. In reality, many systems are not just a single variable; thus, the research on grey multivariate models is gradually emerging. Many scholars analyzed the performance of the grey multivariable prediction model and proved its practicability. For example, Zhai et al. (1997) found that, when using the MGM(1,m) model to predict multiple mutually restricting and interacting variables, the prediction accuracy of the MGM(1,m) model is higher than when using the GM(1,1) model for each variable separately [33]. In addition, Xiong et al. constructed a multivariate non-equidistant MGM(1,m) model for the sequence of main non-equidistant features [34], optimized the background value of the MGM(1,m) model [35], and studied the properties of the MGM(1,m) model [36]. The above studies demonstrated the adaptability of the MGM(1,m) model.
Scholars have carried out optimization research on the MGM(1,m) model. Zhang et al. (2020) presented an improved MGM(1,m) model with optimized initial and background values, and the results verified the effectiveness and feasibility of the model [37]. Dai et al. (2018) proposed an extended MGM(1,m) model for monotonic and oscillatory sequences. The empirical results show that the optimized MGM(1,m) model can better solve the problem of the interaction of multiple variables [38]. Wang et al. (2017) comprehensively studied the properties of the MGM(1,m) model, demonstrating the practicability and accuracy of the model [39]. Yuan et al. (2014) applied the background value-improved MGM(1,m) model to the prediction of mechanical failures, and the results showed that the optimized MGM(1,m) model has higher prediction accuracy than the traditional model [40]. Wang and Cao (2021) improved the background value of the MGM(1,m) model and applied it to the prediction of Chinese economic growth, energy consumption, and urbanization. The results showed that the model has a certain prediction accuracy [41].
In summary, the predictive performance of the MGM(1,m) model has been confirmed by some studies showing that the MGM(1,m) model is suitable for predicting variables with poor data. In this paper, the MGM(1,m) model is used to predict the marine science and technology, marine economy, and employed persons by coastal regions in Guangdong. This work can not only achieve otherwise impossible statistical analysis due to the small amount of data in the ocean system, but also enrich the research field of grey prediction models.
3. Methodology
3.1. GM(1,1) Model
Let be the original sequence of the GM(1,1) model [42],
is the first-order accumulation sequence of ,
is
Thus, the grey differential equation model of GM(1,1) is
where
The error sequence is
According to the least square method, we can get
That is,
This yields
Equation (2) is the whitening equation of Equation (1).
- (1)
- The solution of the whitening equation is also called the time response function,
- (2)
- The time response sequence of the GM(1,1) grey differential equation is
- (3)
- The predicted value is
3.2. MGM(1,m) Model
The original sequence is , where represents the sequence of observations of the variable at , i.e., , where .
By accumulating each time to get , i.e., where is the first-order accumulation sequence of , we get
The matrix form of the MGM(1,m) model is
where
Equation (6) can also be expressed as a first-order differential system.
The time response of the MGM(1,m) model is
where
By discretizing Equation (6), we can get
where
According to the least square method, the parameters can be obtained as
where
We can then get
If , , and satisfy the above conditions,, the response of the MGM(1,m) model is
The predicted value is
3.3. The Rolling MGM(1,m) Model
According the priority principle of new information, rolling prediction is added to MGM(1,m), yielding the RMGM(1,m) model [41].
Given raw data , we use as the sample data to build the MGM(1,m) model, where is the sample size for modeling, is the data sequence that needs to be predicted, and is the total number of data to be predicted.
For , we need to predict the value at n + 1, n + 2, …, n + p, i.e., . is predicted by sequence according to the MGM(1,m) prediction model. Then, we can predict the value of , whereby we remove from the original sequence and add the value of the first prediction. That is, the original sequence of constructing the model becomes , and the predicted value of can then be obtained using the MGM(1,m) prediction model. This continues until we need to predict the value at time n + p, where the original sequence becomes . We can use this sequence to predict the value of , and then the value can be obtained.
The above completes the simulation prediction of , and the obtained prediction value is .
The above is the modeling process of the RMGM(1,m) model.
3.4. The Measurement of Prediction Error
APE and MAPE are often used to evaluate the performance of predictions. In this paper, APE and MAPE were used to test the prediction accuracy of the MGM(1,m) model.
The absolute residual sequence of the original sequences and is
The value of APE is
The value of MAPE is
where
4. The Analytics of Prediction
4.1. Collecting Raw Data and Selecting Variables
The aim of this article is the prediction and analysis of the marine science and technology, marine economy, and employed persons by coastal regions in Guangdong. We selected Guangdong’s marine R&D, employed persons by coastal regions, and the GOP of Guangdong Province to predict the future development trend of Guangdong’s marine technology and marine economy.
Since the government has not released relevant data on marine scientific and technological innovation after 2017, the research period of this paper is from 2011 to 2016. The data sources for this article are the China Science and Technology Statistical Yearbook and China Marine Statistical Yearbook. Table 2 lists the statistics of marine R&D, GOP, and employed persons by coastal regions (EPC) in in Guangdong.
4.2. Modeling Process and Comparison with Alternative Models
Table 3 summarizes the results of using the MGM(1,m) model and the GM(1,1) model to predict Guangdong’s marine R&D, GOP, and employed persons by coastal regions. For the prediction results of the MGM(1,m) model, the prediction error APE was less than 5%, the best prediction result was 0.0067%, and the prediction accuracy was as high as 0.9933%, which shows that the prediction results were excellent. For the prediction results of the GM (1,1) model, most of the prediction errors APE were lower than 5%, but there were individual prediction errors greater than 5%, and the highest prediction error was 5.5421%. Overall, the MGM(1,m) model had a better prediction effect than the GM(1,1) model according to the APE value.
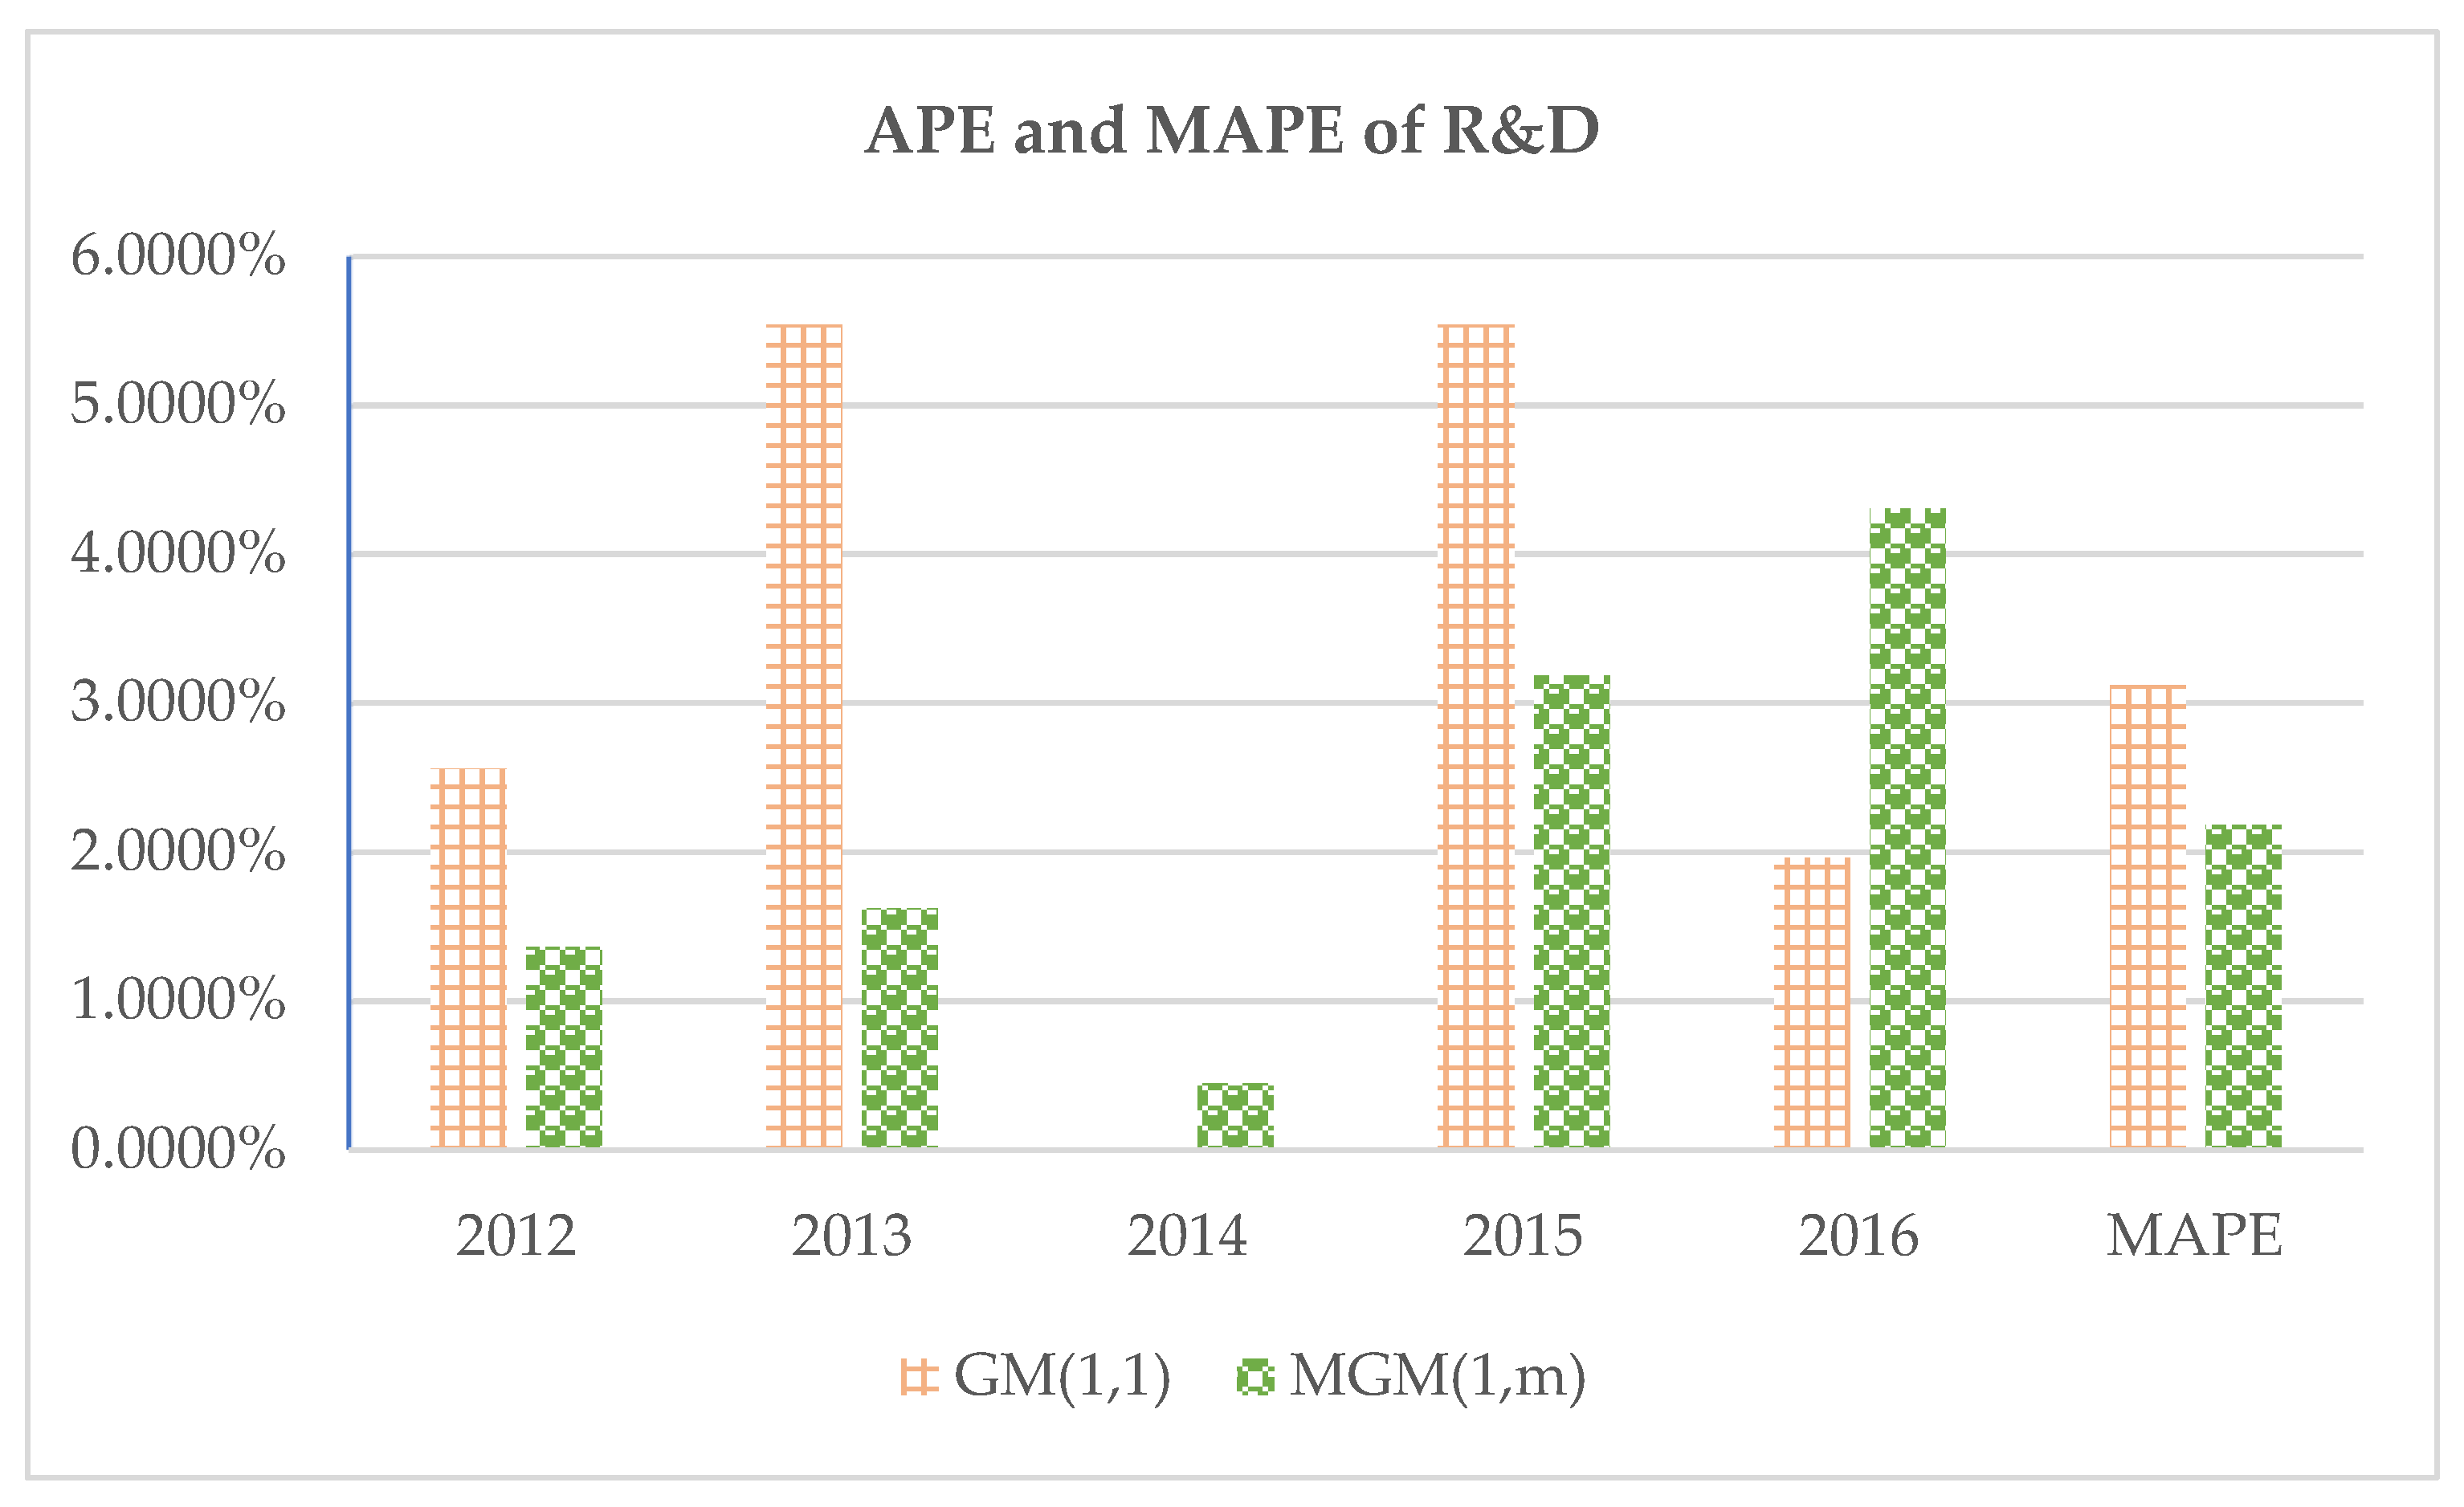
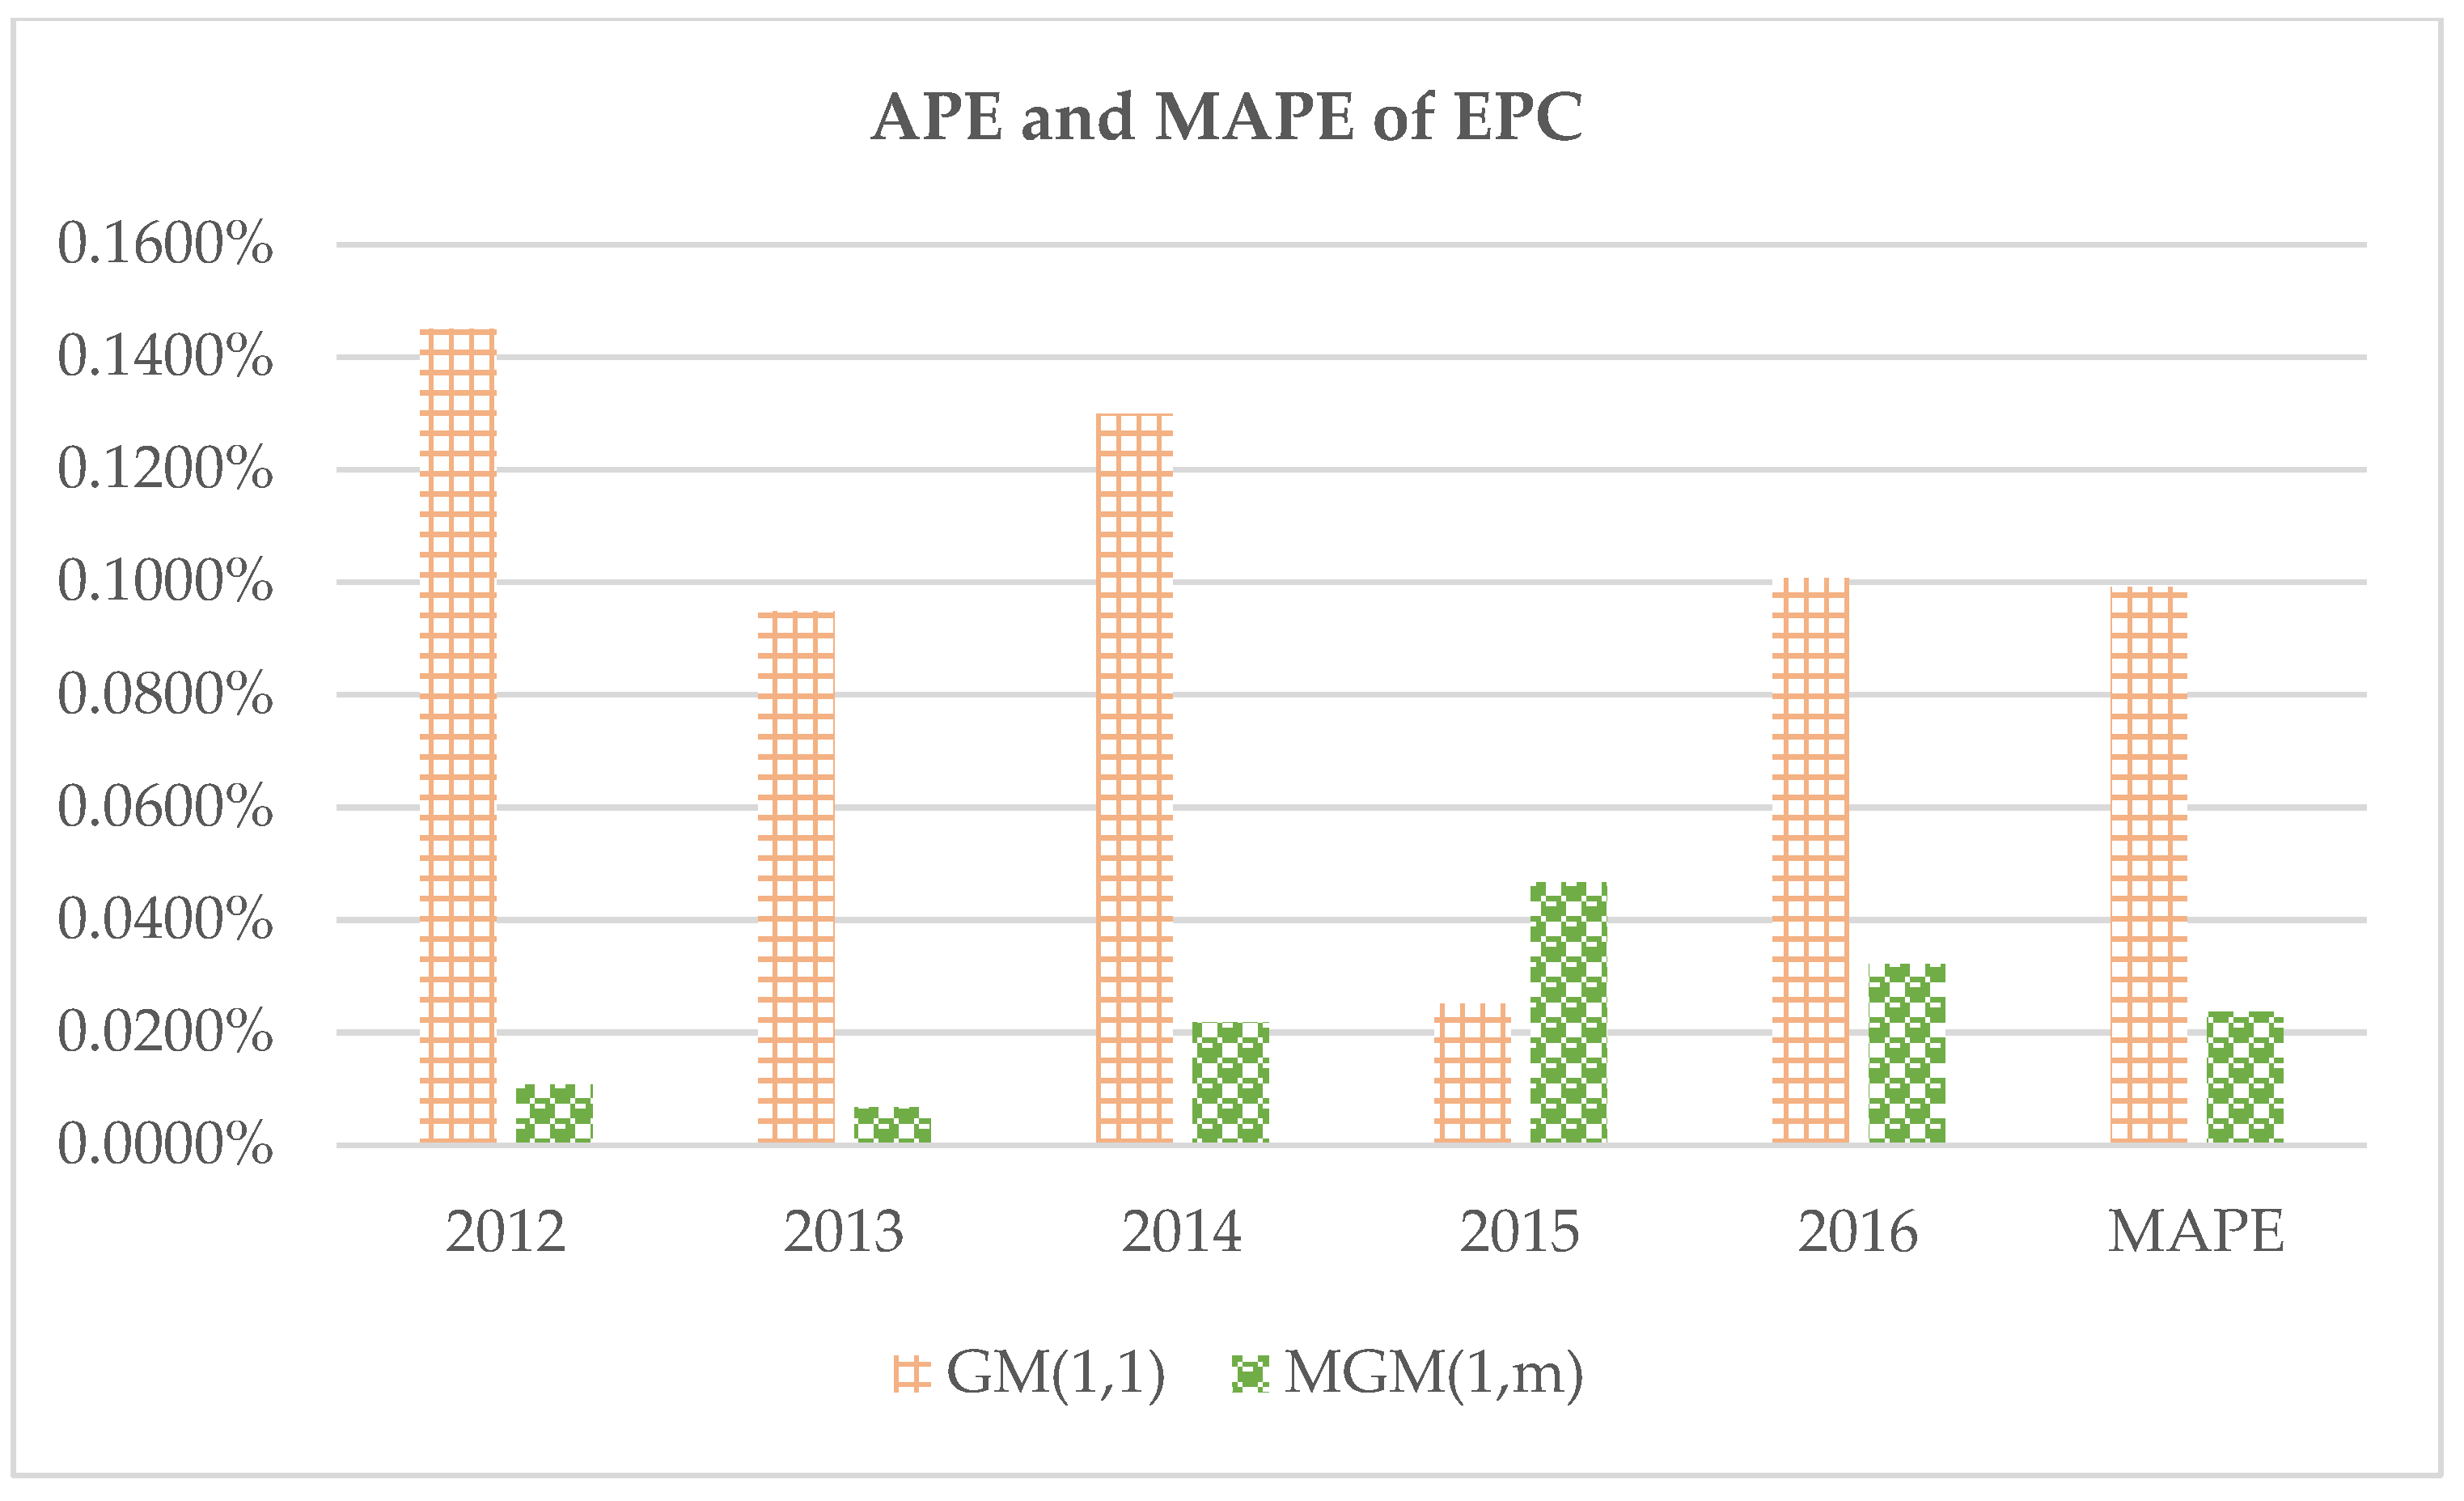
Figure 3 shows the comparison results of the APE and MAPE of Guangdong’s marine R&D between the GM(1,1) model and the MGM(1,m) model. Figure 4 shows the comparison results of the APE and MAPE of the Guangdong’s GOP between the GM(1,1) model and the MGM(1,m) model. Figure 5 shows the comparison results of the APE and MAPE of Guangdong’s EPC by the GM(1,1) model and the MGM(1,m) model. Using the three graphs, the prediction results of the two models can be clearly compared.
The MGM(1,m) model and GM(1,1) model of marine R&D had MAPE values of 2.1833% and 3.1204%, respectively. The prediction error was 0.9371% lower than that of the GM(1,1) model. the values of the MGM(1,m) model and GM(1,1) model for GOP were 1.2871% and 1.3510%, respectively. The prediction error of the value was 0.0639% lower than that of the GM(1,1) model. The values of the MGM(1,m) and GM(1,1) models of EPC were 0.0236% and 0.0991%, respectively. The prediction error for EPC values was 0.0755% lower than that of the GM(1,1) model.
These results show that, compared with the GM(1,1) model, the MGM(1,) model had higher fitting and prediction accuracy, and it was more suitable for forecasting marine science and technology, marine economy, and employed persons by coastal regions in Guangdong.
Due to the lack of sample size of Guangdong’s marine R&D, the entire forecast sample had only 6 years of data; thus, traditional forecasting models such as regression models or ARIMA models could not be used. Only by using the grey model is it possible to predict and analyze the innovation capability of Guangdong’s marine science and technology. From the perspective of data sample size, the validity and applicability of the grey prediction model are further demonstrated.
In summary, according to the APE value and MAPE value of the predicted results, the MGM(1,m) model considering the interaction between variables has higher prediction accuracy than the GM(1,1) model and is more suitable for prediction of marine science and technology innovation systems. Therefore, this paper uses the MGM(1,m) model to predict the marine technological innovation and marine economic development in Guangdong Province. Considering the principle of prioritizing new information, this paper uses the rolling RMGM(1,m) model.
4.3. Future Forecasting
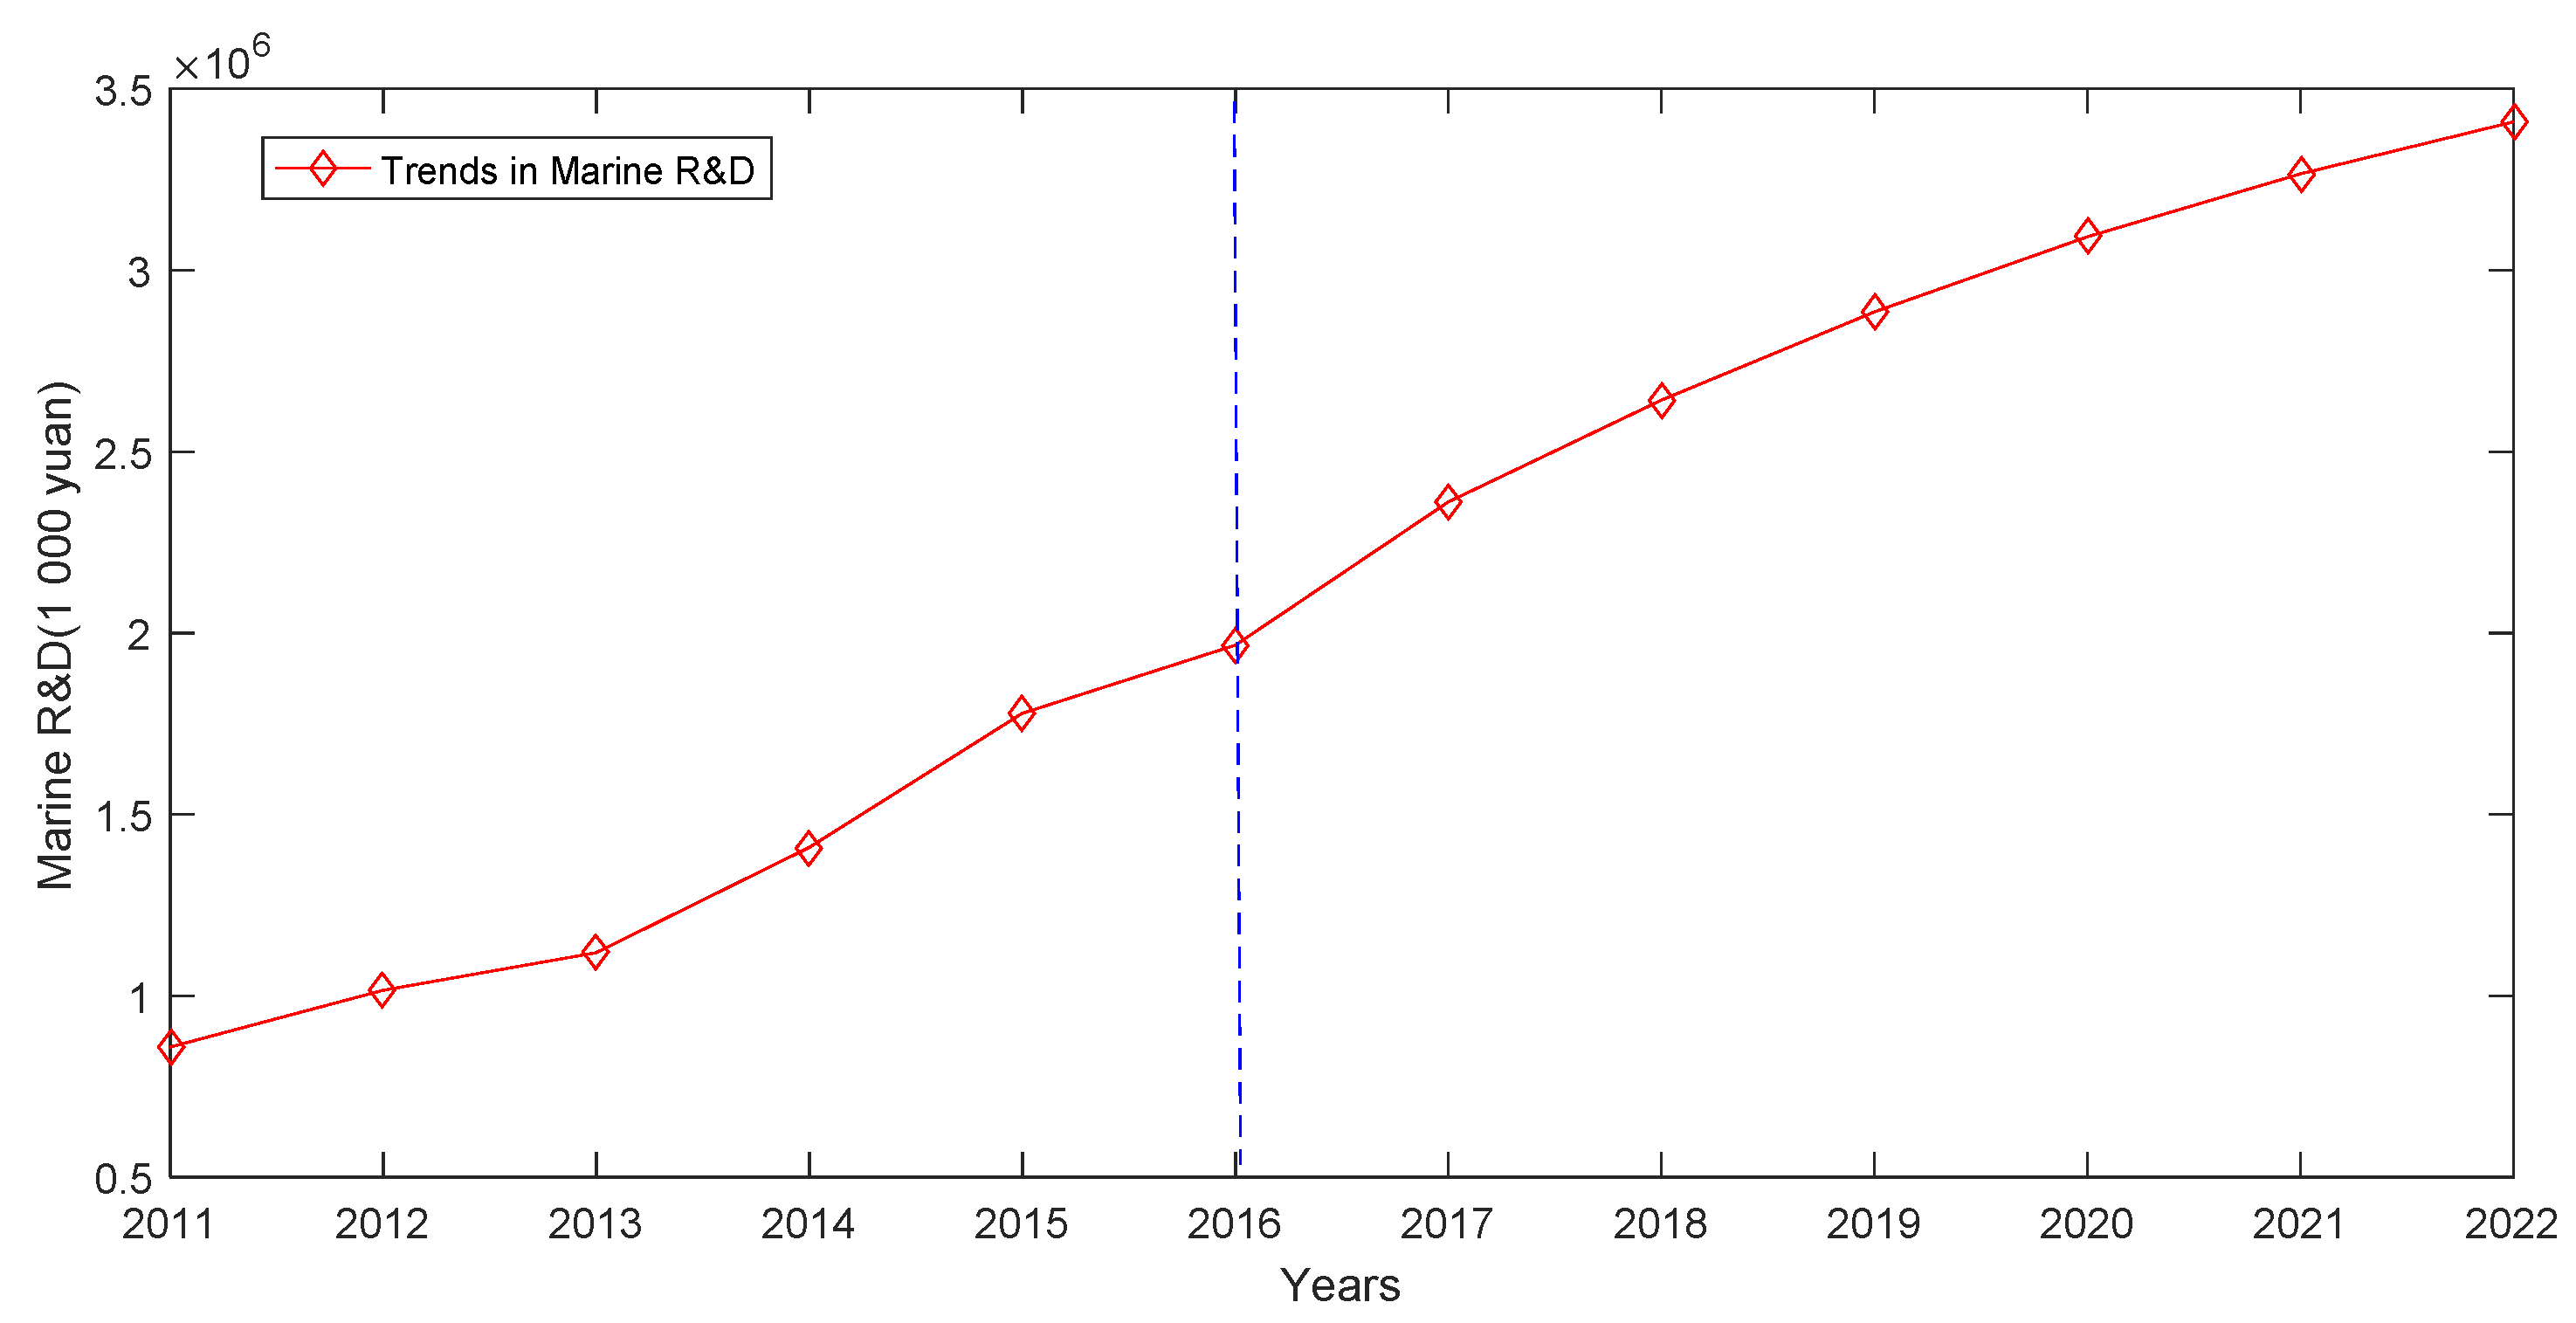
In summary, after comparing the MGM(1,m) model with the GM(1,1) model, we found that the MGM(1,m) model could accurately demonstrate the influence of marine R&D, GOP, and employed persons by coastal regions, and that it had the best and most reliable projecting capability in terms of forecast accuracy. Therefore, we used the RMGM(1,m) model to predict marine R&D, GOP, and employed persons by coastal regions from 2017 to 2022.
From the forecast in Table 4, it can be seen that, from 2017 to 2022, marine R&D, GOP, and employed persons by coastal regions were predicted to maintain an upward trend. A series of policies related to the development of the sea through science and technology issued by China are aimed at further building and improving the national marine science and technology innovation system and improving China’s marine science and technology innovation capabilities. Therefore, it is reasonable for Guangdong’s marine science and technology level to rise steadily. The level of marine science and technology is closely related to the development of the marine economy, which drives the high-quality development of the marine economy.
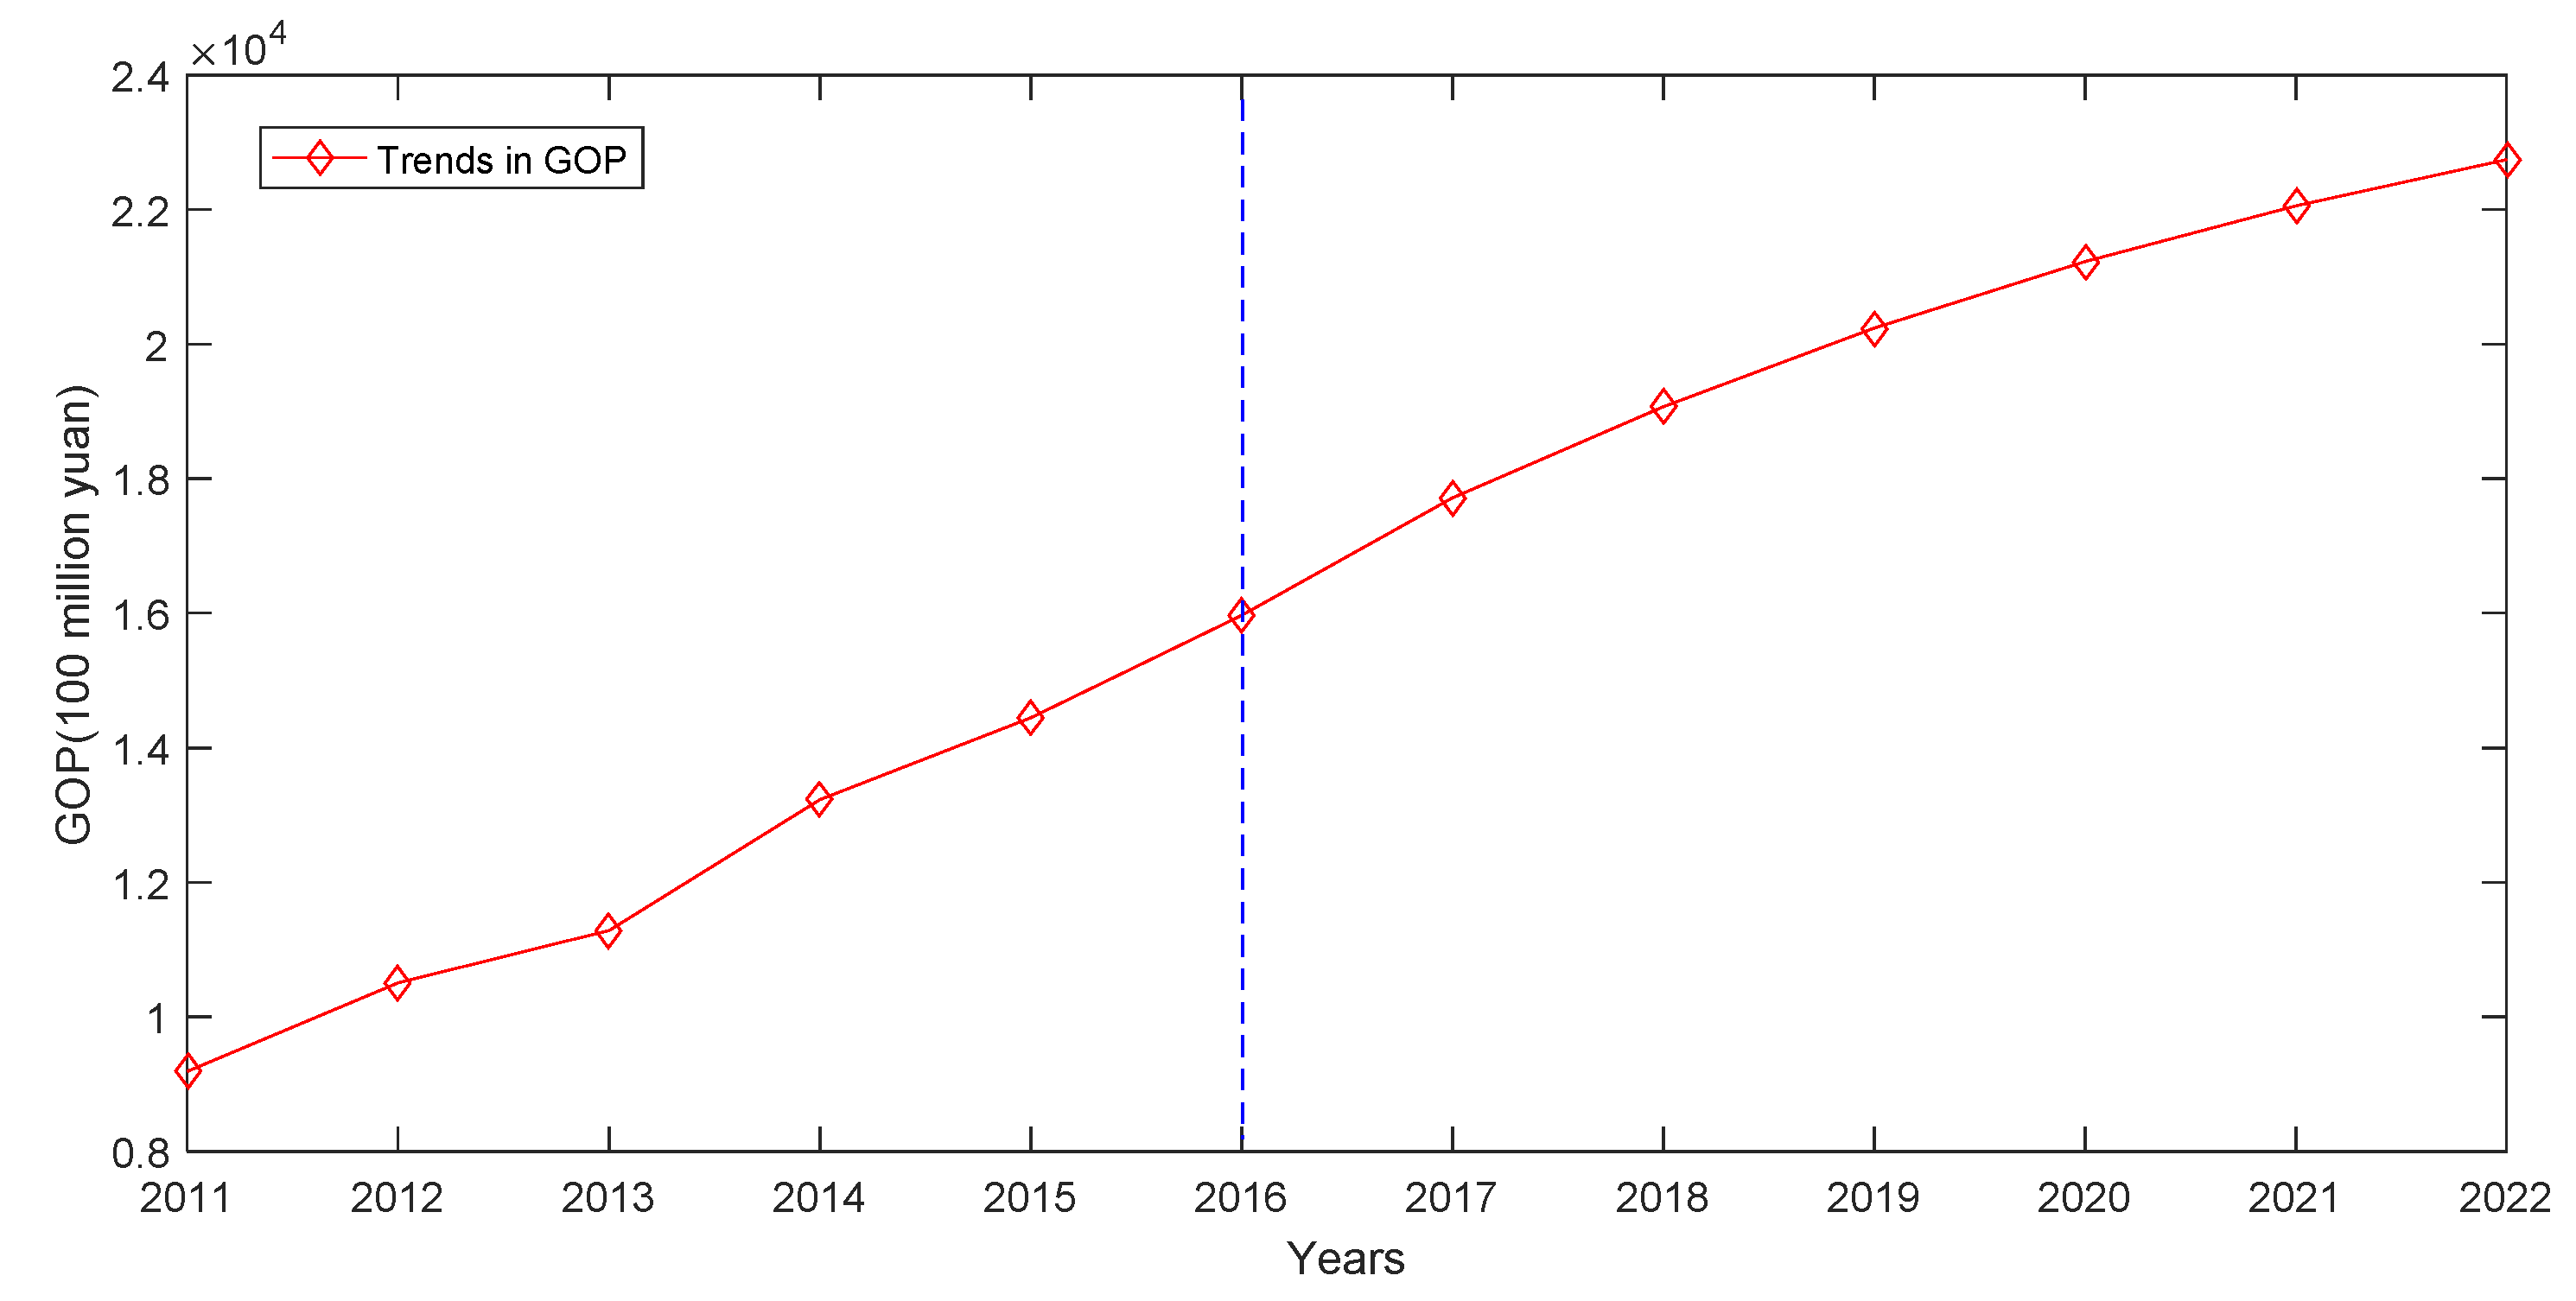
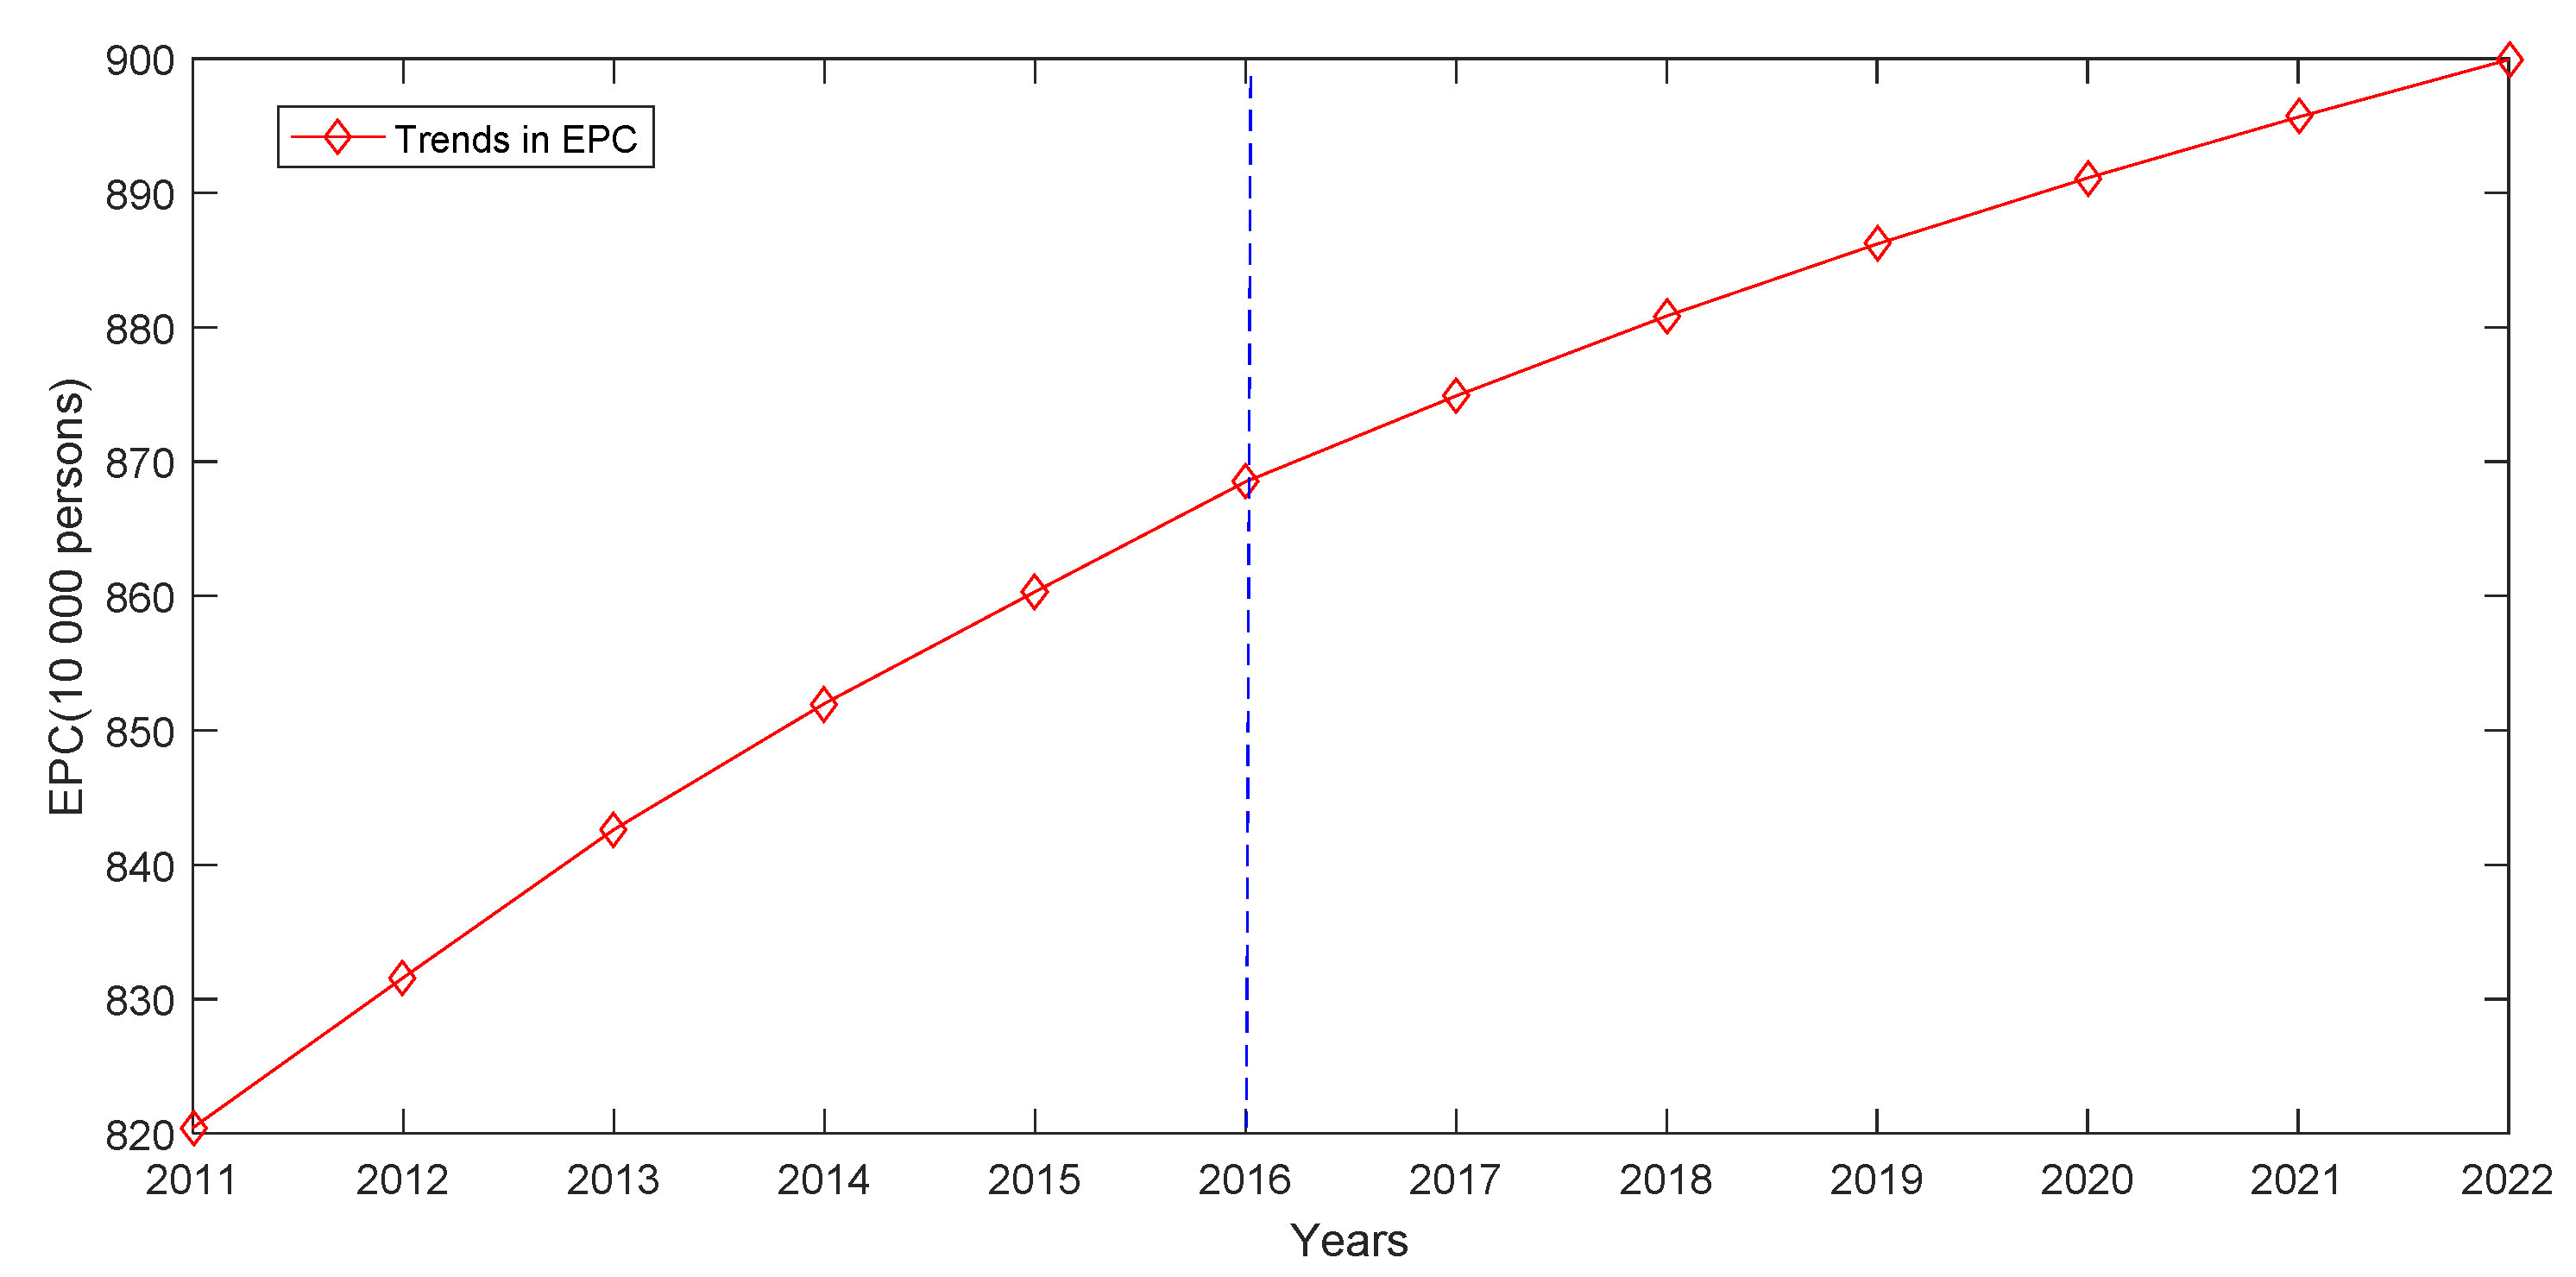
Figure 6 shows the development trend of Guangdong marine R&D predicted in this paper, and Figure 7 shows the development trend of Guangdong’s GOP predicted in this paper. Combining the two development trends, it can be found that the development trends of Guangdong’s marine R&D and GOP are basically the same, and the level of marine scientific and technological innovation is closely related to the development of marine economy. Figure 8 shows the development trend of the number of employed persons by coastal regions in Guangdong. From the perspective of the trend, the growth rate of the sea-related employment in Guangdong is relatively slow.
This paper is optimistic about the future level of marine technological innovation and marine economy in Guangdong. The local government should actively adjust the development direction of the marine industry, devote itself to improving the capability of marine technological innovation, and strengthen the implementation of marine technological innovation policies. This can provide strong scientific and technological support for an in-depth understanding of the ocean, rational development of the ocean, and scientific management of the ocean. In addition, strengthening the construction of marine science and technology innovation can significantly improve the sustainable development capacity of the marine industry and coastal economy.
5. Conclusions and Suggestions
Under the background of China’s comprehensive promotion of marine science and technology innovation capacity building, it is meaningful to study the interactions among marine science and technology innovation capacity, marine economic growth, and employed persons by coastal regions, as well as predict its future development direction and trend. This can promote the close integration of marine technology and marine economy, lead the formation of a new situation for building a powerful marine country, and achieve the goal of high-quality marine development. The improvement of regional marine scientific and technological innovation capabilities and the high-quality development of marine economy are the realistic and major tasks faced by governments at all levels. On this basis, it is very important for us to predict the level of marine science and technology in Guangdong, the development of marine economy, and the employment of marine-related personnel. The research in this paper provides new ideas and methods for future forecasting work in the marine field.
In any predictive analysis, the use of traditional predictive models requires a sufficient sample of data. However, due to insufficient statistical data on marine science and technology in China, traditional prediction models could not be used. Considering the lack of data of marine science and technology, marine economic development, and employed persons by coastal regions in Guangdong and the interactions among the three factors, we used the MGM(1,m) model suitable for small sample analysis and forecasting. According to the experimental results, the MAPE of the RMGM(1,m) for Guangdong’s marine R&D was 2.1833%, for Guangdong’s GOP was 1.2871%, and for Guangdong’s EPC was 0.0236%, which shows that our model performed better than the GM(1,1) model in forecasting performance. Our experimental results proved that the grey multivariate forecasting model has high forecasting accuracy, indicating that the forecasting results are reliable. The results of the model show that, from 2017 to 2022, Guangdong’s marine science and technology innovation level, marine economy, and employed persons by coastal regions were predicted to continue growing; thus, the government needs to rationally view the development trend of marine science and technology innovation, as well as the relationship between the marine economy and employed persons by coastal regions. The government should take comprehensive measures and policies to enhance Guangdong’s marine science and technology innovation capabilities, stabilize employed persons by coastal regions, and speed up the development of the marine economy. Therefore, this paper proposes two policy recommendations.
- (1)
- Increase investment in marine scientific research funds. The investment of marine scientific research funds is the key to maintaining the steady improvement of marine scientific and technological innovation capabilities. From the current point of view, Guangdong’s investment in marine R&D is not strong. In order to further promote the innovative development of the marine industry and accelerate the transformation from a large marine province to a strong marine province, Guangdong needs to continuously increase its investment in marine industry and scientific research, which can fully ensure the smooth progress of marine science and technology innovation activities. In addition, the Guangdong government needs to further support the innovation and development of marine science and technology in terms of scientific research funding and scientific and technological project approval, which can speed up the transformation of scientific research results, and turn input into output as soon as possible.
- (2)
- Increase the training of marine innovative talents. Marine science and technology innovation talents are the foundation of marine science and technology innovation. Guangdong should combine local university platforms to strengthen support for the layout of marine-related majors in colleges and universities, strengthen the construction of marine education and research institutions, and take measures to increase the number of marine-related employment personnel. Talents with certain marine science and technology innovation ability are strong support for the strategy of marine science and technology to revitalize the sea.
Author Contributions
Formal analysis, X.S.; methodology, Y.C.; writing—original draft, X.S.; writing—review and editing, Y.C. All authors have read and agreed to the published version of the manuscript.
Funding
This research was funded by the National Social Science Fund Major Projects of China (14ZDB151).
Institutional Review Board Statement
Not applicable.
Informed Consent Statement
Not applicable.
Data Availability Statement
The data presented in this study are openly available in China Statistical Yearbook of Science and Technology (https://data.cnki.net/yearbook/Single/N2022010277) and China Marine Statistical Yearbook (https://data.cnki.net/Yearbook/Single/N2018090141).
Acknowledgments
Not applicable.
Conflicts of Interest
The authors declare no conflict of interest.
References
- Wang, S.; Lu, B.; Yin, K. Financial development, productivity, and high-quality development of the marine economy. Mar. Policy 2021, 130, 104553. [Google Scholar] [CrossRef]
- Wang, S.; Chen, S.; Zhang, H.; Song, M. The Model of Early Warning for China’s Marine Ecology-Economy Symbiosis Security. Mar. Policy 2021, 128, 104476. [Google Scholar] [CrossRef]
- Zhang, Y.; Wang, S. Influence of marine industrial agglomeration and environmental regulation on marine innovation efficiency—From an innovation value chain perspective. Mar. Policy 2021, 134, 104807. [Google Scholar] [CrossRef]
- Wang, Z.; Huang, H.; Li, J. Strategic Analysis on Marine Development by Reliance on Science and Technology in Guangdong. Strategy Innov. Dev. Sci. Technol. 2021, 5, 71–76. [Google Scholar]
- Wang, Z.; Pei, L.; Ying, H. Time-delayed analysis on the driving effect of R&D investments on the economic growth of China. Stat. Inf. Forum 2011, 26, 49–53. [Google Scholar]
- Romer, P.M. Endogenous technological change. J. Political Econ. 1990, 98, 71–102. [Google Scholar] [CrossRef] [Green Version]
- Aghion, P.; Bloom, N.; Blundell, R.; Griffith, R.; Howitt, P. Competition and innovation: An inverted U relationship. Q. J. Econ. 2005, 120, 701–728. [Google Scholar]
- Galindo, M.-Á.; Méndez, M.T. Entrepreneurship, economic growth, and innovation: Are feedback effects at work? J. Bus. Res. 2014, 67, 825–829. [Google Scholar] [CrossRef]
- Hasan, I.; Tucci, C.L. The innovation-economic growth nexus: Global evidence. Res. Policy 2010, 39, 1264–1276. [Google Scholar] [CrossRef] [Green Version]
- Wei, X.; Hu, Q.; Shen, W.; Ma, J. Influence of the Evolution of Marine Industry Structure on the Green Total Factor Productivity of Marine Economy. Water 2021, 13, 1108. [Google Scholar] [CrossRef]
- Wu, J.; Li, B. Spatio-temporal evolutionary characteristics and type classification of marine economy resilience in China. Ocean. Coast. Manag. 2022, 217, 106016. [Google Scholar] [CrossRef]
- Sun, J.; Miao, J.; Mu, H.; Xu, J.; Zhai, N. Sustainable development in marine economy: Assessing carrying capacity of Shandong province in China. Ocean. Coast. Manag. 2022, 216, 105981. [Google Scholar] [CrossRef]
- Ye, F.; Quan, Y.; He, Y.; Lin, X. The impact of government preferences and environmental regulations on green development of China’s marine economy—ScienceDirect. Environ. Impact Assess. Rev. 2021, 87, 106522. [Google Scholar] [CrossRef]
- Li, X.; Zhou, S.; Yin, K.; Liu, H. Measurement of the high-quality development level of China’s marine economy. Mar. Econ. Manag. 2021, 4, 23–41. [Google Scholar] [CrossRef]
- Xie, Z. Difference of Marine S&T Innovation Level of Coastal Provinces in China and Its Influence on Development of Marine Economy. Sci. Manag. Res. 2014, 32, 76–79. [Google Scholar]
- Sun, C.Z.; Guo, K.M.; Zou, W. The coordination and response between regional marine economy and marine science and technology in China. Resour. Sci. 2017, 39, 2017–2029. [Google Scholar]
- Liu, C.; Cui, W. Competitiveness Evaluation on China Coastal Ocean Science and Technology and Analysis on Influencing Factors. Sci. Technol. Manag. Res. 2016, 36, 55–60. [Google Scholar]
- Shao, Q. Nonlinear effects of marine economic growth and technological innovation on marine pollution: Panel threshold analysis for China’s 11 coastal regions. Mar. Policy 2020, 121, 104110. [Google Scholar] [CrossRef]
- Li, G.; Zhou, Y.; Liu, F.; Tian, A. Regional difference and convergence analysis of marine science and technology innovation efficiency in China—ScienceDirect. Ocean. Coast. Manag. 2021, 205, 105581. [Google Scholar] [CrossRef]
- Wang, L.; Su, M.; Kong, H.; Ma, Y. The impact of marine technological innovation on the upgrade of China’s marine industrial structure. Ocean. Coast. Manag. 2021, 211, 105792. [Google Scholar] [CrossRef]
- Liu, P.; Zhu, B.; Yang, M. Has marine technology innovation promoted the high-quality development of the marine economy?—Evidence from coastal regions in China. Ocean. Coast. Manag. 2021, 209, 105695. [Google Scholar] [CrossRef]
- Lu, Y.; Tang, L.; Li, X. Research on Interprovincial Differences and Driving Factors of China’s Marine Science and Technology Innovation Efficiency. Sci. Technol. Manag. Res. 2020, 40, 59–65. [Google Scholar]
- Garai, A.; Chowdhury, S.; Sarkar, B.; Roy, T.K. Cost-effective subsidy policy for growers and biofuels-plants in closed-loop supply chain of herbs and herbal medicines: An interactive bi-objective optimization in T-environment. Appl. Soft Comput. 2020, 100, 106949. [Google Scholar] [CrossRef]
- Ahmed, W.; Moazzam, M.; Sarkar, B.; Rehman, S.U. Synergic Effect of Reworking for Imperfect Quality Items with the Integration of Multi-Period Delay-in-Payment and Partial Backordering in Global Supply Chains. Engineering 2020, 7, 260–271. [Google Scholar] [CrossRef]
- Deng, J.L. Control problems of Grey systems. Syst. Control Lett. 1982, 1, 288–294. [Google Scholar]
- Pao, H.T.; Fu, H.C.; Tseng, C.L. Forecasting of CO2 emissions, energy consumption and economic growth in China using an improved grey model. Energy 2012, 40, 400–409. [Google Scholar] [CrossRef]
- Wang, Z.-X.; Ye, D.-J. Forecasting Chinese carbon emissions from fossil energy consumption using non-linear grey multivariable models. J. Clean. Prod. 2017, 142, 600–612. [Google Scholar] [CrossRef]
- Mao, M.; Chirwa, E.C. Application of grey model GM (1,1) to vehicle fatality risk estimation. Technol. Forecast. Soc. Chang. 2006, 73, 588–605. [Google Scholar] [CrossRef]
- Hao, Y.; Zhao, J.; Li, H.; Cao, B.; Li, Z.; Yeh, T.C.J. Karst Hydrological Processes and Grey System Model. JAWRA J. Am. Water Resour. Assoc. 2012, 48, 656–666. [Google Scholar] [CrossRef]
- Hao, Y.; Cao, B.; Chen, X.; Yin, J.; Sun, R.; Yeh, T.C.J. A Piecewise Grey System Model for Study the Effects of Anthropogenic Activities on Karst Hydrological Processes. Water Resour. Manag. 2013, 27, 1207–1220. [Google Scholar] [CrossRef]
- Zhao, L.; Dong, Y.; Liu, J. Research on Grey-Catastrophe Model on Predicting Loss in Marine Disaster. J. Tianjin Univ. (Soc. Sci.) 2017, 19, 503–507. [Google Scholar]
- Xuemei, L.; Cao, Y.; Wang, J.; Dang, Y.; Kedong, Y. A summary of grey forecasting and relational models and its applications in marine economics and management. Marine Economics and Management. Mar. Econ. Manag. 2019, 2, 87–113. [Google Scholar] [CrossRef]
- Zhai, J.; Sheng, J.M.; Feng, Y.J. The grey model MGM(1,n) and its application. Syst. Eng.-Theory Pract. 1997, 5, 110–114. [Google Scholar]
- Xiong, P.P.; Dang, Y.G.; Zhu, H. Multivariable MGM(1,m) model based on non-equal spacing. Control. Decis. 2011, 1, 49–53. [Google Scholar]
- Xiong, P.P.; Dang, Y.G.; Wang, Z.X. Optimization of background value of MGM(1,m) model. Control. Decis. 2011, 26, 806–810. [Google Scholar]
- Xiong, P.P.; Dang, Y.G.; Shu, H. Research on characteristics of MGM(1,m) model. Control. Decis. 2012, 27, 389–393. [Google Scholar]
- Zhang, H.; Sha, X.; Wang, Y.; Li, H. Improved MGM(1,m) Model with Optimized Initial and Background Value and Its Application. Stat. Decis. 2020, 36, 15–19. [Google Scholar]
- Dai, J.; Liu, H.; Sun, Y.; Wang, M. An optimization method of multi-variable MGM(1,m) prediction model’s background value. J. Grey Syst. 2018, 30, 221–238. [Google Scholar]
- Wang, H.; Zhao, L.; Hu, M. The Morbidity of Multivariable Grey Model MGM. Int. J. Differ. Equ. 2017, 2017, 2495686. [Google Scholar] [CrossRef] [Green Version]
- Yuan, Z.H.; Guo, F.; Qi, X.X. Fault Prediction Methods Study of Machinery Based on Optimized Background Value MGM(1,m) Model. Appl. Mech. Mater. 2014, 599–601, 1513–1516. [Google Scholar] [CrossRef]
- Wang, C.; Cao, Y. Forecasting Chinese economic growth, energy consumption, and urbanization using two novel grey multivariable forecasting models—ScienceDirect. J. Clean. Prod. 2021, 299, 126863. [Google Scholar] [CrossRef]
- Cao, Y.; Yin, K.; Li, X. Prediction of direct economic loss caused by marine disasters based on the improved GM (1,1) model. J. Grey Syst. 2020, 32, 133–146. [Google Scholar]
- Ding, S.; Dang, Y.G.; Li, X.M.; Wang, J.J.; Zhao, K. Forecasting Chinese CO2 emissions from fuel combustion using a novel grey multivariable model. J. Clean. Prod. 2017, 162, 1527–1538. [Google Scholar] [CrossRef]
Figure 1.
The innovation level science and technology in Guangdong Province. Data source: China Statistical Yearbook of Science and Technology.
Figure 1.
The innovation level science and technology in Guangdong Province. Data source: China Statistical Yearbook of Science and Technology.

Figure 2.
The development level of marine R&D in Guangdong Province. Data source: China Marine Statistical Yearbook.
Figure 2.
The development level of marine R&D in Guangdong Province. Data source: China Marine Statistical Yearbook.

Figure 3.
The values of APE and MAPE for Guangdong’s marine R&D.

Figure 4.
The values of APE and MAPE for Guangdong’s GOP.

Figure 5.
The values of APE and MAPE for Guangdong’s EPC.

Figure 6.
The development trend of Guangdong’s marine R&D.

Figure 7.
The development trend of Guangdong’s GOP.

Figure 8.
The development trend of employed persons by coastal regions in Guangdong.


Table 1.
MAPE criteria.
| MAPE (%) | Forecasting Performance |
|---|---|
| <10 | Excellent |
| 10–20 | Good |
| 20–50 | Reasonable |
| >50 | Incorrect |
Table 2.
Marine R&D, GOP, EPC in Guangdong from 2011 to 2016.
| Year | R&D (1000 CNY) | GOP (100 Million CNY) | EPC (10,000 Persons) |
|---|---|---|---|
| 2011 | 858,228 | 9191.1 | 820.4 |
| 2012 | 1,015,391 | 10,506.6 | 831.6 |
| 2013 | 1,118,513 | 11,283.6 | 842.6 |
| 2014 | 1,408,427 | 13,229.8 | 852 |
| 2015 | 1,778,965 | 14,443.1 | 860.3 |
| 2016 | 1,966,360 | 15,968.4 | 868.5 |
Data source: China Statistical Yearbook of Science and Technology and China Marine Statistical Yearbook.
Table 3.
Prediction results of MGM(1,m) model and GM(1,1) model.
| Year | APE (%) of MGM(1,m) | APE (%) of GM(1,1) | ||||
|---|---|---|---|---|---|---|
| R&D | GOP | EPC | R&D | GOP | EPC | |
| 2012 | 1.3617 | 0.4332 | 0.0107 | 2.5562 | 0.8716 | 0.1450 |
| 2013 | 1.6185 | 1.3526 | 0.0067 | 5.5421 | 2.8063 | 0.0948 |
| 2014 | 0.4455 | 2.4305 | 0.0218 | 0.0028 | 2.3390 | 0.1299 |
| 2015 | 3.1838 | 0.7961 | 0.0467 | 5.5377 | 0.3629 | 0.0251 |
| 2016 | 4.3072 | 1.4230 | 0.0322 | 1.9630 | 0.3754 | 0.1006 |
| MAPE (%) | 2.1833 | 1.2871 | 0.0236 | 3.1204 | 1.3510 | 0.0991 |
Table 4.
The future values of R&D, GOP, and EPC predicted by the RMGM(1,m) model.
| Variable | 2017 | 2018 | 2019 | 2020 | 2021 | 2022 |
|---|---|---|---|---|---|---|
| R&D (1000 CNY) | 2,362,110.381 | 2,642,164.316 | 2,886,021.882 | 3,093,379.101 | 3,266,674.262 | 3,409,696.858 |
| GOP (100 million CNY) | 17,716.04569 | 19,069.40491 | 20,239.88453 | 21,231.75239 | 22,060.14674 | 22,745.17171 |
| EPC (10,000 persons) | 874.8862279 | 880.8407141 | 886.2144171 | 891.1222125 | 895.662112 | 899.9157609 |
Publisher’s Note: MDPI stays neutral with regard to jurisdictional claims in published maps and institutional affiliations. |
© 2022 by the authors. Licensee MDPI, Basel, Switzerland. This article is an open access article distributed under the terms and conditions of the Creative Commons Attribution (CC BY) license (https://creativecommons.org/licenses/by/4.0/).
Share and Cite
MDPI and ACS Style
Shan, X.; Cao, Y. Forecasting Guangdong’s Marine Science and Technology, Marine Economy, and Employed Persons by Coastal Regions—Based on Rolling Grey MGM(1,m) Model. Water 2022, 14, 824. https://doi.org/10.3390/w14050824
AMA Style
Shan X, Cao Y. Forecasting Guangdong’s Marine Science and Technology, Marine Economy, and Employed Persons by Coastal Regions—Based on Rolling Grey MGM(1,m) Model. Water. 2022; 14(5):824. https://doi.org/10.3390/w14050824
Chicago/Turabian StyleShan, Xin, and Yun Cao. 2022. "Forecasting Guangdong’s Marine Science and Technology, Marine Economy, and Employed Persons by Coastal Regions—Based on Rolling Grey MGM(1,m) Model" Water 14, no. 5: 824. https://doi.org/10.3390/w14050824
Note that from the first issue of 2016, this journal uses article numbers instead of page numbers. See further details here.