Article

Role of Ecohydrographical Barriers on the Spatio-Temporal Distribution of Chaetognath Community in the Gulf of Aqaba during Summer

by
Kusum Komal Karati
1,*,†,
Gopinath Vineetha
2,
Reny P. Devassy
3,
Ali M. Al-Aidaroos
3 and
Mohsen M. El-Sherbiny
3,4,*
1
CSIR—National Institute of Oceanography, Regional Centre Kochi, Kochi 682018, India
2
Central Marine Fisheries Research Institute, Kochi 682018, India
3
Department of Marine Biology, Faculty of Marine Science, King Abdulaziz University, Jeddah 21589, Saudi Arabia
4
Department of Marine Sciences, Faculty of Science, Suez Canal University, Ismailia 41522, Egypt
*
Authors to whom correspondence should be addressed.
Present address: Centre for Marine Living Resources and Ecology, Kochi 682508, India.
Water 2022, 14(5), 822; https://doi.org/10.3390/w14050822
Submission received: 18 January 2022 / Revised: 17 February 2022 / Accepted: 4 March 2022 / Published: 6 March 2022
(This article belongs to the Special Issue Zooplankton Diversity in Water Bodies)

Abstract

:
The Gulf of Aqaba (GoA), positioned between the Sinai Peninsula and the Saudi Arabian coast is characterized by its uniquely high saline, oligotrophic waters, and seasonally stratified hydrography. Despite its geographical significance, information on its zooplankton ecology and biodiversity is still meager. Hence, the present study was aimed to investigate the detailed diversity and ecology of the dominant carnivorous zooplankton taxon chaetognath in the pelagic waters of the GoA during summer. Despite the known water flow exchange between the GoA and the Red Sea, only five chaetognath species were observed in GoA which is markedly less than the number earlier recorded in the Red Sea, indicating the role of high saline water mass as an ecophysiological boundary for the inhabitance of many epipelagic chaetognaths. Euryhaline, Serratosagitta pacifica formed the dominant species in both the surface water and the upper 200 m water column and was observed to be the most suitable representative of this high saline environment. Conspicuous diel variability in the distribution of the different growth stages of chaetognaths in the surface waters can be attributed to their varied susceptibility to visually oriented predators. The positive relation observed in the abundance of chaetognaths and their main prey, copepods, and their carbon and nitrogen contents indicated their significance in the pelagic trophic ecology of the GoA. The present study, providing the ecology of a major zooplankton taxon of this unique basin will be relevant for understanding the ecology and trophodynamics of the zooplankton community of the GoA.

1. Introduction

Chaetognath is a major carnivorous zooplankton taxon representing 8–27% of the zooplankton community of the Gulf of Aqaba [1]. Copepods being their major prey, chaetognaths form a crucial trophic link between the primary consumers and the higher trophic levels in the pelagic realm [2,3,4]. The species-specific sensitivity of chaetognaths to the hydrographic attributes makes their distribution and community structure unique in the major ocean basins and their marginal seas [5,6]. Furthermore, the association of various chaetognath species to distinct water masses, based on their preferences and tolerance limits, makes them ideal indicators of water masses and current systems in the world ocean [7,8]. Hence, comprehensive studies pertaining to their diversity, ecology, behavioral patterns, and trophodynamics draw significant research attention while elucidating the ecology, and biogeography of the oceanic regions [9]. Chaetognaths are also known to exhibit normal diel vertical migration, which provides them with many adaptive benefits [10,11]. Hence, along with their spatial distribution, assessment of the diel changes in their habitat is valuable for a detailed understanding of the ecology of any marine system [12,13].
The Gulf of Aqaba (GoA) geographically located between the Sinai (Et Tih) desert and the western Arabian (An Nefud) desert is part of the Syrian–African rift valley. It is connected with the northern Red Sea by a shallow sill (~250 m) at the Strait of Tiran. The Gulf is 180 km long with an average width of 15 km and is located in an extremely arid zone with scanty rainfall. The surface water exhibits high temperature during summer (~26 °C) and low during winter (~21 °C, [14]). The high evaporation rate exceeding the average rainfall (average net evaporation of 1 cm day−1, [15]) makes GoA one of the saltiest ocean basins in the global ocean (salinity > 40, [14,16]. Moreover, the inflow of the less dense Red Sea water into GoA and the return flow of the dense GoA water to the Red Sea makes the hydrography and biological processes of the GoA much more complex [17].
The unique characteristics, such as the oligotrophic high salinity waters and the pronounced seasonality in the stratification of the water column of the GoA, have drawn research attention not only on the physical and chemical attributes of this semi-enclosed basin [18,19,20,21], but also on its biotic components especially the phytoplankton community, their seasonal succession patterns, and interactions with the hydrography of the GoA [22,23,24,25]. In the case of the zooplankton community of the GoA, studies pertaining to their abundance, distribution, and diversity [26,27,28,29] as well as information on the dominant zooplankton taxon, copepods are available [30,31,32]. However, knowledge pertaining to the major carnivorous zooplankton taxon chaetognath from GoA is scanty and is mostly restricted to the studies on their abundance and percentage contribution to the total zooplankton population [1,26].
To fill the lacunae in the understanding of the zooplankton ecology of this unique ocean basin in the world ocean, the present study was aimed to understand the diversity of the chaetognath community of GoA, and also to identify the hydrographic and biotic attributes structuring their distribution, abundance, and community structure. To achieve our aim, both the surface community (horizontal hauling, 0.5–1 m depth) and the chaetognath community structure in the upper 200 m (vertical hauling, 200–0 m depth) of GoA were examined and correlated with biotic and abiotic variables. A detailed evaluation was also carried out on their maturity stage-wise distribution based on their ovarian development, their diel behavior, and trophic position to have a better insight on the critical role they have in the pelagic ecology of the GoA during summer.

2. Materials and Methods
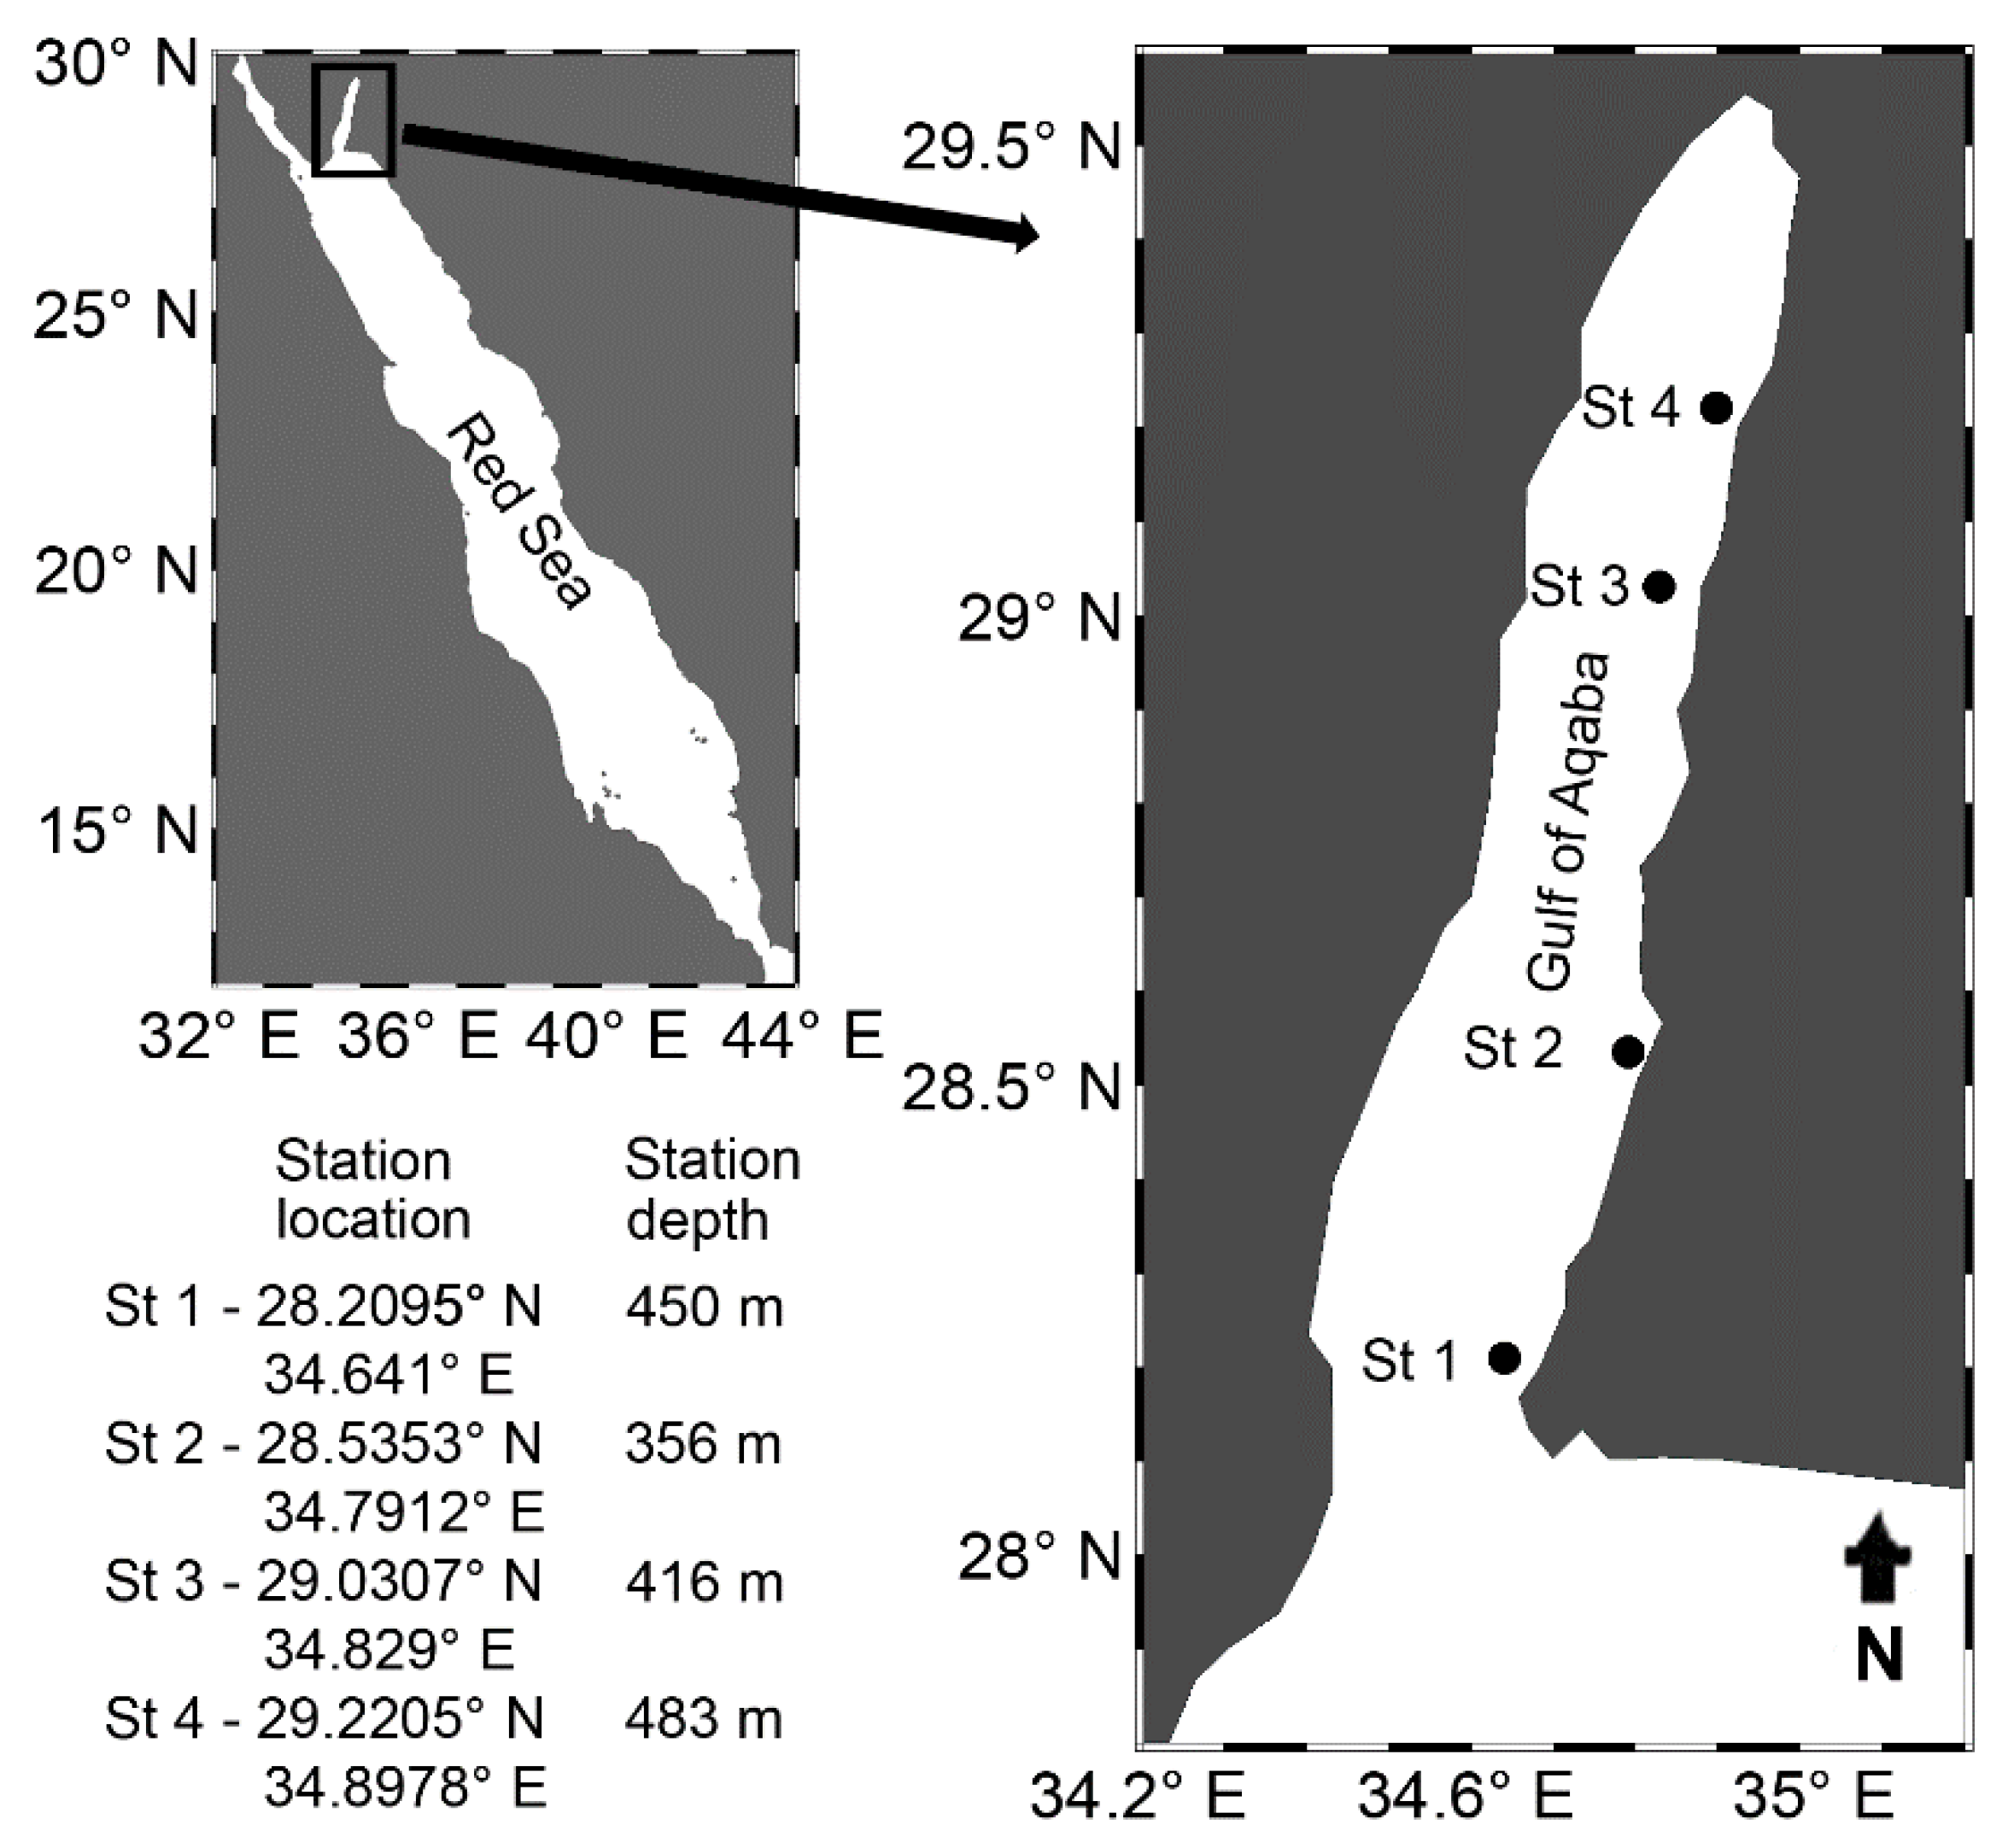
2.1. Collections

The study is based on the samples collected in the Saudi Arabian coastal water of GoA (Figure 1) during the summer (18th to 25th August 2016) onboard RV Al Azizi. In the high saline GoA salinity gradually increases towards the north but with a minor spatial variation (<1 psu). Hence to have better coverage of the total length of the gulf (180 km), sampling was conducted at four locations, each separated at a distance of 35–40 km (Figure 1).
An SBE 911 conductivity, temperature, and depth profiler (CTD, Sea-Bird Electronics, Bellevue, WA, USA) was deployed to obtain the vertical profiles of temperature and salinity. The instrument was operated down to 200 m depth at each station. The potential density (σt) was computed from the pressure, temperature, and salinity values obtained from the CTD. The SBE 43 dissolved oxygen (DO) sensor in the CTD helped to obtain the DO profiles of the water column.
For estimating the phytoplankton biomass (chlorophyll a), water samples were collected from six depths (0, 10, 25, 70, 100, and 200 m) using a carousel deck unit of Niskin rosette samplers (SBE 33). At each depth, 6–10 L of water was filtered through a Whatman GF/F filter paper (pore size 0.7 μm). Later the chlorophyll a was estimated using a UV Spectrophotometer (Shimadzu, UV-1700, Kyoto, Japan) following the standard procedures [33]. The depth-wise distribution of chlorophyll a was integrated to obtain the phytoplankton biomass of the water column following [34] as,
Column chlorophyll a (mg m−2) = [(d1d0) (a0 + a1)/2 + (d2d1) (a1 + a2)/2 +……]
where, d0, d1, d2, etc., are depths sampled and a0, a1, a2 are the respective chlorophyll a values.
Zooplankton samples were collected with two different methods. First, for the surface sampling, the Hydrobios net (mesh size 150 µm) was hauled horizontally just below the surface for 15–20 min, and the volume of water filtered through the net was measured using a digital flowmeter mounted at the center of the net entrance [35]. Second, to estimate the zooplankton distribution in the vertical water column, a Hydrobios vertical plankton net (mesh size 180 µm) was hauled from 200 m depth to the surface. The digital flow meter helped to estimate the amount of water filtered. In both cases, the sampling was carried out during both day (between 10 a.m. and 12 noon) and night (between 10 p.m. and 12 midnight). Thus, a total of 4 samples were collected for each sampling locations. As many zooplankton, including chaetognaths, often avoid the upper surface water especially during day, the surface sampling helped to understand their diel variation in their abundance in the upper water, whereas the vertical sampling (0–200 m) helped to evaluate the total chaetognath community in the 200 m water column. After the collection, samples were immediately preserved in absolute ethanol for detailed taxonomical studies. Copepods and chaetognaths were sorted and enumerated, and the detailed taxonomic identification of the chaetognath species was carried out following the standard identification protocols [36,37,38]. Based on ovarian development, the individual chaetognaths were categorized into 3 maturity stages [39,40]. The stage I or immature specimens with no visible ovaries, stage II or maturing individuals with developing ova, and stage III or matured individuals with one or more matured ova.
In marine ecosystems, zooplankton plays a vital role in transferring the macronutrients like carbon (C) and nitrogen (N) from primary producers to higher trophic levels. As copepod is considered to be the major prey of chaetognath [4], for estimating the trophic link between the copepods and chaetognaths, their C and N content per unit volume of water were estimated as per the elemental analysis data of zooplankton in the Red Sea by [41]. Based on the published information of copepod species composition and abundance during this study [29], the dry weight of different copepod genera was first estimated using the information in table 2 in [42]. Then, based on the genus-specific percentage contribution of C and N in the dry weight [42], their C and N content was estimated. The addition of the C and N content of all individual genera helped to estimate the total C and N content of the copepod community per unit volume of water. For chaetognaths, the C and N content per unit volume of water was carried out in a similar manner. The ratio (in the percentage format) of both the C and N content of the chaetognath and copepod communities was used as a proxy of the trophic link between these zooplankton taxa.

2.2. Data Analyses

The variation in the chaetognath abundances along the diel scale was analyzed using a t-test (95% confidence intervals and two-tailed p values, Graphpad prism version 5.01) for both horizontal and vertical sampling. In addition, the t-test was also done to assess the variation in chaetognath abundance between the horizontal and vertical sampling.
The relationship between the abundance of copepods and chaetognaths was estimated using the Pearson correlation with 95% confidence intervals and two-tailed p values. The correlation was carried out separately for the day and night samples of the horizontal and vertical hauling. The species evenness (J′) was calculated as J = H ln ( S ) (H′ is Shannon Weiner diversity and S is the total number of species) using PRIMER 6 to assess how well distributed the chaetognath community is among the sampling locations [43].
A non-metric multi-dimensional scaling (n-MDS) analysis was carried out for both vertical and surface samplings to identify the similarity in the community structure of chaetognaths along with the sampling locations during the day and night period. The n-MDS plot was based on the Bray–Curtis similarity of the fourth root abundance of the species of chaetognaths using PRIMER 6, as the fourth root transformation was found to be suitable to achieve the Gaussian distribution of the abundance data. The plot was overlayed with cluster based on 70% similarity.
Multivariate Canonical Correspondence Analysis (CCA) was carried out to elucidate the relationship between the chaetognath species and their environment. Monte Carlo simulation was simultaneously done to understand the statistical significance of the CCA plot. As the habitat preferences of organisms are often a unimodal function of the dependent variables, the constrained CCA is the best suitable to describe their interrelationship, as the CCA plot gives a better visualization of their preferred environment [44]. To achieve the output from the 200 m water column, the abundance data of the vertical sampling of the copepods and chaetognaths were used. As the zooplankton samples were collected during both day and night periods, the average abundance data was used for the analysis. In the case of each abiotic variable, the average value of the 200 m water column for each location was calculated and used for the analysis.

3. Results

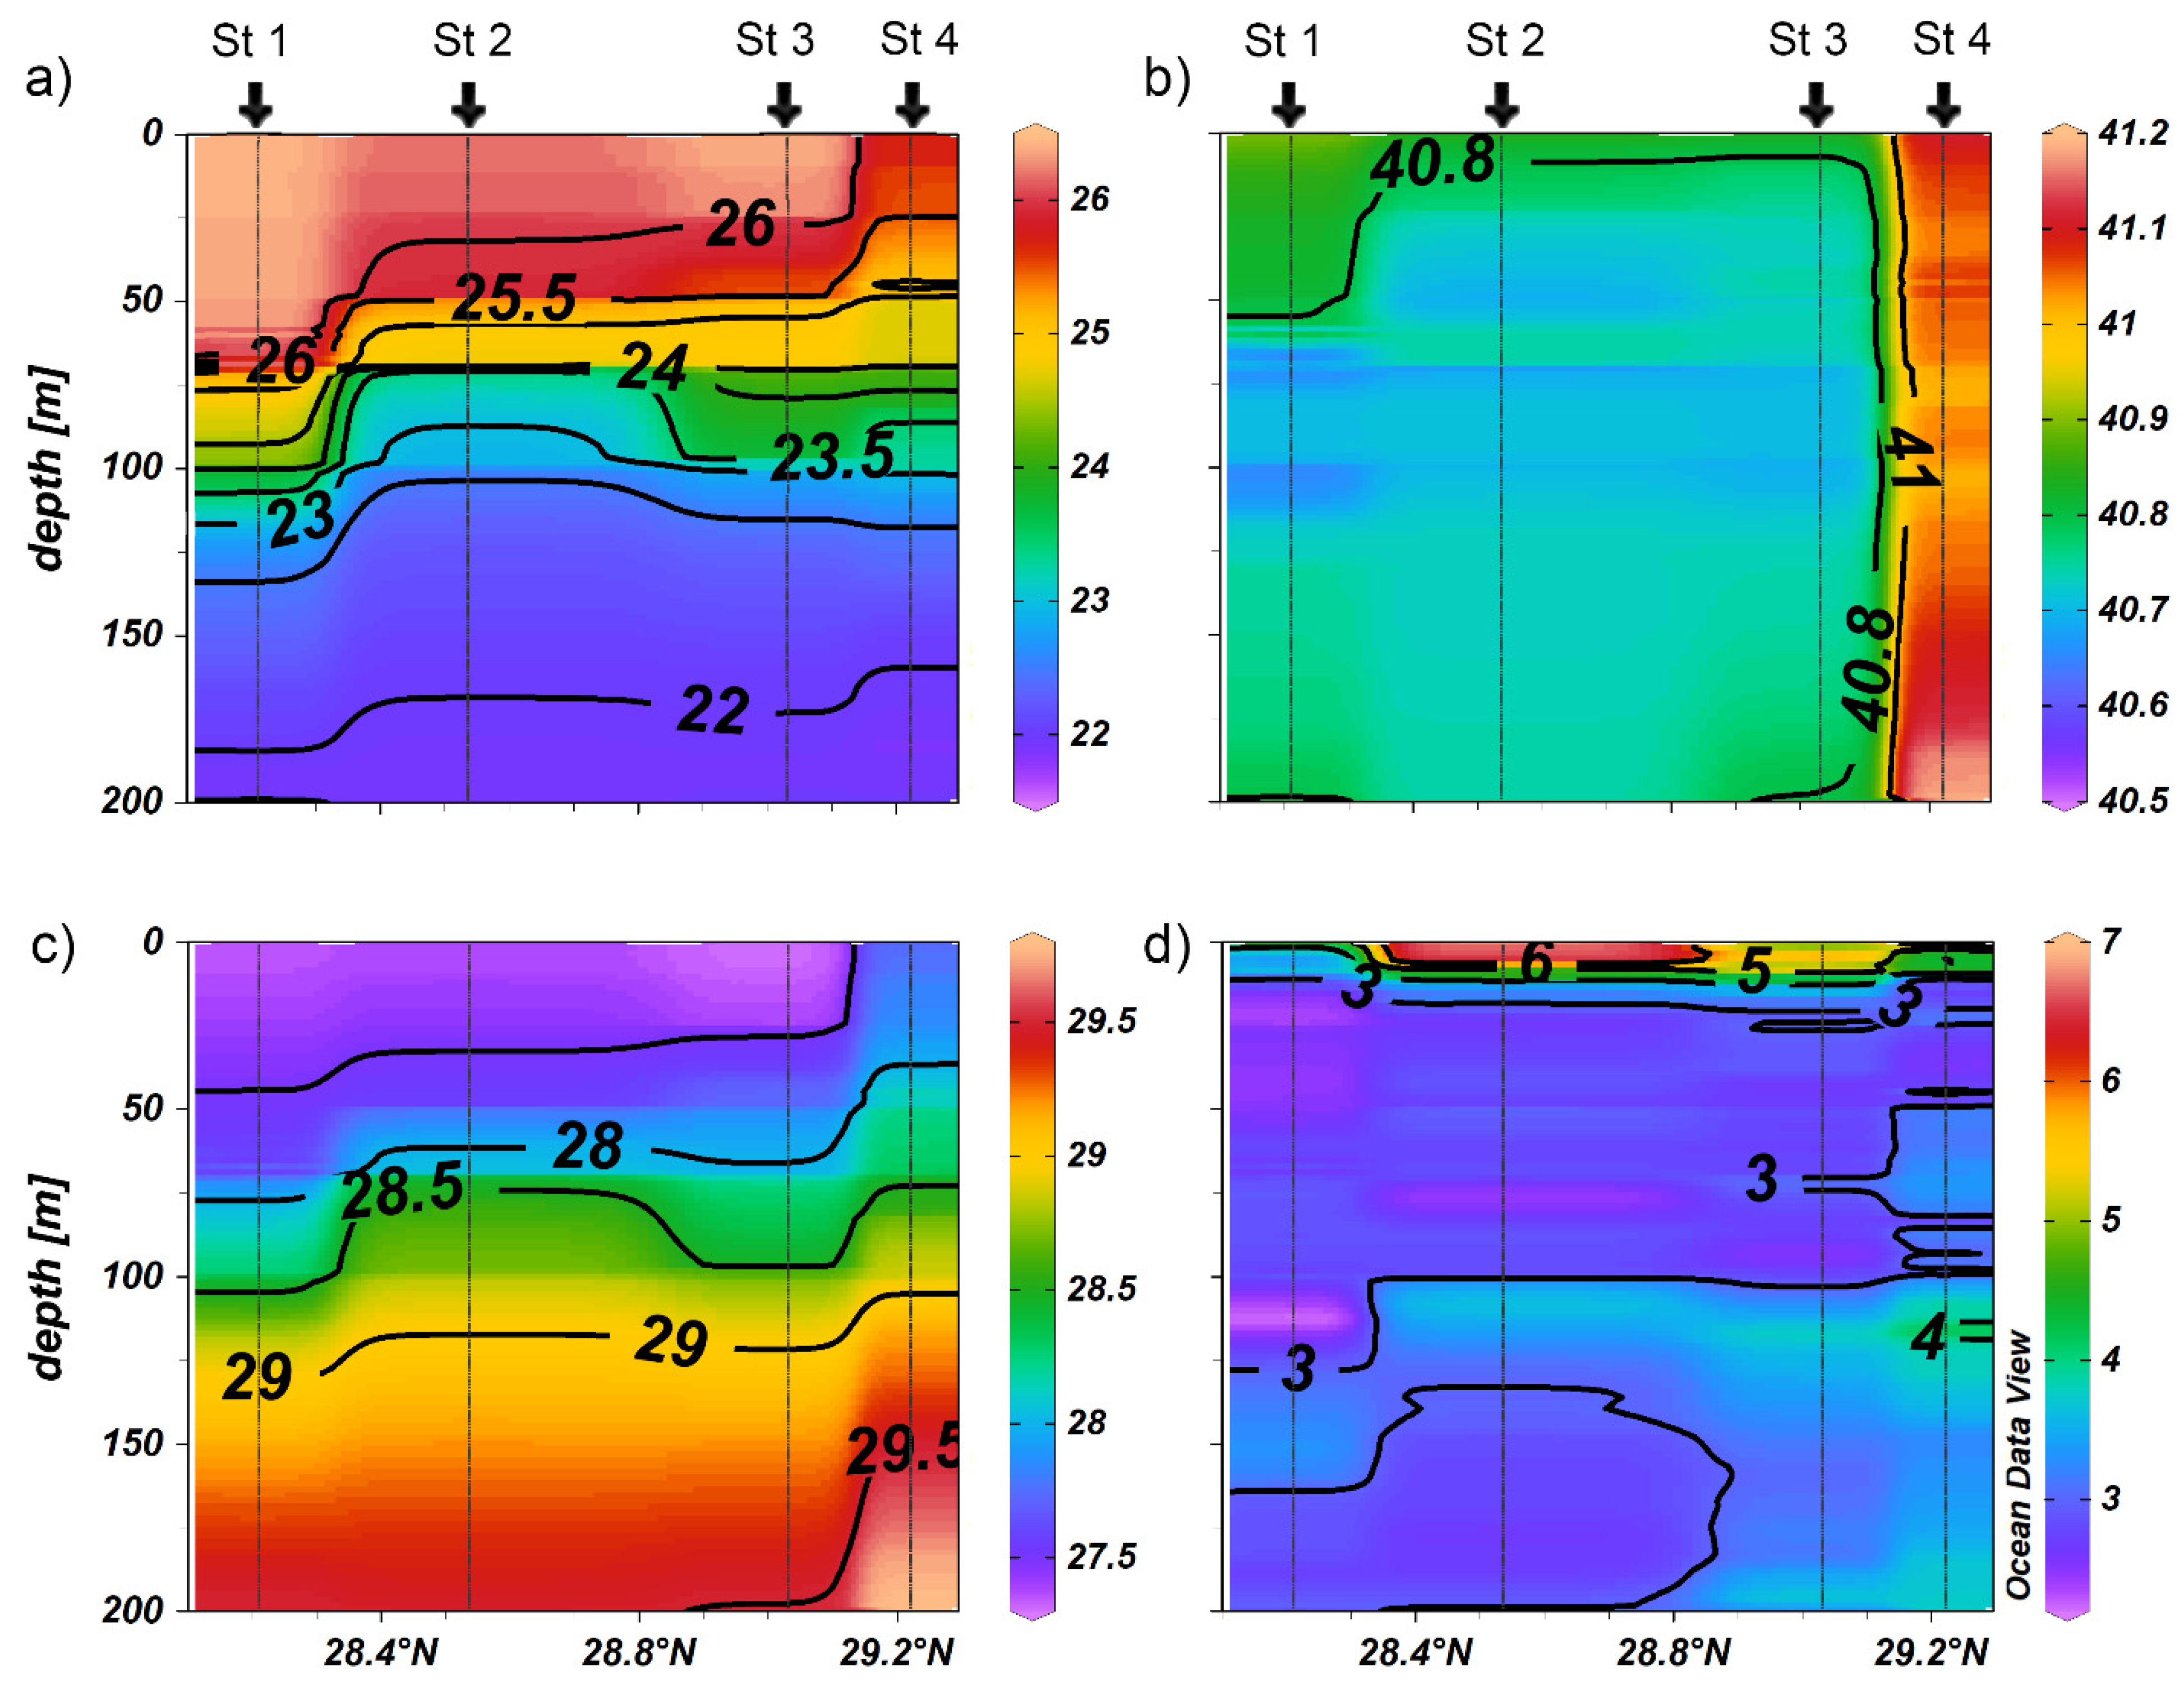
3.1. Physico-Chemical Environment

Sea surface temperature (1 m) ranged between 25.6 °C and 26.4 °C and had a decreasing trend towards the north (Figure 2a). The gradient in the vertical water temperature was prominent, especially up to the 100–125 m depth. There was an uplifting of the isolines of temperature from 50 m depth towards the surface at St 4. The sea surface salinity also exhibited marginal latitudinal variation with higher salinity towards the north (41.1 at St 4). The vertical profile of salinity exhibited near-homogeneous high saline water (salinity > 40.6) in the 200 m water column (Figure 2b). Similar to the sea surface temperature, the potential density of the surface water gradually increased towards the north (Figure 2c). However, unlike temperature, along the vertical scale, the potential density gradually increased towards the depth with a prominent gradient up to 100–125 m. An uplifting of the isolines of density was observed at St 4. The surface DO varied between 4.5 and 6.8 mL L−1 (average ± SD: 5.8 ± 1.2 mL L−1, N = 4). Although there was a sharp gradient in DO just below the surface, the DO never reached below 2.2 mL L−1 in the 200 m water column (Figure 2d).

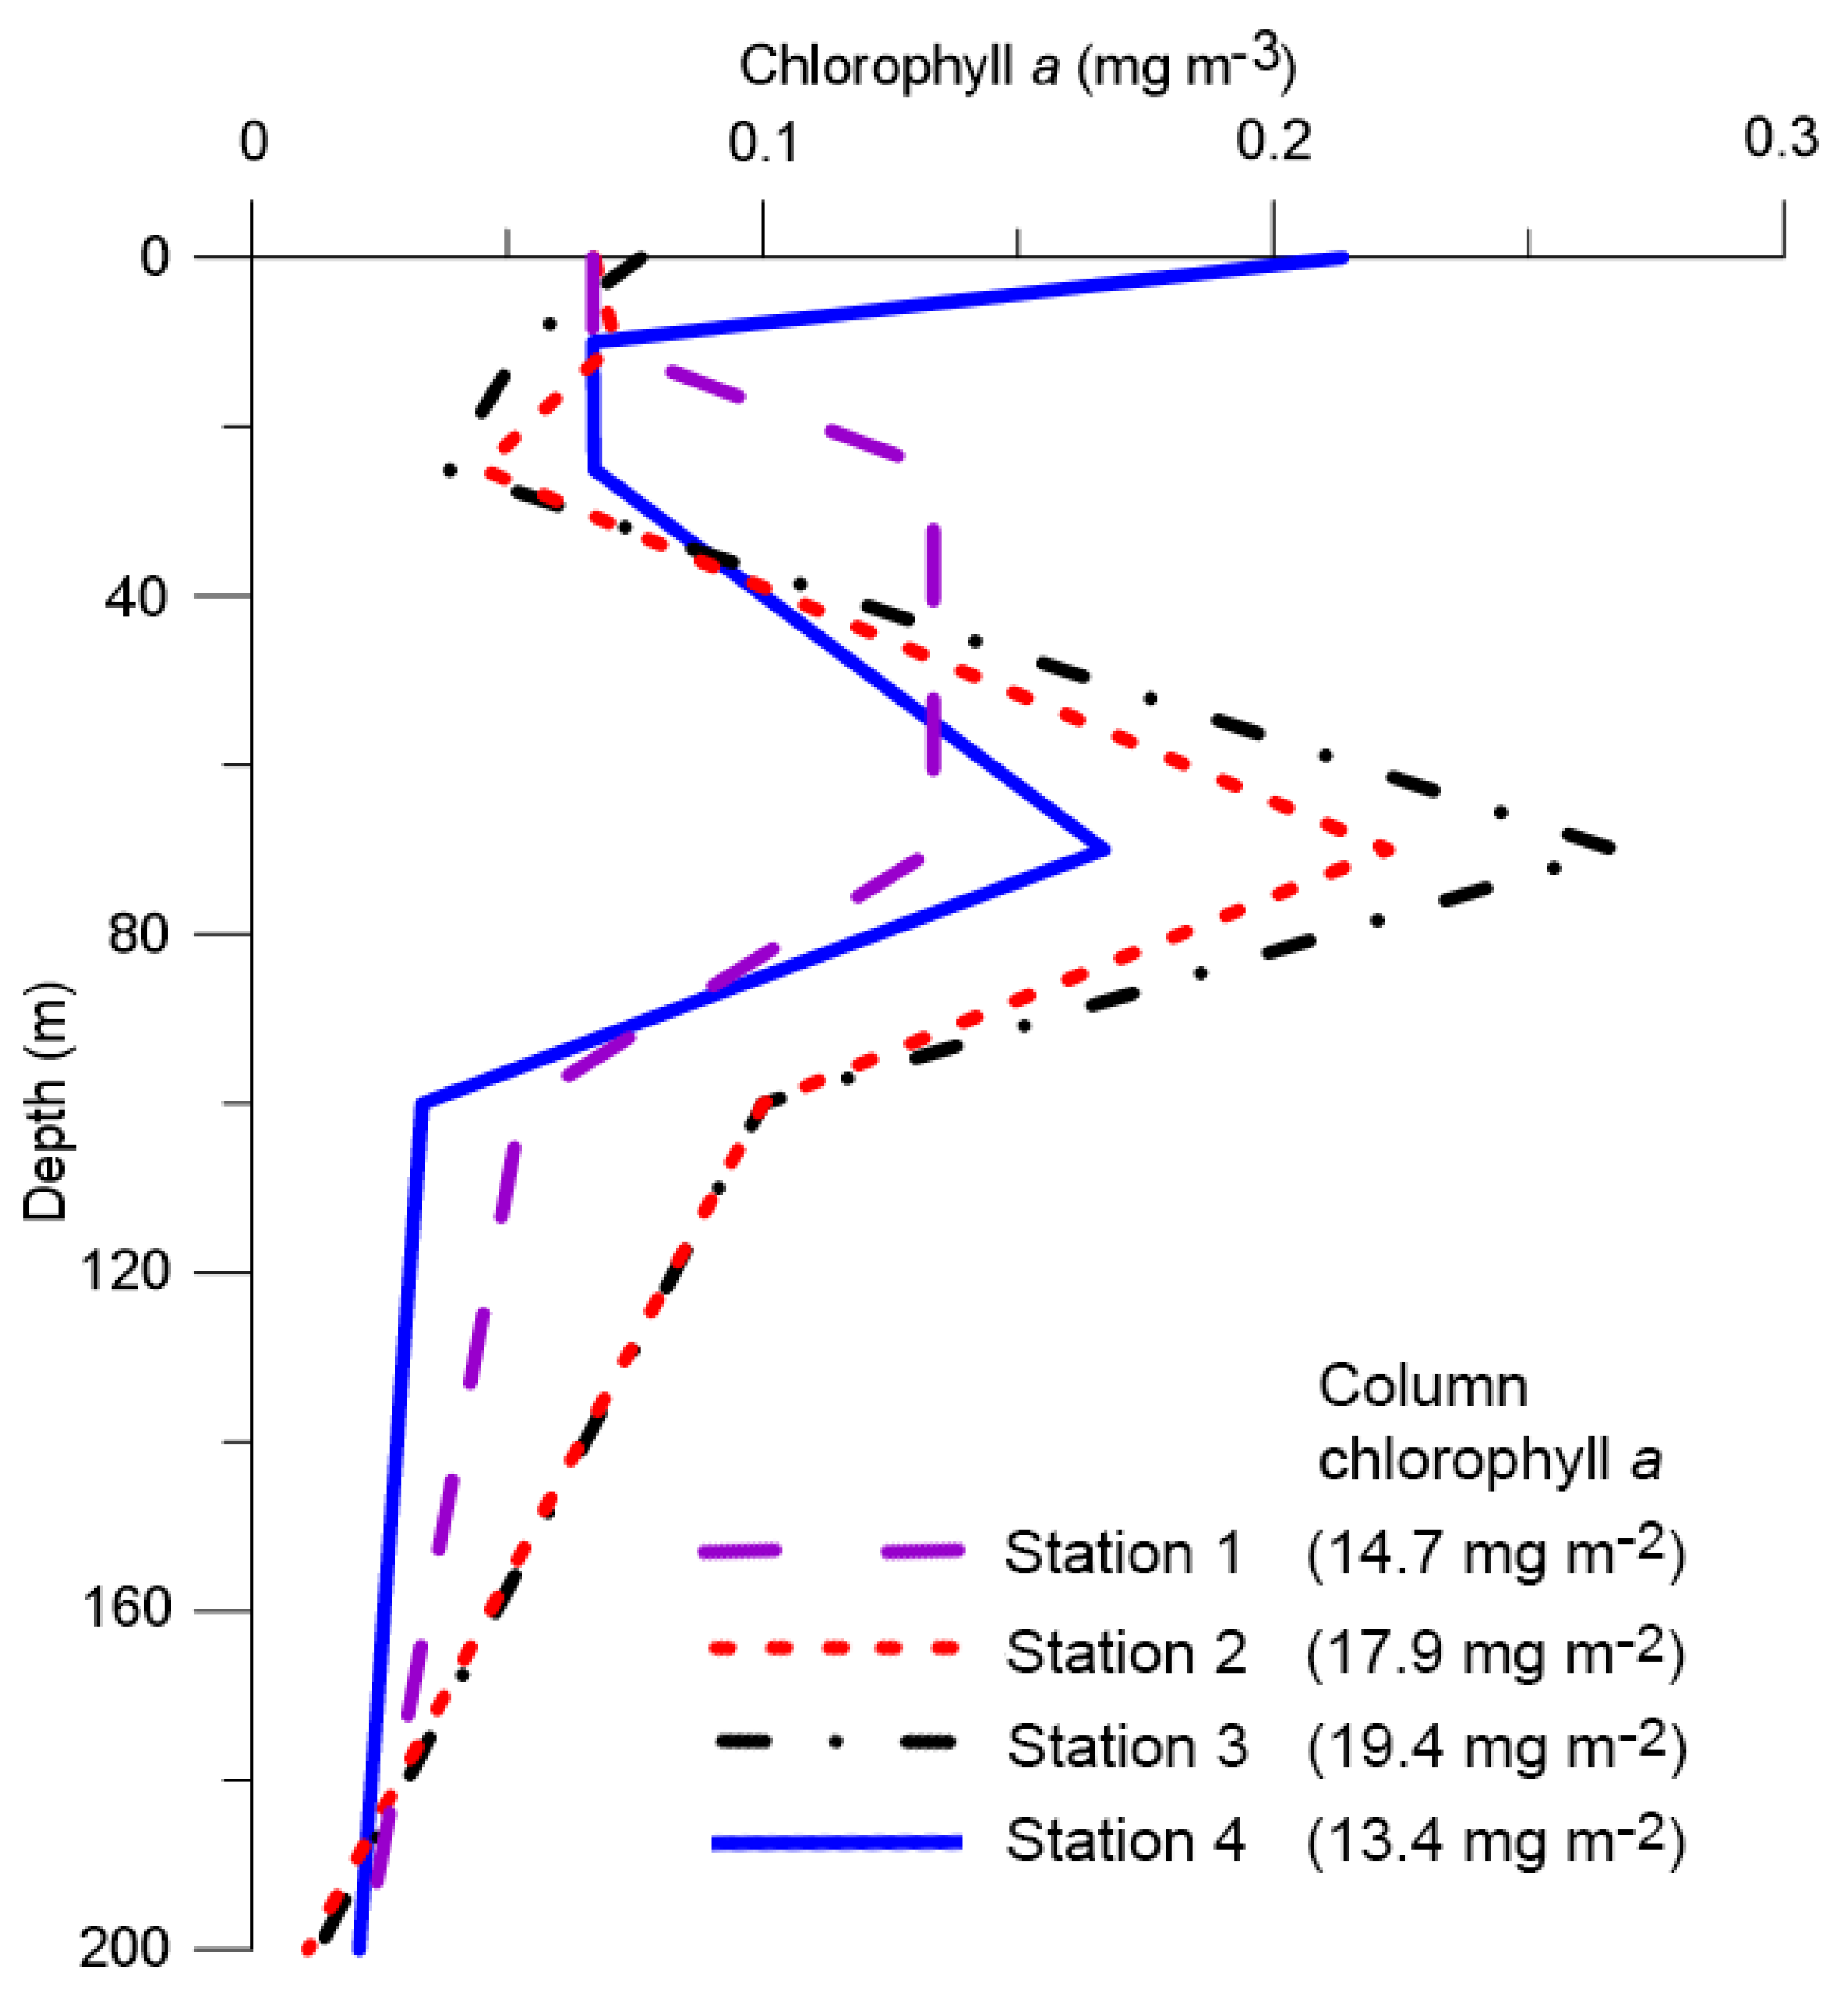
3.2. Phytoplankton Biomass (Chlorophyll a)

Surface chlorophyll a varied between 0.07 and 0.21 mg m−3 (average: 0.11 ± 0.07 mg m−3, N = 4) with the highest biomass in the northernmost location (St 4, Figure 3). In the vertical profile, the subsurface chlorophyll a maxima were observed at 70 m depth in most of the sampling locations with a maximum value of 0.27 mg m−3 at St 3 (Figure 3). The column chlorophyll a in the upper 200 m water column ranged between 13.4 and 19.4 mg m−2 (average: 16.4 ± 2.8 mg m−2, N = 4). Although the surface chlorophyll a was higher at St 4, the column chlorophyll a was higher at St 3 (Figure 3).

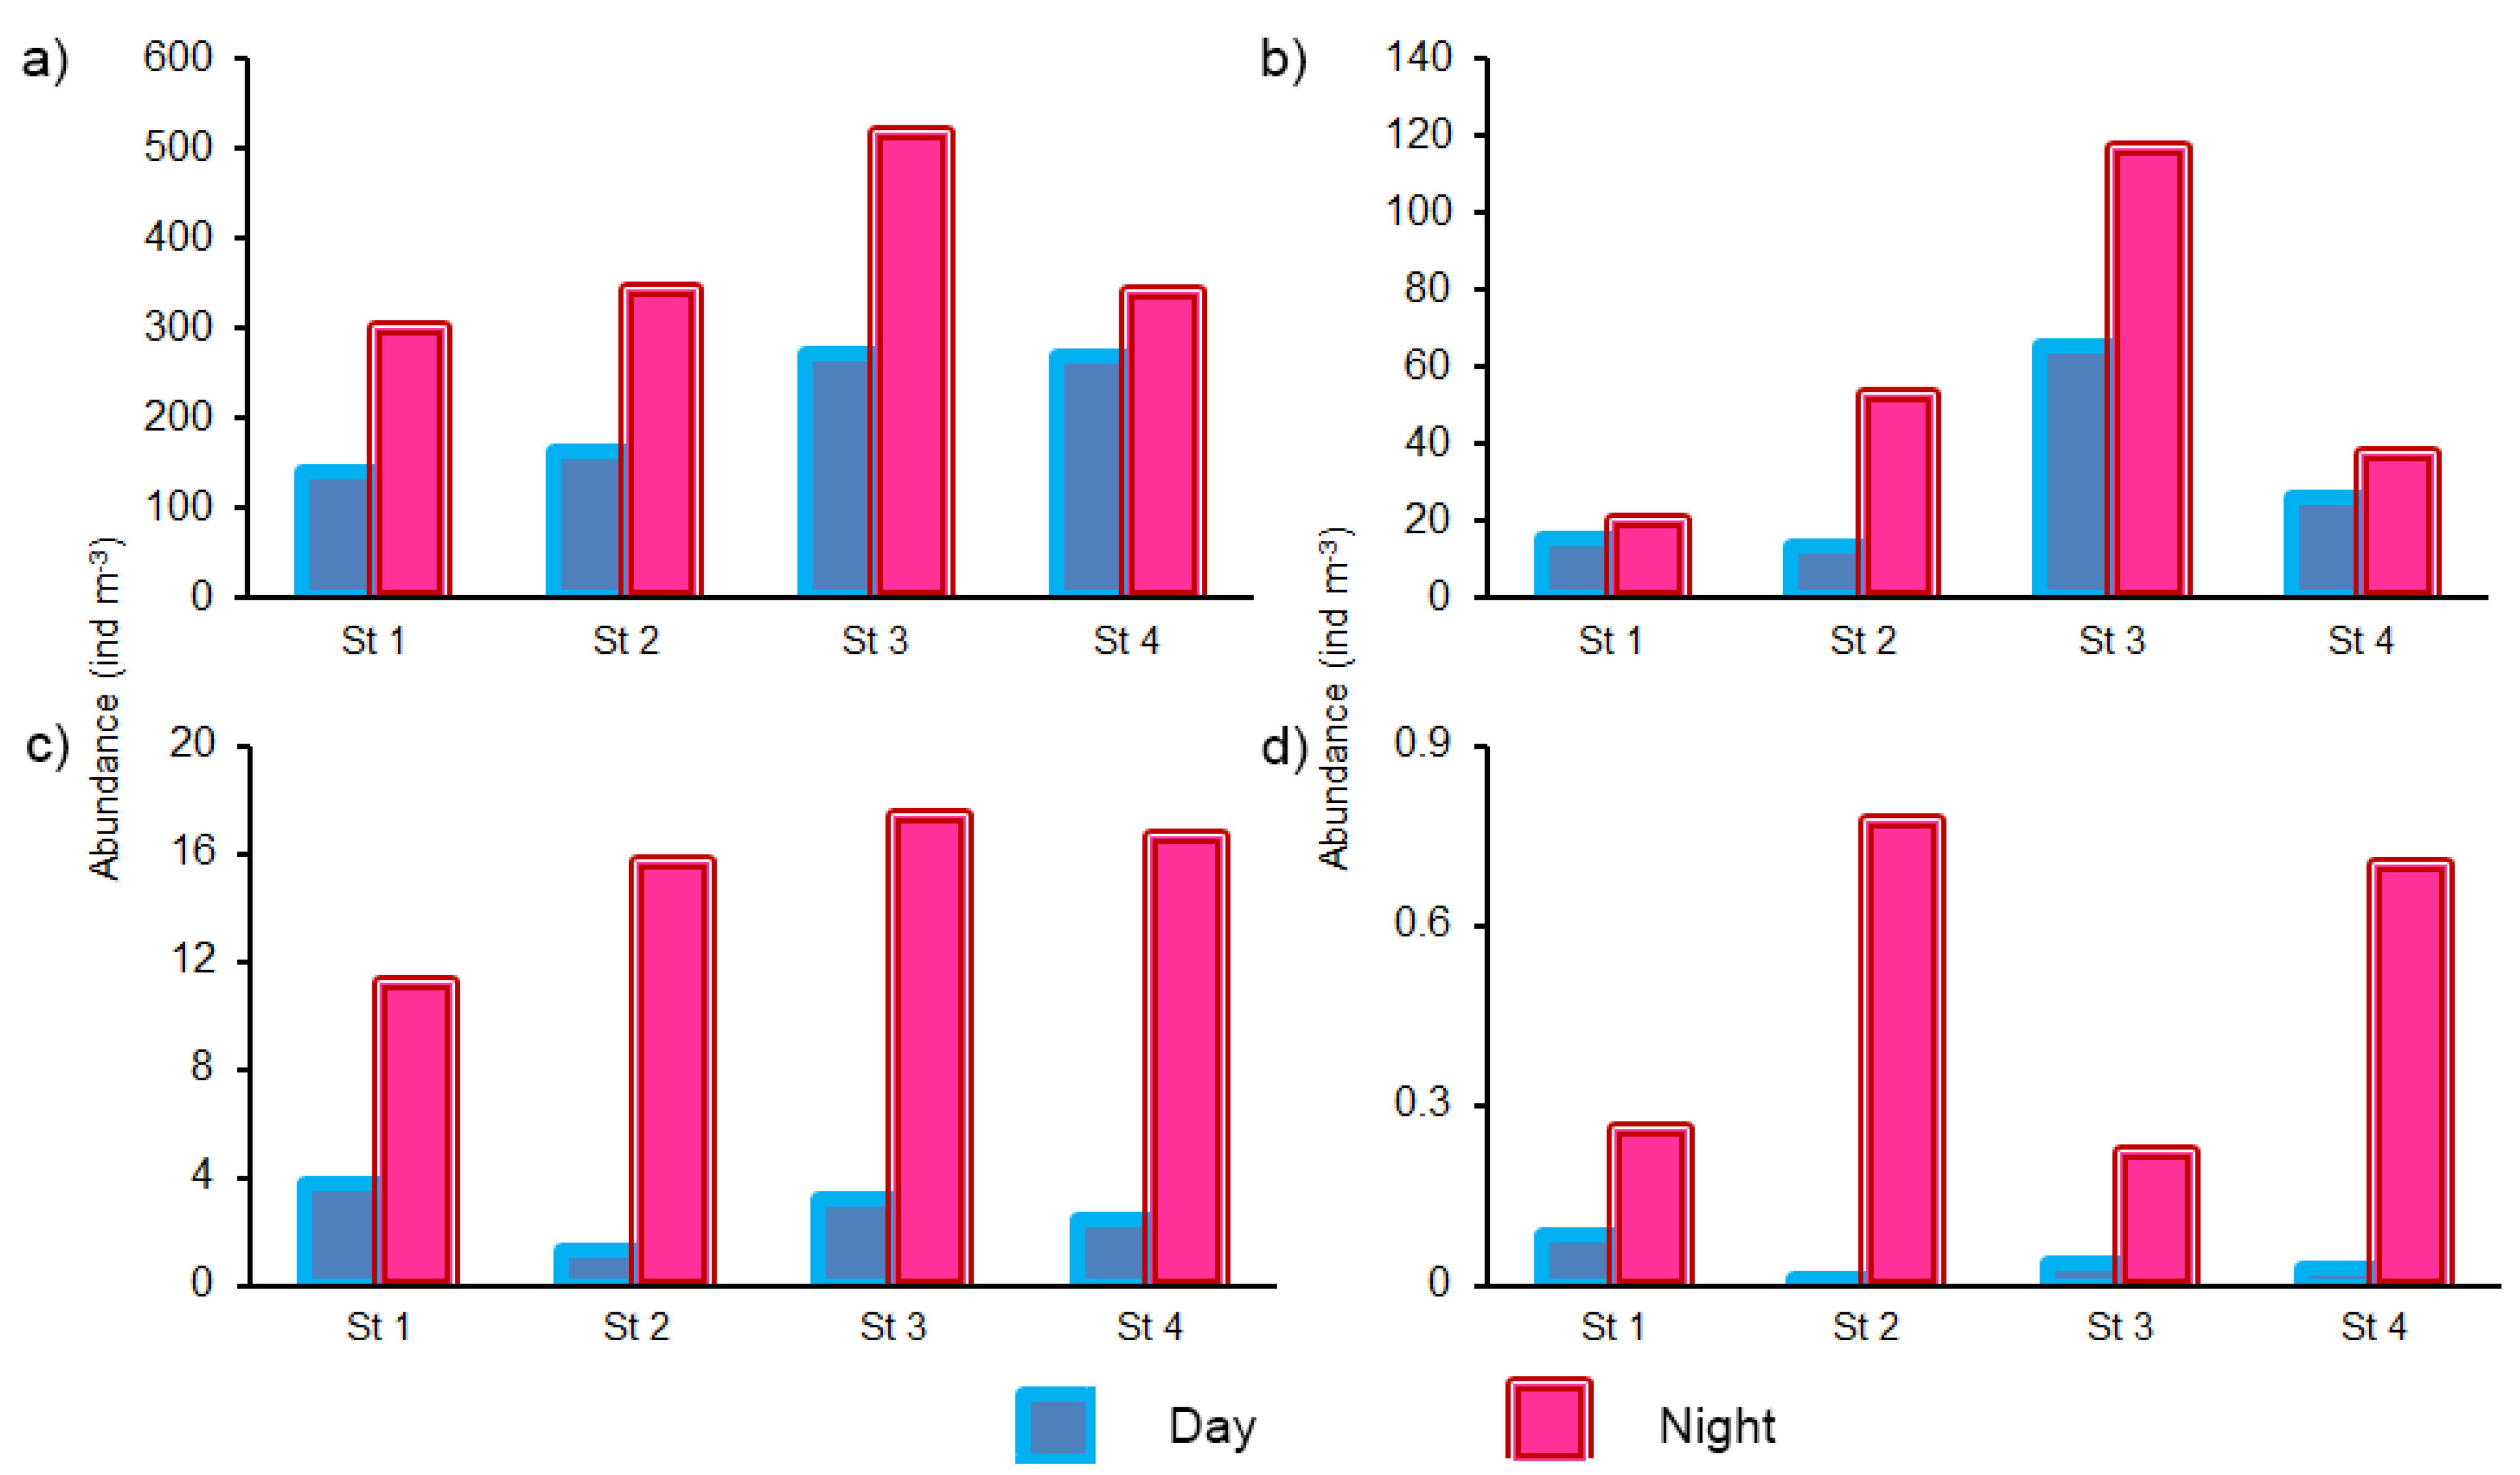
3.3. Abundance of Copepod

In the vertical sampling (0–200 m), the copepod abundance varied between 141 and 271 ind m−3 (average: 211 ± 68 ind m−3, N = 4) during day (Figure 4a). At night, the abundance was higher and ranged between 301 and 517 ind m−3 (average: 376 ± 96 ind m−3, N = 4) exhibiting a statistically significant diel variation (p < 0.05). In the horizontal surface sampling, although the copepod abundance was markedly lower compared to that of vertical sampling, the trend in the diel distribution was similar to that of the vertical sampling (Figure 4c). The day abundance varied between 1.3 and 3.8 ind m−3 (average: 2.7 ± 1.1 ind m−3, N = 4) whereas the night abundance ranged between 11.2 and 17.4 ind m−3 (average: 15.2 ± 2.8 ind m−3, N = 4) with a significant diel variation (p < 0.05). In both the vertical and horizontal surface sampling, spatially, the abundance was maximum at St 3 (average: 394 ± 174, and 10.3 ± 10.1 ind m−3, respectively, N = 2) and minimum at St 1 in the southern part of GoA (average: 221 ± 113, and 7.5 ± 5.2 ind m−3, respectively, N = 2).

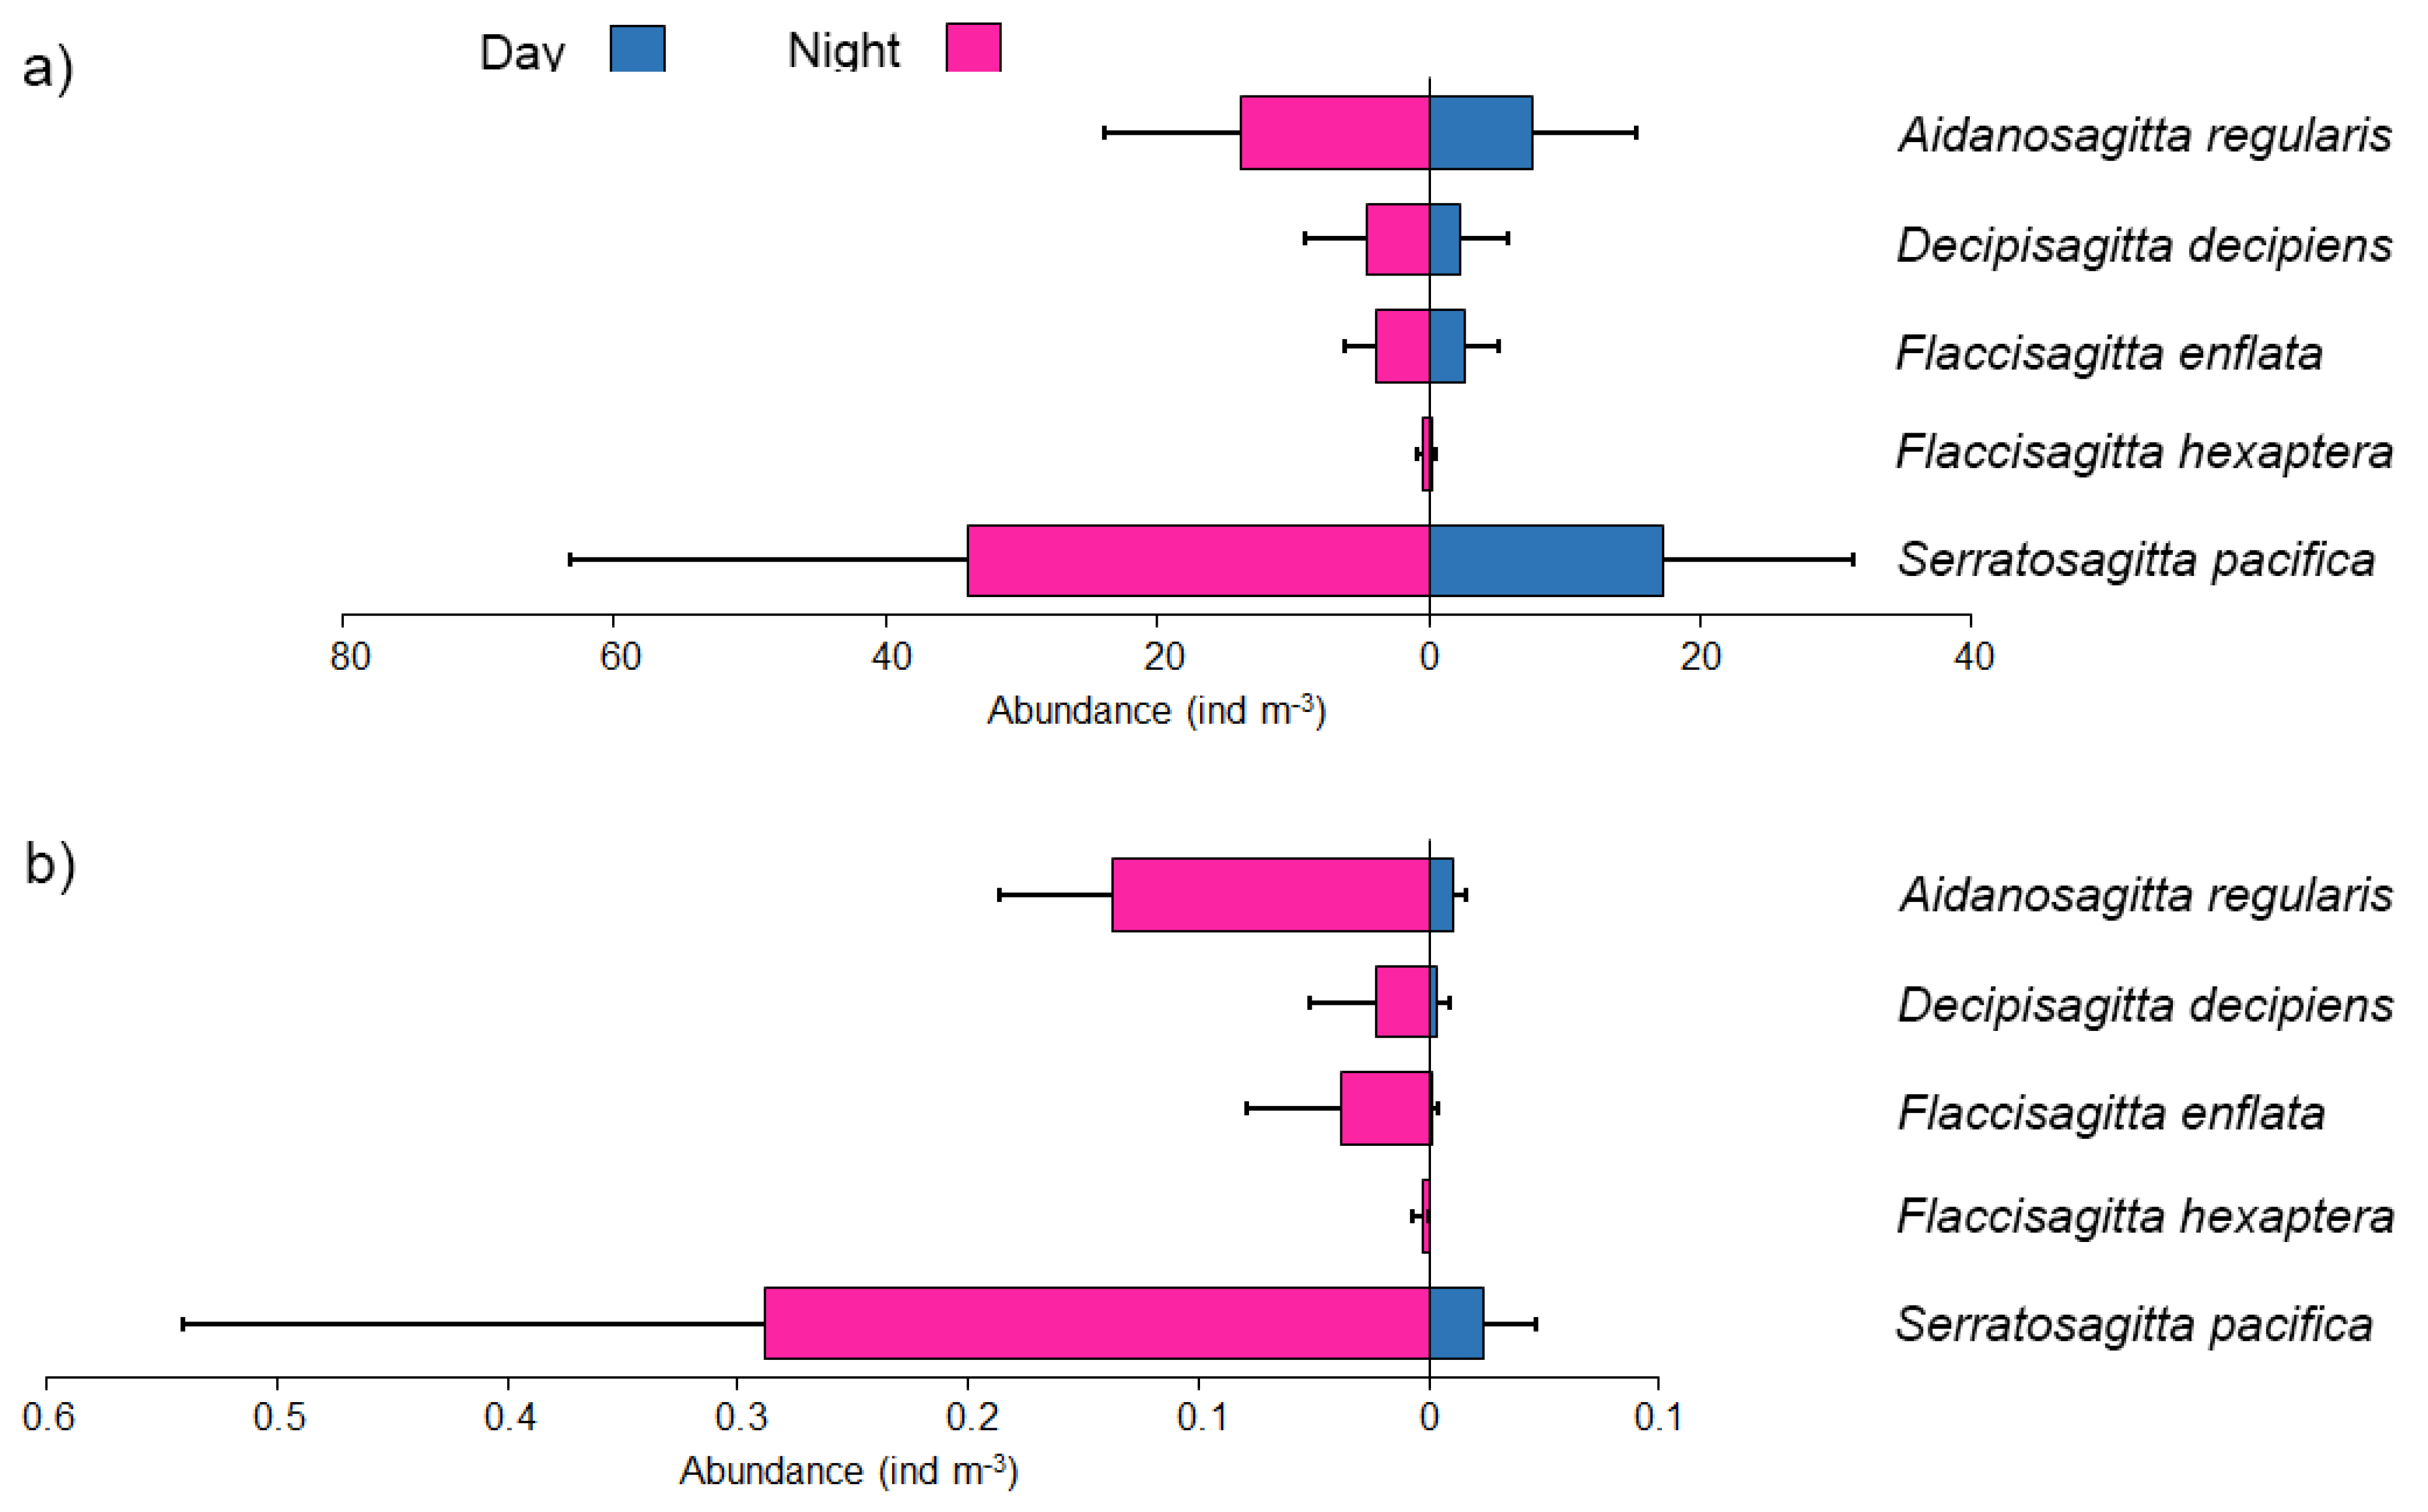
3.4. Composition and Abundance of Chaetognath

Although the average night abundance (average: 56.7 ± 42.2 ind m−3, range: 19.8–116.6 ind m−3, N = 4) in the vertical sampling was 1.88 times higher than that of day (average: 30.2 ± 24.3 ind m−3, range: 13.2–65.7 ind m−3, N = 4), the diel variation was statistically insignificant (p > 0.05) (Figure 4b). In the horizontal surface sampling, the abundance was significantly lower than that of the vertical sampling (p < 0.05). In the diel scale, the night abundance (average: 0.49 ± 0.29 ind m−3, range: 0.22–0.77 ind m−3, N = 4) was significantly higher (12.3 times, p < 0.05) than that of day (average: 0.04 ± 0.03 ind m−3, range: 0.01–0.08 ind m−3, N = 4). In the vertical sampling, the spatial abundance was relatively higher at St 3, whereas in the horizontal surface sampling, it was relatively higher at St 2 and 4 (Figure 4d).
A total of five chaetognath species were observed during the study and the species, Serratosagitta pacifica dominated during both day and night in the vertical (57.3% and 59.8%, respectively) and the horizontal surface samplings (58.9% and 59%, respectively). Aidanosagitta regularis formed the next abundant species in all day and night samplings. The other species which had relatively less contribution (<10%) to the total chaetognath population were Decipisagitta decipiens, Flaccisagitta enflata, and Flaccisagitta hexaptera. All these five species contributed to both the day and night community of the vertical samples and their percentage contribution to the total chaetognath population did not show much diel variation. In horizontal surface samplings, F. hexaptera was present only in the night samples, F. enflata had a higher contribution at night (day 4.6%, night 7.8%) and D. decipiens had a higher contribution to the total population during day (day 9.3%, night 4.6%).
Although the percentage contribution of the chaetognath species did not show much diel variation in the vertical sampling, the abundance of the individuals of all the species was higher during night (1.8, 1.9, 1.5, 1.6, and 1.9 times in A. regularis, D. decipiens, F. enflata, F. hexaptera, and, S. pacifica, respectively) (Figure 5a). Except, F. enflata, all other species had a higher abundance at St 3 (Table 1). The abundance of all chaetognath species in the horizontal surface sampling was significantly lower than that observed in the vertical sampling (Figure 5b). In the diel scale, the chaetognath species either exhibited markedly higher abundance at night compared to the day (12.7, 6.1, 20.6, and 12.3 times in A. regularis, D. decipiens, F. enflata, and, S. pacifica, respectively) or were present only during night (F. hexaptera).

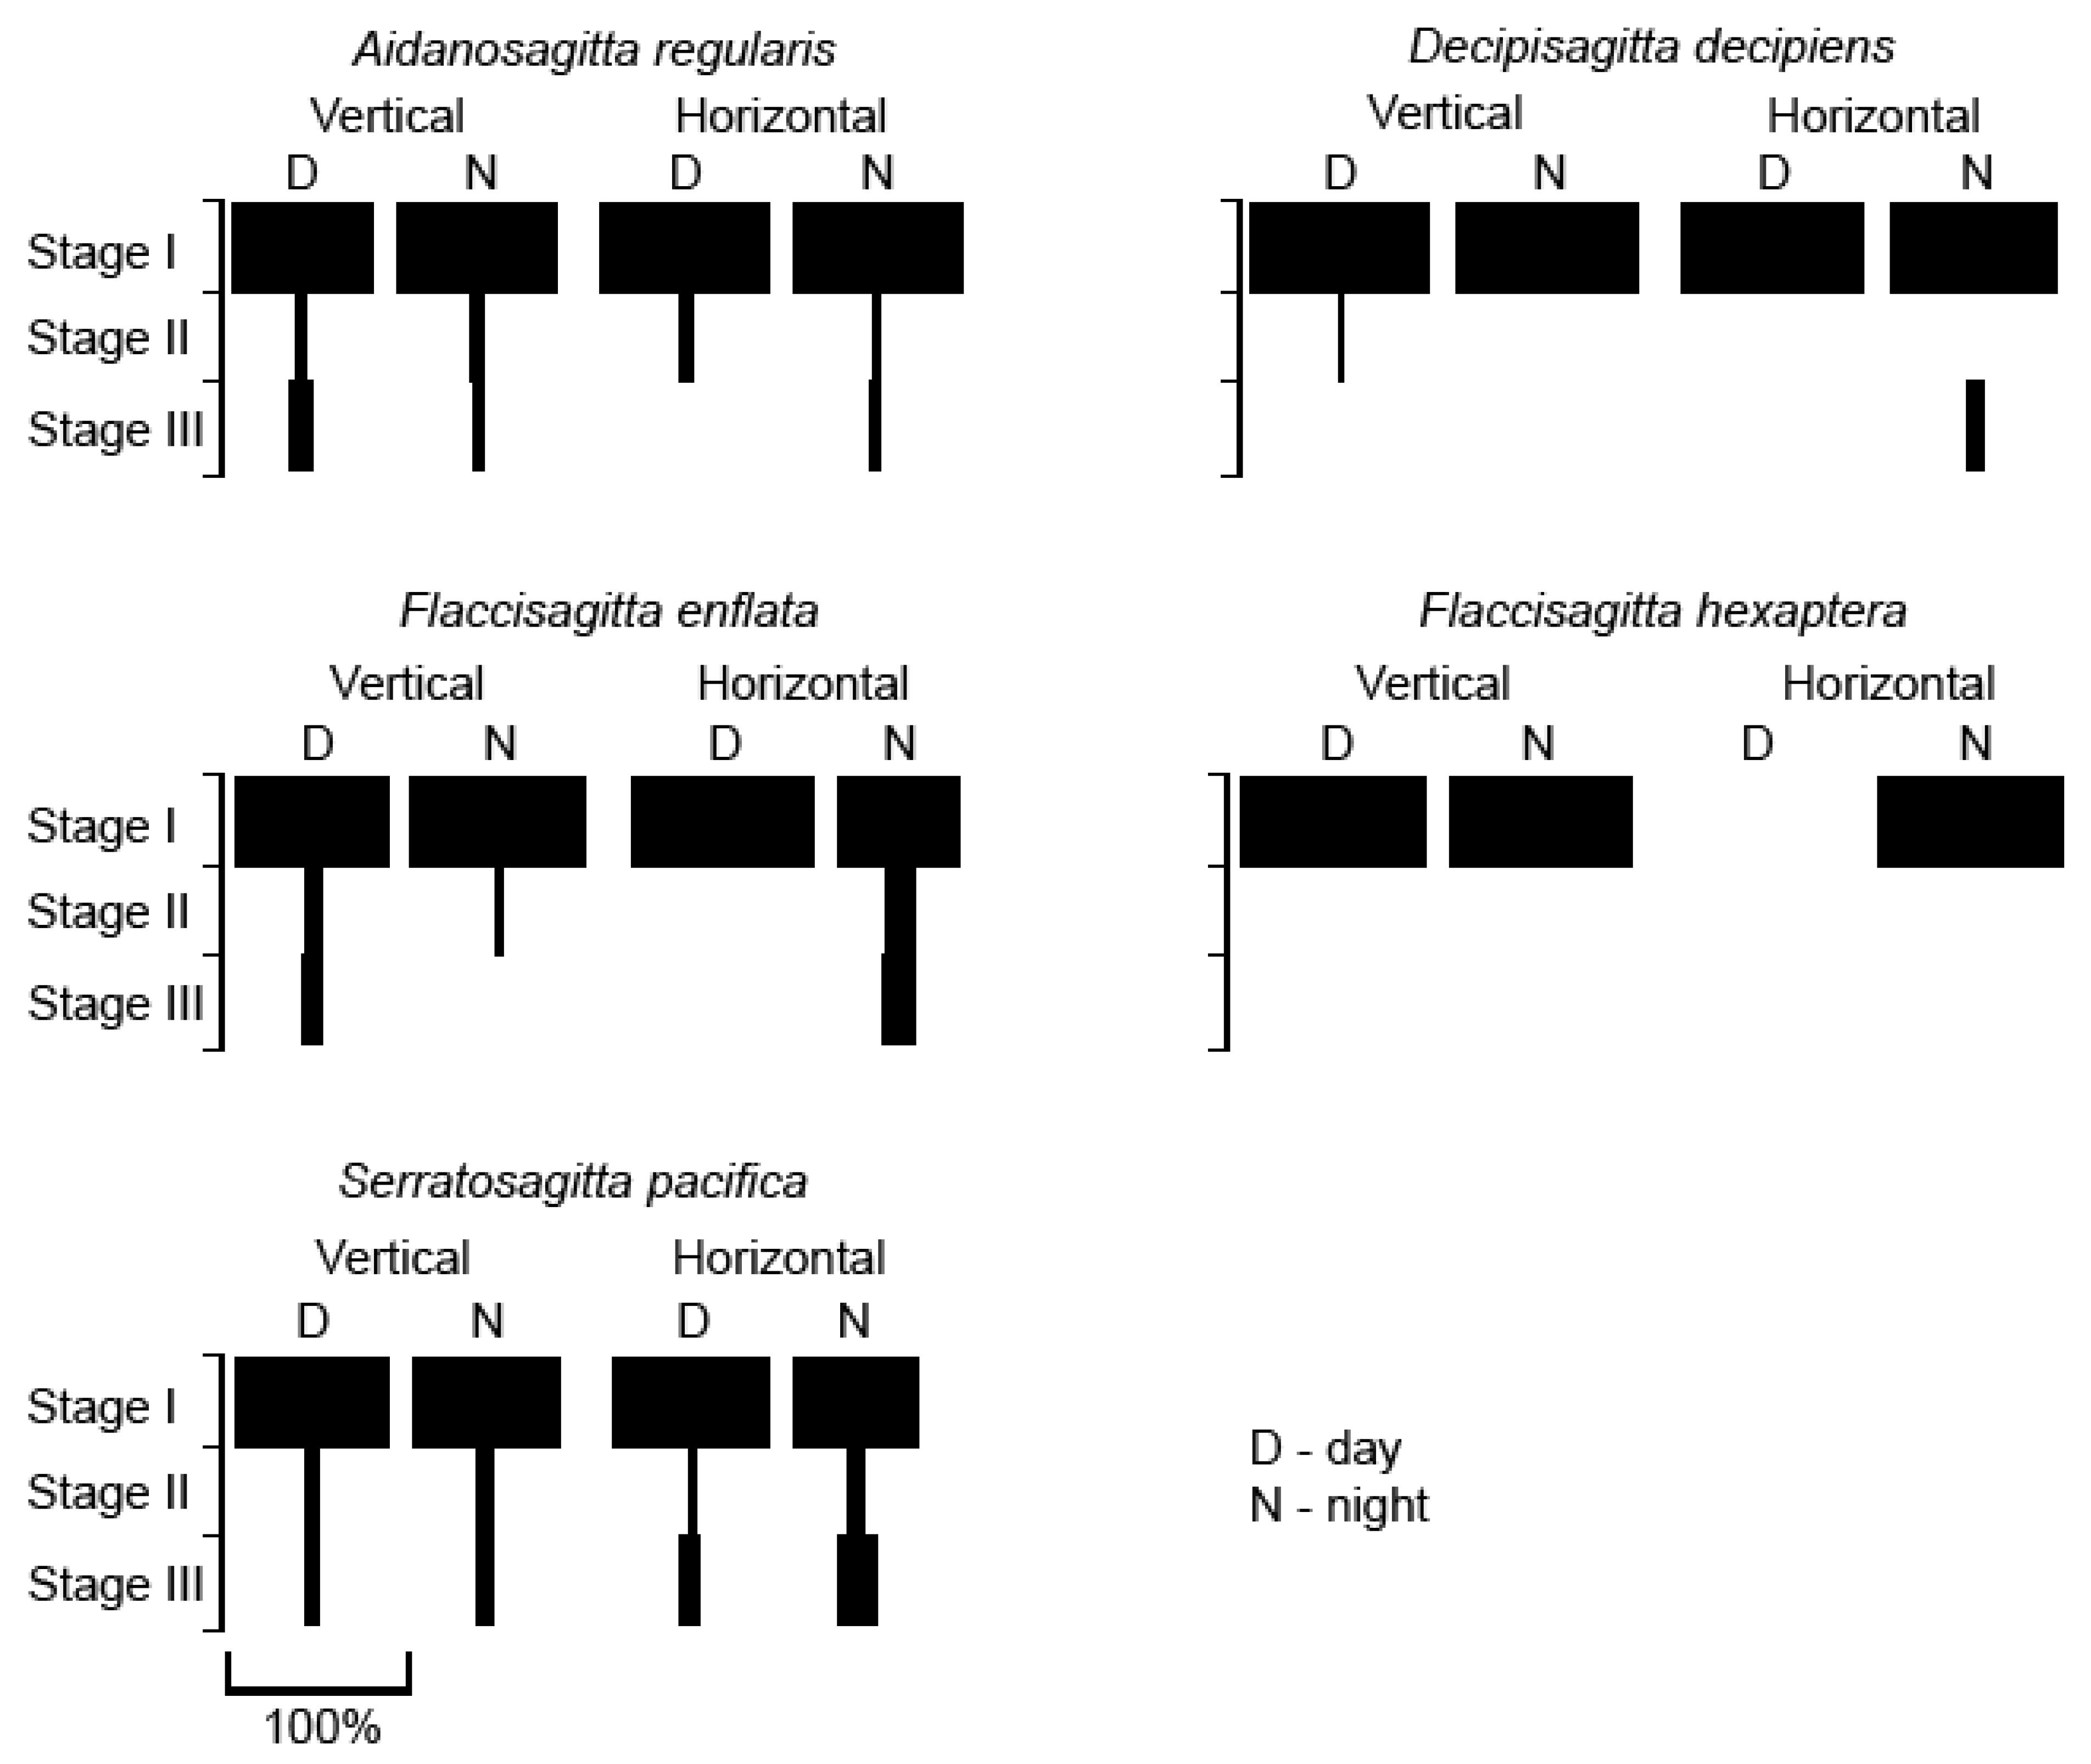
3.5. Maturity Stage-Wise Distribution

Among the maturity stages of the chaetognath species, the immature (stage I) individuals dominated in both the vertical and surface samplings (Figure 6). In the vertical sampling, the percentage contribution of the three maturity stages of the chaetognath species did not exhibit much diel scale variation. However, in the case of the surface sampling, the maturing (stage II) and the matured (stage III) population had relatively higher percentage contribution at night in the majority of the species (Figure 6).

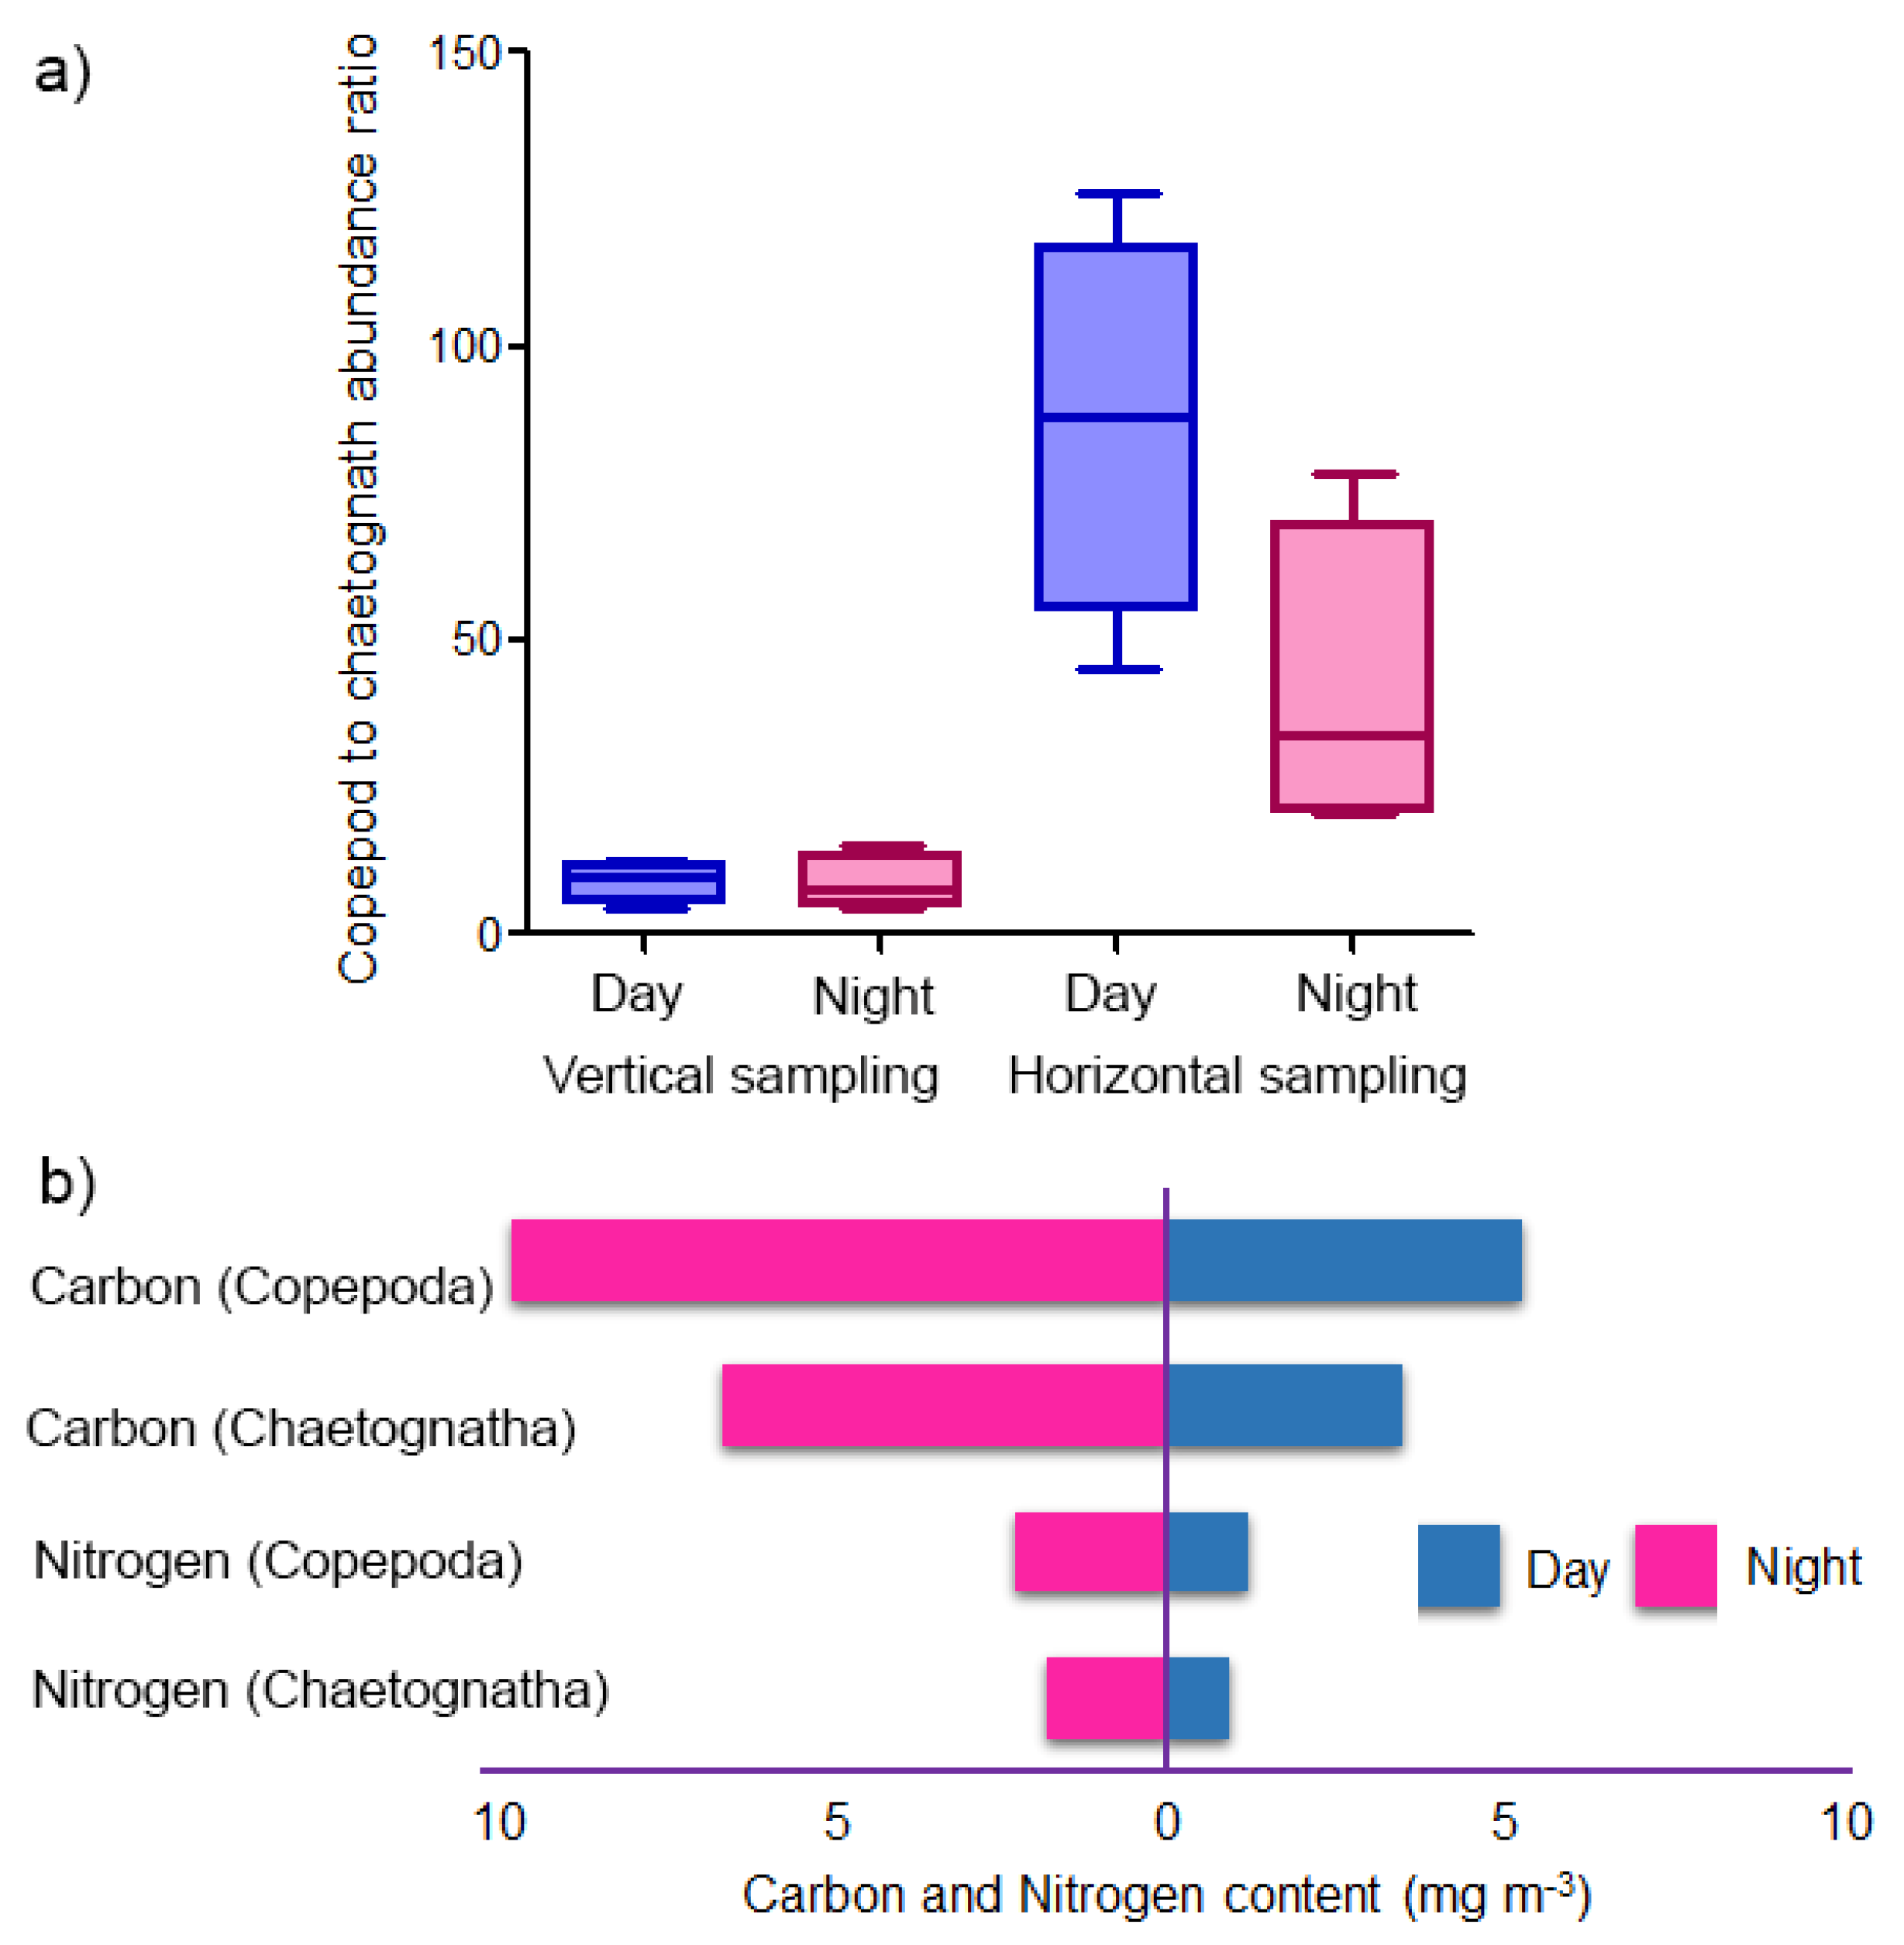
3.6. Copepod–Chaetognath Interrelation

In the vertical sampling, the copepod to chaetognath abundance ratio varied between 4.1 and 12.4 (median 9.6) during day and between 4.4 and 15.2 (median 7.8) during night (Figure 7a). Interestingly, this ratio was in general much higher in the surface sampling (day: range 45–126, median 88.1; night: range 20.2–78.5, median 33.6). A positive relation was observed between the abundances of copepod and chaetognath in both day (r = 0.7496, p > 0.05) and night (r = 0.9867, p < 0.05) vertical sampling, and also in the day (r = 0.8933, p > 0.05) and night (r = 0.3203, p > 0.05) of surface horizontal sampling.
Based on the average abundance of copepods and chaetognaths in GoA, the C and N content of copepods was 5.164 and 1.182 mg m−3 during day whereas at night it was 9.508 and 2.209 mg m−3 in the vertical sampling (Figure 7b). In the case of chaetognaths, the C and N content in the vertical sampling was a little higher during the night (6.468 and 1.723 mg m−3 for C and N, respectively) than the day (3.447 and 0.918 mg m−3 for C and N, respectively). The total amount of C in chaetognaths was 66.7 (day) and 68% (night) to the total C content of copepods, and, in the case of N content, it was 77.7 and 77.8%, respectively.

3.7. Species Evenness
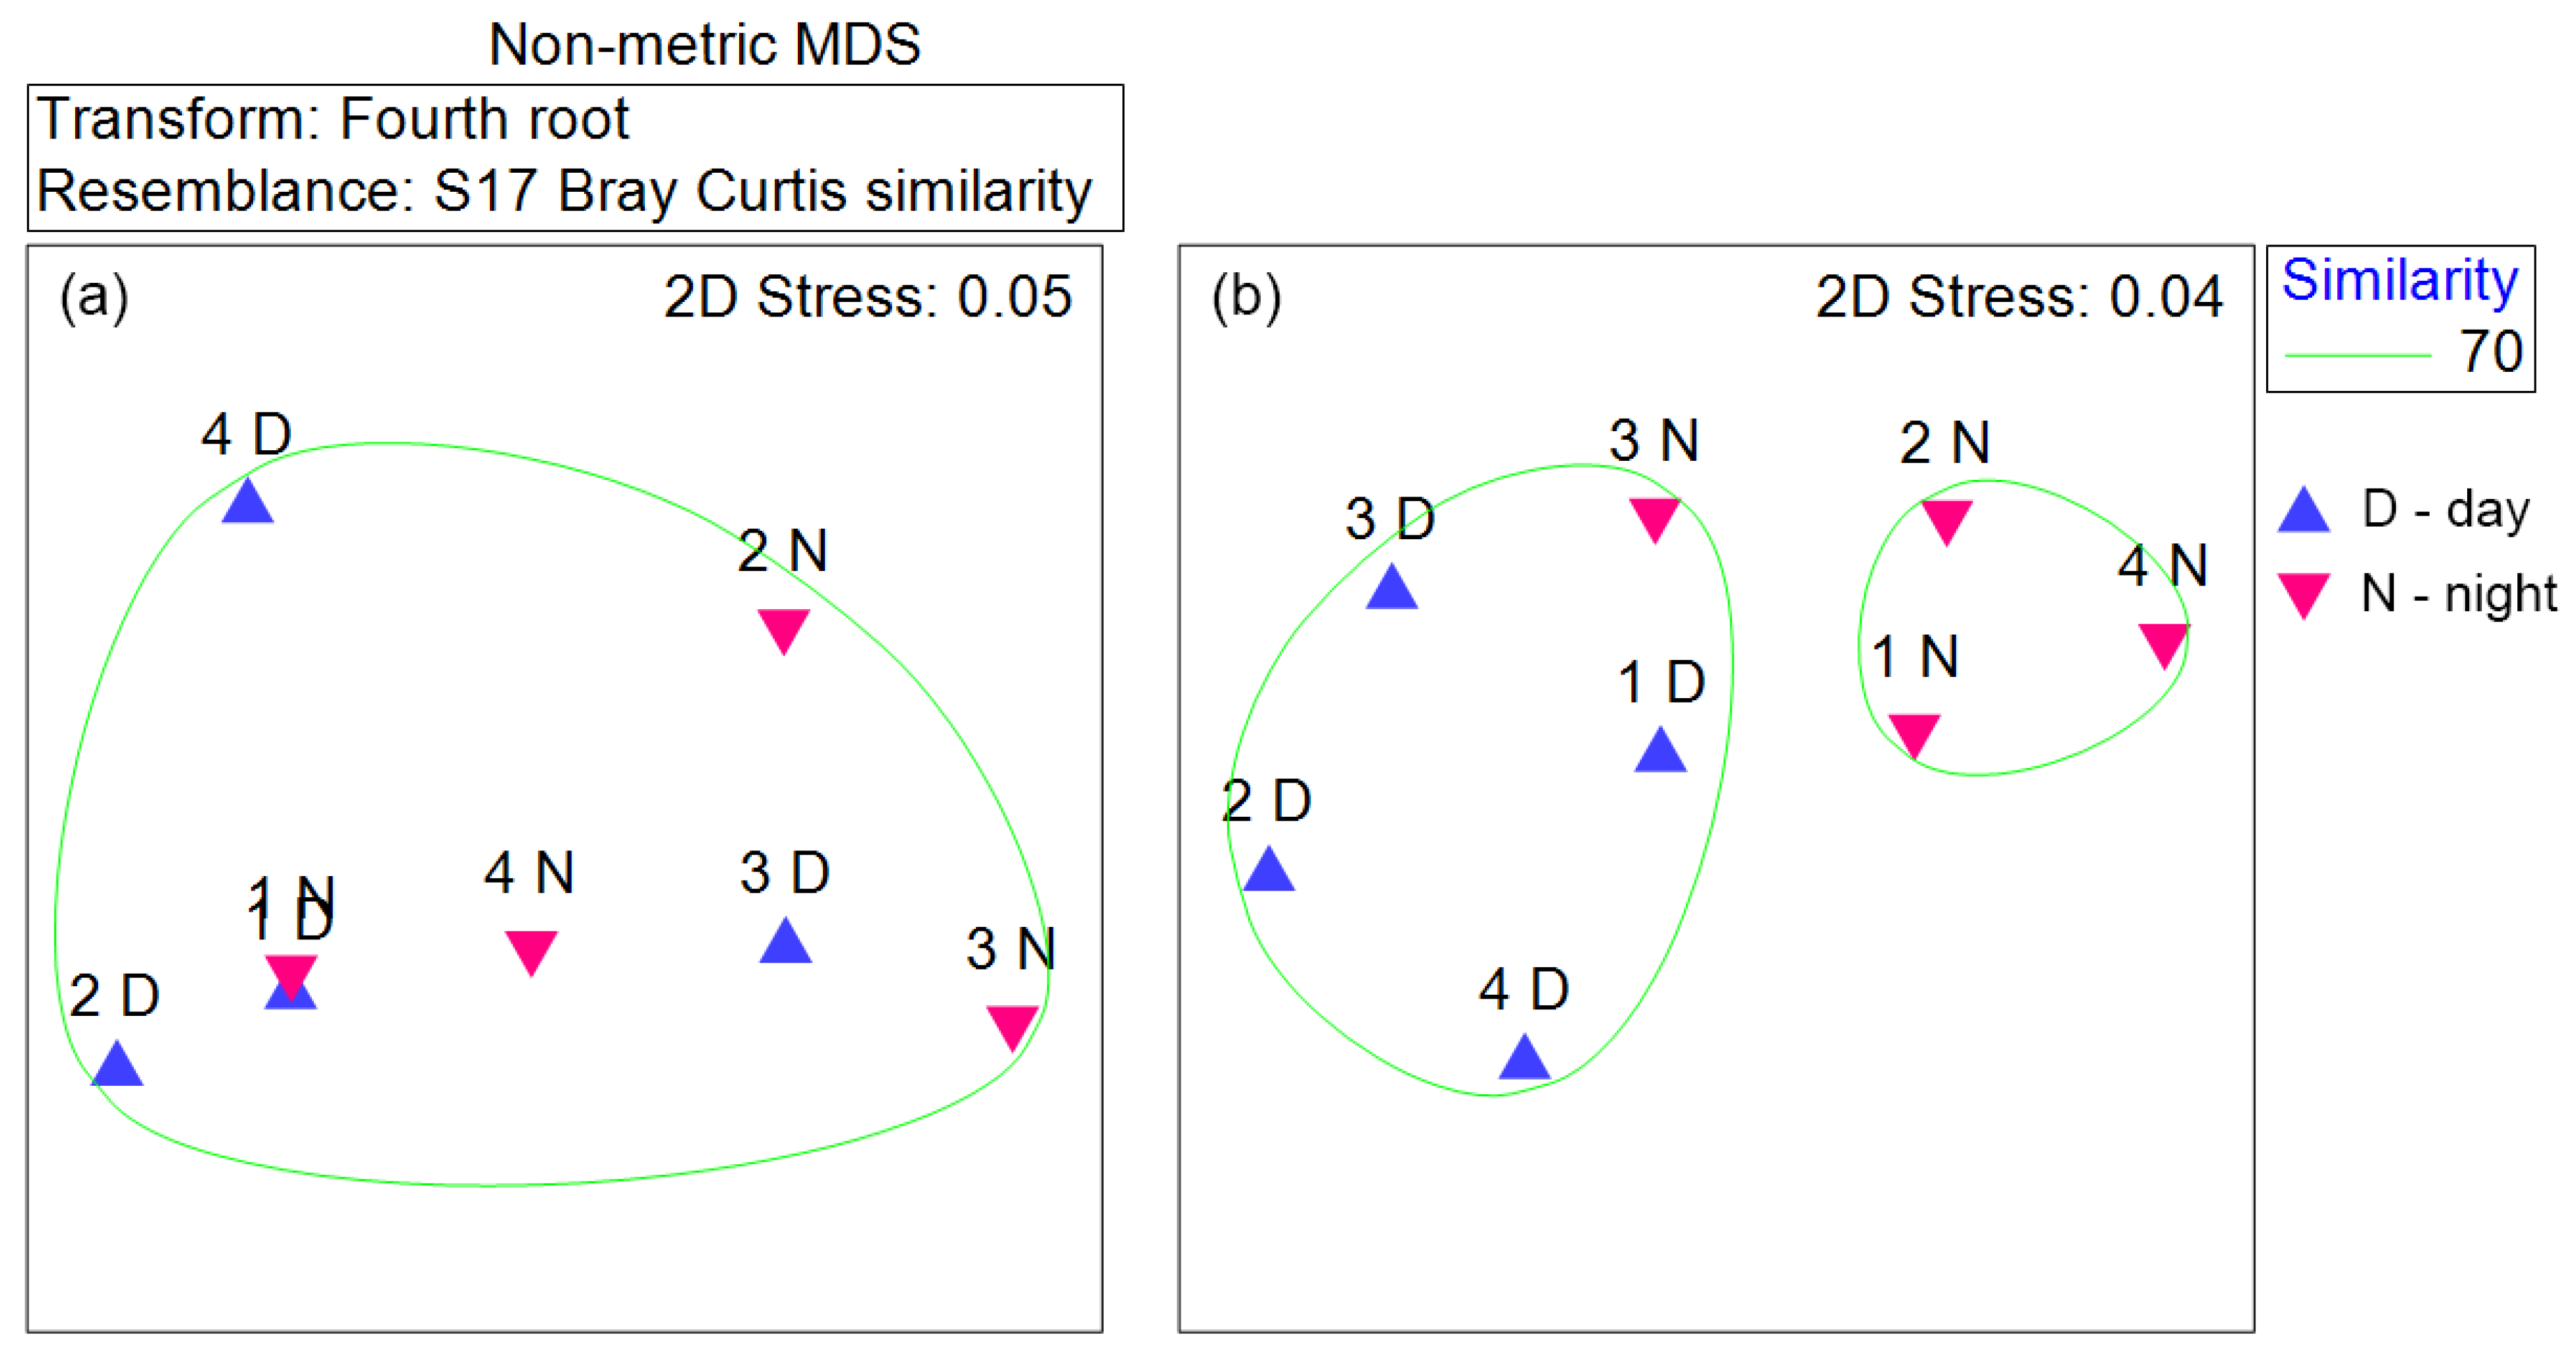
The species evenness (J′) did not show much variation between the vertical and surface samplings (0.67 ± 0.05, and 0.64 ± 0.05, respectively). Although J′ did not exhibit diel variation in the vertical sampling (0.68 ± 0.04, and 0.67 ± 0.07, day and night, respectively), it was higher during day in the surface sampling (0.77 ± 0.1, and 0.51 ± 0.2, day and night, respectively).

3.8. n-MDS Analysis

The n-MDS plot based on the abundance of the chaetognath species did not form separate groups between the day and night periods in the vertical sampling (Figure 8a). However, in the surface sampling, two distinct groups of the day and night-time sampling periods were observed (Figure 8b).

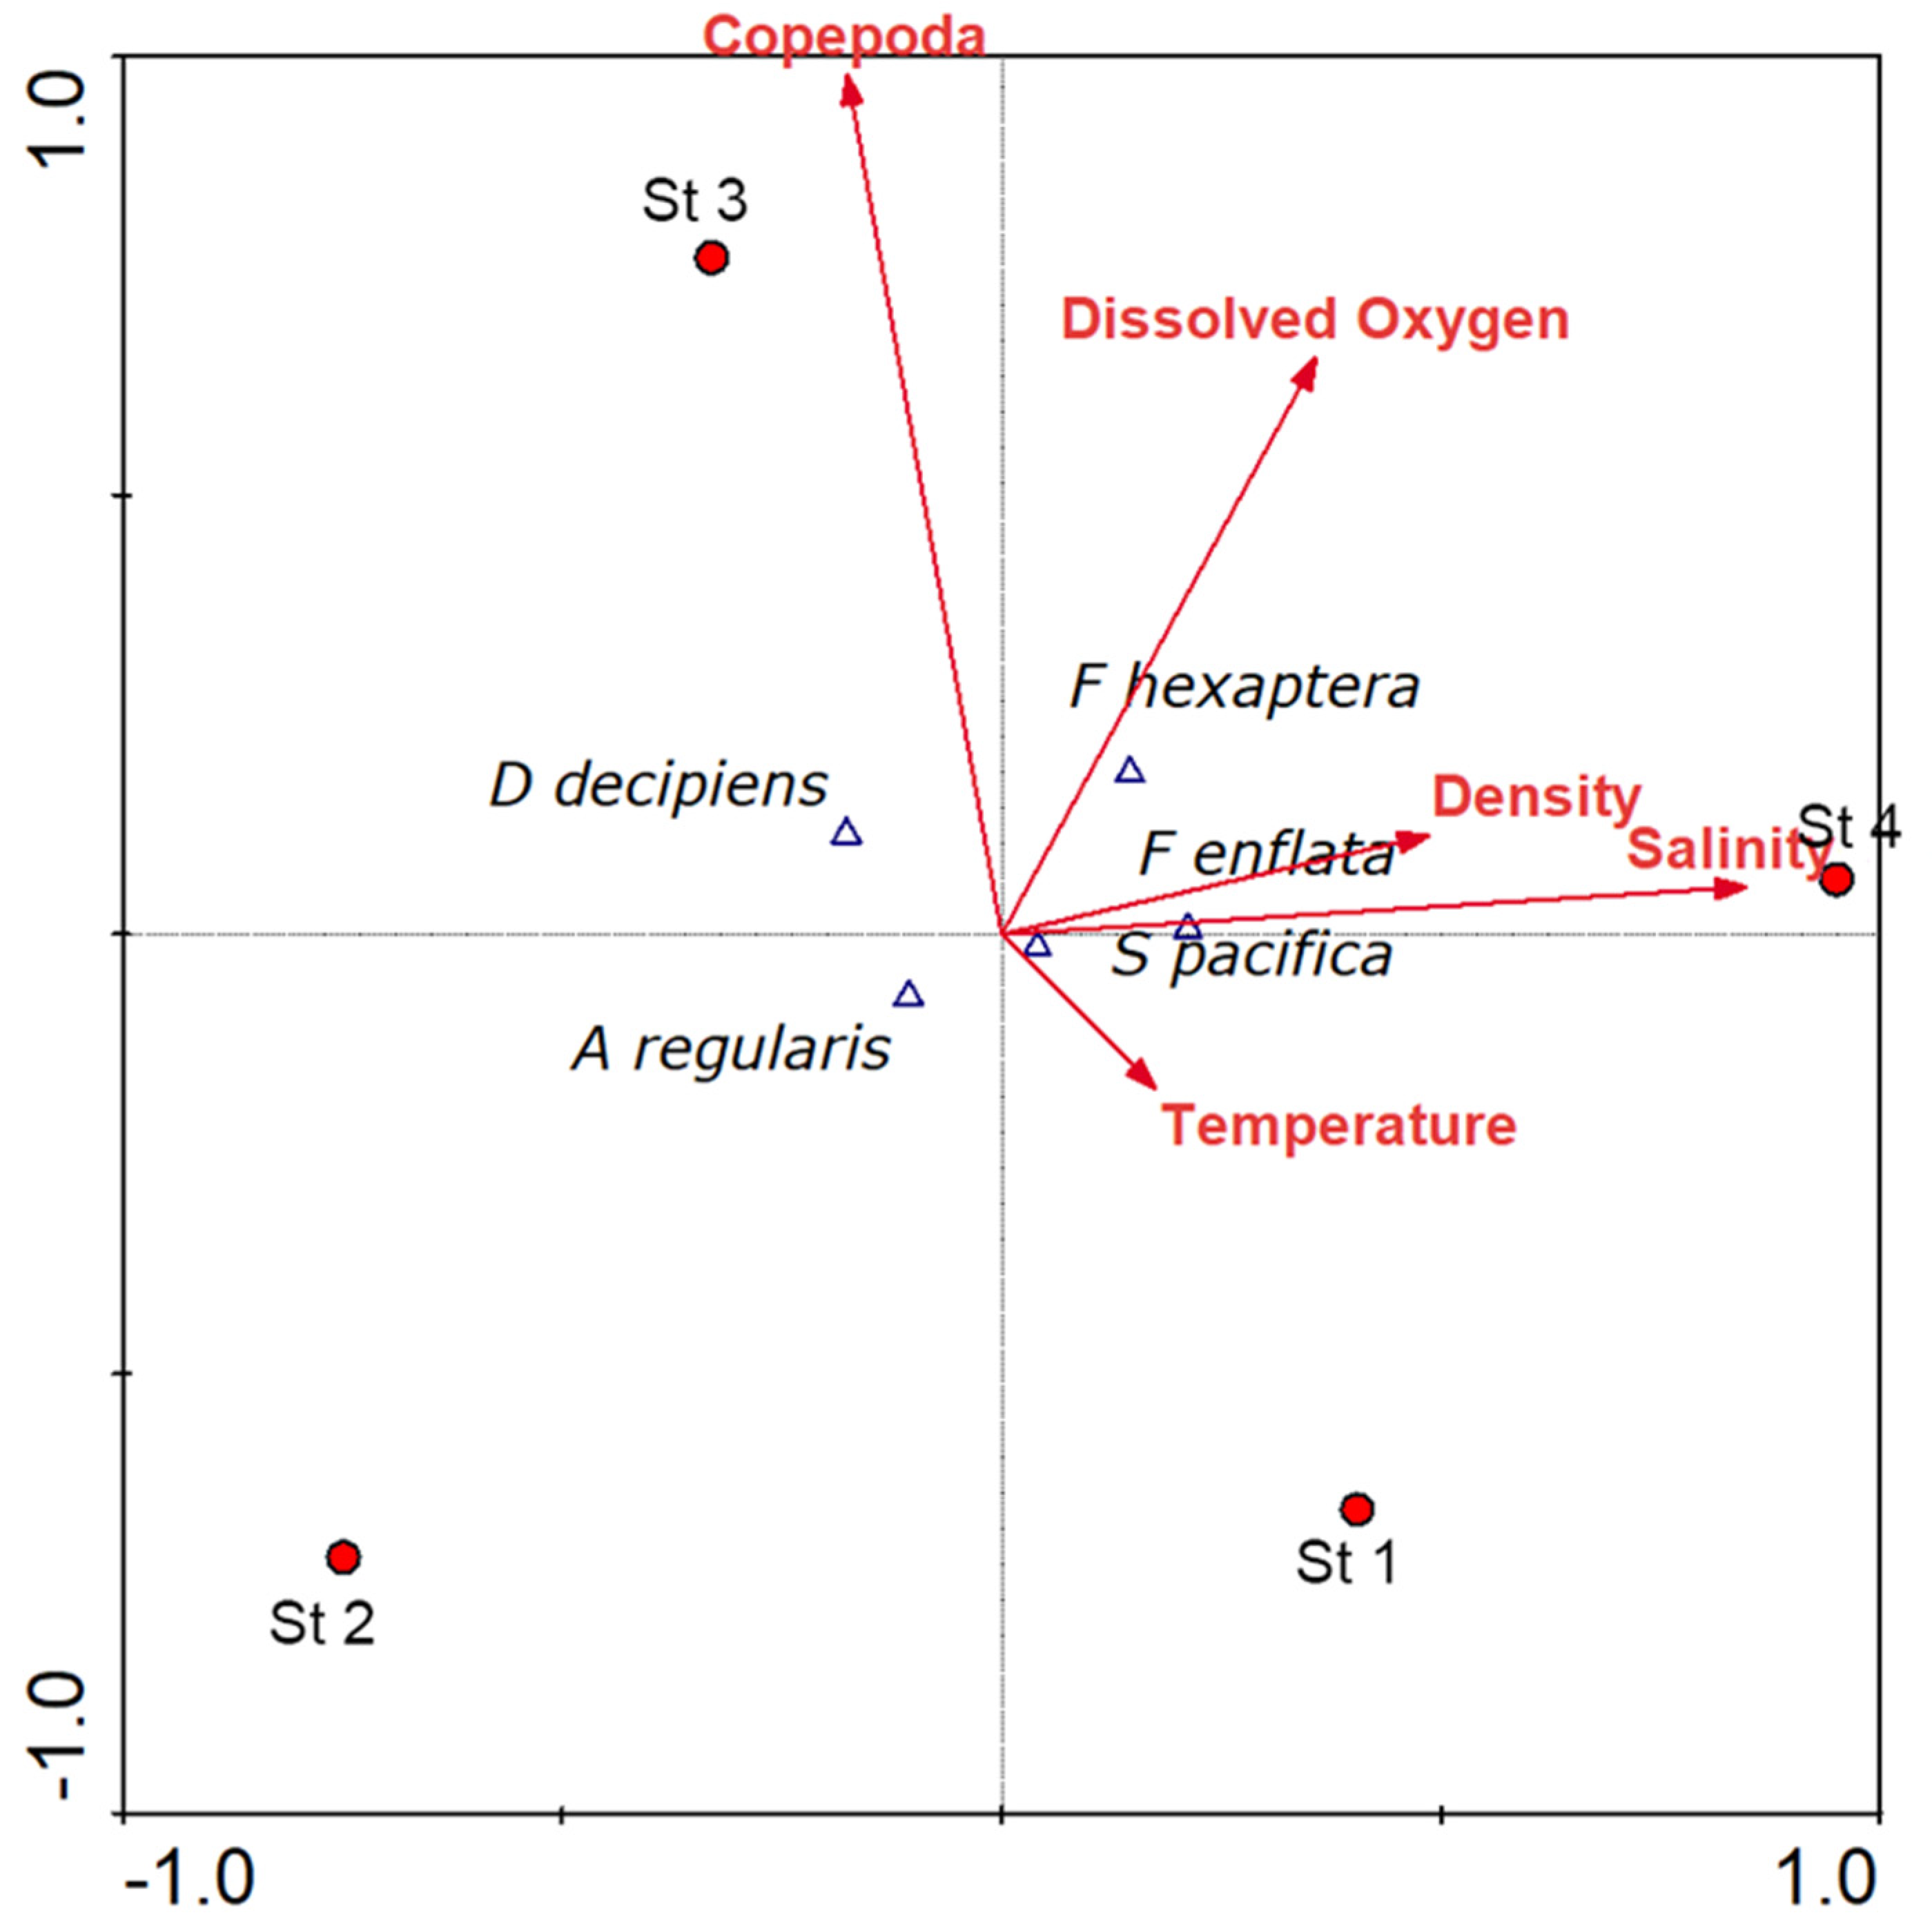
3.9. Canonical Correspondence Analysis (CCA)

The CCA plot exhibited the preferred environment for the chaetognath species in the upper 200 m water column of GoA while the Monte Carlo simulation (p < 0.05) affirmed the influence of the independent variables on chaetognath distribution (Figure 9). The cumulative percentage of variance for the species-environmental relation was 64.2 for these two axes. The copepod abundance had an important role in chaetognath abundance. Both F. hexaptera and D. decipiens exhibited a positive correlation with the copepod abundance. The dominant species, S. pacifica was strongly correlated with salinity, whereas F. enflata and F. hexaptera were positively correlated with DO (Figure 9).

4. Discussion

4.1. Role of Hydrography

The hydrographic attributes of the GoA during summer formed the prime determinant in shaping the distribution and ecology of the chaetognath community of this gulf. The gradients in the vertical profile of temperature indicated summer stratification and were in accordance with the earlier observation and modeling studies [45]. The stratification begins with surface warming during spring and early summer, intensifies by late summer, and dissipates in the fall inter monsoon [21]. In the case of salinity, the variation was less, and the vertical gradient was mostly absent, but the presence of very high saline waters (>41) throughout the water column in the northernmost station indicated a different abiotic environment from the other locations. The gradients observed in the density profile affirmed the presence of stratified water mass in this basin. Compared to salinity, the temperature is considered as a suitable representative governing the density distribution in the GoA, as the relatively warm water makes the seawater density more sensitive to changes in temperature than that of salinity [20,21,46]. The observation in the present study with stronger gradients in temperature compared to salinity affirms the view. The wind-driven circulation helps in the formation of a cyclonic gyre during summer in the northern part of the GoA [47] and the uplifting of the isolines of temperature and density at St 4 in the present study might be due to the occurrence of this physical process in the northern part.
The surface chlorophyll a observed during the study was low (average: 0.11 ± 0.07 mg m−3, N = 4) and might have occurred due to the limited nutrient supply resulting from the stratification of the water column. In this oligotrophic environment of summer, the lower phytoplankton biomass is generally contributed by the smaller sized phytoplankton (<8 µm) among which Prochlorococcus often forms the most significant contributor [22,48]. Along with photoinhibition, the restriction in the nutrient entrainment from the subsurface and deeper waters due to the intense summer stratification might have resulted in the prominent variation in the chlorophyll a between the surface and the subsurface depth (70 m). This contrasts with the chlorophyll a distribution of the winter season, where the convective winter mixing helps in the formation of a mixed water column with fairly constant inputs of nutrients from deeper regions [22]. However, at St 4, the surface chlorophyll a was higher than the sub-surface values. Based on the temperature and density profile, the uplifting of subsurface water mass was seen at St 4 and this surfacing of the nutrient-rich sub-surface waters in the northern part might have helped in the sustenance of the higher surface chlorophyll a at this location.

4.2. Trophic Relationship

The distribution of chlorophyll a with low concentration in the surface water and relatively high concentration in the subsurface waters might be the reason behind the lower copepod abundance in the surface (as observed in surface sampling) compared to the subsurface waters (as observed in vertical sampling from 200 m depth to surface). In the present study, dominant copepods were from the family Clausocalanidae, Mecyoceridae, Paracalanidae, Acartiidae, and Lucicutiidae [29], which are mostly herbivorous or omnivorous [49], and hence their abundance and distribution can be positively correlated with the phytoplankton biomass. The synchronized distribution of high copepod abundance with the highest column chlorophyll a at St 3 corroborates this view. Interestingly, the northernmost St 4 exhibited relatively high surface chlorophyll a compared to other locations, and the corresponding higher copepod abundance in the surface sample of this station further signifies higher phytoplankton biomass sustaining the copepod population. Chaetognaths are primarily carnivorous, and despite their species-specific preferences, copepods have been found to be their major diet component in the marine ecosystems [4,50,51]. Hence, the higher abundance of chaetognaths at St 3 in the vertical sampling and their higher abundances at St 4 in the horizontal surface sampling justify the role of copepods in supporting the chaetognath population. The positive correlation observed between the abundance of copepod and chaetognath in both the vertical and horizontal samplings during both day and night evidently reinforces the importance of copepod in the sustenance of the chaetognath community. This observation is in accordance with our earlier findings from the Indian Ocean and the Red Sea [6,52].
The less variation in copepod to chaetognath abundance ratio between day (median 9.6) and night (median 7.8) in the vertical sampling indicates similar chances of prey encounters along the diel scale. The ratio was similar to the earlier observation in the Red Sea (median 7.8, and 13.9, in 0–100 m, and 100–200 m, respectively [42]). However, the markedly higher copepod to chaetognath abundance ratio in the horizontal surface sampling (33.6 and 88.1, during day and night, respectively) can be attributable to the differences in the habitat preferences between these two prey-predator groups. Although both copepods and chaetognaths are observed in the upper layers, the data suggests that chaetognaths exhibited less preference to inhabit the top surface layer compared to copepods. Their lower inclination to inhabit the surface waters during day might be due to their predator evasion strategy, as their larger size relative to the copepod species makes them more susceptible to visually oriented predators than copepods.
In the upper 200 m, the C and N content in the chaetognaths varied between 66.7 and 77.8% of the total C and N content of copepods which indicates the significant role of this carnivorous taxon in trophic energy transfer. This value was higher than the observation of [42] in the upper 100 m of the Red Sea (26.4% and 30.7%, for C and N) and thus indicates a more crucial role of chaetognaths in the trophic energy transfer of this gulf compared to the Red Sea. Interestingly, in this 200 m water column, the abundance of chaetognaths was only 14.3% (day) and 15% (night) compared to the abundance of copepods. The individuals of chaetognaths are generally larger compared to the copepods thus resulting in a higher average dry weight (0.33452 mg ind −1) than the individual of copepods (0.07369 mg ind −1) [41]. The variation in the size and dry weight of copepods and chaetognaths led to the observed asymmetry between the percentage contribution of their abundance and the trophic energy transfer in this ocean basin.
Considering the small length of the GoA (180 km), the sampling of environmental variables and the plankton community was restricted to four stations each of which was separated by a distance of 35–40 km. Although the number of sampling locations might appear as a limitation in understanding the chaetognath ecology in GoA, the diel sampling along both the horizontal and vertical scales helped to minimize this shortfall in the study region. Moreover, considering the knowledge gap in the plankton ecology of this important marginal sea, the information generated from the present study can provide baseline information for future studies on the pelagic trophodynamics in the GoA.

4.3. Distinct Nature of Chaetognath Community in the GoA and Their Ecology

It was important to assess both the distinctness in the chaetognath community structure of this gulf from the Red Sea, and also the ecohydrographic determinants governing the chaetognath population in the GoA. The limited number of chaetognath species (5) observed in the upper 200 m of GoA during summer compared to the 16 species in the upper 200 m of the Red Sea [5,6,42] clearly indicates the discrete chaetognath community structure of this high saline basin. Although the Red Sea is also a high saline ocean basin, the dominant epipelagic chaetognath in the upper 200 m was F. enflata [42], which is in accordance with the observation in the northern Indian Ocean [53,54,55]. In contrast, S. pacifica dominated the chaetognath community of GoA and F. enflata contributed only 7.5% of the total chaetognath population in both the vertical and surface sampling. Chaetognaths, being highly sensitive to the hydrographic attributes of their habitat are found in close association with distinct water masses of the world ocean and hence are considered as good indicators of different water masses [7,56]. In the Red Sea, salinity distribution occurs over a relatively wide range (36–41) [57] as the inflow of the relatively low saline Indian Ocean water into the Red Sea through the shallow sill of the Bab-al-Mandab contributes in maintaining the wide salinity ranges of this basin. This, in turn, helps in the sustenance of the higher number of epipelagic species in the Red Sea. On the contrary, only a high saline environment was observed in the upper 200 m of the GoA (40.64–41.2, Figure 2), which might have restricted the occurrence of the majority of the Red Sea epipelagic chaetognath species in GoA further indicating the role of hydrography in their distribution.
It was a prerequisite to assess the influence of the Straits of Tiran, the shallow sill connecting GoA with the Red Sea on the chaetognath distribution and diversity of GoA as these shallow sills are often found to restrict the dispersion of the planktonic communities in the marginal seas from their major ocean basins as observed in the Persian Gulf and the Mediterranean Sea [5,58,59]. Considering, the depth of the Strait of Tiran (~265 m), the possible intrusion of the epipelagic species from the Red Sea to GoA with the inflow waters cannot be overruled as the water exchanges occurring between the Red Sea and GoA have been well documented during both the summer and winter periods [60]. Based on the density distribution, inflows of the upper warmer and lighter Red Sea water into GoA along the density slope, and during summer an additional, transient inflow into the GoA over the sill, have been observed [17,60]. Hence, the salinity might have formed an ecophysiological barrier in the widening of the habitat of many epipelagic chaetognath species, thus restricting their number of species in the GoA.
Although S. pacifica was present in all station locations the percentage contribution of it was highest (66.4%) in the northernmost station which had higher salinity than other sampling locations, indicating S. pacifica as the most suitable inhabitant of this high saline environment. Furthermore, the positive correlation of this species with salinity in the CCA plot corroborates their high saline preferences. S. pacifica is a euryhaline species and is found in the Arabian Sea and Bay of Bengal of the northern Indian ocean but having a contribution of less than 10% of the total chaetognath community [33,54,55,61]. However, it has been found to exhibit a preference for the high saline environment compared to other common Indo-Pacific euryhaline chaetognath species [62] and hence might have obtained advantages in this high saline environment over other species.
The CCA plot also helped to identify the preferred environment of all the other chaetognath species. The second abundant species, A. regularis preferred a relatively less saline environment. F. enflata and F. hexaptera had a positive correlation with DO and the preference of F. enflata towards the well-oxygenated environment observed in the earlier study [54], based on long-term datasets in the northern Indian Ocean, strengthens the present observation. However, other chaetognath species did not show any direct relation with DO. Unlike the northern Indian Ocean, in GoA, the oxygen minimum zone (<0.5 mL L−1) was not evident in the upper 200 m, hence the presence of this relatively well-oxygenated environment (>2.2 mL L−1) might have contributed to the observed relationship of the other chaetognath species with DO.

4.4. Diel Variability

The diel variability in the abundance and distribution of the zooplankton taxa including chaetognaths has been documented from estuaries and marginal seas to major oceans. The diel distribution becomes crucial in delineating the spatio-temporal ecology of the zooplankton community [63,64,65]. The markedly higher night abundance of all the chaetognath species in the surface sampling might have been concurrent with the higher abundance of their major prey, copepods. The distinct groups of the majority of the day and night samplings in the n-MDS plot of the horizontal surface sampling (Figure 8) resulted from the significant diel variation in the chaetognath species abundance. The observation was in accordance with the earlier study [66] stating the vertical migration of chaetognath towards the copepod-rich surface layers for foraging at night. Although in vertical sampling, the night abundance was higher, the variation was less conspicuous compared to that of the surface sampling, exhibiting their preferred temporal scale habitat in the water column (Figure 4).
The maturity stage-wise day-night distribution of chaetognath species helped for a better understanding of their diel behavior. In general, the dominance of the immature population of all the species in both vertical and surface sampling was in accordance with both the Red Sea [6] and the northern Indian Ocean [52]. Although, in vertical sampling, the percentage contribution of the maturity stages of all species did not show any significant variation, in the surface sampling, the maturing and matured population was present mostly at night. As the matured and maturing populations are relatively larger in size than the immature ones, they might have evaded the sun-lit surface waters during the day to avoid being preyed upon by the visually oriented predators. Predator avoidance is considered as one of the major cues behind the diel vertical migration behavior among many zooplankton taxa in the global ocean [67] and it is expected that the larger sized maturing and matured chaetognath population will be more susceptible to the visual predators in the surface water than the immature ones. Hence, as a predator avoidance strategy, they might have taken refuge in the sub-surface waters during daytime and surfaced for feeding only at night.
The similar evenness values during both day and night in the vertical sampling are justifiable, as the species composition and the percentage contribution of each species to the total chaetognath population remained mostly similar in the 200 m water column. In contrast, in the surface sampling, the relatively less species evenness at night (0.51 ± 0.2) compared to the day (0.77 ± 0.1) was mostly due to the low J′ in Station 3 at night (0.23), where A. regularis dominated the chaetognath community.

5. Conclusions

The ecohydrography of GoA has helped in maintaining its distinct chaetognath community structure from its adjacent ocean basin, the Red Sea. Despite the limited sampling locations, the output generated from both the horizontal and vertical samplings along the diel scale at each location aided in filling the knowledge gap on the ecology of this important carnivorous zooplankton taxon of this less studied marginal sea. The summer stratification leading to low surface chlorophyll a and subsurface chlorophyll maxima contributed to distinct variation in the copepod and chaetognath abundances between the horizontal surface and vertical samplings. The strong trophic link evident between the chaetognaths and their main prey, copepods and their carbon and nitrogen contents indicated their significance in the pelagic trophic ecology of the GoA. The high saline water (40.64–41.2) in the upper 200 m, formed an ecophysiological boundary for many epipelagic chaetognath species thus limiting the species number to five. S. pacifica forming the predominant species in GoA, in contrast to F. enflata, the dominant species in the tropical Indian Ocean. The marked diel variation in the abundance of both copepod and chaetognath species emphasizes their behavioral adaptation of surfacing to prey-rich surface waters at night. Moreover, the diel variability in the abundance of different growth stages of chaetognaths might be due to the predator evasion strategy of the more susceptible larger maturing and matured individuals of chaetognaths to visually oriented predators in the surface ocean.

Author Contributions

Conceptualization, A.M.A.-A. and M.M.E.-S.; methodology and analysis, M.M.E.-S., R.P.D., A.M.A.-A., K.K.K. and G.V.; original draft preparation, K.K.K. and G.V.; review and editing, M.M.E.-S., R.P.D. and A.M.A.-A. All authors have read and agreed to the published version of the manuscript.

Funding

This project was funded by the Deanship of Scientific Research (DSR) at King Abdulaziz University, Jeddah (grant no. RG-1-150-35).

Institutional Review Board Statement

Not applicable.

Informed Consent Statement

Not applicable.

Data Availability Statement

The data presented in this study are available on request from the corresponding author. The data are not publicly available due to privacy.

Acknowledgments

This project was funded by the Deanship of Scientific Research (DSR) at King Abdulaziz University, Jeddah, Saudi Arabia, under the grant no RG-1-150-35. The authors, therefore, acknowledge with thanks DSR technical and financial support. We also thankfully remember the immense support by the captain and crew members of RV Al Azizi for their help in the field. We are grateful to the associate editor and two anonymous reviewers for their valuable suggestions to improve the quality of the manuscript.

Conflicts of Interest

The authors declare no conflict of interest.

References

  1. Cornils, A.; Schnack-Schiel, S.B.; Hagen, W.; Dowidar, M.; Stambler, N.; Plähn, O.; Richter, C. Spatial and temporal distribution of mesozooplankton in the Gulf of Aqaba and the northern Red Sea in February/March 1999. J. Plankton Res. 2005, 27, 505–518. [Google Scholar] [CrossRef]
  2. Terazaki, M. The role of carnivorous zooplankton, particularly chaetognaths in ocean flux. In Biogeochemical Processes and Ocean Flux in the Western Pacific; Sakai, H., Nozaki, Y., Eds.; TERRAPUB: Tokyo, Japan, 1995; pp. 319–330. [Google Scholar]
  3. Pakhomov, E.A.; Perissinotto, R.; Froneman, P.W. Predation impact of carnivorous macrozooplankton and micronekton in the Atlantic sector of the Southern Ocean. J. Mar. Syst. 1999, 19, 47–64. [Google Scholar] [CrossRef]
  4. Kehayias, G. Quantitative aspects of feeding of chaetognaths in the eastern Mediterranean pelagic waters. J. Mar. Biol. Ass. UK 2003, 83, 559–569. [Google Scholar] [CrossRef]
  5. Casanova, J.P. Similarity of plankton distribution patterns in two nearly land-locked seas: The Mediterranean and the Red Sea. UNESCO Tech. Pap. Mar. Sci. 1986, 49, 42–46. [Google Scholar]
  6. Al-Aidaroos, A.M.; Karati, K.K.; El-Sherbiny, M.M.; Devassy, R.P.; Kürten, B. Latitudinal environmental gradients and diel variability influence abundance and community structure of Chaetognatha in Red Sea coral reefs. Syst. Biodivers. 2017, 15, 35–48. [Google Scholar] [CrossRef]
  7. Bieri, R. The distribution of the planktonic chaetognatha in the Pacific and their relationship to the water masses. Limnol. Oceanogr. 1959, 4, 1–28. [Google Scholar] [CrossRef]
  8. Ulloa, R.; Palma, S.; Silva, N. Bathymetric distribution of chaetognaths and their association with water masses off the coast of Valparaıso, Chile. Deep Sea Res. Part I 2000, 47, 2009–2027. [Google Scholar] [CrossRef]
  9. Froneman, P.W.; Pakhomov, E.A. Trophic importance of the chaetognaths Eukrohnia hamata and Sagitta gazellae in the pelagic system of the Prince Edward Islands (Southern Ocean). Polar Biol. 1998, 19, 242–249. [Google Scholar] [CrossRef]
  10. Gibbons, M.J. Diel feeding and vertical migration of Sagitta serratodentata Krohn tasmanica Thomson (Chaetognatha) in the southern Benguela. J. Plankton Res. 1992, 14, 249–259. [Google Scholar] [CrossRef]
  11. Besiktepe, S.; Unsal, M. Population structure, vertical distribution and diel migration of Sagitta setosa (Chaetognatha) in the south-western part of the Black Sea. J. Plankton Res. 2000, 22, 669–683. [Google Scholar] [CrossRef] [Green Version]
  12. Conway, D.V.P.; Williams, R. Seasonal population structure, vertical distribution and migration of the chaetognath Sagitta elegans in the Celtic Sea. Mar. Biol. 1986, 93, 377–387. [Google Scholar] [CrossRef]
  13. Pan, J.; Cheng, F.; Yu, F. The diel vertical migration of zooplankton in the hypoxia area observed by video plankton recorder. Indian J. Geo-Mar. Sci. 2018, 47, 1353–1363. [Google Scholar]
  14. Paldor, N.; Anati, D.A. Seasonal variations of temperature and salinity in the Gulf of Eilat (Aqaba). Deep Sea Res. 1979, 26, 661–672. [Google Scholar] [CrossRef]
  15. Assaf, G.; Kessler, J. Climate and energy in the Gulf of Aqaba (Elat). Mon. Weather Rev. 1974, 104, 381–385. [Google Scholar] [CrossRef] [Green Version]
  16. Silverman, J.; Gildor, H. The residence time of an active versus a passive tracer in the Gulf of Aqaba: A box model approach. J. Mar. Syst. 2008, 71, 159–170. [Google Scholar] [CrossRef]
  17. Klinker, J.; Reiss, Z.; Kropach, C.; Levanon, I.; Harpaz, H.; Shapiro, Y. Nutrients and biomass distribution in the Gulf of Aqaba (Elat) Red Sea. Mar. Biol. 1978, 45, 53–64. [Google Scholar] [CrossRef]
  18. Manasrah, R.; Lass, H.U.; Fennel, W. Circulation in the Gulf of Aqaba (Red Sea) during winter—Spring. J. Oceanogr. 2006, 62, 219–225. [Google Scholar] [CrossRef]
  19. Wankel, S.D.; Chen, Y.; Kendall, C.; Post, A.F.; Paytan, A. Sources of aerosol nitrate to the Gulf of Aqaba: Evidence from δ15N and δ18O of nitrate and trace metal chemistry. Mar. Chem. 2010, 120, 90–99. [Google Scholar] [CrossRef]
  20. Carlson, D.F.; Fredj, E.; Gildor, H.; Biton, E.; Steinbuck, J.V.; Monismith, S.G.; Genin, A. Observations of tidal currents in the Northern Gulf of Eilat/Aqaba (Red Sea). J. Mar. Syst. 2012, 102–104, 14–28. [Google Scholar] [CrossRef]
  21. Carlson, D.F.; Fredj, E.; Gildor, H. The annual cycle of vertical mixing and restratification in the Northern Gulf of Eilat/Aqaba (Red Sea) based on high temporal and vertical resolution observations. Deep-Sea Res. Part I 2014, 84, 1–17. [Google Scholar] [CrossRef]
  22. Lindell, D.; Post, A.F. Ultraphytoplankton succession is triggered by deep winter mixing in the Gulf of Aqaba (Eilat), Red Sea. Limnol. Oceanogr. 1995, 40, 1130–1141. [Google Scholar] [CrossRef]
  23. Labiosa, R.G.; Arrigo, K.R.; Genin, A.; Monismith, S.G.; van Dijken, G. The interplay between upwelling and deep convective mixing in determining the seasonal phytoplankton dynamics in the Gulf of Aqaba: Evidence from SeaWiFS and MODIS. Limnol. Oceanogr. 2003, 48, 2355–2368. [Google Scholar] [CrossRef] [Green Version]
  24. Al-Najjar, T.; Badran, M.I.; Richter, C.; Meyerhoefer, M.; Sommer, U. Seasonal dynamics of phytoplankton in the Gulf of Aqaba, Red Sea. Hydrobiologia 2007, 579, 69–83. [Google Scholar] [CrossRef]
  25. Mackey, K.R.; Labiosa, R.G.; Calhoun, M.; Street, J.H.; Post, A.F.; Paytan, A. Phosphorus availability, phytoplankton community dynamics, and taxon-specific phosphorus status in the Gulf of Aqaba, Red Sea. Limnol. Oceanogr. 2007, 52, 873–885. [Google Scholar] [CrossRef] [Green Version]
  26. Echelman, T.; Fishelson, L. Surface zooplankton dynamics and community structure in the Gulf of Aqaba (Eilat), Red Sea. Mar. Biol. 1990, 107, 179–190. [Google Scholar] [CrossRef]
  27. Khalil, M.T.; El-Rakman, N.S.A. Abundance and diversity of surface zooplankton in the Gulf of Aqaba, Red Sea, Egypt. J. Plankton Res. 1997, 19, 927–936. [Google Scholar] [CrossRef]
  28. Farstey, V.; Lazar, B.; Genin, A. Expansion and homogeneity of the vertical distribution of zooplankton in a very deep mixed layer. Mar. Ecol. Prog. Ser. 2002, 238, 91–100. [Google Scholar] [CrossRef]
  29. El-Sherbiny, M.M.; Reny, P.D.; Muller, E.M.; Al- Sofyani, A.A.; Al-Aidaroos, A.M. Biodiversity and abundance of plankton communities along the coastal waters of Gulf of Aqaba, Saudi Arabia. Pak. J. Zool. 2019, 51, 1823–1836. [Google Scholar] [CrossRef]
  30. Almeida Prado-Por, M.S. The diversity and dynamics of Calanoida (Copepoda). Oceanol. Acta 1983, 6, 139–145. [Google Scholar]
  31. Böttger-Schnack, R.; Hagen, W.; Schnack-Schiel, S.B. The microcopepod fauna in the Gulf of Aqaba, northern Red Sea: Species diversity and distribution of Oncaeidae (Poecilostomatoida). J. Plankton Res. 2001, 23, 1029–1035. [Google Scholar] [CrossRef] [Green Version]
  32. Cornils, A.; Niehoff, B.; Richter, C.; Al-Najjar, T.; Schnack-Schiel, S.B. Seasonal abundance and reproduction of clausocalanid copepods in the northern Gulf of Aqaba (Red Sea). J. Plankton Res. 2006, 29, 57–70. [Google Scholar] [CrossRef]
  33. Parsons, T.R.; Maita, Y.; Lalli, C.M. A Manual of Biological and Chemical Methods for Seawater Analysis; Pergamon: Oxford, UK, 1984. [Google Scholar]
  34. Dyson, N.; Jitts, H.R.; Scott, B.D. Techniques for measuring oceanic primary production using radioactive carbon. In Division of Fisheries and Oceanography; CSIRO: Melbourne, Australia, 1965. [Google Scholar]
  35. Sameoto, D.; Wiebe, P.; Runge, J.; Postel, L.; Dunn, J.; Miller, C.; Coombs, S. Collecting zooplankton. In ICES Zooplankton Methodology Manual; Harris, R., Wiebe, P., Lenz, J., Skjoldal, H.R., Huntley, M.E., Eds.; Academic Press: London, UK, 2000; pp. 55–81. [Google Scholar]
  36. Tokioka, T. The taxonomical outline of Chaetognatha. Publ. Seto Mar. Biol. Lab. 1965, 12, 335–357. [Google Scholar] [CrossRef]
  37. Michel, H.B. Chaetognatha of the Carribean sea and adjacent areas. NOAA Technical Rep. NMFS 1984, 15, 1–33. [Google Scholar]
  38. Mclelland, J.A. An illustrated key to the chaetognatha of the northern Gulf of Mexico with notes on their distribution. Gulf Res. Rep. 1989, 8, 145–172. [Google Scholar] [CrossRef]
  39. McLaren, I.A. Population and production ecology of zooplankton in Ogac Lake, a landlocked fiord on Baffin Island. J. Fish. Res. Board Can. 1969, 26, 1485–1559. [Google Scholar] [CrossRef]
  40. Zo, Z. Breeding and growth of the Chaetognath Sagitta elegans in Bedford basin. Limnol. Oceanogr. 1973, 18, 750–756. [Google Scholar] [CrossRef]
  41. Kürten, B.; Al-Aidaroos, A.M.; Kürten, S.; El-Sherbiny, M.M.; Devassy, R.P.; Struck, U.; Zarokanellos, N.; Jones, B.H.; Hansen, T.; Bruss, G.; et al. Carbon and nitrogen stable isotope ratios of pelagic zooplankton elucidate ecohydrographic features in the oligotrophic Red Sea. Prog. Oceanogr. 2016, 140, 69–90. [Google Scholar] [CrossRef] [Green Version]
  42. Karati, K.K.; Al-Aidaroos, A.M.; Devassy, R.P.; El-Sherbiny, M.M.; Jones, B.H.; Sommer, U.; Kürten, B. Ecohydrographic control on the community structure and vertical distribution of pelagic Chaetognatha in the Red Sea. Mar. Biol. 2019, 166, 30. [Google Scholar] [CrossRef] [Green Version]
  43. Clarke, K.R.; Gorley, R.N. PRIMER v6: User Manual/Tutorial; PRIMER-E Ltd.: Plymouth, UK, 2006. [Google Scholar]
  44. ter Braak, C.J.; Verdonschot, P.F. Canonical correspondence analysis and related multivariate methods in aquatic ecology. Aquat. Sci. 1995, 57, 255–289. [Google Scholar] [CrossRef]
  45. Reiss, Z.; Hottinger, L. The Gulf of Aqaba: Ecological Micropaleontology; Springer Science and Business Media: New York, NY, USA, 2012. [Google Scholar]
  46. Genin, A.; Lazar, B.; Brenner, S. Vertical mixing and coral death in the Red Sea following the eruption of Mount Pinatubo. Nature 1995, 377, 507–510. [Google Scholar] [CrossRef]
  47. Berman, T.; Paldor, N.; Brenner, S. Simulation of wind-driven circulation in the Gulf of Elat (Aqaba). J. Mar. Sys. 2000, 26, 349–365. [Google Scholar] [CrossRef]
  48. Yahel, G.; Post, A.F.; Fabricius, K.; Marie, K.D.; Vaulot, D.; Genin, A. Phytoplankton distribution and grazing near coral reefs. Limnol. Oceanogr. 1998, 43, 551–563. [Google Scholar] [CrossRef]
  49. Timonin, A.G. The structure of plankton communities of the Indian Ocean. Mar. Biol. 1971, 9, 281–289. [Google Scholar] [CrossRef]
  50. Terazaki, M. Life history strategy of the chaetognath Sagitta elegans in the World Oceans. Coast. Mar. Sci. 2004, 29, 1–12. [Google Scholar]
  51. Yoon, H.; Ko, A.R.; Kang, J.H.; Choi, J.K.; Ju, S.J. Diet of chaetognatha Sagitta crassa and S. nagae in the yellow sea inferred from Gut content and fatty acid analyses. Ocean Polar Res. 2016, 38, 5–46. [Google Scholar] [CrossRef] [Green Version]
  52. Kusum, K.K.; Vineetha, G.; Raveendran, T.V.; Muraleedharan, K.R.; Nair, M.; Achuthankutty, C.T. Impact of oxygen-depleted water on the vertical distribution of Chaetognatha in the northeastern Arabian Sea. Deep Sea Res. Part I 2011, 58, 1163–1174. [Google Scholar] [CrossRef]
  53. Nair, V.R. Bathymetric distribution of Chaetognatha in the Indian Ocean. Indian J. Mar. Sci. 1978, 7, 276–282. [Google Scholar]
  54. Kusum, K.K.; Vineetha, G.; Raveendran, T.V.; Nair, V.R.; Muraleedharan, K.R.; Achuthankutty, C.T.; Joseph, T. Chaetognath community and their responses to varying environmental factors in the northern Indian Ocean. J. Plankton Res. 2014, 36, 1146–1152. [Google Scholar] [CrossRef] [Green Version]
  55. Nair, V.R.; Kusum, K.K.; Gireesh, R.; Nair, M. The distribution of the Chaetognatha population and its interaction with environmental characteristics in the Bay of Bengal and the Arabian Sea. Mar. Biol. Res. 2015, 11, 269–282. [Google Scholar] [CrossRef]
  56. Buchanan, P.J.; Beckley, L.E. Chaetognaths of the Leeuwin Current system: Oceanographic conditions drive epi-pelagic zoogeography in the south-east Indian Ocean. Hydrobiologia 2016, 763, 81–96. [Google Scholar] [CrossRef] [Green Version]
  57. Maillard, C.; Soliman, G. Hydrography of the Red Sea and exchange with Indian Ocean in summer. Oceanol. Acta 1986, 9, 249–269. [Google Scholar]
  58. Furnestin, M.L.; Codaccioni, J.C. Chaetognathes du Nord-Ouest de l’Océan Indien (golfe d’Aden, Mer d’Arabie, golfe d’Oman, golfe Persique). Cah. ORSTOM Sér Océanogr. 1968, 6, 143–171. [Google Scholar]
  59. Haghi, M.; Savari, A.; Madiseh, S.D.; Zakeri, M. Abundance of pelagic chaetognaths in northwestern Persian Gulf. Plankton Benthos Res. 2010, 5, 44–48. [Google Scholar] [CrossRef] [Green Version]
  60. Klinker, J.; Reiss, Z.; Kropach, C.; Levanon, I.; Harpaz, H.; Halicz, E.; Assaf, G. Observations on the circulation pattern in the Gulf of Aqaba (Elat), Red Sea. Israel J. Earth-Sci. 1976, 25, 85–103. [Google Scholar]
  61. Kusum, K.K.; Vineetha, G.; Raveendran, T.V.; Muraleedharan, K.R.; Biju, A.; Achuthankutty, C.T. Influence of upwelling on distribution of chaetognath (zooplankton) in the oxygen deficient zone of the eastern Arabian Sea. Cont. Shelf Res. 2014, 78, 16–28. [Google Scholar] [CrossRef]
  62. Zhang, D.; Xu, Z.L. Estimating optimal salinity and temperature of chaetognaths. J. Mar. Biol. Assoc. UK 2012, 92, 1399–1407. [Google Scholar] [CrossRef]
  63. Schmidt, H.E. The vertical distribution and diurnal migration of some zooplankton in the Bay of Eilat (Red Sea). Helgoländer Wiss. Meeresunters. 1973, 24, 333–340. [Google Scholar] [CrossRef] [Green Version]
  64. Hays, G.C.; Harris, R.P.; Head, R.N. Diel changes in the near-surface biomass of zooplankton and the carbon content of vertical migrants. Deep-Sea Res. Part II 2001, 48, 1063–1068. [Google Scholar] [CrossRef]
  65. Vineetha, G.; Jyothibabu, R.; Madhu, N.V.; Sooria, P.M.; Shivaprasad, A.; Reny, P.D.; Deepak, M.P. Tidal influence on the diel vertical migration pattern of zooplankton in a tropical monsoonal estuary. Wetlands 2015, 35, 597–610. [Google Scholar] [CrossRef]
  66. Lie, A.A.; Tse, P.; Wong, C.K. Diel vertical migration and feeding of three species of chaetognaths (Flaccisagitta enflata. Aidanosagitta delicata and Aidanosagitta neglecta) in two shallow, subtropical bays in Hong Kong. J. Plankton Res. 2012, 34, 670–684. [Google Scholar]
  67. Hays, G.C. A review of the adaptive significance and ecosystem consequences of zooplankton diel vertical migrations. Hydrobiologia 2003, 503, 163–170. [Google Scholar] [CrossRef]
Figure 1. Sampling locations in the Saudi Arabian waters of Gulf of Aqaba.
Water 14 00822 g001
Figure 2. Distribution of (a) temperature (°C), (b) salinity, (c) density (kg m−3), and (d) dissolved oxygen (mL L−1), in the upper 200 m of the Gulf of Aqaba during summer.
Water 14 00822 g002
Figure 3. Vertical profile of chlorophyll a (mg m−3) along the station locations in Gulf of Aqaba. The column chlorophyll a (mg m−2) values for the locations are displayed inset.
Water 14 00822 g003
Figure 4. Diel abundance (ind m−3) of copepod in (a) vertical, (c) horizontal surface haul and of chaetognath in (b) vertical, (d) horizontal surface haul.
Water 14 00822 g004
Figure 5. Diel variability in the abundances of chaetognath species (ind m−3) in the (a) vertical and (b) horizontal surface sampling in the Gulf of Aqaba. The whiskers indicate the standard deviation.
Water 14 00822 g005
Figure 6. The percentage contribution of the maturity stages of the chaetognath species.
Water 14 00822 g006
Figure 7. The (a) copepod to chaetognath abundance ratio and (b) carbon and nitrogen content (mg m−3) in copepod and chaetognath in the Gulf of Aqaba.
Water 14 00822 g007
Figure 8. Cluster analyses showing diel scale similarity of different station locations (D day, N night) based on the species-specific abundances of chaetognath in (a) vertical, and (b) horizontal surface sampling.
Water 14 00822 g008
Figure 9. The Canonical correspondence analysis plot exhibiting the preferred environment of the chaetognath species in the upper 200 m water column of Gulf of Aqaba. The red spots in the plot represent the sampling locations.
Water 14 00822 g009
Table 1. The spatial abundance (ind m−3) of the chaetognath species in the vertical and horizontal surface sampling. The average abundance of the diel sampling was used for the table (ave ± 1 SD).
ChaetognathsSt 1
Vertical
St 2
Vertical
St 3
Vertical
St 4
Vertical
St 1
Surface
St 2
Surface
St 3
Surface
St 4
Surface
Aidanosagitta regularis5.1 ± 214 ± 12.320.7 ± 2.43.2 ± 1.10.051 ± 0.0540.071 ± 0.0940.112 ± 0.1330.061 ± 0.076
Decipisagitta decipiens0.6 ± 0.12.9 ± 39.1 ± 2.31.2 ± 1.10.009 ± 0.0030.006 ± 0.0070.005 ± 0.0020.033 ± 0.047
Flaccisagitta enflata2 ± 0.31.3 ± 13.8 ± 2.96 ± 0.20.003 ± 0.00040.032 ± 0.0450.001 ± 0.0010.043 ± 0.055
Flaccisagitta hexaptera0.4 ± 0.20.04 ± 0.10.8 ± 0.30.3 ± 0.50.002 ± 0.0020.004 ± 0.006
Serratosagitta pacifica9.7 ± 1.514.8 ± 11.956.8 ± 28.221.1 ± 5.30.106 ± 0.0690.283 ± 0.3940.012 ± 0.0060.222 ± 0.292
Publisher’s Note: MDPI stays neutral with regard to jurisdictional claims in published maps and institutional affiliations.

