
Effects of the Invasive Fish Species Ameiurus nebulosus on Microbial Communities in Peat Pools
by
 , and
, and
Tomasz Mieczan
* ,
,
Wojciech Płaska
,
Małgorzata Adamczuk
,
Magdalena Toporowska
and
Aleksandra Bartkowska
Department of Hydrobiology and Protection of Ecosystems, University of Life Sciences, Dobrzańskiego 37, 20-262 Lublin, Poland
*
Author to whom correspondence should be addressed.
Water 2022, 14(5), 815; https://doi.org/10.3390/w14050815
Submission received: 20 January 2022
/
Revised: 27 February 2022
/
Accepted: 3 March 2022
/
Published: 5 March 2022
(This article belongs to the Section Biodiversity and Functionality of Aquatic Ecosystems)
Abstract
:Disturbances in the functioning of peatlands, due to growing human impact, climate change and the appearance of alien invasive species, are becoming increasingly common. Analysis of trophic relationships in the predator (invasive alien species)–prey system is extremely important for understanding the functioning of peat pools—small water bodies formed in peatlands by peat extraction. These issues are, as yet, very little understood. The aim of this study was to examine the impact of Ameiurus nebulosus, an alien and invasive fish species dominant in these pools, on the microbial communities and small metazoa (phycoflora, bacteria, heterotrophic flagellates, ciliates, and crustaceans) in peat pools. The laboratory experiment included two groups of treatments simulating natural conditions: treatments without fish and treatments with brown bullhead. The water temperature was manipulated as well. The presence of brown bullhead in combination with climate changes was shown to cause a change in the structure of microbial communities. This is reflected in a decrease in the abundance of planktonic crustaceans and an increase in ciliates. The overlapping effects of alien species and gradual climate warming may intensify the eutrophication of peatland ecosystems and the increase in the proportion of cyanobacteria, thereby affecting the carbon cycle in these ecosystems.
1. Introduction
Peatlands are generally biodiverse and play an important role in carbon cycling [1]. At the same time, pronounced climate change—particularly increasing temperature—and the increasingly common occurrence of invasive plant and animal species in these ecosystems can contribute to their degradation and significant disturbances in their functioning [2]. One of the factors degrading these ecosystems is peat extraction, which leads to the formation of pits filled with water (peat pools), which undergo succession and colonization. In raised bogs, these pools have low pH, high concentrations of humic matter, and typically brown water, which reduces primary productivity. These pools are often used as model systems in biological research, especially in connection with global warming [3,4]. The low pH in these water bodies limits the occurrence of many groups of organisms. They often do not contain fish, so the role of top predators may be taken over by certain groups of invertebrates, such as Hemiptera, and in the microbial food web by testate amoeba. However, in some such pools in Central Europe, the invasive alien species Ameiurus nebulosus—the brown bullhead—is increasingly recorded. The brown bullhead is an alien species from North America and was introduced to European freshwater ecosystems [5]. Its effects on lake ecosystems, particularly its impact on native fish species, have been described. This impact has mainly been in the form of predation, competition for food resources, habitat destruction, as well as parasite transmission [6,7]. Ameiurus nebulosus is an opportunistic species that usually consume the food that is most abundant [8], while its diet varies depending on its age and size. According to research by authors, such as Gunn et al. [9], Hill et al. [10] and Declerk et al. [11], in natural conditions, the brown bullhead feeds on benthic macroinvertebrates as well as zooplankton and filamentous algae. Studies on zooplankton in lake ecosystems show that predation pressure from fish mainly decreases the abundance of large planktonic cladocerans (e.g., Daphnia galeata) and increases the proportion of small-sized species (e.g., Ceriodaphnia spp.) [12]. Riemann [13] showed that an experimental increase in fish abundance was conducive to an increase in the abundance of heterotrophic flagellates, most likely due to reduced predation pressure from cladocerans, which are consumed by fish. An additional factor that may influence the size structure of aquatic organisms is temperature [14,15,16]. However, there is no literature data on the trophic relationships between brown bullhead and the major microbial elements of the food web in peat pools, taking into account the global increase in water temperature. It seems likely that the food web structure will show clear differences in both abundance and size structure in peat pools colonized by brown bullhead in comparison with those without fish. In the fishless pools, testate amoebae and planktonic crustaceans are likely to play an important role in controlling the abundance of organisms from lower trophic levels and nutrient recycling [17,18].
The objective of this study was to test the following hypotheses: predation pressure from ‘top predators’ (brown bullhead) significantly influences the abundance and size structure of aquatic organisms. This effect increases with temperature, as according to the ‘metabolic theory’ [14] an increase in temperature enhances the effect of the ‘top-down’ regulation mechanism.
2. Materials and Methods
2.1. Study Area
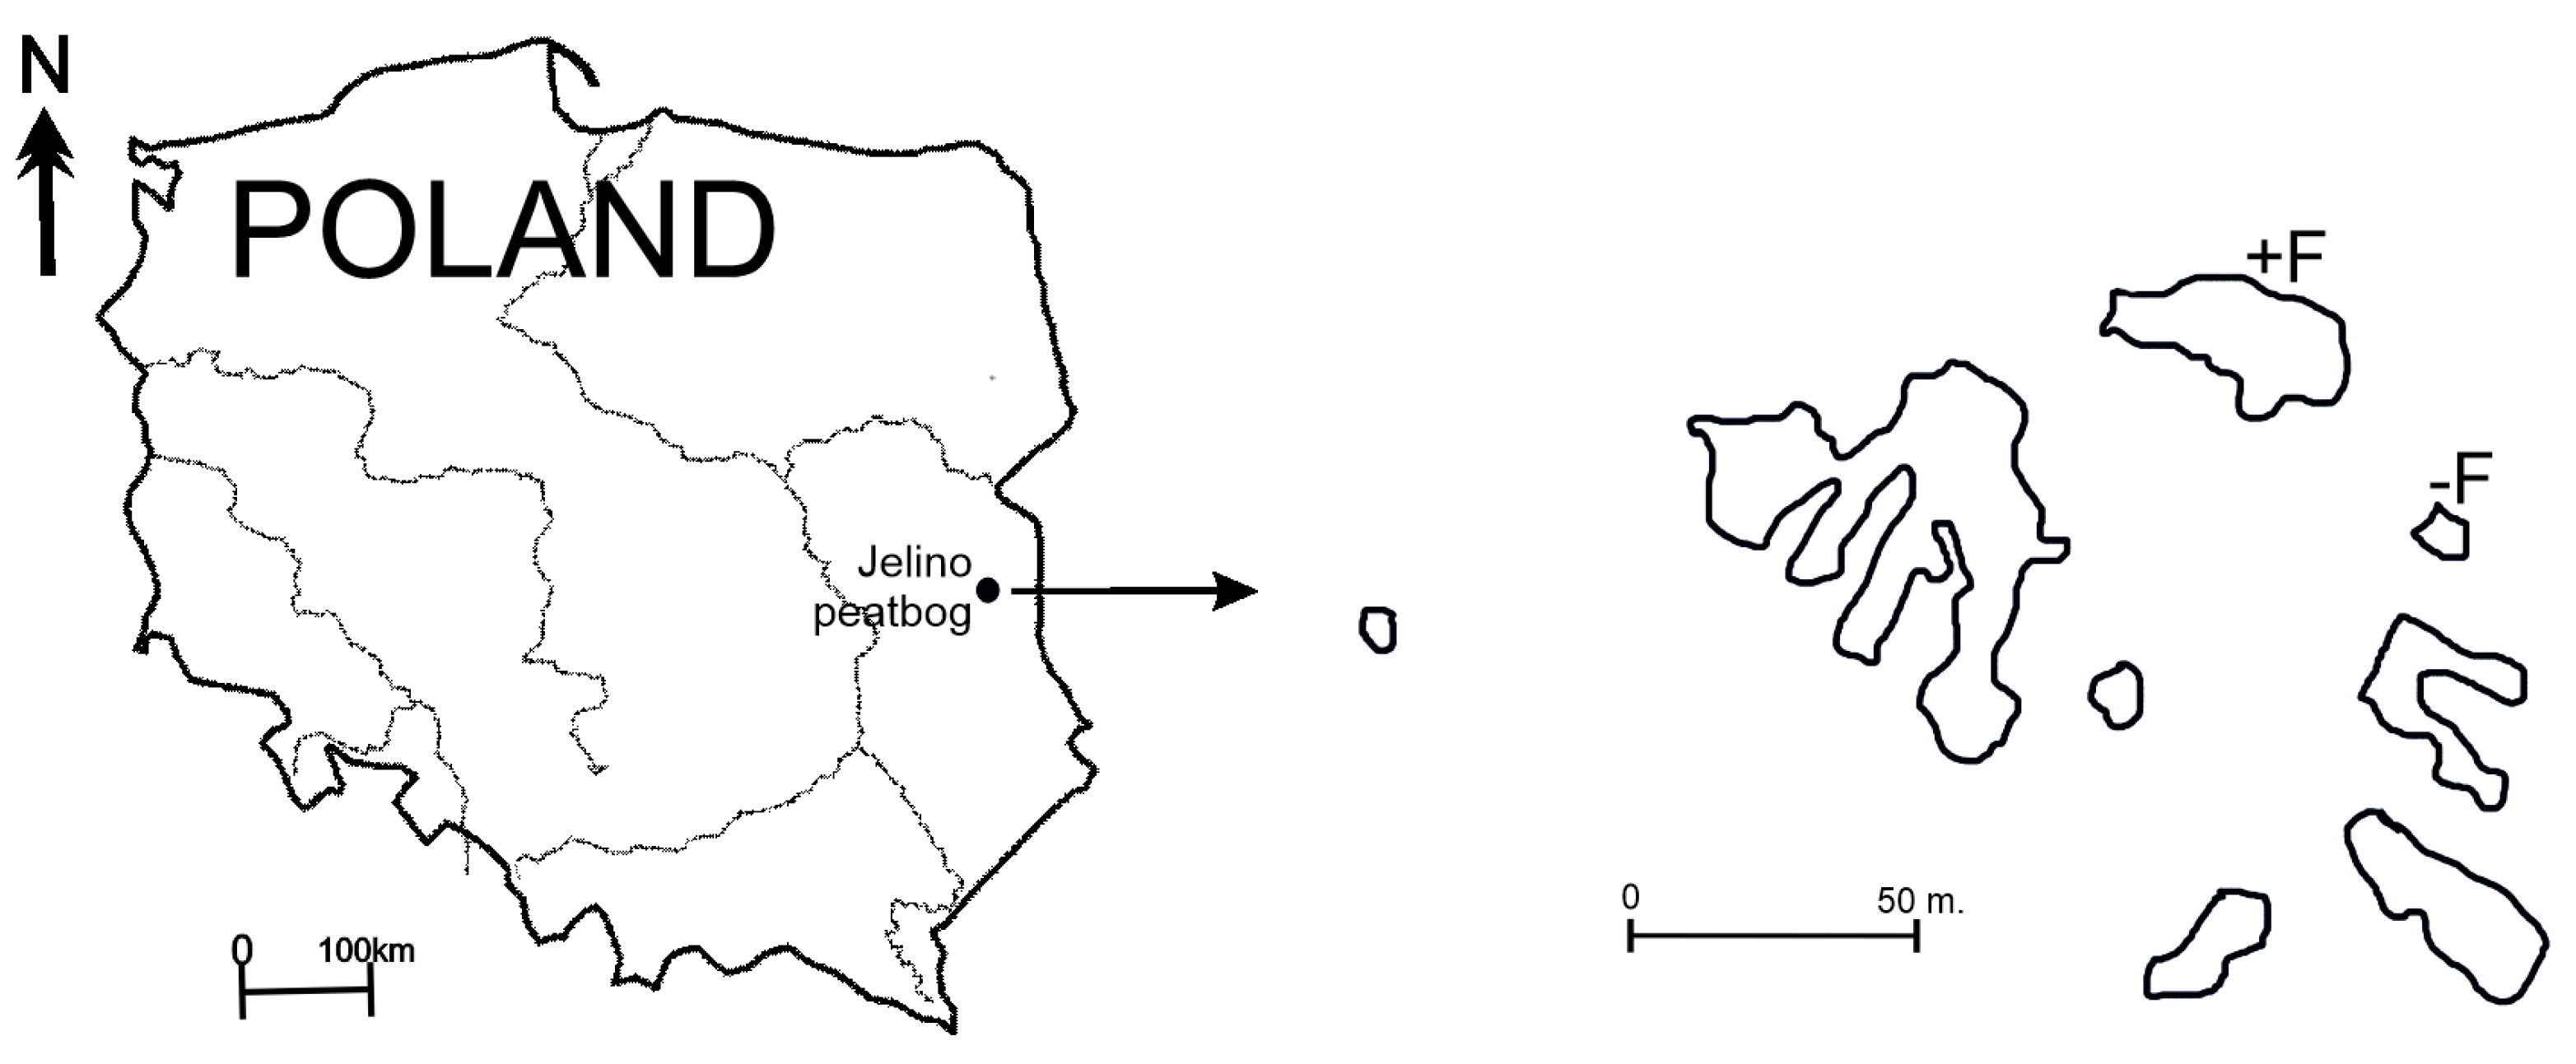
The study area comprised two peat pools (eastern Poland, 51° N, 23° E) located in the Jelino peat bog (Figure 1). The peat pond surface area ranged from 0.35 to 0.5 ha and had a maximum depth of 2.2 m. The peat bog was formed of Sphagnum angustifolium (C.C.O. Jensen ex Russow), Sphagnum cuspidatum Ehrh. ex Hoffm., Polytrichum spp., Eriophorum vaginatum (L.), Carex acutiformis Ehrhart., Carex gracilis Curt., and Equisetum limosum (L.). One of the two pools used in the experiment was a fishless pool (−F), while a population of brown bullhead was present in the other (+F).
2.2. Microcosm Experiments
Water for the laboratory experiment was taken from the two peat pools (−F and +F), placed in 30 L plastic containers, and transported to the laboratory, where the experiment was set up in glass aquariums. Microbial communities were examined in 30 L aquariums (0.25 m diameter, 15 cm deep). To create conditions similar to natural ones, a 4 cm layer of bottom sediment collected from the peat pools was placed in each aquarium. The laboratory experiment consisted of treatments simulating the fishless peat pond (−F) and treatments simulating the peat pond with fish, i.e., the alien invasive species Ameiurus nebulosus (+F). At the same time, in each of the treatments (−F and +F), the effect of climate warming on individual communities of organisms was simulated. Temperature change was not simulated in the control sample (CT), while in the other treatments the temperature was increased by 2 °C and 4 °C using the TX-30 temperature modification system. The experiment included aquaria simulating a fishless peat pond (−F), i.e., treatments −FCT (control), −FT + 2 °C and −FT + 4 °C, and treatments with fish: +FCT (control), +FT + 2 °C and +FT + 4 °C. ‘Microcosm’ experiments were conducted twice, in the spring and summer of 2020. In May and July, 18 experimental variants were conducted: 9 without fish (3 replications of each experimental treatment) and 9 with brown bullhead (3 replications of each experimental treatment). For the laboratory experiment simulating the peat pool with fish, brown bullhead specimens were obtained from the +F peat pool, and after a week-long acclimation period, two specimens were placed in each aquarium. The size of the fish used in the experiment was consistent with the average size of brown bullheads present in the peat pools, ranging from 4.5 to 9.5 cm.
2.3. Laboratory Analyses
The density of phycoflora, bacteria, HNFs, ciliates and crustaceans was determined at the start and end of the experiment (day 20). Water was sampled using a plexiglass corer. The abundance of phycoflora was determined using Utermöhl’s method. An amount of 100 mL of water was fixed with a formalin-glycerine solution, and then cyanobacteria and algae were counted [19]. Taxonomic identification of algae and cyanobacteria was referring mainly to Komárek and Fott [20], Komárek and Anagnostidis [21,22,23], Komárek [24], and Starmach [25]. Diatoms were, in most cases, identified to the genus level, according to Cox [26]. Algal taxonomy was based on Van den Hoek et al. [27]. The density and biomass of bacteria and flagellates were determined using DAPI. An amount of 10 mL of water was preserved in formaldehyde and then 2 mL of the subsamples were condensed on filters with 0.2 µm (bacteria) and (0.8 µm flagellates). The density of testate amoebae and ciliates and taxonomic composition were analyzed by Utermöhl’s method [28,29,30,31]. To determine the abundance of crustaceans in each of the experimental treatments, 100 mL of water was passed through a 30 µm sieve to separate the crustaceans. All individuals were identified at the species level and enumerated using a stereomicroscope Nikon SMZ800. Larvae (nauplii) and juvenile (copepodite) stages of Copepoda were also counted. Biomass was estimated from the relationship between the body length and body weight of a given specimen using established mathematic formulas [32,33,34]. Directly after the experiment was completed, the brown bullheads were weighed and measured and then sacrificed with 2-phenoxyethanol. The stomachs were removed and preserved in 4% formaldehyde. The fish were weighed on a laboratory scale to within 0.001 g and their total length (LT) was measured to within 0.1 cm (from the tip of the snout to the tip of the longest rays of the caudal fin). In the analysis of the stomach contents, the taxonomy of the organisms was determined and other food components were classified according to type. Where possible, the organisms in the stomach contents were identified to the lowest taxonomic rank using a Nikon SMZ800 stereoscopic microscope [35,36,37]. The weight and abundance of each identified food type and taxon in the sample were determined. Unidentified organic debris was classified as detritus. The weight of all food types was determined to be within 0.001 g.
2.4. Physical and Chemical Variables
In each of the experimental treatments, pH, temperature, conductivity, and dissolved oxygen (DO) were analyzed using a multiparametric probe (Hanna Instruments, Woonsocket, RI, USA). Total phosphorus (Ptot) and phosphates (P-PO43−) were determined by the colorimetric method; total nitrogen (Ntot), ammonia nitrogen (N-NH4) and nitrite nitrogen (N-NO2−) by the Kjeldahl method [38]. Chemical oxygen demand (COD), biological oxygen demand (BOD), total suspended solids (TSS) and total organic carbon (TOC) were analyzed by spectrophotometry.
2.5. Numerical Analyses
The abundance and biomass of micro-organisms and metazoan were compared between treatments using two-way ANOVA, p < 0.05. Correlations between different groups of organisms were calculated using Pearson’s coefficients. The analysis was performed using STATISTICA 7.0 software. Canonical correspondence analysis (CCA) was carried out to determine the relationships between microbial communities and metazoans and the environmental data. The analyses were performed using CANOCO 5.0 software [39].
3. Results
3.1. Environmental Variables
The water temperature varied between treatments (ANOVA, F1.33 = 63.0–64.2, p < 0.001). As the temperature increased in the experimental treatments (+2 °C, +4 °C), a substantial decrease in oxygen concentration was observed, as well as an increase in pH, conductivity and content of biogenic compounds (F1.33 = 62.11, p < 0.001). This was particularly pronounced in the experimental treatments with fish. In these treatments, the highest increase in concentrations of biogenic compounds was shown for total nitrogen (Ntot), which was >15 mg L−1 in the experimental treatments at the highest temperature (+4 °C). TOC, COD, BOD and TSS concentration also significantly increased in treatment +F + 4 °C (F1.33 = 62.71, p < 0.001) (Table 1).
3.2. Abundance and Size Structure
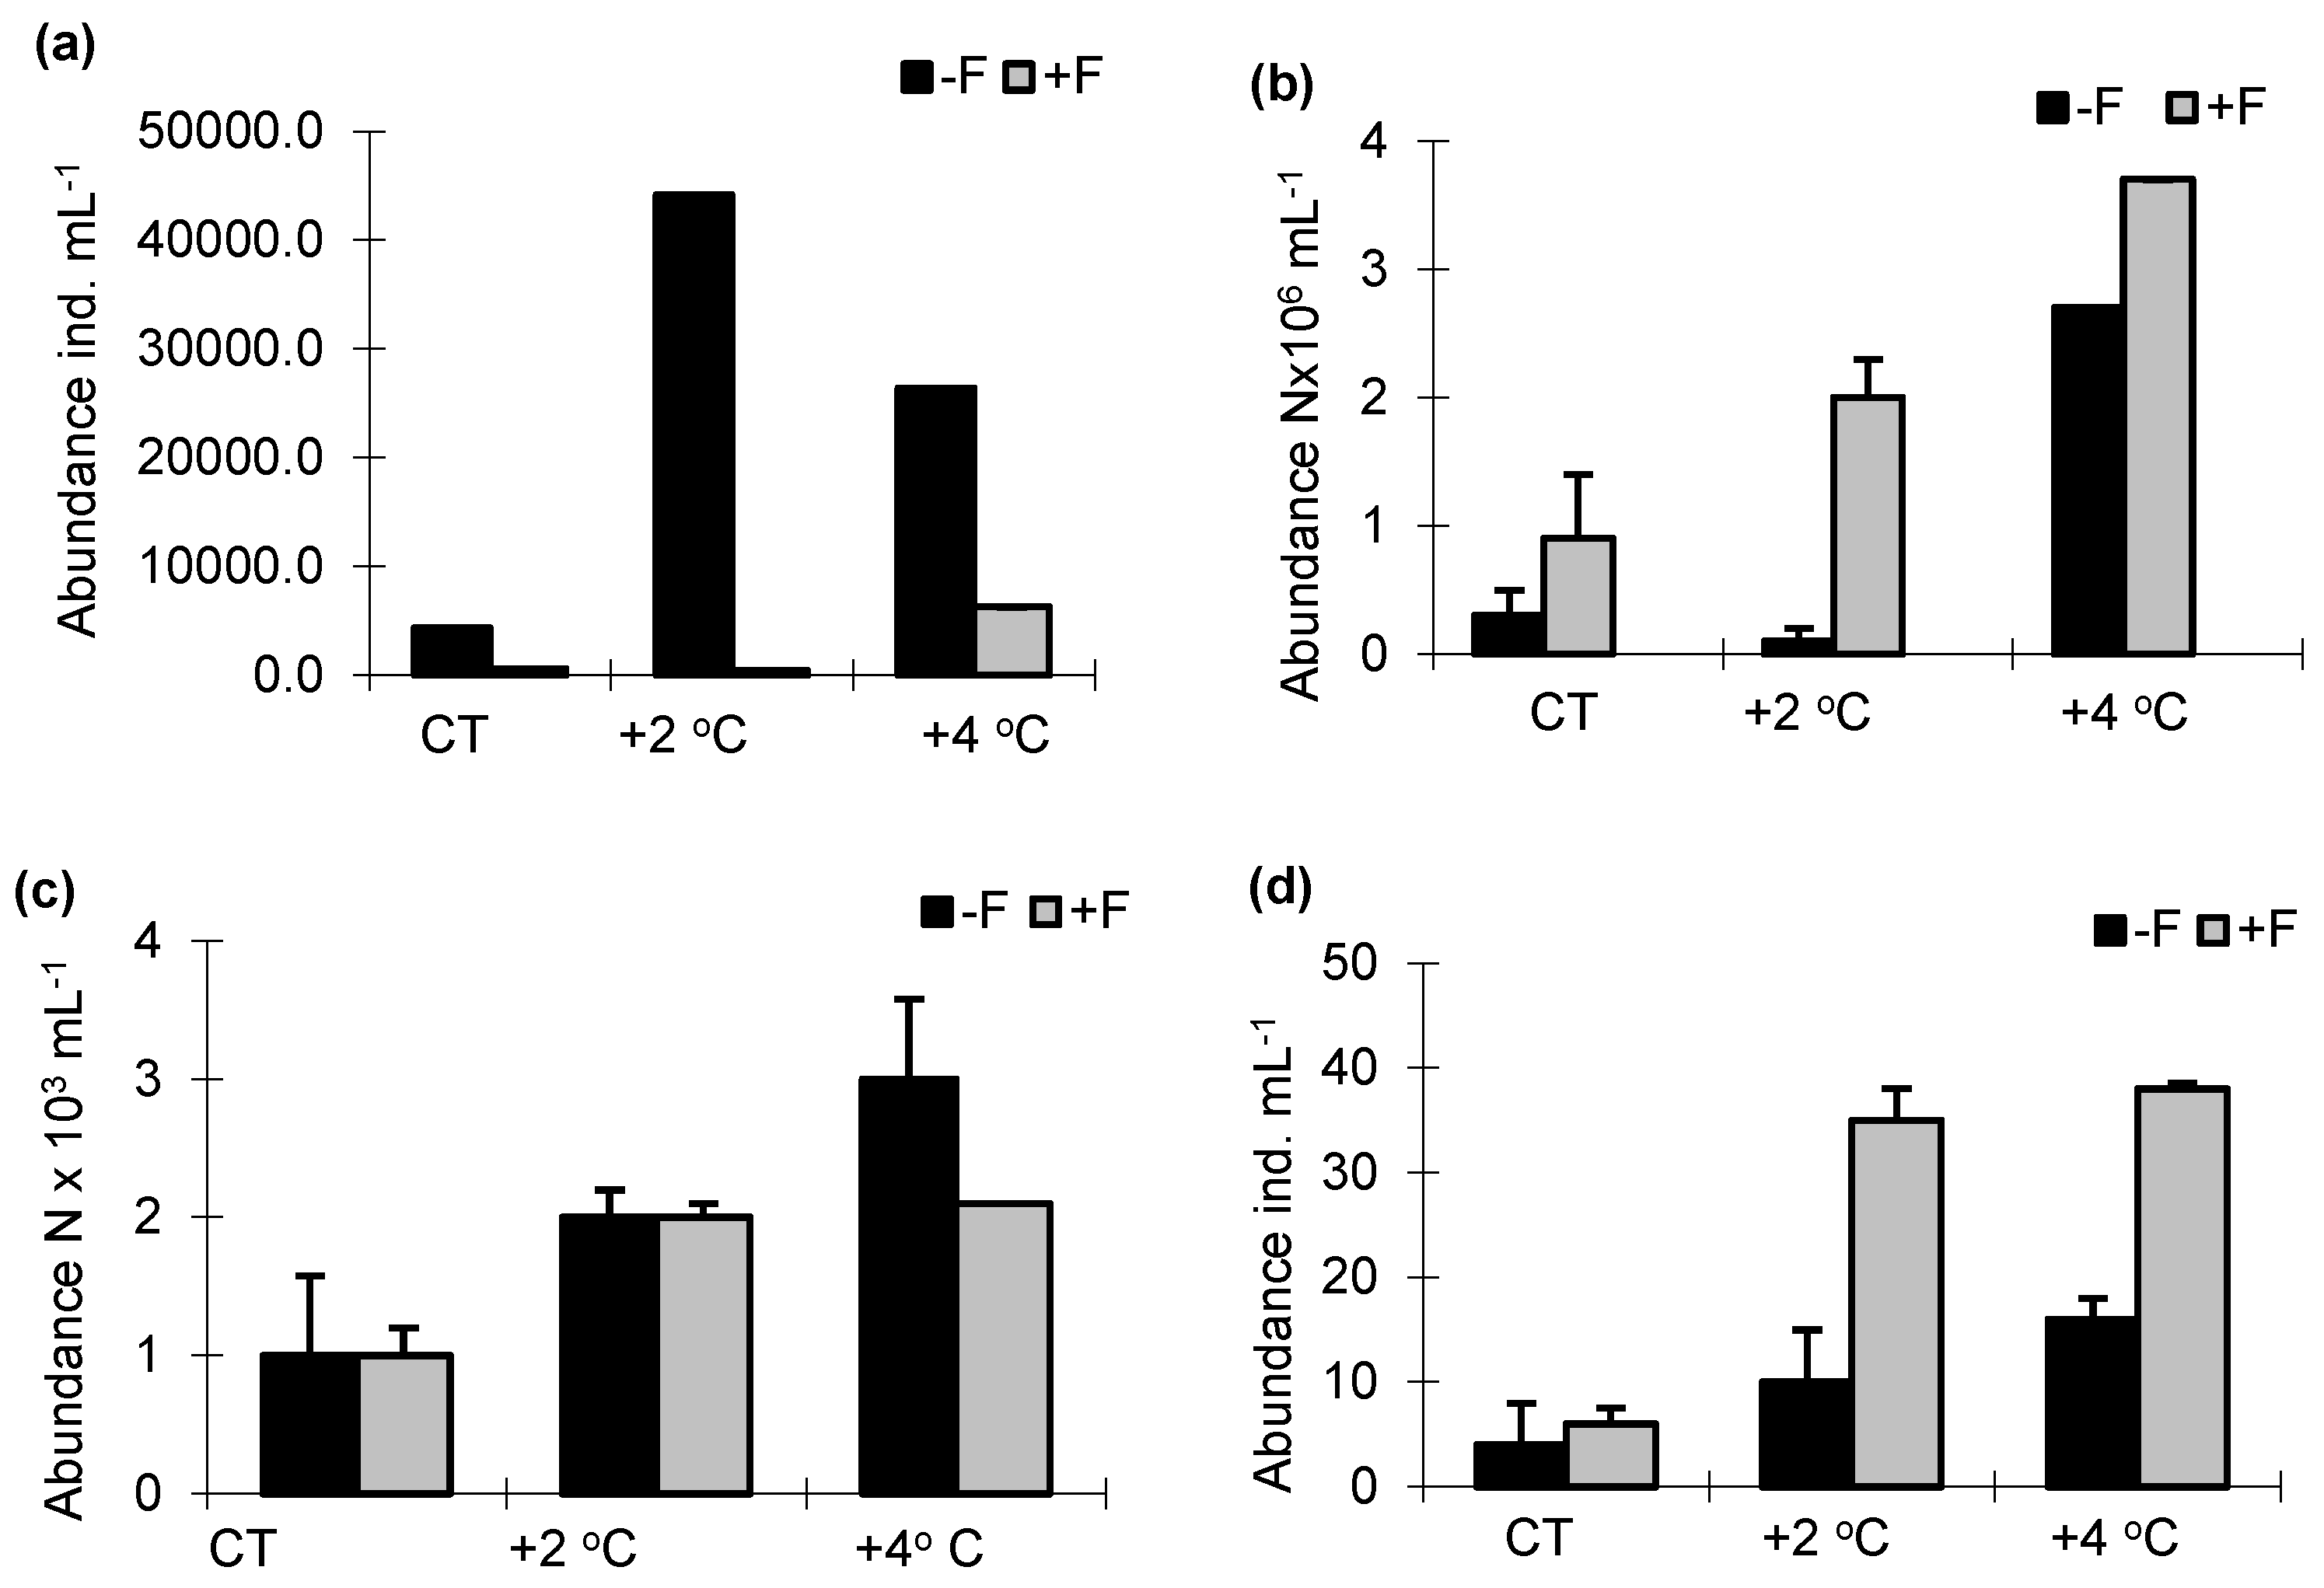
The density of phycoflora was significantly higher in the treatments without fish than in the treatments with fish (F1.33 = 62.71, p < 0.001). At the same time, the abundance of algae increased with the temperature, and it was markedly higher in the treatments without fish (Figure 2a). Irrespective of the experimental treatment, in the experiments with and without fish, the taxa with the highest proportions of the total phycoflora abundance were Chrysophyceae, Cryptophyceae and Chlorophyceae. The increase in water temperature caused an increase in the density of cyanobacteria, especially in the +F treatments. Bacterial abundance was significantly lower in the −F treatments; it increased with a 2 °C increase in temperature (−F + 2 °C), but decreased in the −F + 4 °C treatment (from 4.3 × 10⁶ cells mL−1 to 3.9 × 10⁶ cells mL−1) (F1.33 = 61.21, p < 0.001). In the +F experimental treatments, the highest bacterial abundance was noted at the highest temperature, +4 °C (3.9 × 10⁶ cells mL−1) (Figure 2b). At the same time, as the temperature increased, there was an increase in the proportion of small bacterial cells < 0.5 µm. Numbers of heterotrophic flagellates (HNF) were significantly higher in the −F treatments than in the +F treatments (2.3 × 10³ cells mL−1 and 1.9 × 10³ cells mL−1, respectively), and it increased with the temperature (F1.32 = 61.41, p < 0.001) (Figure 2c). Irrespective of the season, the proportion of forms of flagellates > 10 µm was markedly higher in the control samples. An abundance of testate amoebae was highest in the treatments without fish and increased with the temperature (F1.33 = 59.24, p < 0.001). The abundance of this group of organisms also increased with the temperature in the +F treatments (Figure 2d). Irrespective of the treatment, Arcella vulgaris had the highest share of the total abundance of testate amoebae. Ciliate abundance was higher in the treatments with fish than in the treatments without fish, and irrespective of the presence of fish, the abundance of these protozoans increased with the temperature (F1.33 = 63.34, p < 0.001) (Figure 2e). The ciliate community was dominated by Strombidium viride, Cinetochilum margaritaceum, Uronema spp., and Colpoda cucullus, which together always comprised > 80%. In the control sample, mainly Strombidium viride and Cinetochilum margaritaceum were dominant in the −F and +F treatments, while at the end of the experiment, Cinetochilum margaritaceum becomes dominant in the +F treatment, reaching 84% of the total abundance of ciliates.
In the −F treatments, as the temperature increased, there was an increase in the proportion of Paramecium bursaria (from 34% to 58% in the total abundance of ciliates). Planktonic cladocerans were more abundant in the −F treatments than in the +F treatments, and in treatment −F there was a marked increase in zooplankton at higher temperatures than in the control (from 8 ind. mL−1 to 12 ind. mL−1); it was highest in the +4 °C treatment—cladocerans: to 12 ind. mL−1 and in the +2 °C treatment—copepods: to 320 ind. mL−1. In the +F treatments, the abundance of crustaceans did not increase with the temperature; they were much more abundant in the control treatment (Figure 2f,g). Repeated-measures ANOVA revealed whether there were significant changes with temperature and between the treatments with and without brown bullhead.
3.3. Biomass
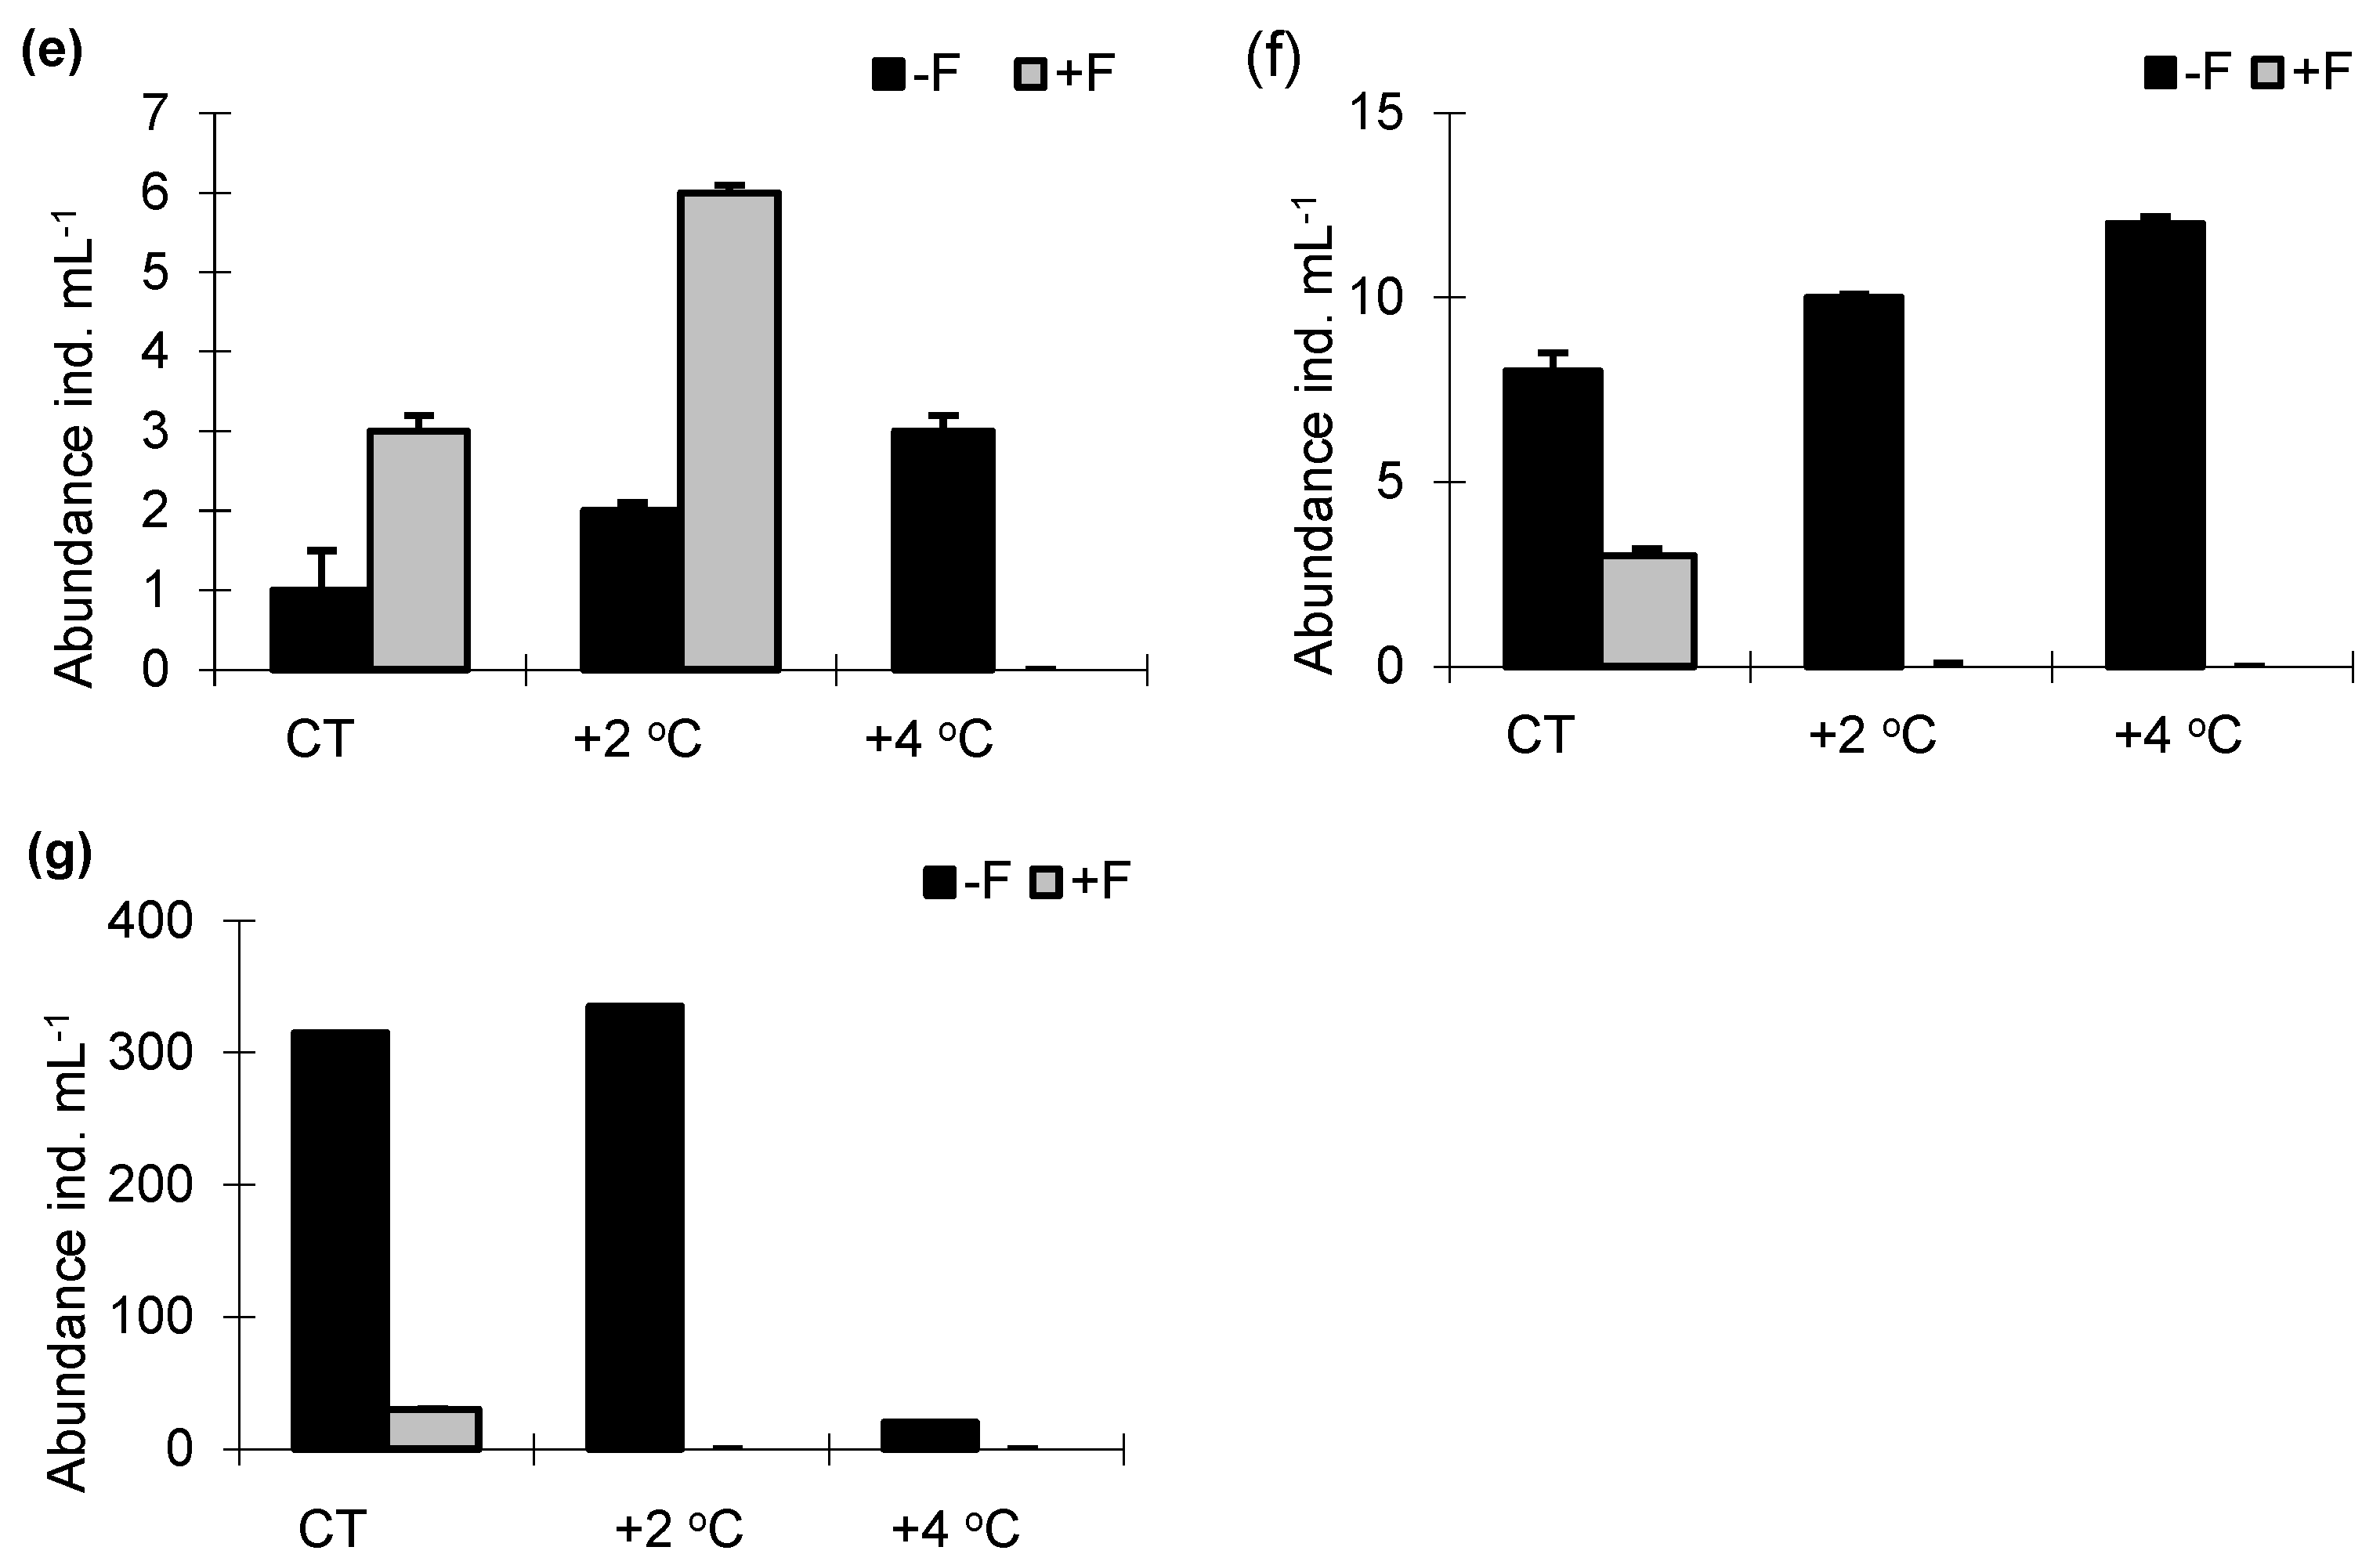
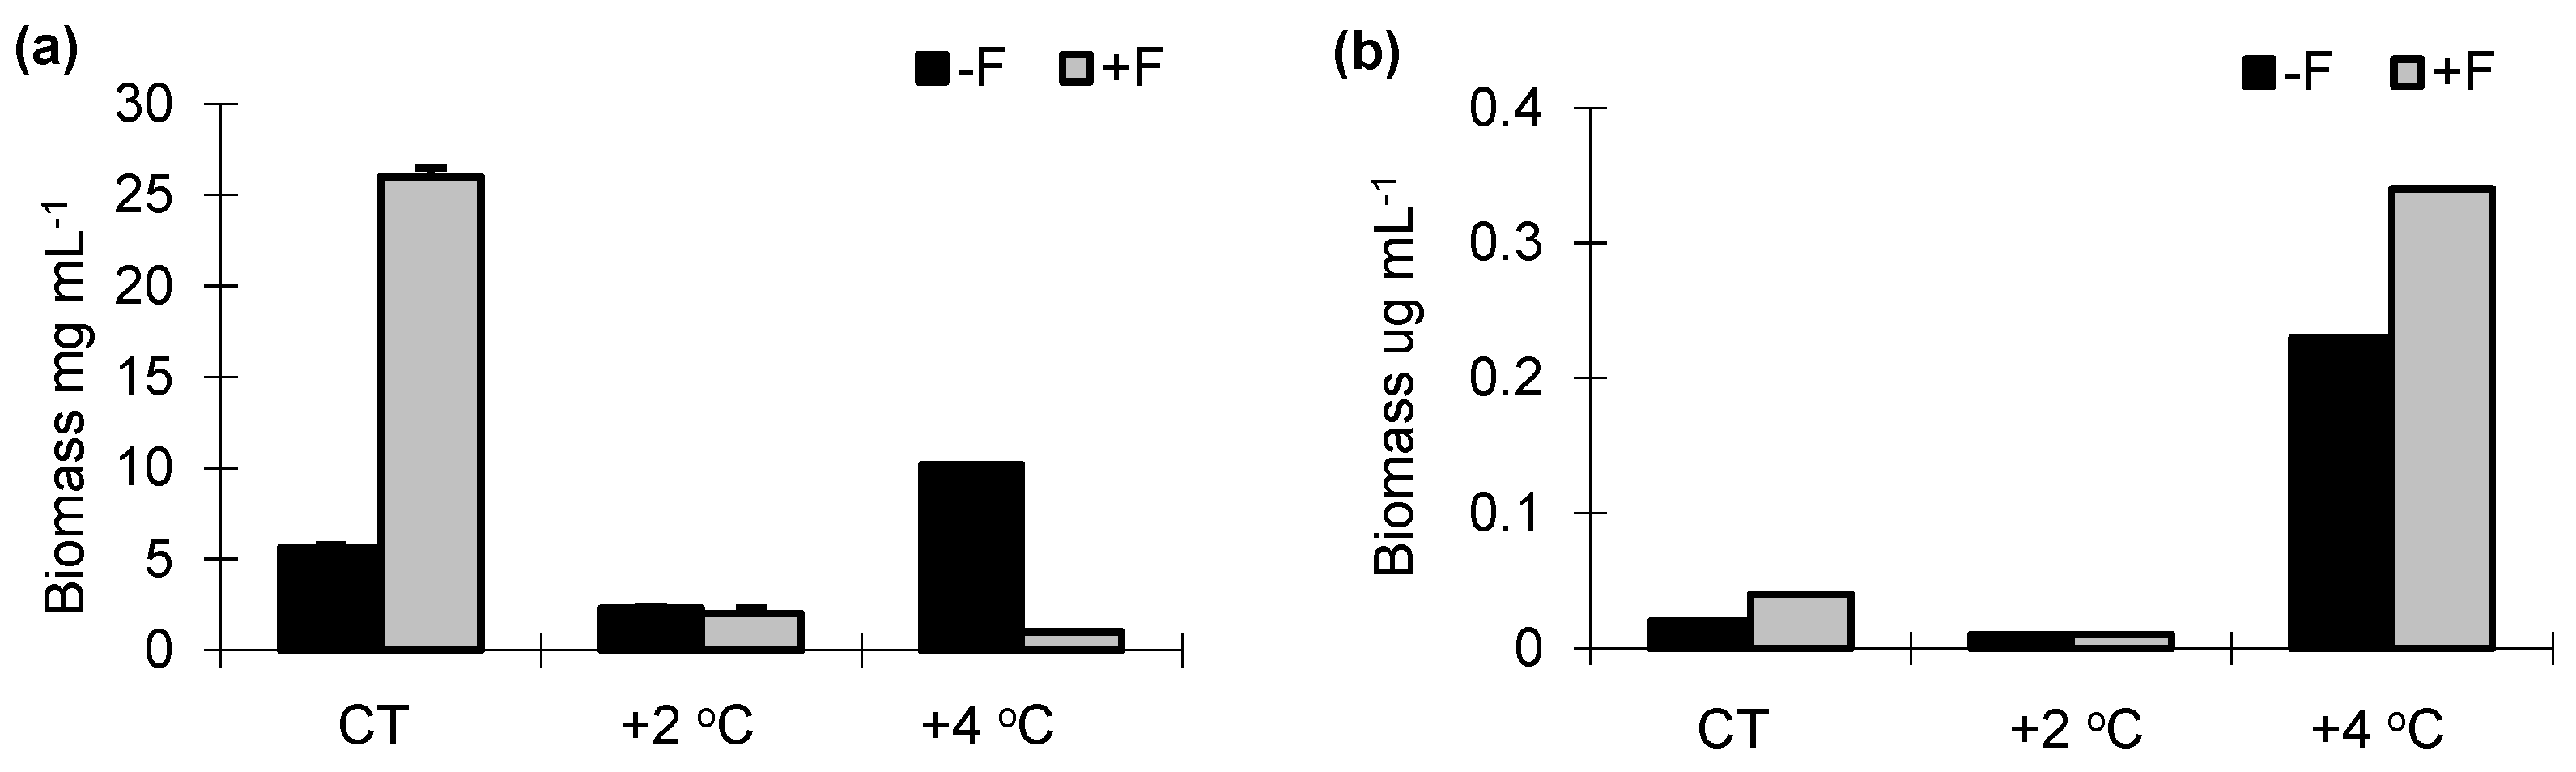
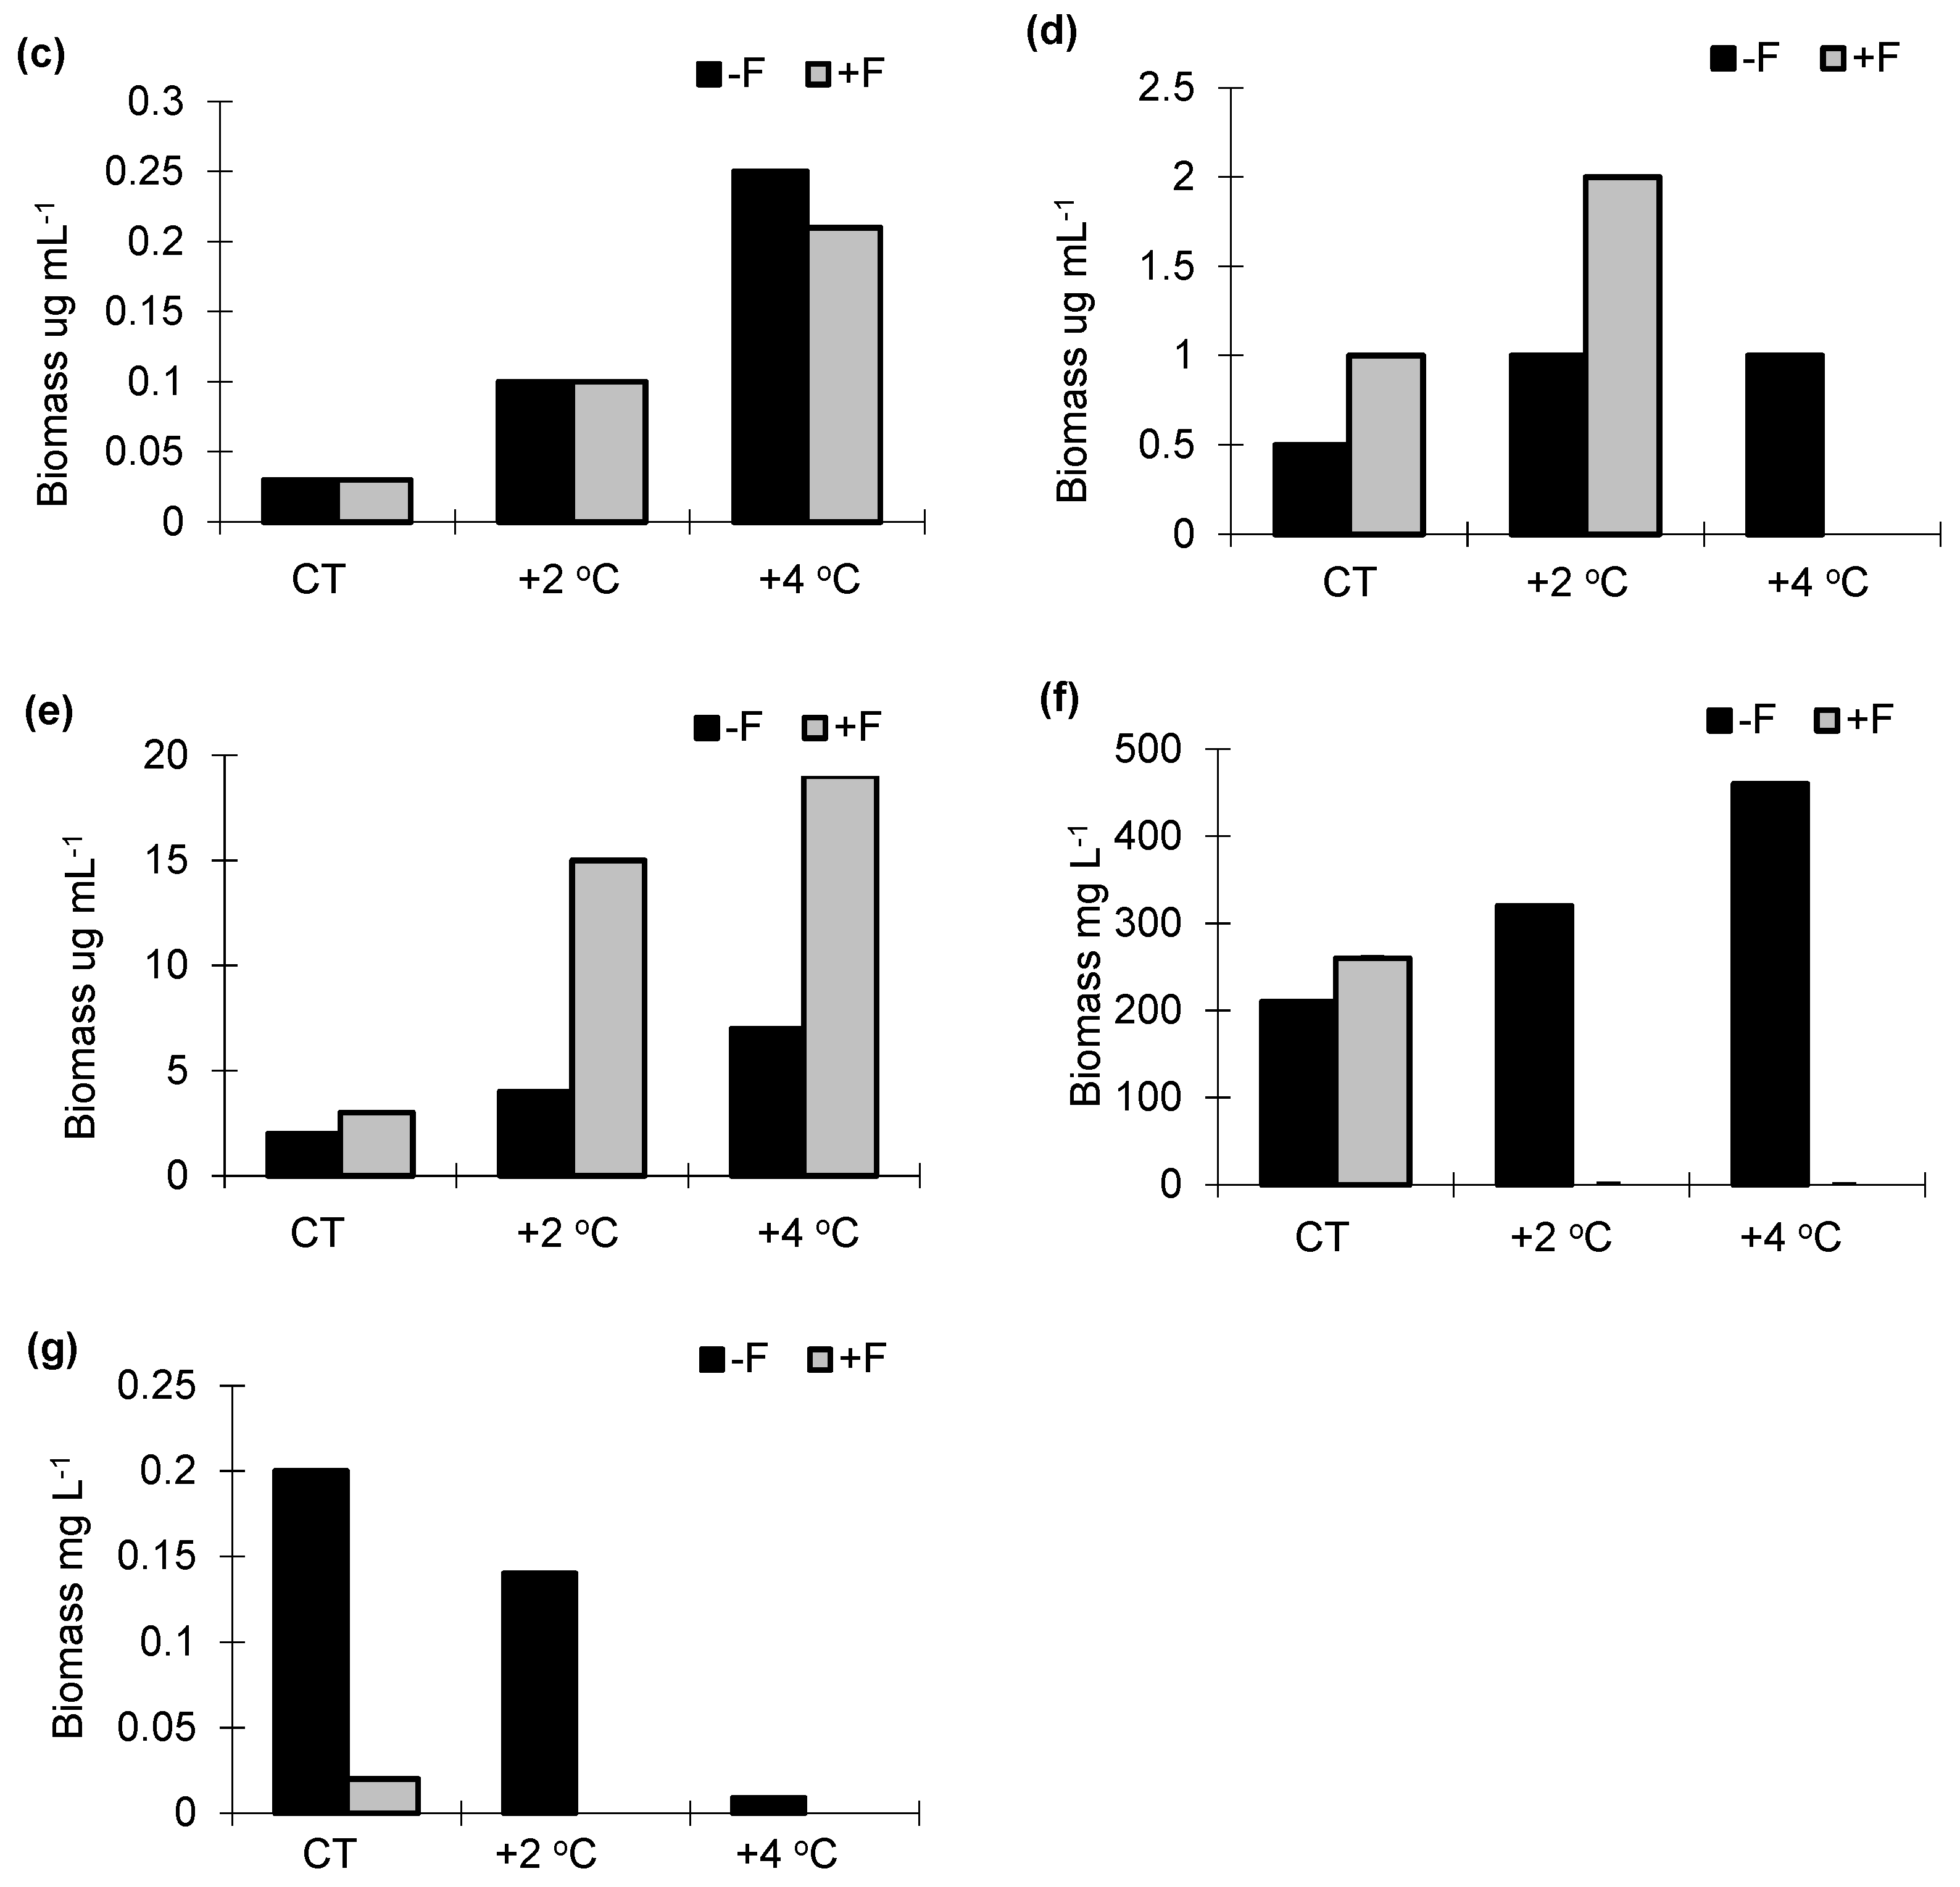
In the experiments without fish (−F), the highest biomass of phycoflora was noted in the control sample and the +4 °C treatment (26 mg mL−1) (Figure 3a), while bacteria, protozoans (flagellates, amoebae and ciliates) and cladocerans increased their biomass as the temperature increased. (Figure 3b–f).
The reverse trend was noted for copepods (Figure 3g). In the +F experiments, the highest biomass of phycoflora was noted in the control sample, and it significantly decreased as the temperature increased (F1.33 = 61.21, p < 0.001). The biomass of bacteria, flagellates and ciliates significantly increased with temperature (F1.33 = 62.74, p < 0.001), while that of testate amoebae significantly decreased (F1.23 = 52.31, p < 0.05). The biomass of crustaceans was highest in the control sample and dropped sharply in the warmer temperature treatments (Figure 3f,g). The largest total biomass in the control treatment was noted for crustaceans (30–55% of the total biomass). Phycoflora, in all treatments, ranged from 15% to 20% of the total biomass, and its contribution increased substantially by the end of the experiment. Bacteria constituted 7–10% of the total biomass. Flagellates and ciliates ranged from 2% to 6%. In the +F treatments, irrespective of the temperature variant, the proportion of heterotrophic flagellates and ciliates in the total biomass increased, from 2% at the start of the experiment to 6% at the end of the experiment and from 6% to 10%, respectively.
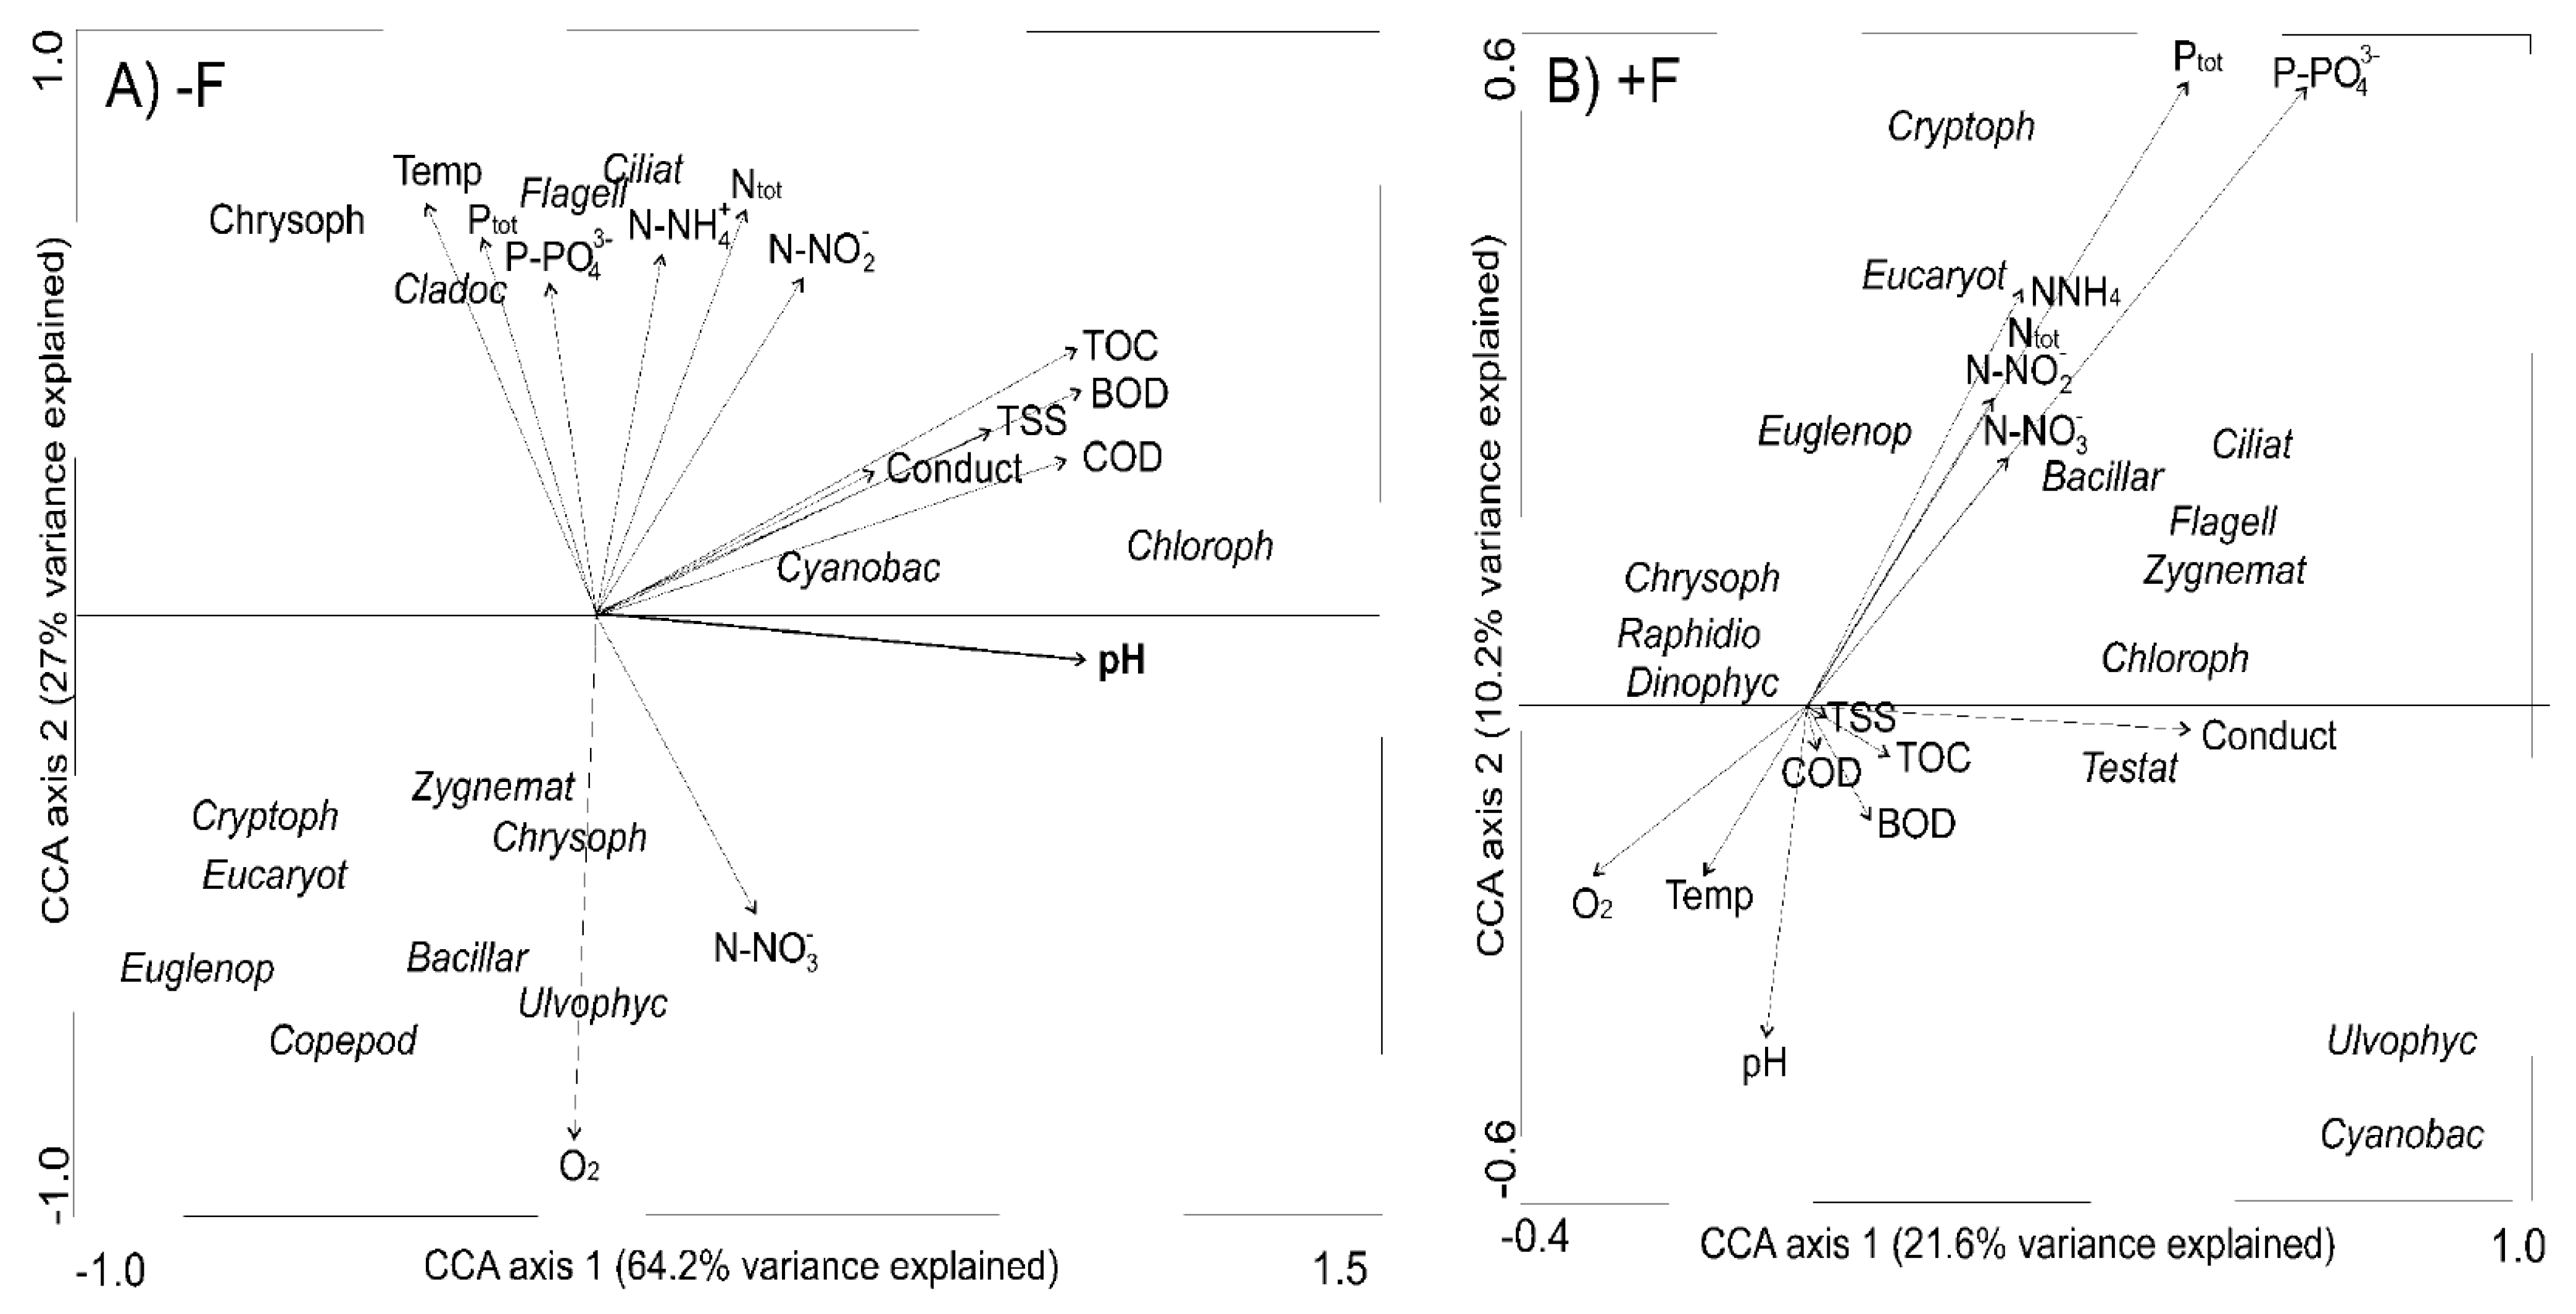
3.4. Microbial Communities vs. Environmental Variables
Canonical correspondence analyses showed that environmental variables were more significant for the development of aquatic communities in fishless environments. In these environments, the first two axes explained 64.2% of the variance in the aquatic communities (Figure 4A). Although some communities showed clear relationships with individual environmental parameters, only pH, temperature and nutrients had a significant effect (λ = 0.84, F = 5.94, p = 0.012). In +F treatments, the first two axes explained 21.6% of the variance in aquatic communities in the environment (Figure 4B).
3.5. Relationships between Food Web Components
The degree of correlation between groups of organisms was markedly varied in the various experimental treatments (Table 2).
In the control −F treatment, there was a negative correlation between bacteria and heterotrophic flagellates (r = −0.82, p < 0.01). Biomass of ciliates showed a positive correlation with phycoflora and bacteria (r = 0.71, r = 0.79, p < 0.01, respectively) and a negative with flagellates, testate amoebae and crustaceans (r = −0.78, r = −0.69 and r = −0.57, p < 0.01). As the temperature increased, there was an increase in the strength of the correlation between bacteria and testate amoebae (r = −0.77, p < 0.01). In the +F control treatment, biomasses of bacteria and flagellates were correlated (r = 0.71, p < 0.01), and the biomass correlated with the biomass of phycoflora (r = 0.74, P < 0.01) and biomass of ciliates (r = −0.65, p < 0.01). In addition, the biomass of phycoflora was significantly correlated with that of ciliates. As the temperature increased, the strength of the correlation between the biomass of bacteria and that of ciliates increased (r = −0.75, p < 0.01) (Table 2).
3.6. Stomach Contents of Ameiurus nebulosus
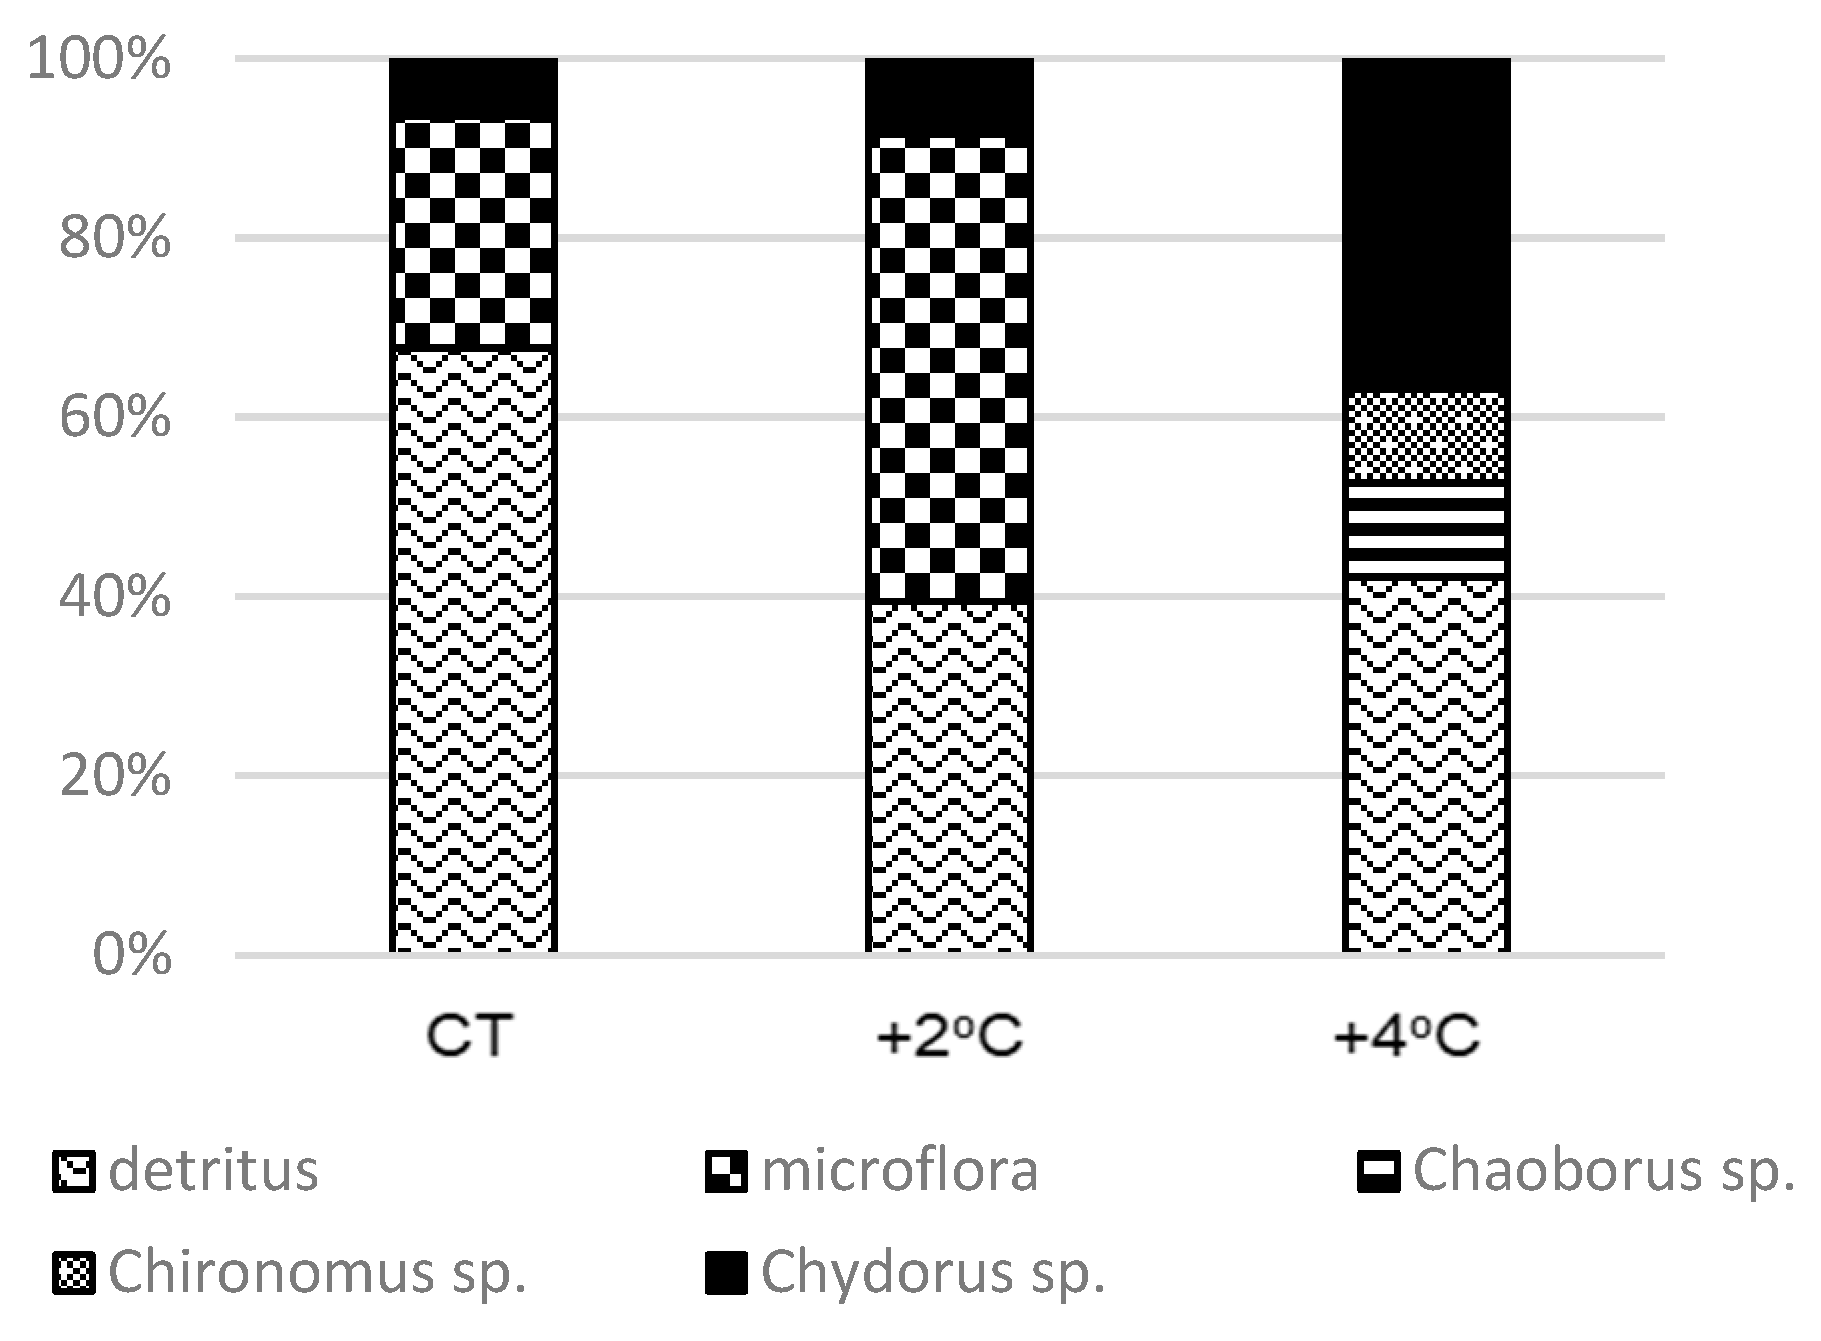
Analysis of the stomach contents of the brown bullhead showed marked variation between treatments in the +F experiment. In the control treatment, detritus was the significantly largest component in the stomach of the fish, accounting for 69%, while the share of microflora and Chydorus spp. was much lower (21% and 10%, respectively) (p < 0.001). In treatment +F + 2 °C, phycoflora made up the largest share of the stomach contents, accounting for 55%, while detritus accounted for 40% and Chydorus spp. for 5% (p < 0.001). When the temperature was increased by +4 °C, there was a pronounced change in the proportions of individual types of food in the stomach of brown bullhead. Detritus and Chydorus spp. had the largest share—43% and 39%, respectively. Choaborus spp. and Chironomus spp. were also found in the stomach, accounting for 10% and 8% (p < 0.001) (Figure 5).
4. Discussion
4.1. Diet of Ameiurus nebulosus
This is the first study to describe the potential effect of the alien and invasive species brown bullhead on the functioning of the microbial food web in peatland ecosystems. Our study showed that brown bullhead in peat pool ecosystems fed mainly on detritus, algae, crustaceans—primarily Chydorus spp., and larvae of Choaborus spp. and Chironomus spp. This relatively poor diet composition is most likely due to the low diversity of macroinvertebrates and zooplankton in peat pools. Research has shown that the food base of this species in lake ecosystems (determined based on the analysis of stomach contents) consists of as many as 18 taxonomic groups of aquatic organisms of various types as well as detritus [7]. In lake ecosystems, A. nebulosus most often consumed Chironomidae, accounting for 50–60% of the contents of the alimentary tract, with a large proportion of detritus as well [7,11]. Our study thus confirms observations from lake ecosystems, which showed that brown bullhead most often feeds on the food that is most abundant in its living environment, while at the same time, we showed that water temperature significantly influenced the species’ feeding activity.
4.2. Functioning of the Food Webs in Treatments with Ameiurus nebulosus
In the experimental treatments with brown bullhead, there was an increase in the proportion of cyanobacteria in the total abundance of phycoflora and a marked decrease in the abundance of testate amoebae and planktonic crustaceans. The increase in the proportion of cyanobacteria was due to the increased pH, temperature and fertility of the water in the +F treatments. An increase in the contribution of cyanobacteria following the experimental fertilization of peat bogs was also observed by Gilbert et al. [40]. The results indicate that the organic matter in the water increases with temperature. In the studied experiments, the density of bacteria, phycoflora and protozoa correlated with organic matter. Similar regularities were also observed by Gilbert et al. [40] and Fischer et al. [41]. A study by Fischer et al. [41], on the effect of Cyprinus carpio and Ameiurus melas on the degradation of lake ecosystems, also found that biogenic compounds significantly affected the dominance structure of phycoflora. In our study, there was a decrease in the density of zooplankton in the +4 °C treatment. This was also reflected in the stomach contents of brown bullhead, in which crustaceans of the genus Chydorus made up a large share. According to the ‘metabolic theory’, the activity of predators increases with temperature, which increases top-down control [14]. Therefore, it is likely that the increase in the efficiency of consumption by brown bullhead contributed to the decline in abundance of zooplankton, and thus to a restructuring of the microbial food web. In this treatment, ciliates were clearly dominant, which may have been linked to the elimination of their main consumers, i.e., planktonic crustaceans, by brown bullhead. On the other hand, in the +F treatments, an increase was observed in the concentration of biogenic compounds in the water, which also may have favored the occurrence of ciliates. The increase in the fertility of the water was most likely due to the excretion by brown bullhead, as well as to the enrichment of the water with biogenic compounds from sediments as a result of their resuspension by the fish. It appears that the combined effect of the increase in temperature and the concentrations of biogenic compounds may significantly affect the diversity and abundance of protozoans. This is also confirmed by research in lake ecosystems [42]. A study by Zingel et al. [43] showed that in eutrophic and hypertrophic water bodies, the density of ciliates is often more than eight times as high as in oligotrophic water bodies. This is also confirmed by the dominance of bacterivorous ciliate taxa (mainly scuticociliatids), whose proportion increased with the temperature and concentration of nutrients.
They can play an important role in controlling bacterial abundance, as research by Andersen et al. [44] and Šimek et al. [45] showed that the rate of feeding on bacteria in groups of ciliates ranges from 380 to 2130 bacteria h−1. Experiments in lake ecosystems show that these protozoans can consume on average from 44 bacterial cells ind.−1 h−1 to even 123 bacterial cells ind.−1 h−1 [46]. Due to their considerable abundance, they can be considered to have a significant role in controlling the abundance of bacteria. At the same time, the absence of a significant correlation between flagellates and bacteria in the control sample may be due to the dominance of large flagellate cells (>10 μm). According to Auer and Arndt [47], Mieczan et al. [48] and Marcisz et al. [49], flagellate cells > 10 μm feed on other flagellates and algae. This may also explain the lower abundance of phycoflora in the +F treatments. In the treatments with higher temperatures, the density of flagellates was correlated with the abundance of bacteria. These treatments were dominated by small flagellate cells, which could control bacterial abundance.
4.3. Functioning of the Food Webs in Fishless Treatments
In the −F treatments, testate amoebae (dominated by Arcella vulgaris) and planktonic crustaceans had a significant effect on microbial communities. According to a study by Laybourn and Whymant [50], Arcella vulgaris feeds mainly on bacteria and algae. At the same time, in the −F experiments in our study, when the temperature increased, there was a change in the size structure of both microalgae and bacteria towards the dominance of larger cells. This change may be a defense mechanism in micro-organisms and a response to increasing predation pressure from zooplankton. Similar observations have been made in lake ecosystems [51,52]. On the other hand, this change in size structure may have been due to selective grazing on microbes by zooplankton. Studies by Mieczan et al. [53] and Kazanjian et al. [54] have shown that testate amoebae and planktonic crustaceans can selectively consume food and change their food preferences depending on the season and the availability of potential food. On the other hand, in the −F treatments, in which zooplankton abundance was higher, an interesting phenomenon was observed, i.e., an increase in the abundance of phycoflora in the water. Therefore, it appears that predation can affect algae communities through a cascading effect, including through grazing on heterotrophic flagellates and ciliates, which can be important consumers of small algal cells. Ciliates are considered major consumers of bacteria in aquatic ecosystems [45]. However, recent studies have shown that testate amoebae are also able to consume a large fraction of the bacterial populations in peatlands [17]. Consumption of bacteria accounts for a major portion of nutrient regeneration in peat pools.
In conclusion, this study is the first to show the substantial impact of Ameiurus nebulosus on microbial communities in peat pool ecosystems. The presence of brown bullhead in combination with temperature increase was shown to cause a change in the microbial communities. This is reflected in a decrease in the abundance of planktonic crustaceans and an increase in ciliates. The overlapping effects of alien species and gradual climate warming may intensify eutrophication (increase in the concentrations of nutrients at the highest temperature in +F treatments) of peatland ecosystems and the increase in the proportion of cyanobacteria, thereby affecting the carbon cycle in these ecosystems.
Author Contributions
Conceptualization, T.M. and W.P.; methodology, T.M.; software, M.A.; validation, T.M., M.T., A.B. and T.M.; writing—original draft preparation, T.M. and A.B.; writing—review and editing. All authors have read and agreed to the published version of the manuscript.
Funding
This research received no external funding.
Institutional Review Board Statement
Not applicable.
Informed Consent Statement
Not applicable.
Data Availability Statement
Not applicable.
Conflicts of Interest
The authors declare no conflict of interest.
References
- Bragazza, L.; Freeman, C.; Jones, T.; Rydin, H.; Limpens, J.; Fenner, N.; Ellis, T.; Gerdol, R.; Hàjek, M.; Iacumin, P.; et al. Atmospheric nitrogen deposition promotes carbon loss from peat bogs. Proc. Natl. Acad. Sci. USA 2006, 103, 19386–19389. [Google Scholar] [CrossRef] [PubMed] [Green Version]
- Robson, T.M.; Pancotto, V.A.; Scopel, A.L.; Flint, S.D.; Caldwell, M. Solar UV-B influences microfaunal community composition in a Tierra del Fuego peatland. Soil Biol. Biochem. 2005, 37, 2205–2215. [Google Scholar] [CrossRef]
- Burford, M.A.; Thompson, P.J.; McIntosh, R.P.; Bauman, R.H.; Pearson, D.C. Nutrient and microbial dynamics in high-intensity, zero-exchange shrimp ponds in Belize. Aquaculture 2003, 219, 393–411. [Google Scholar] [CrossRef] [Green Version]
- Tranvik, L.J.; Downing, J.A.; James, B.; Cotner, J.B.; Steven, A.; Loiselle, S.A.; Striegl, R.G.; Ballatore, T.J.; Dillon, P.; Finlay, K.; et al. Lakes and reservoirs as regulators of carbon cycling and climate. Limnol. Oceanogr. 2009, 54, 2298–2314. [Google Scholar] [CrossRef] [Green Version]
- Copp, G.H.; Bianco, P.G.; Bogutskaya, N.G.; Eros, T.; Falka, I.; Ferreira, M.T.; Fox, M.G.; Freyhof, J.; Gozlan, R.E.; Grabowska, J.; et al. To be, or not to be, a non-native freshwater fish? J. Appl. Ichthyol. 2005, 21, 242–262. [Google Scholar] [CrossRef]
- Rabitsch, W.; Milasowszky, N.; Nehring, S.; Wiesner, C.; Wolter, C.; Essl, F. The times are changing temporal shifts in patterns of fish invasions in central European fresh waters. J. Fish Biol. 2013, 82, 17–33. [Google Scholar] [CrossRef]
- Rechulicz, J.; Płaska, W. The diet of non-indigenous Ameiurus nebulosus of varying size and its potential impact on native fish in shallow lakes. Glob. Ecol. Conserv. 2021, 1, e01881. [Google Scholar] [CrossRef]
- Leunda, P.M.; Oscoz, J.; Elvira, B.; Agorreta, A.; Perea, S.; Miranda, R. Feeding habits of the exotic black bullhead Ameiurus melas (Rafinesque) in the Iberian Peninsula: First evidence of direct predation on native fish species. J. Fish Biol. 2008, 73, 96–114. [Google Scholar] [CrossRef]
- Gunn, J.M.; Qadri, S.U.; Mortimer, D.C. Filamentous algae as a food source for the brown bullhead (Ictalurus nebulosus). J. Fish. Res. Board. Can. 1977, 34, 396–401. [Google Scholar] [CrossRef]
- Hill, T.; Duffy, W.G.; Thomson, M.R. Food habits channel catfish in Lake Oahe, South Dakota. J. Freshwat. Ecol. 1995, 10, 319–323. [Google Scholar] [CrossRef]
- Declerck, S.; Louette, G.; De Bie, T.; De Meester, L. Patterns of diet overlap between populations of non-indigenous and native fishes in shallow ponds. J. Fish Biol. 2002, 61, 1182–1197. [Google Scholar] [CrossRef]
- Jeppesen, E.; Christoffersen, K.; Landkilehus, F.; Lauridsen, T.; Amsinck, S.L.; Riget, F.; Söndergaard, M. Fish and crustaceans in northeast Greenland lakes with special emphasis on interactions between Arctic charr (Salvelinus alpinus), Lepidurus arcticus and benthic chydorids. Hydrobiologia 2001, 442, 329–337. [Google Scholar] [CrossRef]
- Riemann, B. Potential importance of fish pre-dation and zooplankton grazing on natural populations of freshwater bacteria. Appl. Environ. Microbiol. 1985, 50, 187–193. [Google Scholar] [CrossRef] [PubMed] [Green Version]
- Brown, J.H.; Gillooly, J.F.; Allen, A.P.; Savage, V.M.; West, G.B. Toward a metabolic theory of ecology. Ecology 2004, 85, 1771–1789. [Google Scholar] [CrossRef]
- Foster, J.; Hirst, A.G.; Esteban, G.F. Achieving temperature-size changes in unicellular organism. ISME 2013, 7, 28–36. [Google Scholar] [CrossRef] [PubMed]
- Zingel, P.; Cremona, F.; Noges, T.; Cao, Y.; Neif, E.; Coppens, J.; Iskin, U.; Lauridsen, L.; Davidson, T.A.; Sondergaard, M.; et al. Effect of warming and nutrients on the microbial food web in shallow lake mesocosms. Eur. J. Protistol. 2018, 64, 1–12. [Google Scholar] [CrossRef]
- Jassey, V.E.J.; Chiapusio, G.; Binet, P.; Buttler, A.; Laggoun-Defarge, F.; Delarue, F.; Gilbert, D. Above- and belowground linkages in Sphagnum peatland: Climate warming affects plant-microbial interactions. Glob. Chang. Biol. 2013, 19, 811–823. [Google Scholar] [CrossRef] [Green Version]
- Mieczan, T.; Tarkowska-Kukuryk, M. Diurnal dynamics of the microbial loop in peatlands: Structure, function, and relationship to environmental parameters. Hydrobiologia 2013, 717, 189–201. [Google Scholar] [CrossRef] [Green Version]
- Hillebrand, H.; Dürselen, C.D.; Kirschtel, D.; Pollingher, U.; Zohary, T. Biovolume calculation for pelagic and benthic microalgae. J. Phycol. 1999, 35, 403–424. [Google Scholar] [CrossRef]
- Komárek, J.; Fott, B. Chlorophyceae (Grünalgen) Ordnung: Chlorococcales; Schweizerbart: Stuttgart, Germany, 1983; pp. 1–1001. [Google Scholar]
- Komárek, J.; Anagnostidis, K. Cyanoprokaryota. Chroococcales Teil 1; Spektrum Akademischer Verlag: Berlin, Germany, 1999; pp. 1–548. [Google Scholar]
- Komárek, J.; Anagnostidis, K. Chroococcales Teil 1; Spektrum akademischer Verlag: Berlin, Germany, 2000; pp. 1–548. [Google Scholar]
- Komárek, J.; Anagnostidis, K. Oscillatoriales. Teil 2; Spektrum Akademischer Verlag: München, Germany, 2005; pp. 1–759. [Google Scholar]
- Komárek, J. Cyanoprokaryota Teil 3: Heterocytous Genera.; Springer: Berlin, Germany, 2013; pp. 1–1131. [Google Scholar]
- Starmach, K. Süßwasserflora von Mitteleuropa. Chrysophyceae und Haptophyceae Teil 1.; Spektrum Akademischer Verlag: Stuttgart, Germany, 1985; pp. 1–515. [Google Scholar]
- Cox, E.J. Identification of Freshwater Diatoms from Live Material; Chapman and Hall: London, UK, 1996; pp. 1–156. [Google Scholar]
- Van den Hoek, C.; Mann, D.G.; Jahns, H.M. Algae. An Introduction to Phycology; Cambridge University Press: Cambridge, NY, USA, 1995; pp. 1–623. [Google Scholar]
- Utermöhl, H. Zur vervollkommung der quantative phytoplankton methodic. Mitt. Internat. Verein. Limnol. 1958, 9, 1–38. [Google Scholar]
- Foissner, W.; Berger, H. A user-friendly guide to the ciliates (Protozoa, Ciliophora) commonly used by hydrobiologists as bioindicators in rivers, lakes, and waste waters, with notes on their ecology. Freshw. Biol. 1996, 35, 375–482. [Google Scholar] [CrossRef]
- Foissner, W.; Berger, H.; Schaumburg, J. Identification and Ecology of Limnetic Plankton Ciliates; Bayerisches Landesamt für Wasserwirtschaft: München, Germany, 1999; pp. 1–793. [Google Scholar]
- Charman, D.J.; Hendon, D.; Woodland, W. The identification of testate amoebae (Protozoa: Rhizopoda) in peats. Quat. Res. Tech. Guide 2000, 9, 1–147. [Google Scholar]
- Dumont, H.J.; Van de Velde, I.; Dumont, S. The dry weight estimate of biomass in selection of Cladocera, Copepoda and Rotifera from the plankton, periphiton and benthos of continental waters. Oecologia 1975, 19, 75–97. [Google Scholar] [CrossRef] [PubMed]
- Bottrell, H.H.; Duncan, A.; Gliwicz, Z.M.; Grygierek, E.; Herzig, A.; Hillbricht–Ilkowska, A.; Kurasawa, H.; Larsson, P.; Węgleńska, T. Review of some problems in zooplankton production studies. Norw. J. Zool. 1976, 24, 419–456. [Google Scholar]
- Culver, D.A.; Boucherle, M.M.; Bean, D.J.; Fletcher, W.J. Biomass of freshwater crustacean zooplankton from lenght–weight regression. Can. J. Fish. Aquat. Sci. 1985, 42, 1380–1390. [Google Scholar] [CrossRef]
- Hyslop, E.J. Stomach contents analysis—A review of methods and their application. J. Fish Biol. 1980, 17, 411–429. [Google Scholar] [CrossRef] [Green Version]
- Kołodziejczyk, A.; Koperski, P. Polish Invertebrates of Freshwaters. Manual to Determination and the Basics of the Biology and Ecology of Macrofauna; UW: Warsaw, Poland, 2000; pp. 1–250. [Google Scholar]
- Rybak, J.I. Freshwater Invertebrate Animals. Recognition Guide; PWN: Warsaw, Poland, 2000; pp. 1–87. [Google Scholar]
- Golterman, H.L. Methods for Chemical Analysis of Fresh Waters; Blackwell Scientific: Oxford, UK, 1969; pp. 1–166. [Google Scholar]
- Ter Braak, C.J.F. CANOCO–FORTRAN Program for Canonical Community Ordination; Microcomputer Power: Ithaca, NY, USA, 1988; pp. 1–96. [Google Scholar]
- Gilbert, D.; Amblard, C.; Bourdier, G.; Francez, A.J. The microbial loop at the surface of a peatland: Structure, functioning and impact of nutrients inputs. Microb. Ecol. 1998, 35, 89–93. [Google Scholar] [CrossRef] [PubMed]
- Fischer, J.R.; Krogman, R.M.; Quist, M.C. Influences of native and non-native benthivorous fishes on aquatic ecosystem degradation. Hydrobiologia 2013, 711, 187–199. [Google Scholar] [CrossRef]
- Buosi, P.R.B.; Pauleto, G.M.; Lansac-Toha, F.A.; Velho, L.F.M. Ciliate community associated with aquatic macrophyte roots: Effects of nutrient enrichment on the community composition and species richness. Eur. J. Protistol. 2011, 47, 86–102. [Google Scholar] [CrossRef]
- Zingel, P.; Huitu, E.; Mäkelä, S.; Arvola, L. The abundance and diversity of planktonic ciliates in 12 boreal lakes of varying trophic state. Arch Hydrobiol. 2002, 155, 315–332. [Google Scholar] [CrossRef]
- Andersen, R.; Wells, C.; Macrae, M.; Price, J. Nutrient mineralization and microbial functional diversity in a restored bog approach natural conditions 10 years post restoration. Soil Biol. Biochem. 2013, 64, 37–47. [Google Scholar] [CrossRef]
- Šimek, K.; Bobkova, J.; Macek, M.; Nedoma, J. Ciliate grazing on picoplankton in a eutrophic reservoir during the summer phytoplankton maximum: A study at the species and community level. Limnol. Oceanogr. 1995, 40, 1077–1090. [Google Scholar] [CrossRef]
- Kisand, V.; Zingel, P. Dominance of ciliate grazing on bacteria during spring in a shallow eutrophic lake. Aquat. Microb. Ecol. 2000, 22, 135–142. [Google Scholar] [CrossRef]
- Auer, B.; Arndt, H. Taxonomic composition, and biomass of heterotrophic flagellates in relation to lake trophy and season. Freshw. Biol. 2001, 46, 959–972. [Google Scholar] [CrossRef]
- Mieczan, T.; Bielańska-Grajner, I.; Tarkowska-Kukuryk, M. Hydrochemical and microbiological distinction and function of ombrotrophic peatland lagg as ecotone between Sphagnum peatland and forest catchment (Poleski National Park, eastern Poland). Ann. Limnol. Internat. J. Limnol. 2012, 48, 323–336. [Google Scholar] [CrossRef] [Green Version]
- Marcisz, K.; Lamentowicz, Ł.; Słowińska, S.; Słowiński, M.; Muszak, W.; Lamentowicz, M. Seasonal changes in Sphagnum peatland testate amoebae communities along hydrological gradient. Europ. J. Protistol. 2014, 50, 445–455. [Google Scholar] [CrossRef] [PubMed]
- Laybourn, G.; Whymant, L. The effect of diet and temperature on reproductive rate in Arcella vulgaris Ehrenberg (Sarcodina: Testacida). Oecologia 1980, 45, 282–284. [Google Scholar] [CrossRef] [PubMed]
- Hahn, M.W.; Höfle, M.G. Grazing of protozoa and its effect on populations of aquatic bacteria. FEMS Microbiol. Eco. 2001, 35, 113–121. [Google Scholar] [CrossRef] [PubMed]
- Heckmann, L.; Drossel, B.; Brose, U.; Guill, C. Interactive effects of body-size structure and adaptive foraging on food-web stability. Ecol. Lett. 2012, 15, 243–250. [Google Scholar] [CrossRef]
- Mieczan, T.; Adamczuk, M.; Pawlik-Skowrońska, B.; Toporowska, M. Eutrophication of peatbogs: Consequences of P and N enrichment for microbial and metazoan communities in mesocosm experiments. Aquat. Microb. Ecol. 2015, 74, 121–141. [Google Scholar] [CrossRef]
- Kazanjian, G.; Velthuis, M.; Aben, R.; Stephan, S.; Peeters, E.T.H.M.; Frenken, T.; Touwen, J.; Xue, F.; Kosten, S.; Van de Waal, D.B.; et al. Impacts 638 of warming on top-down and bottom-up controls of periphyton production. Sci. Rep. 2018, 8, 9901. [Google Scholar] [CrossRef] [PubMed]
Figure 1.
Location of the study area; −F treatments without fish, +F treatments with fish.

Figure 2.
Numbers of (a) phycoflora; (b) bacteria; (c) heterotrophic flagellates; (d) testate amoebae; (e) ciliates; (f) cladocerans; (g) copepods in experimental mesocosms. −F treatments without fish; +F treatments with fish; CT—control treatments; +2 °C—treatment with temperature increased by +2 °C relative to the control; +4 °C—treatment with temperature increased by +4 °C relative to the control.


Figure 3.
Biomass of (a) phycoflora; (b) bacteria; (c) heterotrophic flagellates; (d) testate amoebae; (e) ciliates; (f) cladocerans; (g) copepods in experimental mesocosms. −F treatments without fish; +F treatments with fish; CT—control treatments; +2 °C—treatment with temperature increased by +2 °C relative to the control; +4 °C—treatment with temperature increased by +4 °C relative to the control.


Figure 4.
Canonical correspondence analyses (CCA) biplots showing microbial and metazoan communities and environmental variables in (A) −F treatments without fish and (B) +F treatments with fish.
Figure 4.
Canonical correspondence analyses (CCA) biplots showing microbial and metazoan communities and environmental variables in (A) −F treatments without fish and (B) +F treatments with fish.

Figure 5.
An abundance of biomass (%P) of types of food in the contents of A. nebulosus digestive tracts in treatments with fish, CT—control treatments, +2 °C—treatment with temperature increased by +2 °C relative to the control, +4 °C—treatment with temperature increased by +4 °C relative to the control.


Table 1.
Changes in physical and chemical parameters in six experimental mesocosms. Key: reaction (pH), dissolved oxygen (DO), total phosphorus (Ptot), phosphates (P-PO43−), total nitrogen (Ntot), ammonia nitrogen (N-NH4), nitrite nitrogen (N-NO2−), chemical oxygen demand (COD), biological oxygen demand (BOD), total suspended solids (TSS), total organic carbon (TOC), treatments −FCT (control), −FT + 2 °C (treatment without fish with temperature increased by +2 °C relative to the control), and −FT + 4 °C (treatment without fish with temperature increased by +4 °C relative to the control), and treatments with fish: +FCT (control), +FT + 2 °C (treatment with temperature increased by +2 °C relative to the control), and +FT + 4 °C (treatment with temperature increased by +4 °C relative to the control).
| Parameters/Treatment | −FCT | −FT + 2 °C | −FT + 4 °C | +FCT | +F + 2 °C | +F + 4 °C |
|---|---|---|---|---|---|---|
| Temperature °C | 22 | 24 | 26 | 22 | 24 | 26 |
| pH | 3.78 | 5.42 | 5.03 | 4.13 | 6.48 | 6.39 |
| Conductivity µS cm−1 | 31 | 57 | 76 | 35 | 94 | 65 |
| O2 mg L−1 | 4.03 | 5.16 | 5.32 | 6.89 | 4.88 | 9.98 |
| N-NH4+ mg L−1 | 0.025 | 3.797 | 5.678 | 0.036 | 8.384 | 10.855 |
| N-NO2− mg L−1 | 0.062 | 0.042 | 0.053 | 0.009 | 0.075 | 0.152 |
| N-NO3− mg L−1 | 0.007 | 0.311 | 0.036 | 0.017 | 0.048 | 0.089 |
| P-PO43− mg L−1 | 0.005 | 0.010 | 0.528 | 0.023 | 0.892 | 0.156 |
| Ptot mg L−1 | 0.060 | 0.084 | 0.637 | 0.046 | 1.116 | 0.250 |
| Ntot mg L−1 | 0.984 | 5.241 | 6.579 | 0.927 | 8.443 | 15.750 |
| TSS mg L−1 | 180.0 | 385.0 | 440.0 | 130.0 | 485.0 | 940.0 |
| TOC mg L−1 | 32.0 | 55.5 | 53.0 | 27.0 | 62.0 | 104.0 |
| COD mg L−1 | 72.0 | 126.0 | 126.0 | 59.0 | 147.0 | 236.0 |
| BOD mg L−1 | 43.0 | 73.5 | 70.5 | 36.0 | 83.0 | 136.0 |
Table 2.
Linear correlation coefficients between microbial components and metazoan in the investigated treatments, Phy—phycoflora; B—bacteria; HNF—heterotrophic flagellates; TA—testate amoebae; C—ciliates; Cr—crustaceans (cladocerans + copepods). p > 0.05, treatments −FCT (control), −FT + 2 °C (treatment without fish with temperature increased by +2 °C relative to the control), and −FT + 4 °C (treatment without fish with temperature increased by +4 °C relative to the control), and treatments with fish: +FCT (control), +FT + 2 °C (treatment with temperature increased by +2 °C relative to the control), and +FT + 4 °C (treatment with temperature increased by +4 °C relative to the control).
| −FCT | −FT + 2 °C | −FT + 4 °C | ||||||||||||||||
| Phy | B | HNF | TA | C | Cr | Phy | B | HNF | TA | C | Cr | Phy | B | HNF | TA | C | Cr | |
| Phy | - | 0.71 | - | - | ||||||||||||||
| B | - | −0.82 | 0.79 | - | - | |||||||||||||
| HNF | −0.78 | - | - | - | - | |||||||||||||
| TA | −0.69 | - | −0.71 | - | −0.77 | - | ||||||||||||
| C | −0.57 | 0.35 | - | 0.51 | - | - | ||||||||||||
| Cr | 0.43 | - | - | 0.53 | - | |||||||||||||
| +FCT | +FT + 2 °C | +FT + 4 °C | ||||||||||||||||
| Phy | - | 0.74 | 0.65 | - | - | |||||||||||||
| B | - | 0.71 | −0.73 | - | 0.5 | −0.73 | - | −0.75 | ||||||||||
| HNF | - | −0.65 | - | 0.37 | - | |||||||||||||
| TA | - | - | - | |||||||||||||||
| C | - | - | - | |||||||||||||||
| Cr | 0.43 | - | 0.5 | - | 0.42 | - | ||||||||||||
Publisher’s Note: MDPI stays neutral with regard to jurisdictional claims in published maps and institutional affiliations. |
© 2022 by the authors. Licensee MDPI, Basel, Switzerland. This article is an open access article distributed under the terms and conditions of the Creative Commons Attribution (CC BY) license (https://creativecommons.org/licenses/by/4.0/).
Share and Cite
MDPI and ACS Style
Mieczan, T.; Płaska, W.; Adamczuk, M.; Toporowska, M.; Bartkowska, A. Effects of the Invasive Fish Species Ameiurus nebulosus on Microbial Communities in Peat Pools. Water 2022, 14, 815. https://doi.org/10.3390/w14050815
AMA Style
Mieczan T, Płaska W, Adamczuk M, Toporowska M, Bartkowska A. Effects of the Invasive Fish Species Ameiurus nebulosus on Microbial Communities in Peat Pools. Water. 2022; 14(5):815. https://doi.org/10.3390/w14050815
Chicago/Turabian StyleMieczan, Tomasz, Wojciech Płaska, Małgorzata Adamczuk, Magdalena Toporowska, and Aleksandra Bartkowska. 2022. "Effects of the Invasive Fish Species Ameiurus nebulosus on Microbial Communities in Peat Pools" Water 14, no. 5: 815. https://doi.org/10.3390/w14050815
Note that from the first issue of 2016, this journal uses article numbers instead of page numbers. See further details here.