
Dissecting the Mutual Response of Potential Evapotranspiration with Vegetation Cover/Land Use over Heilongjiang River Basin, China


1
State Key Laboratory of Resources and Environmental Information System, Institute of Geographic Sciences and Natural Resources Research, Chinese Academy of Sciences, Beijing 100101, China
2
College of Geoscience and Surveying Engineering, China University of Mining & Technology (Beijing), Beijing 100083, China
3
Jiangsu Center for Collaborative Innovation in Geographical Information Resource Development and Application, Nanjing 210023, China
4
Institute for Complex Analysis of Regional Problems, Far-Eastern Branch, Russian Academy of Sciences, 679016 Birobidzhan, Russia
*
Author to whom correspondence should be addressed.
Water 2022, 14(5), 814; https://doi.org/10.3390/w14050814
Submission received: 10 January 2022
/
Revised: 14 February 2022
/
Accepted: 2 March 2022
/
Published: 5 March 2022
(This article belongs to the Section Ecohydrology)
Abstract
:Spatiotemporal changes in potential evapotranspiration (PET) are important referential data for monitoring the variation in ecohydrology under climate change. As the key area of agricultural/forestry reserves and trade, research on the interactions between vegetation cover and land use with accurate PET among the Heilongjiang River basin, China is vital for the sustainability of this cross-border region. To obtain high-suitability PET estimation based on the proven Penman–Monteith (PM) principle, two schemes were adopted using 36-year in situ meteorological data (1984–2019) and derived remote-sensing product MOD16A2 from 2001 to 2019. At meteorological sites with heterogeneous underlying surfaces, the coefficients of the evaluation factors between MOD_PET and the referrable observations were better. This suggests that remotely sensed estimation was preferentially chosen as the input to study the mutual responses. The results indicated that the annual PET and fractional vegetation cover (FVC) changes differed significantly depending on the land use. The proportions of PET according to equal intervals initially increased and then decreased with increasing vegetation coverage, and changing trends indicated a negative correlation. The strongest correlations appeared in the middle to northern sub-basins, which were affected by their distinctive climatic characteristics. The response of PET was reverse-related with changes in the area of each selected land type, but could change with the expected climatic conditions.
1. Introduction
Evapotranspiration (ET) is the sum of water vapor fluxes from vegetation and land surfaces to the atmosphere and is an important part of the water and surface-energy cycle within the context of global climate change [1]. Potential evapotranspiration (PET) characterizes the evapotranspiration capacity (potential) under an adequate water supply. From the initial level of acquisition necessity, it is an essential parameter that directly affects cultivation growth and subtly regulates atmospheric circulation [2]. Further, the overall spatial pattern and long-term temporal evolution of PET can be meaningfully calculated and constructed, and it is of vital importance to design a project to obtain high-suitability results for the target area. It is well known from the level of application value that changes in vegetation cover and land use in ecosystems strongly influence hydrothermal equilibrium, and exert a notable force on the evolution of PET. Consequently, it primarily affects the productivity of natural resources [3,4,5]. Significances and challenges still exist in dissecting and quantifying internal correlations between PET and vegetation cover/land use in mid-high latitudes, which are highly influenced by featured climatological type.
Over the past 50 years, researchers have performed mass PET estimation approaches based on various meteorological and geophysical variables, and the models available in the literature can be broadly classified as follows [6]: (1) fully physical combinative models considering the principles of mass-energy conservation [7,8]; (2) semi-physical models that come down to either mass or energy conservation [9,10,11]; and (3) black-box models according to empirical relationships, artificial neural networks (ANN), fuzzy, and genetic algorithms [12,13]. Based on the above studies, the United Nations Food and Agriculture Organization provides researchers with temperature-based (Blaney–Criddle and Hargreaves), radiation-based (Makkink and Priestley–Taylor), and combination methods (Penman–Monteith, PM) to enable them to fully utilize different effective data in the calculation. After analyzing the applicability of the above calculation methods, the PM method is the only standard method recommended and used worldwide [14,15,16]. In the corresponding application, scholars have combined the required meteorological data to obtain the Penman–Monteith PET (PM_PET) of several key transboundary catchments worldwide through spatial interpolation algorithms such as Kriging and inverse-distance weighting. The long-term time-series distribution of the value was obtained, and its correlation with various meteorological elements and their contribution degrees was analyzed [17,18,19,20].
With the recent continuous development of remote-sensing technology, multi-source remote-sensing data products have been provided by individuals and institutions. The most representative items that were adopted to establish spatiotemporal characteristics and laws of PET included Global Land-surface Evaporation: the Amsterdam Methodology (GLEAM), Moderate Resolution Imaging Spectroradiometer (MODIS) Global Evapotranspiration Project (MOD16), and Operational Simplified Surface Energy Balance/evapotranspiration (SSEBop/ET). These collections are widely used as they improve the capability of data acquisition and analysis of regional environmental monitoring [5]. Taking the application of MOD16 as an example, the corresponding processes during the formal stage focus on depicting the temporal-spatial characters and adopting the attribution analysis of other factors [21,22,23]. The surge of reanalysis data applications in recent years has led to the incorporation of measured parameters and has pushed research into a much deeper gradation. Huang et al. [24] used the combined data from the Global Land Data Assimilation System (GLDAS) to explore changes in evapotranspiration in the Yunnan–Guizhou Plateau from 2000 to 2014. The corresponding indices were calculated using integrated precipitation to analyze the wettability changes over 15 years.
In the process of using remotely sensed products to estimate ET and PET, the evaluation and validation of the products themselves have also engaged the researchers to accomplish the corresponding researches. Autovino et al. [25] proposed a simple empirical model that was calibrated based on eddy covariance (EC) measurements, and then estimated the bulk surface resistance (rc,a), which were adopted as the parameters of the PM equation. Finally, a comparison between ET retrieved by the MODIS product and those obtained by the proposed approach was put forward, and the results showed that the former are associated with credible estimations. In the process of analyzing the spatiotemporal variation of ET and PET in Shandong Province, the accuracy of the MOD16 simulation (MOD_PET) was analyzed from the perspective of spatiotemporal correlation. Zhao et al. [21] found that the spatial correlation coefficient with the observation data of the evaporator was 0.872, and the time correlation coefficient was as high as 0.913. Based on the data of PM_PET and MOD_PET, Chen et al. [26] used the former as reference and explored their correlation to analyze the applicability of MOD_PET in the middle and lower reaches of the Yangtze River. The research found that the average annual correlation values, mean absolute error (MAE), and root mean square error between the PET value calculated by two aspects are 0.67, 10.4%, and 0.31 mm/d, respectively. The comparisons suggested that the MODIS product could better demonstrate the spatiotemporal distribution characteristics of the PET among this region.
Upon reviewing formal literature and detailed information on the scientific discovery of PET, we found the following two loopholes: (i) although the dependability of PET estimation from the remote sensing scheme has been validated and discussed, the spatiotemporal characteristics of data quality still lack a systematic understanding. Additionally, the results were mostly obtained by a series of analyses between the MOD_PET and the single reference data provided by either the PM_PET or by observation. Further, few studies have conceived the design to compare the accuracy of the estimated PET from the two schemes based on the measured data and geographical situation of the target region; (ii) in the further discussion on PET conditions and related factors, many studies have emphatically considered the mutual feedback and interactive effect with meteorological factors. However, corresponding results combined with other environmental elements affected by anthropogenic behaviors, such as the variation of vegetation and land use, were insufficiently referred to.
As the largest river basin in Northeast Asia, the Heilongjiang River connects 15 first-level administrative regions across China, Mongolia, Russia, and North Korea. Changes in its internal resources and environment have a major impact on the green development of the China–Mongolia–Russia Economic Corridor (CMREC) [27,28,29]. Approximately 48% of the river basin lies in China, which covers the entire Heilongjiang Province and parts of Jilin Province and Inner Mongolia. Abundant in natural resources, the basin is a key area of agricultural and forestry reserves and trade for Northeast Asia. The internal vegetation coverage and land use have changed significantly with the continuing intensification of human activities in the basin. This has caused serious ecological problems such as aridification and flooding, which contribute to difficulty in balancing water supply with demand and eventually dissolve these resources [30]. Fully recognizing the spatiotemporal changes in the internal PET, vegetation cover, land use, and reciprocal feeding mechanisms among the three factors helps provide a scientific basis for effectively allocating water resources and methodically dealing with ecological problems. Furthermore, an exemplary role will be performed to support the environmental sustainability of cross-border regions worldwide and promote the executive ability of sustainable development goals proposed by the United Nations.
In summary, the main research objectives were as follows: (i) to construct a spatial distribution pattern and analyze temporal variations of PET among the Heilongjiang River basin (Chinese section) over the past 30 years; (ii) to combine meteorological/remotely sensed schemes and assess the suitability of PM_PET and MOD_PET by introducing observational data on evaporation; (iii) to dissect the interaction among the changing PET, vegetation cover, and major land use (agriculture, forest, and grassland) combined with local climatic features; and (iv) to discuss the attribution analysis, evolution tendencies, and prospects of the results according to human activities and physical conditions of the basin.
2. Materials and Methods
2.1. Study Area
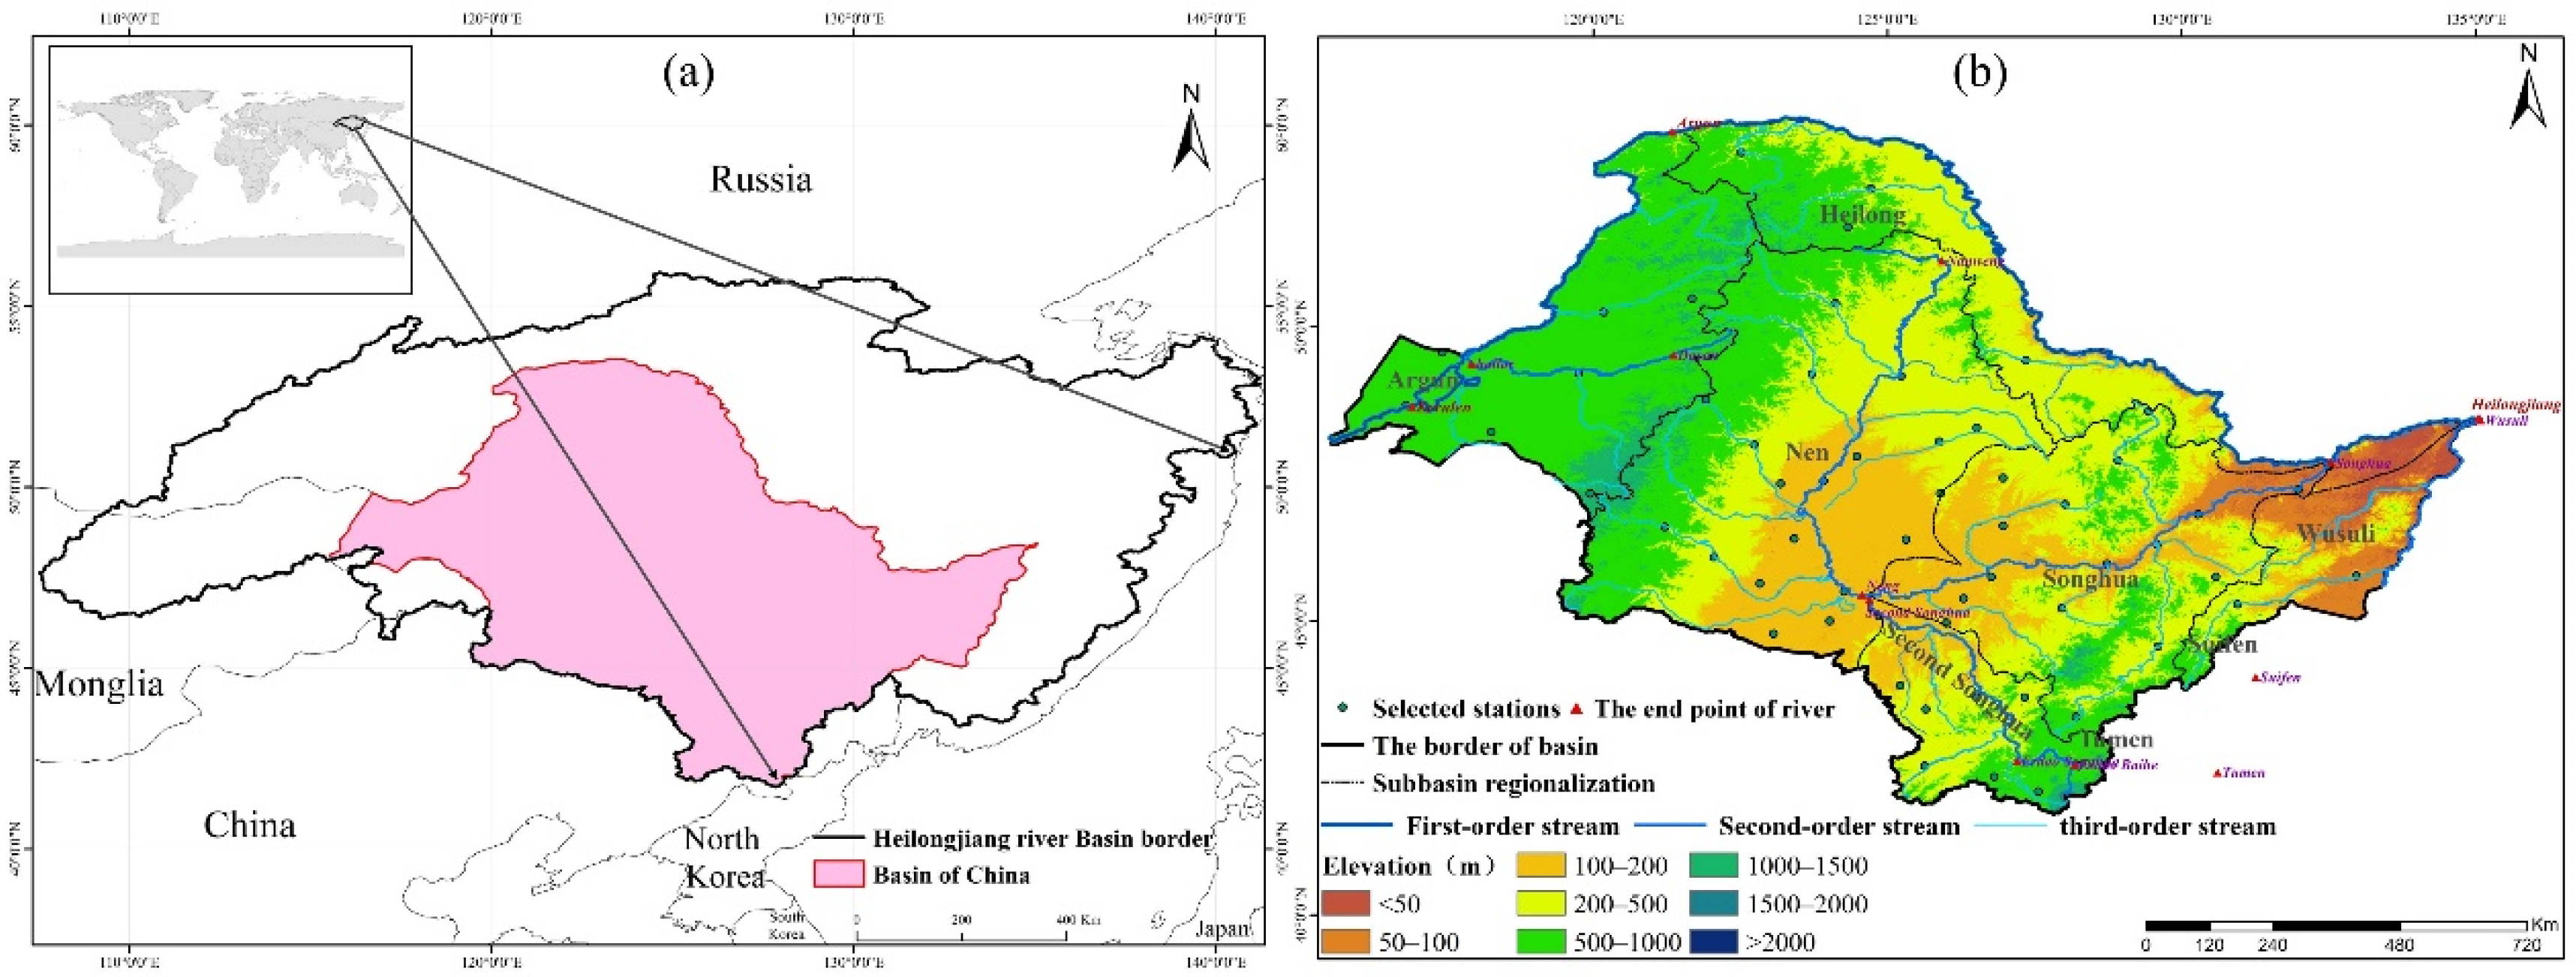
The Chinese section of the Heilongjiang River basin (referred to below as the basin) comprises the central portion (from west to east) of the complete area and covers approximately 1.05 106 km2 (Figure 1a). Hydrologically, the basin can be divided into eight secondary basins. A line from west to east passes through the Argun, Nen, Songhua, and Wusuli sub-basins, and parts of the Suifen, while from south to north, there are the Second Songhua, parts of Tumen, and the Heilong (the lands that drain toward the Heilong River itself, and not into one of the tributaries) sub-basins (Figure 1b). Geomorphologically, the Greater and Lesser Khingan ranges lie in the north of this area, with the Changbai Mountains in the southeast. The Songnen, Sanjiang, and other plains lie in the middle and northeast areas. Climatically, the eastern region has a temperate humid monsoon climate, and the western region is dominated by a continental climate [31]. The average annual precipitation in the region ranges from 250 to 800 mm. It is mainly concentrated in the coastal zone and gradually decreases to the west [32]. The main vegetation types are dense forests, vigorous grasslands, and extensive agricultural lands.
Due to the above preponderance, the designation of “high-quality grain elevator” and “precious warehouse of biological items” was granted. The official media announced that trade volumes of Sino-Russian agricultural products reached USD 3.7 billion in August 2020, with a stable surge trend and it was not subject to the influence of restricted measurements against COVID-19 [33]. However, despite these advantages, some hidden disadvantages still exist, such as low vegetation restoration capacity and fragile soil erosion resistance, which directly result in strong sensitivity to eco-systematic disasters [31].
2.2. Data Source and Preprocessing
Vector range and digital elevation model data were obtained from the Global Change Scientific Research Data Publishing System (http://www.geodoi.ac.cn, accessed on 29 September 2021) and the National Earth System Science Data Center of China (http://www.geodata.cn, accessed on 29 September 2021). Meteorological data were obtained from the China Meteorological Data website (http://data.cma.cn, accessed on 5 October 2021). Wind and evaporation data from certain weather stations were missing perennially. Therefore, 56 weather stations were selected to ensure uniformity, and their observations were sorted using Python. Data on daily maximum, minimum, and mean temperature and relative humidity, wind speed, atmospheric pressure, evaporation (from small-pan evaporimeters), and sunshine duration for 1984–2019 were used. We selected the MOD16A2 evapotranspiration/latent-heat flux dataset (https://ladsweb.modaps.eosdis.nasa.gov, accessed on 9 October 2021) to obtain the PET data. This dataset has a spatial resolution of 500 m and a time resolution of eight days. Fractional vegetation cover (FVC) is used to reflect vegetation growth and change (Jia et al. 2013). The input element, Normalized Difference Vegetation Index (NDVI), was calculated using MOD13Q1 (https://ladsweb.modaps.eosdis.nasa.gov, accessed on 20 October 2021) with a spatial resolution of 250 m and a 16-day time resolution. For land-use data, we selected the annual land cover product MCD12Q1 (https://lpdaac.usgs.gov/products/mcd12q1v006, accessed on 22 October 2021) at a spatial resolution of 500 m, where land use was divided into 17 types based on the International Geosphere–Biosphere Programme classification method [34]. Data were subjected to time filtering, spatial cropping, sequential summation, and mosaic analysis of the basin range based on the Google Earth Engine platform during pre-processing. PET, NDVI, and land use data were obtained from 2001 to 2019 for the availability of MODIS serial products. Classifications were regrouped as forest, grassland, wetland, cropland, urban, and water bodies to concisely analyze the changing characteristics of land-use types [4]. For the uniformity of spatio-temporal resolution, the spatial resolution of NDVI was resampled to 500 m from ArcGIS software as the other two productions, and the annual average NDVI and accumulated PET were obtained for analysis with the annual land cover product. In the discussion part of the study, the 1 km monthly precipitation dataset for China (1901–2020) [35] was adopted to depict the impact of meteorological changes on PET under the homogeneous vegetation cover and land-use. Preprocessing, which included format and scale conversion, interannual synthesis, and regional extraction of the corresponding data from 2001 to 2019, was processed using ArcGIS software.
2.3. Methods
2.3.1. PET Estimation Based on Meteorological Data
Theoretically, the FAO PM Equation (1) was used to calculate the daily PM_PET [36]:
where PM_PET represents potential evapotranspiration (mm) and represents the net energy budget of the crop surface, MJ/(m2·d). In the corresponding Equation (2), Rsd represents the downward shortwave radiation, Rld represents the downward longwave radiation, Rsu represents the upward shortwave radiation, and Rlu represents the upward longwave radiation. represents soil heat flux, MJ/(m2·d); represents net psychrometer constant, kPa·°C−1; represents the mean temperature, °C; represents the wind speed at 2 m height, m·s−1; and represent saturated vapor pressure and actual vapor pressure, respectively, kPa; and Δ represents saturated vapor pressure–temperature curve slope (kPa·°C−1). The specific calculation process of moduli is referred to in the guidebook “FAO Irrigation and Drainage Paper, No. 56, Crop Evapotranspiration”.
In the actual operation, we used the EToCalculator software published by FAO (http://www.fao.org/land-water/databases-and-software/eto-calculator/en/, accessed on 5 October 2021) to obtain the daily results from the collected meteorological data according to the guideline materials.
2.3.2. Correlation Analysis between PET Simulation Results and Measured Evaporation Data
MOD16 is a medium-resolution simulation dataset for evapotranspiration. The series was developed based on the PM method by introducing remotely sensed data that characterize the features of the surface energy partitioning process and environmental constraints [37,38]. The objective of the product is to push the former results of the point scale to the global scale and estimate while considering multi-sourced conditions. Some issues in the practical application stage reflect that the quality and availability of the new entrants become factors that affect the data applicability or even bring counterproductive results [39,40,41]. Therefore, it is vital to validate whether the improvement exists. Evaporation measured at weather stations is the effect of combined climatic elements on the water surface of the evaporimeter. The magnitude and differences in its value can be used as an indication or reference for PET estimation, while considering that the corresponding elements are unavailable under natural conditions [42,43,44]. Therefore, PM_PET was spatially interpolated based on the station values and resampled to the same spatial resolution as MOD_PET for unifying the spatial difference. Subsequently, the corresponding values of the two series were extracted using ArcGIS software. Finally, the correlation results (Equations (3)–(5)) of MOD_PET and PM_PET were analyzed against the measured data Epan observed from the E-601 type of evaporator. Evaporation was considered a standard value in Chinese hydrological test specifications, which were converted by the collected small-pan evaporimeter data through local conversion coefficients [45,46,47].
where and represent the PM/MOD_PET and observed Epan_avg, respectively; the subscript denotes the th data point; refers to the number of data; and and represent the mean of the PM/MOD_PET and observed Epan_avg, respectively.
2.3.3. Calculation and Classification of FVC
The FVC was calculated using the principle of the dimidiate pixel model [48], as represented by Equation (6).
where NDVI represents the NDVI value of each pixel on the image, is the NDVI value of bare soil or non-vegetation area, and represents the NDVI value of the completely covered area. Based on the frequency statistics table of each NDVI image from 2001 to 2019, a 0.5% confidence level was used to determine the confidence interval of the NDVI value, and the 0.5% areas with the largest and smallest NDVI values were averaged to obtain and , respectively [48].
The FVC classification was based on previous studies combined with the actual situation of the basin to determine the classification boundaries [29,31]. The area with FVC ≤ 10% was classified as “Bare soil or non-vegetation”, while 30, 45, and 60% were the upper limit of the status of coverage and were classified as “Low”, “Low–medium”, and “Medium”, respectively. The condition of the area with high vegetation cover was defined as FVC ≥ 60%.
2.3.4. Analysis Method for the Impact of Vegetation Cover and Land-Use Change on PET
The sub-basins mentioned above were further divided into five thematic areas based on geographic location and area to simplify the analysis. In particular, Songhua, Second Songhua, and the adjacent Tumen Basin were merged into “Songhua–Tumen”. Wusuli and part of Suifen basin were merged into the “Wusuli–Suifen”, and the remaining sub-basins were left unchanged. As part of the content, the impact of changes in vegetation cover on PET can be divided into two parts. Based on the annual average FVC and PET spatial distribution data, the analysis of changes in cover magnitude calculated means for the basin and each sub-basin. Subsequently, the proportion of each classification in the corresponding area according to coverage level and equal intervals was determined. In the relationship analysis between trends, the Mann–Kendall (MK) nonparametric test method and the Theil–Sen slope method were used to determine variations. The calculations involved in the two methods are detailed in classical literature [49,50]. To evaluate the impact of changes in land use or cover, three ecological types (cropland, forest, and grassland) were chosen by considering their advantages in terms of trade and utilization. Using the spatial analysis function from ArcGIS, we extracted those types from the annual raster and converted them to vectors, which were subsequently masked to obtain the PET distribution for the corresponding year. Finally, the regional statistical function was used to obtain the average PET and coverage of selected land cover types and to describe the yearly changes in the two results.
Figure 2 shows the workflow for all the contents mentioned in this section, mainly including data collection and processing, correlation analysis among simulation results with measured data and analysis for the mutual response of PET with FVC/land use.
3. Results and Analysis
3.1. Temporal Variation of PET Based on PM Methodology and MOD_PET
The research calculated PM_PET using the obtained meteorological data and FAO PM equation. Then, daily values of each station by year were accumulated to obtain the dynamic changes of inter-annual average PM_PET for the basin and that for each sub-basin from 1984 to 2019 (Figure 3a,b). It can be seen from the two figures that the annual mean PET in the basin was 897.39 mm, and the maximum and minimum PET were 1056.42 and 715.24 mm, for the years 2005 and 2017, respectively. The inter-annual trend of each sub-basin was roughly similar, and the fluctuation of PET values in the three periods (1984–1989, 2004–2009, and 2014–2017) was more obvious. The inter-annual PET differed relatively little between the sub-basins in the range of 900–1000 mm. The values peaked in 1986, 1993, 2005, and 2011, possibly due to lower precipitation in the preceding years and the associated increase in surface evaporation capacity.
From the corresponding dynamic diagram generated by the MOD16 product (Figure 3c), the size, trend change, and magnitude rank of the annual PET in each basin are roughly the same as those in Figure 3b. The peaks and troughs of the inter-annual PET numerical changes were uniformly consistent between the results. The Argun and Nen basins have the highest estimated similarity across the two types of annual average PET estimates. For the Tumen Basin, the two types of estimated values deviated significantly from 2009 to 2016.
3.2. Estimated Suitability Evaluation between PM_PET and MOD_PET
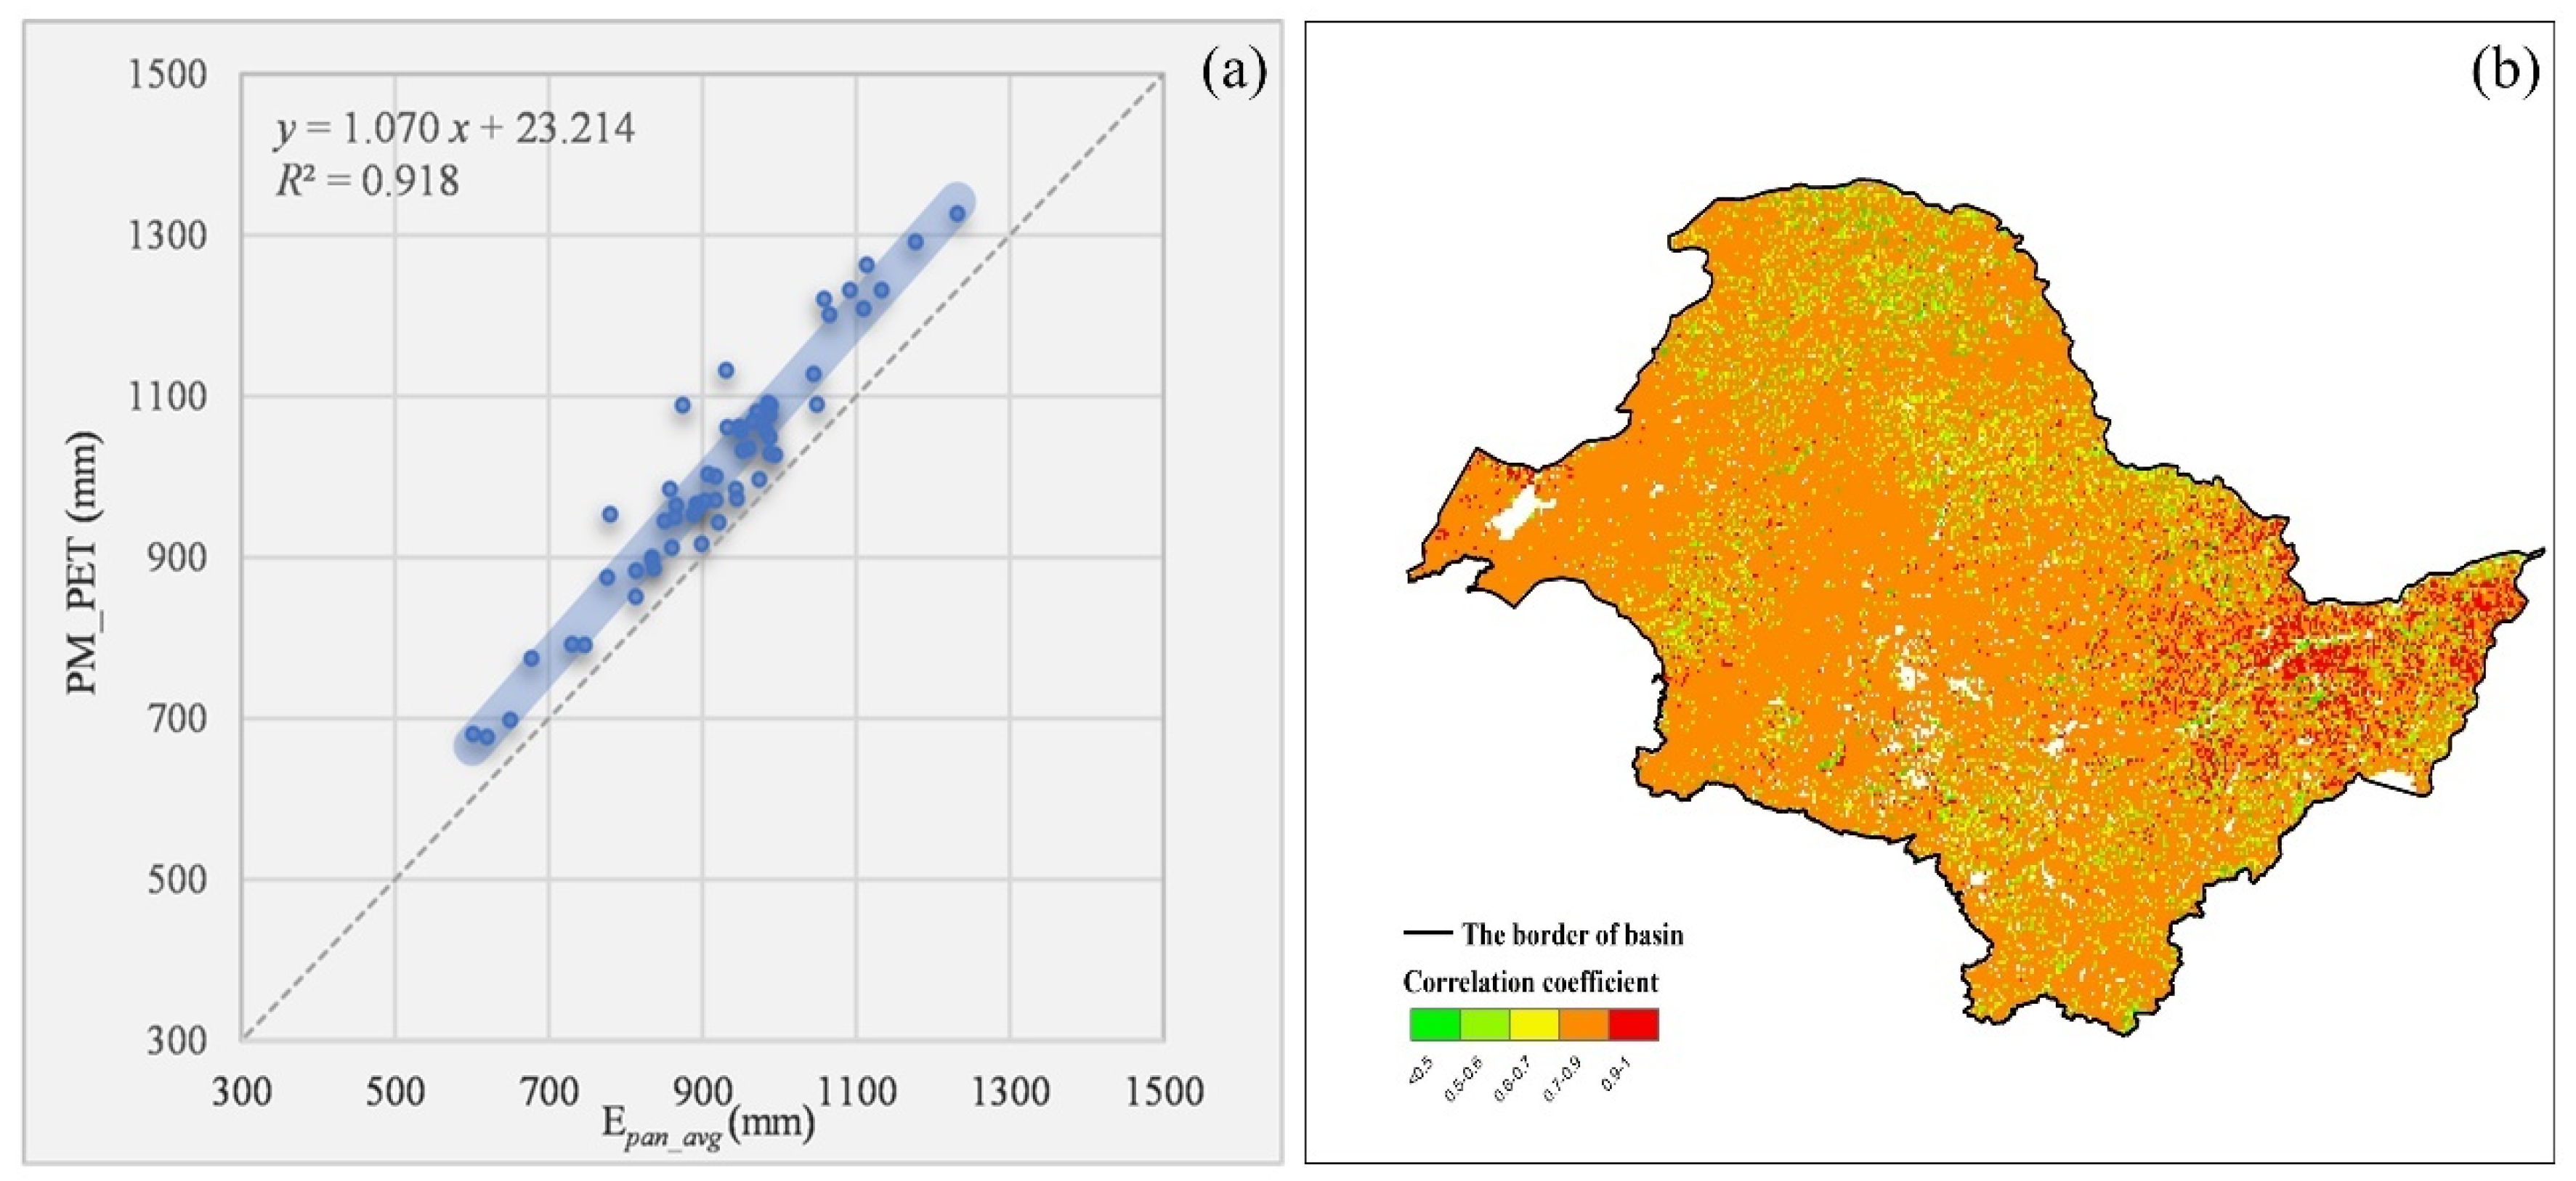
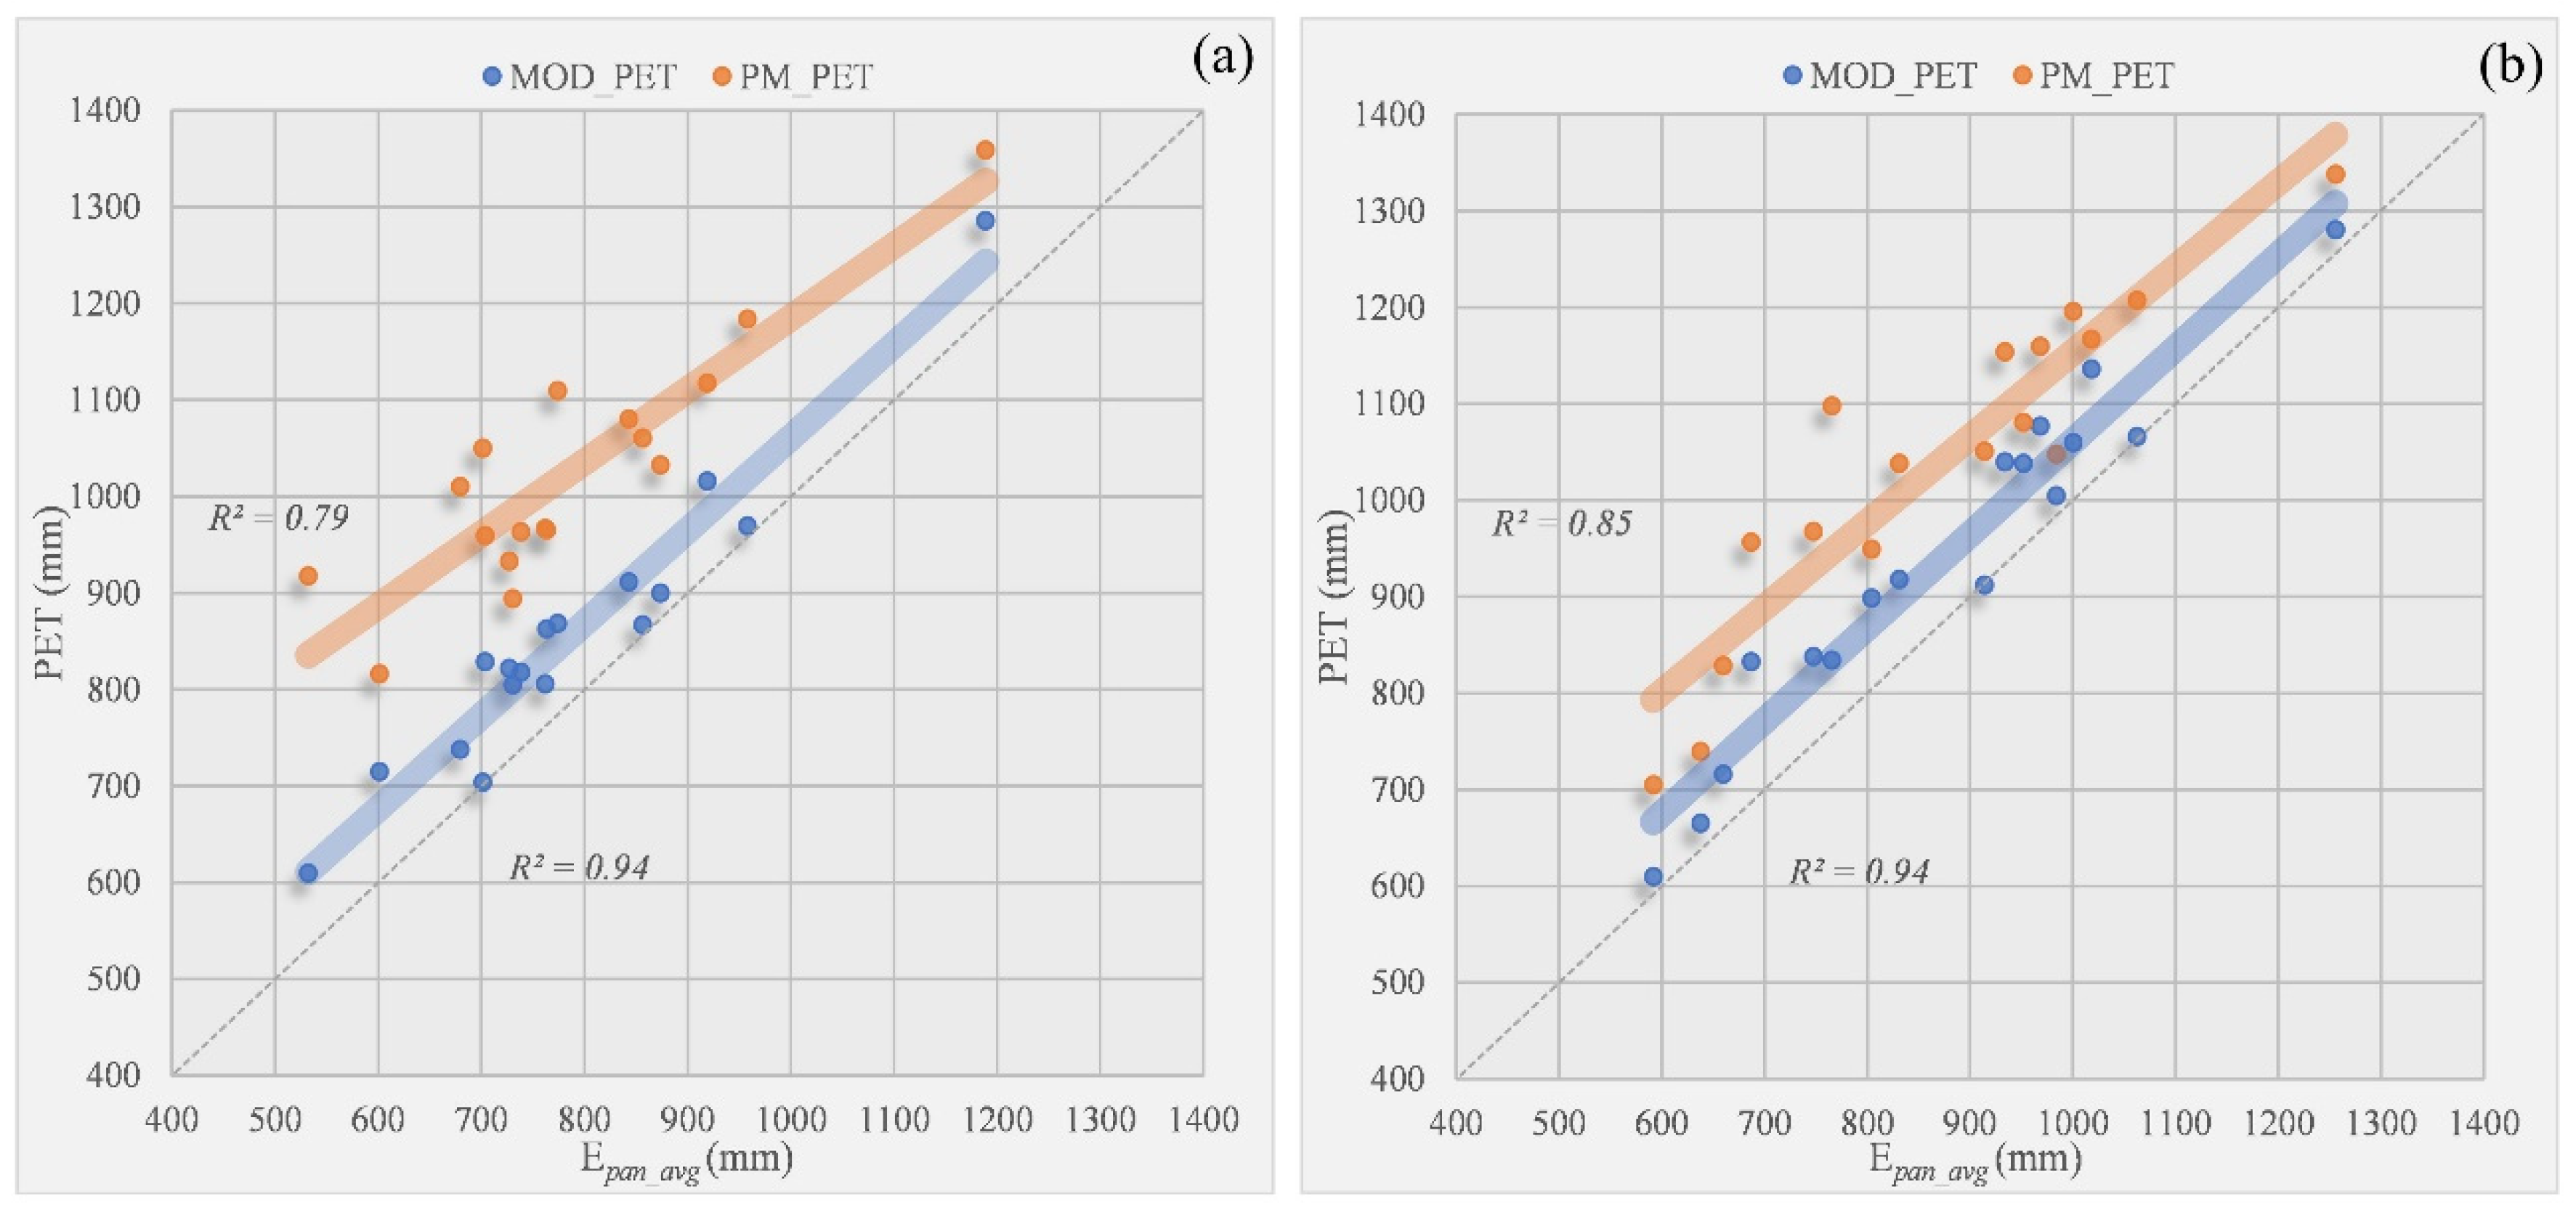
This study used the mean value of PM_PET from each site in 2001–19 to further verify the effect of simulation, and the corresponding value of the average measured E-601 evaporation Epan_avg for correlation analysis (Figure 4a). The results showed that the square value of the correlation coefficient (R2) was 0.918, and the slope of the linear regression equation was 1.07. The above values showed that the correlation between aspects was relatively strong, and the trend was fairly consistent. This indicates that PM_PET could approximately represent the evaporation potential of the basin. Next, spatially interpolated PM_PET and MOD_PET were used to perform a pixel-level correlation analysis (Figure 4b). The results indicate that the correlation was high in most areas but low in those with large altitude differences and complex land cover types. Comparing these results, we found that most sites belonging to the discrete data in Figure 4a were in areas with low correlation values (Figure 4b). This indicates that simulation controversy existed both in the correlation of PM_PET–Epan_avg and PM_PET–MOD_PET among the specific areas. Therefore, to determine what simulative condition MOD_PET performs in the sites where discrete data occurred in PM_PET–Epan_avg, and even in the entire basin, we selected the mean results of PM_PET and MOD_PET for the corresponding weather stations during the early and later periods of 2001–2009 and 2010–2019. Subsequently, we analyzed their correlations with Epan_avg during the same period. The results are shown in Figure 5a,b, respectively.
As shown in Figure 5, the correlation coefficient results (R2) of the MOD_PET obtained at each station were better than the corresponding results of PM_PET in the same periods. Further, we added root-mean-square error (RMSE) and mean absolute error (MAE) [51] to provide more information on controlling the validity of applied statistics and construct the collection of the quantitative evaluation (Table 1). The corresponding results from the table show that the PET simulation results obtained by the MOD16 evapotranspiration algorithm, which considered more environmental factors, were more reliable when applied to this basin.
3.3. Spatial Characteristic Analysis of PET and FVC/Land Use
The spatial distribution of the mean PET and FVC from 2001 to 2019 and the latest land-use status in the study are shown in Figure 6. Areas with high PET values were mainly concentrated in the Nen and western Argun basins, while the northern Argun-Heilong and eastern Wusuli basins had the lowest levels. The two basins located in the south (Songhua and Second Songhua) presented a PET pattern of high in the south and low in the north. The condition of vegetation coverage, which was highly correlated with land-use type, varied across the basin. The areas of the highest FVC were concentrated in forests and wetlands, and were primarily distributed in the Heilong, Argun, and Songhua basins; the second highest was the cultivated land category, which was mainly distributed in the Song-nen and Sanjiang plains in the Nen and Wusuli basins. The remaining grasslands, built-up areas, and water bodies showed relatively low vegetation coverage. In general, the results of PET distribution showed the appearance of “one aspect wanes, while the other waxes” with respect to vegetation coverage (especially in the northern and eastern regions), which was highly affected by the status of each land type in the whole basin.
3.4. Time Series Changes of FVC and Their Influence on PET
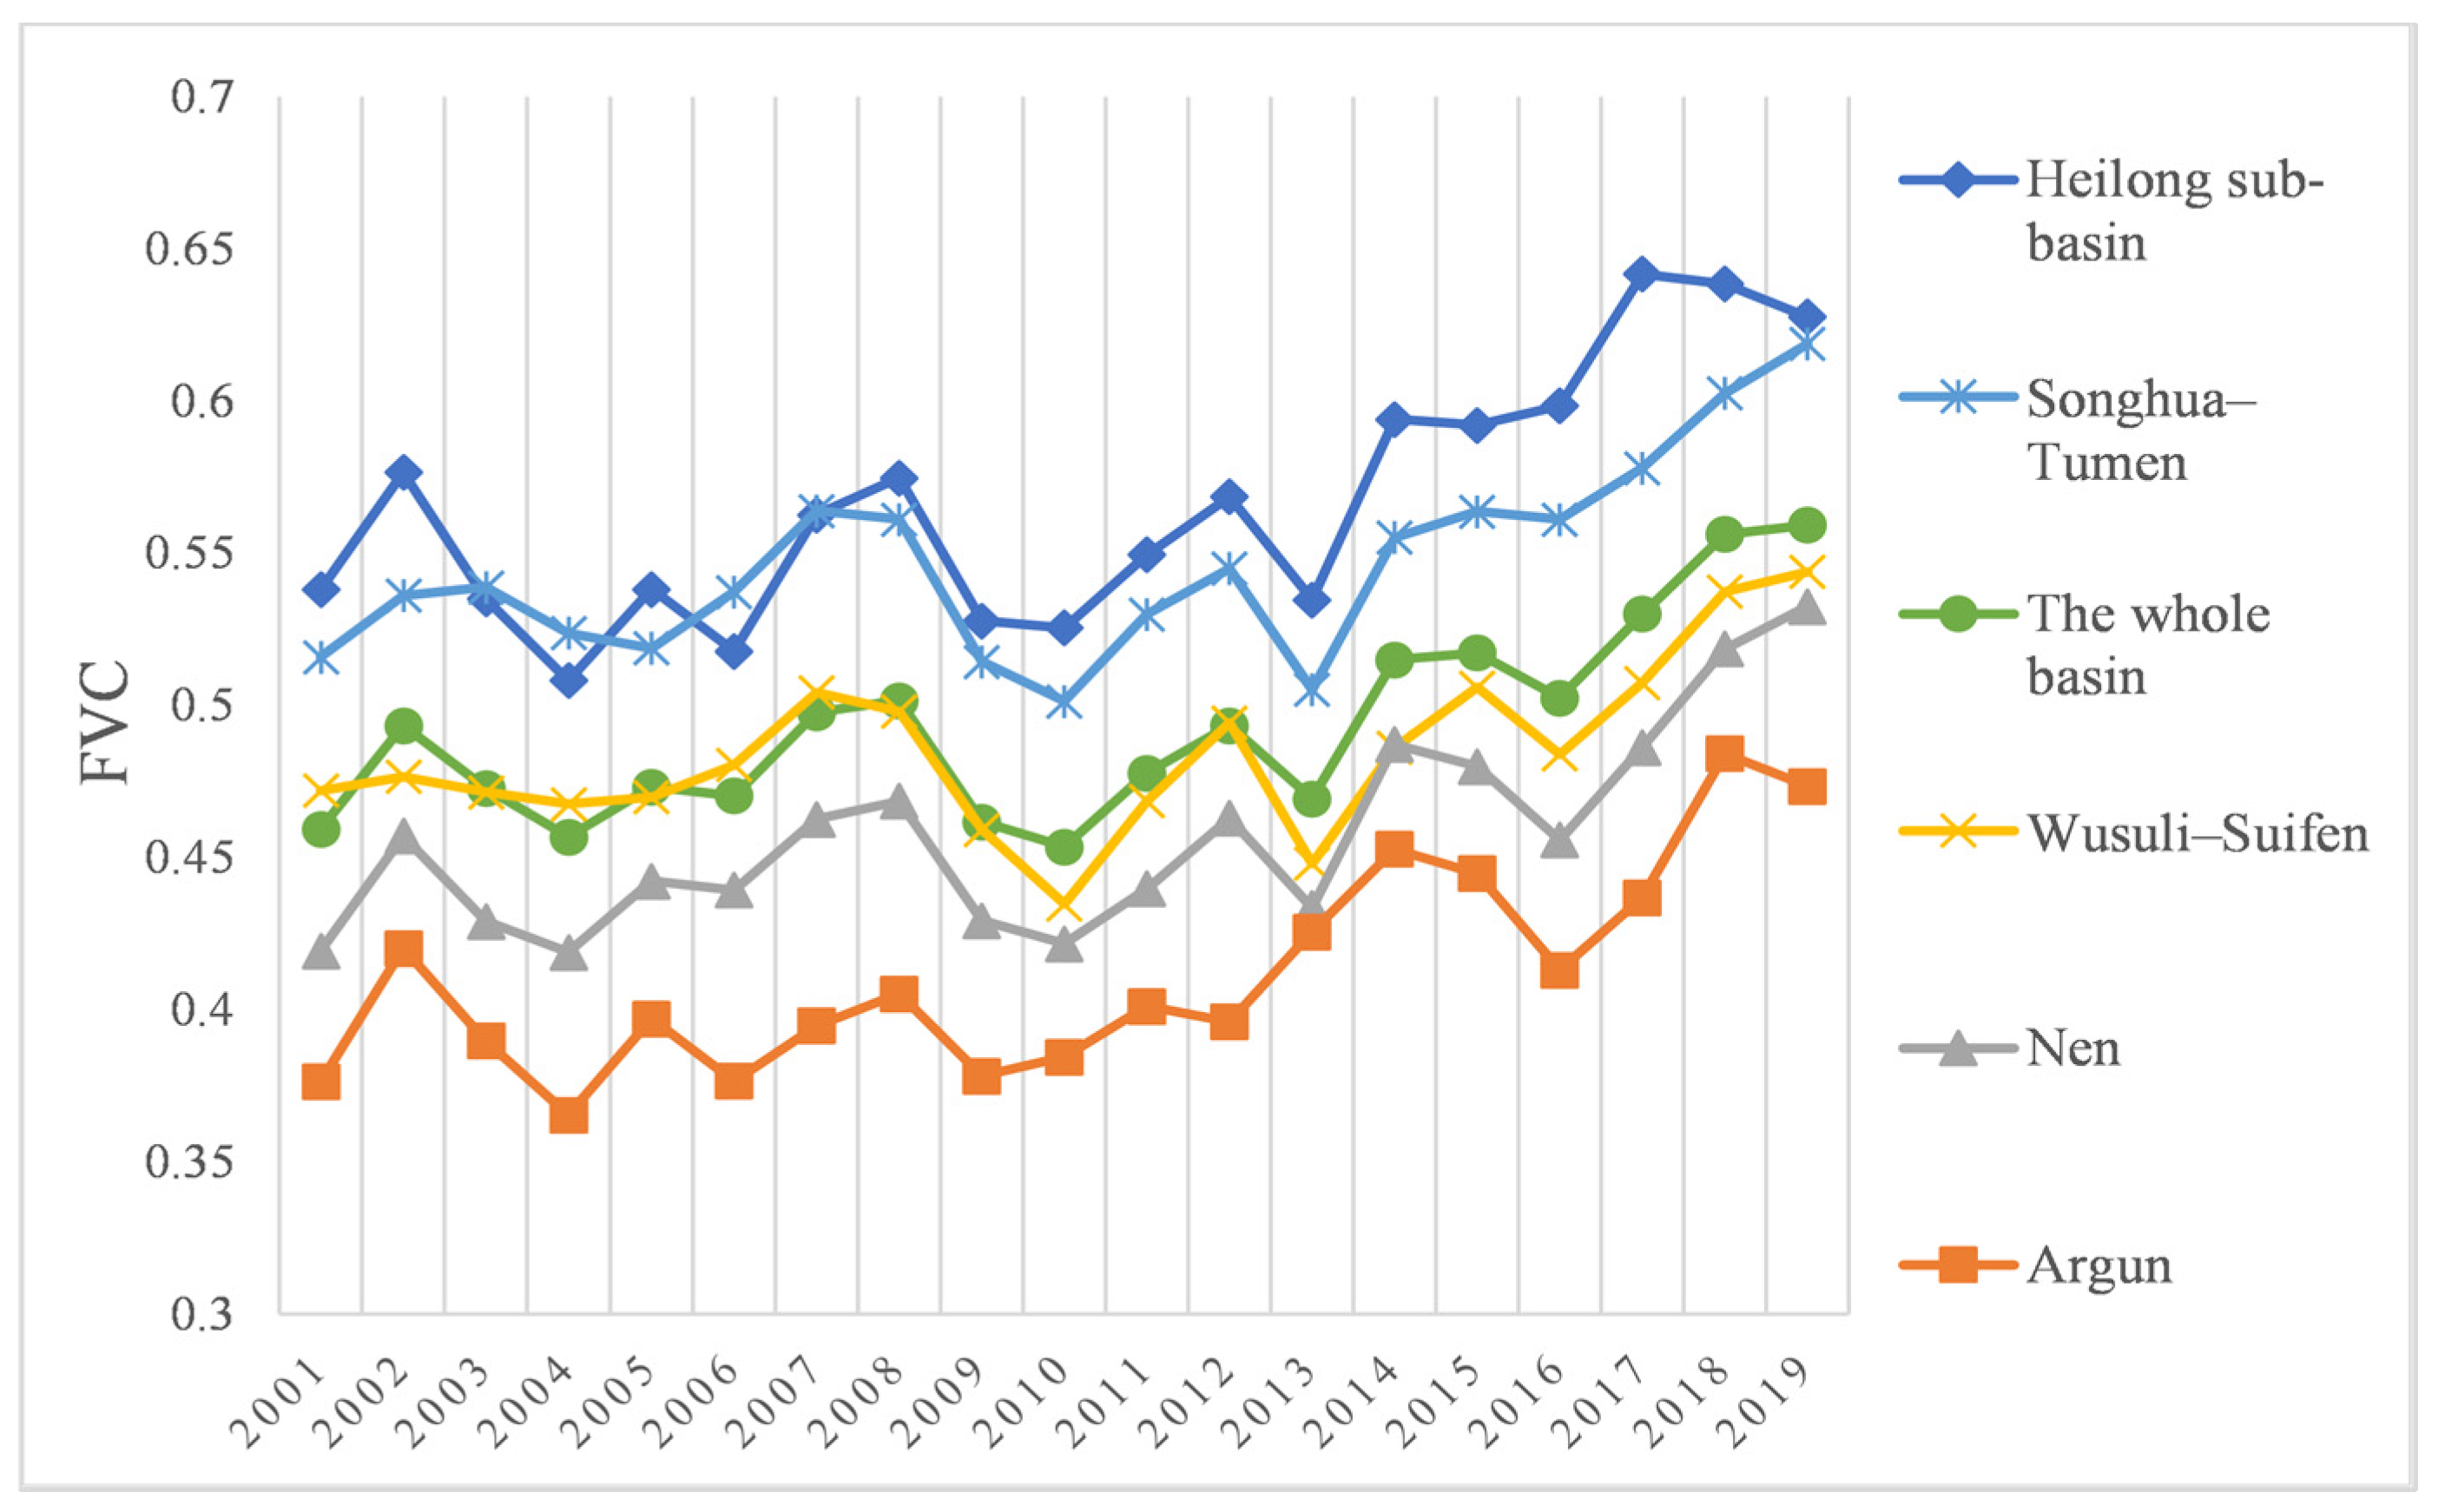
The inter-annual changes in vegetation coverage from 2001 to 2019 are shown in Figure 7. It could be seen that the average value of the overall FVC was beyond 0.45 over the years. The annual minimum and maximum values were 0.452 and 0.557, which appeared in 2010 and 2019, respectively. Although the corresponding values of each sub-basin were quite different, inter-annual fluctuations were essentially the same, and the overall trend of changes shifted from upward and downward fluctuations (2001–2009) to growth (from 2010 onwards). The Heilong and Songhua–Tumen sub-basins were densely forested, as the internal vegetation coverage was more than 0.5. After 2018, the basins became highly vegetated. In the basins of Nen and Wusuli–Suifen, the FVC values were between 0.4 and 0.5. However, the value ranges of both basins have increased in recent years by one level according to the classification of FVC. The Argun Basin has the overall lowest FVC, but the value here has increased along with other basins as the coverage level has changed from low to medium.
The annual average data were divided into five groups according to classification levels and equal intervals to analyze the impact of FVC changes on PET (Table 2 and Table 3).
As shown in Table 2 and Table 3, the average annual FVC of the entire basin was 0.491, and more than half of the area had medium to high coverage. Areas with high vegetation coverage in the Heilong and Songhua–Tumen basins accounted for approximately 40% of the respective basins. The main coverage was chiefly distributed in the low–medium/medium grades in the remaining thematic areas. The average annual PET of the whole basin was 928.27 mm, and the numeric value among the sub-basins was Nen > Wusuli–Suifen > Songhua–Tumen > Argun > Heilong. It was found that the PET volume of more than 55% of the regions was between 605 and 845 mm, and the specific gravity of each sub-basin at this level remained similar. In addition, approximately 30–40% of the areas in each sub-basin had a mass above 850 mm, and areas with values below 600 mm accounted for less than 20%. Comparing the two sets of data, it was found that the proportion of PET at all levels in the whole area and sub-basin initially increased and then decreased with increasing vegetation coverage. High-value accumulation areas of PET and FVC were laid in the Nen and Heilong sub-basins, respectively. In the two sub-basins, the adverse degree of the phenomenon was relatively noticeable.
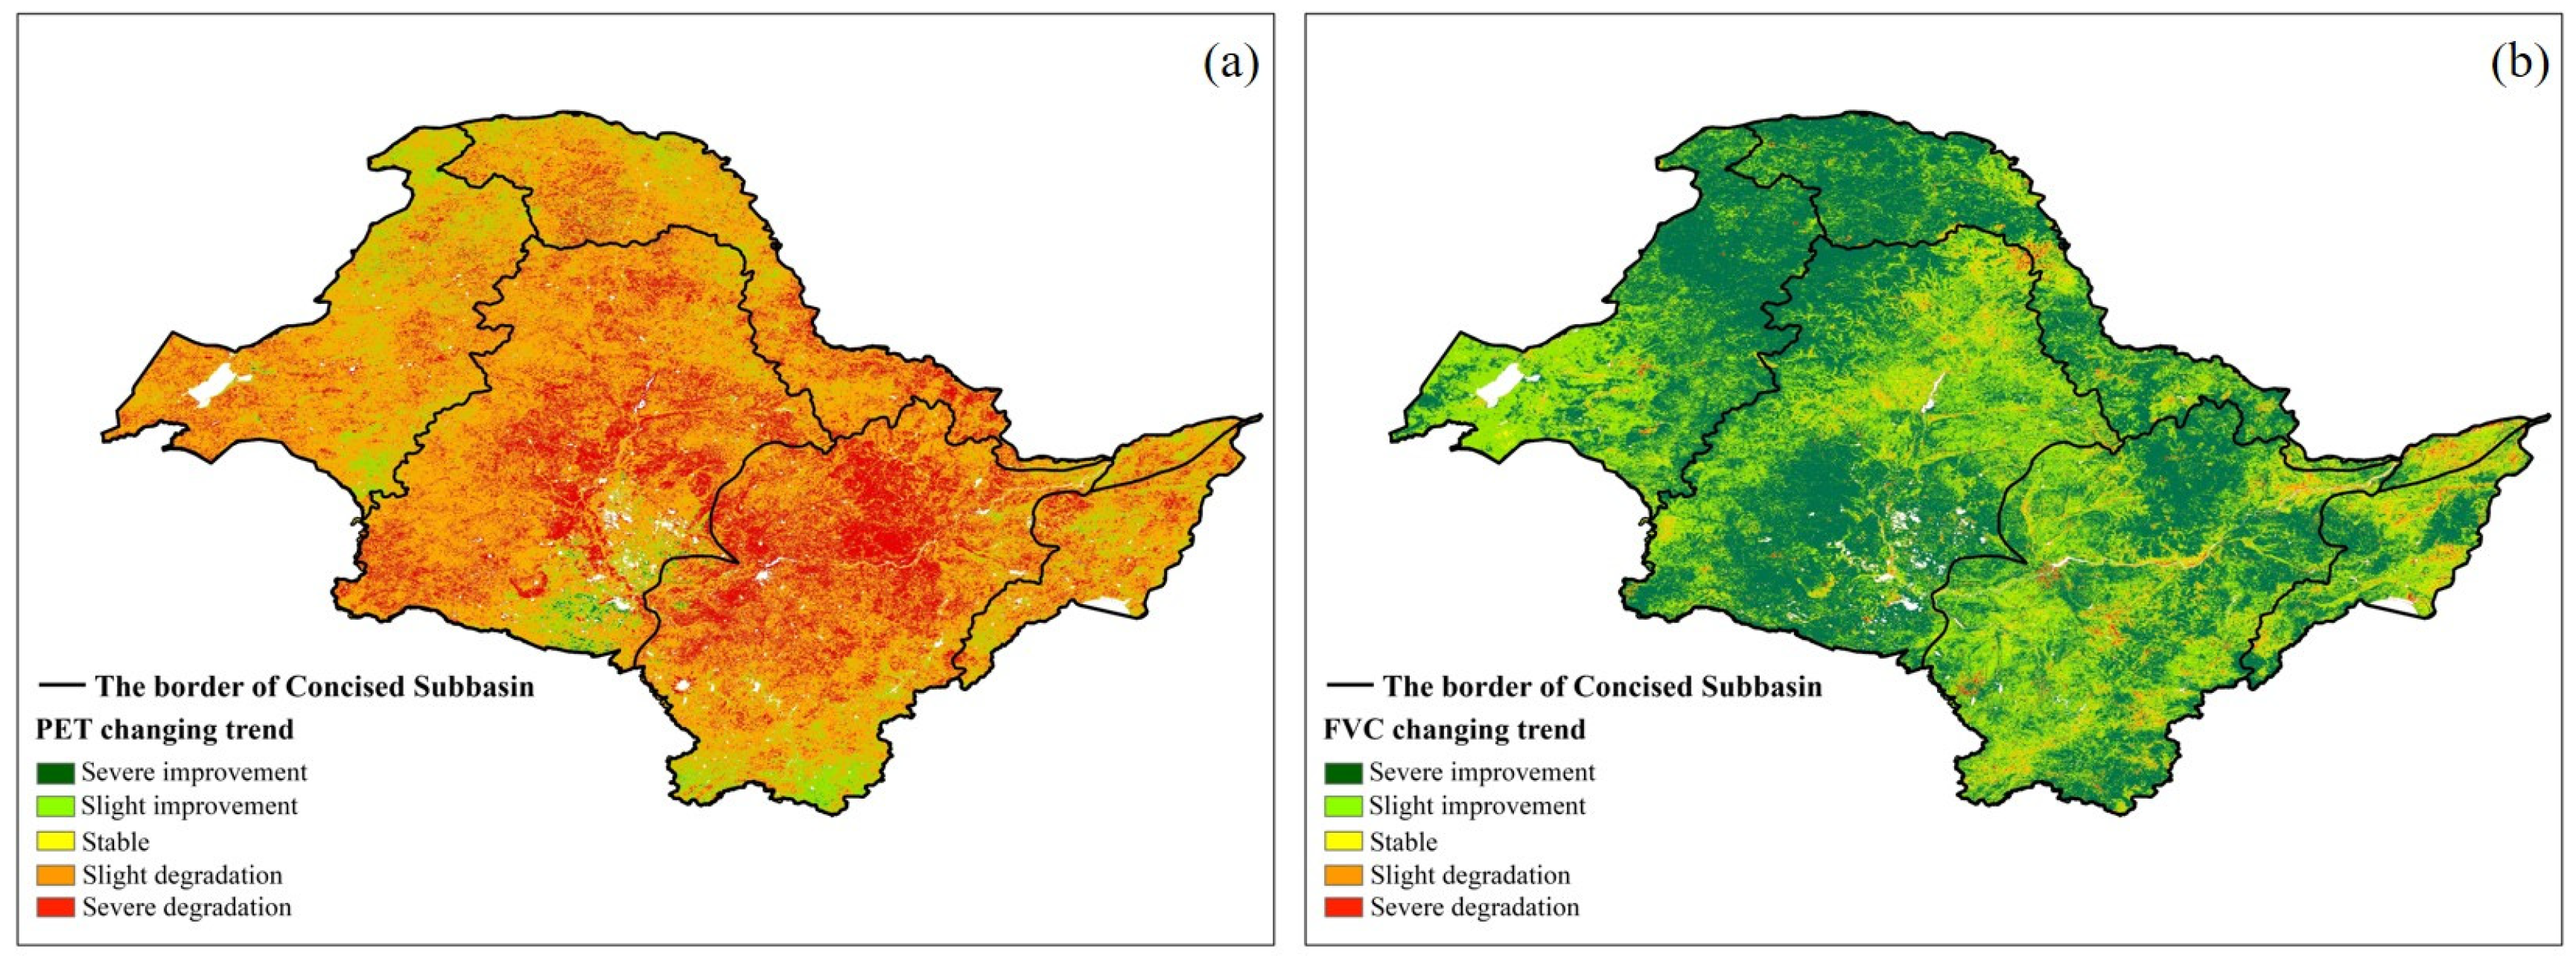
To further analyze the relationship and response between trends of the two elements across the years, the FVC and PET were calculated pixel-by-pixel according to the MK test and Sen-trend analysis. The MK-test statistics value Zc (Z statistic after variance correction) and inter-annual change rate β were obtained. The two results were classified according to their respective threshold ranges, and their proportional characteristics were determined (Figure 8).
It can be seen from Figure 8 that the PET of the basin has generally shown a downward trend over the past 19 years. Areas of significant decline diverge mainly from the middle reaches of the Nen, Songhua, and Heilong rivers. The remaining areas declined slightly. Areas where PET showed growth was primarily distributed in the marginal areas. Among them, the confluence of the Nen–Songhua River and the start of the Second Songhua River showed the most apparent trend. However, the trend in FVC was the opposite. Approximately 80% of the areas showed a significant increase, which was primarily concentrated in areas characterized by high vegetation coverage. In addition, the values of some areas along the Nen and Songhua rivers showed a steady or slightly downward trend.
There was an overall negative correlation between PET and FVC. Areas with the strongest correlation appeared in the middle of the Nen basin, the middle-lower part of the Heilong River, and the northern region of the Songhua–Tumen basin. PET increased noticeably with the improvement in vegetation coverage in areas with dense river networks at the southern ends.
3.5. Time Series Changes of Main Land-Use Types and Analysis of Their Impact on PET
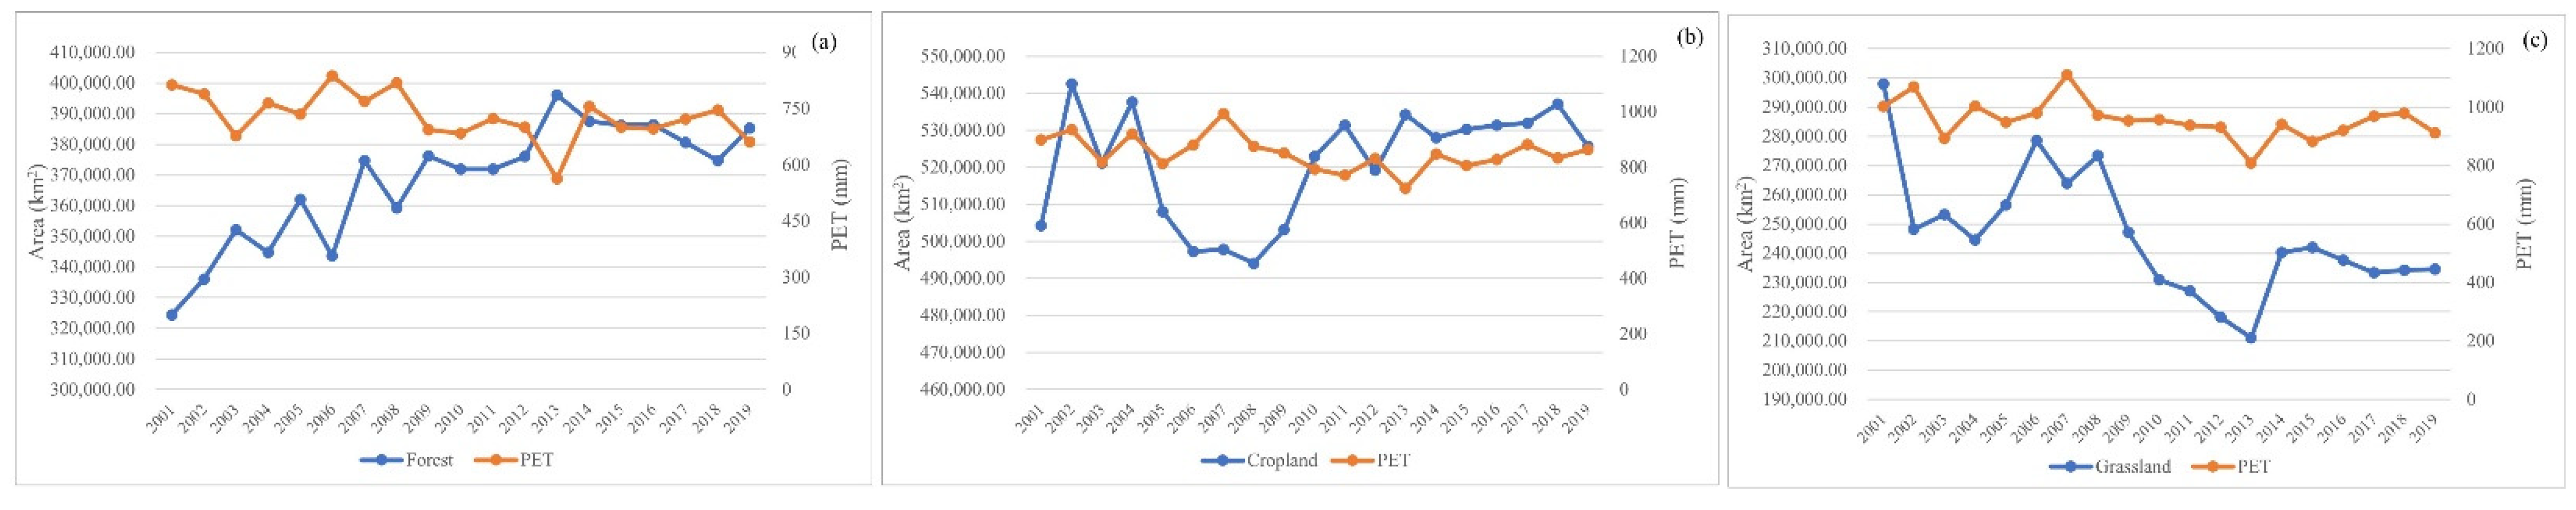
Annual changes in the area of the selected land types and their corresponding PET averages from 2001 to 2019 are shown in Figure 9. The forest area of the basin (Figure 9a) from 2001 to 2013 fluctuated from the initial 324,500 to 396,200 km2, with a growth rate of 4578.6 km2·a−1 (“a” represents year here). The area has stabilized in recent years with an overall volume remaining between 374,000 and 387,500 km2. The area of cropland (Figure 9b) showed a U-shaped change from 2004 to 2011, and the value in 2008 was the lowest in 19 years; falling from the highest above 542,000 km2 six years earlier. Subsequently, it quickly recovered to over 530,000 km2 within three years. The rate of decline and rise in the process reached 8305.5 and 13,144 km2·a−1, respectively. After 2011, the areal changes tended to be slight with only minor fluctuations. The trend for grassland (Figure 9c) from 2001 to 2011 was opposite to that of cropland. During this process, the area decreased by approximately 70,000 km2. After decreasing to a low of 210,000 km2, it rebounded above 240,000 km2 in 2014 and then decreased to around 235,000 km2 with minor fluctuations.
The average PET values corresponding to the three types of land cover in descending order were grassland PET > cropland PET > forest PET. The trends of the three results were relatively stable annually, and the time range corresponding to the fluctuation interval was generally consistent. Comparing the changes of the two elements in each type, an inverse tendency exists between changes in the area of land use and PET for cropland and forest. The above-mentioned relationship is applicable in the area of grassland type during the period when the variation is relatively stable. However, PET tends to decrease proportionally in periods when the area changes sharply.
4. Discussion
4.1. Spatiotemporal Characteristics of PET and Their Relationship with the “Evaporation Paradox”
Previous studies have shown that Chinese multi-year PET is between 610 and 1300 mm, and the spatial distribution is roughly low in the east and high in the west [52]. Compared with other regions in China, the northeast region (where the basin is located) has the lowest value, and areas ˂ 800 mm frequently appear in the east and north of the basin [53]. Regarding the trend of PET in recent years, Zhao et al. (2018) found that the PET value in northeastern China showed a generally significant downward trend after 2000. Su et al. [54] found that while there was an overall downward trend of PET, which declined in the western cities of Heilongjiang province, an upward trend dominated in the northern areas such as the Greater Khingan Range and Heihe from 1960 to 2018. Chen et al. [55] studied the Second Songhua River basin trend and found that PET in the plain area showed a downward trend from 1978 to 2018, while a significant upward trend occurred in the highlands. It can be seen that the results and conclusions for the relevant regions from our study are similar to those of previous studies. However, the PET trends in the Song and Nen basins in our study are somewhat contrary to those in previous findings. This may be due to two possible reasons. First, the timing sequence of each study was different: PET changes in 2000 and before would have a specific impact on trends. Second, in previous studies, the spatial distribution of PET was obtained by interpolating the PM model calculations. Only the distance of the station value was considered with this method, except for actual factors such as land use and cover. The corresponding differences were in the areas with mixed surface types. The validity of the conclusions could be verified for the above-mentioned areas by considering both the MOD_PET and PM_PET results and their estimated estimation accuracies from this study.
Many scholars have previously found that under the trend of global warming, there is a contradiction between the hypothesis of increased evaporation capacity in various regions and the observed decrease in measured evaporation or the estimated result of PET. This has been referred to as the “evaporation paradox” [56,57]. In a correlation study of this basin, scholars have obtained and analyzed the spatial distribution and performance of the “evaporation paradox” in Heilongjiang, Jilin, and Inner Mongolia from the perspective of azimuth degree [58,59]. Based on the fact that the temperature in the basin has shown an upward trend from previous studies, this study found that most areas of the basin between 2001 and 2019 showed the “evaporation paradox” phenomenon. However, in forests and cropland areas, there were some locations where this did not appearance did not exist. This is because evapotranspiration and its potential in these areas are determined by evaporation from the ground surface and transpiration capacity of the underlying surface. Vegetation coverage in forest areas was non-uniform, which resulted in some areas with relatively low FVC. This did not reduce evaporation from the ground surface, which contributed significantly to the overall PET [3]. Due to the variety of crops and cropping methods, the amount of artificial irrigation was consistently high in certain cultivated land. Hence, in the background of continuously rising temperatures, the above-mentioned factors cause the region mentioned to be unrestricted by the overall laws of the basin.
4.2. The Impact of Vegetation Cover and Land-Use Changes on PET
In studies on interactions between vegetation cover/land use and regional actual evapotranspiration (AET), Zhang et al. [3] have found that deep roots of the stratum in forest areas can store plant-available water more effectively than in areas of plants with shallow roots, such as croplands and grasslands. Therefore, the actual evapotranspiration of the forest area was the highest of the three when other factors were constant. The following are two opposing hypotheses of investigations on the relationship between AET and PET: “proportional” and “complementary” [60]. Budyko [61] and Yan-Jun et al. [62] explored the applicability of the two hypotheses in different regions. They found that the annual period of evapotranspiration was controlled by the water/energy supply (precipitation versus potential evapotranspiration). Under humid conditions, the water supply is greater than the energy supply. At this time, PET is converted into latent heat flux and becomes true evapotranspiration. However, the relative supply of water and energy is the opposite under drought conditions. At this time, the AET was mainly controlled by changes in precipitation. Therefore, the “proportional” (complementary) hypothesis applies to humid (arid) areas. The relationship between the spatial characteristics of PET and FVC/land use in the basin can be verified by combining previous studies on precipitation and drought levels in the basin [63,64,65].
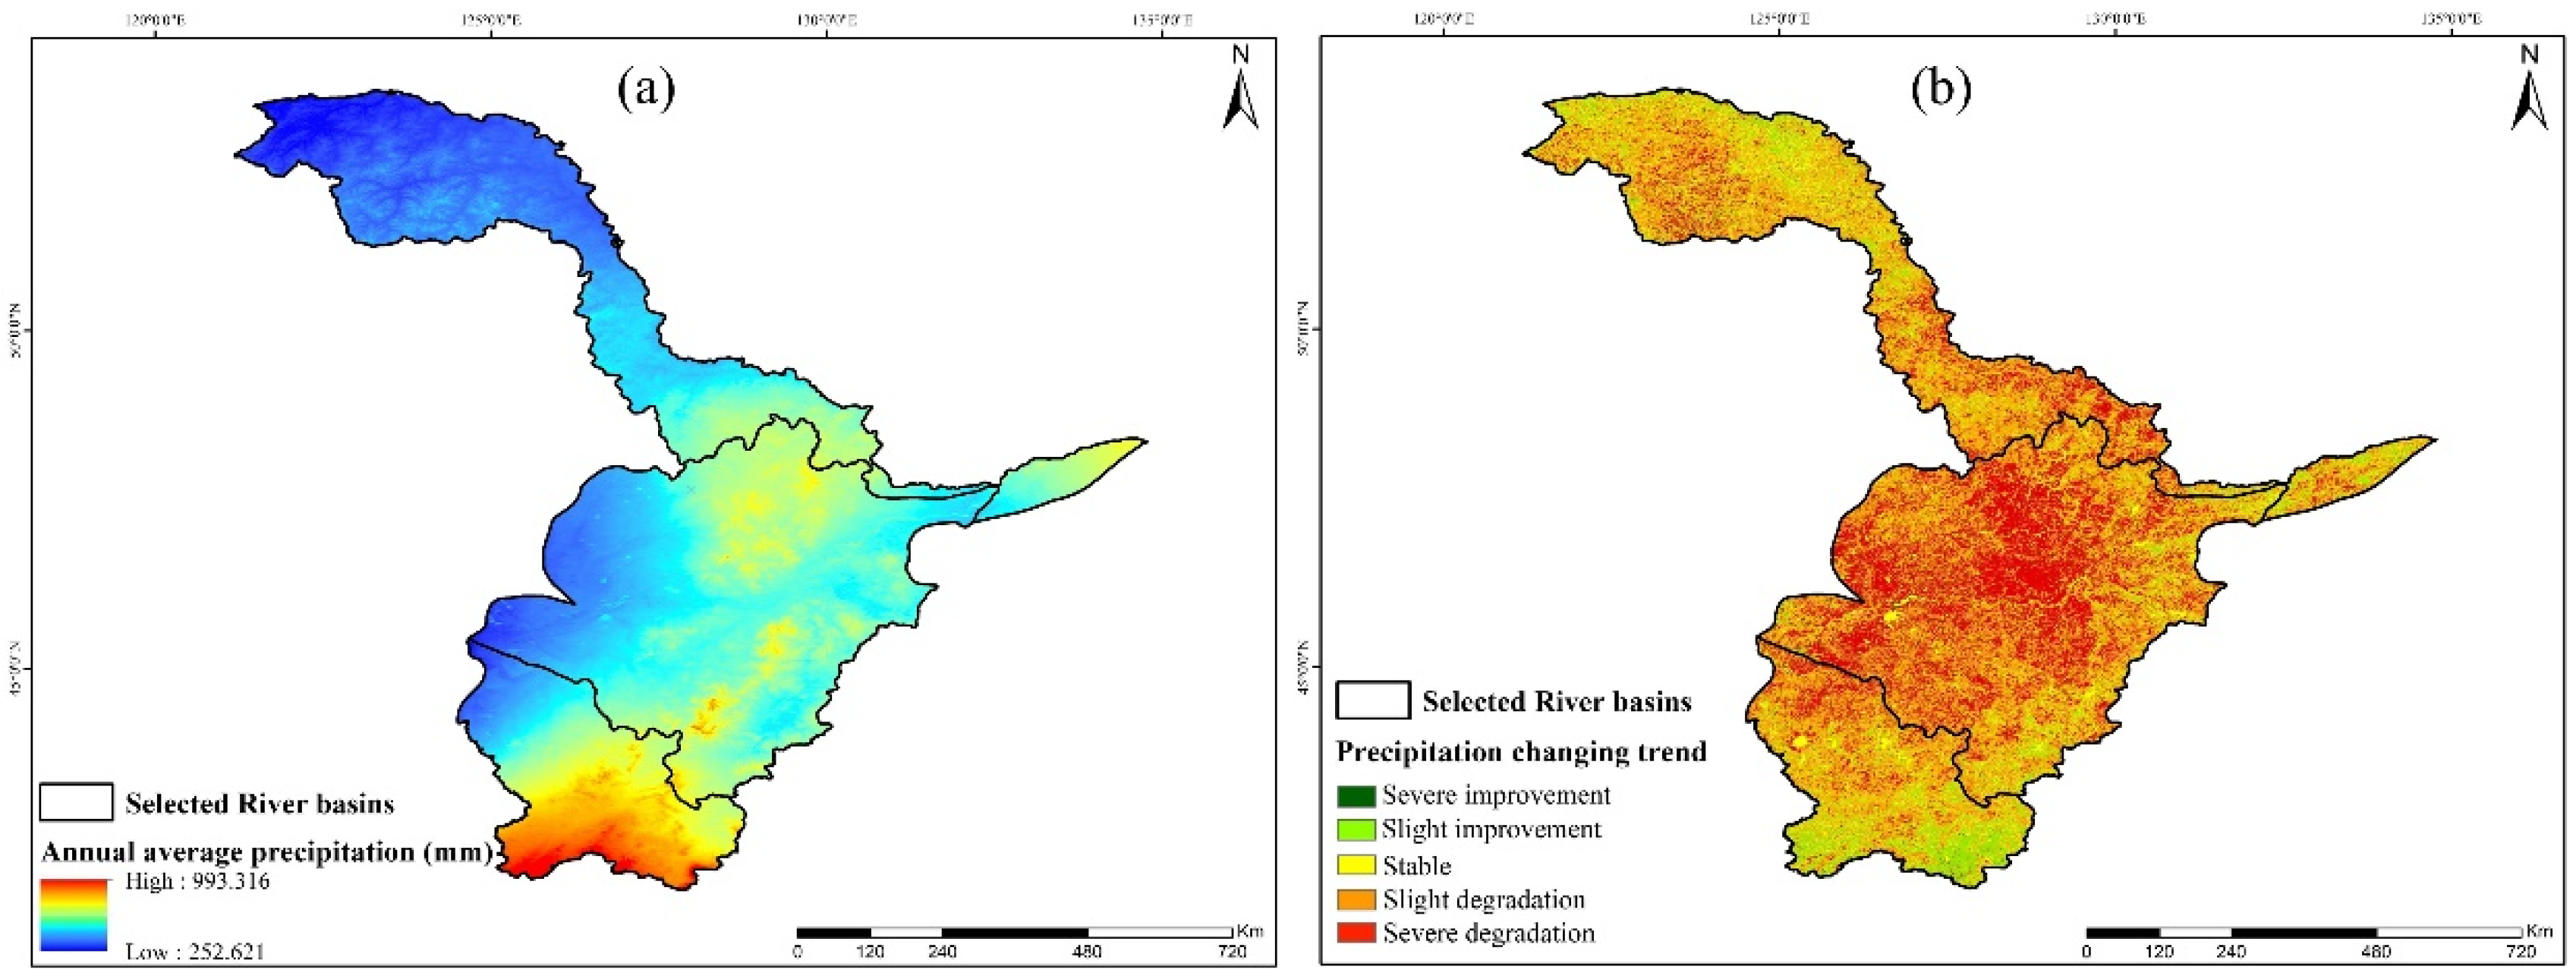
In this study, the yearly trends in FVC and PET showed a negative correlation. The area with the most obvious correlation is in the forest area of the entire Heilong and north of the Songhua River basin. Based on the corresponding conclusions of the former research, the significant increase in FVC in this area should play a positive role in promoting changes in PET in terms of regional vegetation types and wettability. Considering the difference between the theoretical and actual situation, the main explanation is that changes in local PET are not only affected by vegetation coverage but are also restricted by changes in other meteorological factors. Zhang et al. [65] analyzed the sensitivity of PET to various meteorological factors in the Songhua River basin and the contribution of meteorological factors to PET changes on an annual scale. They found that in such an alpine-cold zone, temperature and relative humidity were the most influential factors in the process of PET changes. Based on the response relationship between vegetation coverage and climate change in the basin [31,66], climatic conditions such as gradually decreasing temperature and increasing relative humidity contribute to the variation as the vegetation coverage in the target area is significantly strengthened. To extensively analyze the impact generated by the meteorological elements, we added the annual precipitation as a factor to explore the spatial distribution and time-series analysis of the rainfall with the variation of PET among the three river basins that have homogeneous FVC and stretch along the north–south direction in space: Heilong and (second) Songhua (Figure 10). As shown in Figure 10a, the distribution of rainfall decreased from south to north. Due to the positive interaction of rainfall–AET–PET discovered by the above studies, relatively low precipitation was also proposed as one of the reasons for the pattern of PET in the northern region. In addition, Figure 10b elucidates that there is a positive correlation between the changing trends of annual rainfall and PET. Based on the above findings, arguments can be discussed in terms of ascertaining the responses between PET and FVC by using the link of AET produced by different vegetation. Characterized weather constituents are also suggested to be considered.
Among all the land cover types, forest, cropland, and grassland are the most important sections for resource supply and ecological regulation. As a key link in the soil-water-resource-atmosphere cycle, regional PET is an important parameter guiding the acquisition and management of natural resources, including forest exploitation, farmland irrigation, and grassland grazing. The area of forestry fluctuates with the continuous advancement of the Chinese Three-North Shelterbelt Project, and its proportion increases yearly. However, the rate of change of its internal PET was −5.52 mm·a−1, which indicates that high-latitude forestry was restricted by climatic factors such as low temperatures and rainfall since the water-holding and transpiration capacity of the plants could not effectively exert the synergistic effect of PET. In the context of global warming, forest PET trends may increase gradually or even abruptly, especially in the northern region. One of the sensitive factors for drought monitoring, investigating, and forecasting the future direction under the condition of water supplementation (precipitation, snowfall, etc.) in these areas will become a meaningful aspect of preventing silviculture and cultivation from water shortness. The changing trends of farmland and grassland in the basin over the years have shown an evident complementarity as the eastern edge of the Chinese agricultural/pastoral transition zone. Simultaneously, the western and southwestern parts of the basin have high PET values and are dominated by two land-cover types. Therefore, proper utilization and management of local water resources based on changes in the two types and their ET potential will be essential for maintaining the quality and security of farm-pasture products in this key area. Therefore, this is worthy of further discussion and research.
4.3. Research Deficiencies and Prospects
In the process of experimental data curation and previous documentary analysis, it was found that the following topics are worthy of further improvement and research:
(1) Diversification of estimated data sources: In this study, two representative estimation schemes in meteorology and remote sensing were selected to simulate and analyze the PET of the basin. In recent years, scholars have tried to introduce meteorological data from multi-sourced reanalysis products and simulated PET products for quality assessment and application analysis with promising simulation results [40,41,67]. Therefore, future research will analyze the applicability of the newly estimated results in the basin based on existing studies and the known impact of various factors on PET to expand the research sequence and achieve better simulation results. Furthermore, aside from the evaluation of these products, the key parameters that construct the theoretical equation will be meaningful for modeling and computing. They will aid in calibrating the estimations provided by the selected production. Analysis of this research progress is also mentioned in the literature review section.
(2) Enhance the reasonableness of applicability analysis: In this study, the evaporation data were used as the measured reference material to evaluate the suitability of PM_PET and MOD_PET in the basin. Although its environmental conditions are similar to those set for PET, calculation without the reference crop becomes an encumbrance that affects the reliability of the assessment. In the future, we plan to create the experimental condition on a typical site that possibly meets the observation requirement of PET ruled by its definition. The results will enhance the rationality of the evaluation and can also validate the availability of setting Epan as a judgment. Moreover, the spatial differences were neglected during the correlation test between PET simulations and Epan, which is generated by the consideration that the observed value will be changed by the corresponding operation on scale-uniforming. Therefore, higher-resolution products and downscaling methods will be adopted for future research.
(3) Thematic analysis of the effects of results: This study focused on macro-topics of water consumption in the entire basin and sub-basins. We found that areas with different vegetation growth conditions and cover types due to anthropogenic activity had different spatiotemporal responses to PET changes. For example, in the impact of PET on crop water requirements and supplementation, scholars have calculated evapotranspiration results during the crop growing season in the irrigation area and used them as an input to evaluate the utilization efficiency of water resources [68]. Therefore, future investigations are needed to conduct detailed research on regional evapotranspiration and its impact according to local conditions to provide more precise policy plans for managing water resources under changing climate conditions. This will also facilitate trade and donate adequate high-quality resources with the countries along the CMREC.
5. Conclusions
This study used a variety of conventional meteorological data and estimated the long-term temporal variations and overall spatial distribution of high-suitability PET in the basin by comparing and combining remote-sensing products. The results show that the potential evapotranspiration of the Heilongjiang River basin (Chinese section) from 1984 to 2019 was between 715 and 1060 mm, and the mean annual PET was 897.39 mm. The interannual variation trends of each sub-basin within the basin were roughly the same. Two “candidates” were introduced to seek the finer performance, i.e., PM_PET and MOD_PET, which demonstrated a high consistency for the simulation. After correlation analysis with the measured evaporation data, it was found that both can approximately represent the ET potential. The simulation accuracy of MOD_PET was higher in the areas where the estimations were relatively different in the same period. The spatial characteristics of MOD_PET have an overall pattern of increasing gradually from northeast to southwest, and high-value sectors were mainly concentrated in the Nen and western Argun basins. As the input to propose the multidimensional association analysis, the spatial characteristics of mean PET values from 2001 to 2019 showed a significant negative relationship with the corresponding FVC-classification results and had certain relationships with land use/cover change. By comparing datasets, it was found that the proportion of PET initially increased and then decreased with increasing FVC. There was an overall negative correlation between the trends in PET and FVC in the basin during the research sequence. Areas with the strongest correlations appeared in the middle of the agricultural area in Nen and the northern forested sub-basins, which were affected by the relevance of AET based on the relatively arid environment and northern “take over” climatic conditions, respectively. Annual changes in the selected land-use types, cropland, forest, and grassland differed significantly. They were negatively correlated with the annual trend in PET over 19 years. However, the situation is expected to be altered substantially in the near future or longer according to the warming climatic tendency and the macro-policy regulation contrapuntally on each ecological niche.
Author Contributions
J.W.: Conceptualization and supervision; Y.Z.: writing the manuscript draft, data preparation, experiments, and analysis; E.G.: data collection and supervision; K.L.: data collection and processing. All authors have read and agreed to the published version of the manuscript.
Funding
Fundings for the research received from the Strategic Priority Research Program (Class A) of the Chinese Academy of Sciences (Grant XDA2003020302), Construction Project of China Knowledge Center for Engineering Sciences and Technology (Grant CKCEST-2021-2-18).
Institutional Review Board Statement
Not applicable.
Informed Consent Statement
Not applicable.
Data Availability Statement
All data, models, or codes generated or used during the study are available from the corresponding author upon request.
Acknowledgments
Thanks for the support provided by Special Exchange Program of Chinese Academy of Sciences. In addition, the authors are also thankful to colleagues Huanyu Xu, Jian Wang and Xingguang Yan for their constructive comments and supplied inspiration during data processing and manuscript writing.
Conflicts of Interest
The authors declare no conflict of interest.
References
- Pereira Luis, S.; Perrier, A.; Allen Richard, G.; Alves, I. Evapotranspiration: Concepts and Future Trends. J. Irrig. Drain. Eng. 1999, 125, 45–51. [Google Scholar] [CrossRef]
- Gao, G.; Chen, D.; Ren, G.; Chen, Y.; Liao, Y. Spatial and temporal variations and controlling factors of potential evapotranspiration in China: 1956–2000. J. Geogr. Sci. 2006, 16, 3–12. [Google Scholar] [CrossRef]
- Zhang, L.; Dawes, W.R.; Walker, G.R. Response of mean annual evapotranspiration to vegetation changes at catchment scale. Water Resour. Res. 2001, 37, 701–708. [Google Scholar] [CrossRef]
- Liu, M.; Tian, H.; Chen, G.; Ren, W.; Zhang, C.; Liu, J. Effects of land-use and land-cover change on evapotranspiration and water yield in china during 1900–2000. J. Am. Water Resour. Assoc. 2008, 44, 1193–1207. [Google Scholar] [CrossRef]
- Wang, Q.; Cheng, L.; Zhang, L.; Liu, P.; Qin, S.; Liu, L.; Jing, Z. Quantifying the impacts of land-cover changes on global evapotranspiration based on the continuous remote sensing observations during 1982–2016. J. Hydrol. 2021, 598, 126231. [Google Scholar] [CrossRef]
- Srivastava, A.; Sahoo, B.; Raghuwanshi, N.S.; Singh, R. Evaluation of Variable-Infiltration Capacity Model and MODIS-Terra Satellite-Derived Grid-Scale Evapotranspiration Estimates in a River Basin with Tropical Monsoon-Type Climatology. J. Irrig. Drain. Eng. 2017, 143, 04017028. [Google Scholar] [CrossRef] [Green Version]
- Penman, H.L. Natural Evaporation from Open Water, Bare Soil and Grass. Proc. R. Soc. Lond. Math. Phys. Sci. 1948, 193, 120–145. [Google Scholar]
- Monteith, J.L. Evaporation and Environment; Academic Press: Cambridge, MA, USA, 1965. [Google Scholar]
- Priestley, C.; Taylor, R.J. On the Assessment of Surface Heat Flux and Evaporation Using Large Scale Parameters. Mon. Weather Rev. 1972, 100, 81–92. [Google Scholar] [CrossRef]
- Hargreaves, G.H.; Samani, Z.A. Reference Crop Evapotranspiration from Temperature. Appl. Eng. Agric. 1985, 1, 96–99. [Google Scholar] [CrossRef]
- Ankur, S.; Bhabagrahi, S.; Singh, R.N.; Chandranath, C. Modelling the dynamics of evapotranspiration using Variable Infiltration Capacity model and regionally calibrated Hargreaves approach. Irrig. Sci. 2018, 36, 289–300. [Google Scholar]
- Kumar, M.; Bandyopadhyay, A.; Raghuwanshi, N.S.; Singh, R. Comparative study of conventional and artificial neural network-based ETo estimation models. Irrig. Sci. 2008, 26, 531–545. [Google Scholar] [CrossRef]
- Sahoo, B. Closure to ‘Standardization of Reference Evapotranspiration Models for a Subhumid Valley Rangeland in the Eastern Himalayas’ by Bhabagrahi Sahoo, Imtisenla Walling, Bidyut, C. Deka, and Bhagwati, P. Bhatt. J. Irrig. Drain. Eng. 2013, 139, 795–796. [Google Scholar] [CrossRef]
- Hargreaves, G.H.; Samani, Z.A. Estimating Potential Evapotranspiration. J. Irrig. Drain. Div. 1982, 108, 225–230. [Google Scholar] [CrossRef]
- Yin, Y.; Wu, S.; Gang, C.; Dai, E. Attribution analyses of potential evapotranspiration changes in China since the 1960s. Theor. Appl. Climatol. 2010, 101, 19–28. [Google Scholar] [CrossRef]
- Tang, Y.; Tang, Q. Variations and influencing factors of potential evapotranspiration in large Siberian river basins during 1975–2014. J. Hydrol. 2021, 598, 126443. [Google Scholar] [CrossRef]
- Al-Faraj, F.A.M.; Tigkas, D. Impacts of Multi-year Droughts and Upstream Human-Induced Activities on the Development of a Semi-arid Transboundary Basin. Water Resour. Manag. 2016, 30, 5131–5143. [Google Scholar] [CrossRef]
- Gerginov, P.; Antonov, D. Estimation of evapotranspiration rate by using the Penman-Monteith and Hargreaves formulas for the loess in Northeast Bulgaria complex with HYDRUS-1D. Geol. Balc. 2019, 48, 3–9. [Google Scholar] [CrossRef]
- Zhang, S.; Liu, S.; Xingguo, M.O.; Shu, C.; Sun, Y. Assessing the Impact of Climate Change on Reference Evapotranspiration in Aksu River Basin. Acta Geogr. Sin. 2010, 65, 1363–1370. [Google Scholar]
- Liu, H.; Wang, Z.; Ji, G.; Yue, Y. Quantifying the Impacts of Climate Change and Human Activities on Runoff in the Lancang River Basin Based on the Budyko Hypothesis. Water 2020, 12, 3501. [Google Scholar] [CrossRef]
- Zhao, S.; Chen, S. Spatiotemporal variations of evapotranspiration and potential evapotranspiration in Shandong Province based on station observations and MOD16. Prog. Geogr. 2017, 36, 1040–1047. [Google Scholar]
- Yuanfei, L.I.; Zhang, L.; Cao, Y.; Xiao, C.; Liu, M. Spatiotemporal variations of potential evapotranspiration and its climate influencing factors in Hebei Province. South-North Water Transf. Water Sci. Technol. 2019, 17, 67–78. [Google Scholar]
- Tong, S.Q.; Zhang, J.Q.; Hasi Qi-Yun, M.A.; Environment, S.O. 14 Years Spatial-temporal Distribution Characteristics of Evapotranspiration in Xilingol Grassland Based on MOD16. Chin. J. Grassl. 2016, 38, 83–91. [Google Scholar]
- Huang, J.; Cui, W.; Zhong, M.; Li, X.N. Research on the Characteristics of Evapotranspiration and Climate Aridity Based on Remote Sensing Data in Yunnan–Guizhou Region. China Rural Water Hydropower 2021, 98–104. [Google Scholar]
- Autovino, D.; Minacapilli, M.; Provenzano, G. Modelling bulk surface resistance by MODIS data and assessment of MOD16A2 evapotranspiration product in an irrigation district of Southern Italy. Agric. Water Manag. 2016, 167, 86–94. [Google Scholar] [CrossRef]
- Chen, S.; Zhang, L.I.; Tian, X.; Tang, Q.; Liu, X. Comparative analysis of potential evapotranspiration estimation between Penman-Monteith model and MOD16 data in Middle and Lower Yangtze River Basin. Eng. J. Wuhan Univ. 2019, 52, 283–289. [Google Scholar]
- Dai, C.; Wang, S.; Li, Z.; Zhang, Y.; Gao, Y.; Li, C. Review on hydrological geography in Heilongjiang River Basin. Acta Geogr. Sin. 2015, 70, 1823–1834. [Google Scholar]
- Haruyama, S.; Shiraiwa, T. Environmental Change and the Social Response in the Amur River Basin; Springer: Berlin/Heidelberg, Germany, 2014; Volume 5. [Google Scholar]
- Yang, R.; Li, X.; Mao, D.; Wang, Z.; Tian, Y.; Dong, Y. Examining fractional vegetation cover dynamics in response to climate from 1982 to 2015 in the Amur river basin for SDG 13. Sustainability 2020, 12, 5866. [Google Scholar] [CrossRef]
- Gao, G.; Fu, B.; Wang, S.; Liang, W.; Jiang, X. Determining the hydrological responses to climate variability and land use/cover change in the Loess Plateau with the Budyko framework. Sci. Total Environ. 2016, 557, 331–342. [Google Scholar] [CrossRef]
- Fang, L.; Wang, W.; Jiang, W.; Chen, M.; Wang, Y.; Jia, K.; Li, Y. Spatio-temporal Variations of Vegetation Cover and Its Responses to Climate Change in the Heilongjiang Basin of China from 2000 to 2014. Sci. Geogr. Sin. 2017, 37, 1745–1754. [Google Scholar] [CrossRef]
- Tian, P.; Tian, K.; Jing, L.I.; Zhang, G.J. Studies on Ecological Functional Districts along Amur Basin. J. Northwest For. Univ. 2007, 22, 189–193. [Google Scholar]
- Sputniknews. COVID-19 Outbreak Has Not Disrupted Trade between Russia and China. Available online: https://sputniknews.cn/20200930/1032229345.html (accessed on 30 September 2020).
- Sulla-Menashe, D.; Friedl, M. MCD12Q1 MODIS/Terra + Aqua Land Cover Type Yearly L3 Global 500 m SIN Grid V006; NASA EOSDIS Land Processes DAAC: Sioux Falls, SD, USA, 2019.
- Peng, S.; Ding, Y.; Liu, W.; Zhi, L.I. 1 km monthly temperature and precipitation dataset for China from 1901 to 2017. Earth Syst. Sci. Data 2019, 11, 1931–1946. [Google Scholar] [CrossRef] [Green Version]
- Allen, G.; Utah, L.; Pereira, L.; Raes, D. Crop evapotranspiration: Guidelines for computing crop water requirements. FAO 1998, 300, D05109. [Google Scholar]
- Mu, Q.; Heinsch, F.A.; Zhao, M.; Running, S.W. Development of a global evapotranspiration algorithm based on MODIS and global meteorology data. Remote Sens. Environ. 2007, 111, 519–536. [Google Scholar] [CrossRef]
- Mu, Q.; Zhao, M.; Running, S.W. Improvements to a MODIS global terrestrial evapotranspiration algorithm. Remote Sens. Environ. 2011, 115, 1781–1800. [Google Scholar] [CrossRef]
- Degano, M.F.; Rivas, R.E.; Carmona, F.; Niclòs, R.; Sánchez, J.M. Evaluation of the MOD16A2 evapotranspiration product in an agricultural area of Argentina, the Pampas region. Egypt. J. Remote Sens. Space Sci. 2021, 24, 319–328. [Google Scholar] [CrossRef]
- Tian, Y.; Zhang, K.; Xu, Y.P.; Gao, X.; Wang, J. Evaluation of Potential Evapotranspiration Based on CMADS Reanalysis Dataset over China. Water 2018, 10, 1126. [Google Scholar] [CrossRef] [Green Version]
- Huang, J.; Wang, W.; Cui, W.; Wang, P. Evaluation of several evapotranspiration products over Yunnan-Guizhou region in China. Yangtze River 2019, 50, 73. [Google Scholar]
- Xu, S.; Yu, Z.; Yang, C.; Ji, X.; Zhang, K. Trends in evapotranspiration and their responses to climate change and vegetation greening over the upper reaches of the Yellow River Basin. Agric. For. Meteorol. 2018, 263, 118–129. [Google Scholar] [CrossRef]
- Chen, D.; Gao, G.; Xu, C.; Guo, J.; Ren, G. Comparison of the Thornthwaite method and pan data with the standard Penman-Monteith estimates of reference evapotranspiration in China. Clim. Res. 2005, 28, 123–132. [Google Scholar] [CrossRef]
- Liao, X.F.; Qian, S.; Peng, Y.M.; Qing-Guo, L.I.; Jun, L.U.; Cai, C.X. Response of Evaporation of Evaporator and Potential Evapotranspiration to the Climate Variation. Yellow River 2010, 32, 42–44. [Google Scholar]
- Wang, M.; Jing-Kun, N.A.; Wang, J.B. The representation of small evaporation machince(E_(20)) and calculation data. J. Heilongjiang Hydraul. Eng. Coll. 2004, 31, 17–19. [Google Scholar]
- Xu, S.; Liang, H.; Fu, S.; Hu, Y. Variation characteristics of evaporation in Jilin province from 1951 to 2015. J. Meteorol. Environ. 2018, 34, 71–77. [Google Scholar]
- Yang, J.; Dong, Z.; Meng, Y. Analysis on Small Type and E-601 Type Evaporation Conversion Coefficient in Inner Mongolia. Meteorol. J. Inn. Mong. 2018, 33–36. [Google Scholar]
- Li, J.; Yan, X.; Yan, X.; Guo, W.; Wang, K.; Qiao, J. Temporal and Spatial Variation Study of Vegetation Coverage in the Yellow River Basin Based on GEE Cloud Platform. J. China Coal Soc. 2021, 46, 1439–1450. [Google Scholar]
- Kendall, M.G. Rank Correlation Methods; C. Griffin: Washington, DC, USA, 1948. [Google Scholar]
- Sievers, G.L. Weighted rank statistics for simple linear regression. J. Am. Stat. Assoc. 1978, 73, 628–631. [Google Scholar] [CrossRef]
- Rodrigues, M.; Santana, P.; Rocha, A. Bootstrap approach to validate the performance of models for predicting mortality risk temperature in Portuguese Metropolitan Areas. Environ. Health 2019, 18, 1–16. [Google Scholar] [CrossRef] [PubMed] [Green Version]
- Wu, X.; Wang, P.; Huo, Z.; Bai, Y. Spatio-temporal distribution characteristics of potential evapotranspiration and impact factors in China from 1961 to 2015. Resour. Sci. 2017, 39, 964–977. [Google Scholar]
- Zhao, Y.; Liu, Y.; Li, J.; Liu, X. Spatial and temporal variation of potential evapotranspiration and its sensitivity to meteorological factors in china from 1960 to 2013. Desert Oasis Meteorol. 2018, 12, 1–9. [Google Scholar]
- Su, J.W.; Zhang, X.L.; Shen, B. Spatial and Temporal Variation Characteristics and Influencing Factors of Potential Evapotranspiration in Heilongjiang Province. Heilongjiang Hydraul. Sci. Technol. 2021, 49, 1–8. [Google Scholar]
- Chen, H.; Yang, G.; Lin, M.; Wu, J.; Yuan, F. Spatiotemporal Changes and Affecting Factors of Potential Evapotranspiration in the Second Songhua River Basin. Res. Soil Water Conserv. 2021, 28, 238–244 + 253. [Google Scholar]
- Brutsaert, W.; Parlange, M. Hydrologic Cycle Explains the Evaporation Paradox. Nature 1998, 396, 30. [Google Scholar] [CrossRef]
- Cong, Z.; Yang, D.; Ni, G. Does evaporation paradox exist in China? Hydrol. Earth Syst. Sci. 2009, 13, 357–366. [Google Scholar] [CrossRef] [Green Version]
- Zhao, Q.; Zou, C.; Wang, K.; Gao, Q.; Yao, T. Spatial and temporal distribution characteristics of drought and its influencing factors in Heilongjiang province, China from 1956 to 2015. Appl. Ecol. Environ. Res. 2019, 17, 2631–2650. [Google Scholar] [CrossRef]
- Hu, Q.; Pan, F.; Pan, X.; Hu, L.; Wang, X.; Yang, P.; Wei, P.; Pan, Z. Dry-wet variations and cause analysis in Northeast China at multi-time scales. Theor. Appl. Climatol. 2018, 133, 775–786. [Google Scholar] [CrossRef]
- Fisher, J.B.; Whittaker, R.J.; Malhi, Y. ET come home: Potential evapotranspiration in geographical ecology. Glob. Ecol. Biogeogr. 2011, 20, 1–18. [Google Scholar] [CrossRef]
- Budyko, M.I. Climate and Life; Academic Press: Cambridge, MA, USA, 1974; p. 508. [Google Scholar]
- Yan-Jun, W.; Bo, L.; Jian-Qing, D.; Bu-Da, S.; Yong, L.; Zeng-Xin, Z. Relationship between potential and actual evaporation in Yangtze River Basin. Adv. Clim. Chang. Res. 2011, 7, 393. [Google Scholar]
- Gu, J.P.; Wang, S.Y.; Gong, J.G.; Sun, Z.F.; Gong, W.L. Spational-temporal Evolution Study of Drought and Flood in Heilongjiang Province. Water Resour. Power 2017, 35, 17–20. [Google Scholar]
- Wang, X.; Shen, H.; Zhang, W.; Cao, J.; Qi, Y.; Chen, G.; Li, X. Spatial and temporal characteristics of droughts in the Northeast China Transect. Nat. Hazards 2015, 76, 601–614. [Google Scholar] [CrossRef]
- Zhang, J.; Liu, G.; Song, X.; Song, S.; Jiuyi, L.I.; Lijuan, L.I. A Simulation Study of Actual Evapotranspiration in Songhuajiang River Basin Based on Budyko Hypothesis. J. China Hydrol. 2019, 39, 22–27. [Google Scholar]
- You, G.; Liu, B.; Zou, C.; Li, H.; McKenzie, S.; He, Y.; Gao, J.; Jia, X.; Altaf Arain, M.; Wang, S.; et al. Sensitivity of vegetation dynamics to climate variability in a forest-steppe transition ecozone, north-eastern Inner Mongolia, China. Ecol. Indic. 2021, 120, 106833. [Google Scholar] [CrossRef]
- Wang, Y.; Wang, S.; Song, W.; Yang, S. Application of GLDAS data to the potential evapotranspiration monitoring in Weihe River Basin. J. Arid. Land Resour. Environ. 2013, 27, 54–58. [Google Scholar]
- Fu, J.E.; Pang, Z.; Lu, J. Research on Assessment Method of Winter Wheat Water Use Efficiency Based on ET and Biomass with Remote Sensing; Geo-Informatics in Resource Management and Sustainable Ecosystem: Wuhan, China, 2013. [Google Scholar]
Figure 1.
General condition of the Heilongjiang River basin, China: (a) Location of study site; and (b) selected meteorological sites, elevation distribution, and regionalization.
Figure 1.
General condition of the Heilongjiang River basin, China: (a) Location of study site; and (b) selected meteorological sites, elevation distribution, and regionalization.

Figure 2.
Flowchart of the methods employed in this study.

Figure 3.
Interannual variation of Penman–Monteith potential evapotranspiration (PM_PET) and MOD16 potential evapotranspiration (MOD_PET) mean values for the whole basin and its sub-basins from 1984 to 2019: (a) PM_PET (1984–2000); (b) PM_PET (2001–2019); and (c) MOD_PET (2001–2019).
Figure 3.
Interannual variation of Penman–Monteith potential evapotranspiration (PM_PET) and MOD16 potential evapotranspiration (MOD_PET) mean values for the whole basin and its sub-basins from 1984 to 2019: (a) PM_PET (1984–2000); (b) PM_PET (2001–2019); and (c) MOD_PET (2001–2019).

Figure 4.
Correlation analysis of PM_PET with (a) Epan_avg and (b) MOD_PET over all weather stations.
Figure 4.
Correlation analysis of PM_PET with (a) Epan_avg and (b) MOD_PET over all weather stations.

Figure 5.
Correlation analysis of PM_PET and MOD_PET with Epan_avg for specified stations: (a) 2001–2009 and (b) 2010–2019.
Figure 5.
Correlation analysis of PM_PET and MOD_PET with Epan_avg for specified stations: (a) 2001–2009 and (b) 2010–2019.

Figure 6.
Spatial distributions of potential evapotranspiration (PET) and fractional vegetation coverage (FVC)/land use in the basin: (a) PET, (b) FVC, and (c) Land-use type.
Figure 6.
Spatial distributions of potential evapotranspiration (PET) and fractional vegetation coverage (FVC)/land use in the basin: (a) PET, (b) FVC, and (c) Land-use type.

Figure 7.
Time-series changes of fractional vegetation coverage in the basin.

Figure 8.
Changing trend of (a) potential evapotranspiration (PET) and (b) fractional vegetation coverage (FVC), 2001–2019 in the basin.
Figure 8.
Changing trend of (a) potential evapotranspiration (PET) and (b) fractional vegetation coverage (FVC), 2001–2019 in the basin.

Figure 9.
Time-series changes of land-use types and corresponding potential evapotranspiration (PET): (a) forest, (b) cropland, and (c) grassland.
Figure 9.
Time-series changes of land-use types and corresponding potential evapotranspiration (PET): (a) forest, (b) cropland, and (c) grassland.

Figure 10.
Spatial distribution of annual average precipitation (a) and changing trend of the annual precipitation (b) over Heilong and (Second) Songhua River basins from 2001 to 2019.
Figure 10.
Spatial distribution of annual average precipitation (a) and changing trend of the annual precipitation (b) over Heilong and (Second) Songhua River basins from 2001 to 2019.


Table 1.
Parameters of quantitative evaluation based on the correlation analyses.
| Period | MOD_PET–Epan_avg | PM_PET–Epan_avg | ||||
|---|---|---|---|---|---|---|
| R2 | MAE | RMSE | R2 | MAE | RMSE | |
| 2001–2009 | 0.94 | 69.22 | 78.37 | 0.79 | 239.35 | 248.49 |
| 2010–2019 | 0.94 | 65.85 | 78.2 | 0.85 | 168.87 | 181.51 |
Table 2.
Basin/sub-basin mean fractional vegetation coverage (FVCs) and class ratios.
| (Sub) Basin Name | Mean FVC | FVC Class Ratio % | ||||
|---|---|---|---|---|---|---|
| Bare Soil or Water Body | Low Cover | Low–Medium Cover | Medium Cover | High Cover | ||
| The whole Basin | 0.491 | 1.08 | 8.35 | 35.41 | 28.57 | 26.59 |
| Heilong | 0.565 | 0.39 | 0.57 | 14.58 | 35.92 | 48.54 |
| Songhua–Tumen | 0.545 | 0.64 | 2.11 | 37.18 | 20.58 | 39.49 |
| Argun | 0.411 | 2.39 | 0.97 | 50.97 | 22.83 | 22.84 |
| Nen | 0.457 | 1.09 | 5.72 | 47.78 | 29.12 | 16.29 |
| Wusuli–Suifen | 0.484 | 1.66 | 11.74 | 41.20 | 30.87 | 14.53 |
Table 3.
Basin/sub-basin mean Potential evapotranspiration (PETs) and class ratios.
| (Sub) Basin Name | Mean PET/mm | PET Class Ratio % | ||||
|---|---|---|---|---|---|---|
| [125–365] | [365–605] | [605–845] | [845–1085] | [1085–1337] | ||
| The whole Basin | 928.27 | 0.12 | 6.57 | 55.87 | 37.44 | 0 |
| Heilong | 795.21 | 0.72 | 42.71 | 30.92 | 25.65 | 0 |
| Songhua–Tumen | 924.3 | 0.01 | 11.09 | 50.53 | 38.18 | 0.19 |
| Argun | 829.04 | 0.025 | 13.659 | 47.031 | 39.285 | 0 |
| Nen | 974.66 | 0.005 | 17.594 | 37.744 | 43.360 | 1.296 |
| Wusuli–Suifen | 958.35 | 0.004 | 3.275 | 59.714 | 37.007 | 0 |
Publisher’s Note: MDPI stays neutral with regard to jurisdictional claims in published maps and institutional affiliations. |
© 2022 by the authors. Licensee MDPI, Basel, Switzerland. This article is an open access article distributed under the terms and conditions of the Creative Commons Attribution (CC BY) license (https://creativecommons.org/licenses/by/4.0/).
Share and Cite
MDPI and ACS Style
Zhou, Y.; Wang, J.; Grigorieva, E.; Li, K. Dissecting the Mutual Response of Potential Evapotranspiration with Vegetation Cover/Land Use over Heilongjiang River Basin, China. Water 2022, 14, 814. https://doi.org/10.3390/w14050814
AMA Style
Zhou Y, Wang J, Grigorieva E, Li K. Dissecting the Mutual Response of Potential Evapotranspiration with Vegetation Cover/Land Use over Heilongjiang River Basin, China. Water. 2022; 14(5):814. https://doi.org/10.3390/w14050814
Chicago/Turabian StyleZhou, Yezhi, Juanle Wang, Elena Grigorieva, and Kai Li. 2022. "Dissecting the Mutual Response of Potential Evapotranspiration with Vegetation Cover/Land Use over Heilongjiang River Basin, China" Water 14, no. 5: 814. https://doi.org/10.3390/w14050814
Note that from the first issue of 2016, this journal uses article numbers instead of page numbers. See further details here.