
Spatial and Temporal Effects of Irrigation Canals Rehabilitation on the Land and Crop Yields, a Case Study: The Nile Delta, Egypt


Abstract
:1. Introduction
2. Materials and Methods
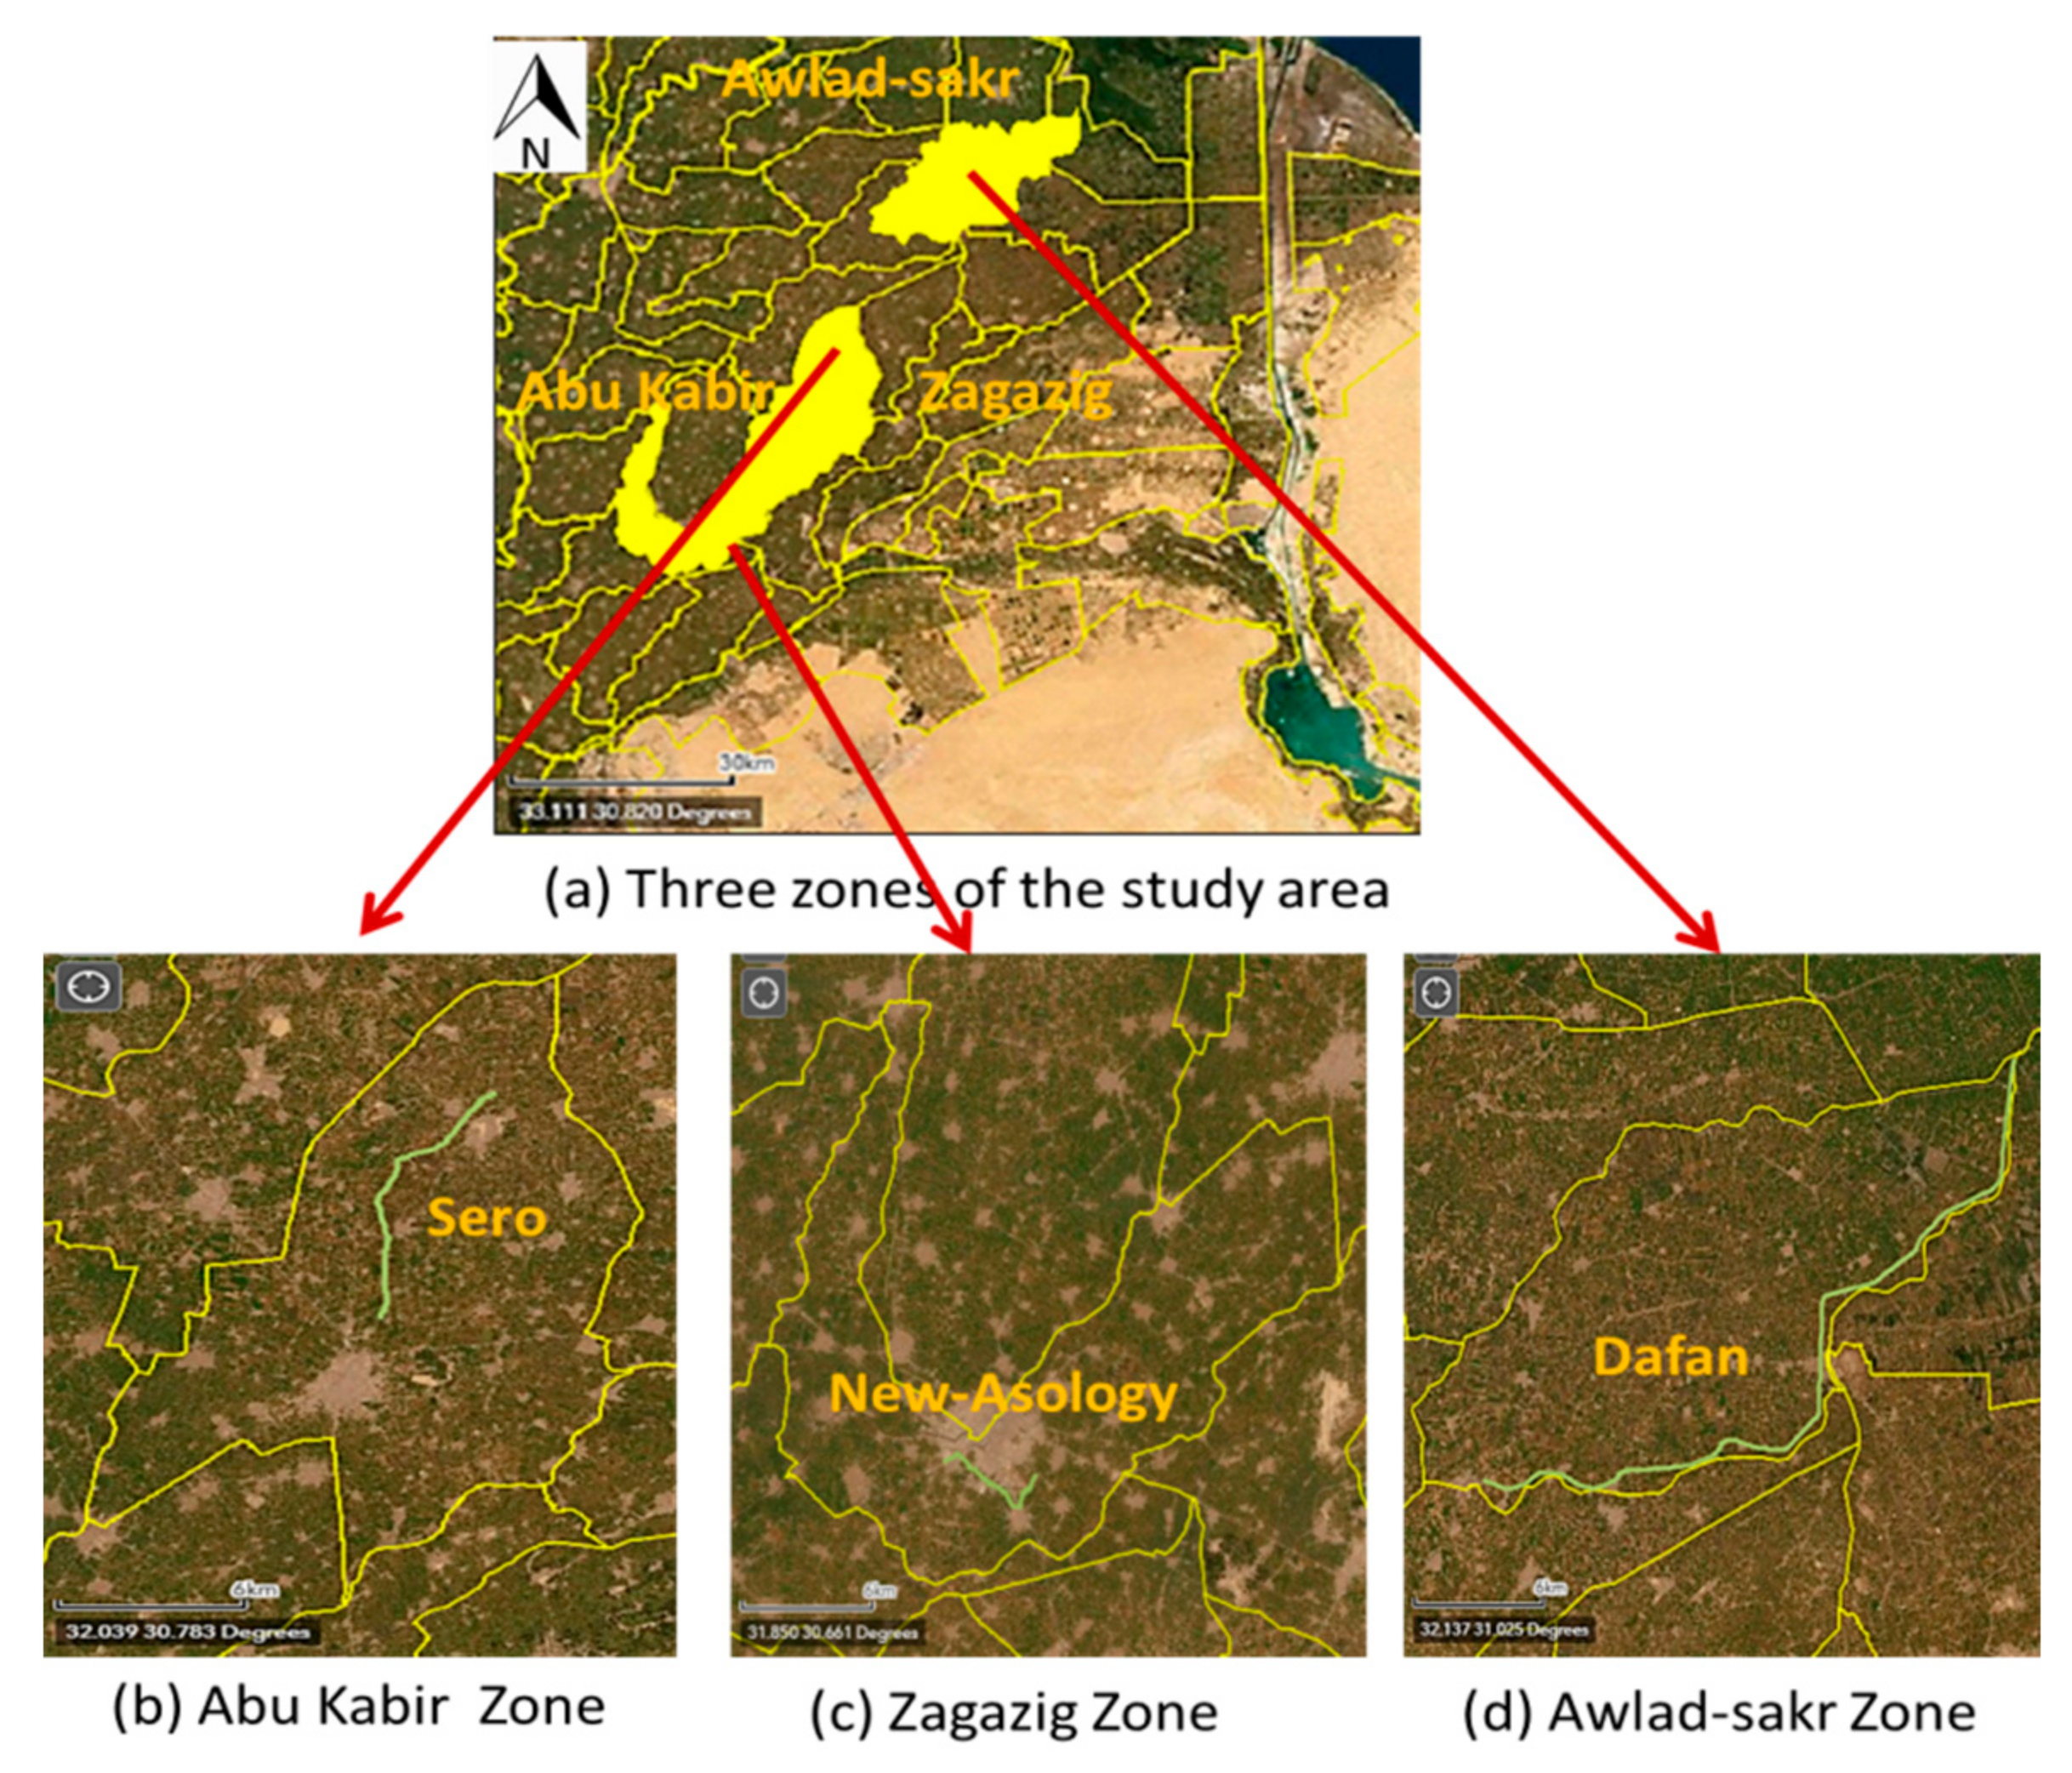
2.1. The Study Area
2.1.1. Surface Water System in the Study Area
2.1.2. Groundwater System in the Study Area
2.1.3. Interaction between the Surface and Groundwater Systems and Discharge in the Study Area
2.2. Numerical Modeling
- q: specific discharge (m3/day/m)
- : hydraulic conductivity (m/day)
- : gradient of the total hydraulic head (m/m)
- : total head , ie
- h: pressure head
- y: elevation
- : hydraulic conductivity in the x-direction
- : hydraulic conductivity in the y-direction
- : applied boundary flux
- : volumetric water content (for clay = 45% to 55%)
- t: time
- k: element property matrix (includes material properties and volume)
- : nodal total head
- Q: nodal flow
3. Methodology
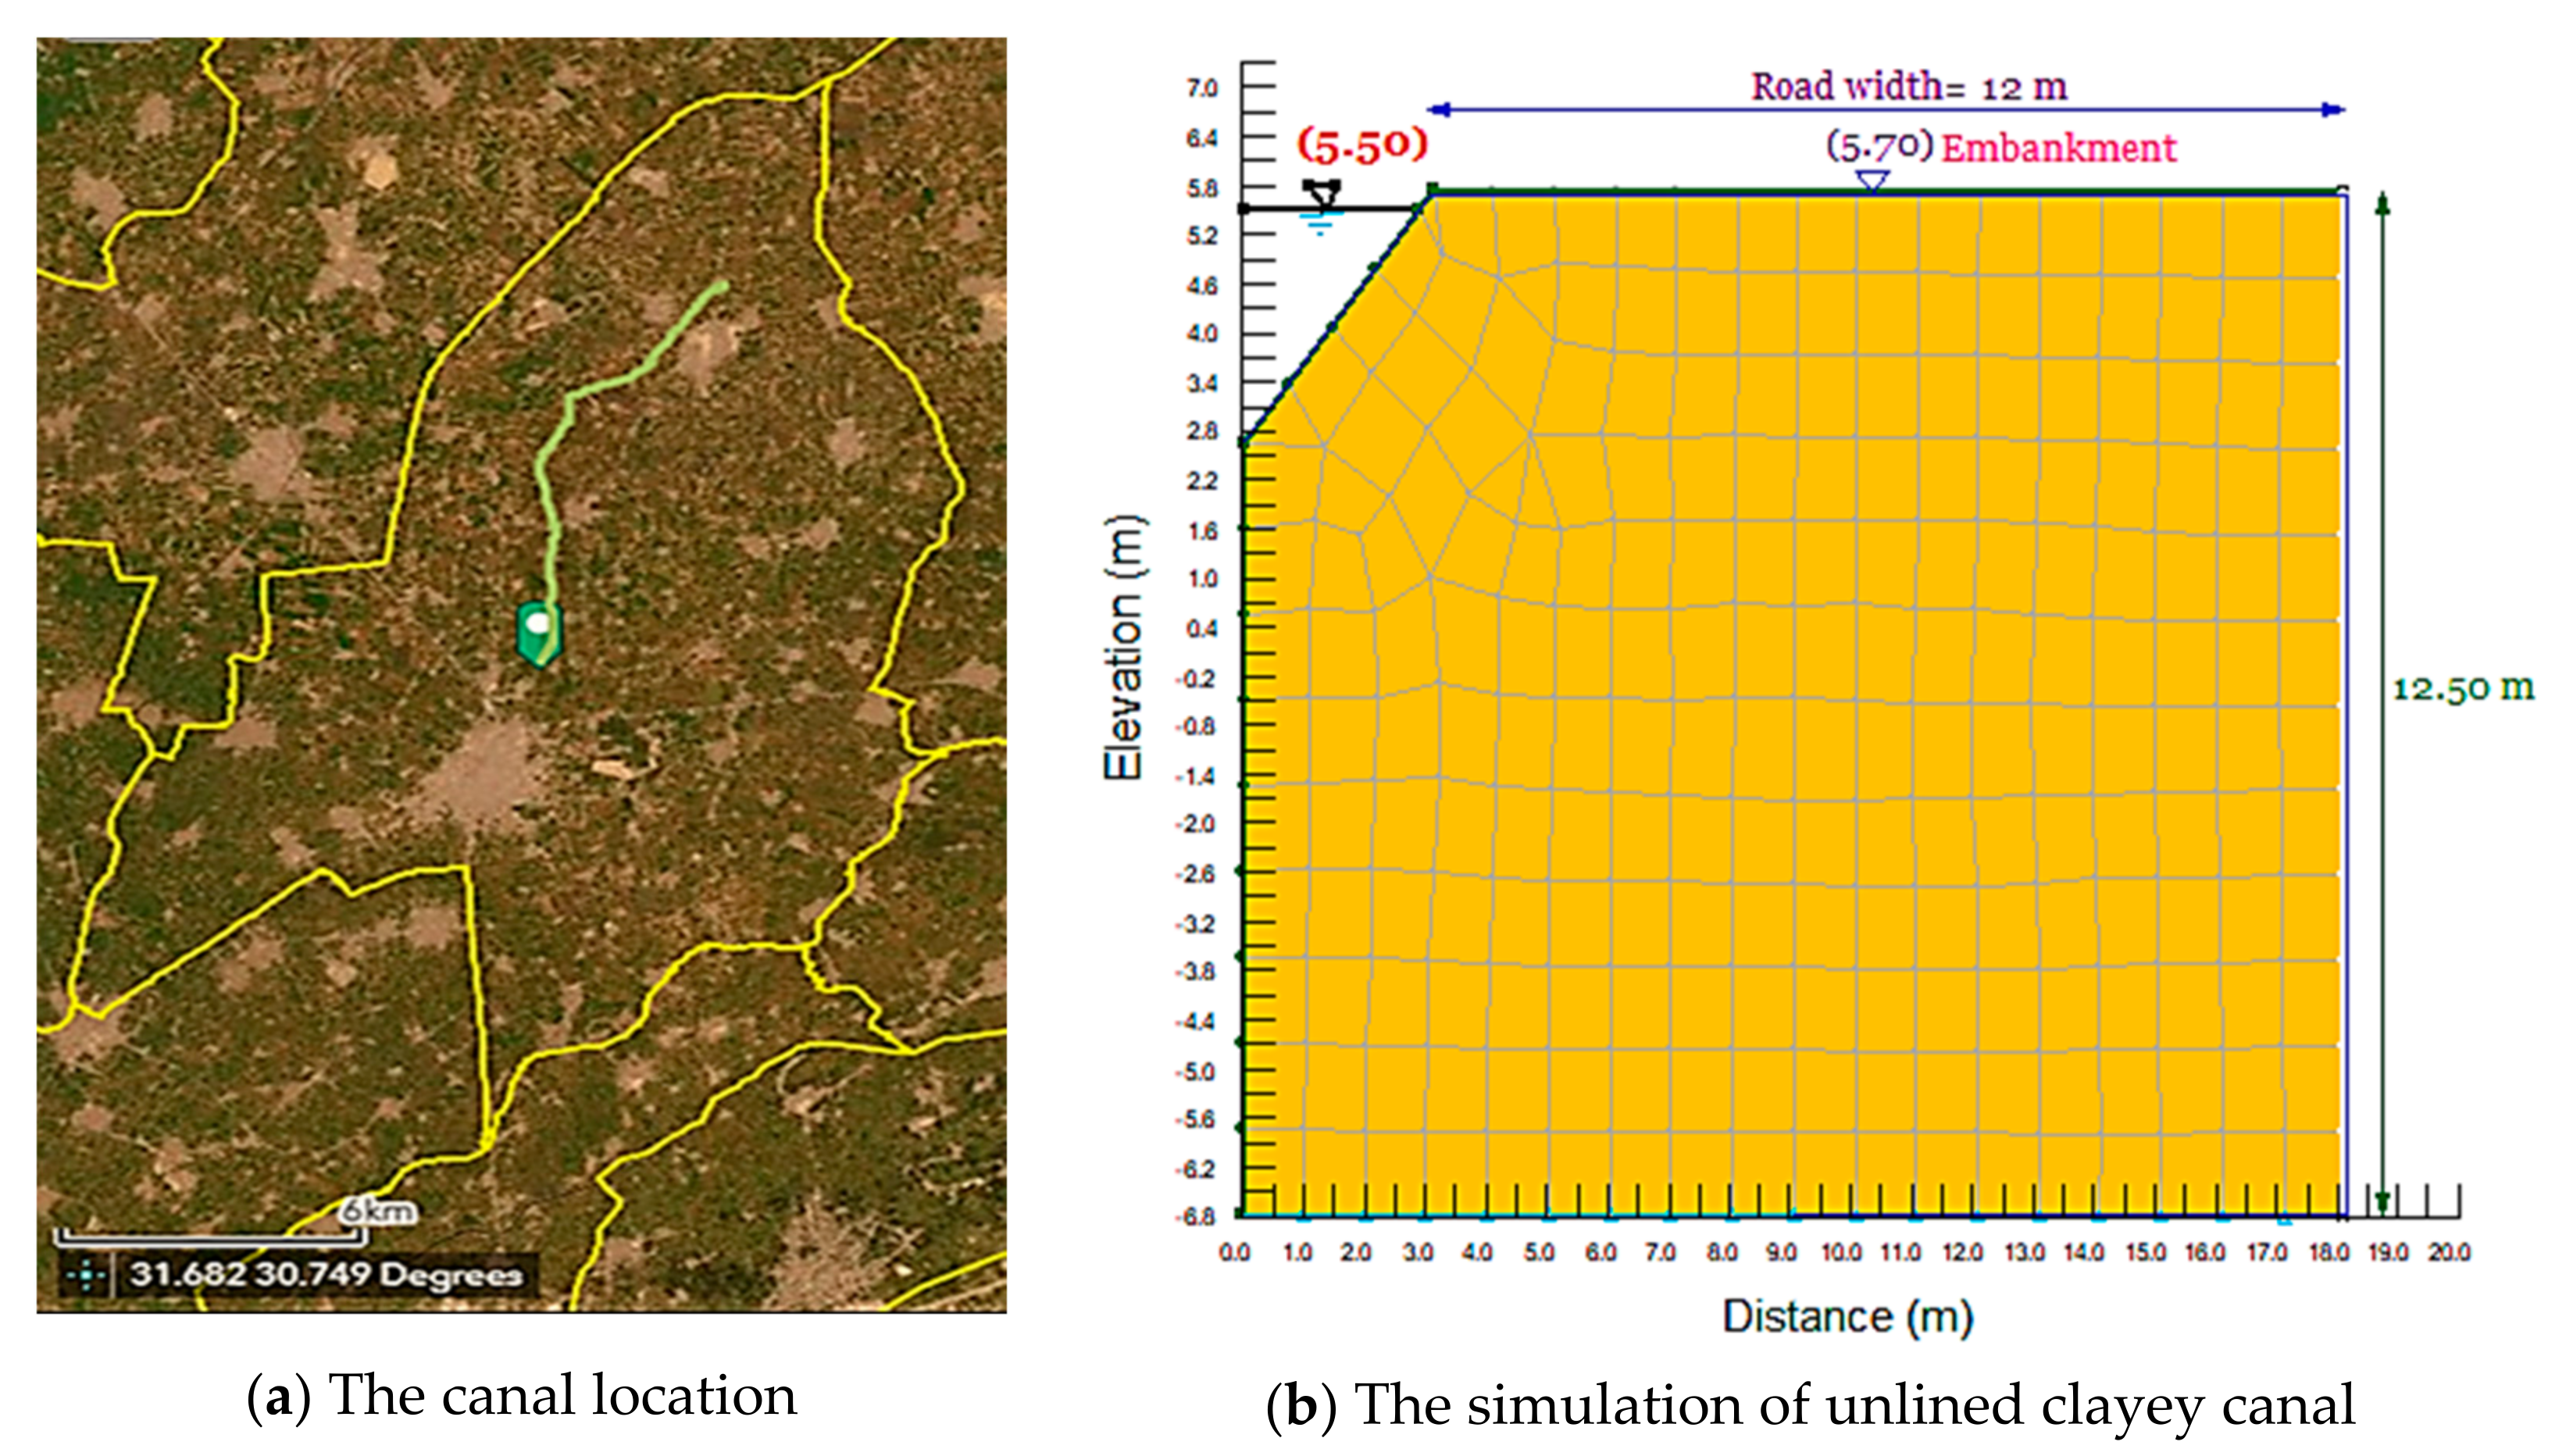
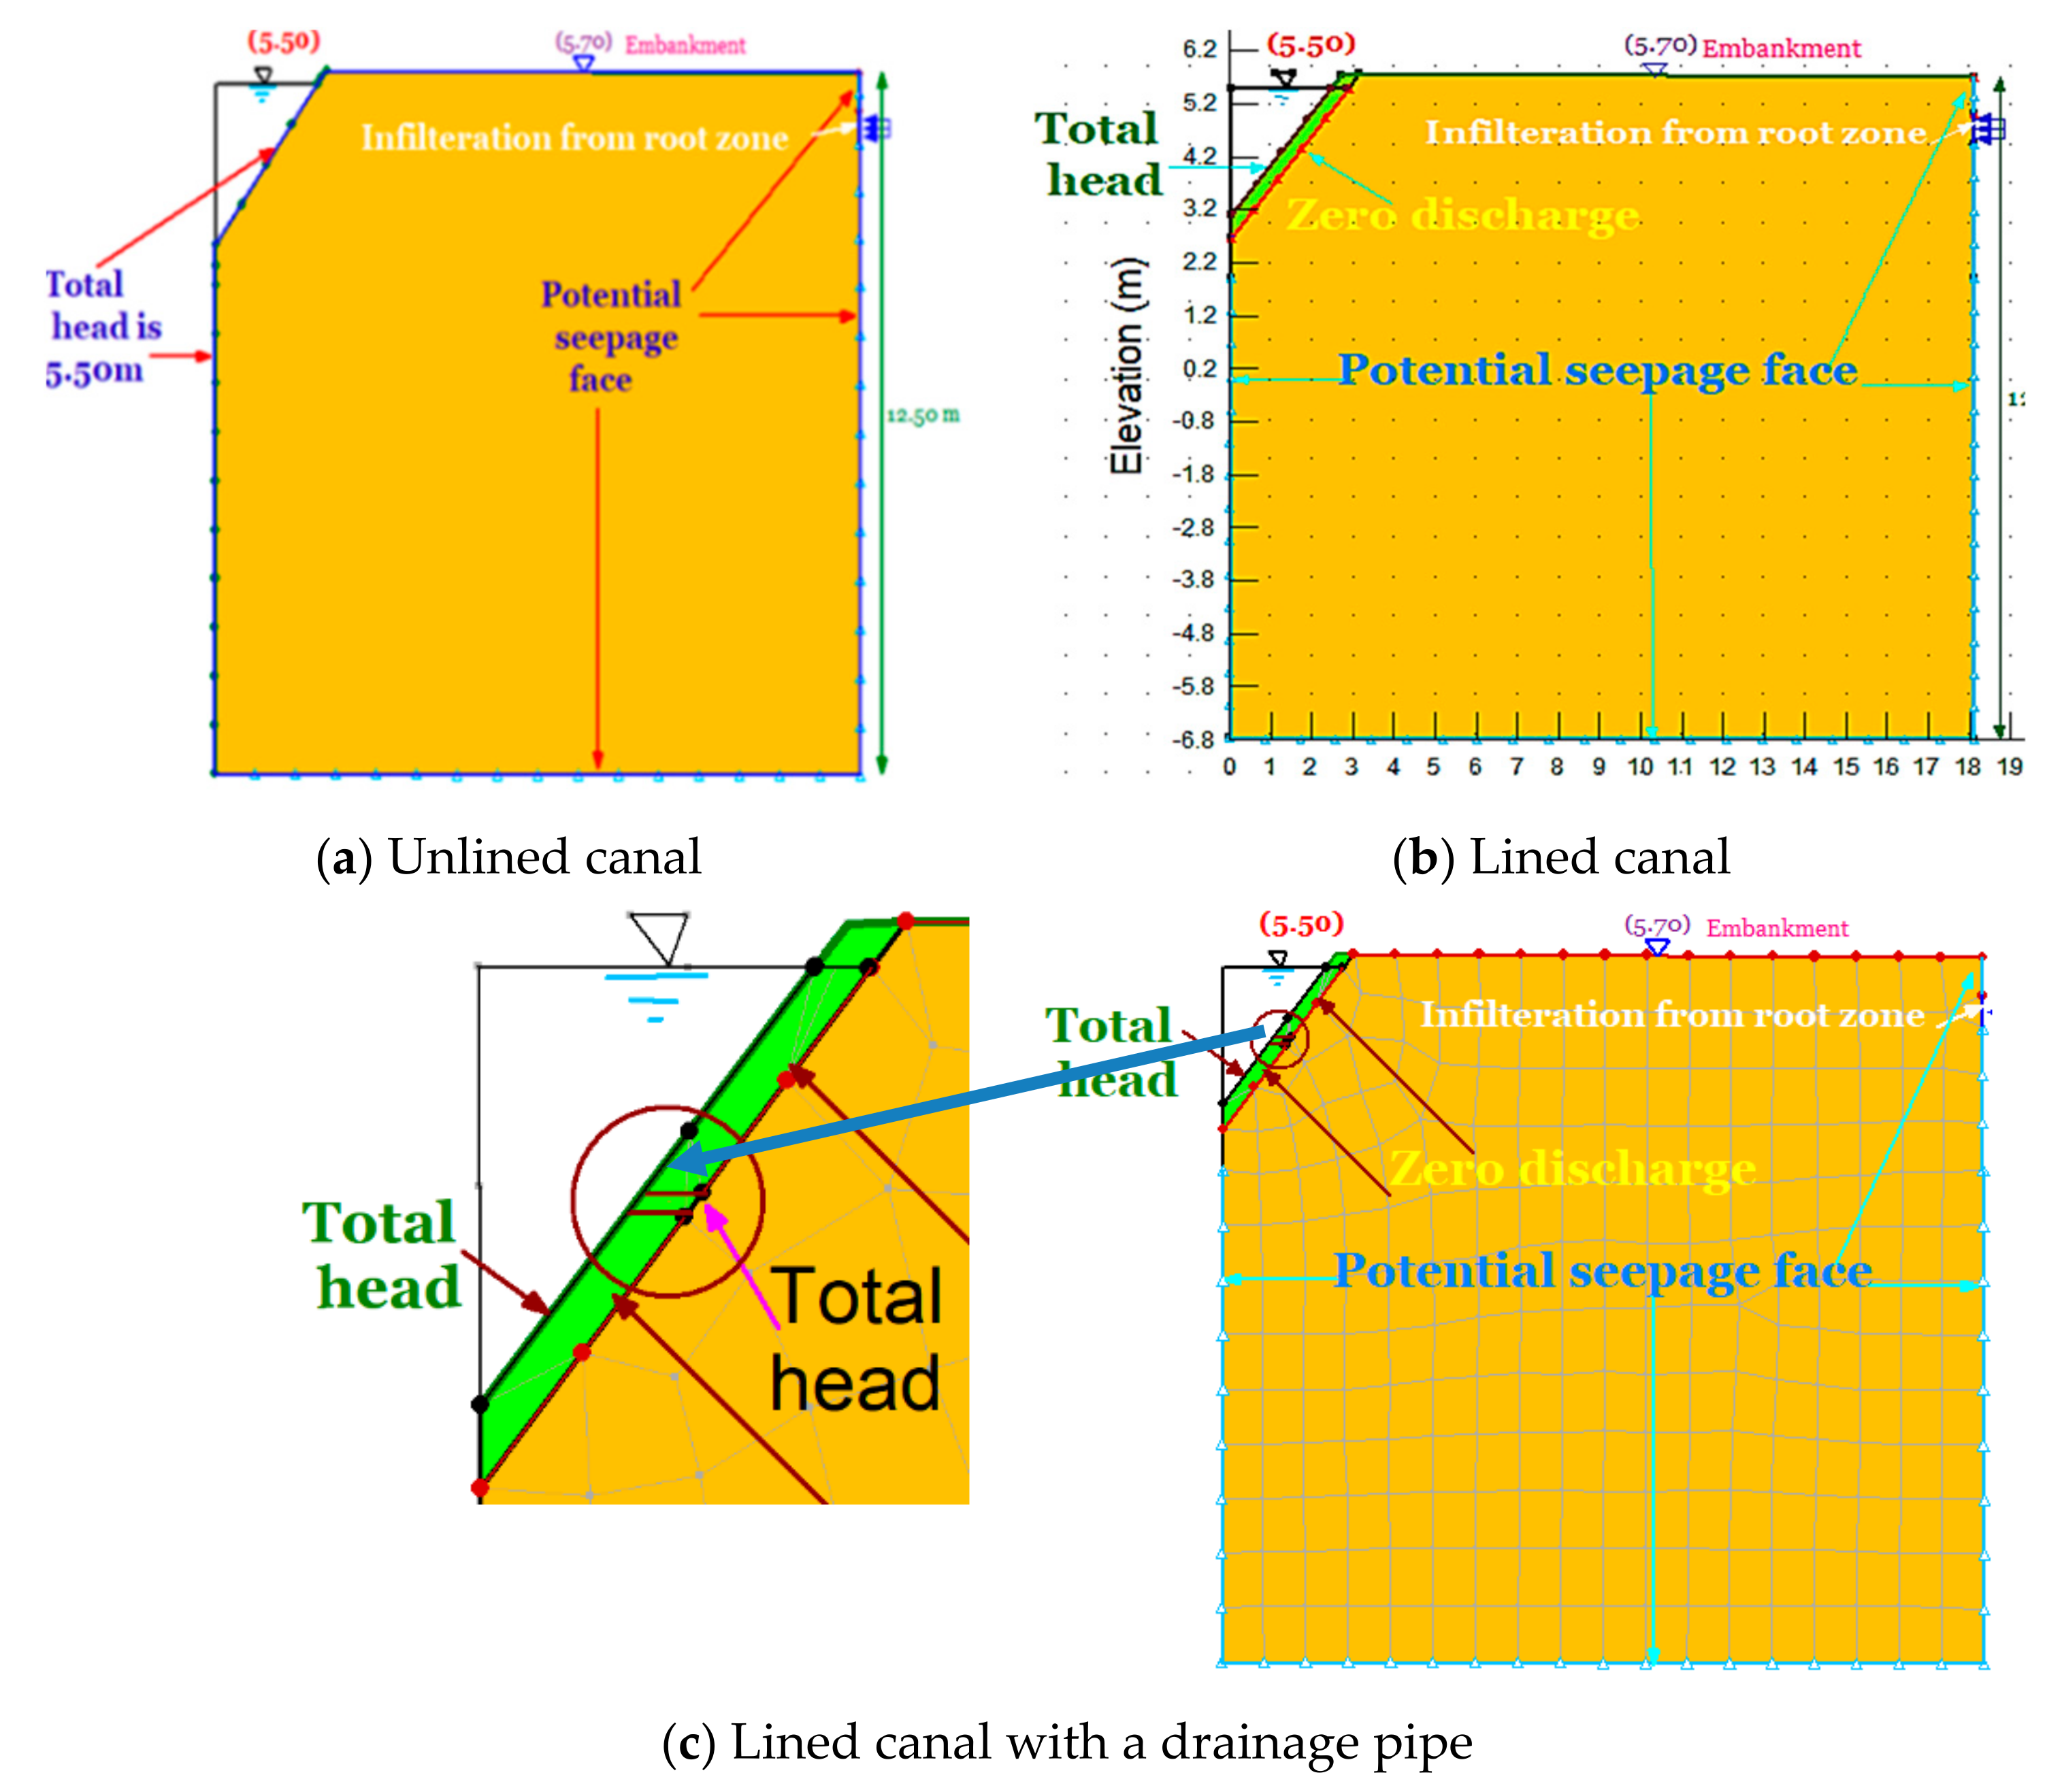
3.1. Unlined Canals
3.2. Lined Canals
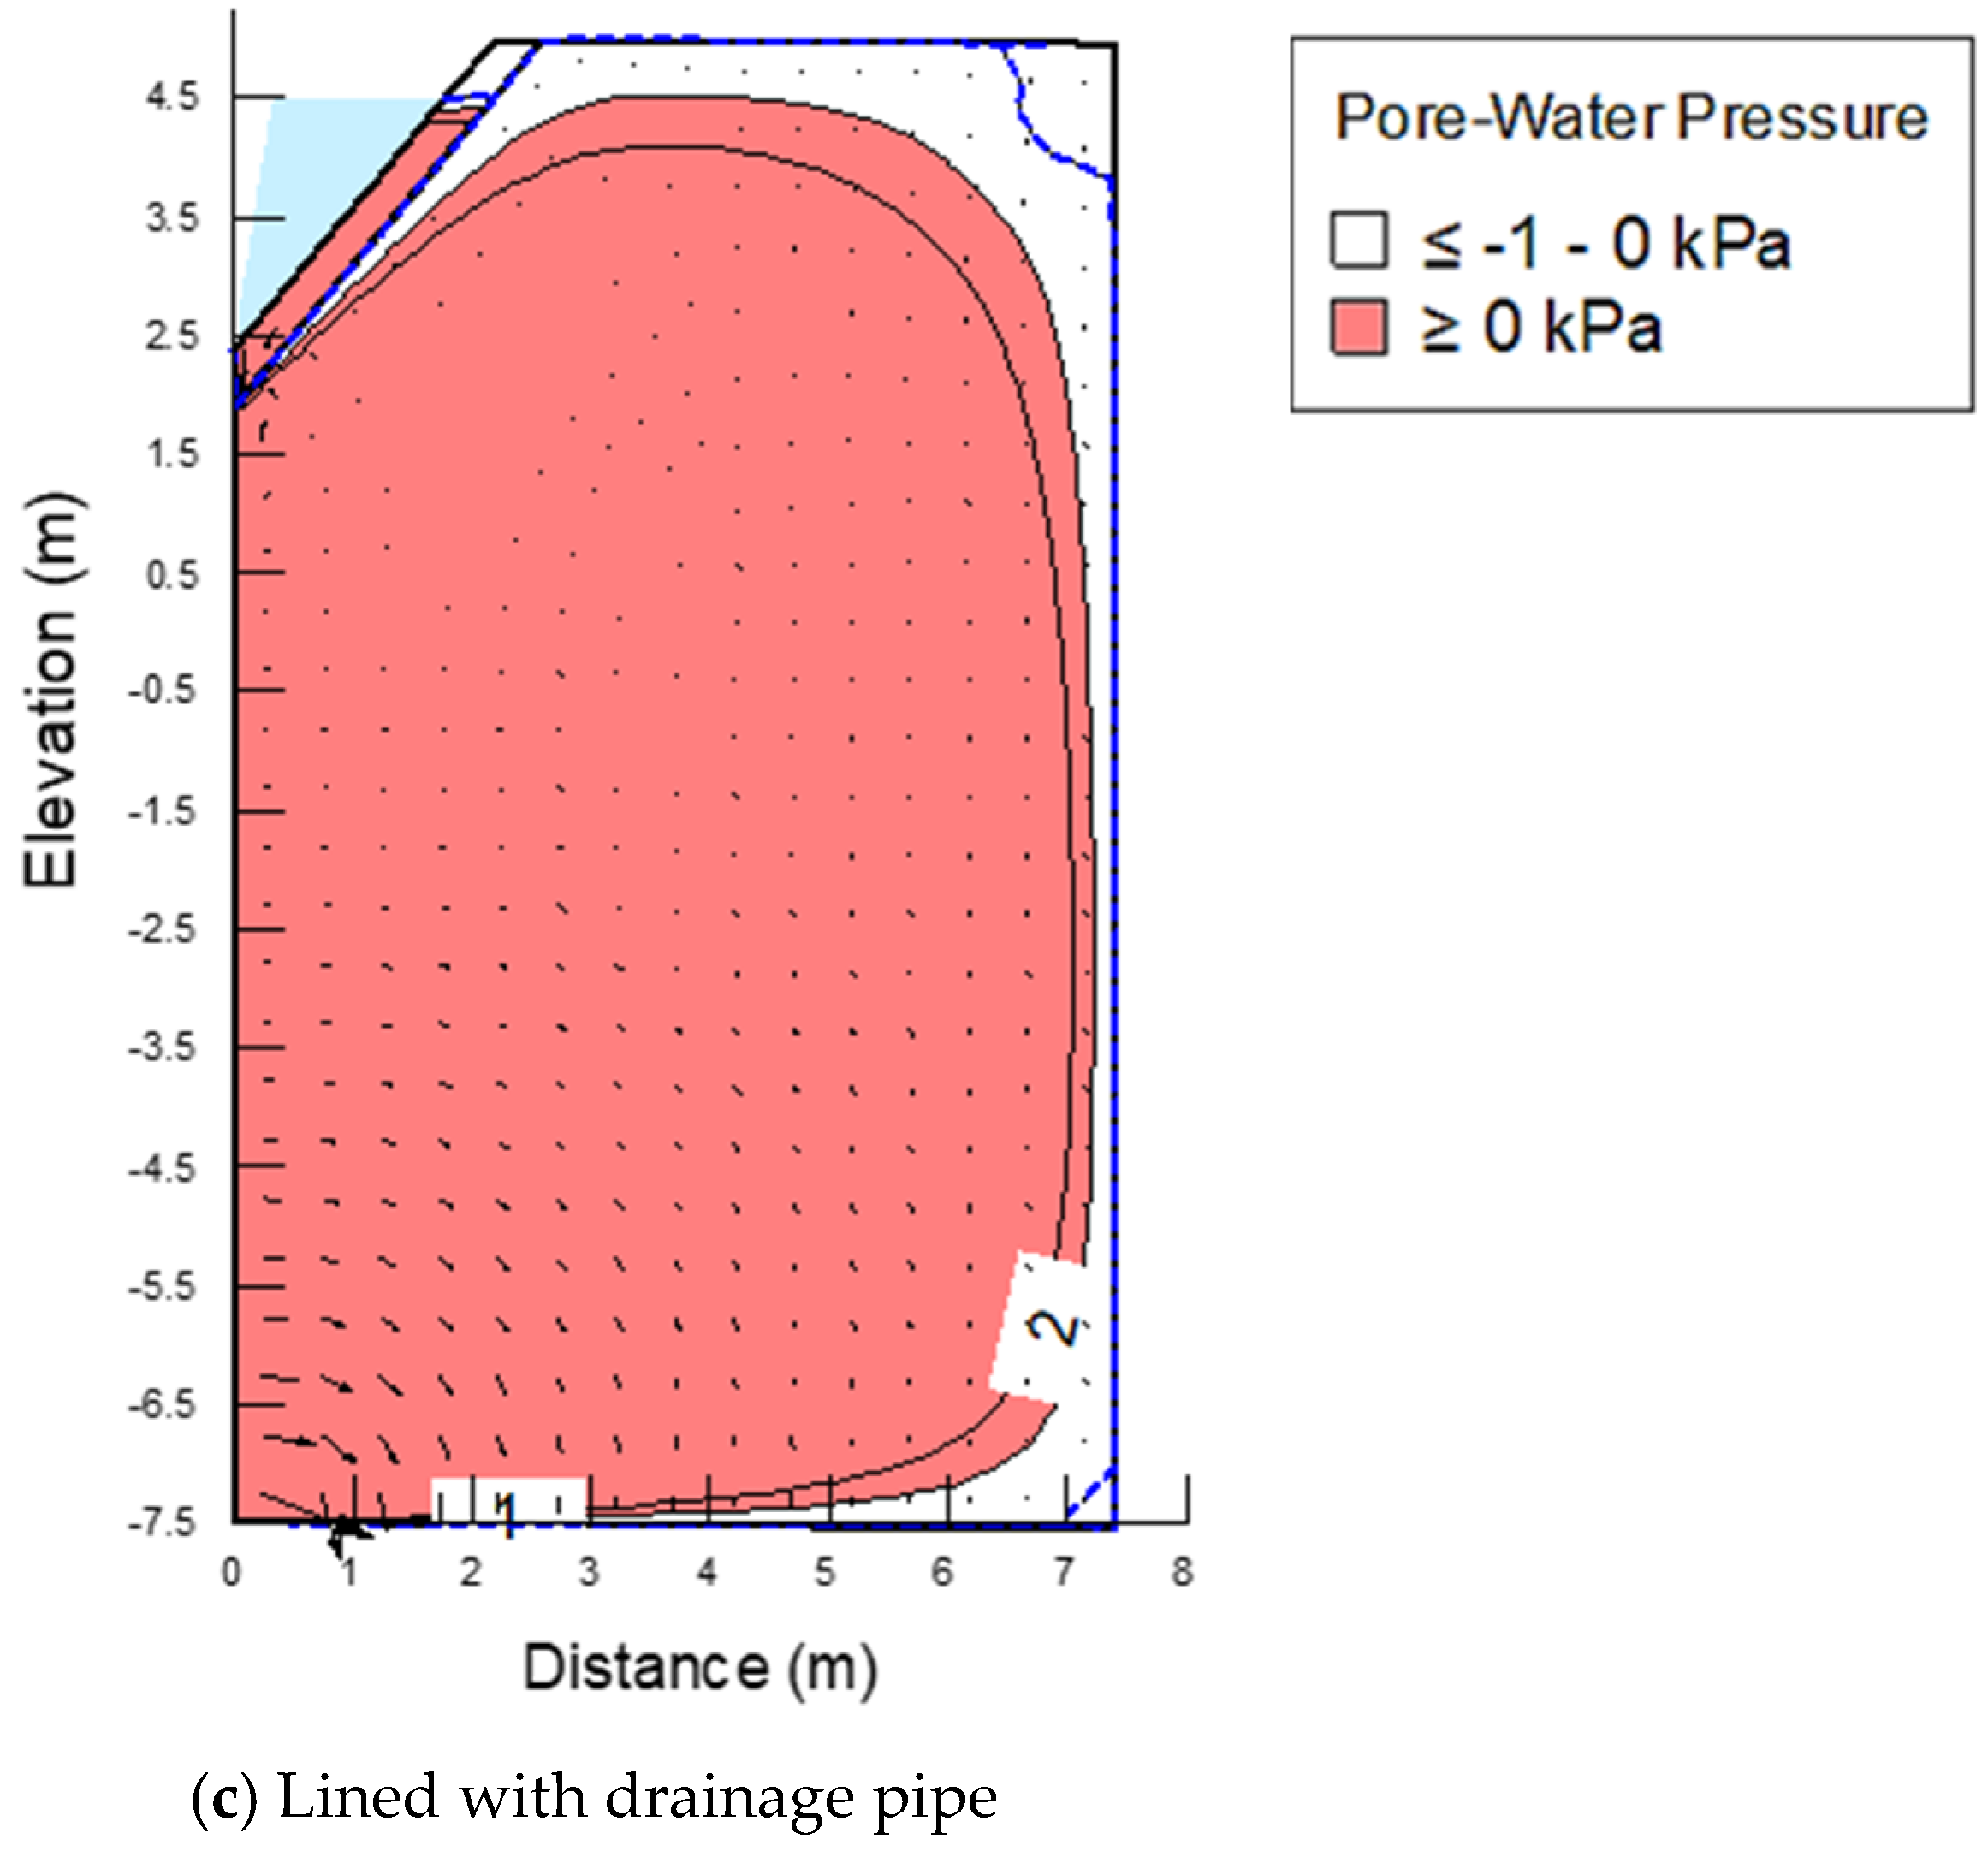
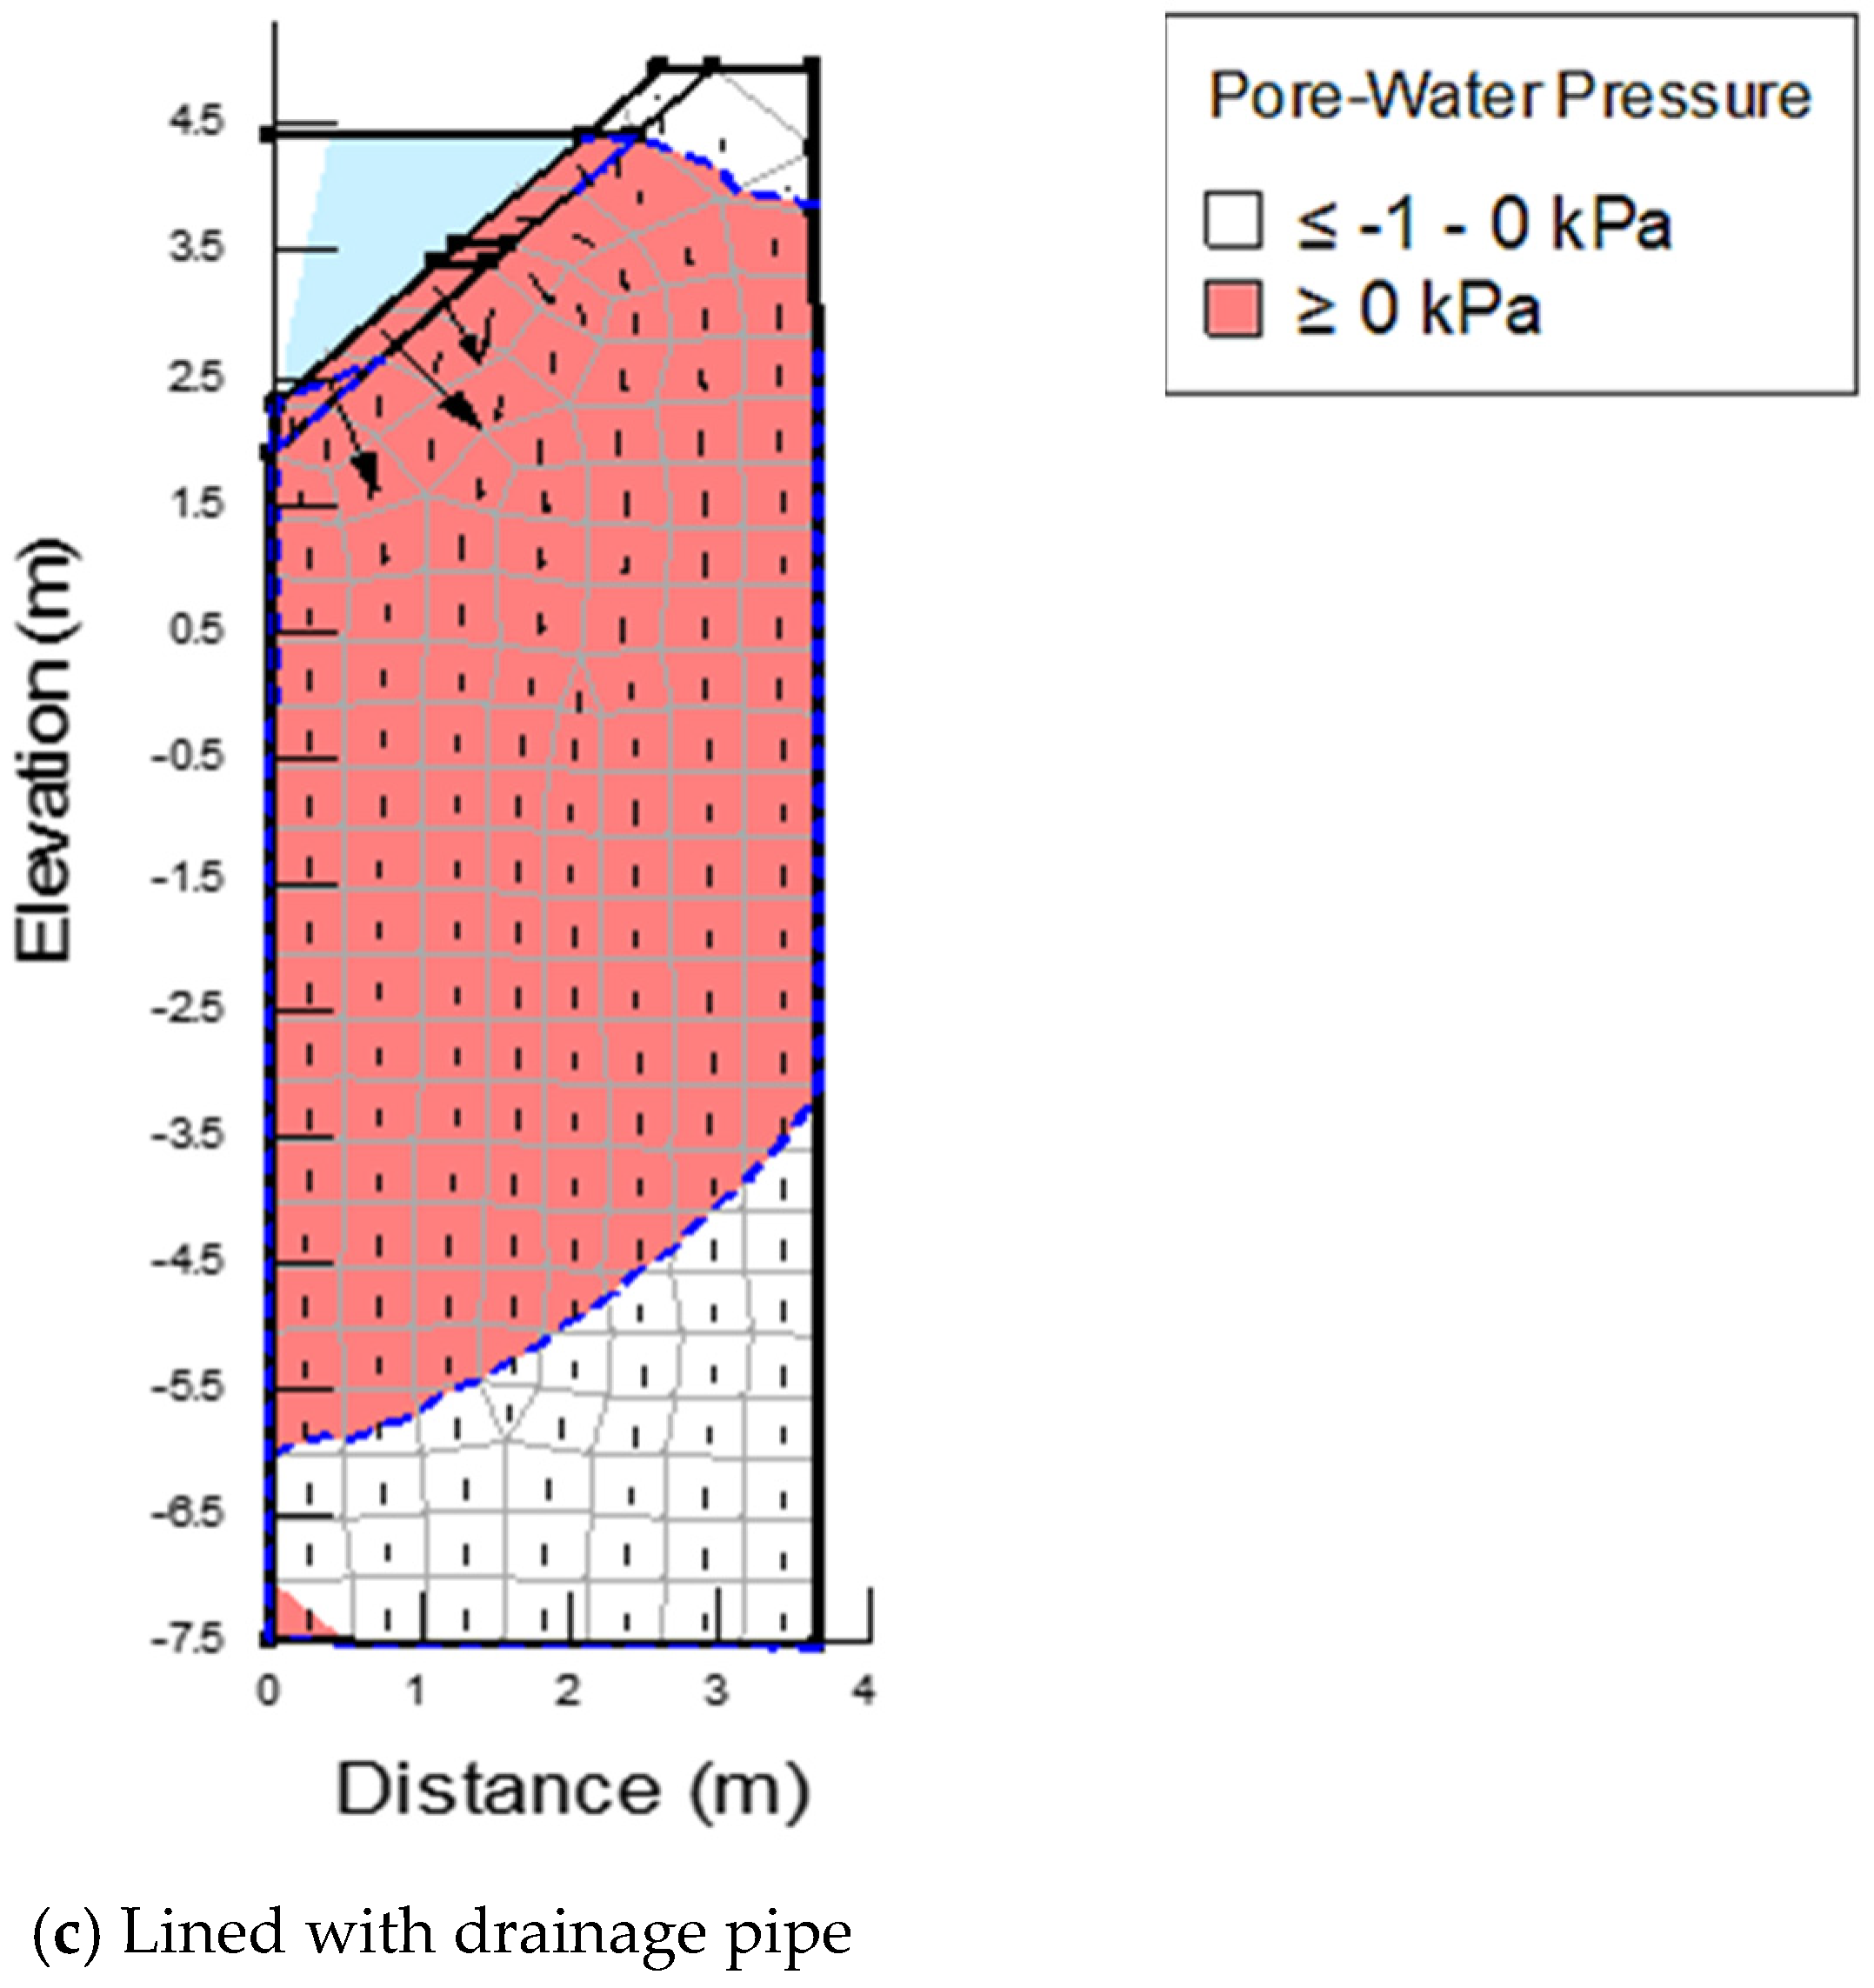
3.3. Lined Canals with a Drainage Pipe
3.4. Model Geometry and the Grid
3.5. Properties of Material and Boundary Conditions
3.6. Initial Conditions
- Steady state analysis (parental analysis) or initial conditions, then
- Transient analysis
3.7. Root Zone
3.8. Model Calibration
4. Results
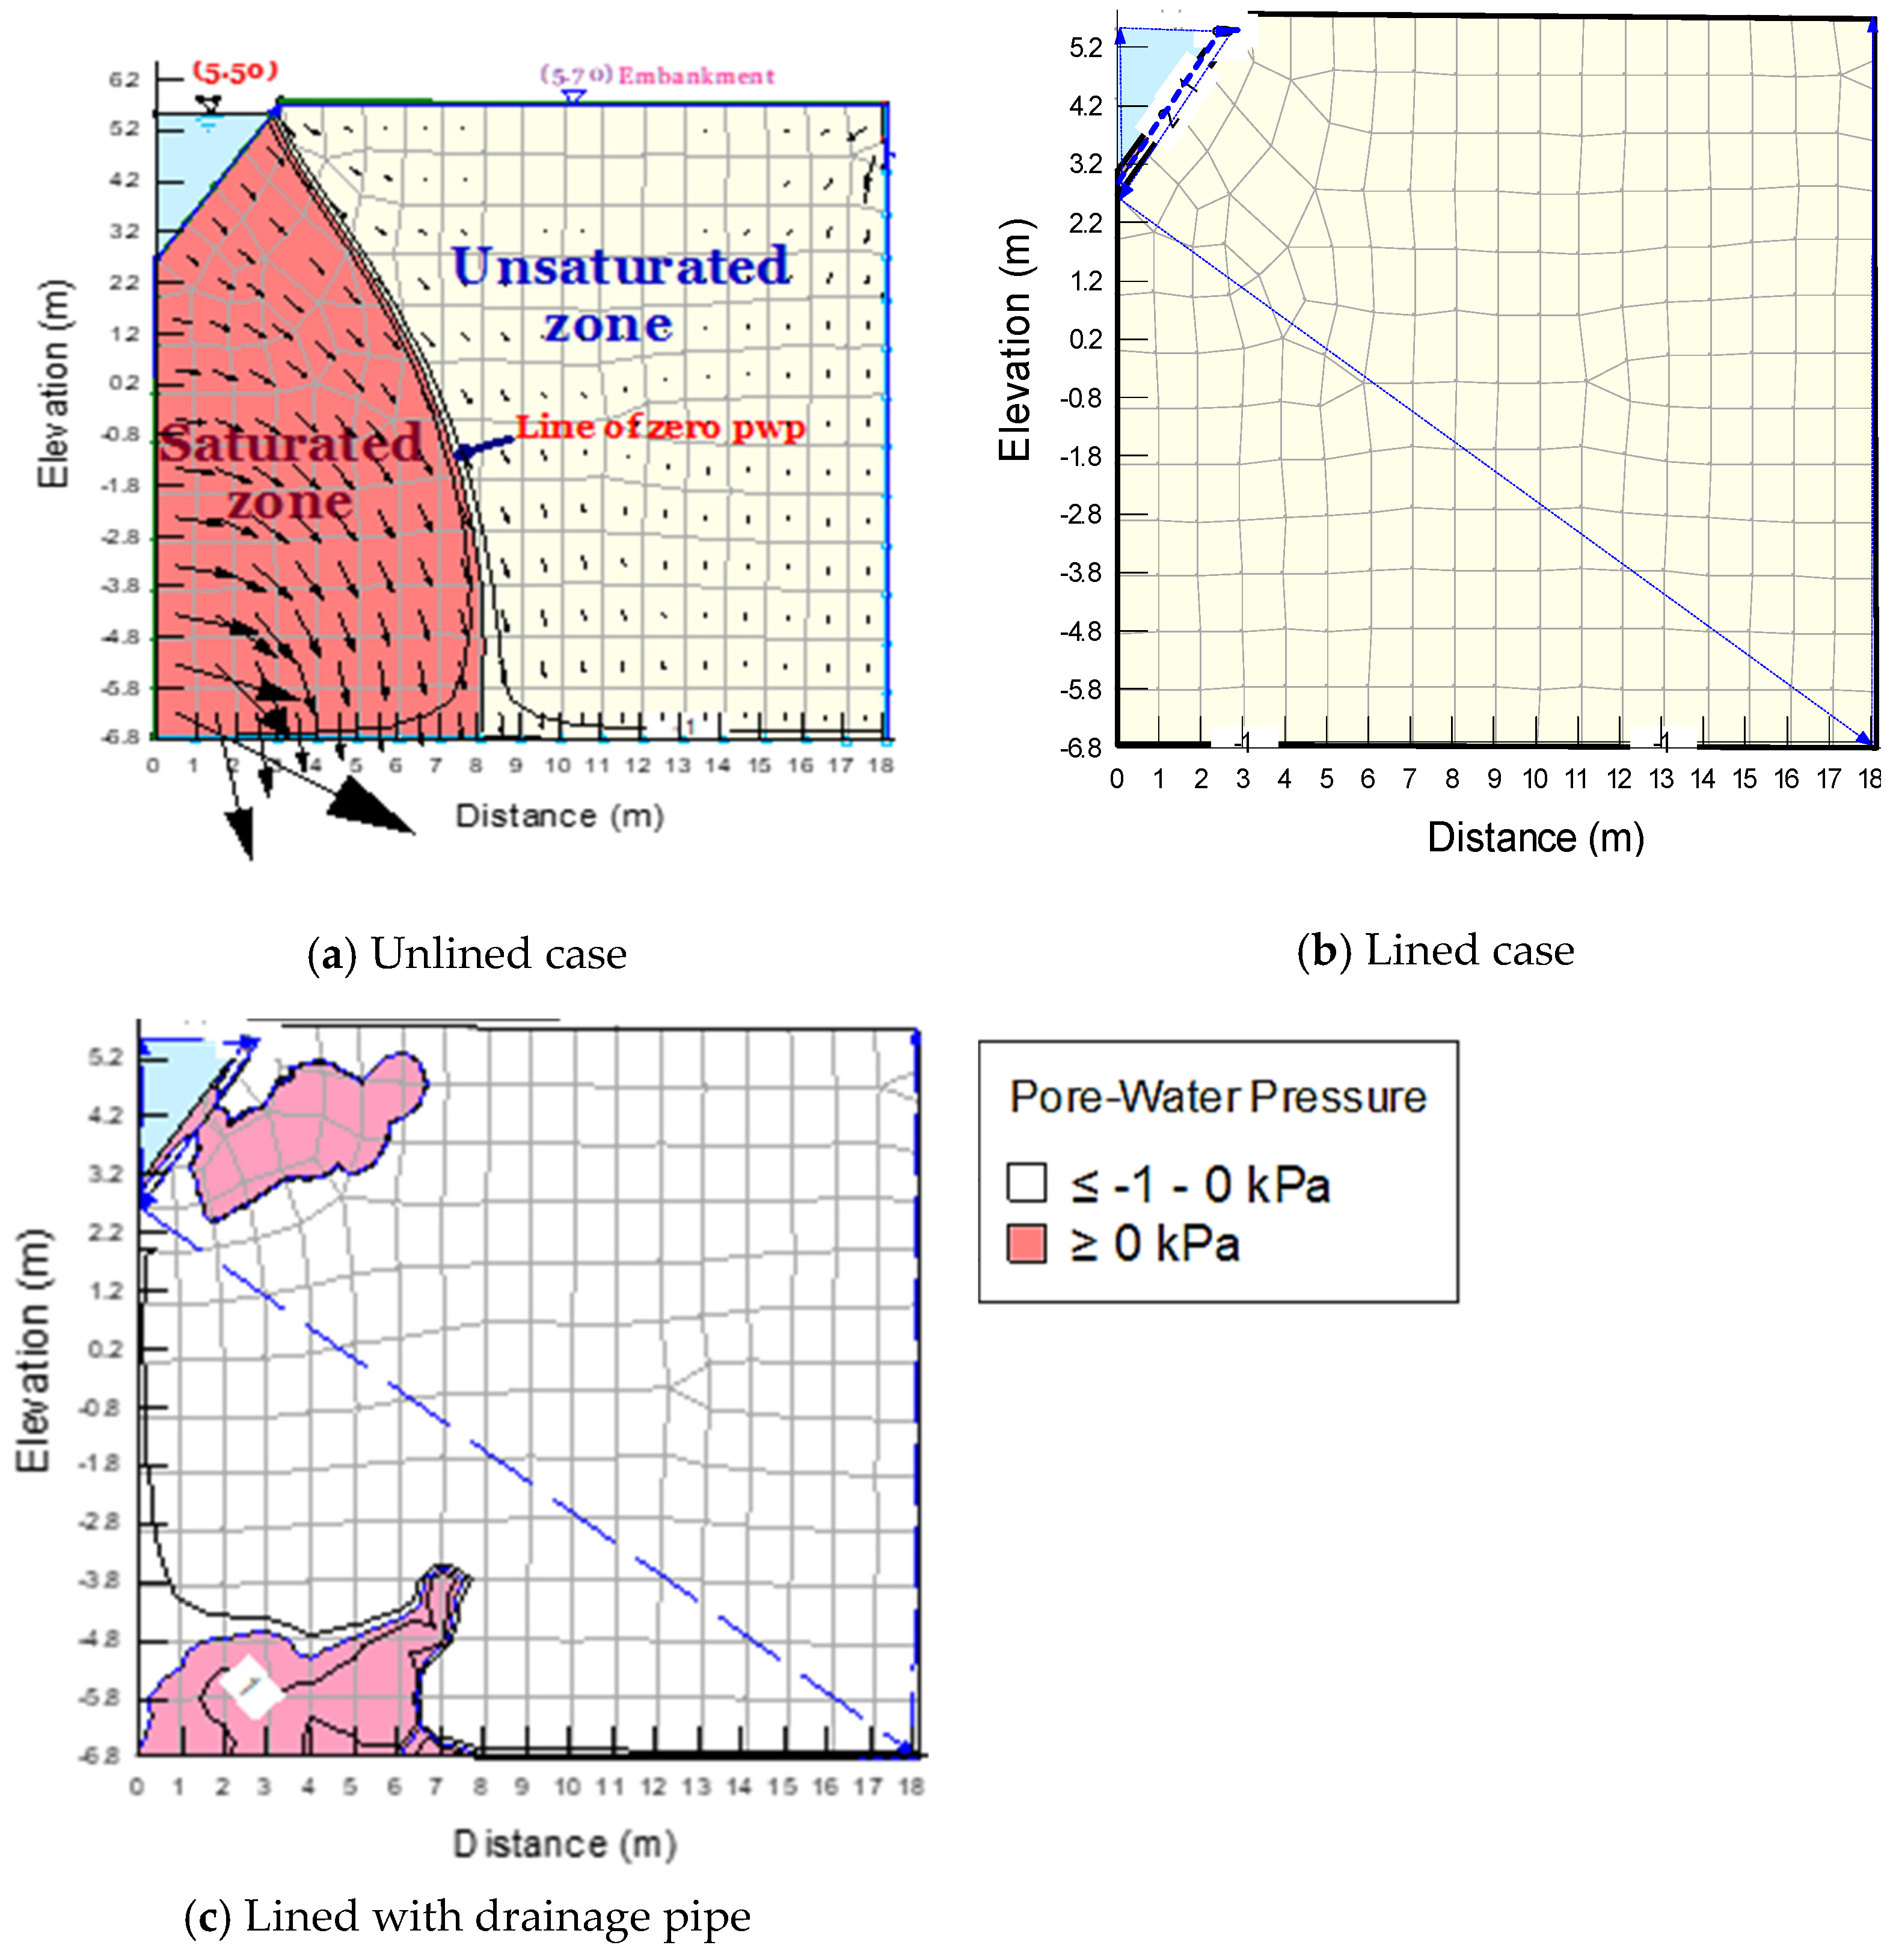
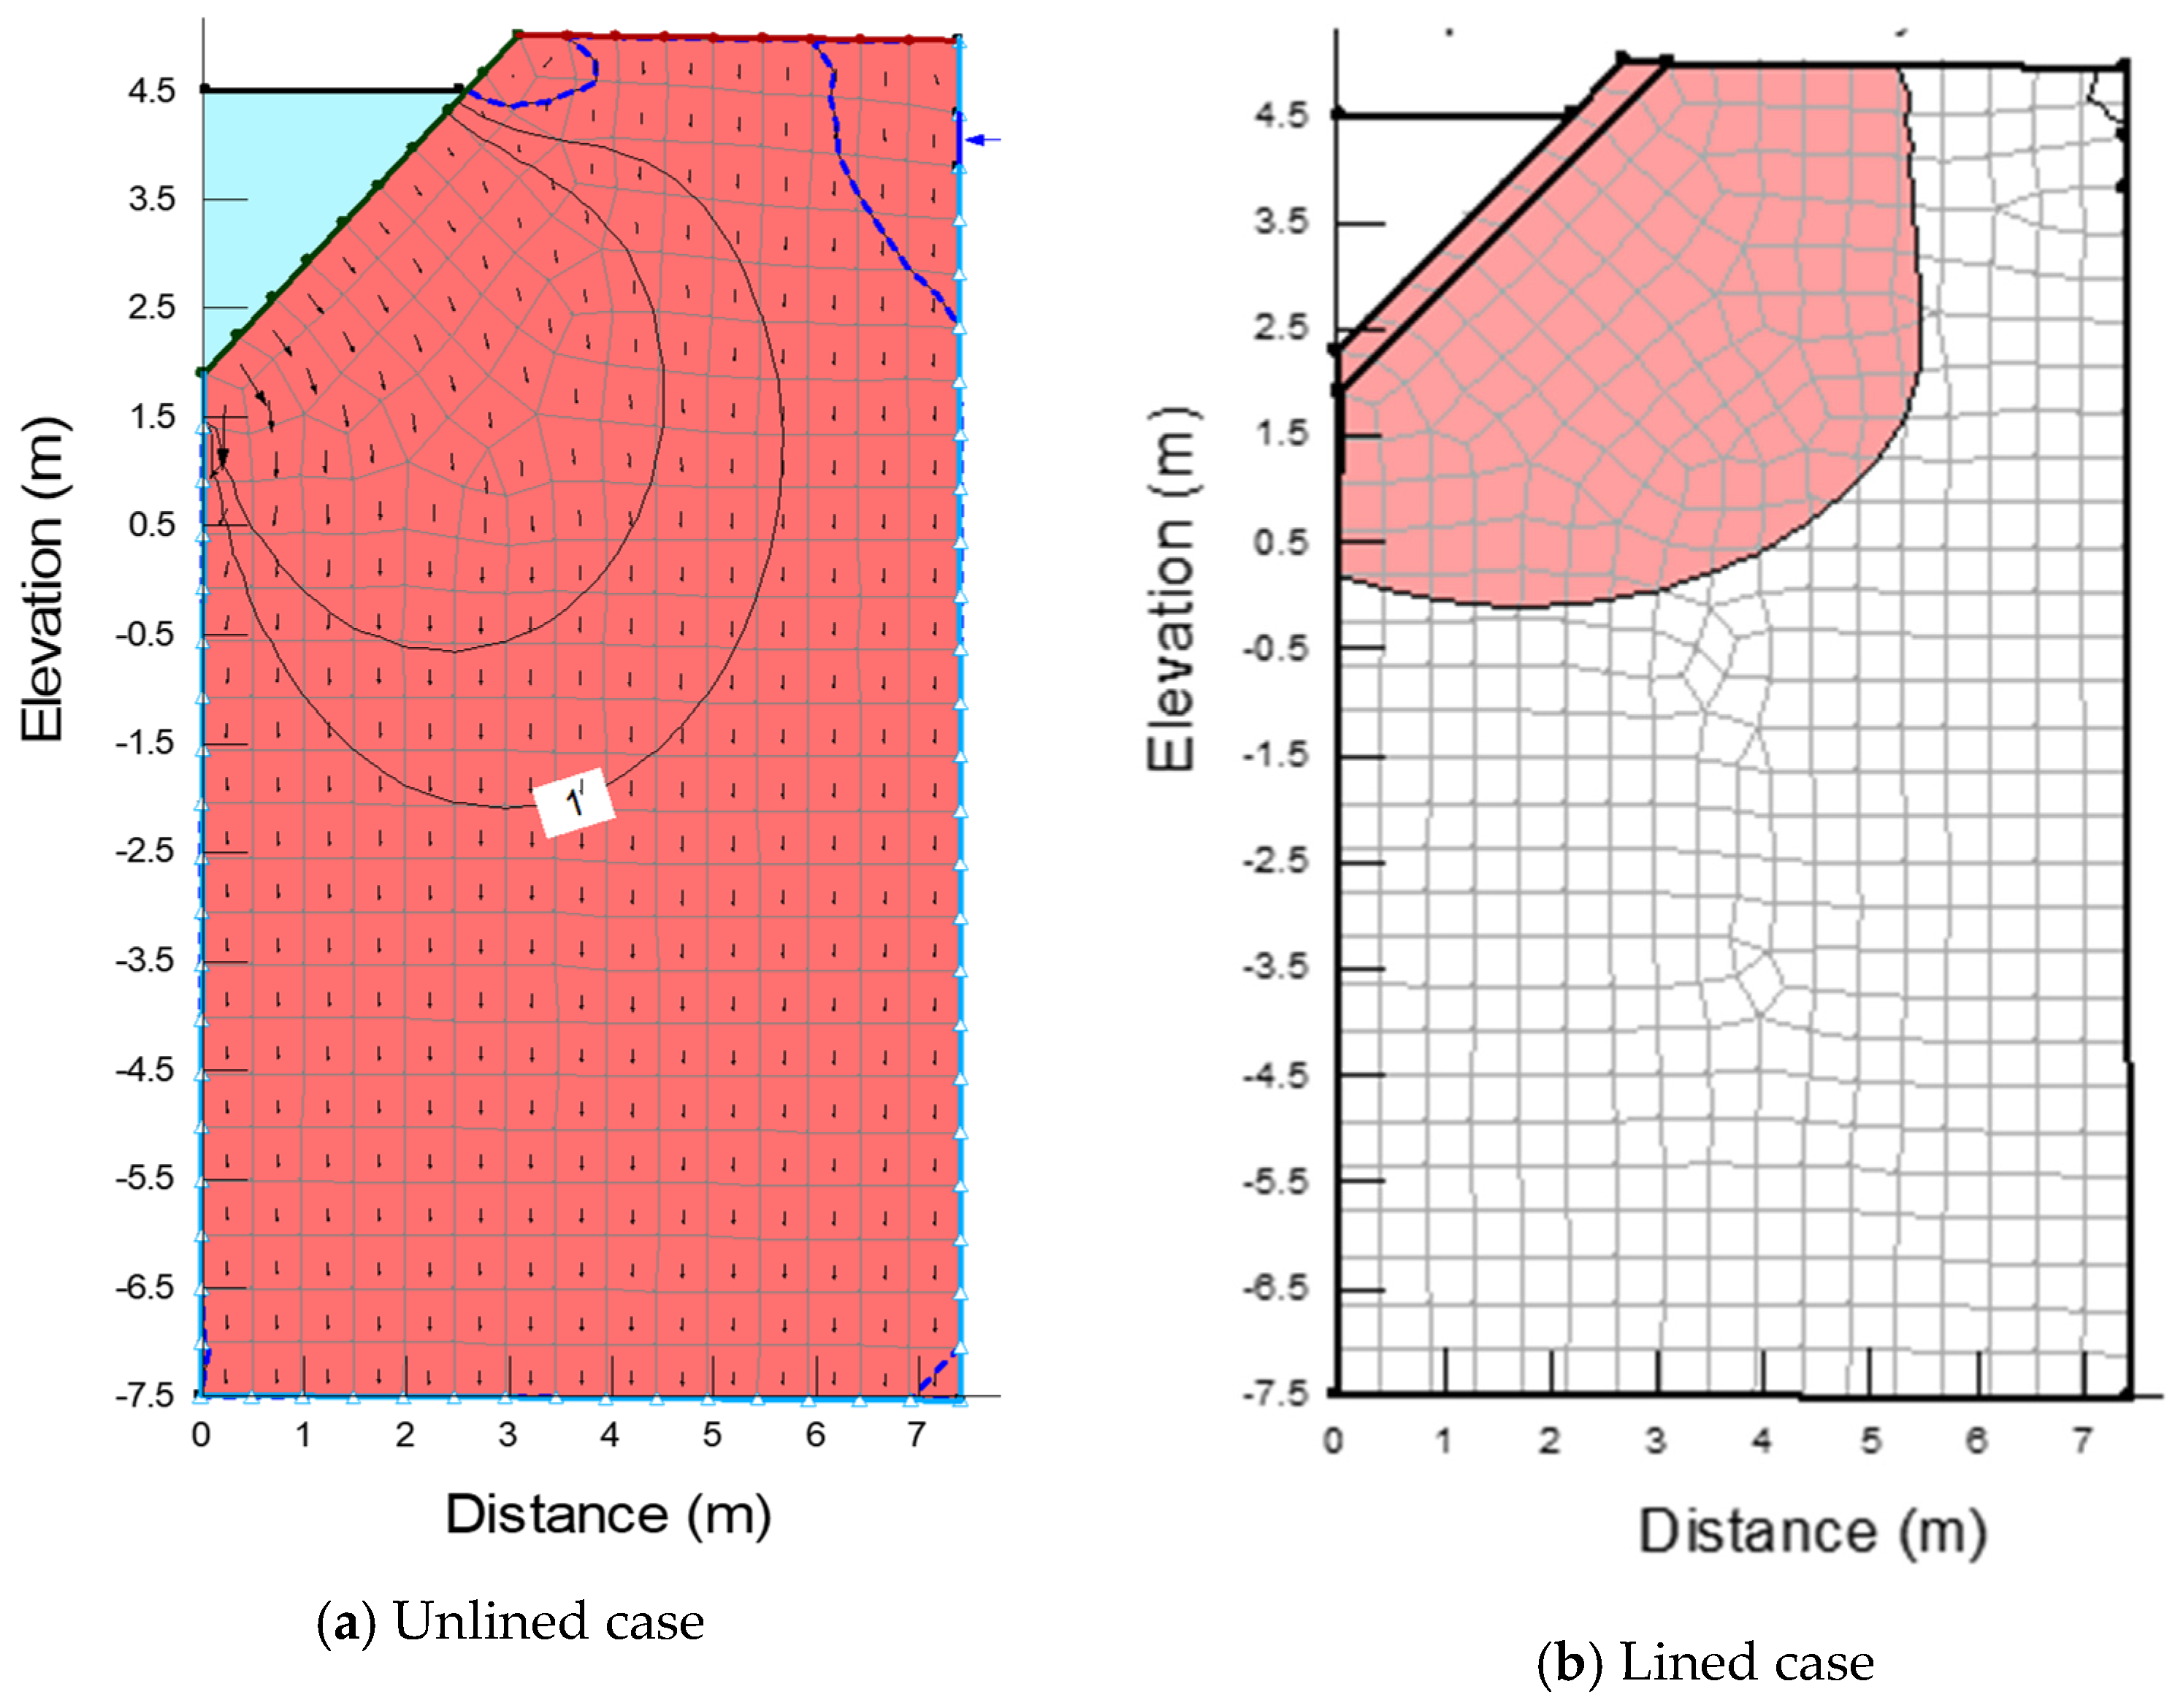
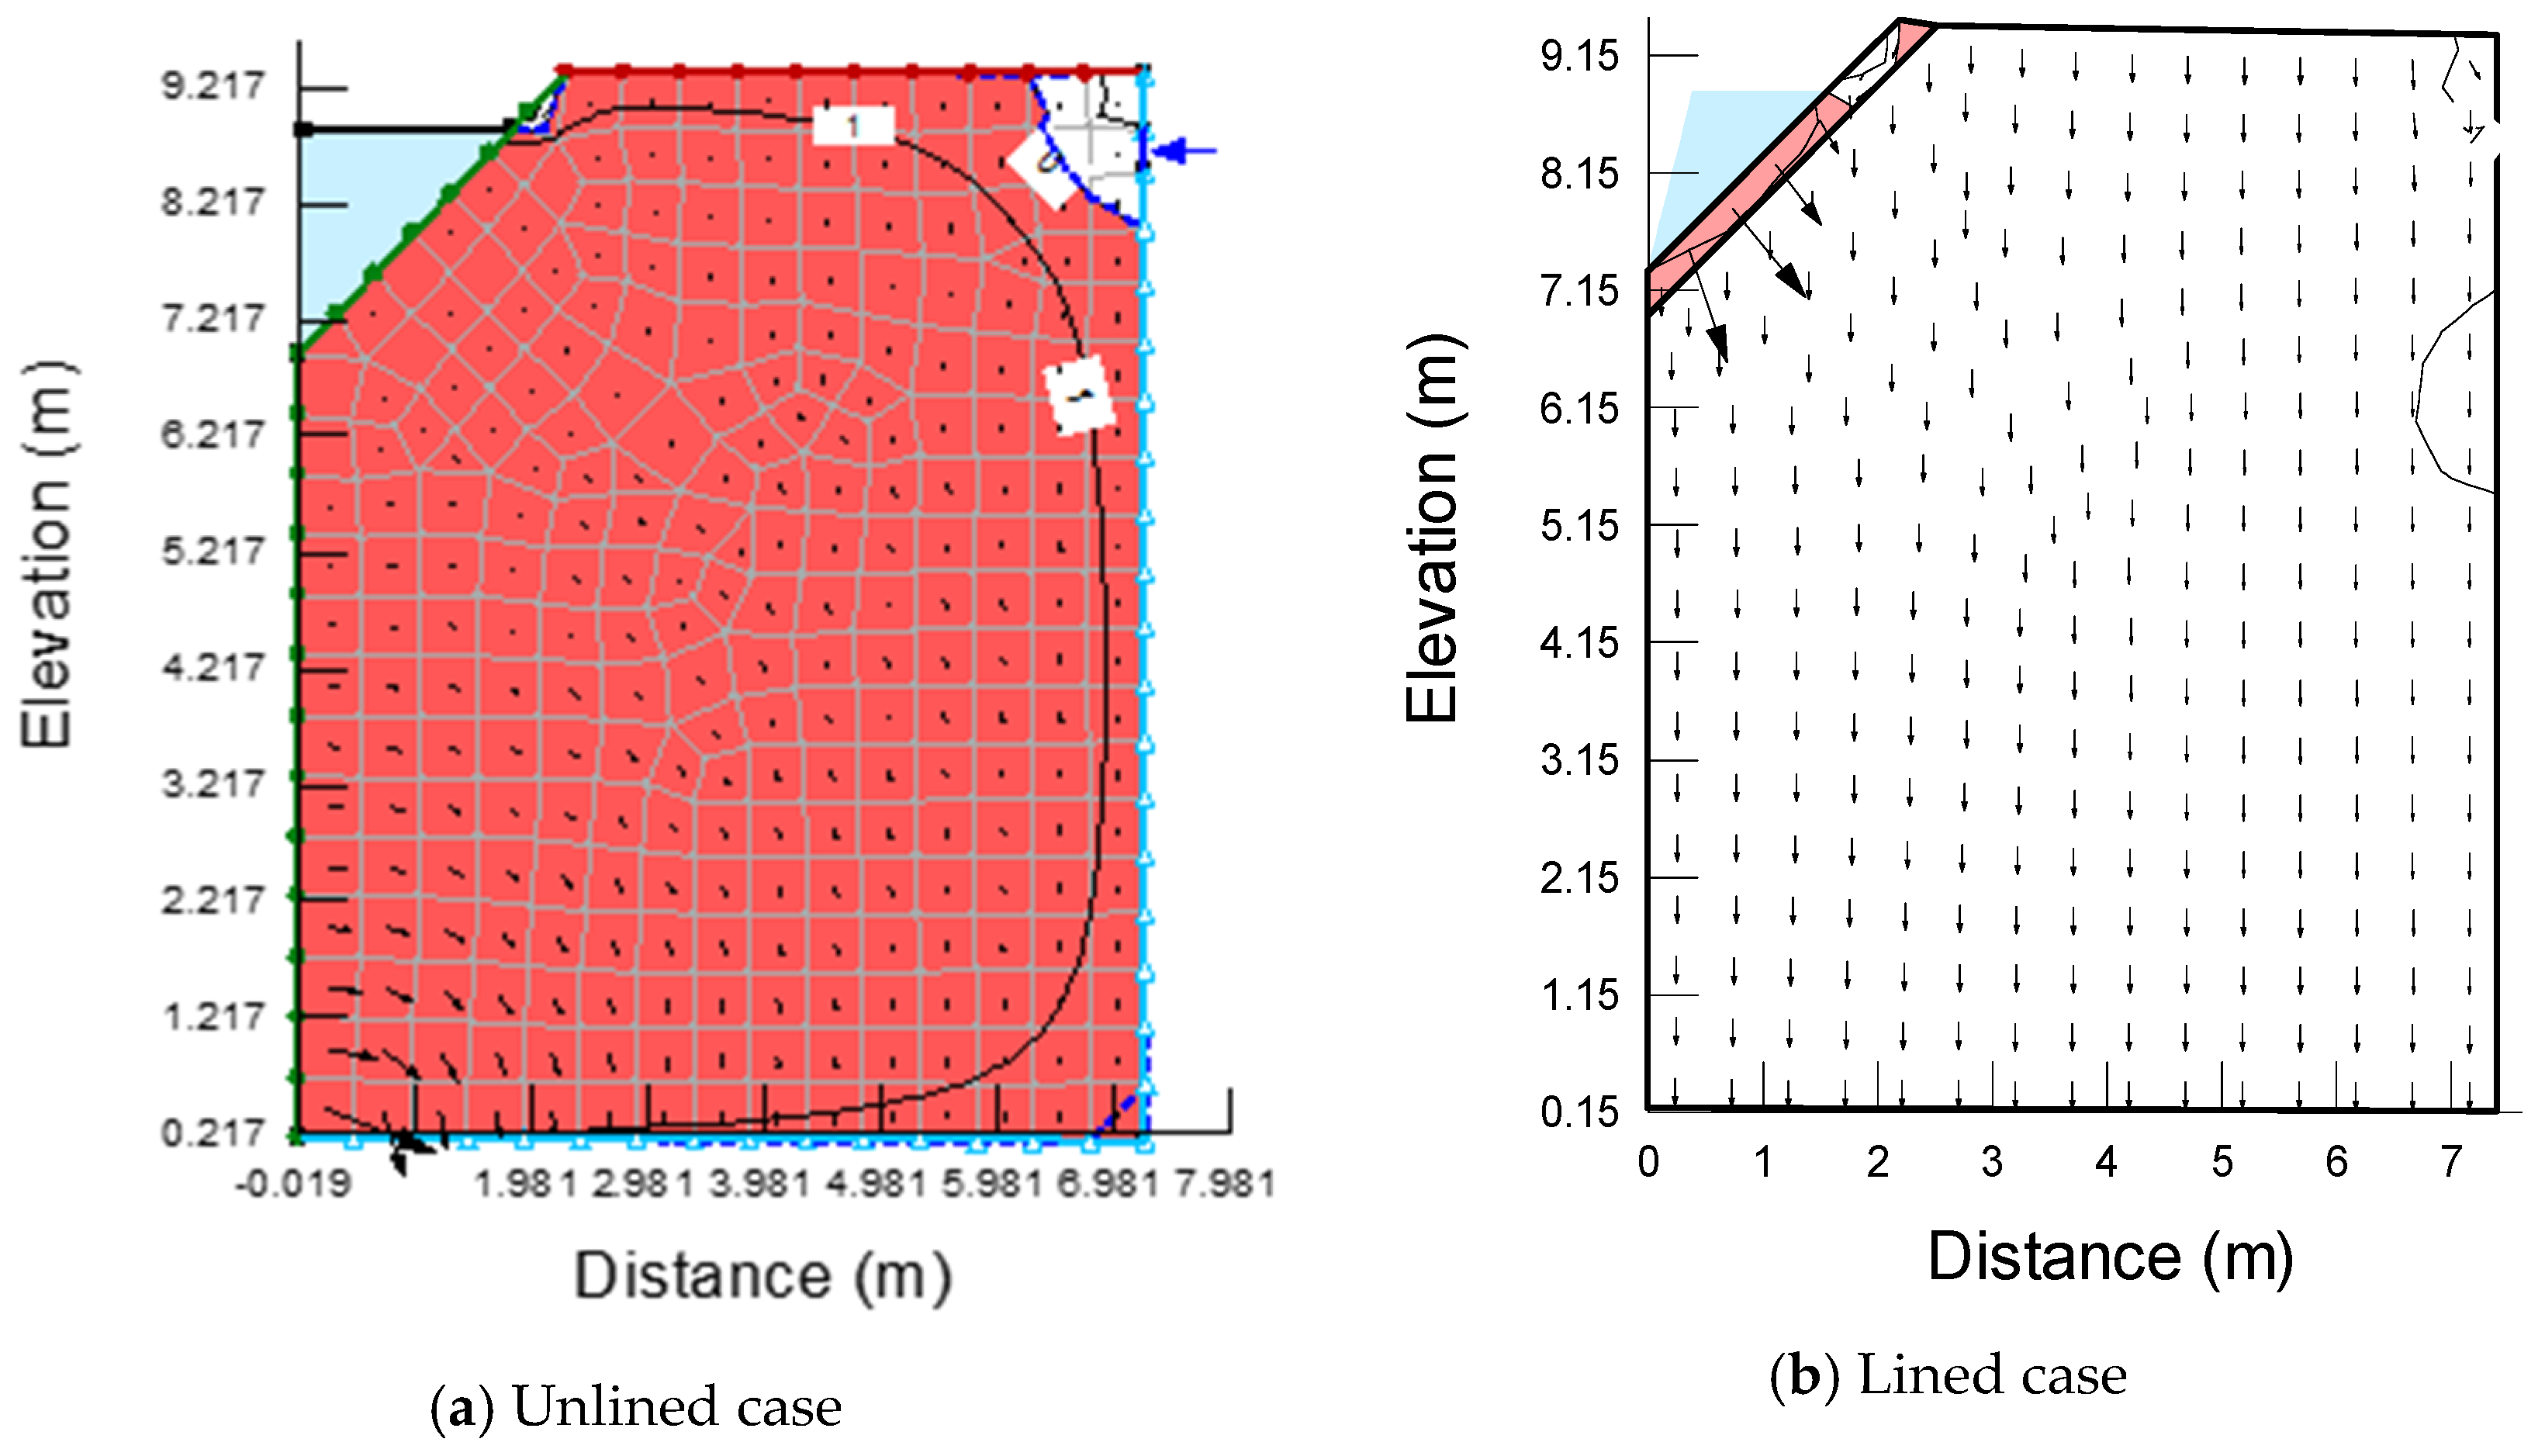
4.1. Total Head and Velocity Vectors in the Steady State
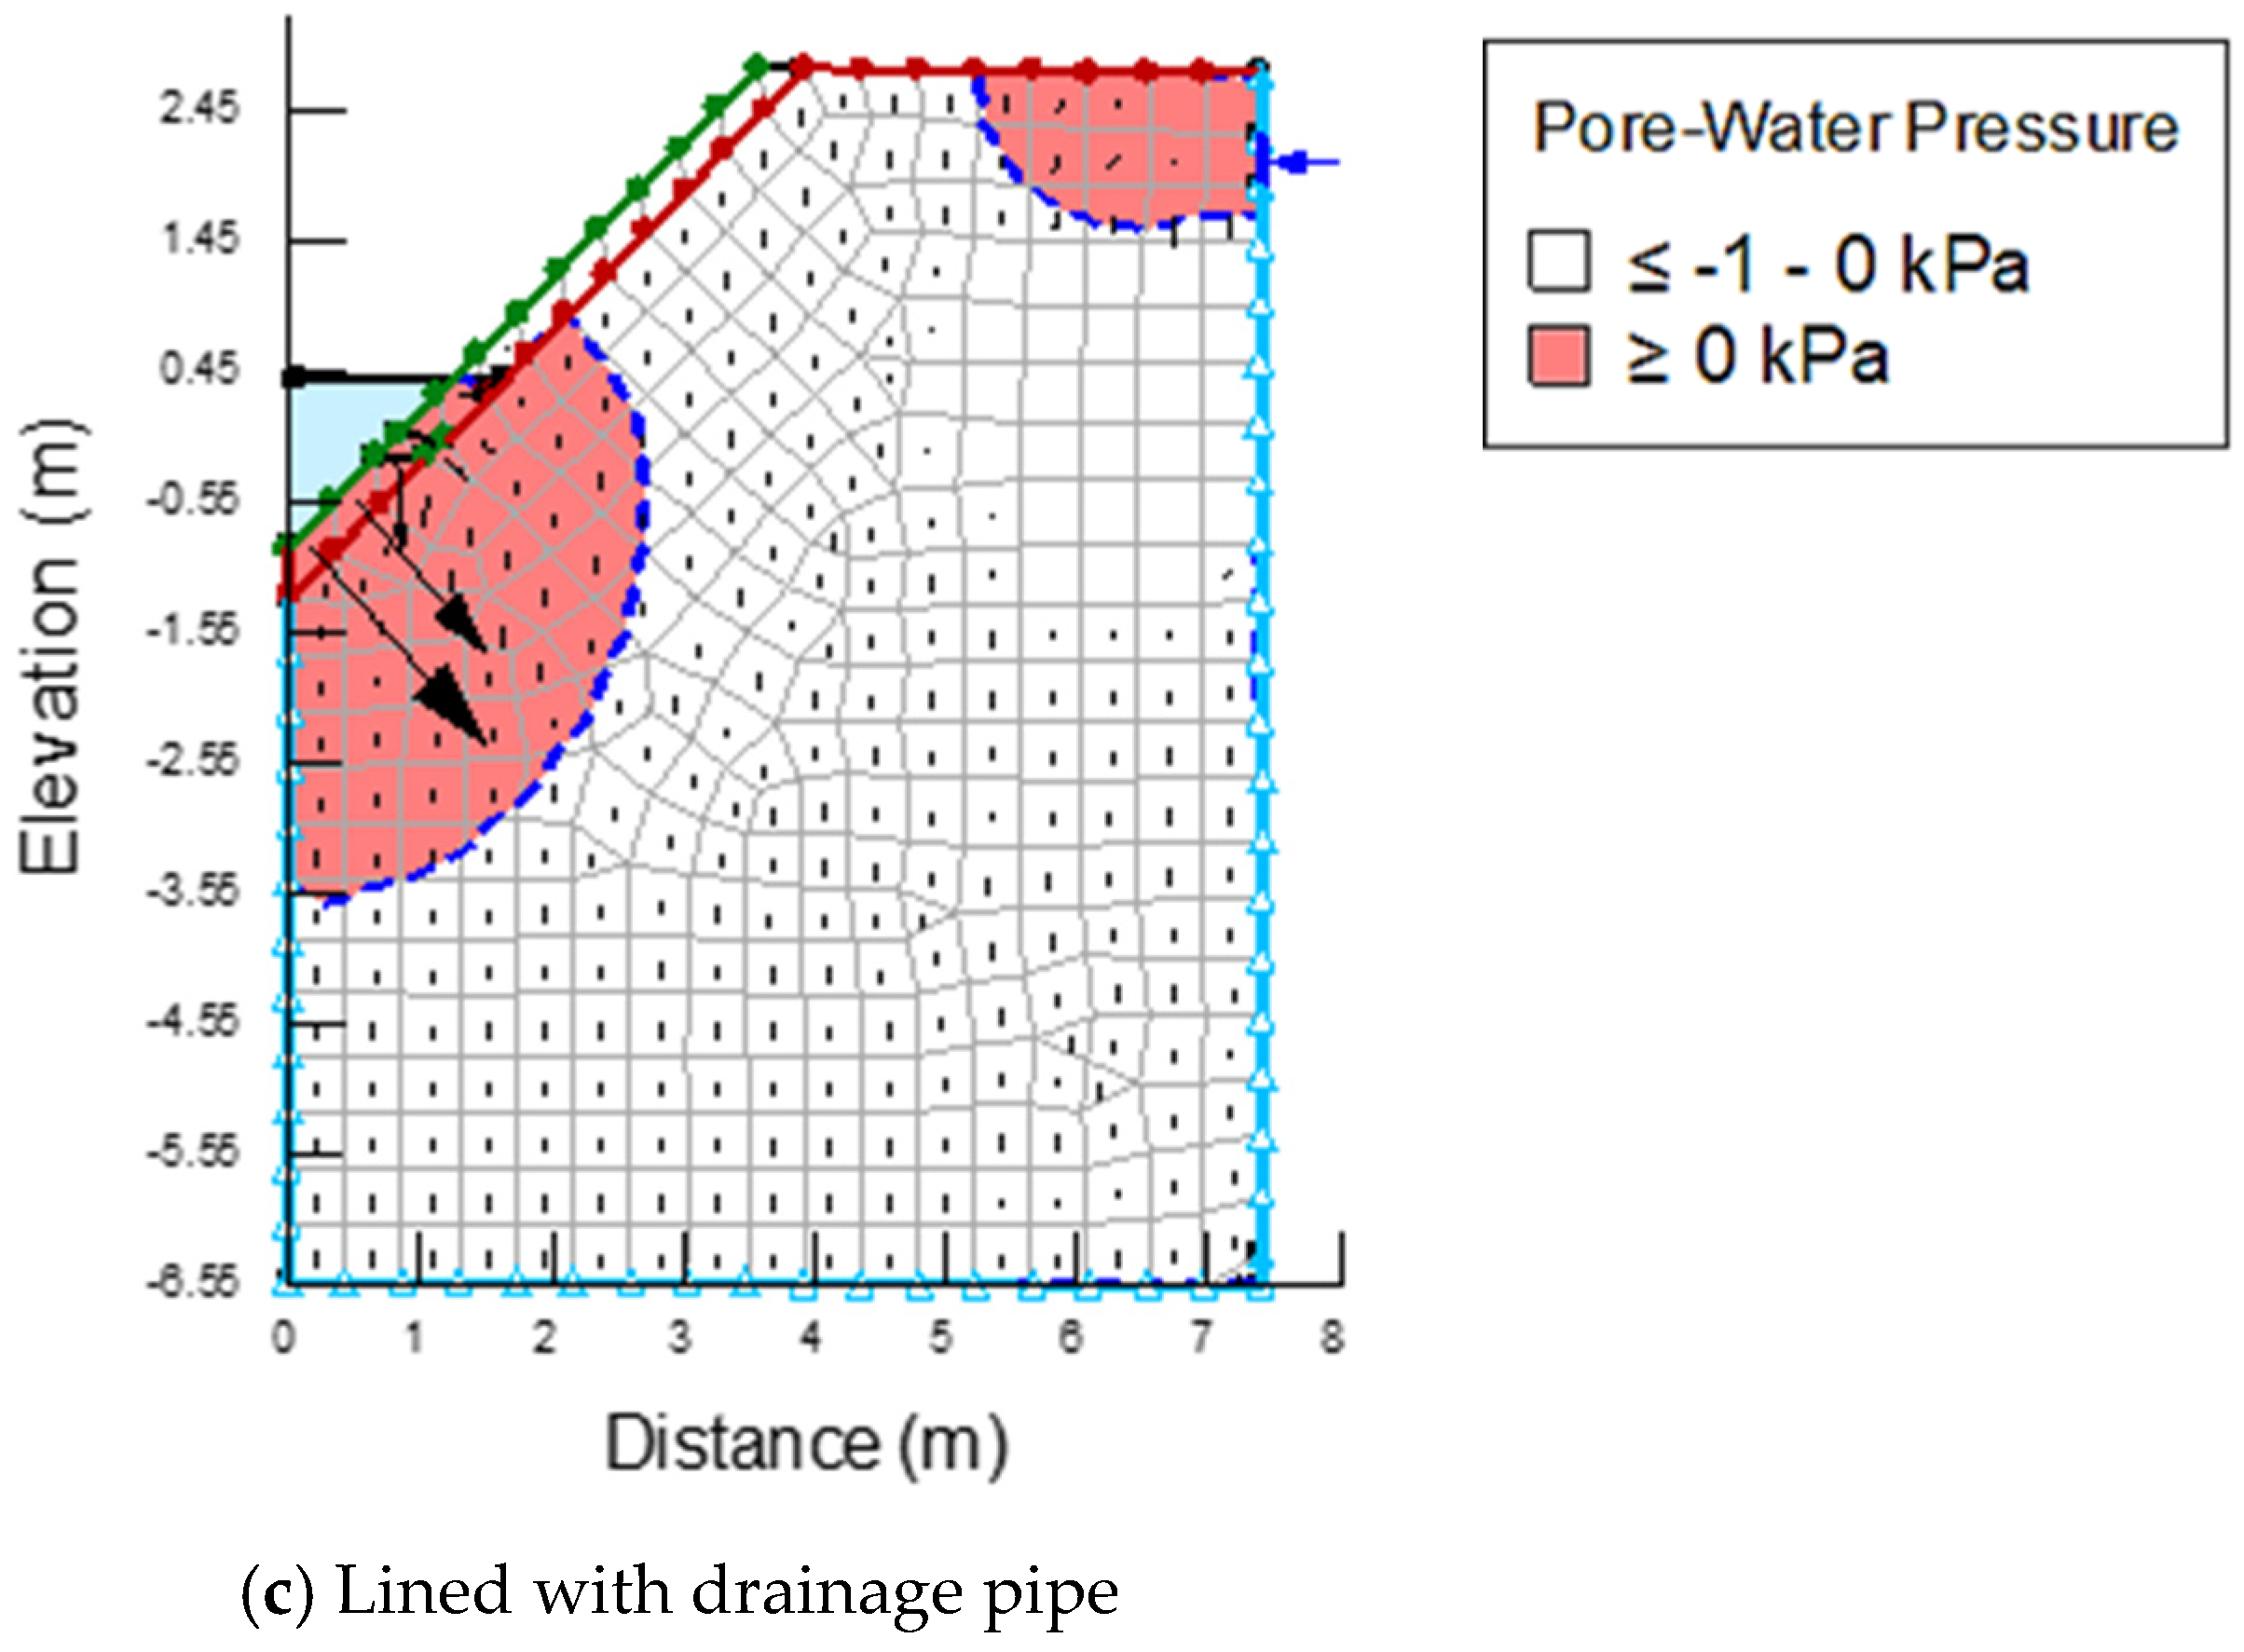
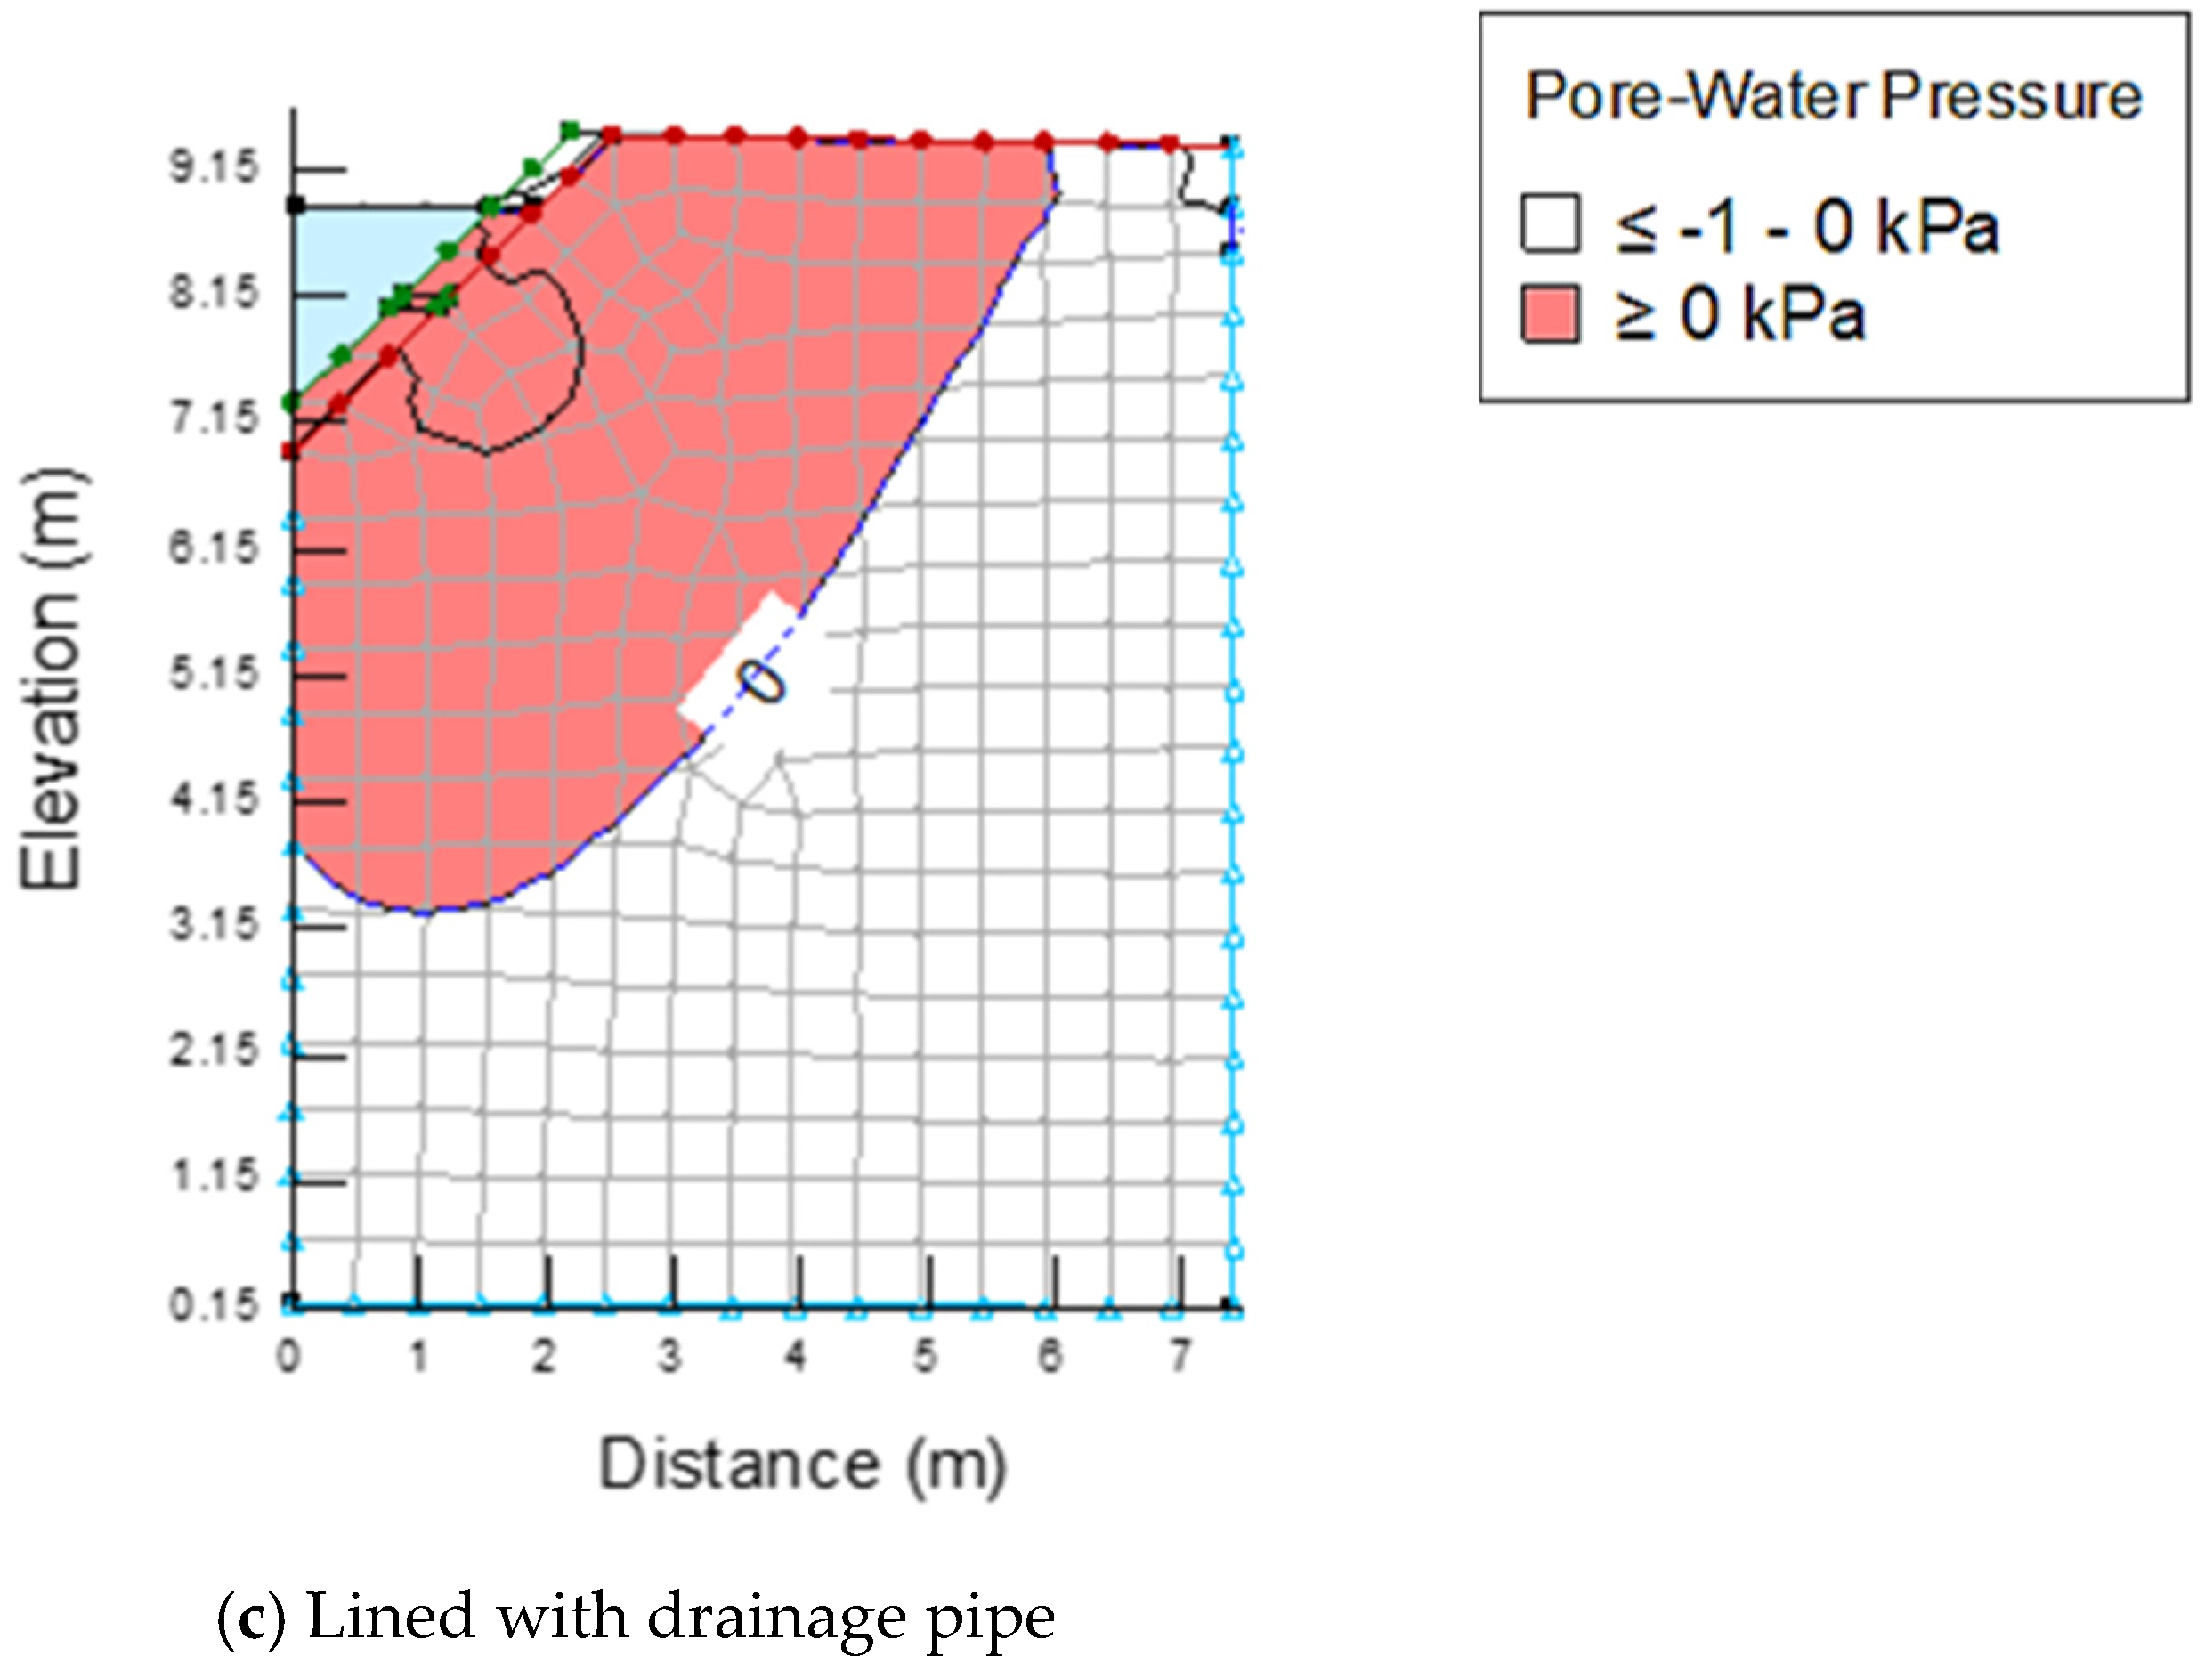
4.2. Pore Water Pressure at Different Sections of the Studied Canal
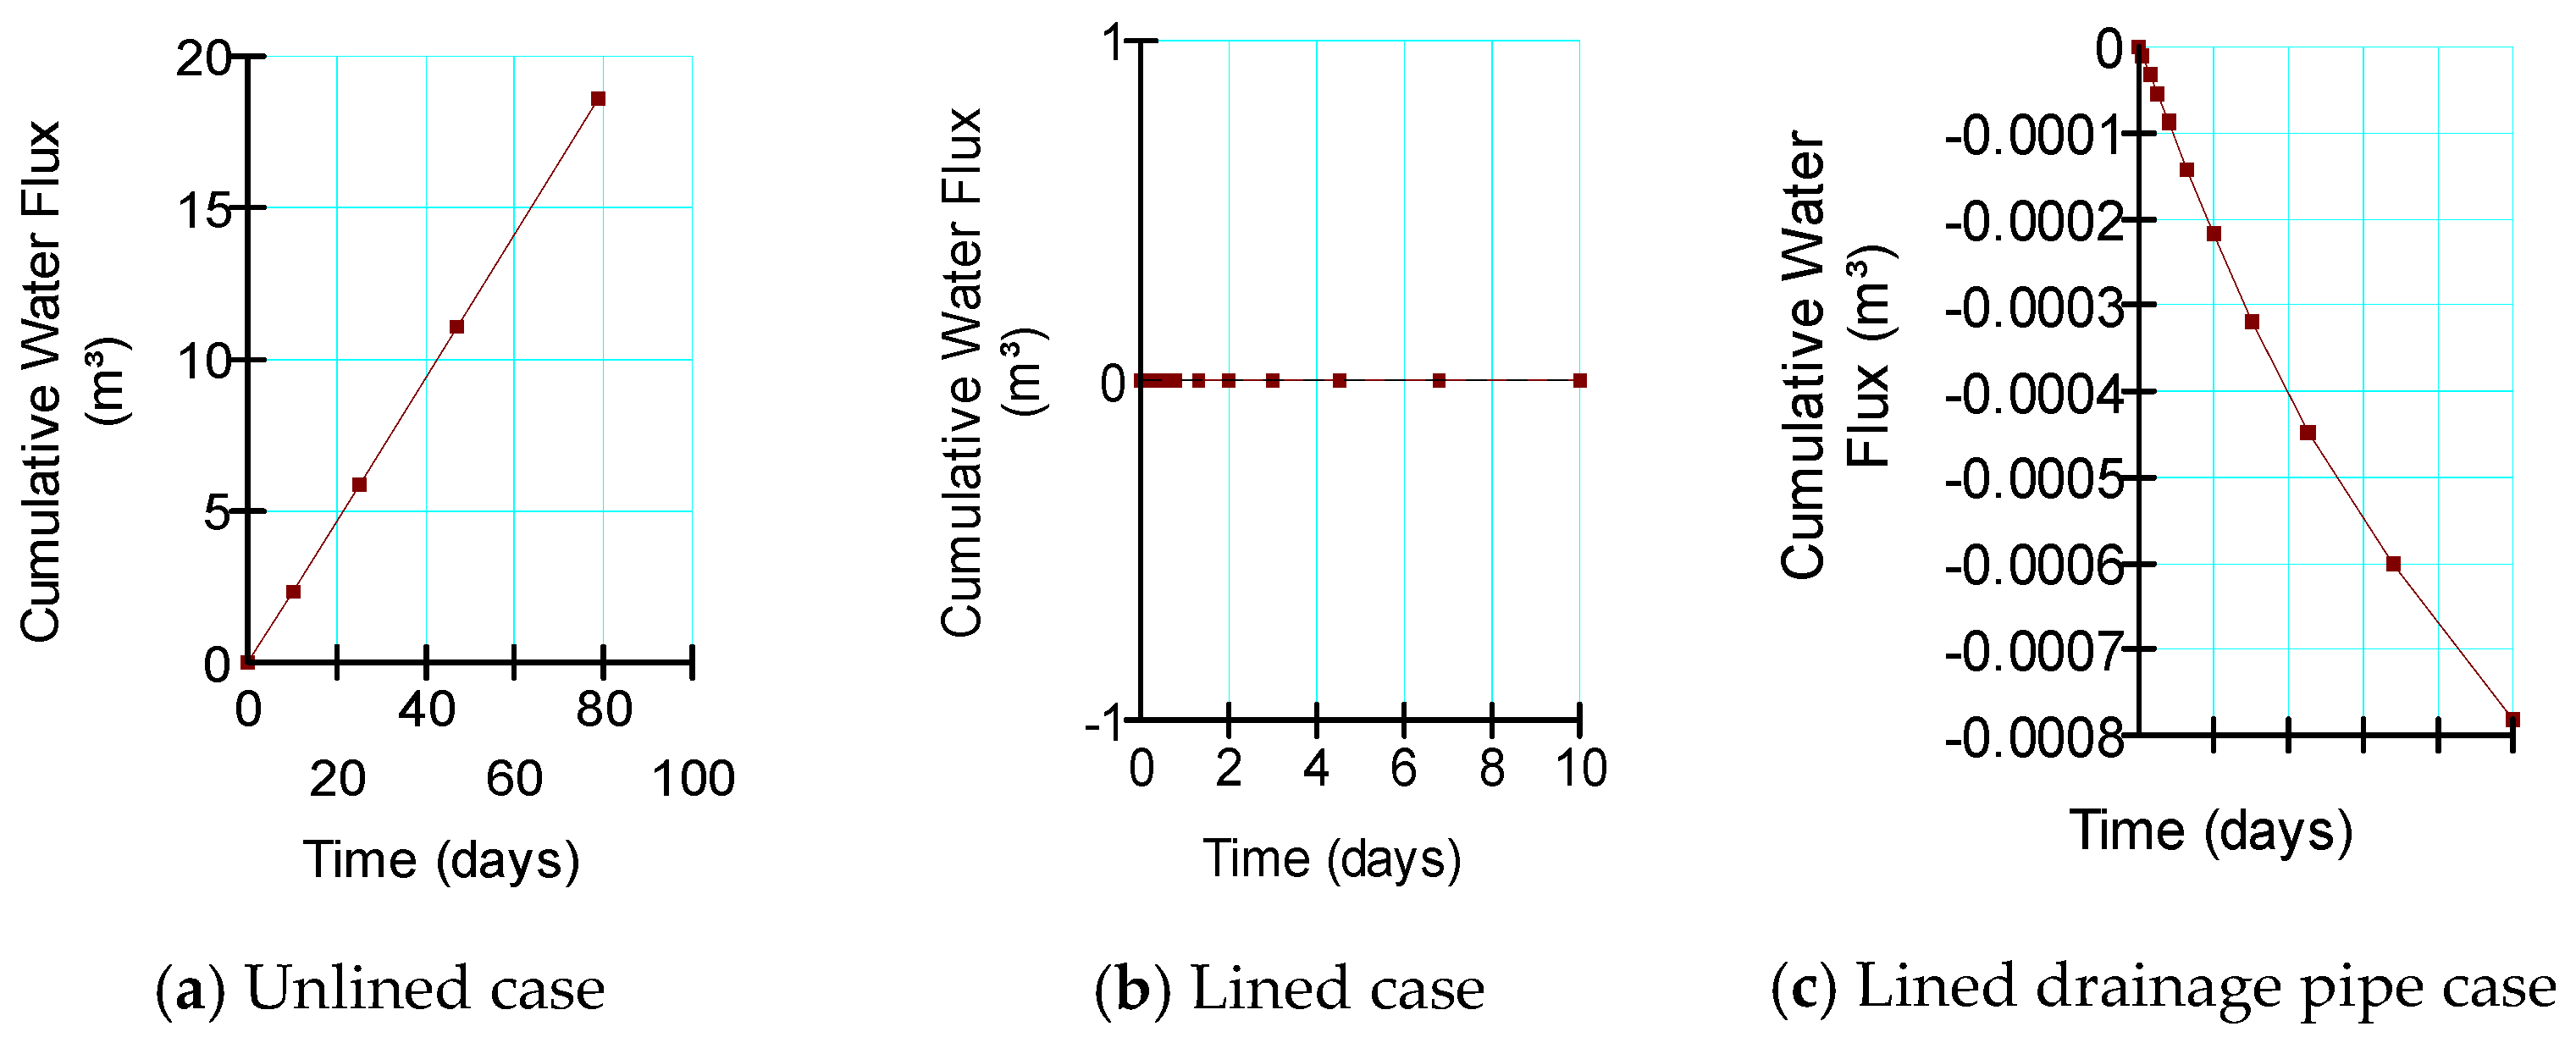
4.3. Seepage at Different Sections of the Studied Canal
- v: velocity
- K: hydraulic conductivity
- i: hydraulic gradient
- n: porosity
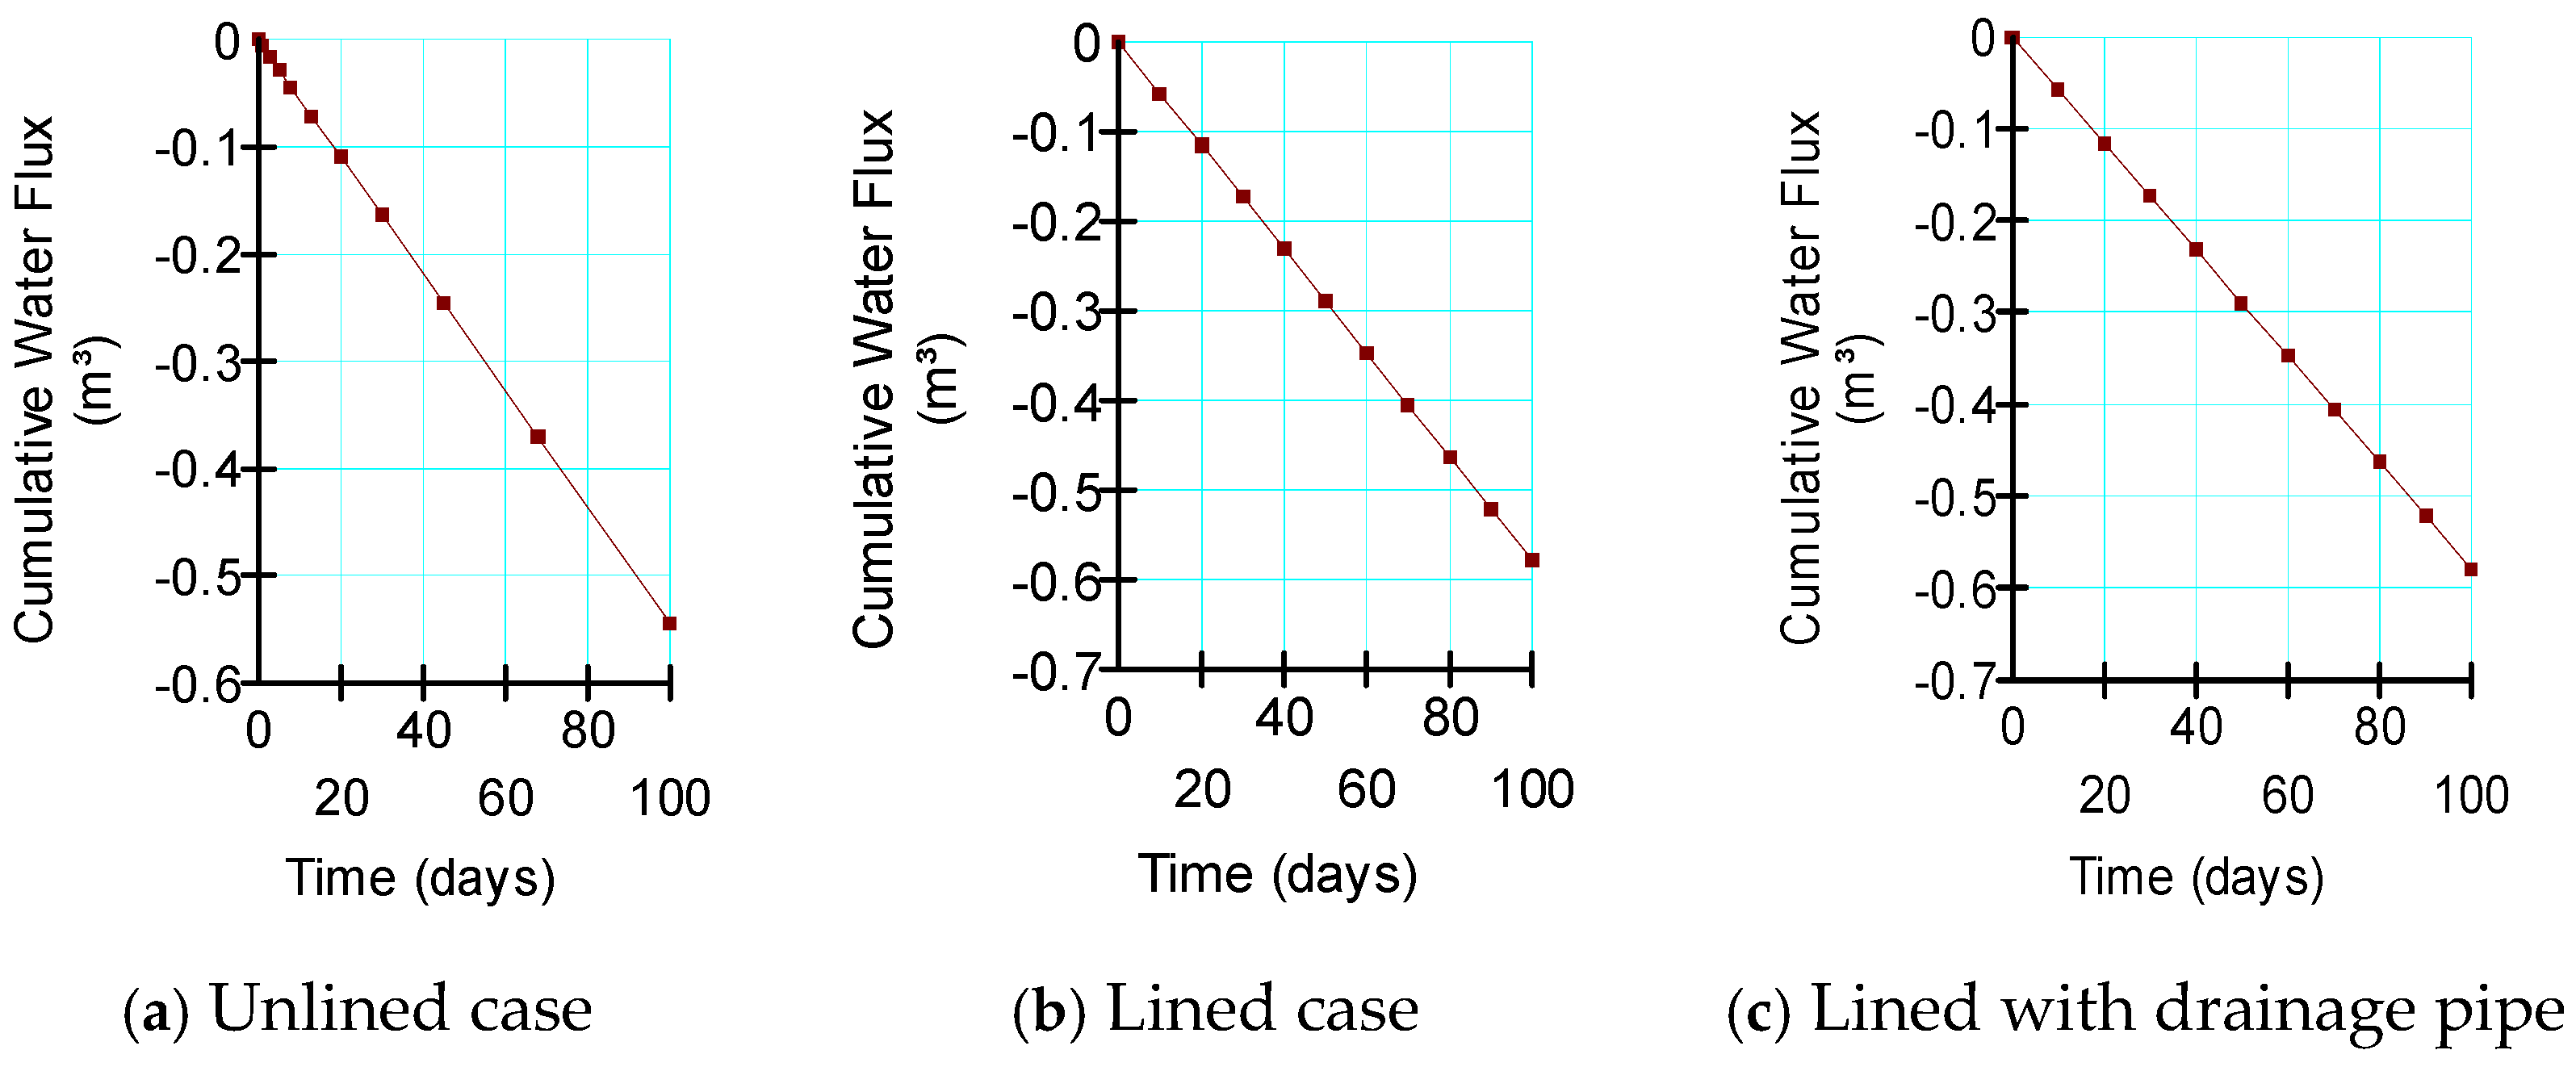
4.3.1. Seepage along the Side Slope for the Sero Canal at 1.00 km
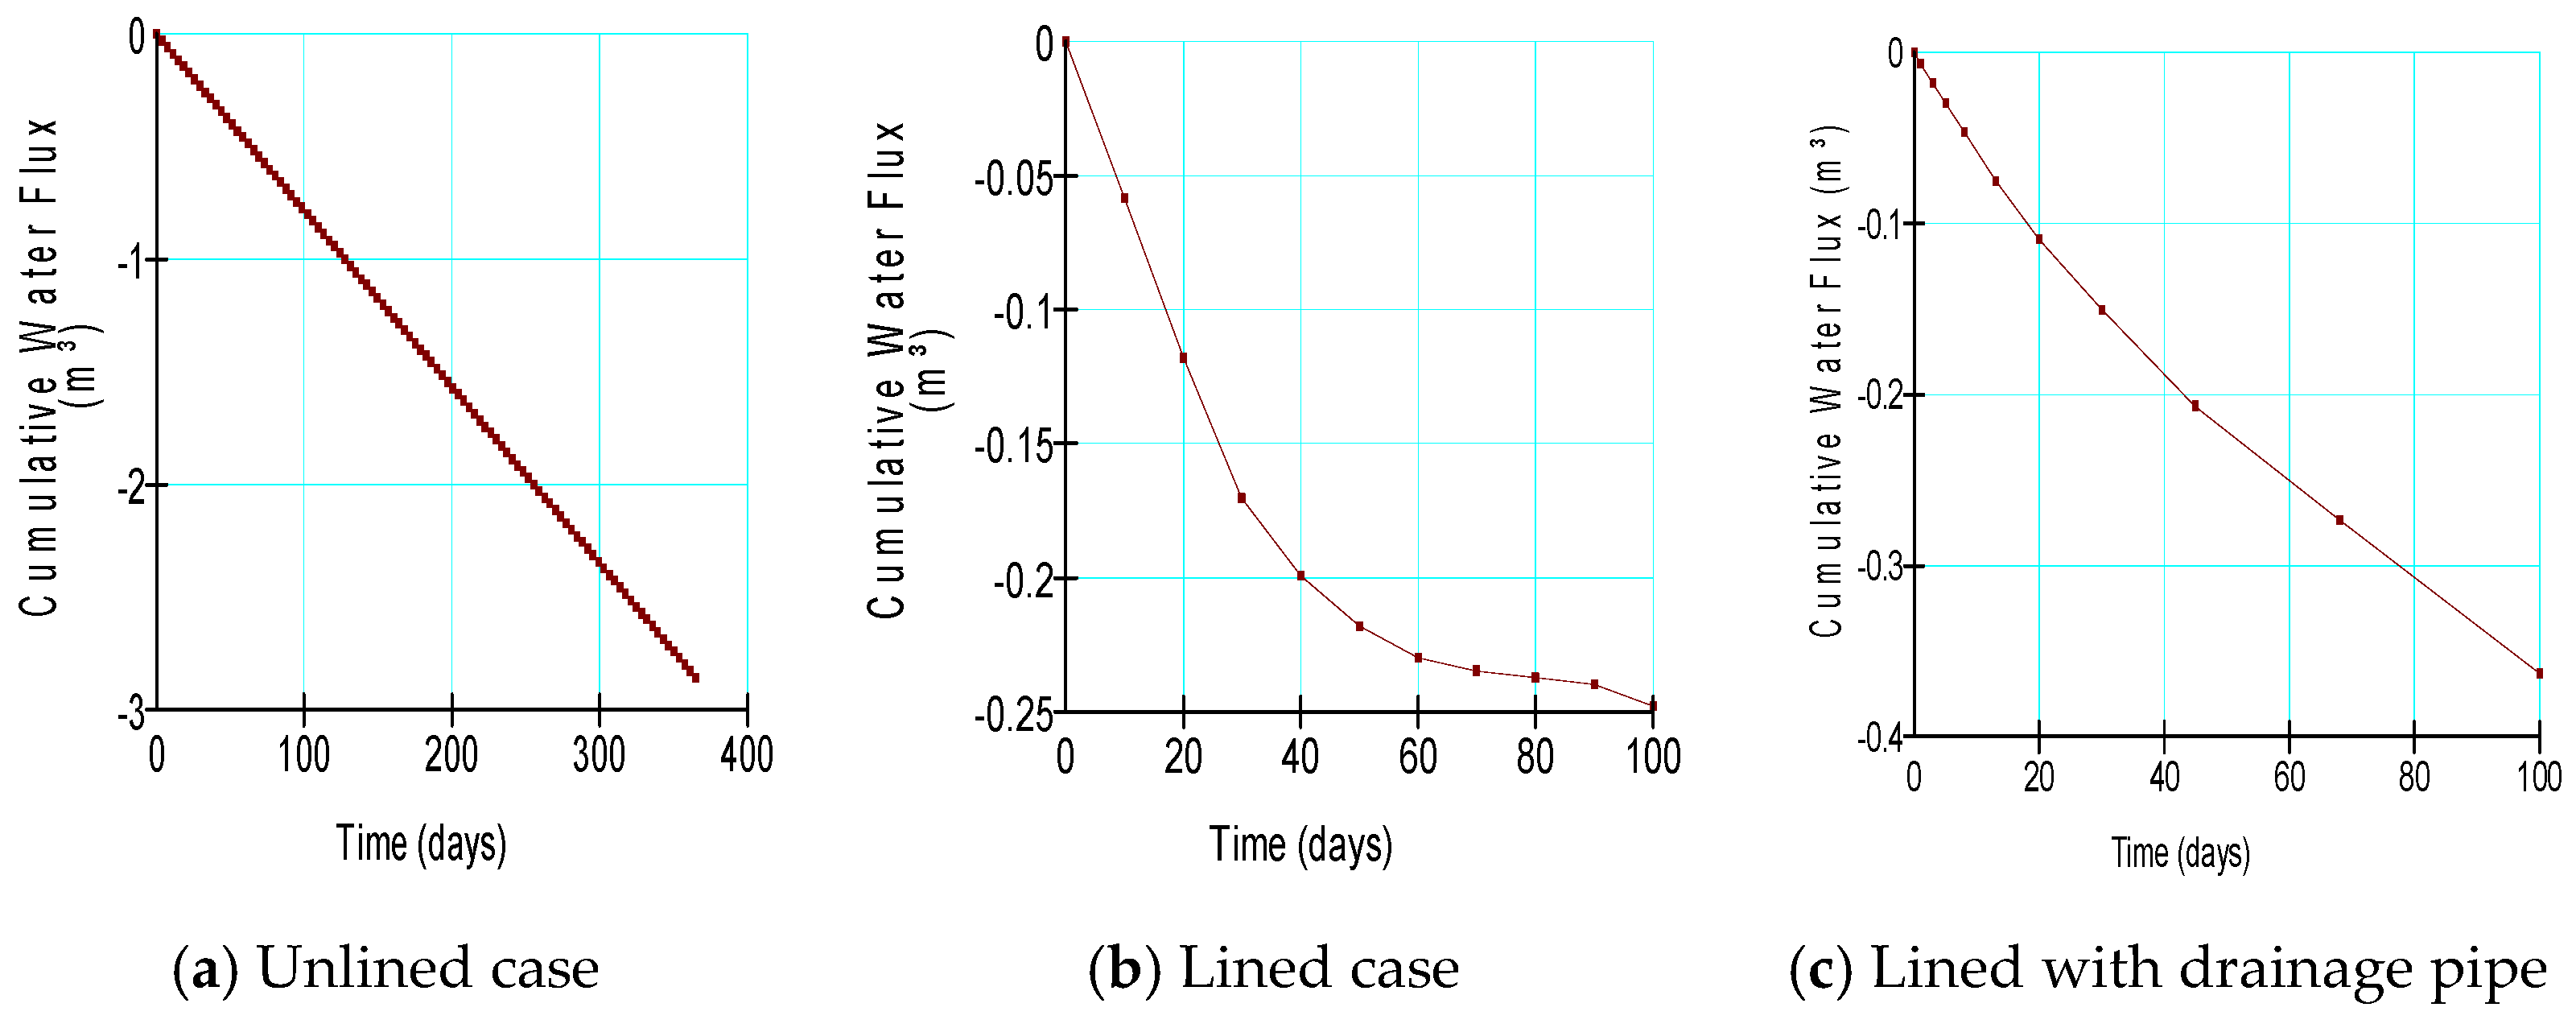
4.3.2. Seepage along the Side Slope for the Sero Canal at 7.00 km
4.3.3. Seepage along the Side Slope for the Sero Canal at 10.55 km
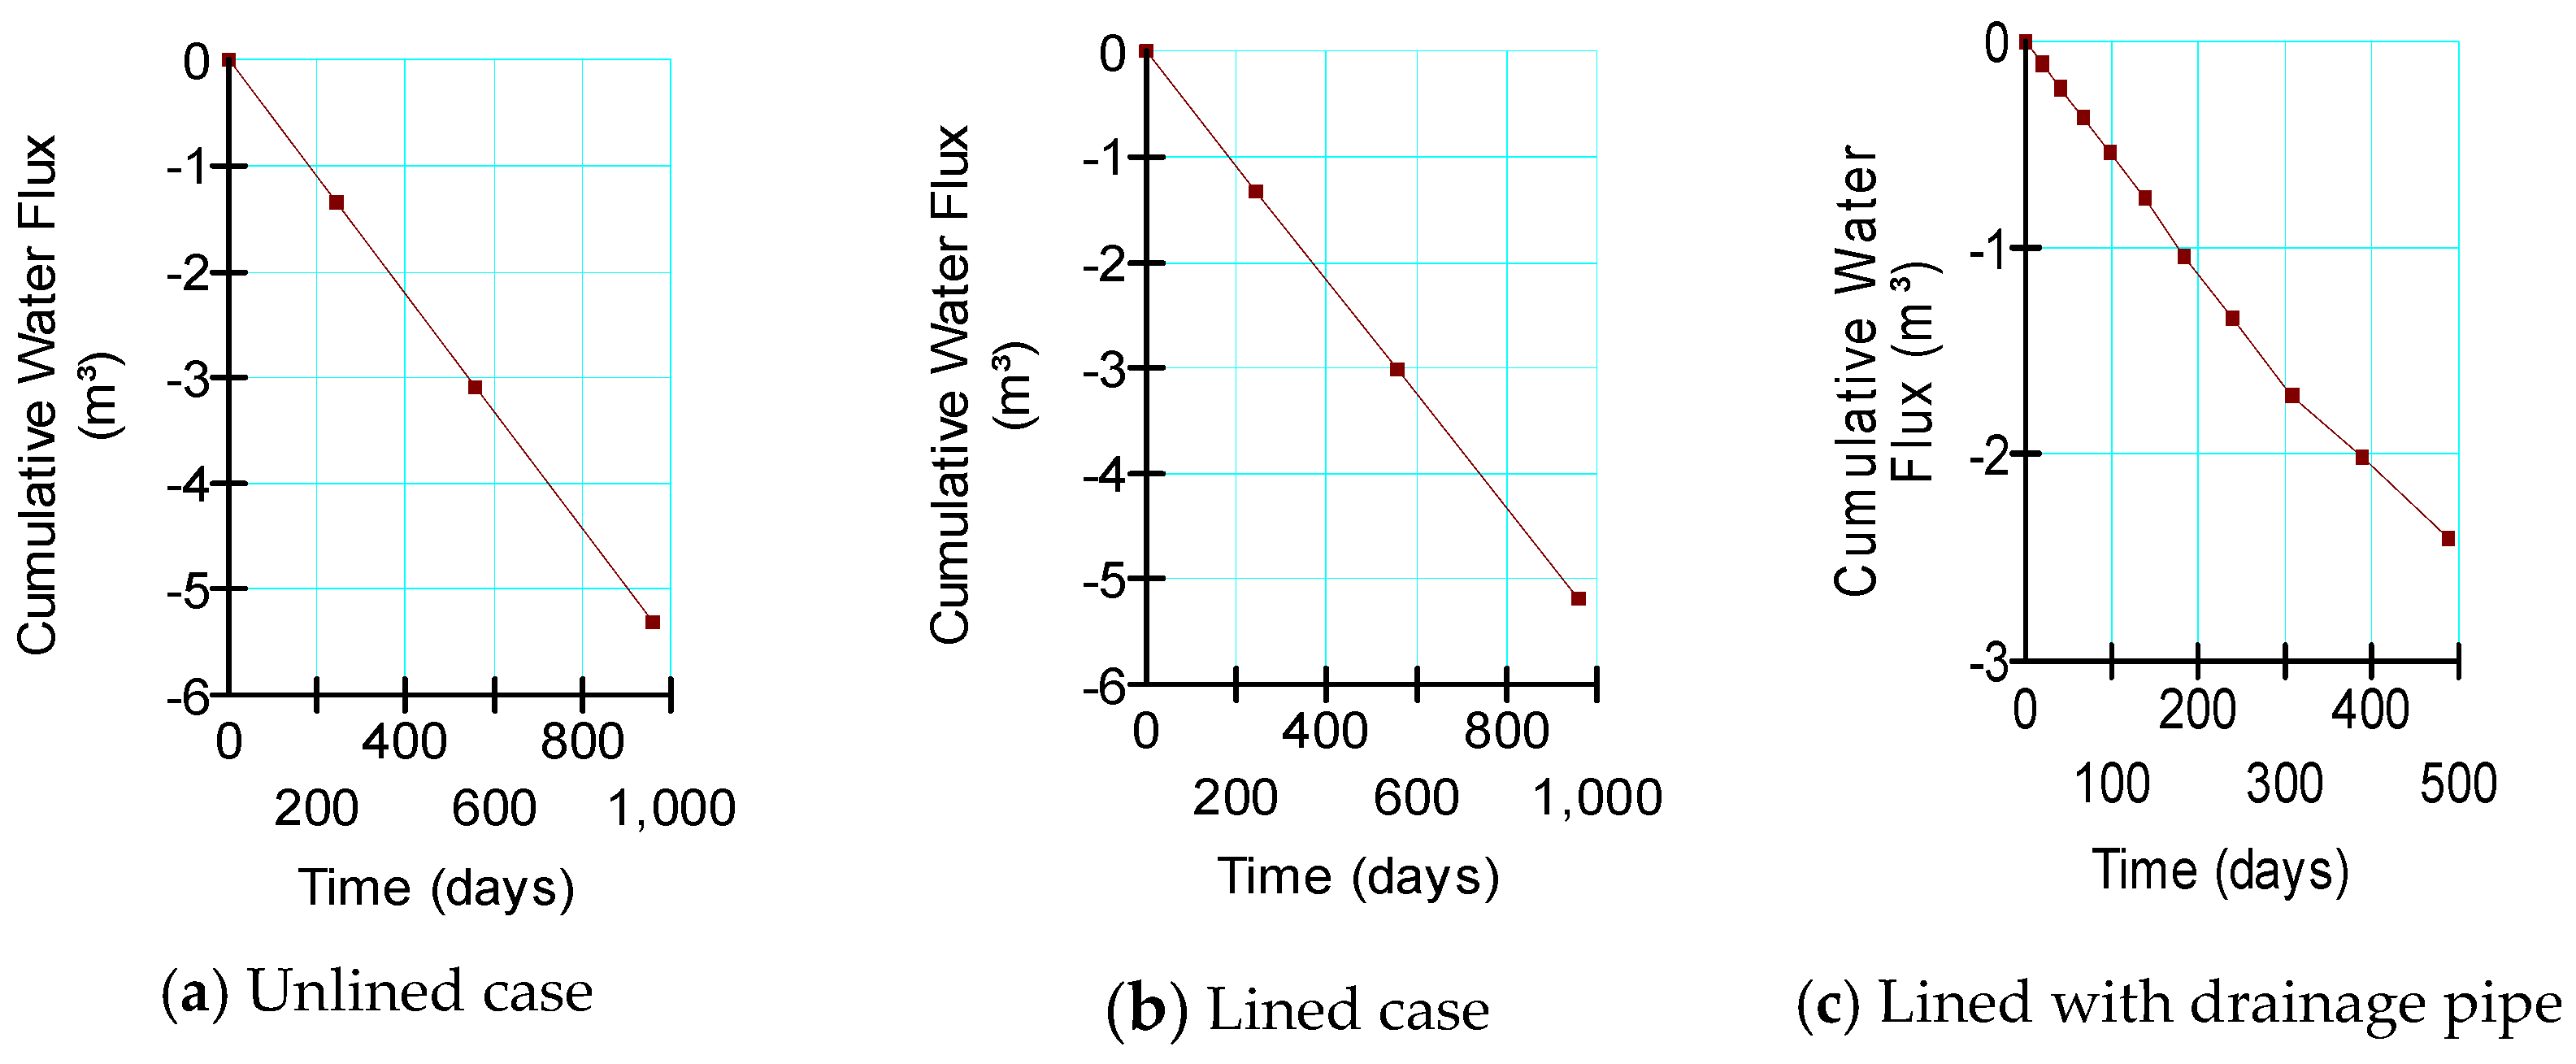
4.3.4. Seepage along the Side Slope for the Dafan Canal at 17.50 km
4.3.5. Seepage along the Side Slope for the New-Aslogy Canal at 1.50 km
4.4. Seepage along the Downstream of the Embankment at Different Sections of the Studied Canal
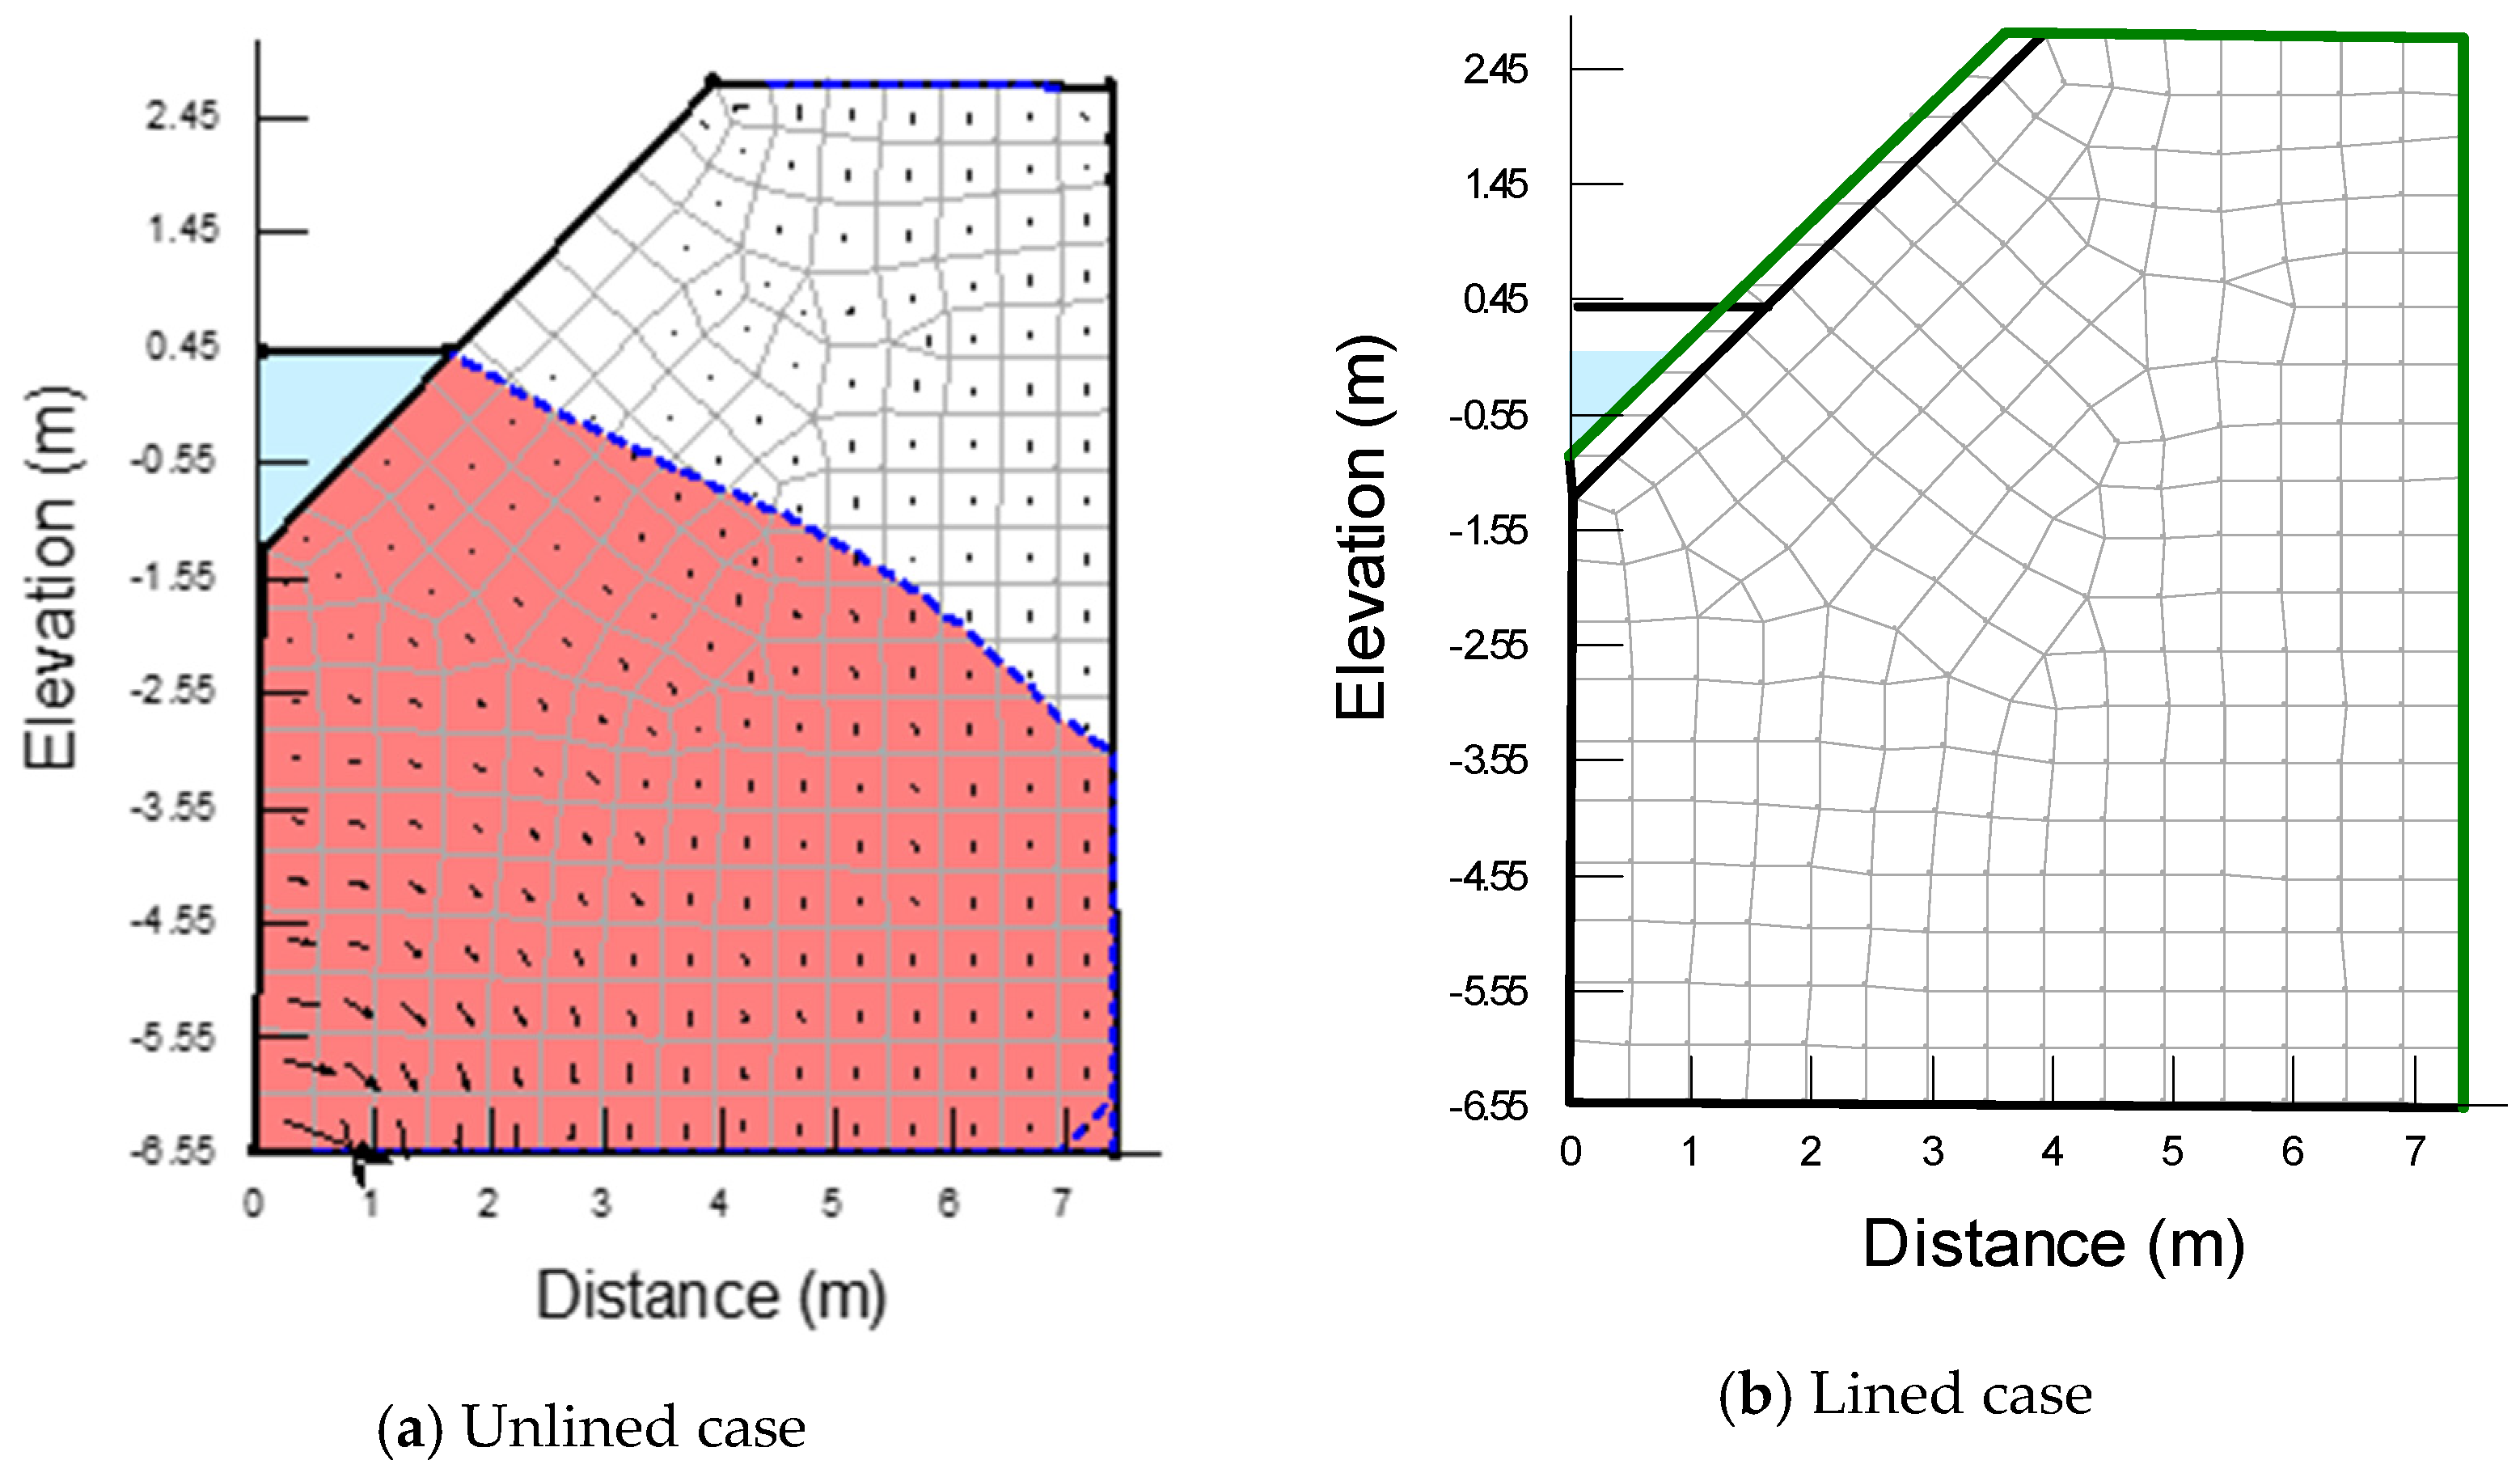
4.5. The Effect of the Lining on the Root Zone
4.6. The Effect of the Embankment Width
5. Conclusions
Author Contributions
Funding
Data Availability Statement
Acknowledgments
Conflicts of Interest
References
- Zeng, N.; Cen, L.; Xie, Y.; Zhang, S. Nonlinear optimal control of cascaded irrigation canals with conservation law PDEs. Control Eng. Pract. 2020, 100, 104407. [Google Scholar] [CrossRef]
- Rath, A.; Swain, P.C. Evaluation of performance of irrigation canals using benchmarking techniques—A case study of Hirakud dam canal system, Odisha, India. ISH J. Hydraul. Eng. 2020, 26, 51–58. [Google Scholar] [CrossRef]
- Zhou, X.; Zhang, Y.; Sheng, Z.; Manevski, K.; Andersen, M.N.; Han, S.; Li, H.; Yang, Y. Did water-saving irrigation protect water resources over the past 40 years? A global analysis based on water accounting framework. Agric. Water Manag. 2021, 249, 106793. [Google Scholar] [CrossRef]
- Khanal, K.; Adhikari, K.B.; Dhakal, S.C.; Marahatta, S. Factors Motivating Farmers for Collective Action for Management of Irrigation System in Nepal. Int. J. Soc. Sci. Manag. 2021, 8, 285–291. [Google Scholar] [CrossRef]
- Morad, N.A.; Abdel Latif, R.M. Assessment of Surface Water-Groundwater Relationship in the Area between Borg El Arab and West El Hammam, North West Coastal Zone, Egypt. Bull. Fac. Eng. Mansoura Univ. 2020, 42, 1–11. [Google Scholar] [CrossRef]
- Awad, S.R.; El Fakharany, Z.M. Mitigation of waterlogging problem in El-Salhiya area, Egypt. Water Sci. 2020, 34, 1–12. [Google Scholar] [CrossRef] [Green Version]
- Rank, P.; Vishnu, B. Pulse drip irrigation: A review. J. Pharmacogn. Phytochem. 2021, 10, 125–130. [Google Scholar]
- Hosseinzadeh Asl, R.; Salmasi, F.; Arvanaghi, H. Numerical investigation on geometric configurations affecting seepage from unlined earthen channels and the comparison with field measurements. Eng. Appl. Comput. Fluid Mech. 2020, 14, 236–253. [Google Scholar] [CrossRef]
- Tavakoli, E.; Ghorbani, B.; Radfar, M.; Borujeni, H.S.; Ghahraman, B. Investigating the Impressibility of Groundwater Level from Infiltration and Seepage in Water Conveyance Channels (Case Study: Boldaji). Irrig. Sci. Eng. 2020, 42, 1–14. [Google Scholar]
- Deng, C.; Bailey, R.T. Assessing causes and identifying solutions for high groundwater levels in a highly managed irrigated region. Agric. Water Manag. 2020, 240, 106329. [Google Scholar] [CrossRef]
- Habteyes, B.G.; Ward, F.A. Economics of irrigation water conservation: Dynamic optimization for consumption and investment. J. Environ. Manag. 2020, 258, 110040. [Google Scholar] [CrossRef]
- Souza, G.; Aquino, P.T.; Maia, R.F.; Kamienski, C.; Soininen, J.-P. A fuzzy irrigation control system. In Proceedings of the 2020 IEEE Global Humanitarian Technology Conference (GHTC), Seattle, WA, USA, 29 October–1 November 2020. [Google Scholar] [CrossRef]
- Aziz, S.A.; Negm, A.; Abd-Elhamid, H.F.; Mustafa, G.; Nassar, M. The impact of irrigation canals covering on groundwater in the nile delta, a case study: Abu Kebier city, Sharkia, Egypt. Int. Water Technol. J. 2009, 5, 57–64. [Google Scholar]
- Nasr, R.; Zeydan, B.; Bakry, M.; Saloom, M. Uplift pressure relief on lined canals using tile drains. Alex. Eng. J. 2003, 42, 497–507. [Google Scholar]
- Abuzeid, T.S. Conveyance losses estimation for open channels in middle Egypt case study: Almanna main canal, and its branches. JES J. Eng. Sci. 2021, 49, 64–84. [Google Scholar] [CrossRef]
- Shah, Z.; Gabriel, H.; Haider, S.; Jafri, T. Analysis of seepage loss from concrete lined irrigation canals in Punjab, Pakistan. Irrig. Drain. 2020, 69, 668–681. [Google Scholar] [CrossRef]
- Han, X.; Wang, X.; Zhu, Y.; Huang, J.; Yang, L.; Chang, Z.; Fu, F. An Experimental Study on Concrete and Geomembrane Lining Effects on Canal Seepage in Arid Agricultural Areas. Water 2020, 12, 2343. [Google Scholar] [CrossRef]
- Eltarabily, M.G.; Moghazy, H.E.; Abdel-Fattah, S.; Negm, A.M. The use of numerical modeling to optimize the construction of lined sections for a regionally-significant irrigation canal in Egypt. Environ. Earth Sci. 2020, 79, 80. [Google Scholar] [CrossRef]
- Abd-Elhamid, H.F.; Abdelaal, G.M.; Abd-Elaty, I.; Said, A.M. Efficiency of using different lining materials to protect groundwater from leakage of polluted streams. J. Water Supply Res. Technol. 2019, 68, 448–459. [Google Scholar] [CrossRef]
- Khan, M.H.A.; Saleem, M.U.; Ahmad, S.R.; Ahmad, N.; Sameeni, S.J.; Akram, M.; Farooq, M. Role of Canal Lining on Groundwater Fluctuations: A Modeling Simulation Approach for Jaalwala Distributary, Bahawalnagar. Open J. Appl. Sci. 2017, 7, 213–232. [Google Scholar] [CrossRef] [Green Version]
- Lesser, L.E.; Mahlknecht, J.; López-Pérez, M. Long-term hydrodynamic effects of the All-American Canal lining in an arid transboundary multilayer aquifer: Mexicali Valley in north-western Mexico. Environ. Earth Sci. 2019, 78, 504. [Google Scholar] [CrossRef] [Green Version]
- Zhao, Y.; Li, F.; Yao, R.; Jiao, W.; Hill, R.L. An Empirical Orthogonal Function-Based Approach for Spatially- and Temporally-Extensive Soil Moisture Data Combination. Water 2020, 12, 2919. [Google Scholar] [CrossRef]
- Taran, F.; Mahtabi, G. Optimum layout of weep holes in concrete irrigation canals to control uplift pressure and hydraulic gradient. Arab. J. Geosci. 2020, 13, 88. [Google Scholar] [CrossRef]
- Salmasi, F.; Khatibi, R.; Nourani, B. Investigating reduction of uplift forces by longitudinal drains with underlined canals. ISH J. Hydraul. Eng. 2017, 24, 81–91. [Google Scholar] [CrossRef]
- Abd-Elaziz, S.; Zeleňáková, M.; Mésároš, P.; Purcz, P.; Abd-Elhamid, H.F. Anthropogenic Activity Effects on Canals Morphology, Case Study: Nile Delta, Egypt. Water 2020, 12, 3184. [Google Scholar] [CrossRef]
- Aziz, S.A.; Zeleňáková, M.; Mésároš, P.; Purcz, P.; Abd-Elhamid, H. Assessing the Potential Impacts of the Grand Ethiopian Renaissance Dam on Water Resources and Soil Salinity in the Nile Delta, Egypt. Sustainability 2019, 11, 7050. [Google Scholar] [CrossRef] [Green Version]
- Available online: https://geoportal.mwri.gov.eg/portal/apps/webappviewer/index.html?id=81955815d2a84d1890b4d3686dc6be8a (accessed on 20 March 2021).
- Engineering tooLfC. Soil Sampling; Technical Report; Engineering tooLfC: Zagazig, Egypt, 2019. [Google Scholar]
- Division of Agricultural Sciences and Natural Resources Hsoe. Available online: https://www.osuit.edu/ (accessed on 20 April 2021).
- Chuck Burr UoN-L. PAGE 3, Irrigation Chapter 3—Soil Water; The Plant and Soil Sciences eLibrary: Lincoln, NE, USA, 2021; Available online: https://passel2-stage.unl.edu/view/lesson/bda727eb8a5a/3, (accessed on 25 May 2021).
- El-Molla, D.A.; El-Molla, M.A. Reducing the conveyance losses in trapezoidal canals using compacted earth lining. Ain Shams Eng. J. 2021, 12, 2453–2463. [Google Scholar] [CrossRef]
- Aghdam, A.T.; Salmasi, F.; Abraham, J.; Arvanaghi, H. Effect of Drain Pipes on Uplift Force and Exit Hydraulic Gradient and the Design of Gravity Dams Using the Finite Element Method. Geotech. Geol. Eng. 2021, 39, 3383–3399. [Google Scholar] [CrossRef]
- Salmasi, F.; Abraham, J. Predicting seepage from unlined earthen channels using the finite element method and multi variable nonlinear regression. Agric. Water Manag. 2020, 234, 106148. [Google Scholar] [CrossRef]
- Jassam, M.G.; Abdulrazzaq, S.S.; Khalaf, W.D. Seepage characteristics analysis through homogeneous earth dams using theoretical model of SEEP/W program. J. Crit. Rev. 2020, 7, 5984–5996. [Google Scholar]
- Al-Janabi, A.M.S.; Ghazali, A.H.; Ghazaw, Y.M.; Afan, H.A.; Al-Ansari, N.; Yaseen, Z.M. Experimental and Numerical Analysis for Earth-Fill Dam Seepage. Sustainability 2020, 12, 2490. [Google Scholar] [CrossRef] [Green Version]
- Al-Nedawi, N.M. Finite Element Analysis of Seepage for Hemrin Earth Dam Using Geo-Studio Software. Diyala J. Eng. Sci. 2020, 13, 66–76. [Google Scholar] [CrossRef]
- Mostafa, A.; Gado, T.A.; Masoud, A.A.; Rashwan, I.M.H. Numerical and experimental analyses of the use of double vertical barrier walls for groundwater protection. Water Environ. Res. 2020, 92, 2168–2177. [Google Scholar] [CrossRef] [PubMed]
- Geo-Studio. Version 8.15.11236 UMGI, Calgary, in, Alberta, Canada; Geo-Studio: Calgary, AB, Canada, 2012. [Google Scholar]
- (WGNHS) TWGaNHS. Understanding Porosity and Density; (WGNHS) TWGaNHS: Hong Kong, China, 2021. [Google Scholar]


| The Canal | Length (km) | Zone | Pick Point | Longitude | Latitude |
|---|---|---|---|---|---|
| Sero | 11.155 | Abu Kabir | end | 31.721° | 30.835° |
| Dafan | 36.899 | Awlad-sakr | inlet | 31.706° | 30.931° |
| New-Aslogy | 6.187 | Zagazig | inlet | 31.482° | 30.576° |
| Canal | Section (km) | Side Slope | Surface Water Level | Ground-Water Level | Bed Width (m) | Bed Level | Road Width (m) | Road Level | Aquitard Depth (m) |
|---|---|---|---|---|---|---|---|---|---|
| Sero | 1.00 | 1:1 | (5.50) | (1.90) | 6 | (2.70) | 12 | (5.70) | 12.5 |
| 7.00 | (4.50) | 5 | (1.90) | 7.4 | (5.00) | ||||
| 10.55 | (4.40) | 4 | (1.90) | 4.9 | (5.00) | ||||
| Dafan | 17.500 | 1:1 | (0.40) | −(0.75) | 8 | −(1.30) | 5.5 | (2.75) | 9.3 |
| New-Aslogy | 1.500 | 1:1 | (8.84) | (5.94) | 3 | (6.90) | 6.57 | (9.33) | 9.2 |
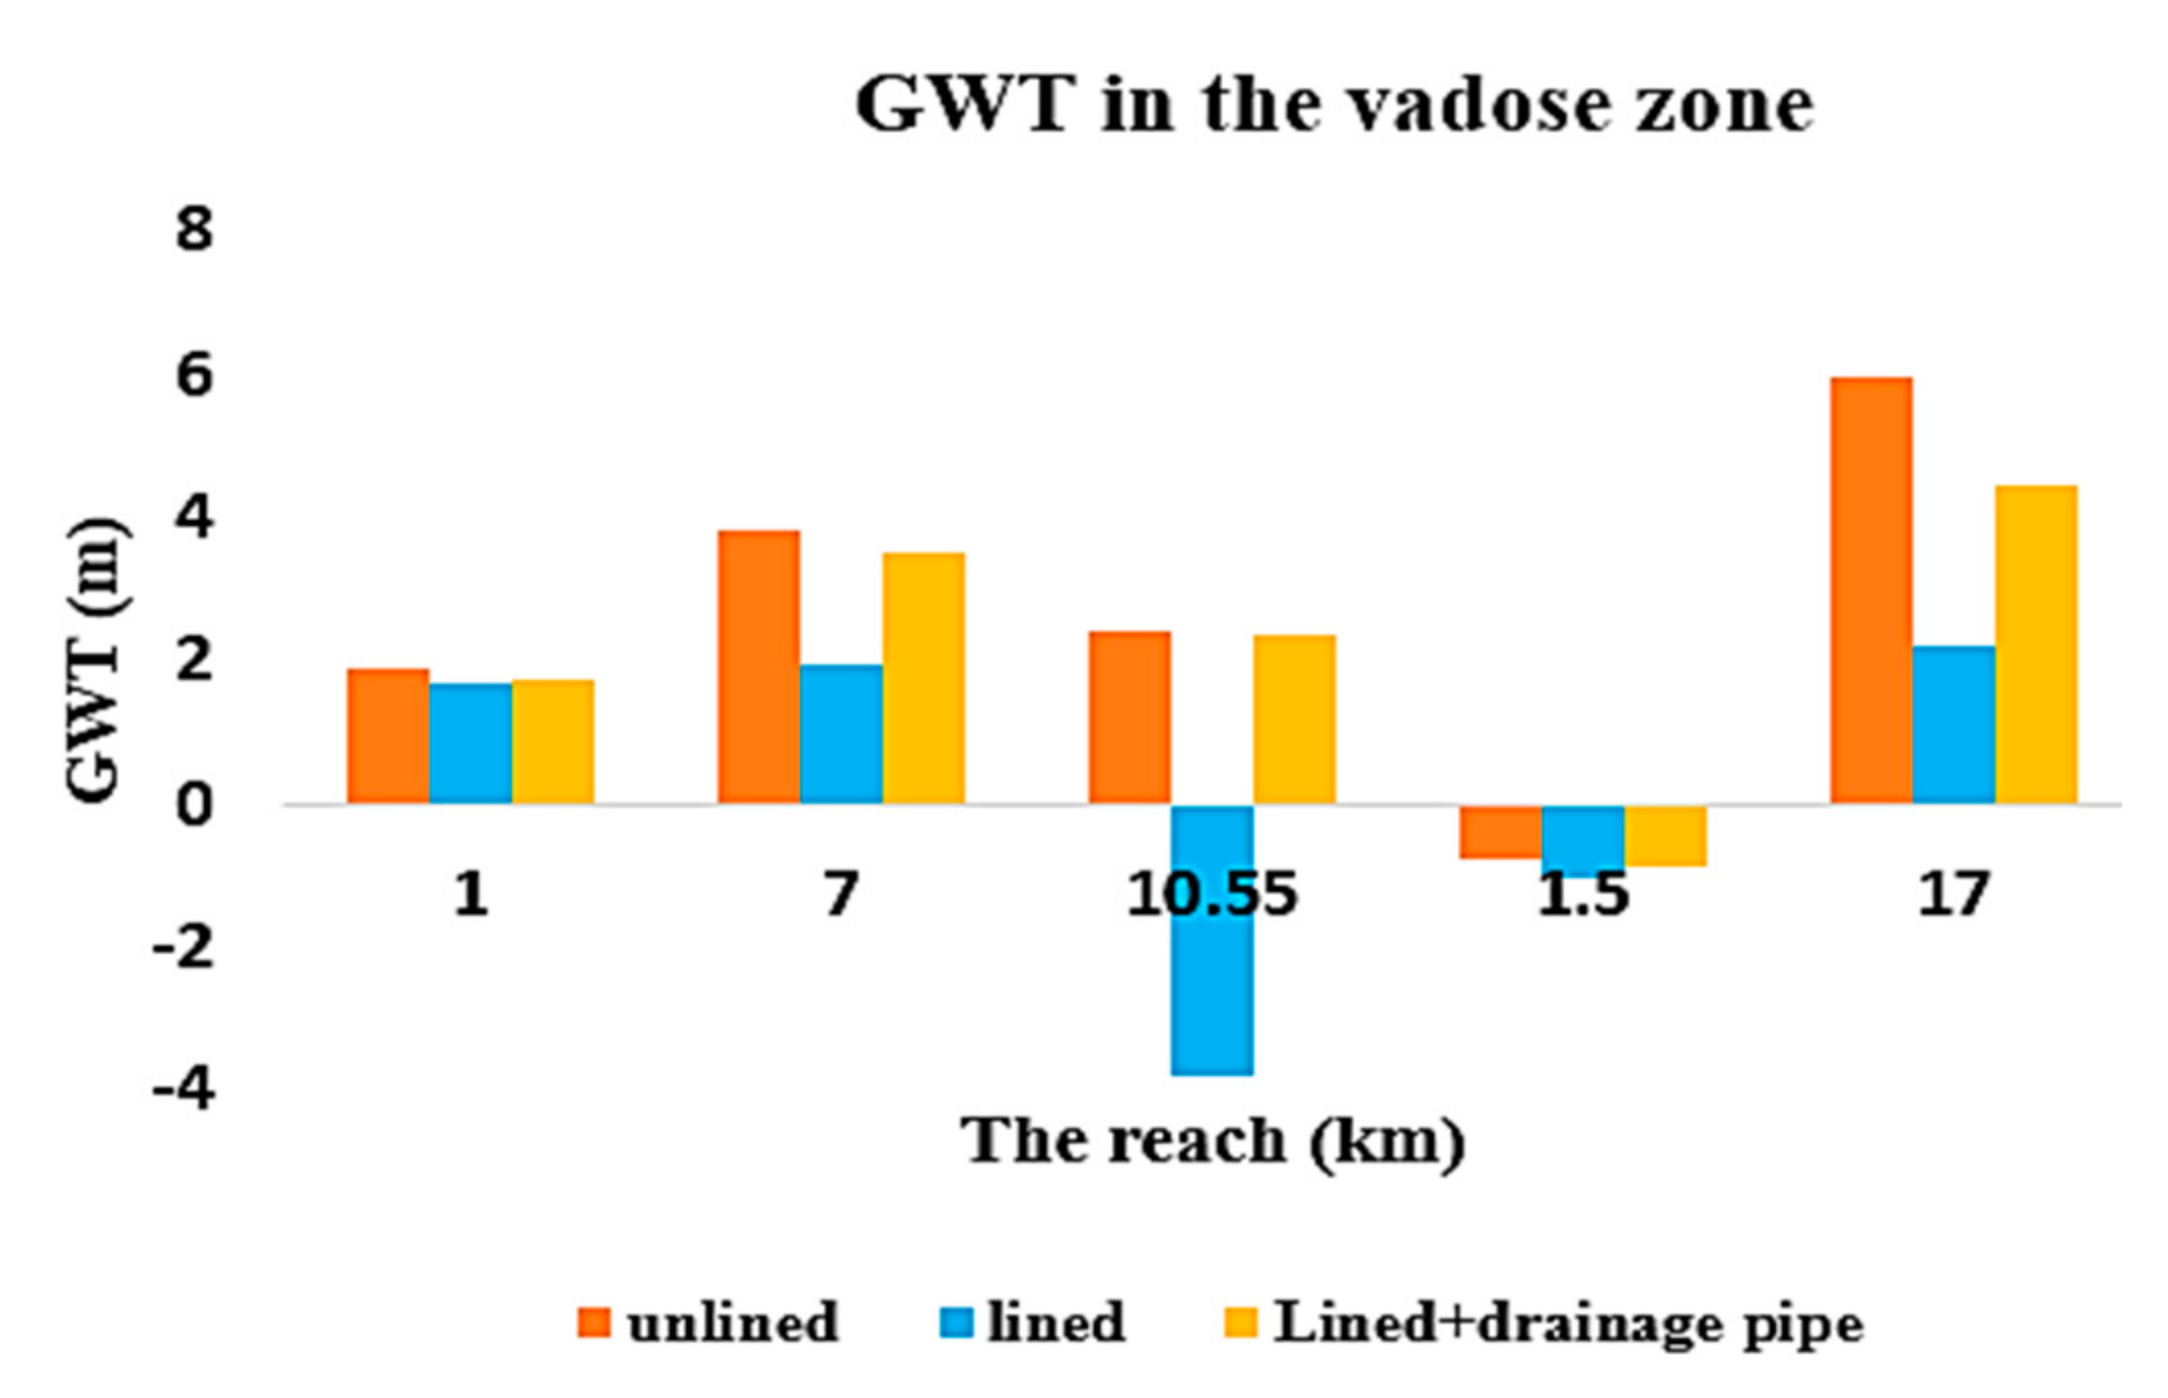
| Canal | Reach (km) | Unlined | Lined | Lined with a Drainage Pipe |
|---|---|---|---|---|
| Sero | 1.00 | 1.9 | 1.7 | 1.725 |
| 7.00 | 3.84 | 1.966 | 3.49 | |
| 10.550 | 2.4 | −3.78 | 2.35 | |
| Dafan | 1.50 | −0.75 | −1.03 | −0.87 |
| New-Aslogy | 17.00 | 5.94 | 2.22 | 4.45 |
Publisher’s Note: MDPI stays neutral with regard to jurisdictional claims in published maps and institutional affiliations. |
© 2022 by the authors. Licensee MDPI, Basel, Switzerland. This article is an open access article distributed under the terms and conditions of the Creative Commons Attribution (CC BY) license (https://creativecommons.org/licenses/by/4.0/).
Share and Cite
Abd-Elziz, S.; Zeleňáková, M.; Kršák, B.; Abd-Elhamid, H.F. Spatial and Temporal Effects of Irrigation Canals Rehabilitation on the Land and Crop Yields, a Case Study: The Nile Delta, Egypt. Water 2022, 14, 808. https://doi.org/10.3390/w14050808
Abd-Elziz S, Zeleňáková M, Kršák B, Abd-Elhamid HF. Spatial and Temporal Effects of Irrigation Canals Rehabilitation on the Land and Crop Yields, a Case Study: The Nile Delta, Egypt. Water. 2022; 14(5):808. https://doi.org/10.3390/w14050808
Chicago/Turabian StyleAbd-Elziz, Sherien, Martina Zeleňáková, Branislav Kršák, and Hany F. Abd-Elhamid. 2022. "Spatial and Temporal Effects of Irrigation Canals Rehabilitation on the Land and Crop Yields, a Case Study: The Nile Delta, Egypt" Water 14, no. 5: 808. https://doi.org/10.3390/w14050808