
Index System of Water Resources Development and Utilization Level Based on Water-Saving Society
by
 , ,
, ,
Ce Dai
1,2 ,
,
Jie Tang
1,2,
Zhaoyang Li
1,2,*,
Yucong Duan
1,2,
Yunke Qu
1,2,
Yao Yang
1,2,
Hang Lyu
1,2,
Dan Zhang
3 and
Yongtai Wang
4 1
Key Laboratory of Groundwater Resources and Environment, Ministry of Education, Jilin University, Changchun 130012, China
2
College of New Energy and Environment, Jilin University, Changchun 130012, China
3
Jilin Northeast Coal Industry Environmental Protection Research Co., Ltd., Changchun 130012, China
4
Shulan Ecological Environment Monitoring Station, Shulan 132600, China
*
Author to whom correspondence should be addressed.
Water 2022, 14(5), 802; https://doi.org/10.3390/w14050802
Submission received: 27 January 2022
/
Revised: 1 March 2022
/
Accepted: 2 March 2022
/
Published: 3 March 2022
(This article belongs to the Topic Water Reclamation and Reuse)
Abstract
:The notion of a ‘Water-saving society’ may help China achieve sustainable development and high-quality development. In this paper, the concept of water resources development and utilization level is discussed from the perspective of a water-saving society, and an evaluation index system including 33 indicators is constructed. This paper takes the evaluation of water resources development and utilization level of Jingyu County from 2009 to 2018 as an example to verify the rationality of the indicator system of this study. Additionally, by changing the sensitivity analysis method of indicator weights, the indicators with greater influence on the evaluation results are screened to reduce the uncertainty of too many indicators and low correlation. The results show that the evaluation value of water resources development and utilization level in Jingyu County from 2009 to 2018 was improved from V to II, and the improvement of industrial and domestic water use efficiency and effectiveness improved the water resource problems in the study area. Sensitivity analysis showed that the sensitivity parameters are the degree of water resources development and utilization (8.7%), water consumption per CNY 10,000 of industrial value added (11.2%), water consumption per CNY 10,000 of GDP (9.3%), leakage rate of the urban water supply network (8.4%), per capita water resources (10.1%), per capita COD emissions (9.3%) and urbanization rate (8.2%).
1. Introduction
Water is one of the most important natural resources on which living things depend; the survival and development of human society cannot be achieved without the support and use of water resources [1]. With industrialization, the world is facing a water pollution crisis [2], and less than one percent of the world’s fresh water resources are available for drinking, so the conservation of water is a major challenge in securing access to water resources in the 21st century [3]. Many scholars have conducted studies to address the issue of efficient water use and conservation. Lim, Bongsu et al. analyzed the water use and awareness of water conservation in Daejeon, Korea [4]. Otaki, Yurina et al. analyzed the local applicability of water-saving devices by investigating the use of water-saving devices and the amount of water saved in 134 households in Hanoi, Vietnam [5]. da Silva [6] analyzed water conservation in the city of Karuru, Brazil, by projecting the population in 2015 and the population in 2035 to derive per capita water use, based on the calculated amount of water savings and the cost of water-saving devices, and the impact of water-saving device installation on economic development and the environment. Juniah, Restu analyzed the economic, social and ecological benefits of water resources in a city in Indonesia and quantified the economic, social and ecological benefits using electricity prices, sustainability and vegetation cover [7].
China’s average multiyear water use totals 2.81 × 10⁴ billion m3, ranking sixth globally. However, due to the large population base, China’s per capita water holdings rank 108. By 2030, China’s per capita water resources are expected to reach the internationally recognized alert level for water scarcity [8]. With economic and social development, China’s demand for water resources is increasing. Additionally, in the process of exploiting water resources on a large scale, it has not only produced waste and pollution of water resources, but also caused a series of environmental problems, such as drought, overexploitation and ground collapse [9]. It is evident that the level of exploitation of water resources in China is limited, and therefore China is promoting the construction of a water-saving society in a comprehensive manner. Building a water-saving society is one of the important plans in China’s 14th Five-Year Plan and is also a manifestation of ‘ecological civilization’ with Chinese characteristics [10,11]. The construction of a water-saving society has been agreed upon in many countries, but there are no complete and mature cases abroad. Only Israel, Japan, South Africa and other countries have made partial studies and attempts in the area of water rights and water demand management [12]. Chinese leader Xi Jinping has proposed a water-saving society with the goal of achieving the economical, intensive and safe use of water resources and improving the efficiency and benefits of water resource use across the board. Although water efficiency improved in the 13th Five-Year Plan, and water conservation policies and measures have been improved, China still has water conservation problems, such as high leakage rates in urban water supply networks and low levels of water reuse in some industrial sectors. In order to realize the rational exploitation and economic value of water resources, there is an urgent need for methods to evaluate the level of water resources development and utilization to ensure the country’s water security and economic development.
A scientific and reasonable evaluation index system is the basis for water resources evaluation. Currently, water resources evaluation includes single-indicator evaluation and multi-indicator integrated evaluation. Single-indicator evaluation has certain limitations [13], and many scholars at home and abroad have tried to use different methods to establish an integrated multi-indicator water resources evaluation system, such as an analytic hierarchy process (AHP) [14,15], pressure–state–response (PSR) [16], driving force–pressure–state–impact–response (DPSIR) [17,18] and socio–economic–ecological [19]. Although these studies of indicator systems have been good at evaluating water resources development and utilization, the results of different indicator systems also vary considerably. As there is no unified and scientific indicator system for water resources evaluation, the construction of an indicator system is not only an important part of water resources evaluation but has also become a hot topic in water resources evaluation research.
The use and innovation of evaluation methods is an important part of water resources evaluation, and in recent years many scholars have used different methods of water resources evaluation to explore the extent of development and sustainable use of regional water resources [20]. Liu, Chuanfeng et al. used principal component analysis to comparatively assess the carrying capacity of water resources in Hebei, Tianjin and Beijing [21]. Abadi used a system dynamics approach and the Vensim model to model the water resource system downstream of the Karkheh dam in Khuzestan province. After validation of the model, sustainability indicators were evaluated in simulated scenarios and under different DEA policies [22]. Yewang Zhou used and the gray correlation method to assess agricultural water use efficiency and influencing factors in Hubei Province, China [23]. Water resources assessment is the most powerful basic guarantee for the rational development and use of water resources. Whether it is a regional or an overall water resources assessment, it plays an important role in guiding the sustainable development and use of water resources. The most widely used water resources evaluation methods are principal component analysis [24], fuzzy integrated evaluation [25], analytic hierarchy process [26] and multiobjective analysis [27]. When the sign of the factor loadings of the principal components in the principal component analysis is positive or negative, the meaning of the composite evaluation function is unclear. The fuzzy comprehensive evaluation method is complex to calculate, is highly subjective in determining the weight vector of indicators and may miss sample information [28]. The weight of each index in the analytic hierarchy process depends on the judgment of experts, which leads to a lack of objectivity. Multiobjective analysis is a dimensionality reduction analysis method. The diversity of its objectives and the contradictory nature between them make the construction of its functions difficult, while the choice of the dimensionality reduction algorithm also has a significant impact on its results. Projection pursuit is a new statistical method for processing and analyzing high-dimensional data. The basic idea is to project high-dimensional data onto a low-dimensional (one- to three-dimensional) subspace and find a projection that reflects the structure or characteristics of the original high-dimensional data, with objective results [29]. Both subjective and objective evaluation methods have certain shortcomings and cannot give scientifically accurate evaluation results.
Sensitivity analysis is an important basis for indicator system construction and system structure optimization [30]. Through sensitivity analysis, it can calculate which indicators have the greatest impact and contribution to the indicator system and then provide guidance for the refinement and optimization of the equipment system [31]. Existing sensitivity analysis methods include local sensitivity analysis methods and global sensitivity analysis methods. The main local sensitivity analysis methods are the OTA method [32] and the single-factor cut method [33]. Global sensitivity analysis methods mainly include the regression method [34], Sobol method [35], Morris search method [36] and RSA method [37]. Neumann pointed out that global sensitivity analysis has a better theoretical basis and higher accuracy [38].
This paper proposes the concept of regional water resources development and utilization level from the perspective of a water-saving society while combining previous studies on water resources development and utilization level and the concept of water resources carrying capacity at home and abroad. It is defined as the maximum efficiency and effectiveness of water resources development and use that can be achieved at a given socioeconomic and technological level, within the context of sustainable development of the water resources system. Based on this definition, the evaluation index system of water resources development and utilization level was constructed. Similar to the carrying capacity of water resources, the level of water resources development and use is dynamic and related to the state of the water resource system and human activities. This indicator system can quantitatively evaluate the level of water resources development and utilization. It contains 33 indicators selected from the current status of water resources development and utilization, water resources utilization efficiency, water resources utilization benefits and regional development capacity. The selection of the indicators takes full account of the connotations of the level of water resources development and utilization as well as the principles of systematicity and scientificity. The evaluation results of the indicator system are of great significance in promoting the development and use of regional water resources and building a water-saving society. This study uses the evaluation results of the water resources development and utilization level of Jingyu County from 2009 to 2018 as a case study to theoretically provide a reference for the evaluation index system of water resources development and utilization level. On this basis, the Sobol global sensitivity analysis method was used to conduct sensitivity analysis on the index weights and screen out the indexes that have a great influence on the evaluation results, so as to refine and optimize the index system in this paper.
2. Methods
2.1. Construction of the Evaluation Index System for the Level of Water Resources Development and Utilization
The evaluation of the level of water resources development and use is a complex system involving social, economic and ecological aspects, and the elements of its various systems are intertwined and interact with each other. Firstly, the ecological environment is the basis for the sustainable exploitation and quality of water resources; secondly, the exploitation of water resources is inseparable from the activities of human society, while the exploitation of water resources also promotes economic development.
The evaluation index system should be based on the characteristics of the level of water resources development and utilization, taking into account the causal relationship among society, the economy and environment and incorporating the requirements of a water-saving society into the construction of the index system. Based on the concept of building a water-saving society, this indicator system does not simply discuss how to save water and use water and explore the degree of exploitation of water resources, but aims at the economical and intensive use of water resources and explores the maximum efficiency and benefits of the use of regional water resources.
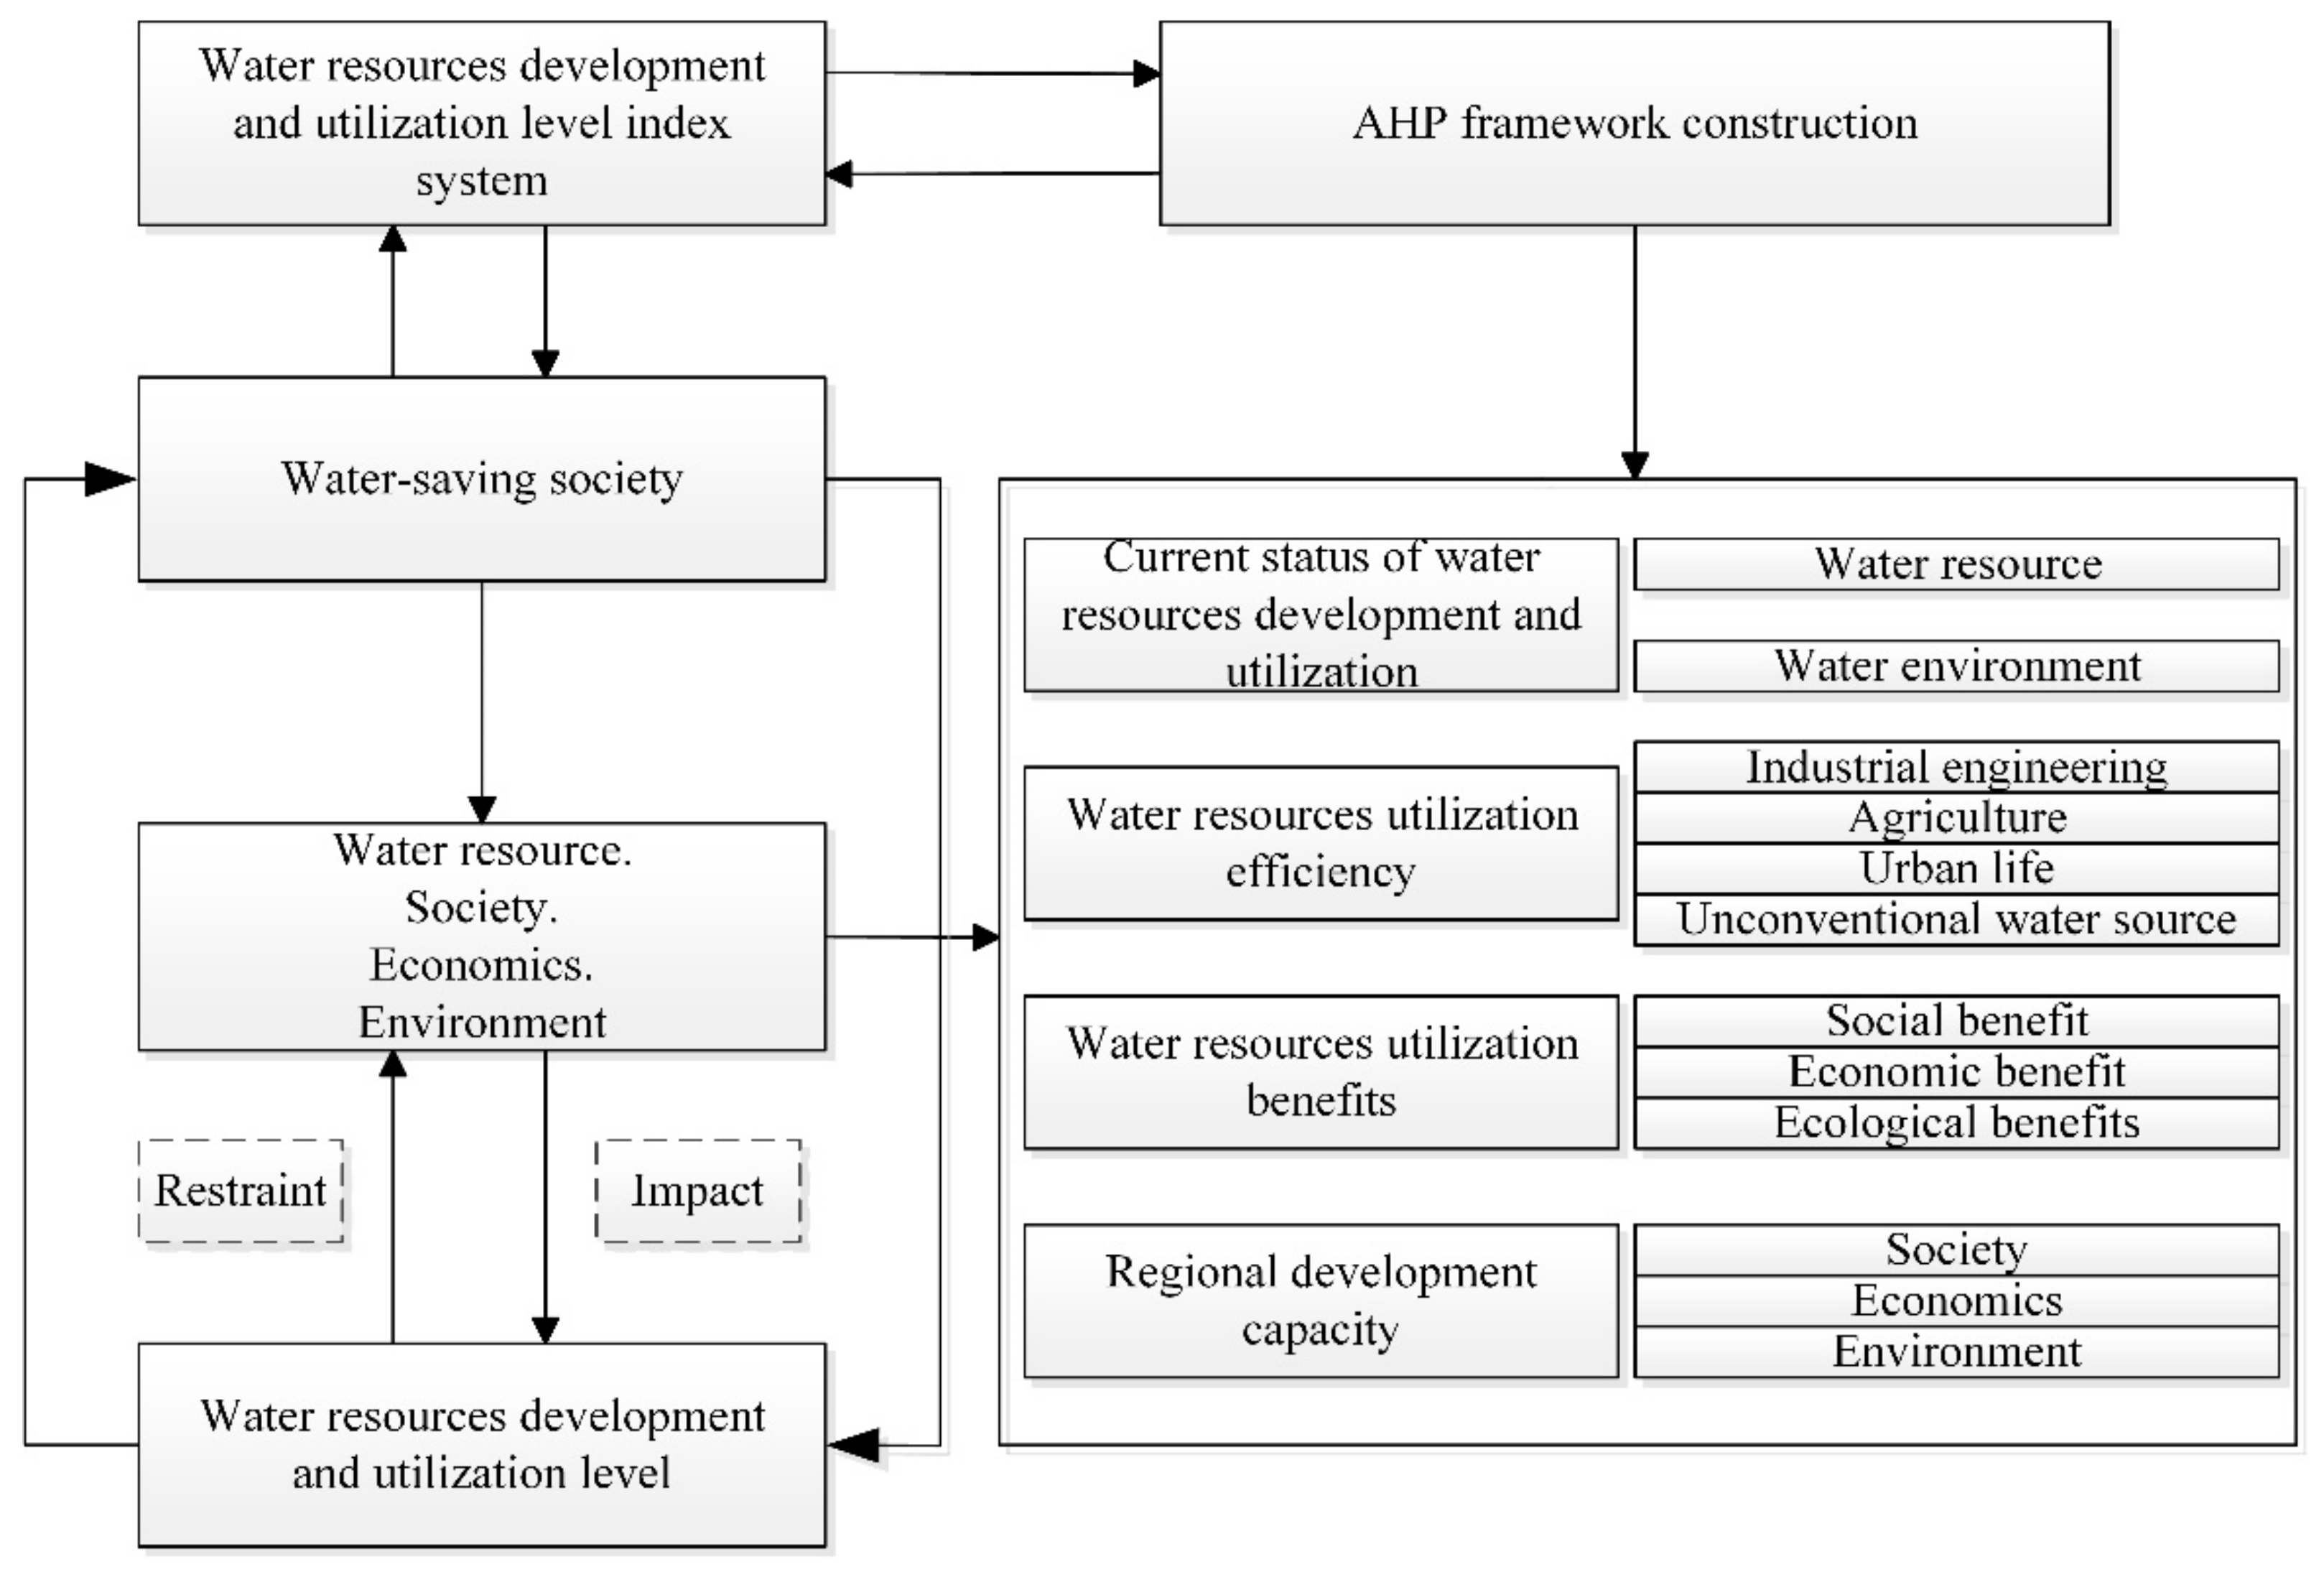
The purpose of this study was to propose a set of scientific and effective index systems for evaluating the level of water resources development and utilization, which has certain guidance significance for different regions. In the process of constructing the criteria layer, we propose a basic framework for the current status of water resources development and utilization, water resources utilization efficiency, water resources utilization benefits and regional development capacity in terms of water resources, social, economic, ecological and other aspects (Figure 1). Not only does it encompass the construction of a water-saving society, but it also fully demonstrates the connotations of the level of water resources development and utilization. The following are descriptions of the criteria layer.
- (1)
- Current status of water resources development and utilization
The current status of water resources development and utilization is a comprehensive reflection of the development and use of water resources and the current status of water resources and the water environment in a region. In this study, it is divided into two components: water resources, which focuses on water quantity and recharge and water environment, which represents the water quality and environmental conditions of the study area. The two are independent and interlinked, and excellent water resources and quality of the water environment are the basis of water resources development and utilization.
- (2)
- Water resources utilization efficiency
Water resources utilization efficiency reflects a region’s ability to conserve and use water. It is a reflection of a region’s water resources management and social policies. The efficient use of water resources in a region depends to a large extent on the efficiency of water use, and this is particularly the case in water-scarce regions. This paper divides them into four areas: industrial, agricultural, urban domestic, etc. and nonconventional water sources.
- (3)
- Water resources utilization benefits
The development and use of water resources by humans can have negative or positive effects on the natural environment while reaping economic and social benefits. Negative benefits, such as pollution of water resources by sewage discharge, reduction in vegetation cover due to the plundering of natural water resources and investment in compliance with sewage standards and environmental protection protocols, will also increase ecological benefits. In this paper, a number of easily accessible and representative indicators are selected to characterize the magnitude of economic, social and ecological benefits.
- (4)
- Regional development capacity.
Regional development capacity is the driving force behind changes in the overall water resources system and is the capacity of human activity and socioeconomic development to constrain the level of water resources development and use. It is pointless to explore water resources development and use without human activity, so regional development capacity is an integral part of the overall framework. This paper divides it into three parts: social, economic and environmental.
2.2. Selection of Indicators
To better integrate the requirements of a water-saving society into the indicator system, the selection process of the indicators must reflect the core requirements of a water-saving society. It is also important to meet the principles of scientificity, harmonization, representativeness and operability at the same time. After a thorough analysis of the background and process of water resources development and utilization, this study selected top-down indicators that can represent the quality of the water environment, the replenishment capacity of water resources, the efficiency of water resources utilization, the social, economic and ecological benefits of water resources utilization, the economic development of the region, the human activities and environmental protection. Each standard tier was selected from 1 to 4 indicators. To ensure the accuracy and representativeness of the indicators, expert consultation and questionnaires were used to validate the specific indicators of the criterion layer, and the specific indicators and descriptions are shown in Table 1. Positive indicators indicate that higher values are more favorable to the evaluation results, while negative indicators imply the opposite.
2.3. Determination of Indicator Weights
In this study, different indicators have different impacts on the level of water resources development and utilization, so it is necessary to determine the weight of each indicator. Because this study involved several systems and indicators, the AHP method was used to determine the weight of each indicator. However, the AHP method relied too much on expert judgment and was too subjective, so the projection pursuit method was introduced. The projection tracing method was based on linear projection to find the vectors that can reflect the high-dimensional data from the data itself. It was an objective evaluation method, and this study used the analytic hierarchy process and projection pursuit (AHP-PP) to determine the combined weights of the indicators.
2.3.1. Analytic Hierarchy Process
The analytic hierarchy process is a decision-making method that decomposes the elements related to decision making into levels, such as objectives, criteria and options, on the basis of which qualitative and quantitative analysis was carried out. The method was proposed by the American operations researcher Saaty [39] in the early 1970s, and its basic steps are as follows:
Define the scope of the problem, understand the factors involved in the problem and determine the relationship between the factors. Divide the factors in the system into different levels according to their characteristics, generally three levels, with the top being the target layer, the middle being the criterion layer and the bottom being the indicator layer.
The AHP method requires the decision maker to make a comparison of the relative importance of the elements of each level, expressed in a judgment matrix, and determine the corresponding level by assigning values (Table 2).
The maximum eigenvalue () of each judgment matrix and its corresponding eigenvector were calculated, and then the consistency and consistency index of the judgment matrix were tested by Equations (1) and (2), respectively.
where CR is the consistency of the judgment matrix. CI is the consistency index. RI is the random consistency index. n is the order of the judgment matrix.
The judgments of the various hierarchies were combined to calculate the eigenvalues of all elements of the current level for all elements of the previous level.
2.3.2. Projection Pursuit Method
Projection tracing is a statistical method for analyzing and processing non-normal high-dimensional data. The basic principle is that computer techniques are used to project high-dimensional data into a low-dimensional subspace. By optimizing the projection objective function, a projection vector [40] reflecting the structure or characteristics of the high-dimensional data is obtained. Therefore, the main steps to study and analyze a projection-seeking integrated evaluation model of high-dimensional data in a low-dimensional subspace are as follows.
- (1)
- Standardization of indicator data
The indicators had different units and were not directly comparable. A followed extreme standard method was adopted [41,42]. It made the indicators directly comparable and unified the range of values for each indicator. Assuming the number of indicators was m and was the -th evaluation indicator, the number of samples was n, and was the -th sample. The initial maximum and minimum values of the corresponding indicators were and , respectively. The overall raw index was ( = 1, 2, …, n; = 1, 2, …, m). The normalized index was ( = 1, 2, …, n; = 1, 2, …, m). The formula was as follows.
For the larger, the better indicator (positive indicators):
For the smaller, the better indicator (negative indicators):
- (2)
- Projected characteristic value
Projecting high-dimensional data into a one-dimensional space, with as a one-dimensional linear projection vector with data dimension p, the projected characteristic value was defined as:
- (3)
- The construction of the projection objective function
In order to construct the objective function, the local density and standard deviation were introduced. The larger is, the more dispersed the projection points. The larger is, the denser the local projection points, and the projection eigenvalue requirement was that the projection points were as dispersed as possible and the local projection points were preferably dense clusters, so the projection indicator function could be constructed as follows:
2.3.3. Determination of Combination Weight
This study used Equation (7) to calculate the combined weights, converting people’s subjective judgments on the influence factors of each element into scientific mathematical processing and expression, so as to make a more accurate quantitative assessment of the evaluation of the level of regional water resources development and utilization. The weight of each indicator obtained by the projection tracing method was combined with the weight of the AHP method obtained by expert scoring. The value of , ranging from 0 to 1. , was considered larger when there was little difference between the weights of the AHP method and smaller when the opposite was true.
2.4. Calculation Method of Weight Sensitivity
When determining the weights of each indicator, uncertainty in each indicator and variable propagates cumulatively because different experts have different perceptions of the same issue and there is uncertainty in the understanding of the indicator system, expert scoring and other aspects. As for the hierarchical analysis method, the criterion weights are the key elements in the calculation of evaluation results, so it is important to conduct sensitivity analysis on the indicator weights to test the evaluation results. Sensitivity analysis is an essential and basic step in the multicriteria decision-making process, because it is directly related to the accuracy and reliability of the decision results.
In this study, the model of this paper was validated using the Sobol method [43,44], which is a global sensitivity analysis method based on variance decomposition, and the hypothetical model is expressed by Equation (8).
where = () is the parameter set of the model. is the objective function value of the model output.
The total variance of the equation can be decomposed into subvariances for a single parameter and multiple parameters as follows.
where is the variance generated by the i-th parameter . Dij is the variance generated by the interaction of parameters xi and xj. D12...p is the variance generated by all parameters together.
After normalizing Equation (9) to obtain Equation (10), the sensitivity parameters of each parameter and each parameter interaction were obtained according to Equation (11).
where Si is the first-order sensitivity. Sij is the second-order sensitivity. is the p-order sensitivity.
The total sensitivity of the i-th parameter was calculated using Equation (12), which represents the sensitivity of all parameters containing the i-th parameter.
3. Case Study
3.1. The Studied Area and Data Sources
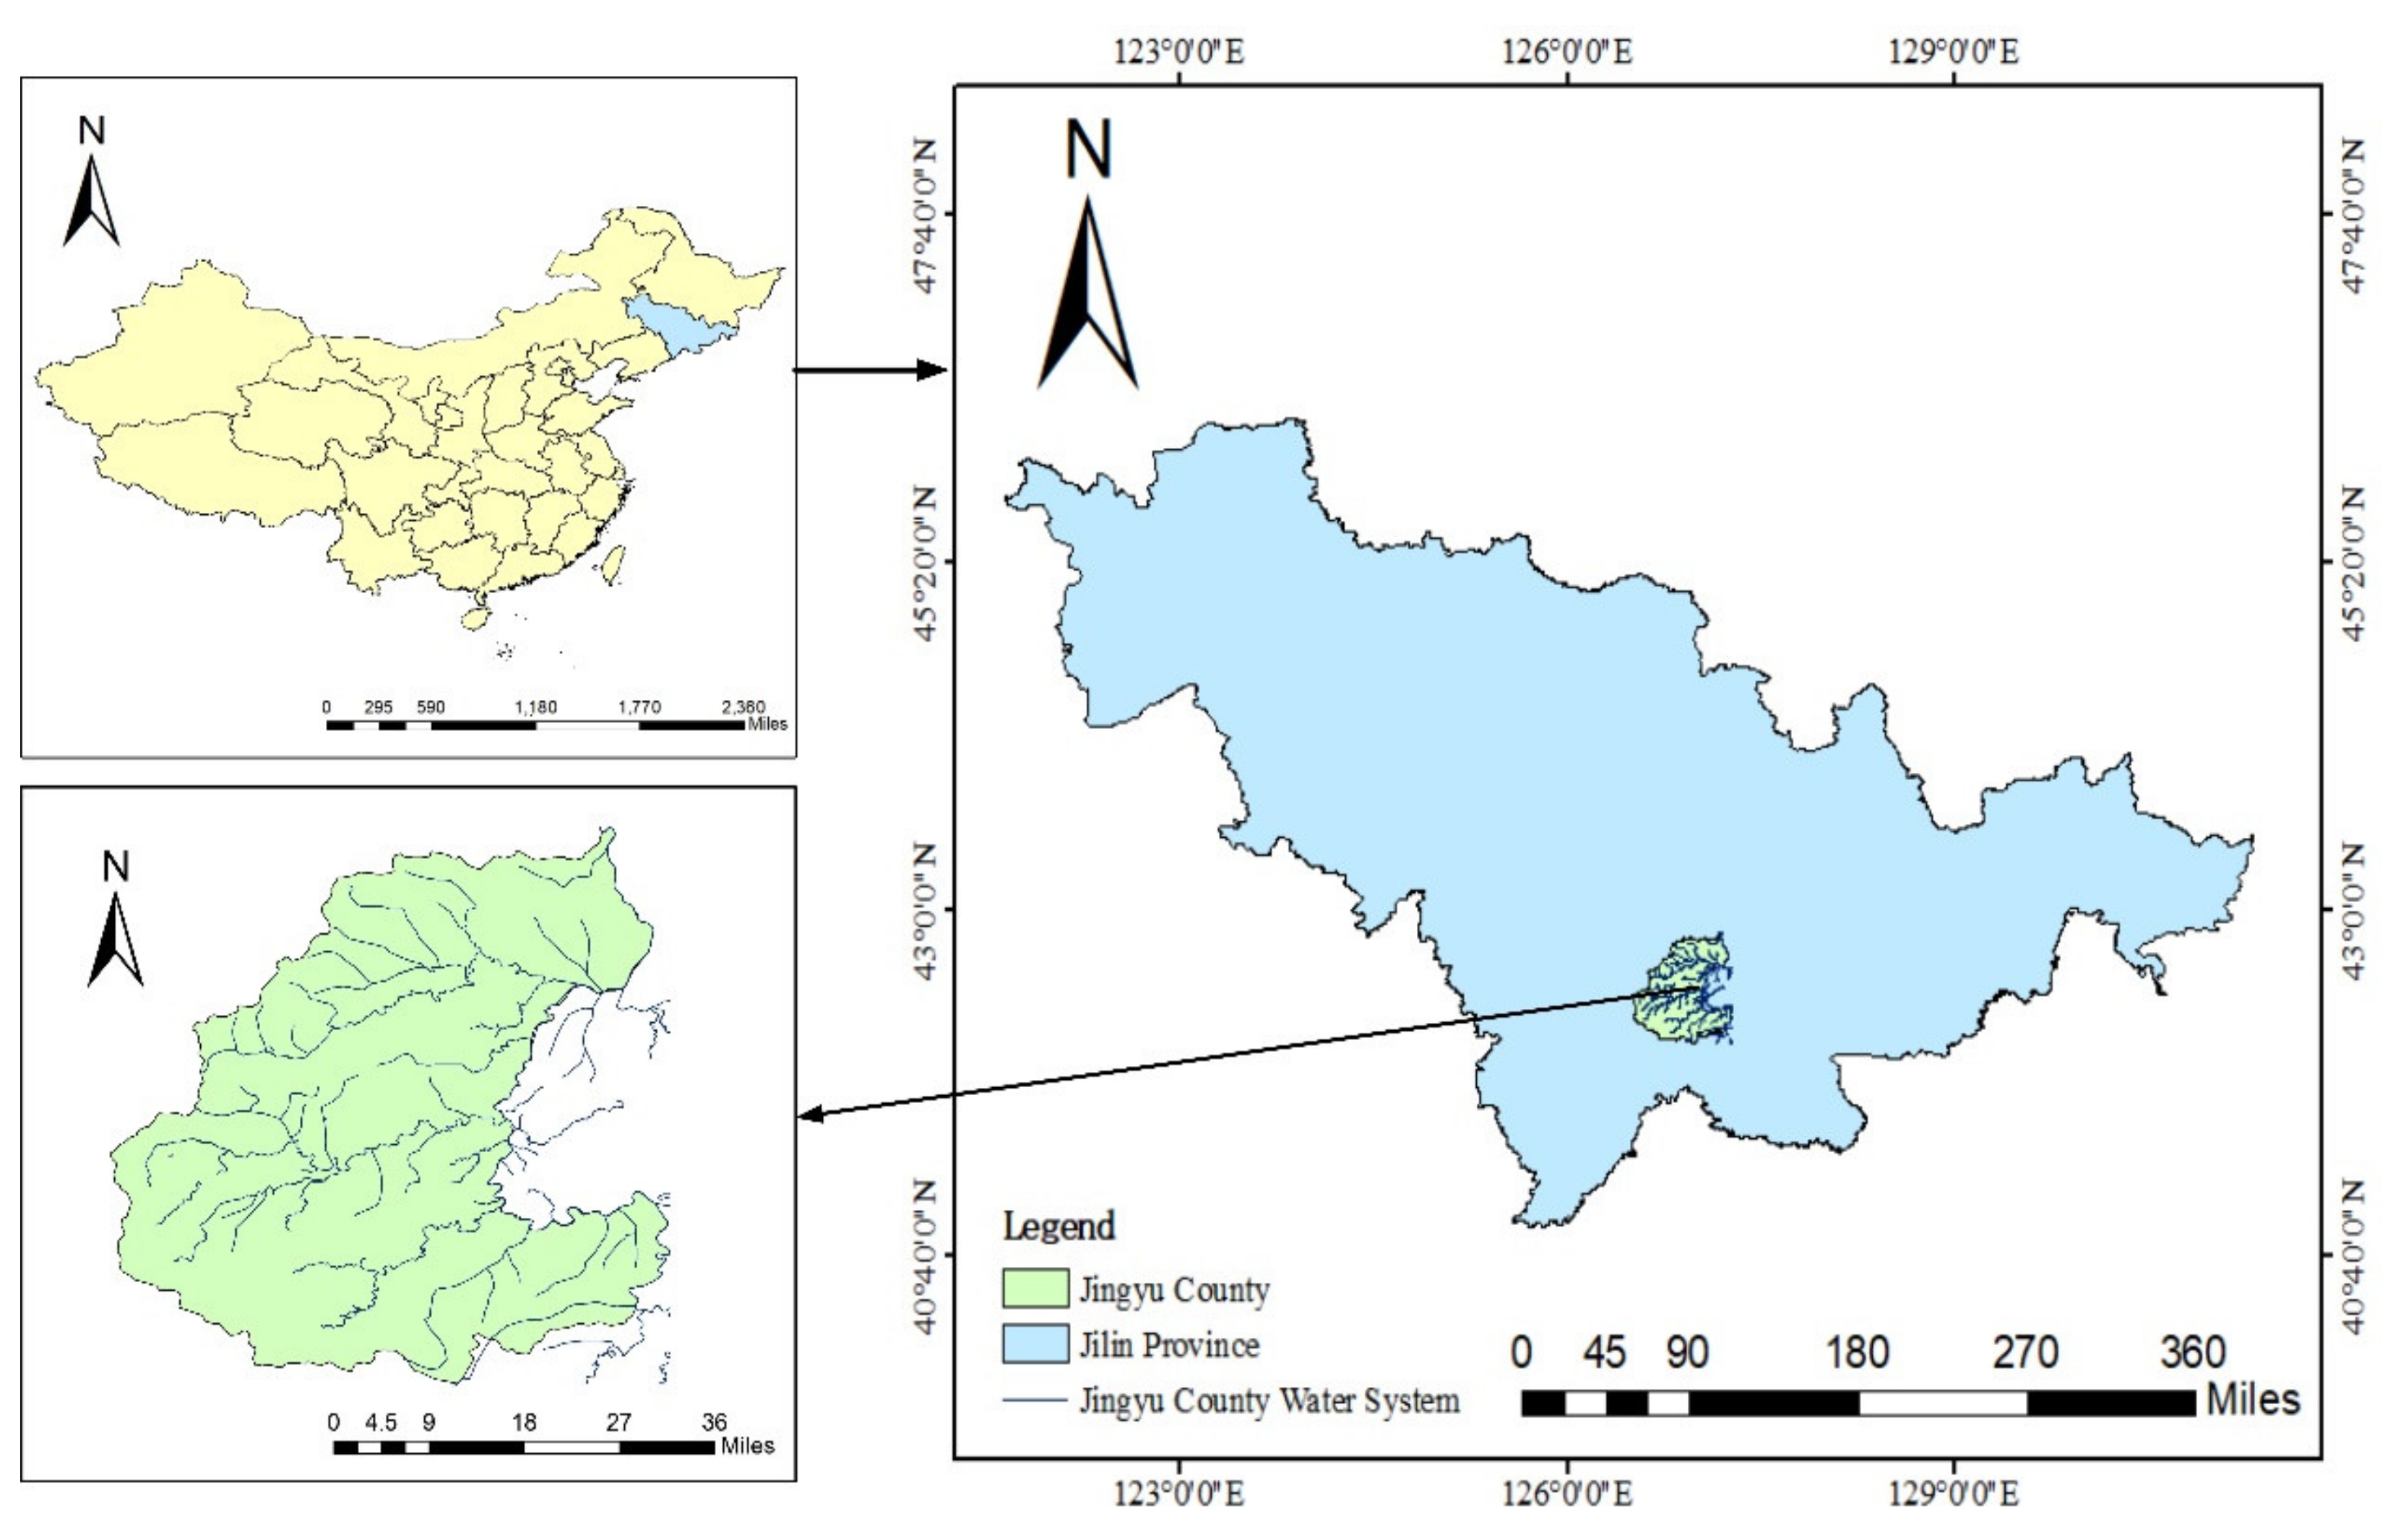
The indicator system and methods of this study were used to evaluate the level of development and utilization in Jingyu County as an example. Jingyu County, known as the ‘First City of Mineral Springs in China’, is located in southeastern Jilin Province and has excellent groundwater and mineral water resources (Figure 2), and the socioeconomic development and high quality of life are benefits of the high quality of water resources. However, at the same time, the water used for toilet flushing and landscaping in the city, which should be using a medium amount of water, is using high-quality groundwater resources, resulting in a waste of water resources. The development of mineral water enterprises and tertiary industries has aggravated the pollution of water resources. The construction of a water-saving society and social development over the past 15 years have improved the local water resources problem to a certain extent, but there are still problems, such as a high leakage rate of the urban water supply network and low exploitation of water resources. These water resources problems have created a contradictory situation in which the water resources in Jingyu County are abundant but the level of water resources development and utilization is too low. The study of Jingyu County can verify the reasonableness of this index system, help the local water resources development and utilization and identify the driving force for the improvement of water resources development and utilization so as to solve this contradictory situation more effectively.
To reflect the effectiveness of water-saving society construction as well as to ensure the integrity of the index data, in this paper, data from the study area from 2009 to 2018 were selected, mainly from the Baishan Water Resources Bulletin, the Jingyu County Statistical Yearbook, the Jingyu County Water Resources Bulletin and relevant local departments and related studies. The normalized data are shown in Table 3.
3.2. Construction of the Study Area Indicator System
As the study area was different, the construction of the indicator system and the selection of indicators also needed to change based on the excellent groundwater and mineral water resources in Jingyu County and the high leakage rate of the urban water supply network. The number of water-producing systems (D5) and the daily extraction of mineral water (D6) were added to the water resources element layer to reflect the replenishment and extraction capacity of the local groundwater resources based on the original indicator system. Because of the high-quality ecological environment of Jingyu County, the proportion of poor V water bodies (A5) in the region is 0, so it was replaced with the proportion of III water bodies (D7). Finally, the total output value of mineral water enterprises was added to the elemental layer of economic benefits to reflect the economic benefits brought about by the development and export of mineral water. The indicator system for evaluating the level of water resources development and utilization in line with the characteristics of the study area and the weights and attributes of the indicators are shown in Table 4.
3.3. Consistency Test and the Choice of Algorithms for Projection Pursuit
In order to ensure the reasonableness of the calculated weights, we conducted a consistency check on the weights of the AHP method. Due to too much data only the CR values of the criterion layers are listed in this paper (Table 5), through the consistency calculation it can be seen that the weights of the AHP method have a certain degree of scientificity and can be subsequently calculated. The projection pursuit model adopts quantum genetic algorithm. Quantum genetic algorithm can overcome the disadvantage of easy local convergence of traditional genetic algorithm, and its accuracy is higher [45].
3.4. Division of Evaluation Grade
To accurately evaluate the level of water resources development and utilization in the study area using the index system of this paper, it is necessary to determine the grading criteria of each index. The grading criteria of this paper (Table 6) are based on the actual situation of water resources, socio-economic development and ecological environment of the study area and combined with the research results of related scholars [46]. Based on this, the grading criteria of the water resources development and utilization level of the study area are determined (Table 7).
3.5. Weight Sensitivity Analysis
In this paper, the sensitivity index of each indicator weight in the study area from 2009 to 2018 was analyzed using the Sobol global sensitivity method to screen the indicators that have the greatest impact on the evaluation results. The indicator system of this study was refined by the uncertainty method to seek the best and most effective tool set.
4. Results and Analysis
4.1. Evaluation Results and Analysis of Water Resources Development and Utilization Level
Figure 3 and Table 8 show the five indicators that have the greatest impact on the level of water resources development and utilization in the study area. They are water consumption of CNY 10,000 GDP (D16), water consumption of CNY 10,000 industrial value added (D11), single-party water production value (D23), GDP per capita (D24) and domestic water consumption per capita (D18). The level of water resources development and utilization in the study area has shown an overall upward trend from 2009 to 2018, with the assessment value increasing from 0.29 in 2009 to 0.74 in 2018 and the evaluation level changing from low development and use level IV to good development and use level I. The increase in level is attributed to improvements in the water resources efficiency and benefits of the subsystem. The significant decrease in the assessment value in 2013–2014 was mainly due to the decrease in the assessment value of the water resources use efficiency and water resources development and use status guideline layers. The analysis of the data shows that the decrease in the amount of water resources available for exploitation (D2), the development and utilization degree of water resources (D3) and the amount of precipitation (D4) are the reasons for the deterioration of the current subsystem of water resources exploitation. While the increase in the amount of water used per CNY 10,000 of industrial value added (D11), the proportion of industrial water use (D12) and the leakage rate of the urban water supply network (D17) lead to a significant decrease in the efficiency of water resources exploitation.
The above analysis illustrates the continued improvement in infrastructure development in Jingyu County and the more comprehensive implementation and enforcement of our water resources management policies, thereby improving the county’s ability to use water resources. In addition, Jingyu County has placed special emphasis on investment in environmental protection and the conservation and intensive use of water resources. These measures have ensured the sustainable use of local environmental conditions and water resources; for example, investment in environmental protection has increased forest cover (D9) and public green space per capita (D22), and the construction of infrastructure has increased the rate of sewage treatment (D10) and reduced COD and ammonia emissions per capita (D28, D29). The future construction of water facilities will ensure that existing water sources meet water quality standards (D8) while replacing existing domestic water supply sources to increase the daily extraction of mineral water and economic efficiency (D6,D26), thus achieving the conservation of high-quality water resources and the intensive use of the overall water supply. However, the degree of water resources development and utilization in Jingyu County (D3) is too low, and the capacity of mineral spring enterprises is not high. The leakage rate of the urban water supply network (D17), the water reuse rate (D19) and the proportion of nonconventional water sources (D20) are far below the national average. Therefore, there is still much room for improvement in the level of water resources development and utilization in Jingyu County.
4.2. Results of Weight Sensitivity Analysis
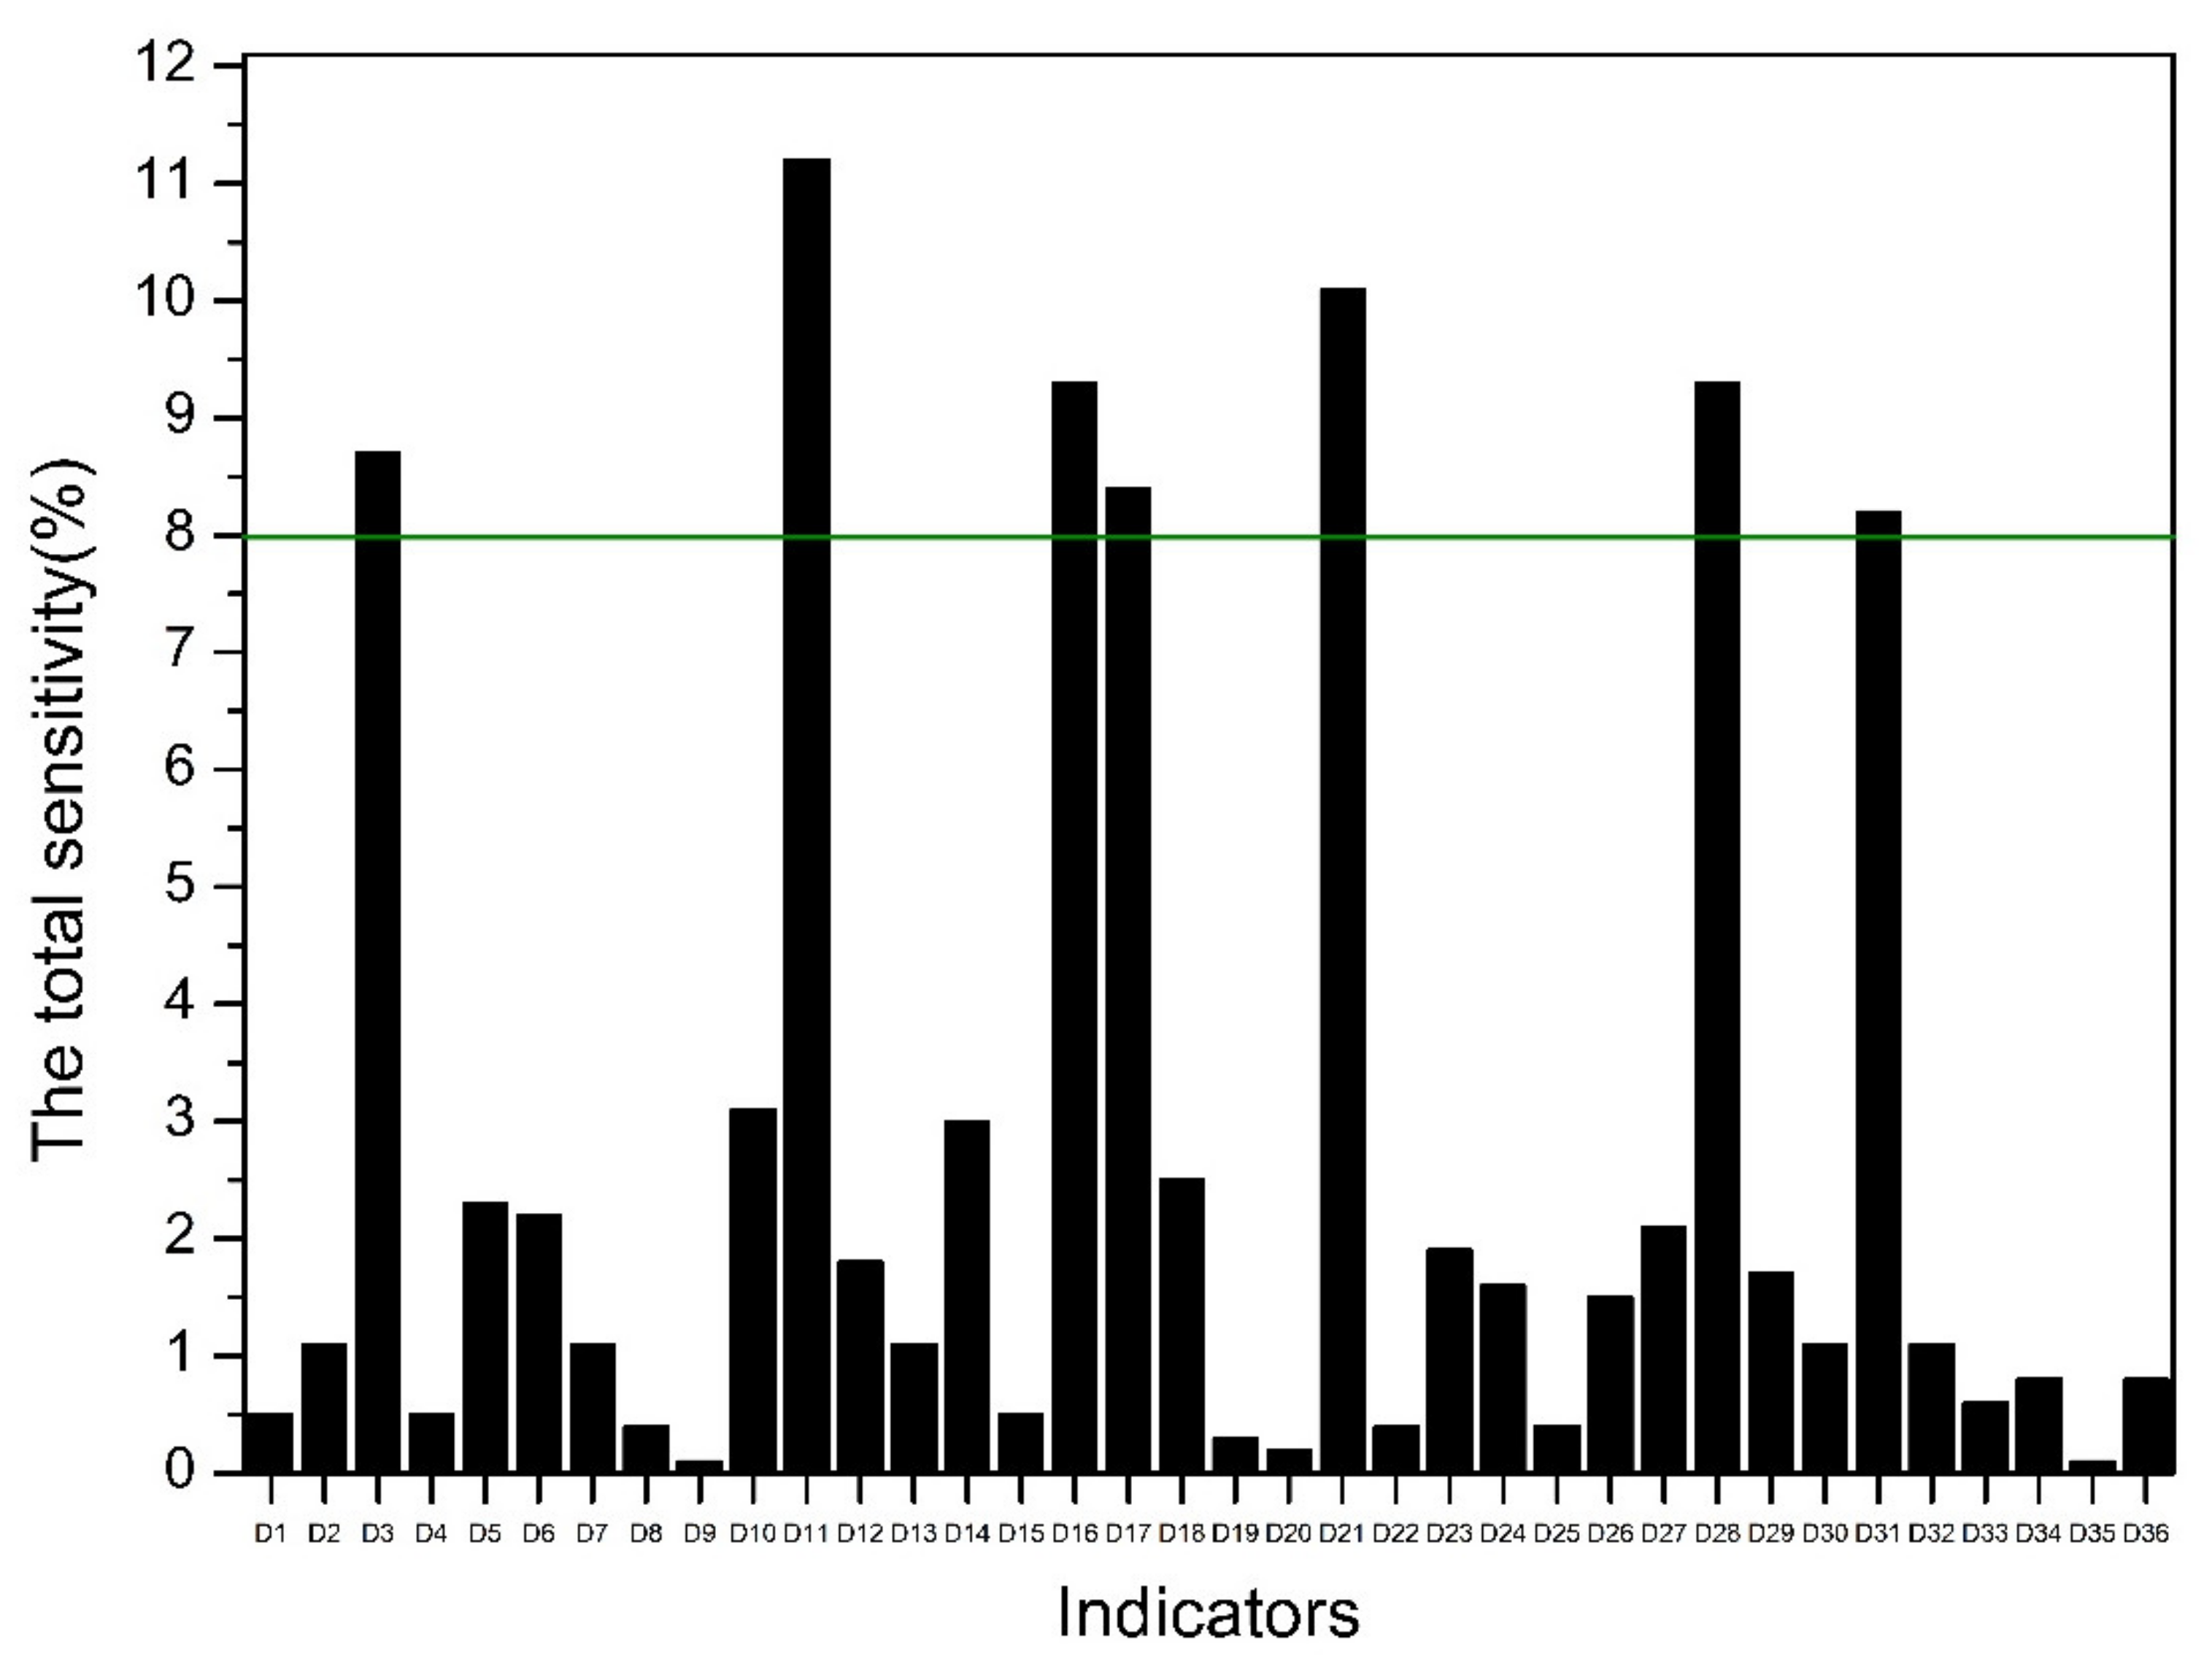
Full-order sensitivities were calculated for each indicator in the study area for the years 2009–2018, and Figure 4 reflects the summed full-order sensitivities for each indicator as a percentage of the total sensitivity (Ts) for each year from 2009 to 2018. In this study, the share of each indicator was considered a sensitivity parameter if it was greater than 8%, and the determination of this threshold was completely subjective. The results show that the sensitivity parameters are D3(development and utilization degree of water resources), D11(water consumption of CNY 10,000 industrial added value), D16(water consumption per CNY 10,000 GDP), D17(leakage rate of urban water supply network), D21(water resources per capita), D28(per capita COD emission) and D31(urbanization rate). Their percentages in the total sensitivity were 8.7%, 11.2%, 9.3%, 8.4%, 10.1%, 9.3% and 8.2%, respectively. They are mostly from the water use efficiency and water use effectiveness subsystems. The above indicates that in the process of applying the index system of this study, more attention should be paid to the sensitivity parameters and the contribution of the water use efficiency and water use effectiveness subsystems. The metrics that were most sensitive to uncertainty changes in weights were water consumption of CNY 10,000 industrial added value, and the least sensitive were D9 forest coverage and D35 environmental protection investment index.
5. Conclusions
In this paper, the concept of water resources development and utilization level and the evaluation index system are proposed from the perspective of a water-saving society. According to the index system of this study, the level of water conservation and water use in cities can be evaluated quantitatively and qualitatively to guide the water efficiency and economic development of cities. In previous water resources evaluation studies, researchers have focused mostly on water resources themselves and their carrying capacity, such as Cui Zhencai’s analysis of the carrying capacity of water resources in Rizhao City [47] and Wang Ge’s prediction of the carrying capacity of water resources in Changchun City [48]. Although the results of these scholars are very helpful for the management and utilization of water resources in cities, the core of concern is the impact of water resources on economic and social development. The concept of water resources exploitation and utilization level in this study is based on sustainable economic and social development and aims to seek the maximum efficiency and effectiveness of urban water resources utilization through different concerns and ways to reflect the interaction between water resources and human society. With modernization and urbanization, the problem of water scarcity and economic development in China is becoming more and more acute. The efficient or inefficient use of water resources has become one of the most decisive factors for China’s rapid economic development [25]. The evaluation results of the index system in this study reflect the regional water use level and provide a theory and reference for the evaluation and judgment of the efficient use of water resources in the region.
This study is also of great significance for the construction of a water-saving society, as the scientific and rational development and utilization of water resources is an indispensable part in the construction process of China’s ‘ecological civilization’. The study of a water-saving society evaluation index system is also becoming more and more mature, but past research has focused more or less on the same social, economic and environmental construction index system [49,50,51]. The authors believe that although the requirements of a water-saving society are constantly changing with socioeconomic development, the core elements will not change. This index system fully considers the core elements of a water-saving society and can dynamically reflect the impact of changes in each index on water resources development and utilization, providing a good basis for the deeper construction of a water-saving society in the future.
This study analyzed the water resources development and utilization level of Jingyu County from 2009 to 2018, and the evaluation results show that there is an obvious trend of improvement in the water resources development and utilization level of Jingyu County, and the evaluation level improved from V in 2009 to II in 2018. The sensitivity analysis shows that the sensitivity parameters are development and the utilization degree of water resources (8.7%), water consumption of CNY 10,000 industrial added value (11.2%), water consumption per CNY 10,000 GDP (9.3%), leakage rate of urban water supply network (8.4%), water resources per capita (10.1%), per capita COD emission (9.3%) and urbanization rate (8.2%). Parameters with high sensitivity to uncertainty of the weights should be the focus of future attention and controlled in future studies, which can increase the accuracy of the evaluation results.
Author Contributions
C.D. writing—original draft and writing—review and editing; J.T. and Z.L. methodology and conceptualization; Y.D. software and resources; Y.Q., Y.Y. and H.L. supervision and validation; D.Z. and Y.W. data curation and resources. All authors have read and agreed to the published version of the manuscript.
Funding
This study was supported by The National Key Research and Development Program of China (2019YFC0409103).
Data Availability Statement
There is no publicly available dataset for this section, and the data for the study area are fieldwork and internally circulated data.
Conflicts of Interest
The authors declare no conflict of interest.
References
- Walter, A.; Cadenhead, N.; Lee, V.S.W.; Dove, C.; Milley, E.; Elgar, M.A. Water as an Essential Resource: Orb Web Spiders Cannot Balance Their Water Budget by Prey Alone. Ethology 2012, 118, 534–542. [Google Scholar] [CrossRef]
- Bigas, H. The Global Water Crisis: Addressing an Urgent Security Issue; United Nations University-Institute for Water, Environment and Health: Hamilton, ON, Canada, 2012. [Google Scholar]
- Cooley, H.; Ajami, N.; Ha, M.-L.; Srinivasan, V.; Morrison, J.; Donnelly, K.; Christian-Smith, J. Global water governance in the twenty-first century. In The World’s Water; Springer: Berlin/Heidelberg, Germany, 2014; pp. 1–18. [Google Scholar]
- Lim, B.; Kwon, J.; Chu, S.; Lee, B.H. Survey on water utilization status and saving mind for water demand management. J. Korean Soc. Water Wastewater 2018, 32, 507–515. [Google Scholar] [CrossRef]
- Otaki, Y.; Otaki, M.; Aramaki, T. Potential of efficient toilets in Hanoi, Vietnam. Water Pract. Technol. 2018, 13, 621–628. [Google Scholar] [CrossRef]
- da Silva, J.K.; Costa Ferreira Nunes, L.G.; Paz Soares, A.E.; da Silva, S.R. Assessment of water-saving equipment to support the urban management of water. RBRH 2017, 22. [Google Scholar] [CrossRef] [Green Version]
- Juniah, R.; Sastradinata, M. Study Benefit Value of Utilization Water Resources for Energy and Sustainable Environment. In Proceedings of the 3rd International Conference on Construction and Building Engineering (ICONBUILD), Palembang, Indonesia, 14–17 August 2017. [Google Scholar]
- Cai, X.; Ringler, C. Balancing agricultural and environmental water needs in China: Alternative scenarios and policy options. Water Policy 2007, 9, 95–108. [Google Scholar] [CrossRef]
- Liu, C.M.; Yu, J.J.; Kendy, E. Groundwater exploitation and its impact on the environment in the North China Plain. Water Int. 2001, 26, 265–272. [Google Scholar]
- Dong, R. Analysis on the construction of water ecological civilization and its evaluation index in China. In Proceedings of the 3rd International Forum on Energy, Environment Science and Materials (IFEESM), Shenzhen, China, 25–26 November 2017; pp. 1944–1950. [Google Scholar]
- Liu, K.; Li, Y.; Wang, P.; Li, H. Research on the construction of domestic ecological civilization cities. In Proceedings of the 2nd International Conference on Energy and Environmental Protection (ICEEP 2013), Guilin, China, 19–21 April 2013; pp. 1967–1970. [Google Scholar]
- Xue, Z.C.; You, J.J.; Qin, C.H.; Jiang, Y.Z. Research on Evaluation Method and Application of Water-saving Society Building Based on Chen Shouyu Fuzzy Set. In Proceedings of the International Conference of Green Buildings and Environmental Management (GBEM), Qingdao, China, 23–25 August 2018. [Google Scholar]
- Guan, X.J.; Meng, Y.; Wu, Z.N. Construction of water resources utilization efficiency evaluation index system based on cloud model. In Proceedings of the 3rd International Conference on Energy, Environment and Sustainable Development (EESD 2013), Shanghai, China, 12–13 November 2013; pp. 2249–2256. [Google Scholar]
- Chi, Y.X.; Xue, L.Q.; Zhang, H. Comprehensive benefit analysis of regional water resources based on multi-objective evaluation. In Proceedings of the 3rd International Conference on Environmental Science and Material Application (ESMA), Chongqing, China, 25–26 November 2017. [Google Scholar]
- Wang, R.L.; Zhang, C.; Ning, P.H. Assessment System about the Ecosystem Water Based on AHP-FPP. In Proceedings of the International Conference on Green Building, Materials and Civil Engineering (GBMCE 2011), Shangri La, China, 22–23 August 2011; pp. 2483–2486. [Google Scholar]
- Men, B.H.; Liu, H.Y. Water resource system vulnerability assessment of the Heihe River Basin based on pressure-state-response (PSR) model under the changing environment. Water Sci. Technol. Water Supply 2018, 18, 1956–1967. [Google Scholar] [CrossRef]
- Hu, C.; Ghen, G.; Lu, X.H. Employing DPSIR Conceptualization and PP Clustering Algorithm to Predict Water Resources Carrying Capacity of River Basins in Fujian, China, in 2020. In Proceedings of the 2nd International Conference on Energy, Environment and Sustainable Development (EESD 2012), Jilin, China, 12–14 October 2012; pp. 2663–2670. [Google Scholar]
- Liu, D.; Zhou, L.H.; Li, H.; Fu, Q.; Li, M.; Faiz, M.A.; Ali, S.; Li, T.X.; Khan, M.I. Optimization of irrigation water use efficiency evaluation indicators based on DPSIR-ISD model. Water Supply 2020, 20, 83–94. [Google Scholar]
- Liang, X.D.; Zhang, R.Y.; Liu, C.M.; Liu, H.Y. Quantitative Measurement of the Sustainable Water Resource Development System in China Inspired by Dissipative Structure Theory. Sustainability 2018, 10, 3996. [Google Scholar] [CrossRef] [Green Version]
- Wei, X.; Wang, J.; Wu, S.; Xin, X.; Wang, Z.; Liu, W. Comprehensive evaluation model for water environment carrying capacity based on VPOSRM framework: A case study in Wuhan, China. Sustain. Cities Soc. 2019, 50, 101640. [Google Scholar] [CrossRef]
- Liu, C.; Wang, R.; Zhang, X.; Cheng, C.; Song, H.; Hu, Y. Comparative Analysis of Water Resources Carrying Capacity Based on Principal Component Analysis in Beijing-Tianjin-Hebei Region from the Perspective of Urbanization. In Proceedings of the International Conference on Materials Science, Resource and Environmental Engineering (MSREE), Xi’an, China, 10–11 December 2016. [Google Scholar]
- Abadi, L.S.K.; Shamsai, A.; Goharnejad, H. An analysis of the sustainability of basin water resources using Vensim model. KSCE J. Civ. Eng. 2015, 19, 1941–1949. [Google Scholar] [CrossRef]
- Zhou, Y. Utilization efficiency and influencing factors of agricultural water resources in Hubei province. Desalination Water Treat. 2019, 168, 201–206. [Google Scholar] [CrossRef]
- Zeinalzadeh, K.; Rezaei, E. Determining spatial and temporal changes of surface water quality using principal component analysis. J. Hydrol. Reg. Stud. 2017, 13, 1–10. [Google Scholar] [CrossRef]
- Zhou, Z.; Zhang, X.; Dong, W. Fuzzy comprehensive evaluation for safety guarantee system of reclaimed water quality. In Proceedings of the 4th International Symposium on Environmental Science and Technology (ISEST), Dalian, China, 4–7 June 2013; pp. 227–235. [Google Scholar]
- Yang, Z.; Song, J.; Cheng, D.; Xia, J.; Li, Q.; Ahamad, M.I. Comprehensive evaluation and scenario simulation for the water resources carrying capacity in Xi’an city, China. J. Environ. Manag. 2019, 230, 221–233. [Google Scholar] [CrossRef]
- Yang, Y.; Liu, J.; Tan, S.; Wang, H. A multi-objective differential evolutionary algorithm for constrained multi-objective optimization problems with low feasible ratio. Appl. Soft Comput. 2019, 80, 42–56. [Google Scholar] [CrossRef]
- Wang, T.; Xu, S. Dynamic successive assessment method of water environment carrying capacity and its application. Ecol. Indic. 2015, 52, 134–146. [Google Scholar] [CrossRef]
- Webb-Robertson, B.J.M.; Jarman, K.H.; Harvey, S.D.; Posse, C.; Wright, B.W. An improved optimization algorithm and a Bayes factor termination criterion for sequential projection pursuit. Chemom. Intell. Lab. Syst. 2005, 77, 149–160. [Google Scholar] [CrossRef]
- Ni, X.; Kang, J.; Wang, G.; Bai, Y. Sensitivity Analysis Method of Uncertainty Based on Conditional Entropy. In Proceedings of the International Conference on Information Engineering for Mechanics and Materials (ICIMM 2013), Hangzhou, China, 5–7 July 2013; pp. 296–302. [Google Scholar]
- Xu, C.; Hu, Y.; Chang, Y.; Jiang, Y.; Li, X.; Bu, R.; He, H. Sensitivity analysis in ecological modeling. Ying Yong Sheng Tai Xue Bao J. Appl. Ecol. 2004, 15, 1056–1062. [Google Scholar]
- Palma-Rodriguez, A.A.; Tlelo-Cuautle, E.; Rodriguez-Chavez, S.; Tan, S.-D. DDD-based symbolic sensitivity analysis of active filters. In Proceedings of the 2012 8th International Caribbean Conference on Devices, Circuits and Systems (ICCDCS), Playa del Carmen, Mexico, 14–17 March 2012; pp. 1–4. [Google Scholar]
- Ge, Y.; Wu, J.; Zhang, D.; Jia, R.; Yang, H. Uncertain Analysis of Fuzzy Evaluation Model for Water Resources Carrying Capacity: A Case Study in Zanhuang County, North China Plain. Water 2021, 13, 2804. [Google Scholar] [CrossRef]
- Ye, J.; Torloni, M.R.; Ota, E.; Jayaratne, K.; Pileggi-Castro, C.; Ortiz-Panozo, E.; Lumbiganon, P.; Morisaki, N.; Laopaiboon, M.; Mori, R. Searching for the definition of macrosomia through an outcome-based approach in low-and middle-income countries: A secondary analysis of the WHO Global Survey in Africa, Asia and Latin America. BMC Pregnancy Childbirth 2015, 15, 324. [Google Scholar] [CrossRef] [Green Version]
- Zhang, C.; Chu, J.; Fu, G. Sobol′’s sensitivity analysis for a distributed hydrological model of Yichun River Basin, China. J. Hydrol. 2013, 480, 58–68. [Google Scholar] [CrossRef] [Green Version]
- Herman, J.; Kollat, J.; Reed, P.; Wagener, T. Method of Morris effectively reduces the computational demands of global sensitivity analysis for distributed watershed models. Hydrol. Earth Syst. Sci. 2013, 17, 2893–2903. [Google Scholar] [CrossRef] [Green Version]
- Beven, K.; Binley, A. The future of distributed models: Model calibration and uncertainty prediction. Hydrol. Processes 1992, 6, 279–298. [Google Scholar] [CrossRef]
- Neumann, M.B. Comparison of sensitivity analysis methods for pollutant degradation modelling: A case study from drinking water treatment. Sci. Total Environ. 2012, 433, 530–537. [Google Scholar] [CrossRef] [PubMed]
- Saaty, T.L. How to make a decision: The analytic hierarchy process. Eur. J. Oper. Res. 1990, 48, 9–26. [Google Scholar] [CrossRef]
- Guo, Q.; Wang, J.Y.; Yin, H.L.; Zhang, G. A comprehensive evaluation model of regional atmospheric environment carrying capacity: Model development and a case study in China. Ecol. Indic. 2018, 91, 259–267. [Google Scholar] [CrossRef]
- Bai, X.R.; Tang, J.C. Ecological Security Assessment of Tianjin by PSR Model. In Proceedings of the Biennial International Conference on Ecological Informatics and Ecosystem Conservation (ISEIS), Beijing, China, 27–29 August 2010; pp. 881–887. [Google Scholar]
- Lu, Y.; Xu, H.; Wang, Y.; Yang, Y. Evaluation of water environmental carrying capacity of city in Huaihe River Basin based on the AHP method: A case in Huai’an City. Water Resour. Ind. 2017, 18, 71–77. [Google Scholar] [CrossRef]
- Soboľ, I.M. Sensitivity estimates for nonlinear mathematical models. Math. Model. Comput. Exp. 1993, 1, 407–414. [Google Scholar]
- Xiaodong, C.; Zongxue, X.; Gang, Z.; Huaimin, L. Sensitivity analysis of SWMM model parameters based on sobol method. J. Hydroelectr. Eng. 2018, 37, 59–68. [Google Scholar]
- Liu, S.; Ba, L. Progress, Application and Prospect of Quantum Genetic Algorithm. In Proceedings of the IEEE International Conference on Electronics and Communication Engineering (ICECE), Xi’an, China, 10–12 December 2018; pp. 65–70. [Google Scholar]
- Hu, J. Study on Evaluation of Water Resources Carrying Capacity in Coastal Regions. Dalian University of Technology, 2018. Available online: https://kns.cnki.net/kcms/detail/detail.aspx?dbcode=CDFD&dbname=CDFD0911&filename=2009040386.nh&uniplatform=NZKPT&v=AS6E2pLHVZnS6k08M2fzXjnCG4OIRRfEHceAiACW1e178STjmCcbnDs08j_jMz58 (accessed on 26 January 2022).
- Cui, Z.; Hu, J.; Zhao, D.; Zhao, H. The Water Resources Carrying Capacity & Strategy Research of Rizhao City. In Proceedings of the International Conference on Energy, Environment and Sustainable Development (ICEESD 2011), Shanghai, China, 21–23 October 2011; pp. 3946–3951. [Google Scholar]
- Wang, G.; Xiao, C.; Qi, Z.; Meng, F.; Liang, X. Development tendency analysis for the water resource carrying capacity based on system dynamics model and the improved fuzzy comprehensive evaluation method in the Changchun city, China. Ecol. Indic. 2021, 122, 107232. [Google Scholar] [CrossRef]
- Chen, J.; Wang, H.; Yang, W. Research on Water-Saving Society Construction Evaluation Based on Grey Incidence Model. In Proceedings of the International Workshop on Computer Science for Environmental Engineering and EcoInformatics (CSEEE), Kunming, China, 29–31 July 2011; pp. 397–402. [Google Scholar]
- Li, Z.L.; Shi, P.Z. A research on water-saving ecosystem and its construction problems. In Proceedings of the 7th International Conference on Environment and Water, Beijing, China, 11–14 October 2004; pp. 640–645. [Google Scholar]
- Liu, D.; Zhang, Q.Y.; Ji, C.M.; Wang, X.G. Study on the operating mechanism of the water-saving society in China. In Proceedings of the 7th International Conference on Environment and Water, Beijing, China, 11–14 October 2004; pp. 897–904. [Google Scholar]
Figure 1.
Key points of index system.

Figure 2.
Administrative map of Jingyu.

Figure 3.
Evaluation value of each part in Jingyu County.

Figure 4.
Sensitivity parameters and other indicators sensitivity percentage. (Those that are above the green line are considered sensitivity parameters.)
Figure 4.
Sensitivity parameters and other indicators sensitivity percentage. (Those that are above the green line are considered sensitivity parameters.)


Table 1.
Indicator system of water resources development and utilization level. (Positive indicators indicate that higher values are more favorable to the evaluation results, while negative indicators imply the opposite).
Table 1.
Indicator system of water resources development and utilization level. (Positive indicators indicate that higher values are more favorable to the evaluation results, while negative indicators imply the opposite).
| Criterion Layer | Element Layer | Serial Number and Index Layer | Description | Attributes |
|---|---|---|---|---|
| Current status of water resources development and utilization | Water resource | A1 Total water resources (m3) | Total surface and underground water volume | Positive |
| A2 Exploitable amount of water resources (m3) | Exploitable capacity of water resources | Positive | ||
| A3 Development and utilization degree of water resources (%) | Proportion of developed water resources | Positive | ||
| A4 Precipitation (mm) | Water resources replenishment capacity | Positive | ||
| Water environment | A5 Proportion of inferior class V water body (%) | Water environment quality | Negative | |
| A6 Standard rate of water quality of water source (%) | Water environment quality | Positive | ||
| A7 Forest coverage (%) | Water environment quality | Positive | ||
| A8 Sewage treatment rate (%) | Sewage treatment level | Positive | ||
| Water resources utilization efficiency | Industrial engineering | A9 Water consumption of CNY 10,000 industrial added value (m3) | Industrial water efficiency | Negative |
| A10 Proportion of industrial water (%) | Industrial water efficiency | Negative | ||
| Agriculture | A11 Effective area of water-saving irrigation farmland (km2) | Agricultural water use efficiency | Positive | |
| A12 Efficiency of irrigation water (%) | Agricultural water use efficiency | Positive | ||
| Urban life | A13 Water meter metering rate (%) | Domestic water efficiency | Positive | |
| A14 Water consumption per CNY 10,000 GDP (10,000 CNY/m3) | Domestic water efficiency | Negative | ||
| A15 Leakage rate of urban water supply network (%) | Water supply efficiency | Negative | ||
| A16 Per capita domestic water consumption (L/d) | Domestic water efficiency | Negative | ||
| Unconventional water source | A17 Reclaimed water reuse rate (%) | Water resources reuse level | Positive | |
| A18 Proportion of unconventional water sources (%) | Water saving capacity | Positive | ||
| Water resources utilization benefits | Economic benefits | A21 Single-party water production value (CNY/m3) | Economic benefits of water resources | Positive |
| A19 Water resources per capita (m3/person) | Social benefits of water resources | Positive | ||
| Social benefits | A20 Per capita public green space area (km2/person) | Social benefits of water resources | Positive | |
| A22 Per capita GDP (CNY) | Economic benefits of water resources | Positive | ||
| A23 Tap water price (CNY) | Economic benefits of water resources | Negative | ||
| Ecological benefits | A24 Water ecosystem service value (CNY 100 million) | Ecological benefits of water resources | Positive | |
| A25 Per capita COD emission (kg) | Negative ecological benefits of water resources | Negative | ||
| A26 Ammonia nitrogen emission per capita (kg) | Negative ecological benefits of water resources | Negative | ||
| Regional development capacity | Society | A27 Population density (people/km2) | Urbanization level | Positive |
| A28 Urbanization rate (%) | Urbanization level | Positive | ||
| A29 Engel coefficient (%) | Urbanization level | Negative | ||
| Economics | A30 Annual GDP growth rate (%) | Economic growth level | Positive | |
| A31 Proportion of tertiary industry in GDP (%) | Economic growth level | Positive | ||
| Environment | A32 Environmental protection investment index (%) | Degree of environmental protection | Positive | |
| A33 Ecological water use rate (%) | Degree of environmental protection | Positive |
Table 2.
Judgment process of analytic hierarchy process.
| Numerical Scale | Definition |
|---|---|
| 1 | Equal importance between two elements |
| 3 | One element is slightly more important than the other |
| 5 | One element is strongly important compared to the other |
| 7 | One element is strongly important compared to another element |
| 9 | One element is absolutely important compared to the other |
| 2, 4, 6, 8 | Intermediate value between two adjacent judgments |
| Reciprocals | If index i specifies one of the above judgments compared to index j, then j has the opposite judgment (inverse value) compared to index i |
Table 3.
Normalized index (The calculation uses Equations (3) and (4)).
| Serial Number and Index | 2009 | 2010 | 2011 | 2012 | 2013 | 2014 | 2015 | 2016 | 2017 | 2018 |
|---|---|---|---|---|---|---|---|---|---|---|
| D1 Total water resources | 0.49 | 0.00 | 0.47 | 0.48 | 0.48 | 0.53 | 0.55 | 0.56 | 0.62 | 1.00 |
| D2 Exploitable amount of water resources | 0.04 | 0.00 | 0.00 | 0.02 | 0.01 | 0.11 | 0.14 | 0.17 | 0.29 | 1.00 |
| D3 Development and utilization degree of water resources | 0.70 | 0.80 | 0.70 | 0.90 | 0.90 | 0.50 | 0.80 | 1.00 | 0.70 | 0.00 |
| D4 Precipitation | 0.05 | 1.00 | 0.00 | 0.39 | 0.62 | 0.12 | 0.12 | 0.37 | 0.04 | 0.60 |
| D5 Water production coefficient | 1.00 | 0.00 | 0.33 | 0.00 | 0.67 | 0.33 | 0.33 | 0.33 | 1.00 | 0.33 |
| D6 Daily mining volume of mineral water | 0.04 | 0.00 | 0.13 | 0.17 | 0.22 | 0.26 | 0.41 | 0.52 | 0.80 | 1.00 |
| D7 Proportion of inferior class III water body | 1.00 | 1.00 | 1.00 | 1.00 | 1.00 | 1.00 | 1.00 | 1.00 | 1.00 | 1.00 |
| D8 Standard rate of water quality of water source | 1.00 | 1.00 | 1.00 | 1.00 | 1.00 | 1.00 | 1.00 | 1.00 | 1.00 | 1.00 |
| D9 Forest coverage | 0.00 | 0.09 | 0.18 | 0.27 | 0.36 | 0.36 | 0.36 | 0.55 | 0.55 | 1.00 |
| D10 Sewage treatment rate | 0.00 | 0.01 | 0.39 | 0.67 | 0.88 | 0.95 | 0.99 | 1.00 | 0.98 | 1.00 |
| D11 Water consumption of CN Y10,000 industrial added value | 0.90 | 0.85 | 0.76 | 0.76 | 0.67 | 0.00 | 0.19 | 0.15 | 0.84 | 1.00 |
| D12 Proportion of industrial water | 1.00 | 0.86 | 0.84 | 0.51 | 0.47 | 0.00 | 0.07 | 0.12 | 0.72 | 0.74 |
| D13 Effective area of water-saving irrigation farmland | 0.00 | 0.01 | 0.16 | 0.23 | 0.53 | 0.67 | 0.72 | 0.83 | 0.94 | 1.00 |
| D14 Efficiency of irrigation water | 0.00 | 0.28 | 0.19 | 0.39 | 0.44 | 1.00 | 0.74 | 0.70 | 0.47 | 0.74 |
| D15 Water meter metering rate | 0.00 | 0.08 | 0.16 | 0.18 | 0.39 | 0.53 | 0.70 | 0.83 | 0.92 | 1.00 |
| D16 Water consumption per CNY 10,000 GDP | 0.00 | 0.36 | 0.58 | 0.77 | 0.80 | 0.87 | 0.91 | 0.92 | 0.82 | 1.00 |
| D17 Leakage rate of urban water supply network | 0.29 | 0.71 | 0.14 | 0.86 | 0.71 | 0.00 | 0.43 | 0.86 | 1.00 | 0.71 |
| D18 Per capita domestic water consumption | 1.00 | 1.00 | 1.00 | 1.00 | 0.50 | 0.50 | 0.50 | 0.00 | 0.00 | 0.00 |
| D19 Reclaimed water reuse rate | 0.00 | 0.00 | 0.00 | 0.00 | 0.00 | 0.00 | 0.00 | 0.00 | 0.00 | 0.00 |
| D20 Proportion of unconventional water sources | 0.00 | 0.00 | 0.00 | 0.00 | 0.00 | 0.00 | 0.00 | 0.00 | 0.00 | 0.00 |
| D21 Water resources per capita | 0.08 | 0.00 | 0.02 | 0.04 | 0.09 | 0.22 | 0.28 | 0.36 | 0.58 | 1.00 |
| D22 Per capita public green space area | 0.00 | 0.96 | 1.00 | 0.70 | 0.47 | 0.32 | 0.45 | 0.43 | 0.27 | 0.67 |
| D23 Single-party water production value | 0.00 | 0.17 | 0.33 | 0.54 | 0.58 | 0.71 | 0.79 | 0.79 | 0.62 | 1.00 |
| D24 Per capita GDP | 0.00 | 0.19 | 0.42 | 0.65 | 0.77 | 0.90 | 0.97 | 1.00 | 0.81 | 0.58 |
| D25 Tap water price | 0.00 | 0.00 | 0.00 | 0.33 | 0.33 | 0.67 | 0.67 | 0.67 | 1.00 | 1.00 |
| D26 Total output value of mineral water enterprises | 0.00 | 0.14 | 0.21 | 0.33 | 0.30 | 0.38 | 0.53 | 0.62 | 0.77 | 1.00 |
| D27 Water ecosystem service value | 0.00 | 0.18 | 0.36 | 0.56 | 0.65 | 0.74 | 0.80 | 0.90 | 0.60 | 1.00 |
| D28 Per capita COD emission | 0.03 | 0.00 | 0.16 | 0.30 | 0.54 | 0.42 | 0.52 | 0.76 | 0.83 | 1.00 |
| D29 Ammonia nitrogen emission per capita | 0.00 | 0.16 | 0.36 | 0.32 | 0.48 | 0.44 | 0.60 | 0.84 | 1.00 | 0.96 |
| D30 Population density | 0.75 | 0.67 | 0.71 | 0.71 | 0.85 | 0.85 | 0.85 | 0.94 | 1.00 | 0.00 |
| D31 Urbanization rate | 0.00 | 0.00 | 0.08 | 0.08 | 0.38 | 0.31 | 0.85 | 0.92 | 0.92 | 1.00 |
| D32 Engel coefficient | 0.00 | 0.12 | 0.07 | 0.19 | 0.48 | 0.85 | 0.88 | 0.86 | 0.88 | 1.00 |
| D33 Annual GDP growth rate | 0.53 | 1.00 | 0.78 | 0.72 | 0.21 | 0.21 | 0.15 | 0.00 | 0.40 | 0.21 |
| D34 Proportion of tertiary industry in GDP | 0.59 | 0.24 | 1.00 | 0.00 | 0.12 | 0.18 | 0.24 | 0.47 | 0.76 | 0.65 |
| D35 Environmental protection investment index | 0.00 | 0.00 | 0.13 | 0.33 | 0.37 | 0.43 | 0.73 | 0.70 | 0.83 | 1.00 |
| D36 Ecological water use rate | 0.69 | 0.69 | 0.63 | 0.69 | 1.00 | 0.88 | 0.00 | 0.13 | 0.31 | 0.31 |
Table 4.
Indicator system of Jingyu County. (Positive indicators indicate that higher values are more favorable to the evaluation results, while negative indicators are the opposite.)
Table 4.
Indicator system of Jingyu County. (Positive indicators indicate that higher values are more favorable to the evaluation results, while negative indicators are the opposite.)
| Criterion Layer | Element Layer | Serial Number & Index Layer | AHP | PP | Combination | Attributes |
|---|---|---|---|---|---|---|
| Current status of water resources development and utilization | Water resource | D1 Total water resources (m3) | 0.0142 | 0.0211 | 0.0183 | Positive |
| D2 Exploitable amount of water resources (m3) | 0.0152 | 0.0141 | 0.0145 | Positive | ||
| D3 Development and utilization degree of water resources (%) | 0.0156 | 0.0266 | 0.0222 | Positive | ||
| D4 Precipitation (mm) | 0.0158 | 0.0112 | 0.0130 | Positive | ||
| D5 Water production coefficient (%) | 0.0135 | 0.0145 | 0.0141 | Positive | ||
| D6 Daily mining volume of mineral water (ton) | 0.0063 | 0.0194 | 0.0141 | Positive | ||
| Water environment | D7 Proportion of inferior class III water body (%) | 0.021 | 0.0187 | 0.0196 | Negative | |
| D8 Standard rate of water quality of water source (%) | 0.0096 | 0.0121 | 0.0111 | Positive | ||
| D9 Forest coverage (%) | 0.0136 | 0.0099 | 0.0113 | Positive | ||
| D10 Sewage treatment rate (%) | 0.0364 | 0.0351 | 0.0356 | Positive | ||
| Water resources utilization efficiency | Industrial engineering | D11 Water consumption of CNY 10,000 industrial added value (m3) | 0.0777 | 0.0911 | 0.0857 | Negative |
| D12 Proportion of industrial water (%) | 0.0389 | 0.0279 | 0.0323 | Negative | ||
| Agriculture | D13 Effective area of water-saving irrigation farmland (km2) | 0.0095 | 0.0127 | 0.0114 | Positive | |
| D14 Efficiency of irrigation water (%) | 0.0286 | 0.0402 | 0.0355 | Positive | ||
| Urban life | D15 Water meter metering rate (%) | 0.0241 | 0.0141 | 0.0181 | Positive | |
| D16 Water consumption per 10,000 CNY GDP (m3/10,000 CNY) | 0.109 | 0.0776 | 0.0901 | Negative | ||
| D17 Leakage rate of urban water supply network (%) | 0.0385 | 0.0542 | 0.0479 | Negative | ||
| D18 Per capita domestic water consumption (L/d) | 0.0687 | 0.0431 | 0.0533 | Negative | ||
| Unconventional water source | D19 Reclaimed water reuse rate (%) | 0.0149 | 0.0202 | 0.0180 | Positive | |
| D20 Proportion of unconventional water sources (%) | 0.0149 | 0.0245 | 0.0206 | Positive | ||
| Water resources utilization benefits | Social benefits | D21 Water resources per capita (m3/person) | 0.0579 | 0.0481 | 0.0520 | Positive |
| D22 Per capita public green space area (km2/person) | 0.0193 | 0.0161 | 0.0174 | Positive | ||
| Economic benefits | D23 Single party water production value (CNY/m3) | 0.0633 | 0.0731 | 0.0691 | Positive | |
| D24 Per capita GDP (CNY) | 0.0609 | 0.0575 | 0.0589 | Positive | ||
| D25 Tap water price (CNY) | 0.0098 | 0.0171 | 0.0142 | Negative | ||
| D26 Total output value of mineral water enterprises (100 million CNY) | 0.0203 | 0.0311 | 0.0268 | Positive | ||
| Ecological benefits | D27 Water ecosystem service value (100 million CNY) | 0.025 | 0.034 | 0.0304 | Positive | |
| D28 Per capita COD emission (kg) | 0.0108 | 0.0144 | 0.0129 | Negative | ||
| D29 Ammonia nitrogen emission per capita (kg) | 0.0028 | 0.0076 | 0.0057 | Negative | ||
| Regional development capacity | Society | D30 Population density (people/km2) | 0.0094 | 0.0056 | 0.0071 | Positive |
| D31 Urbanization rate (%) | 0.0216 | 0.0121 | 0.0159 | Positive | ||
| D32 Engel coefficient (%) | 0.0247 | 0.0084 | 0.0149 | Negative | ||
| Economics | D33 Annual GDP growth rate (%) | 0.0425 | 0.0305 | 0.0353 | Positive | |
| D34 Proportion of tertiary industry in GDP (%) | 0.0213 | 0.0199 | 0.0204 | Positive | ||
| Environment | D35 Environmental protection investment index (%) | 0.0162 | 0.0255 | 0.0218 | Positive | |
| D36 Ecological water use rate (%) | 0.0081 | 0.0107 | 0.0096 | Positive |
Table 5.
Consistency test of analytic hierarchy process element layer.
| Serial Number | Element Layer | CR Value | Judgment |
|---|---|---|---|
| E1 | Water resource | 0 | <0.1 |
| E2 | Water environment | 0.067 | <0.1 |
| E3 | Industrial engineering | 0 | <0.1 |
| E4 | Agriculture | 0.081 | <0.1 |
| E5 | Urban life | 0.035 | <0.1 |
| E6 | Unconventional water source | 0 | <0.1 |
| E7 | Social benefits | 0.001 | <0.1 |
| E8 | Economic benefits | 0.062 | <0.1 |
| E9 | Economic benefits | 0.017 | <0.1 |
| E10 | Society | 0 | <0.1 |
| E11 | Economics | 0.024 | <0.1 |
| E12 | Environment | 0 | <0.1 |
Table 6.
Grading criteria and criteria sources of JingYu County indicators.
| Indicators & Units | Grading Criteria | Criteria Sources | ||||
|---|---|---|---|---|---|---|
| V | IV | III | II | I | ||
| D1 Total water resources (100 million m3) | <10 | 10–15 | 15–20 | 20–25 | >25 | Jingyu County Water Resources Bulletin |
| D2 Exploitable amount of water resources (100 million m3) | <5 | 5–8 | 8–11 | 11–15 | >15 | Jingyu County Water Resources Bulletin |
| D3 Development and utilization degree of water resources (%) | <1 | 1–4 | 4–7 | 7–10 | >10 | Jingyu County Water Resources Bulletin |
| D4 Precipitation (mm) | <300 | 300–600 | 600–800 | 800–1000 | >1200 | Jingyu County Water Resources Bulletin |
| D5 Water production coefficient (%) | <0.1 | 0.1–0.2 | 0.2–0.5 | 0.5–0.6 | >0.6 | JingYu County Groundwater Investigation Report |
| D6 Daily mining volume of mineral water (kiloton) | <10 | 10–17 | 17–24 | 24–30 | >30 | Jingyu County Statistical Yearbook and Water Resources Bulletin |
| D7 Proportion of inferior class III water body (%) | >50 | 40–50 | 30–40 | 20–30 | <20 | Jingyu County Water Resources Bulletin |
| D8 Standard rate of water quality of water source (%) | <40 | 40–55 | 55–65 | 65–80 | >80 | Jingyu County Water Resources Bulletin |
| D9 Forest coverage (%) | <40 | 40–55 | 55–65 | 65–80 | >80 | Jingyu County Statistical Yearbook |
| D10 Sewage treatment rate (%) | <40 | 40–55 | 55–70 | 70–95 | >95 | Jingyu County Water Resources Bulletin |
| D11 Water consumption of 10,000 CNY industrial added value (m3) | >200 | 90–200 | 30–90 | 10–30 | <10 | JingYu County Water Resources Bulletin and Future Planning |
| D12 Proportion of industrial water (%) | >60 | 50–60 | 40–50 | 30–40 | <30 | Jingyu County Water Resources Bureau |
| D13 Effective area of water-saving irrigation farmland (km2) | <20 | 20–33 | 33–47 | 47–60 | >60 | Baishan Bureau of Statistics and Water Resources Bulletin |
| D14 Efficiency of irrigation water (%) | <30 | 30–40 | 40–60 | 60–80 | >80 | Baishan Bureau of Statistics and Water Resources Bulletin |
| D15 Water meter metering rate (%) | <60 | 60–70 | 70–80 | 80–90 | >90 | Jingyu County Water Resources Bureau |
| D16 Water consumption per CNY 10,000 GDP (10,000 CNY/m3) | >1050 | 600–1050 | 140–600 | 25–140 | <25 | JingYu County Water Resources Bulletin and Future Planning |
| D17 Leakage rate of urban water supply network (%) | >60 | 35–60 | 15–35 | 10–15 | <10 | Jingyu County Government Annual Report |
| D18 Per capita domestic water consumption (L/d) | >130 | 130–110 | 90–110 | 70–90 | <70 | Jingyu County Water Resources Bulletin |
| D19 Reclaimed water reuse rate (%) | <10 | 10–40 | 40–60 | 60–90 | >90 | Jingyu County Water Resources Bureau |
| D20 Proportion of unconventional water sources (%) | <0.8 | 0.8–1.85 | 1.85–2.9 | 2.9–4 | >4 | JingYu County Future Planning |
| D21 Water resources per capita (10,000 m3/person) | <0.6 | 06–0.9 | 0.9–1.2 | 1.2–1.5 | >1.5 | Jingyu County Water Resources Bureau |
| D22 Per capita public green space area (km2/person) | <3 | 3–5 | 5–7 | 7–10 | >10 | Jingyu County Government Annual Report |
| D23 Single-party water production value (CNY/m3) | <10 | 10–50 | 50–100 | 100–200 | >200 | Jingyu County Government Annual Report and Water Resources Bureau |
| D24 Per capita GDP (CNY 10,000) | <0.65 | 0.65–2.6 | 2.6–3.9 | 3.9–8 | >8 | Baishan and Jingyu County Bureau of Statistics |
| D25 Tap water price (CNY) | >4.5 | 3.6–4.5 | 2.8–3.6 | 2–2.8 | <2 | Jingyu County Water Resources Bureau |
| D26 Total output value of mineral water enterprises (CNY 100 million) | <10 | 10–20 | 20–30 | 30–40 | >50 | Jingyu County Bureau of Statistics |
| D27 Water ecosystem service value (CNY 100 million) | <30 | 30–43 | 43–57 | 57–70 | >70 | Ecological Value Assessment Report for Jing Yu County |
| D28 Per capita COD emission (kg) | <200 | 200–233 | 233–267 | 267–300 | >300 | Jingyu County Water Resources Bulletin |
| D29 Ammonia nitrogen emission per capita (kg) | <0.4 | 0.4–0.5 | 0.5–0.6 | 0.6–0.7 | >0.7 | Jingyu County Water Resources Bulletin |
| D30 Population density (people/km2) | <20 | 20–30 | 30–40 | 40–50 | >50 | Baishan Bureau of Statistics |
| D31 Urbanization rate (%) | <20 | 20–35 | 35–50 | 50–70 | >70 | Jingyu County Government Annual Report |
| D32 Engel coefficient (%) | >0.6 | 0.5–0.6 | 0.4–0.5 | 0.3–0.4 | <0.3 | Baishan Bureau of Statistics |
| D33 Annual GDP growth rate (%) | <2 | 2–4 | 4–6 | 6–7 | >7 | Jingyu County Government and Bureau of Statistics Annual Report |
| D34 Proportion of tertiary industry in GDP (%) | <20 | 20–30 | 30–40 | 40–50 | >50 | Jingyu County Government and Bureau of Statistics Annual Report |
| D35 Environmental protection investment index (%) | <0.1 | 0.1–0.5 | 0.5–1 | 1–1.5 | >1.5 | Annual Report of Jingyu County Government and Baishan Ecological Environment Bureau |
| D36 Ecological water use rate (%) | <2 | 2–4 | 4–6 | 6–8 | >8 | Annual Report of Jingyu County Government |
Table 7.
Grading of water resources development and use levels.
| Index Value | Grade | Comprehensive Evaluation |
|---|---|---|
| 0–0.3 | V | The level of water resources development and use is low, urban infrastructure construction is not perfect, water resources are mainly used in a simple way, lack of protection and serious environmental pollution. |
| 0.3–0.5 | IV | Low level of water resources development and use, some problems in the ecological environment, low investment in environmental protection |
| 0.5–0.7 | III | Medium level of water resources development and use, low environmental quality, problems in water resources management, and lack of obvious response to national water resources policy |
| 0.7–0.8 | II | Good level of water resources exploitation, green and healthy ecological environment, recyclable economic development, but still some room for improvement |
| 0.8–1 | I | Excellent level of water resources development and utilization, reasonable water use structure, sustainable water resources and society. High investment in environmental protection and well-developed infrastructure. |
Table 8.
Development and utilization level data 2009–2018 for Jingyu County.
| 2009 | 2010 | 2011 | 2012 | 2013 | 2014 | 2015 | 2016 | 2017 | 2018 | |
|---|---|---|---|---|---|---|---|---|---|---|
| Comprehensive evaluation value | 0.29 | 0.40 | 0.45 | 0.53 | 0.54 | 0.48 | 0.56 | 0.58 | 0.67 | 0.76 |
| C1 Current situation of water resources development and utilization | 0.07 | 0.06 | 0.08 | 0.09 | 0.12 | 0.10 | 0.11 | 0.12 | 0.13 | 0.14 |
| C2 Water resources utilization efficiency | 0.18 | 0.23 | 0.22 | 0.26 | 0.23 | 0.16 | 0.20 | 0.19 | 0.26 | 0.29 |
| C3 Water resources utilization benefits | 0.00 | 0.05 | 0.09 | 0.13 | 0.14 | 0.17 | 0.19 | 0.21 | 0.19 | 0.26 |
| C4 Regional development capacity | 0.04 | 0.05 | 0.06 | 0.05 | 0.05 | 0.05 | 0.06 | 0.06 | 0.09 | 0.08 |
Publisher’s Note: MDPI stays neutral with regard to jurisdictional claims in published maps and institutional affiliations. |
© 2022 by the authors. Licensee MDPI, Basel, Switzerland. This article is an open access article distributed under the terms and conditions of the Creative Commons Attribution (CC BY) license (https://creativecommons.org/licenses/by/4.0/).
Share and Cite
MDPI and ACS Style
Dai, C.; Tang, J.; Li, Z.; Duan, Y.; Qu, Y.; Yang, Y.; Lyu, H.; Zhang, D.; Wang, Y. Index System of Water Resources Development and Utilization Level Based on Water-Saving Society. Water 2022, 14, 802. https://doi.org/10.3390/w14050802
AMA Style
Dai C, Tang J, Li Z, Duan Y, Qu Y, Yang Y, Lyu H, Zhang D, Wang Y. Index System of Water Resources Development and Utilization Level Based on Water-Saving Society. Water. 2022; 14(5):802. https://doi.org/10.3390/w14050802
Chicago/Turabian StyleDai, Ce, Jie Tang, Zhaoyang Li, Yucong Duan, Yunke Qu, Yao Yang, Hang Lyu, Dan Zhang, and Yongtai Wang. 2022. "Index System of Water Resources Development and Utilization Level Based on Water-Saving Society" Water 14, no. 5: 802. https://doi.org/10.3390/w14050802
Note that from the first issue of 2016, this journal uses article numbers instead of page numbers. See further details here.