
Size–Abundance Relationships of Freshwater Macroinvertebrates in Two Contrasting Floodplain Channels of Rhone River


1
Department F.-A. Forel for Environmental and Aquatic Sciences, Institute for Environmental Sciences, University of Geneva, 66 Boulevard Carl-Vogt, CH-1205 Geneva, Switzerland
2
Department of Biological and Environmental Sciences and Technologies, University of Salento, Via Monteroni, Ecotekne, 73100 Lecce, Italy
3
Ecology and Fluvial Hydrosystems Laboratory, University Claude Bernard Lyon 1, 69100 Villeurbanne, France
*
Author to whom correspondence should be addressed.
Water 2022, 14(5), 794; https://doi.org/10.3390/w14050794
Submission received: 31 January 2022
/
Revised: 25 February 2022
/
Accepted: 26 February 2022
/
Published: 3 March 2022
(This article belongs to the Topic Aquatic Ecological Monitoring and Wastewater Treatment in Agricultural Systems)
Abstract
:Body size is perhaps the most fundamental property of an organism and its relationship with abundance is one of the most studied relationships in ecology. Although numerous studies have examined these relationships in local communities, few have investigated how they vary at different temporal and spatial scales. We investigated the relationship between body size and abundance of local macroinvertebrate communities in two floodplain channels of the French upper Rhone River. The two channels differ in their vegetation coverage (high vs. low vegetation) and hydrological regimes. The shapes of the size–abundance relationship were similar between channels on a yearly basis but differed when compared between months. The variation in local size–abundance relationships between months was related to variation in the functional diversity across time. Our findings suggest that local size–abundance relationships are able to quantitatively describe temporal changes in community structure, showing the importance of relating diversity with ecosystem function in a more realistic context.
1. Introduction
Body size is a key component of the diversity and structure of animal assemblages [1,2] as it encapsulates many ecological traits of species [3,4]. One of the most important relationships of body size is with abundance, as recognized in both terrestrial and aquatic ecology [5,6,7]. The relationship between body size and abundance, according to Damuth’s Rule, scales with a scaling exponent of −0.75 [8,9,10]. Body size (or mass) is also related to metabolic rate with a scaling exponent of 0.75 (i.e., metabolic theory in ecology (MTE) [11]). Furthermore, body size of the species is negatively related to abundance at the scale of local to global communities. Such size–abundance relationships [7] have remained at the core of our understanding of ecology for more than 20 years [12,13,14,15,16].
The power function of −0.75 implies that the total energy or resource used (as a function of abundance and metabolism) by all the different-sized species is independent of their body size, known as the “energetic equivalence hypothesis (EER)” [17]. This pattern of size–abundance relationships has been confirmed using global-scale data sets compiled from the literature, such as the global size–abundance relationship (GSDR following [7]). However, these studies are observational and are subject to the normal limitations of an observational study, making it difficult to draw strong conclusions of the mechanisms that control size–abundance relationships. Indeed, other studies suggest that using smaller scales data sets (i.e., local communities’ data [18,19]), such as local size–abundance relationships (LSDR following [7]) may better reveal the mechanisms underlying size–abundance relationships.
Relationships of this sort have also been widely studied in aquatic ecosystems [20,21,22] for diverse types of communities in various habitats, such as rocky intertidal pool [23], stream [24], pond [25] and lagoon [26] communities. The LSDRs often show deviations from the expected power–law relationships with slopes shallower than −0.75 [6,27,28,29]. Indeed, it has been observed that the size–frequency distributions generally exhibit a right-skewed pattern [30] with more small-sized species and fewer large-sized ones than predicted [31]. This has been described as a ‘polygonal’ size–abundance relationship with abundance peaking at small body sizes and species with low abundance being equally represented across all body sizes. Applying the logic of the “energetic equivalence hypothesis”, these deviations imply that the species present in such a local community use unequal amounts of energy [8,9,17].
This deviation of LSDR from the EER observed mostly in aquatic ecosystems may be related to abiotic and biotic factors in aquatic ecosystems. This is because body size is closely related to physical, morphological and hydrological constraints, and thus habitat complexity in aquatic ecosystems [32]. Specifically, previous studies have shown that habitat complexity is the main driver of macroinvertebrate species’ body size. For example, temporal and spatial body size patterns of aquatic macroinvertebrates may be influenced by: 1. physicochemical fluctuations [33], 2. physical characteristics, such as substrate types, grain size and water flow [34], and 3. biotic characteristics, such as vegetation coverage [35]. Furthermore, habitat complexity plays an important role in determining functional diversity across time and space [36,37]. If such variability among habitat complexities is related to species’ body size, then this variation may result in deviation of an LSDR slope from −0.75.
Although many LSDR studies demonstrate data which vary temporally (i.e., daily, weekly, monthly and yearly), few of them have considered the spatial variation that occurs at different scales [19,22]. Indeed, how the relationships between body size and abundance of local communities vary temporally, spatially and across functional diversity is poorly understood [33]. Documenting LSDR across a wide range of diversity functions and spatial and temporal scales is a step forward in understanding the relationship between biodiversity and ecosystem functioning at spatiotemporal scales. Here, we tested relationships between body size and abundance for local macroinvertebrate communities (i.e., LSDR) in two different floodplain channels of the Rhone River.
The two selected channels show differences in aquatic vegetation cover and hydrological regimes that, we suppose, modify the transfer of energy in these habitats. Furthermore, in floodplain habitats, benthic macroinvertebrates occur frequently and are functionally diverse, especially regarding feeding groups and are associated with hydrology. Because of their dynamic nature and temporal fluctuations, floodplain habitats allow us to understand how their LSDR vary temporally through the four months of high production and under different flow conditions. Hence, the main goal of our study is to identify the shape of LSDR communities between two distinct floodplains and to discover temporal or spatial differences across a spectrum of functional diversity of macroinvertebrates. Macroinvertebrate species present a high functional diversity that allows them to be categorized into functional feeding groups based on their diverse morphological and behavioral functions that characterize the ways they acquire food [38,39]. This functional diversity is strongly related to the habitat or ecosystem type where they live, making the invertebrates sensitive to environmental conditions depending on their taxonomy and traits.
2. Materials and Methods
2.1. Studied Sites
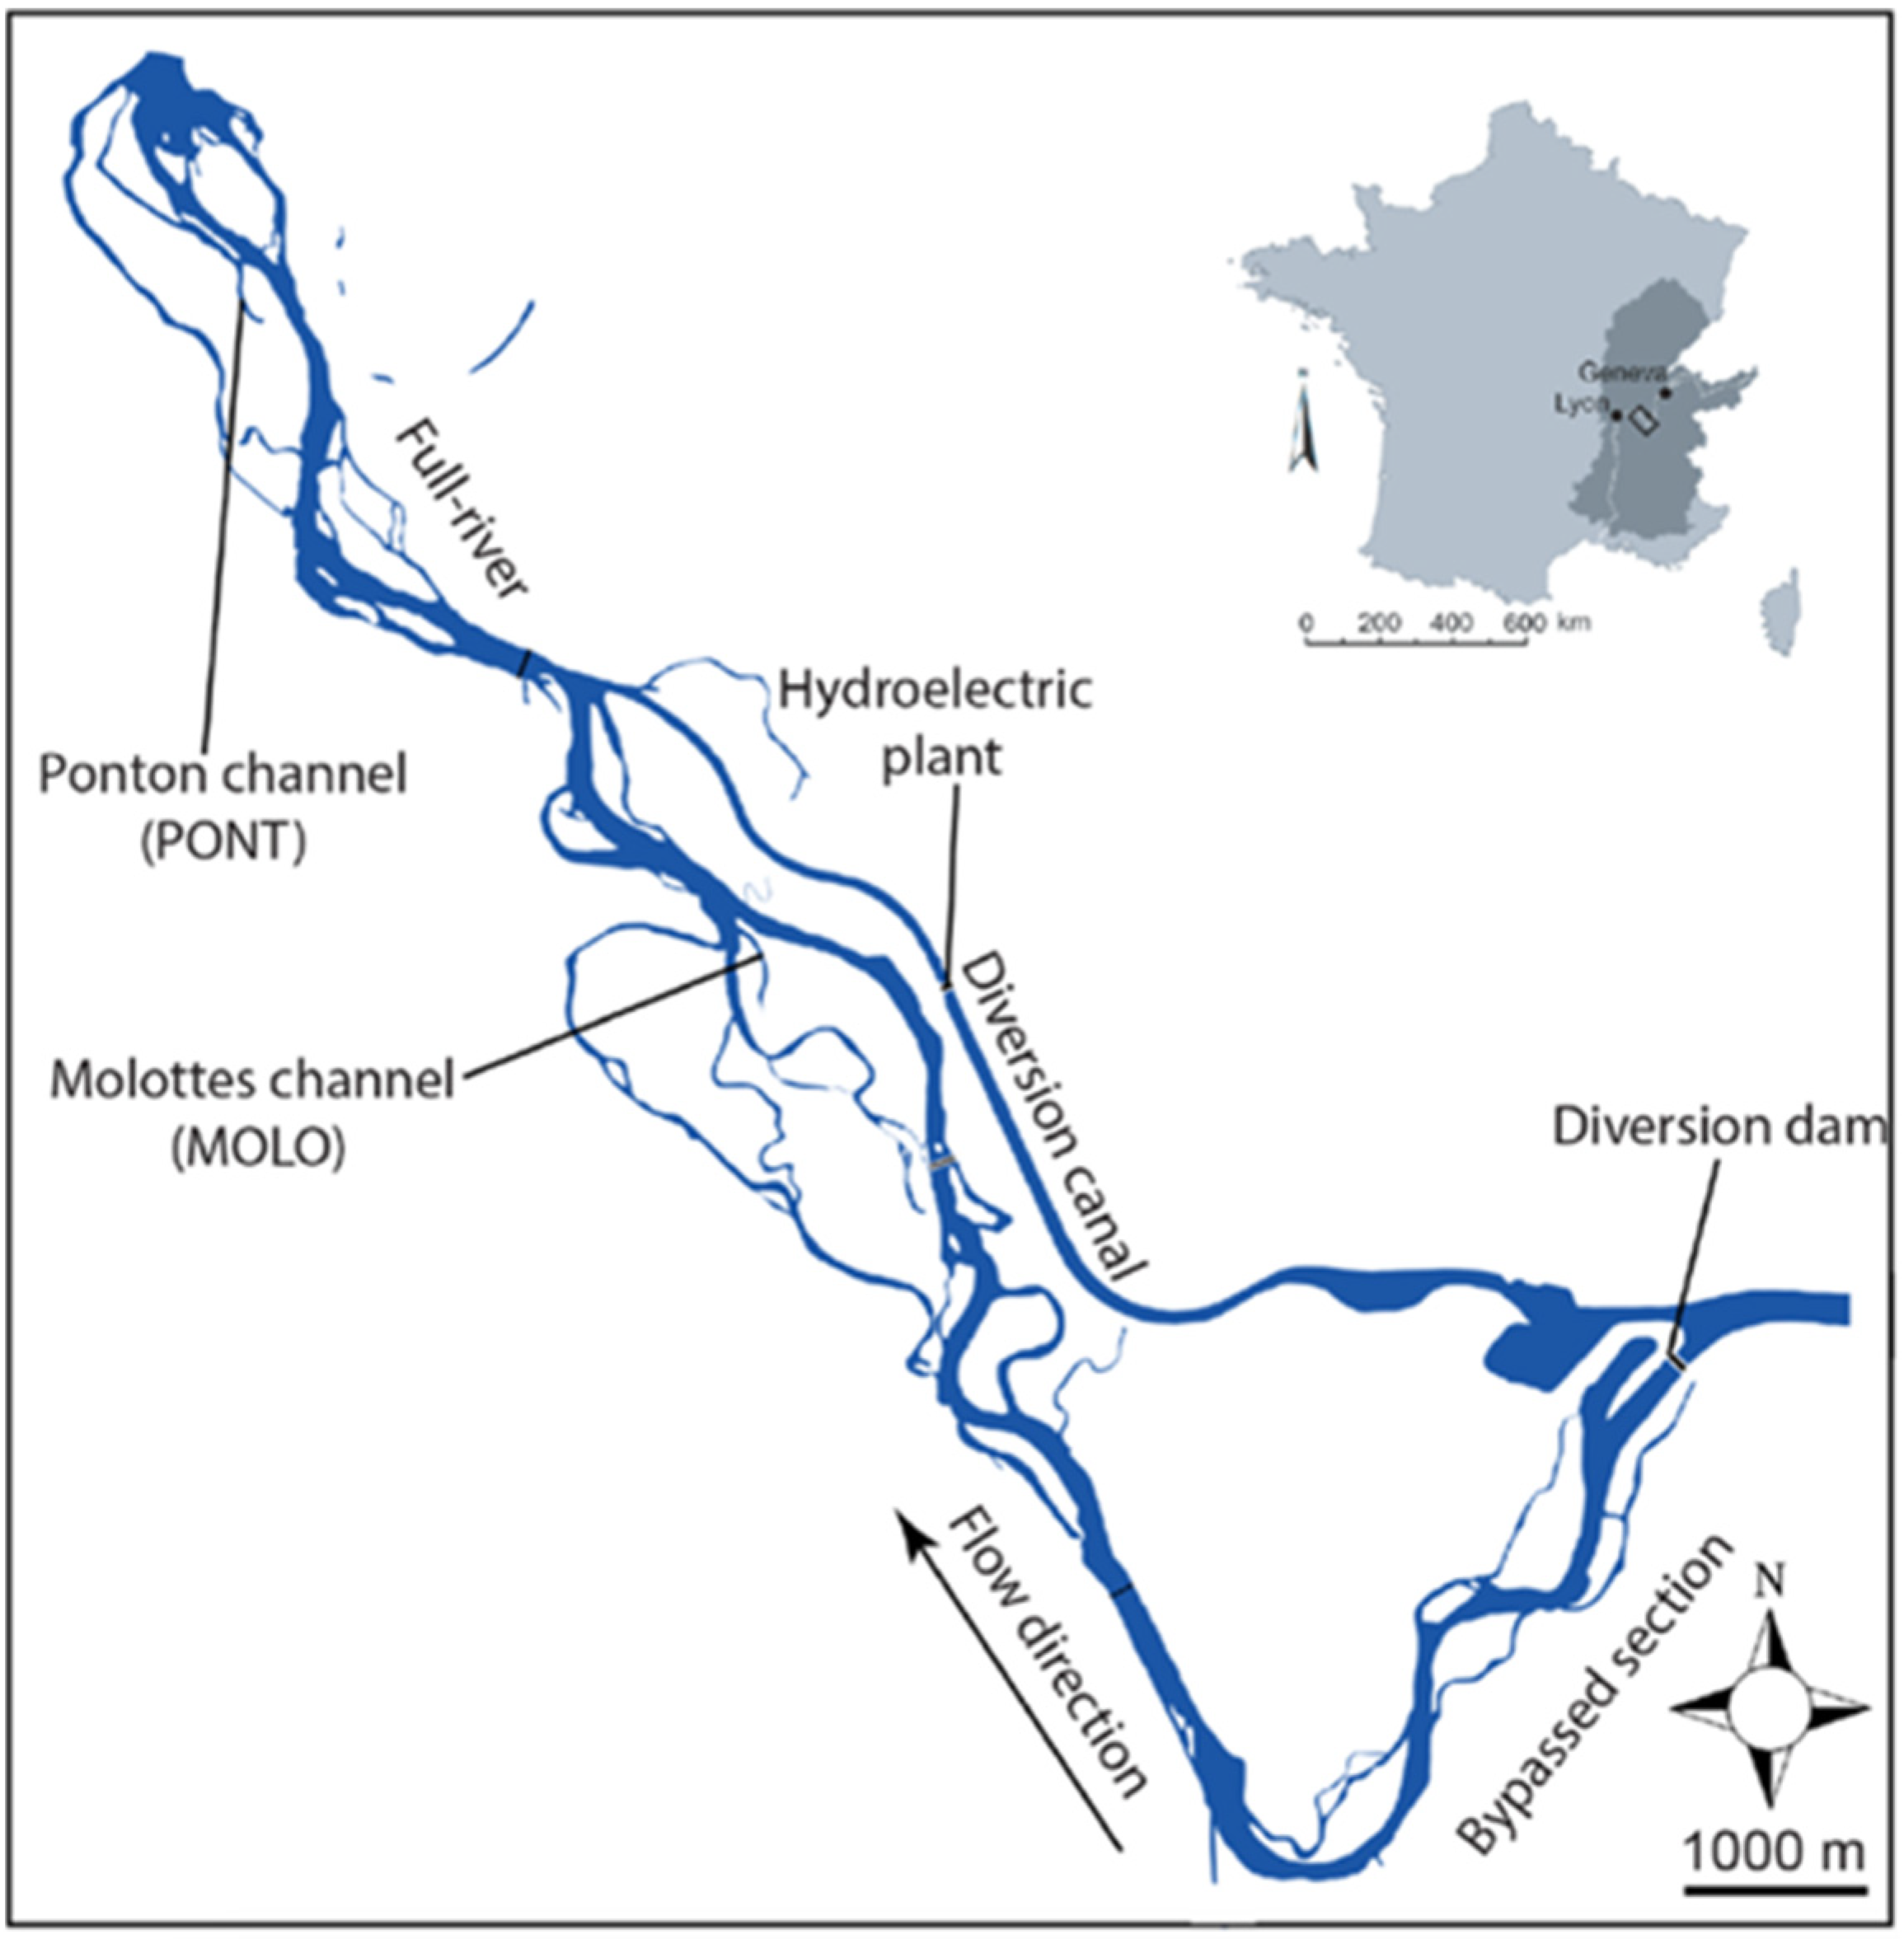
The two Rhone floodplain channels, which are former braided side-arms, are presently both connected downstream with the main river, but disconnected upstream, at average discharge. In this sector of the French Upper Rhone, between Geneva and Lyon, the mean summer discharge is about ~700 m3 s−1) (see Figure 1). The hydrological context of the two selected channels is very different. Molottes channel (MOLO) is located in the bypassed section of the Brégnier–Cordon hydroelectric scheme where the regulated flow delivered by the diversion dam is 150 m3 s−1 from 1 June to 31 August, 100 m3 s−1 from 1 September to 31 October, and 80 m3 s−1 during winter [40]. This floodplain channel is influenced by backflow entries generated by water level elevation (i.e., return flow from the bypassed river section) in relation to the functioning of the hydroelectric power station. Ponton channel (PONT) is located downstream of the hydroelectric scheme and hydropeaking usually causes daily discharge fluctuations from Monday to Friday (between ~200 and ~500 m3 s−1). Upstream flow connections occur during high floods for less than one day per year for both floodplain channels on average [41].
The two floodplain channels vary in length (1220 m for MOLO and 910 m for PONT) and geographic position (4 km between the two channels). A slightly deeper gully (depth minimum ~0.30 m), through which water passes continuously, allows the maintenance of a downstream connection for both channels with the main channel during low flow periods. In contrast, the upstream part of both channels was not modified by restoration works. Because of the loss of competence of the river flow when it enters into the floodplain channel from downstream, downstream alluvial plugs, composed of a mix of sand and silt were deposited in the two channels, allowing the establishment of aquatic plants, e.g., Elodea nuttallii and Ceratophyllum demersum, which, for the MOLO channel exclusively, became denser in the downstream part of the channel. Regarding PONT, the shallow upstream part of the channel is completely emerged over 15 m during reduced discharge periods. During high discharge periods, low-to-moderate water depth (<50 cm) covers the previously emerged part. Aquatic vegetation development is generally low in the PONT channel and mainly restricted to the upstream and mid-channel parts. Furthermore, aquatic vegetation cover provides egg-laying sites for, e.g., gastropods, and a substrate for periphyton, which, in turn, is highly influential for other organisms. Energy flow of these habitats is also influenced by periodic desiccation of the shallowest parts (e.g., [42]) or by stable and low flow conditions [43,44]. Despite these highly diverse habitats, there have been no modeling efforts to study how the different flow conditions affect the transfer of energy of these channels.
Finally, basic information on physicochemical data (e.g., water temperature, conductivity, and dissolved oxygen) of the water column in MOLO and PONT channel for each month (e.g., April, May, June, July) were also collected (see Table 1). These abiotic data are not analyzed in this paper but they have a profound impact on the size–abundance relationships.
2.2. Sampling Method and Ecological Traits
A total of 24 samples was used, where 3 samples were collected from each of 2 given floodplain channel sites on the same date of each month (across 4 months). For each channel site, the 3 samples were collected from 3 random spots along a 30 m transect (in a straight line). Specifically, benthic invertebrate samples were taken in the middle part of the two floodplain channels over four dates in early 2017: April, May, June and July. The period chosen for sampling corresponds to a time of much higher diversity and productivity compared with winter or fall. After July, many aquatic insects with annual voltinism emerge [45] however, others undergo extreme conditions (e.g., dissolved oxygen and temperature conditions) where the abundance of the macroinvertebrates decreases, thus limiting productivity and functional diversity.
Benthic invertebrates living among aquatic macrophytes and in or on the sediment/litter upper layer were both sampled within a 0.5 × 0.5 m metal frame with a hand net (mesh size 500 µm). The collected samples of benthic invertebrates were weighed on a balance as wet weight (g) for each individual present in the sample. Benthic invertebrates were then sorted under a stereomicroscope, where they were counted (i.e., abundance) and identified to genus or species level, when possible. Diptera were identified up to the family level.
Feeding type was extracted for each taxon from the freshwater ecology database available online (http://www.freshwaterecology.info, accessed on 31 July 2021). It consists in assigning a positive score (from 0 to 10) that describes the affinity of a taxon for pre-defined feeding categories, i.e., filtering collectors, gathering collectors, grazers, shredders and predators (see Appendix B—Table A4).
2.3. Statistical Analysis
A linear model was fitted to the raw data of average body size relative to their average abundance (both variables in log10, see Figure 2) per taxon, in order to test the size–abundance relationship of freshwater macroinvertebrate among the two channels. This approach to studying the size–abundance relationships was based on calculating local size–abundance relationship (LSDR), which plots average size and average abundance of each taxon (see [7]). Least-squares regression (LSR) was fitted on average wet weight and average abundance (number of individuals): i. among the two channels (all months included), ii. among the two channels and across months, and iii. among the two channels and across functional feeding groups.
We used least-squares regression (LSR) for analyzing body size and abundance relationships. LSR is more appropriate than reduced major axis regression when measurement error in the independent variable (body mass) is less than that of the dependent variable (abundance), as is the case in our study [46,47]. We used log10-transformation to normalize the data variation, and to permit proportional, linear relationships to be readily discerned [48,49]. Significant differences between scaling exponents (slopes) and intercepts (elevations) were estimated by ANCOVA (with body mass as a covariate).
3. Results
Both LSDRMOLO and LSDRPONT showed significant relationships between body weight and abundance of macroinvertebrate taxon (Figure 2, Table 2). The scaling slopes were shallower than the energetic equivalence hypothesis value of −0.75 (−0.39 and −0.33, for MOLO and PONT, respectively), thus the slopes and intercepts were not significantly different between the two channels (Table A1).
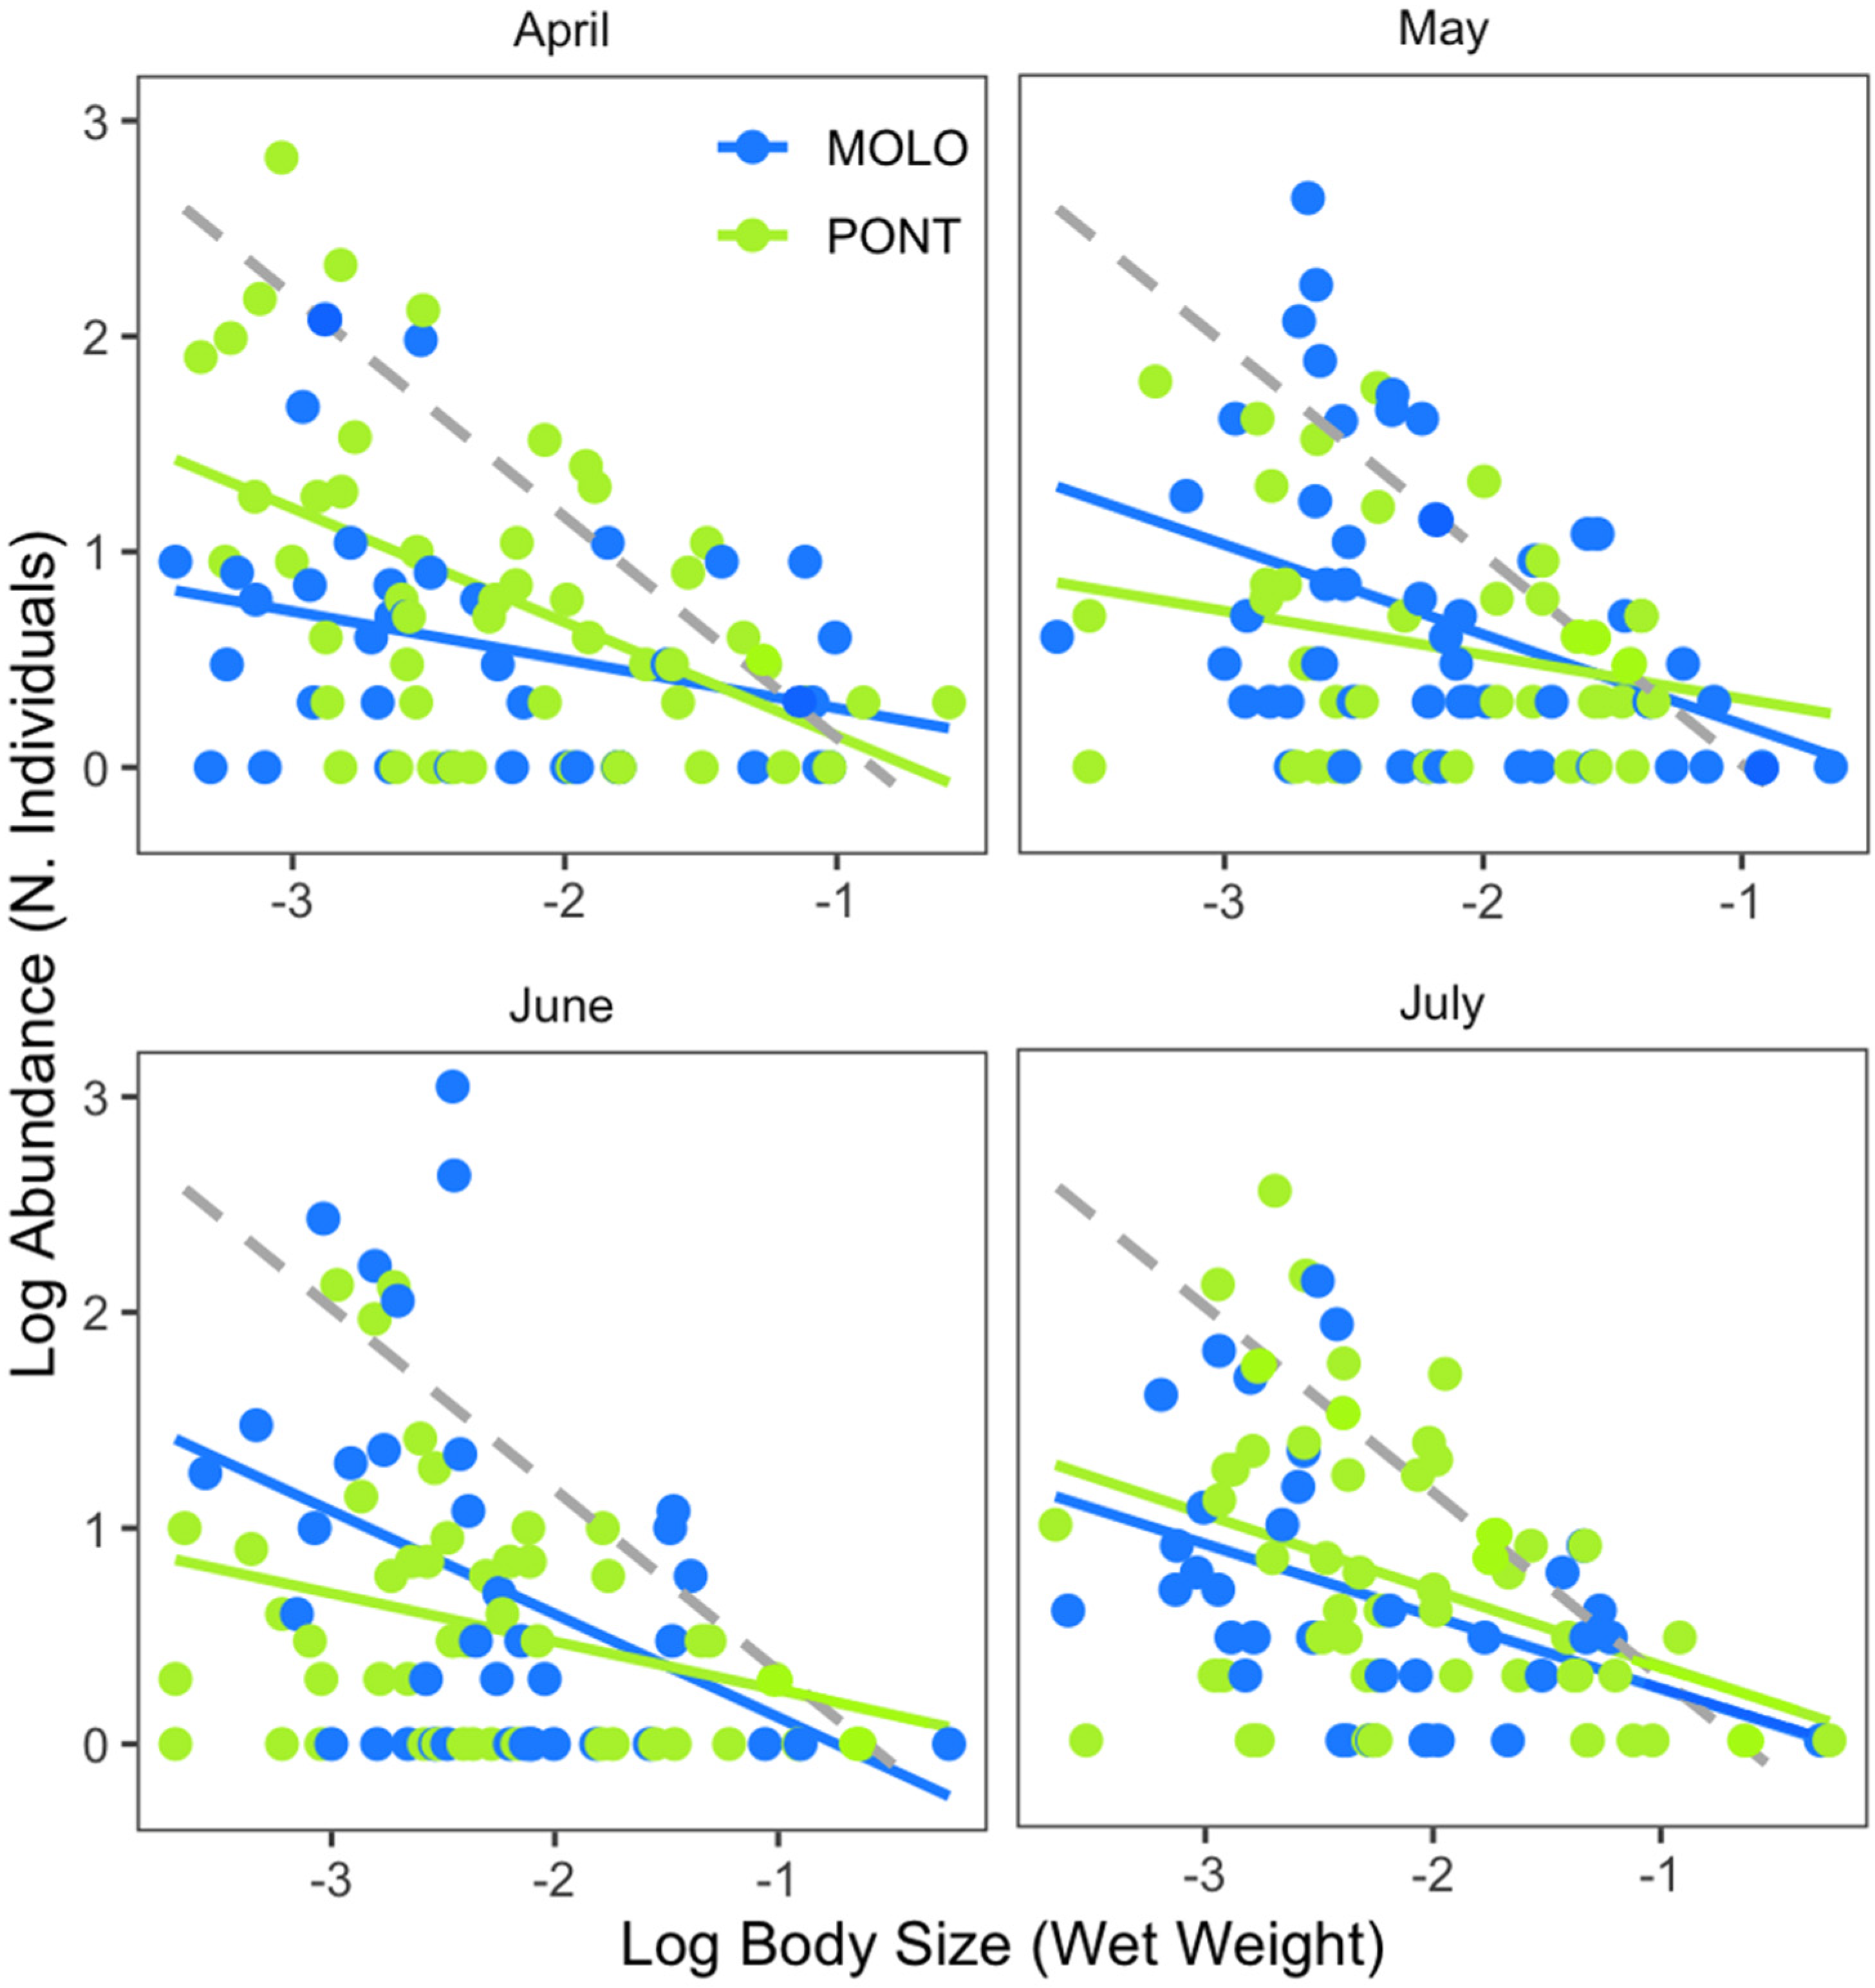
Furthermore, the two channels showed significant relationships over time (April, May, June and July), although the pattern was different (Figure 3, Table 3). Specifically, LSDRPONT showed a significantly steeper scaling slope (−0.53) than LSDRMOLO (−0.31) in April. By contrast, LSDRMOLO showed steeper scaling slopes (−0.42 and −0.48) than LSDRPONT (−0.28 and −0.26) for May and June. However, both channels showed similar scaling slopes (−0.34 and −0.29, respectively) in July. The scaling slopes of the two channels were significantly different for April, May and June and the intercept was significantly different for April and June (Appendix A—Table A2).
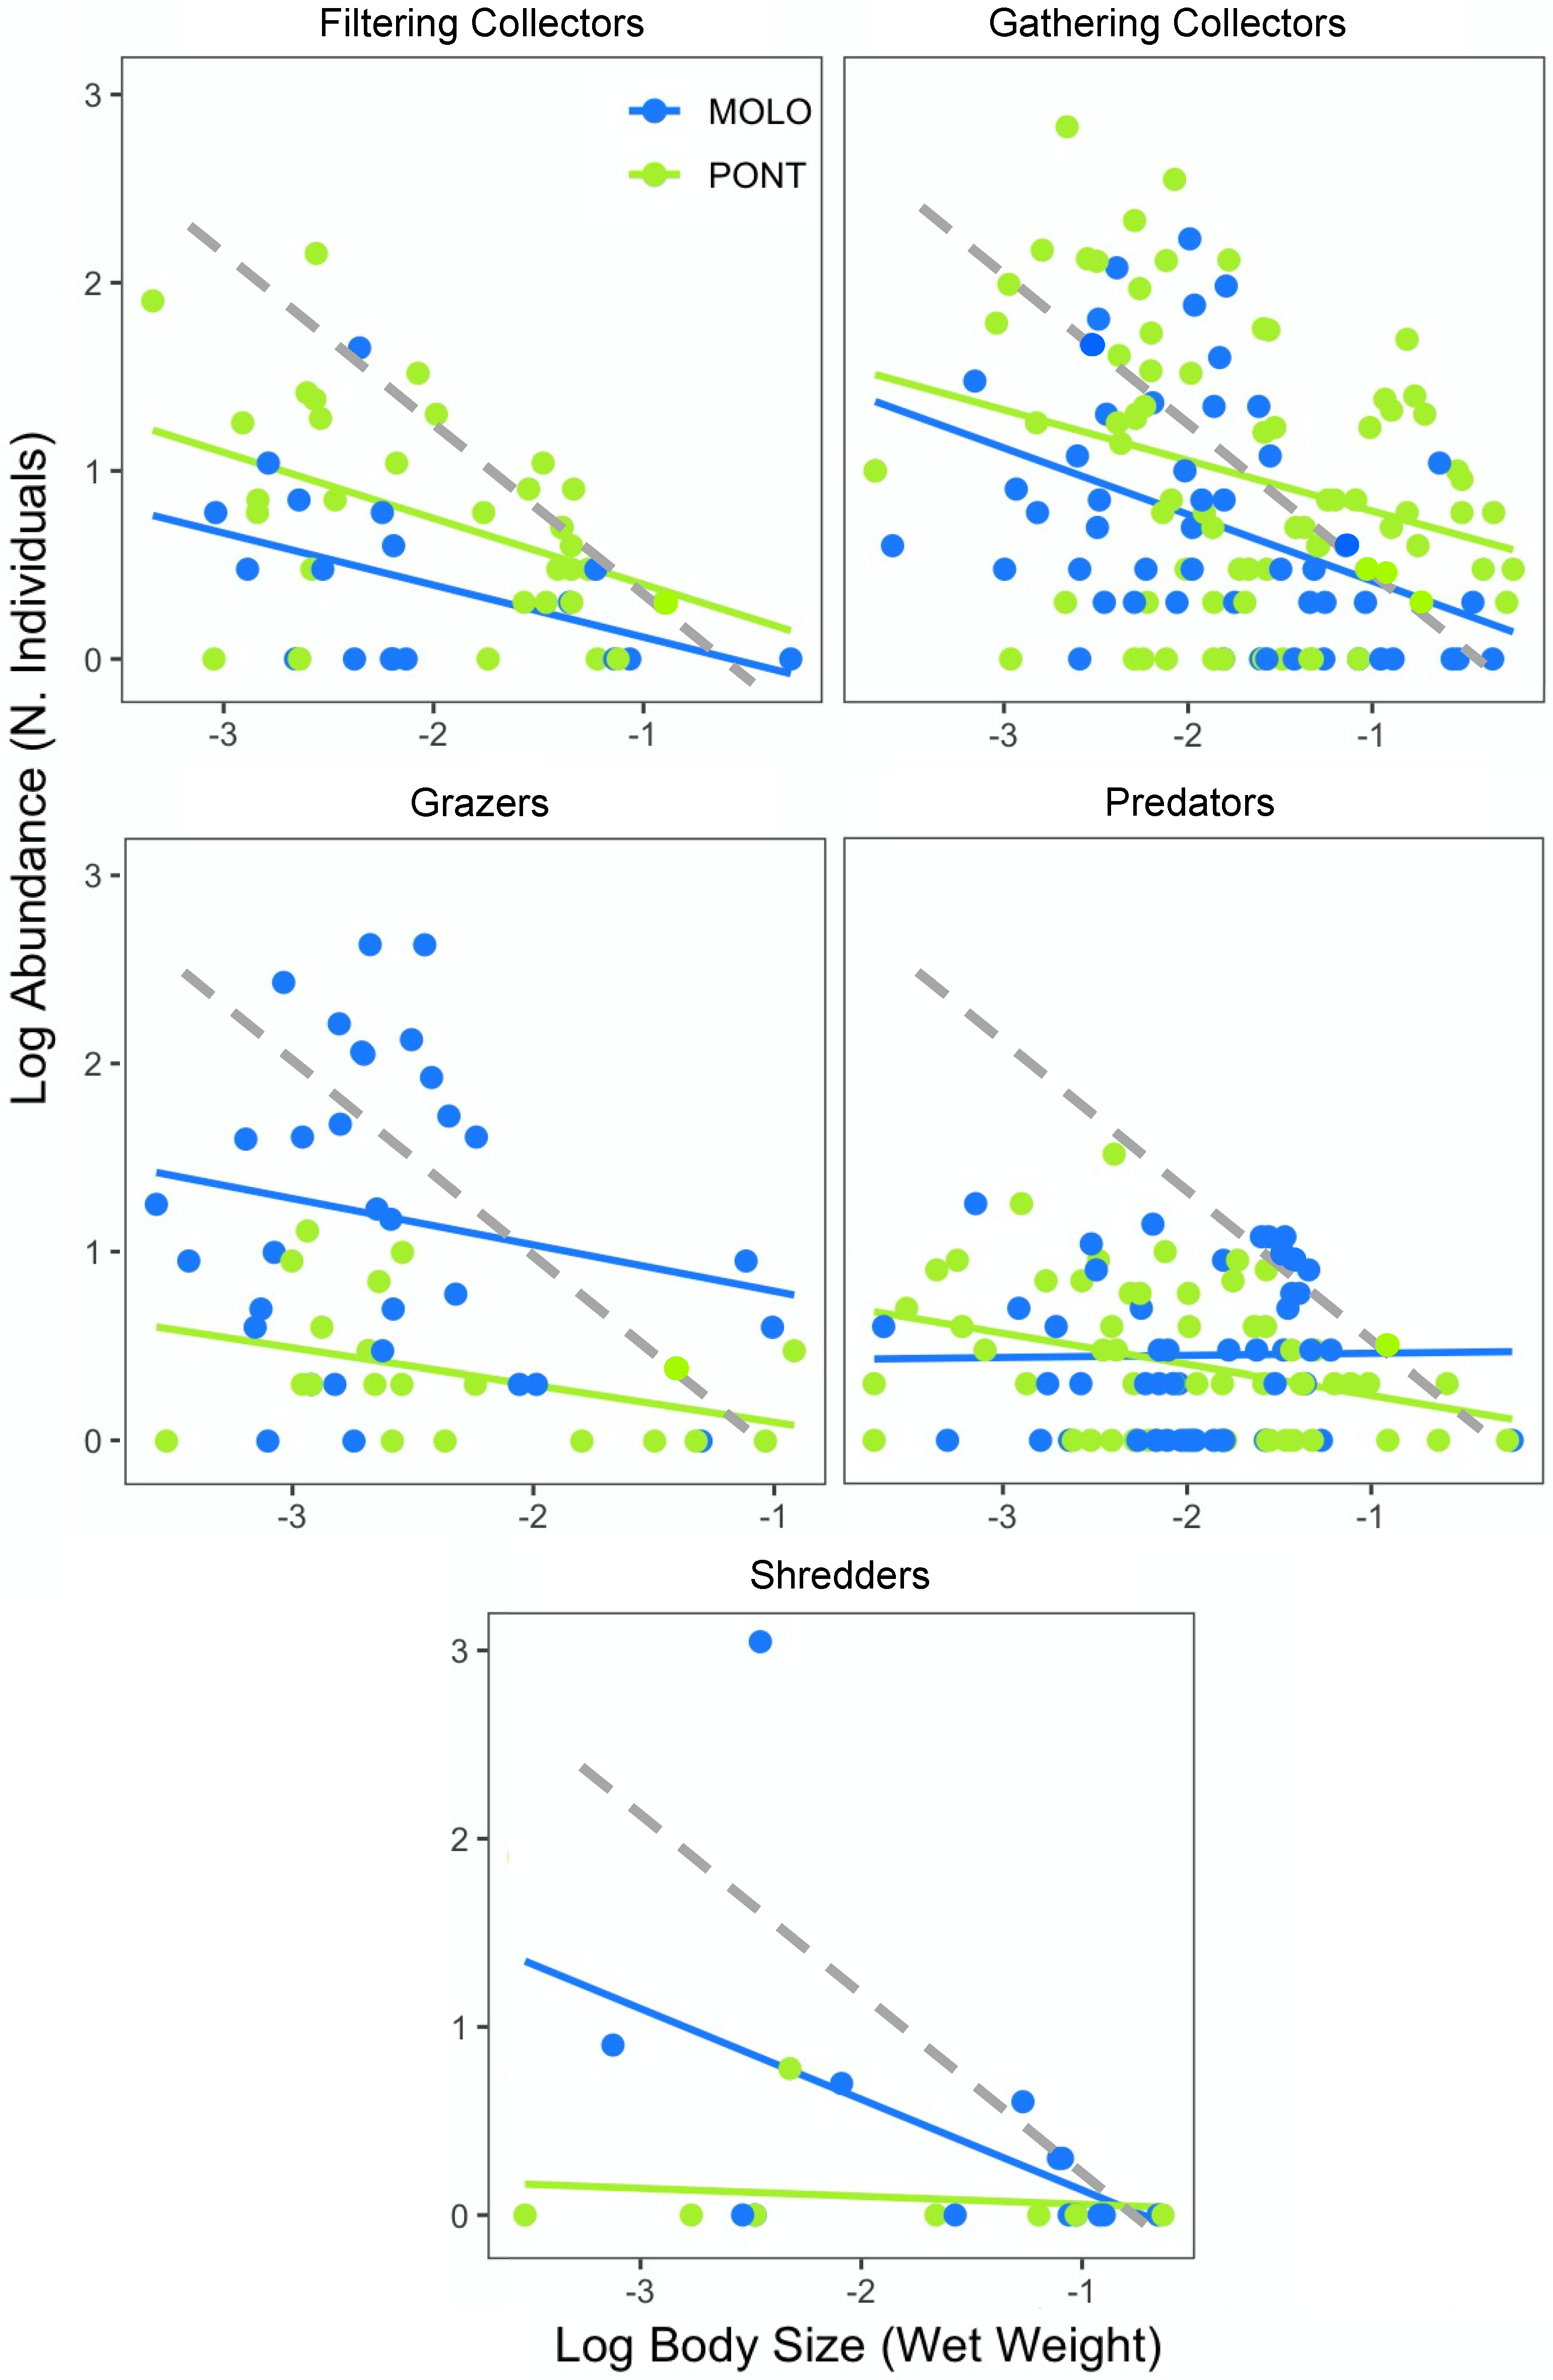
Finally, the scaling slopes of LSDRMOLO and LSDRPONT across functional feeding groups showed similar patterns for both channels, with the exception of the predators and shredders (Figure 4, Table 4). Specifically, gathering collectors showed steeper scaling slopes for LSDRMOLO and LSDRPONT (−0.60 and −0.45, respectively), whereas filtering collectors (−0.27 and −0.35, respectively) and grazers (−0.31 and −0.28, respectively) resulted in less steep slopes for both LSDRMOLO and LSDRPONT. The scaling slopes across functional feeding groups were not significantly different for the two channels, while the intercepts were different for grazers, filterers and gatherers (Appendix A—Table A3). Finally, predators and shredders showed different LSDR slopes, where only predators of PONT (−0.16) and shredders of MOLO (−0.49) were significant.
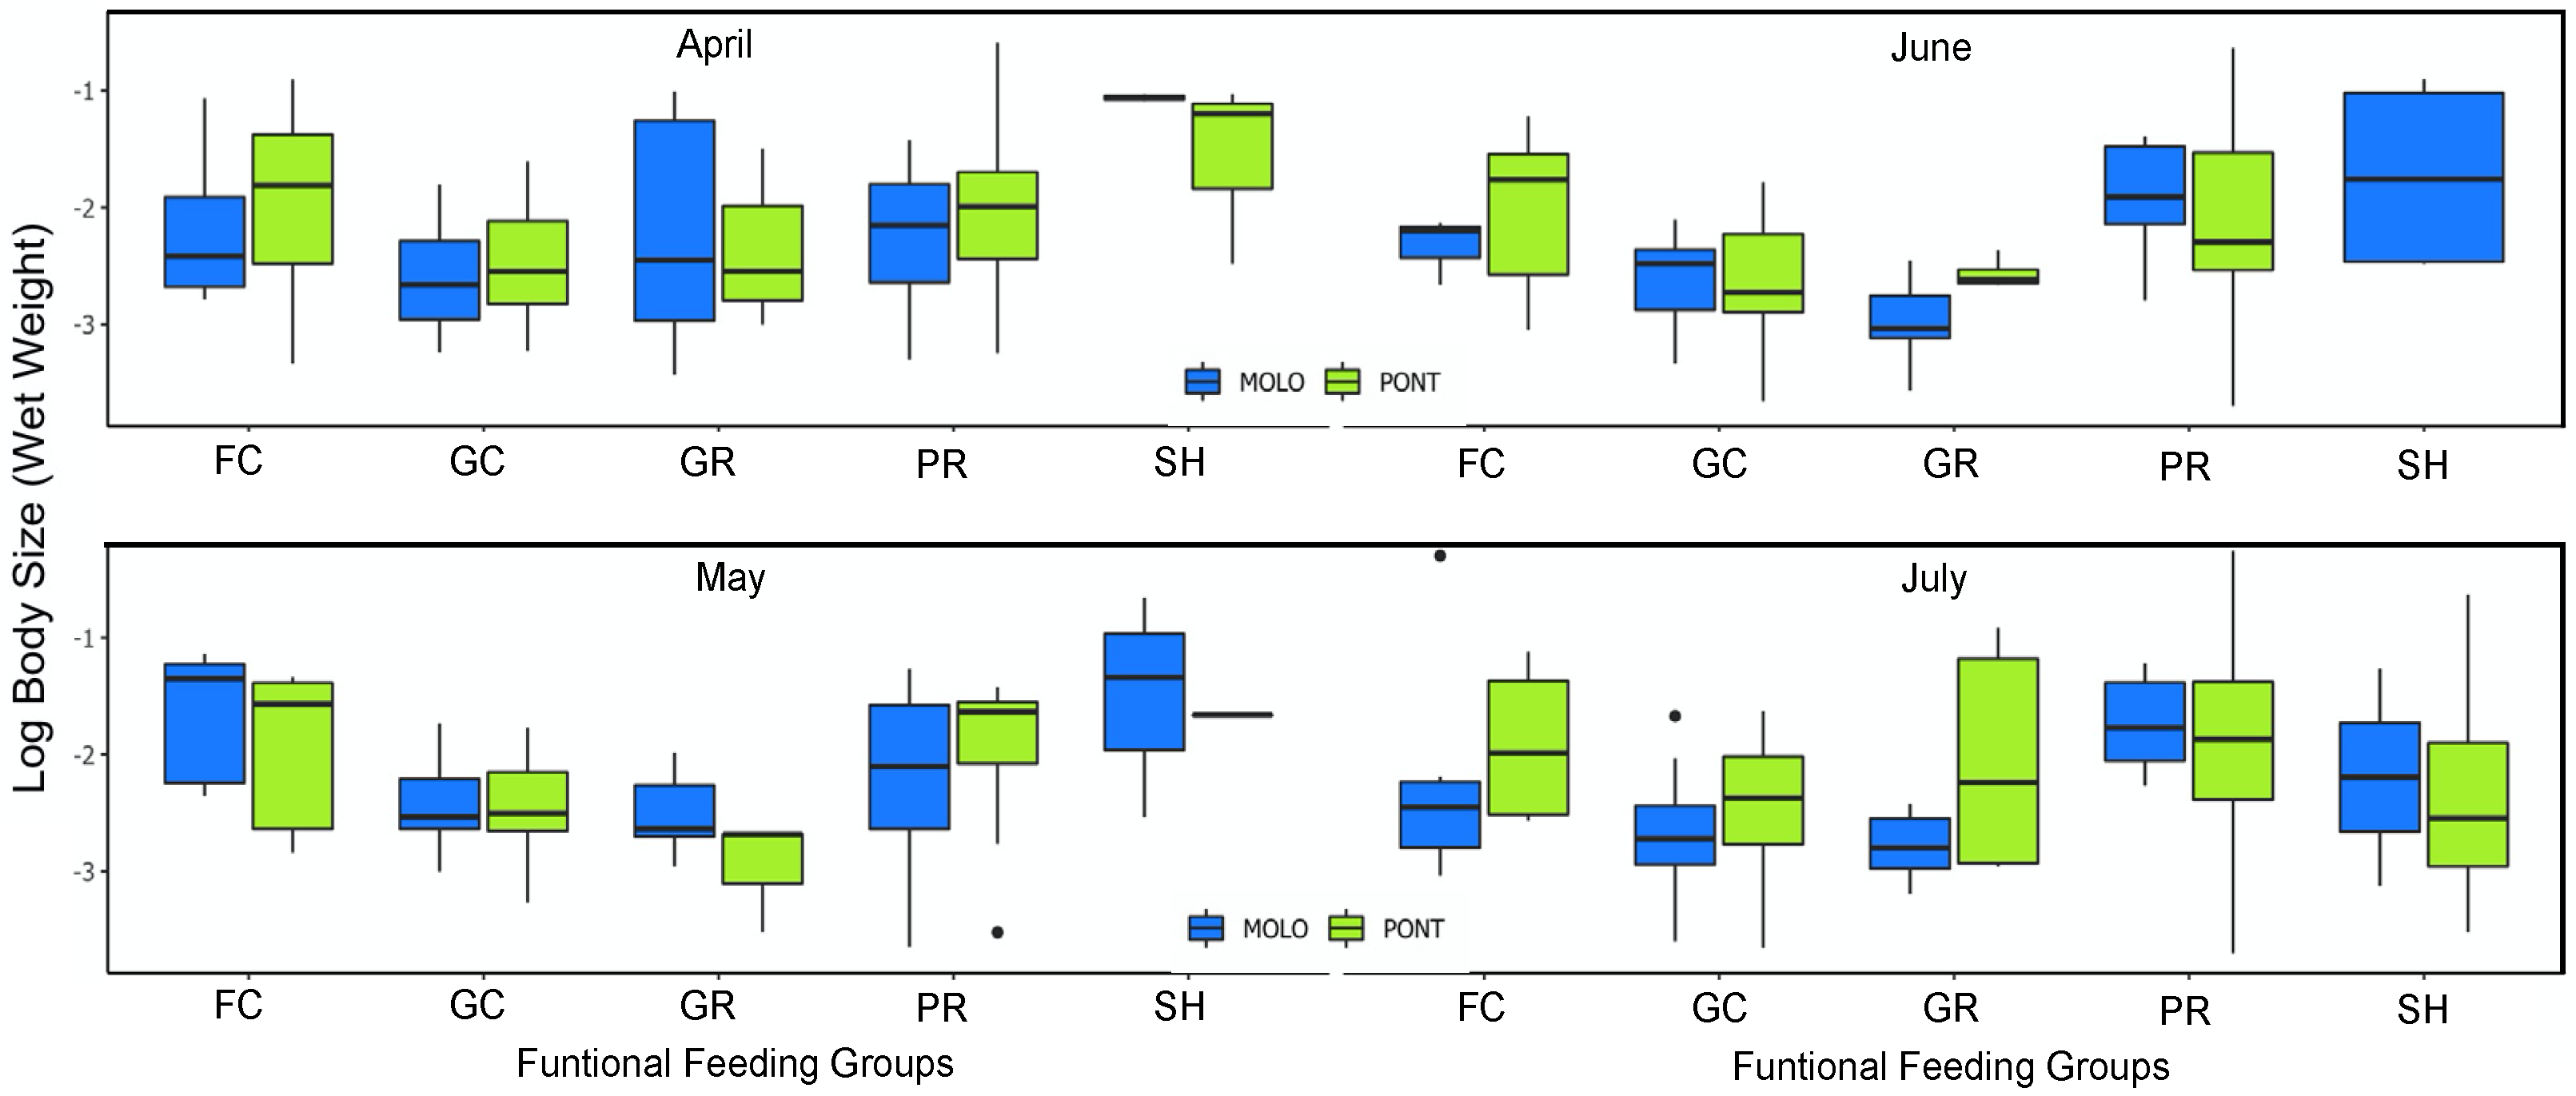
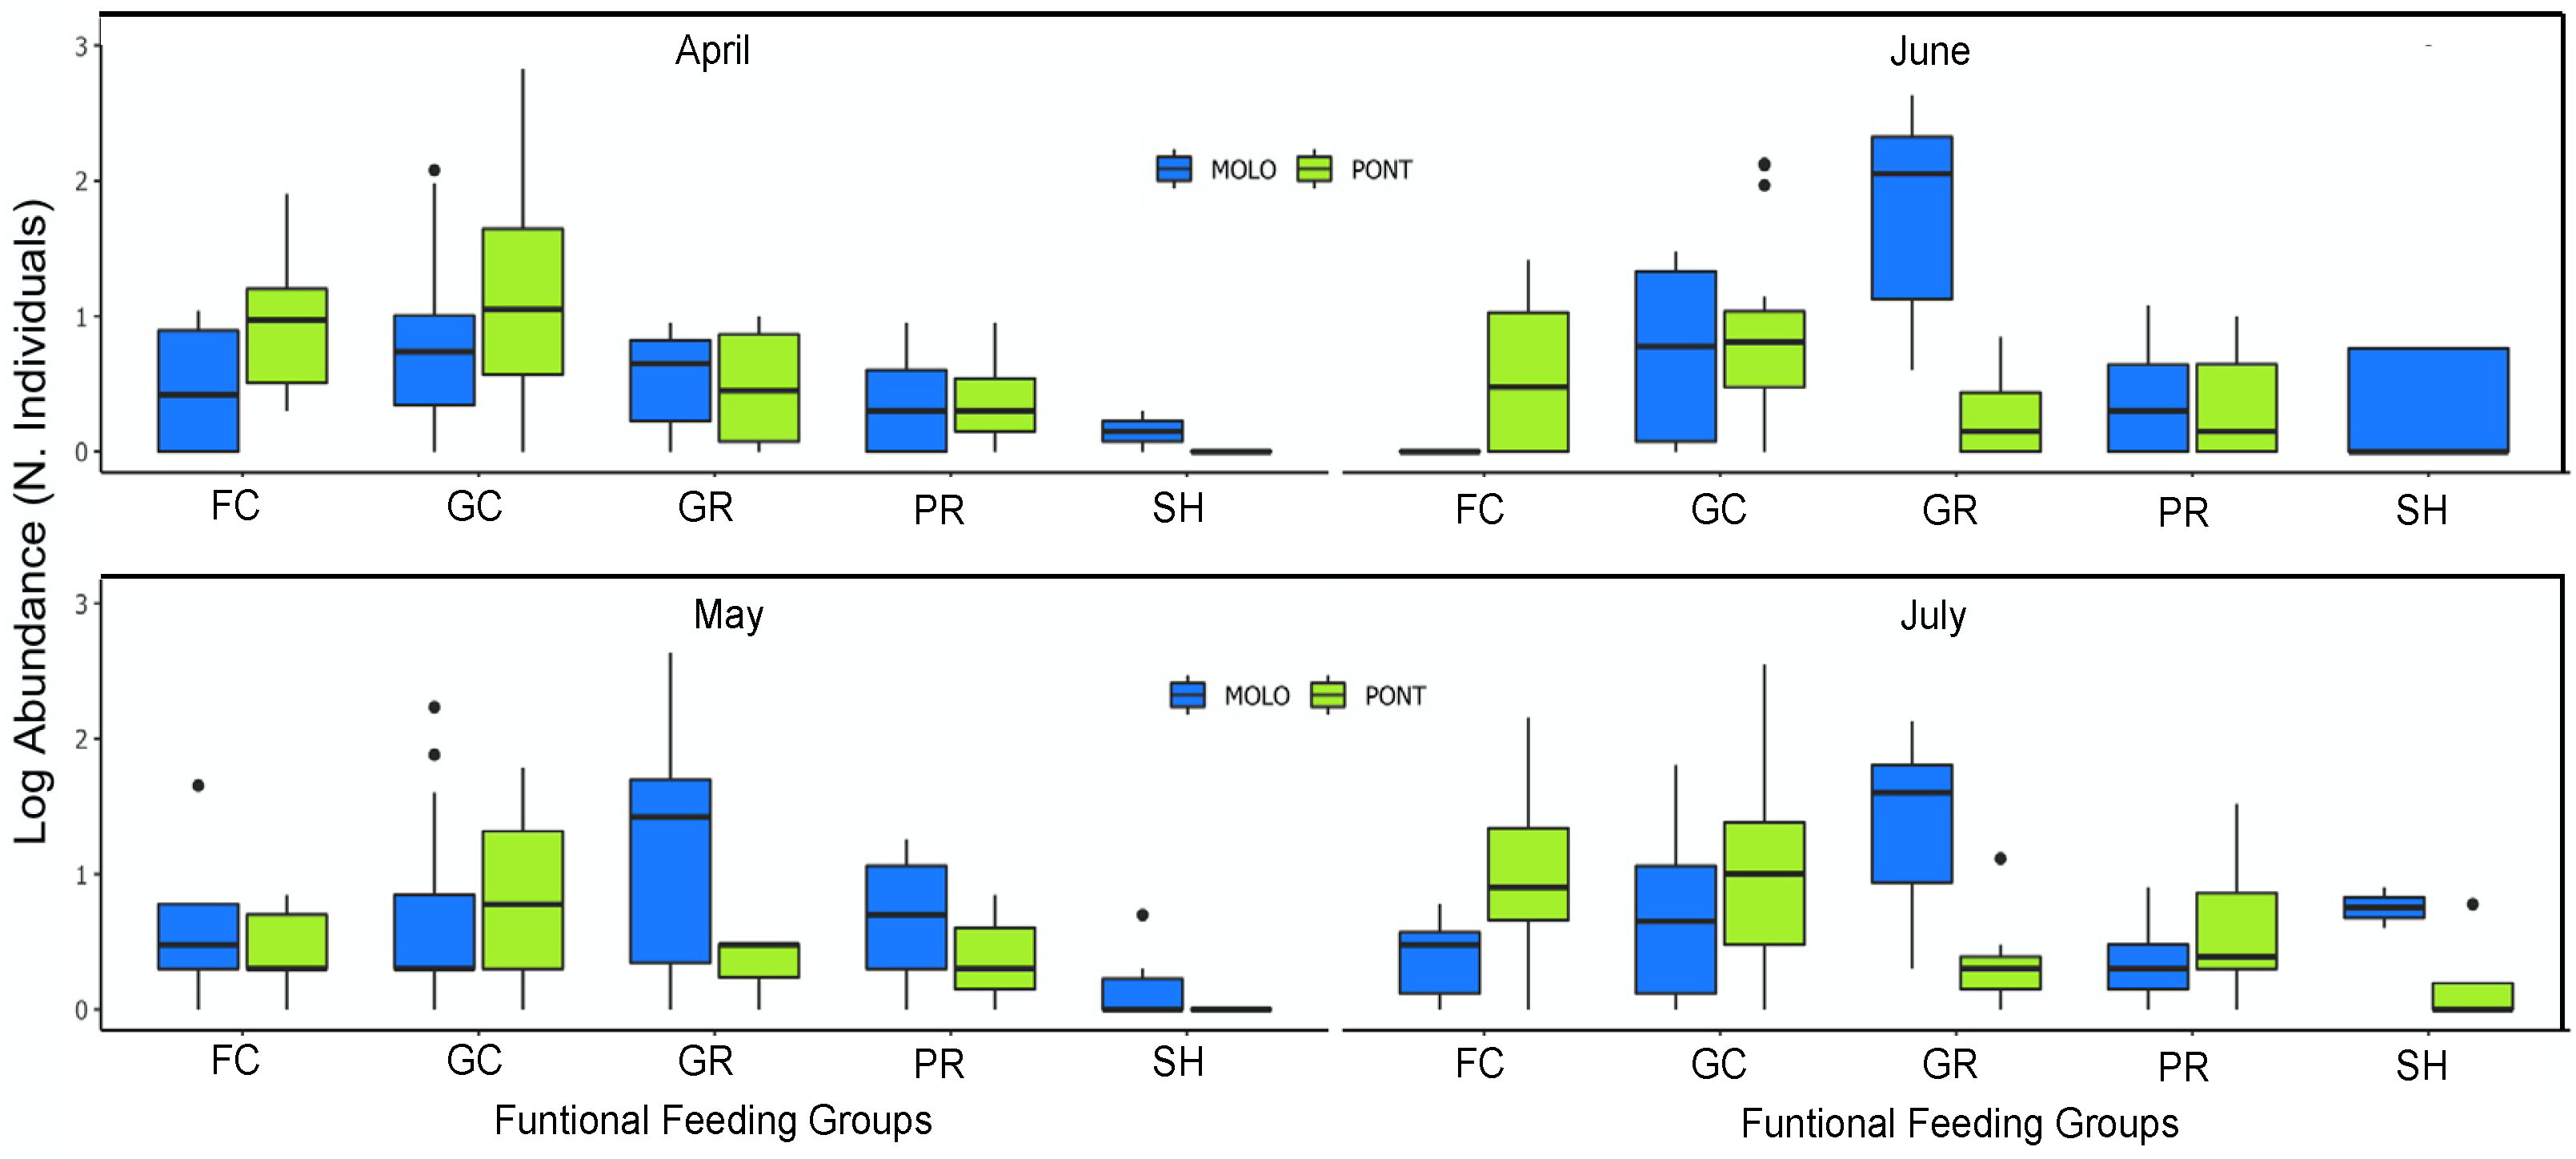
However, at a monthly scale, the average body size and average abundance across functional feeding groups of MOLO and PONT were consistent with the monthly patterns of LSDRMOLO and LSDRPONT. Specifically, in April, small filtering and gathering collectors in PONT showed higher abundance than MOLO (Figure 5 and Figure 6), forming a steeper slope (−0.53 vs. −0.31) than the one for MOLO. Whereas, in May and June, small-sized grazers in MOLO showed higher abundances than in PONT (Figure 5 and Figure 6) resulting in steeper slopes for MOLO than PONT (−0.42 vs. −0.28 and −0.48 vs. −0.26, respectively). Furthermore, the large-sized shredders that were present only in PONT contributed to form less steep slopes for PONT than the ones of MOLO.
4. Discussion
4.1. Patterns of LSDRMOLO and LSDRPONT (All Months Included)
The patterns of the LSDR across the two floodplain channels, considering the whole dataset including all the months, were both statistically significant, with similar slopes (i.e., −0.39 and −0.33 for MOLO and PONT, respectively) that were significantly shallower than predicted by Damuth [8,9,10]. Our patterns were consistent with several studies that suggested that the relationship between body size and abundance is much shallower than the value of −0.75 for aquatic macroinvertebrate communities (e.g., [26,50,51,52]) and other animal communities (e.g., [19,53,54,55,56]). However, the shallower slopes found were not consistent with the EER. This deviation of LSDR provides evidence against the universality of EER, showing that the amount of energy used is not the same for all species [7]. Because the EER predicts that size–abundance relationships arise from the metabolic scaling, environmental factors that alter size-dependent metabolic demands may alter size–abundance relationships [17]. Therefore, the shallower slope of LSDR in both freshwater channels implies a shallower slope of the metabolic scaling with body size.
Indeed, the metabolic scaling slope of macroinvertebrate species in aquatic ecosystems was previously found to be shallower than the expected MTE value of 0.75 (reviewed by [57]). For reasons that are still not completely understood, the metabolic scaling slope of benthic macroinvertebrates often shows less steep slopes (i.e., ~0.30 to ~0.55) than the −0.75 value. Whether this variation in macroinvertebrate metabolic scaling slope is related to environmental factors, such as water temperature [58,59] and biological factors, such as predation pressure [60,61], is less known. Moreover, this variation of metabolic responses in relation to predation threats may be temperature-dependent [62,63]. These studies showed that smaller macroinvertebrates in both freshwater springs and saltwater lagoons more strongly increased their metabolism under high temperature and predation threat, when compared with the larger taxa. However, large macroinvertebrates, that do not change their metabolism in the presence of a predation threat, were present at a higher abundance. This again implies that the slope of the size–abundance relationships of benthic macroinvertebrates should scale with a less steep slope (i.e., ~−0.30 to ~−0.55), and indeed this was found for both channels considered in our study (Figure 3). The size-dependent effects of abiotic and biotic factors on metabolic rate may change the metabolic scaling slope and, as a consequence, it may influence the size–abundance relationship slope. This may explain the competitive advantage of large macroinvertebrate species over smaller ones also observed by other studies [64,65].
4.2. Patterns of LSDRMOLO and LSDRPONT across Months
The size–abundance relationship varied at the monthly scale for both channels (i.e., LSDRMOLO and LSDRPONT). The size–abundance relationship across the two sites showed different, site-specific patterns for April and May, while LSDRs for June and July followed comparable patterns. Our findings were consistent with other studies that showed a temporal [24,33] and spatial (reviewed by [6]) variation in size–abundance relationship of local communities. This pattern implies that time and space are both able to shape the local communities, resulting in different shapes of size–abundance relationships, for which differently sized species acquire energy differently.
PONT showed a slightly steeper size–abundance relationship for the months of May and June, while MOLO showed a slightly steeper size–abundance relationship only for April, compared with the other months. These patterns show an increase in the abundance of small taxa during May and June for PONT, and April for MOLO. Small aquatic macroinvertebrates may have reached their highest abundance during May and June for MOLO and during April for PONT. This is because reproduction and the appearance of juveniles (gastropods in particular) tend to peak during this period of time (i.e., from April to July) for most macroinvertebrate species [66]. However, this peak for each species or functional group varies because of differences in life cycles and resource availability. Thus, the LSDRs changed in a different way for MOLO and PONT across time, following the proposed hypothesis based on the specifics of reproduction and juvenile appearance, implying that juveniles of the species present in PONT peaked at a different moment across the four months than those in MOLO. Therefore, our findings suggest that although the size–abundance relationships of the two sites were broadly the same when looking at all months combined, this result does not hold when considered at the monthly scale.
4.3. Patterns of LSDRMOLO and LSDRPONT across Functional Diversity
The size–abundance relationship of local communities at both sites taking functional diversity into account, showed the same shape with different intercepts, with the exception of the predators and shredders. LSDRPONT showed significantly higher abundance of filtering and gathering collectors, independent of body size, than LSDRMOLO. However, LSDRMOLO showed significantly higher abundance of grazers regardless of their body size than LSDRPONT. Our findings therefore showed different energy flow patterns for the two channels. Filtering and gathering collectors in PONT and grazers in MOLO are shown here to have higher energy flow compared with the other functional groups. This suggests a difference in the energy flow across the functional groups, depending on differences in the habitat structure of the two channels [67]. To repeat, MOLO was characterized by slow and less active backflows from the by-passed section of the river, whereas PONT was subjected to more frequent oscillations associated with hydropeaking in the full river and characterized by lower vegetation density.
The various macroinvertebrate functional feeding groups translate their diversity in terms of food acquisition strategies. Specifically, in our study the filtering feeders were mostly bivalves, gathering collectors were mostly insects and some gastropods, grazers were mostly gastropods, and shredders were mostly crustaceans. The difference of the intercept of the functional groups independent of their body size implies higher energy flow for the functional feeding groups with higher intercepts [62]. Our findings showed that the energy flow of filtering and gathering collectors was higher in PONT, while the energy flow of grazers was higher in MOLO.
Our study indicates that energy transfers through floodplain feeding groups are linked to and may change as a function of the vegetation cover and the water flow conditions in the two channels. Specifically, the functional groups of filtering collectors, gathering collectors and grazers showed different patterns in energy transfers between the two channels [68]. These variations suggest that water movement (enhanced by hydropeaking) may increase the suspended matter load as food for filtering and gathering feeders in MOLO [66]. Low and more stable flow conditions may increase temperature and promote biofilm/algal growth upon macrophytes for grazing in PONT [69]. Because the energy flow in floodplain channels probably relies on hydrology in addition to their connection (or reconnection in the case of restoration) with the main channel, it would be possible to adapt water releases from dams in the Rhone River to control energy transfers in floodplain channels [70]. Restricting hydropeaking (see [71]) might suffice to allow the proliferation of grazers that would tend to increase the energy transfers and thus support more top predators for PONT than MOLO channel.
Additionally, functional feeding groups were able to also explain the different monthly LSDR slopes of the two channels. Specifically, small-sized filtering and gathering collectors showed higher abundance for MOLO in May and June, whereas small-sized grazers showed higher abundance for PONT in April. Therefore, our findings suggest that the LSDR shape of most functional feeding groups was apparently the same, but they showed a different energy flow (i.e., higher abundance regardless of their body size). Furthermore, the body size and abundance of functional feeding groups when considered at a monthly scale were able to explain the monthly pattern of LSDRs in the two channels. Our finding confirms that the changes in habitat conditions across time and space, such as vegetation coverage and water flow, are closely related to the functional diversity and LSDR shape.
5. Conclusions
Size–abundance relationships link individual- and population-level energetics with the structure of ecological communities based on principles that are generally applicable. Broadly evaluating the variation of size–abundance relationship in local communities (i.e., LSDR) and understanding how it arises from biological and ecological processes at population- and community-levels would represent a major advance in our present understanding of ecosystems. This study offers a potential method of using size–abundance relationships for describing community structure, and the underlying processes across time, space, habitat type and functional diversity. This methodological approach links biodiversity and ecosystem functioning processes, improving our ability to make predictions of how environmental change will shape aquatic ecosystems, and is relevant for research and management policies for the conservation of biodiversity.
Author Contributions
Conceptualization, V.G. and P.M.; methodology, P.M.; formal analysis, V.G.; investigation, V.G.; resources, P.M. and E.C.; data curation, P.M. and V.G.; writing—original draft preparation, V.G. and P.M.; writing—review and editing, V.G., P.M., B.W.I. and E.C.; visualization, V.G.; supervision V.G., B.W.I. and E.C., project administration, V.G. and B.W.I.; funding acquisition, V.G. and B.W.I. All authors have read and agreed to the published version of the manuscript.
Funding
This research was funded by a Swiss National Foundation grant called “Scientific Exchange” awarded to Vojsava Gjoni in support of her research visit at the University of Geneva in Switzerland. The data of this study have been provided in the context of the OHM Vallée du Rhône, the LabEx DRIIHM and in the EUR H2O’Lyon (ANR-17-EURE-0018) of Université de Lyon.
Acknowledgments
We thank all the research teams involved in the monitoring of the Rhône River ecological restoration (RhônEco program) for making data available and for discussions. We thank the Syndicat du Haut-Rhône for their technical support. Furthermore, we would like to thank Pablo Timoner for his help on classifying the species into functional feeding groups. We are grateful for the helpful suggestions and comments by three anonymous reviewers.
Conflicts of Interest
The authors declare no conflict of interest. The funders had no role in the design of the study; in the collection, analyses, or interpretation of data; in the writing of the manuscript, or in the decision to publish the results.
Appendix A
In order to quantify the difference between the two channel sites we have used ANCOVA (p value) for slope and intercept comparison between LSDRMOLO and LSDRPONT: across all months, and across each month. Specifically, the differences between slopes were assessed by comparing 95% CI. When the slopes were not significantly different, the differences between elevations were estimated by ANCOVA (with body mass as a covariate). Least-squares regression (LSR) was fitted on average body size and average abundance (number of individuals): i. among the two channels (all months included—Table A1), ii. among the two channels and across months (Table A2), and iii. among the two channels and across functional feeding group (Table A3).

Table A1.
p value for slope and intercept comparison of the LSDR analyses in Table 1. The differences among slopes were assessed by comparing 95% CI. When the slopes were not significantly different, the differences between elevations were estimated by ANCOVA (with body mass as a covariate).
Table A1.
p value for slope and intercept comparison of the LSDR analyses in Table 1. The differences among slopes were assessed by comparing 95% CI. When the slopes were not significantly different, the differences between elevations were estimated by ANCOVA (with body mass as a covariate).
| Sampling Site | p Value for Slope a | p Value for Intercept b | ||
|---|---|---|---|---|
| MOLO | PONT | MOLO | PONT | |
| MOLO | - | ns | - | ns |
| PONT | ns | - | ns | - |
a Significance of slope differences; b Significance of intercept differences; ns–not significant; - not measurable.
Table A2.
p value for slope and intercept comparison of the two streams LSDR analyses in Table 2. The differences among slopes were assessed by comparing 95% CI. When the slopes were not significantly different, the differences between elevations were estimated by ANCOVA (with body mass as a covariate).
| Month | p Value for Slope a | p Value for Intercept b | ||||||
|---|---|---|---|---|---|---|---|---|
| April | May | June | July | April | May | June | July | |
| April | ** | - | - | - | * | - | - | - |
| May | - | * | - | - | - | - | - | - |
| June | - | - | * | - | - | - | * | - |
| July | - | - | - | ns | - | - | - | ns |
a Significance of slope differences; b Significance of intercept differences; * p < 0.05; ** p < 0.005; ns–not significant; - not measurable.
Table A3.
p value for slope and intercept comparison of the LSDR analyses in Table 3. The differences among slopes were assessed by comparing 95% CI. When the slopes were not significantly different, the differences between elevations were estimated by ANCOVA (with body mass as a covariate).
Table A3.
p value for slope and intercept comparison of the LSDR analyses in Table 3. The differences among slopes were assessed by comparing 95% CI. When the slopes were not significantly different, the differences between elevations were estimated by ANCOVA (with body mass as a covariate).
| Feeding Types | p Value for Slope a | p Value for Intercept b | ||||||||
|---|---|---|---|---|---|---|---|---|---|---|
| FC | GC | GR | PR | SH | FC | GC | GR | PR | SH | |
| Filtering Collectors | ns | - | - | - | - | * | - | - | - | - |
| Gathering Collectors | - | ns | - | - | - | - | * | - | - | - |
| Grazers | - | - | ns | - | - | - | - | * | - | - |
| Predators | - | - | - | ns | - | - | - | - | ns | - |
| Shredders | - | - | - | - | ns | - | - | - | - | ns |
a Significance of slope differences; b Significance of intercept differences; * p < 0.05; ns–not significant; - not measurable.
Appendix B
This table contains the estimated average wet weight, abundance and feeding traits for 54 taxa collected across 2 floodplain channels in the French upper Rhone River. Below are the column names and a brief description of them: Channel = channel name (MOLO—Molottes and PONT—Ponton; Month = month of sampling; Site = sampling site in each channel (1, 2, or 3); Taxon = species name; FFG = functional feeding groups; Abundance = total abundance per taxon.
Table A4.
A unified dataset of taxon names, functional feeding groups and total abundance of macroinvertebrate species collected from the two channels on the Rhone River floodplain.
Table A4.
A unified dataset of taxon names, functional feeding groups and total abundance of macroinvertebrate species collected from the two channels on the Rhone River floodplain.
| Channel | Month | Site | Order | Family | Genus | Species | FFG | Abundance |
|---|---|---|---|---|---|---|---|---|
| MOLO | April | 2 | Ephemeroptera | Caenidae | Caenis | horaria | Gathering collectors | 1 |
| MOLO | April | 2 | Diptera | Ceratopogonidae | Gathering collectors | 5 | ||
| MOLO | April | 2 | Diptera | Chironomidae | Gathering collectors | 47 | ||
| MOLO | April | 2 | Gastropoda | Planorbidae | Gyraulus | sp. | Grazers | 9 |
| MOLO | April | 2 | Gastropoda | Planorbidae | Haitia | acuta | Grazers | 4 |
| MOLO | April | 2 | Heteroptera | Corixidae | Micronecta | sp. | Gathering collectors | 6 |
| MOLO | April | 2 | Bivalvia | Sphaeridae | Pisidium | sp. | Filtering collectors | 11 |
| MOLO | April | 2 | Odonata | Platycnemididae | Platycnemis | pennipes | Predators | 1 |
| MOLO | April | 2 | Bivalvia | Sphaeridae | Sphaerium | sp. | Filtering collectors | 1 |
| MOLO | April | 2 | Gastropoda | Valvatidae | Valvata | piscinalis | Gathering collectors | 3 |
| MOLO | April | 3 | Diptera | Ceratopogonidae | Gathering collectors | 7 | ||
| MOLO | April | 3 | Diptera | Chironomidae | Gathering collectors | 120 | ||
| MOLO | April | 3 | Gastropoda | Planorbidae | Gyraulus | sp. | Grazers | 5 |
| MOLO | April | 3 | Gastropoda | Planorbidae | Haitia | acuta | Grazers | 1 |
| MOLO | April | 3 | Coleoptera | Haliplidae | Haliplus | sp. | Predators | 1 |
| MOLO | April | 3 | Odonata | Coenagrionidae | Ischnura | elegans | Predators | 2 |
| MOLO | April | 3 | Heteroptera | Corixidae | Micronecta | sp. | Gathering collectors | 8 |
| MOLO | April | 3 | Bivalvia | Sphaeridae | Pisidium | sp. | Filtering collectors | 7 |
| MOLO | April | 3 | Megaloptera | Sialidae | Sialis | sp. | Predators | 1 |
| MOLO | April | 4 | Trichoptera | Limnephilidae | Anabolia | nervosa | Shredders | 2 |
| MOLO | April | 4 | Crustacea | Asellidae | Asellus | aquaticus | Gathering collectors | 3 |
| MOLO | April | 4 | Ephemeroptera | Caenidae | Caenis | horaria | Gathering collectors | 2 |
| MOLO | April | 4 | Diptera | Ceratopogonidae | Gathering collectors | 11 | ||
| MOLO | April | 4 | Diptera | Chironomidae | Gathering collectors | 96 | ||
| MOLO | April | 4 | Odonata | Coenagrionidae | Coenagrion | puella | Predators | 9 |
| MOLO | April | 4 | Gastropoda | Planorbidae | Gyraulus | sp. | Grazers | 6 |
| MOLO | April | 4 | Gastropoda | Planorbidae | Haitia | acuta | Grazers | 9 |
| MOLO | April | 4 | Coleoptera | Haliplidae | Haliplus | sp. | Predators | 4 |
| MOLO | April | 4 | Trichoptera | Hydroptilidae | Hydroptila | sp. | Grazers | 1 |
| MOLO | April | 4 | Gastropoda | Planorbidae | Menetus | dilatatus | Grazers | 2 |
| MOLO | April | 4 | Odonata | Libellulidae | Orthetrum | albistylum | Predators | 1 |
| MOLO | April | 4 | Odonata | Platycnemididae | Platycnemis | pennipes | Predators | 3 |
| MOLO | April | 4 | Gastropoda | Tateidae | Potamopyrgus | antipodarum | Gathering collectors | 1 |
| MOLO | April | 4 | Gastropoda | Valvatidae | Valvata | piscinalis | Gathering collectors | 1 |
| MOLO | April | 4 | Odonata | Zygoptera | Predators | 8 | ||
| MOLO | May | 1 | Crustacea | Asellidae | Asellus | aquaticus | Gathering collectors | 1 |
| MOLO | May | 1 | Gastropoda | Bithynidae | Bithynia | tentaculata | Filtering collectors | 3 |
| MOLO | May | 1 | Diptera | Chironomidae | Gathering collectors | 76 | ||
| MOLO | May | 1 | Crustacea | Crangonyctidae | Crangonyx | pseudogracilis | Shredders | 1 |
| MOLO | May | 1 | Odonata | Coenagrionidae | Erythromma | najas/viridulum | Predators | 12 |
| MOLO | May | 1 | Gastropoda | Planorbidae | Gyraulus | sp. | Grazers | 17 |
| MOLO | May | 1 | Gastropoda | Planorbidae | Haitia | acuta | Grazers | 53 |
| MOLO | May | 1 | Odonata | Coenagrionidae | Ischnura | elegans | Predators | 3 |
| MOLO | May | 1 | Heteroptera | Corixidae | Micronecta | sp. | Gathering collectors | 2 |
| MOLO | May | 1 | Gastropoda | Valvatidae | Valvata | cristata | Grazers | 2 |
| MOLO | May | 1 | Gastropoda | Valvatidae | Valvata | piscinalis | Gathering collectors | 1 |
| MOLO | May | 1 | Odonata | Zygoptera | Predators | 11 | ||
| MOLO | May | 2 | Trichoptera | Limnephilidae | Anabolia | nervosa | Shredders | 1 |
| MOLO | May | 2 | Crustacea | Asellidae | Asellus | aquaticus | Gathering collectors | 2 |
| MOLO | May | 2 | Diptera | Athericidae | Predators | 1 | ||
| MOLO | May | 2 | Gastropoda | Bithynidae | Bithynia | tentaculata | Filtering collectors | 2 |
| MOLO | May | 2 | Ephemeroptera | Caenidae | Caenis | horaria | Gathering collectors | 2 |
| MOLO | May | 2 | Diptera | Ceratopogonidae | Gathering collectors | 3 | ||
| MOLO | May | 2 | Diptera | Chironomidae | Gathering collectors | 40 | ||
| MOLO | May | 2 | Odonata | Coenagrionidae | Coenagrion | puella | Predators | 14 |
| MOLO | May | 2 | Crustacea | Crangonyctidae | Crangonyx | pseudogracilis | Shredders | 5 |
| MOLO | May | 2 | Odonata | Coenagrionidae | Erythromma | najas/viridulum | Predators | 9 |
| MOLO | May | 2 | Gastropoda | Planorbidae | Gyraulus | sp. | Grazers | 41 |
| MOLO | May | 2 | Gastropoda | Planorbidae | Haitia | acuta | Grazers | 432 |
| MOLO | May | 2 | Odonata | Coenagrionidae | Ischnura | elegans | Predators | 1 |
| MOLO | May | 2 | Odonata | Lestidae | Lestes | viridis | Predators | 2 |
| MOLO | May | 2 | Trichoptera | Limnephilidae | Limnephilus | lunatus | Shredders | 2 |
| MOLO | May | 2 | Gastropoda | Planorbidae | Menetus | dilatatus | Grazers | 1 |
| MOLO | May | 2 | Micropterna | lateralis/sequax | Shredders | 1 | ||
| MOLO | May | 2 | Odonata | Platycnemididae | Platycnemis | pennipes | Predators | 5 |
| MOLO | May | 2 | Gastropoda | Tateidae | Potamopyrgus | antipodarum | Gathering collectors | 1 |
| MOLO | May | 2 | Megaloptera | Sialidae | Sialis | sp. | Predators | 2 |
| MOLO | May | 2 | Gastropoda | Valvatidae | Valvata | piscinalis | Gathering collectors | 2 |
| MOLO | May | 3 | Ephemeroptera | Caenidae | Caenis | horaria | Gathering collectors | 4 |
| MOLO | May | 3 | Diptera | Ceratopogonidae | Gathering collectors | 7 | ||
| MOLO | May | 3 | Diptera | Chironomidae | Gathering collectors | 171 | ||
| MOLO | May | 3 | Heteroptera | Corixidae | Corixinae | sp. | Gathering collectors | 3 |
| MOLO | May | 3 | Dreissena | polymorpha | Filtering collectors | 1 | ||
| MOLO | May | 3 | Odonata | Coenagrionidae | Erythromma | najas/viridulum | Predators | 12 |
| MOLO | May | 3 | Crsutacea | Gammaridae | Shredders | 1 | ||
| MOLO | May | 3 | Gastropoda | Planorbidae | Gyraulus | sp. | Grazers | 41 |
| MOLO | May | 3 | Gastropoda | Planorbidae | Haitia | acuta | Grazers | 116 |
| MOLO | May | 3 | Coleoptera | Haliplidae | Haliplus | sp. | Predators | 5 |
| MOLO | May | 3 | Hydracarina | Predators | 18 | |||
| MOLO | May | 3 | Trichoptera | Hydroptilidae | Hydroptila | sp. | Grazers | 2 |
| MOLO | May | 3 | Gastropoda | Planorbidae | Menetus | dilatatus | Grazers | 3 |
| MOLO | May | 3 | Heteroptera | Corixidae | Micronecta | sp. | Gathering collectors | 2 |
| MOLO | May | 3 | Bivalvia | Sphaeridae | Musculium | lacustre | Filtering collectors | 6 |
| MOLO | May | 3 | Bivalvia | Sphaeridae | Pisidium | sp. | Filtering collectors | 45 |
| MOLO | May | 3 | Odonata | Platycnemididae | Platycnemis | pennipes | Predators | 1 |
| MOLO | May | 3 | Gastropoda | Tateidae | Potamopyrgus | antipodarum | Gathering collectors | 2 |
| MOLO | May | 3 | Megaloptera | Sialidae | Sialis | sp. | Predators | 4 |
| MOLO | May | 3 | Gastropoda | Valvatidae | Valvata | piscinalis | Gathering collectors | 7 |
| MOLO | June | 1 | Hirudinida | Glossiphonidae | Glossiphonia | sp. | Predators | 3 |
| MOLO | June | 1 | Trichoptera | Limnephilidae | Anabolia | nervosa | Shredders | 1 |
| MOLO | June | 1 | Gastropoda | Bithynidae | Bithynia | tentaculata | Filtering collectors | 1 |
| MOLO | June | 1 | Diptera | Ceratopogonidae | Gathering collectors | 1 | ||
| MOLO | June | 1 | Diptera | Chironomidae | Gathering collectors | 22 | ||
| MOLO | June | 1 | Heteroptera | Corixidae | Corixinae | sp. | Gathering collectors | 2 |
| MOLO | June | 1 | Odonata | Coenagrionidae | Erythromma | najas/viridulum | Predators | 12 |
| MOLO | June | 1 | Gastropoda | Planorbidae | Gyraulus | sp. | Grazers | 272 |
| MOLO | June | 1 | Gastropoda | Planorbidae | Haitia | acuta | Shredders | 1114 |
| MOLO | June | 1 | Gastropoda | Planorbidae | Menetus | dilatatus | Grazers | 18 |
| MOLO | June | 1 | Gastropoda | Tateidae | Potamopyrgus | antipodarum | Gathering collectors | 1 |
| MOLO | June | 1 | Megaloptera | Sialidae | Sialis | sp. | Predators | 2 |
| MOLO | June | 1 | Gastropoda | Valvatidae | Valvata | piscinalis | Gathering collectors | 23 |
| MOLO | June | 2 | Diptera | Chironomidae | Gathering collectors | 12 | ||
| MOLO | June | 2 | Crustacea | Crangonyctidae | Crangonyx | pseudogracilis | Shredders | 1 |
| MOLO | June | 2 | Gastropoda | Planorbidae | Gyraulus | sp. | Grazers | 10 |
| MOLO | June | 2 | Gastropoda | Planorbidae | Haitia | acuta | Grazers | 164 |
| MOLO | June | 2 | Coleoptera | Dytiscidae | Laccophilus | sp. | Predators | 1 |
| MOLO | June | 2 | Odonata | Lestidae | Lestes | viridis | Predators | 6 |
| MOLO | June | 2 | Bivalvia | Sphaeridae | Musculium | lacustre | Filtering collectors | 1 |
| MOLO | June | 2 | Bivalvia | Sphaeridae | Pisidium | sp. | Filtering collectors | 1 |
| MOLO | June | 2 | Megaloptera | Sialidae | Sialis | sp. | Predators | 1 |
| MOLO | June | 2 | Gastropoda | Valvatidae | Valvata | piscinalis | Gathering collectors | 1 |
| MOLO | June | 3 | Diptera | Chironomidae | Gathering collectors | 20 | ||
| MOLO | June | 3 | Odonata | Coenagrionidae | Coenagrion | puella | Predators | 1 |
| MOLO | June | 3 | Odonata | Coenagrionidae | Erythromma | najas/viridulum | Predators | 10 |
| MOLO | June | 3 | Heteroptera | Gerridae | Gerris | sp. | Predators | 1 |
| MOLO | June | 3 | Gastropoda | Planorbidae | Gyraulus | sp. | Grazers | 113 |
| MOLO | June | 3 | Gastropoda | Planorbidae | Haitia | acuta | Grazers | 431 |
| MOLO | June | 3 | Coleoptera | Dytiscidae | Laccophilus | sp. | Predators | 2 |
| MOLO | June | 3 | Odonata | Lestidae | Lestes | viridis | Predators | 3 |
| MOLO | June | 3 | Trichoptera | Limnephilidae | Limnephilus | lunatus | Shredders | 1 |
| MOLO | June | 3 | Gastropoda | Planorbidae | Menetus | dilatatus | Grazers | 4 |
| MOLO | June | 3 | Odonata | Libellulidae | Orthetrum | albistylum | Predators | 1 |
| MOLO | June | 3 | Gastropoda | Tateidae | Potamopyrgus | antipodarum | Gathering collectors | 3 |
| MOLO | June | 3 | Megaloptera | Sialidae | Sialis | sp. | Predators | 5 |
| MOLO | June | 3 | Diptera | Tabanidae | Predators | 1 | ||
| MOLO | June | 3 | Gastropoda | Valvatidae | Valvata | piscinalis | Gathering collectors | 30 |
| MOLO | July | 1 | Diptera | Chironomidae | Gathering collectors | 12 | ||
| MOLO | July | 1 | Gastropoda | Planorbidae | Haitia | acuta | Grazers | 48 |
| MOLO | July | 1 | Odonata | Lestidae | Lestes | viridis | Predators | 6 |
| MOLO | July | 1 | Bivalvia | Sphaeridae | Pisidium | sp. | Filtering collectors | 3 |
| MOLO | July | 1 | Megaloptera | Sialidae | Sialis | sp. | Predators | 2 |
| MOLO | July | 1 | Gastropoda | Valvatidae | Valvata | piscinalis | Gathering collectors | 10 |
| MOLO | July | 2 | Crustacea | Asellidae | Asellus | aquaticus | Gathering collectors | 1 |
| MOLO | July | 2 | Gastropoda | Bithynidae | Bithynia | tentaculata | Filtering collectors | 6 |
| MOLO | July | 2 | Diptera | Chironomidae | Gathering collectors | 64 | ||
| MOLO | July | 2 | Bivalvia | Corbiculidae | Corbicula | fluminea | Filtering collectors | 1 |
| MOLO | July | 2 | Heteroptera | Corixidae | Corixinae | sp. | Gathering collectors | 1 |
| MOLO | July | 2 | Odonata | Coenagrionidae | Erythromma | najas/viridulum | Predators | 3 |
| MOLO | July | 2 | Crsutacea | Gammaridae | Shredders | 8 | ||
| MOLO | July | 2 | Gastropoda | Planorbidae | Gyraulus | sp. | Grazers | 15 |
| MOLO | July | 2 | Gastropoda | Planorbidae | Haitia | acuta | Grazers | 85 |
| MOLO | July | 2 | Coleoptera | Haliplidae | Haliplus | sp. | Predators | 1 |
| MOLO | July | 2 | Hydracarina | Predators | 2 | |||
| MOLO | July | 2 | Coleoptera | Dytiscidae | Laccophilus | sp. | Predators | 1 |
| MOLO | July | 2 | Odonata | Lestidae | Lestes | viridis | Predators | 3 |
| MOLO | July | 2 | Gastropoda | Planorbidae | Menetus | dilatatus | Grazers | 5 |
| MOLO | July | 2 | Bivalvia | Sphaeridae | Pisidium | sp. | Filtering collectors | 1 |
| MOLO | July | 2 | Gastropoda | Tateidae | Potamopyrgus | antipodarum | Gathering collectors | 1 |
| MOLO | July | 2 | Megaloptera | Sialidae | Sialis | sp. | Predators | 2 |
| MOLO | July | 2 | Gastropoda | Valvatidae | Valvata | piscinalis | Gathering collectors | 5 |
| MOLO | July | 4 | Gastropoda | Bithynidae | Bithynia | tentaculata | Filtering collectors | 4 |
| MOLO | July | 4 | Diptera | Chironomidae | Gathering collectors | 4 | ||
| MOLO | July | 4 | Gastropoda | Planorbidae | Gyraulus | sp. | Grazers | 40 |
| MOLO | July | 4 | Gastropoda | Planorbidae | Haitia | acuta | Grazers | 135 |
| MOLO | July | 4 | Odonata | Lestidae | Lestes | viridis | Predators | 8 |
| MOLO | July | 4 | Gastropoda | Planorbidae | Menetus | dilatatus | Grazers | 2 |
| MOLO | July | 4 | Heteroptera | Corixidae | Micronecta | sp. | Gathering collectors | 3 |
| MOLO | July | 4 | Heteroptera | Naucoridae | Naucoris | maculatus | Predators | 1 |
| MOLO | July | 4 | Lepidoptera | Crambidae | Parapoynx | stratiotata | Shredders | 4 |
| MOLO | July | 4 | Bivalvia | Sphaeridae | Pisidium | sp. | Filtering collectors | 3 |
| MOLO | July | 4 | Megaloptera | Sialidae | Sialis | sp. | Predators | 3 |
| MOLO | July | 4 | Gastropoda | Valvatidae | Valvata | piscinalis | Gathering collectors | 22 |
| PONT | April | 2 | Trichoptera | Limnephilidae | Anabolia | nervosa | Shredders | 1 |
| PONT | April | 2 | Crustacea | Asellidae | Asellus | aquaticus | Gathering collectors | 3 |
| PONT | April | 2 | Gastropoda | Bithynidae | Bithynia | tentaculata | Filtering collectors | 8 |
| PONT | April | 2 | Ephemeroptera | Caenidae | Caenis | horaria | Gathering collectors | 19 |
| PONT | April | 2 | Ephemroptera | Caenidae | Caenis | robusta | Gathering collectors | 5 |
| PONT | April | 2 | Diptera | Ceratopogonidae | Gathering collectors | 149 | ||
| PONT | April | 2 | Diptera | Chironomidae | Gathering collectors | 674 | ||
| PONT | April | 2 | Odonata | Coenagrionidae | Coenagrion | puella | Predators | 1 |
| PONT | April | 2 | Odonata | Coenagrionidae | Erythromma | najas/viridulum | Predators | 2 |
| PONT | April | 2 | Gastropoda | Planorbidae | Gyraulus | sp. | Grazers | 10 |
| PONT | April | 2 | Gastropoda | Planorbidae | Hippeutis | complanatus | Grazers | 2 |
| PONT | April | 2 | Hydracarina | Predators | 9 | |||
| PONT | April | 2 | Trichoptera | Hydroptilidae | Hydroptila | sp. | Grazers | 1 |
| PONT | April | 2 | Heteroptera | Corixidae | Micronecta | sp. | Gathering collectors | 6 |
| PONT | April | 2 | Bivalvia | Sphaeridae | Musculium | lacustre | Filtering collectors | 18 |
| PONT | April | 2 | Bivalvia | Sphaeridae | Pisidium | sp. | Filtering collectors | 11 |
| PONT | April | 2 | Bivalvia | Sphaeridae | Filtering collectors | 3 | ||
| PONT | April | 2 | Gastropoda | Valvatidae | Valvata | piscinalis | Gathering collectors | 25 |
| PONT | April | 3 | Trichoptera | Limnephilidae | Anabolia | nervosa | Shredders | 1 |
| PONT | April | 3 | Crustacea | Asellidae | Asellus | aquaticus | Gathering collectors | 4 |
| PONT | April | 3 | Gastropoda | Bithynidae | Bithynia | tentaculata | Filtering collectors | 11 |
| PONT | April | 3 | Ephemeroptera | Caenidae | Caenis | horaria | Gathering collectors | 5 |
| PONT | April | 3 | Diptera | Chironomidae | Gathering collectors | 132 | ||
| PONT | April | 3 | Odonata | Coenagrionidae | Coenagrion | puella | Predators | 2 |
| PONT | April | 3 | Gastropoda | Planorbidae | Gyraulus | sp. | Grazers | 4 |
| PONT | April | 3 | Gastropoda | Planorbidae | Haitia | acuta | Grazers | 1 |
| PONT | April | 3 | Heteroptera | Corixidae | Micronecta | sp. | Gathering collectors | 1 |
| PONT | April | 3 | Odonata | Libellulidae | Orthetrum | albistylum | Predators | 2 |
| PONT | April | 3 | Bivalvia | Sphaeridae | Pisidium | sp. | Filtering collectors | 3 |
| PONT | April | 3 | Bivalvia | Sphaeridae | Filtering collectors | 2 | ||
| PONT | April | 3 | Diptera | Tabanidae | Predators | 1 | ||
| PONT | April | 3 | Gastropoda | Valvatidae | Valvata | piscinalis | Gathering collectors | 3 |
| PONT | April | 4 | Crustacea | Asellidae | Asellus | aquaticus | Gathering collectors | 7 |
| PONT | April | 4 | Trichoptera | Leptoceridae | Athripsodes | sp. | Shredders | 1 |
| PONT | April | 4 | Gastropoda | Bithynidae | Bithynia | tentaculata | Filtering collectors | 33 |
| PONT | April | 4 | Ephemeroptera | Caenidae | Caenis | horaria | Gathering collectors | 34 |
| PONT | April | 4 | Diptera | Ceratopogonidae | Gathering collectors | 98 | ||
| PONT | April | 4 | Diptera | Chironomidae | Gathering collectors | 214 | ||
| PONT | April | 4 | Odonata | Coenagrionidae | Coenagrion | puella | Predators | 1 |
| PONT | April | 4 | Hirudinida | Glossiphonidae | Glossiphonia | sp. | Predators | 2 |
| PONT | April | 4 | Gastropoda | Planorbidae | Gyraulus | sp. | Grazers | 9 |
| PONT | April | 4 | Odonata | Coenagrionidae | Ischnura | elegans | Predators | 2 |
| PONT | April | 4 | Heteroptera | Corixidae | Micronecta | sp. | Gathering collectors | 18 |
| PONT | April | 4 | Trichoptera | Leptoceridae | Mystacides | azurea | Gathering collectors | 1 |
| PONT | April | 4 | Bivalvia | Sphaeridae | Pisidium | sp. | Filtering collectors | 80 |
| PONT | April | 4 | Odonata | Platycnemididae | Platycnemis | pennipes | Predators | 6 |
| PONT | April | 4 | Gastropoda | Tateidae | Potamopyrgus | antipodarum | Gathering collectors | 1 |
| PONT | April | 4 | Bivalvia | Sphaeridae | Filtering collectors | 4 | ||
| PONT | April | 4 | Diptera | Tabanidae | Predators | 6 | ||
| PONT | April | 4 | Gastropoda | Valvatidae | Valvata | piscinalis | Gathering collectors | 20 |
| PONT | May | 1 | Crustacea | Asellidae | Asellus | aquaticus | Gathering collectors | 1 |
| PONT | May | 1 | Gastropoda | Bithynidae | Bithynia | tentaculata | Filtering collectors | 5 |
| PONT | May | 1 | Ephemeroptera | Caenidae | Caenis | horaria | Gathering collectors | 5 |
| PONT | May | 1 | Diptera | Ceratopogonidae | Gathering collectors | 20 | ||
| PONT | May | 1 | Diptera | Chironomidae | Gathering collectors | 61 | ||
| PONT | May | 1 | Odonata | Coenagrionidae | Erythromma | najas/viridulum | Predators | 2 |
| PONT | May | 1 | Hirudinida | Glossiphonidae | Glossiphonia | sp. | Predators | 2 |
| PONT | May | 1 | Gastropoda | Planorbidae | Gyraulus | sp. | Grazers | 3 |
| PONT | May | 1 | Trichoptera | Limnephilidae | Limnephilus | lunatus | Shredders | 1 |
| PONT | May | 1 | Heteroptera | Corixidae | Micronecta | sp. | Gathering collectors | 1 |
| PONT | May | 1 | Bivalvia | Sphaeridae | Pisidium | sp. | Filtering collectors | 7 |
| PONT | May | 1 | Gastropoda | Tateidae | Potamopyrgus | antipodarum | Gathering collectors | 1 |
| PONT | May | 1 | Gastropoda | Valvatidae | Valvata | piscinalis | Gathering collectors | 9 |
| PONT | May | 2 | Crustacea | Asellidae | Asellus | aquaticus | Gathering collectors | 2 |
| PONT | May | 2 | Gastropoda | Bithynidae | Bithynia | tentaculata | Filtering collectors | 5 |
| PONT | May | 2 | Ephemeroptera | Caenidae | Caenis | horaria | Gathering collectors | 16 |
| PONT | May | 2 | Diptera | Ceratopogonidae | Gathering collectors | 33 | ||
| PONT | May | 2 | Diptera | Chironomidae | Gathering collectors | 57 | ||
| PONT | May | 2 | Odonata | Coenagrionidae | Coenagrion | puella | Predators | 4 |
| PONT | May | 2 | Hirudinida | Glossiphonidae | Glossiphonia | sp. | Predators | 4 |
| PONT | May | 2 | Hydracarina | Predators | 7 | |||
| PONT | May | 2 | Bivalvia | Sphaeridae | Musculium | lacustre | Filtering collectors | 1 |
| PONT | May | 2 | Trichoptera | Leptoceridae | Oecetis | ochracea | Predators | 1 |
| PONT | May | 2 | Megaloptera | Sialidae | Sialis | sp. | Predators | 4 |
| PONT | May | 2 | Gastropoda | Valvatidae | Valvata | piscinalis | Gathering collectors | 6 |
| PONT | May | 4 | Crustacea | Asellidae | Asellus | aquaticus | Gathering collectors | 3 |
| PONT | May | 4 | Gastropoda | Bithynidae | Bithynia | tentaculata | Filtering collectors | 2 |
| PONT | May | 4 | Ephemeroptera | Caenidae | Caenis | horaria | Gathering collectors | 21 |
| PONT | May | 4 | Diptera | Chironomidae | Gathering collectors | 41 | ||
| PONT | May | 4 | Odonata | Coenagrionidae | Erythromma | najas/viridulum | Predators | 4 |
| PONT | May | 4 | Gastropoda | Planorbidae | Gyraulus | sp. | Grazers | 3 |
| PONT | May | 4 | Heteroptera | Corixidae | Micronecta | sp. | Gathering collectors | 2 |
| PONT | May | 4 | Bivalvia | Sphaeridae | Musculium | lacustre | Filtering collectors | 1 |
| PONT | May | 4 | Trichoptera | Leptoceridae | Mystacides | azurea | Gathering collectors | 1 |
| PONT | May | 4 | Bivalvia | Sphaeridae | Pisidium | sp. | Filtering collectors | 6 |
| PONT | May | 4 | Odonata | Platycnemididae | Platycnemis | pennipes | Predators | 4 |
| PONT | May | 4 | Megaloptera | Sialidae | Sialis | sp. | Predators | 5 |
| PONT | May | 4 | Gastropoda | Valvatidae | Valvata | piscinalis | Gathering collectors | 6 |
| PONT | June | 1 | Coleoptera | Dytiscidae | Laccophilus | sp. | Predators | 2 |
| PONT | June | 2 | Gastropoda | Bithynidae | Bithynia | tentaculata | Filtering collectors | 1 |
| PONT | June | 2 | Ephemeroptera | Caenidae | Caenis | horaria | Gathering collectors | 4 |
| PONT | June | 2 | Diptera | Ceratopogonidae | Gathering collectors | 6 | ||
| PONT | June | 2 | Diptera | Chironomidae | Gathering collectors | 93 | ||
| PONT | June | 2 | Odonata | Coenagrionidae | Coenagrion | puella | Predators | 3 |
| PONT | June | 2 | Hirudinida | Erpobdellidae | Predators | 1 | ||
| PONT | June | 2 | Gastropoda | Planorbidae | Gyraulus | sp. | Grazers | 2 |
| PONT | June | 2 | Gastropoda | Planorbidae | Haitia | acuta | Grazers | 1 |
| PONT | June | 2 | Hydracarina | Predators | 8 | |||
| PONT | June | 2 | Coleoptera | Dytiscidae | Laccophilus | sp. | Predators | 1 |
| PONT | June | 2 | Trichoptera | Leptoceridae | Oecetis | ochracea | Predators | 1 |
| PONT | June | 2 | Gastropoda | Tateidae | Potamopyrgus | antipodarum | Gathering collectors | 2 |
| PONT | June | 2 | Megaloptera | Sialidae | Sialis | sp. | Predators | 9 |
| PONT | June | 2 | Diptera | Tabanidae | Predators | 3 | ||
| PONT | June | 2 | Gastropoda | Valvatidae | Valvata | piscinalis | Gathering collectors | 7 |
| PONT | June | 3 | Odonata | Aeschnidae | Aeschna | sp. | Predators | 1 |
| PONT | June | 3 | Crustacea | Asellidae | Asellus | aquaticus | Gathering collectors | 3 |
| PONT | June | 3 | Gastropoda | Bithynidae | Bithynia | tentaculata | Filtering collectors | 3 |
| PONT | June | 3 | Ephemeroptera | Caenidae | Caenis | horaria | Gathering collectors | 7 |
| PONT | June | 3 | Diptera | Ceratopogonidae | Gathering collectors | 10 | ||
| PONT | June | 3 | Diptera | Chironomidae | Gathering collectors | 131 | ||
| PONT | June | 3 | Heteroptera | Corixidae | Corixinae | sp. | Gathering collectors | 3 |
| PONT | June | 3 | Coleoptera | Dytiscidae | Dytiscus | sp. | Predators | 3 |
| PONT | June | 3 | Odonata | Coenagrionidae | Erythromma | najas/viridulum | Predators | 1 |
| PONT | June | 3 | Hirudinida | Glossiphonidae | Glossiphonia | sp. | Predators | 2 |
| PONT | June | 3 | Gastropoda | Planorbidae | Gyraulus | sp. | Grazers | 7 |
| PONT | June | 3 | Gastropoda | Planorbidae | Haitia | acuta | Grazers | 1 |
| PONT | June | 3 | Hydracarina | Predators | 7 | |||
| PONT | June | 3 | Odonata | Libellulidae | Libellula | despressa | Predators | 1 |
| PONT | June | 3 | Bivalvia | Sphaeridae | Pisidium | sp. | Filtering collectors | 26 |
| PONT | June | 3 | Megaloptera | Sialidae | Sialis | sp. | Predators | 10 |
| PONT | June | 3 | Bivalvia | Sphaeridae | Filtering collectors | 6 | ||
| PONT | June | 3 | Diptera | Tabanidae | Predators | 1 | ||
| PONT | June | 3 | Gastropoda | Valvatidae | Valvata | piscinalis | Gathering collectors | 10 |
| PONT | June | 4 | Gastropoda | Bithynidae | Bithynia | tentaculata | Filtering collectors | 1 |
| PONT | June | 4 | Ephemeroptera | Caenidae | Caenis | horaria | Gathering collectors | 3 |
| PONT | June | 4 | Diptera | Ceratopogonidae | Gathering collectors | 2 | ||
| PONT | June | 4 | Diptera | Chironomidae | Gathering collectors | 134 | ||
| PONT | June | 4 | Coleoptera | Dytiscidae | Dytiscus | sp. | Predators | 4 |
| PONT | June | 4 | Odonata | Coenagrionidae | Erythromma | najas/viridulum | Predators | 1 |
| PONT | June | 4 | Hirudinida | Glossiphonidae | Glossiphonia | sp. | Predators | 1 |
| PONT | June | 4 | Heteroptera | Corixidae | Micronecta | sp. | Gathering collectors | 14 |
| PONT | June | 4 | Bivalvia | Sphaeridae | Pisidium | sp. | Filtering collectors | 19 |
| PONT | June | 4 | Megaloptera | Sialidae | Sialis | sp. | Predators | 6 |
| PONT | June | 4 | Bivalvia | Sphaeridae | Filtering collectors | 1 | ||
| PONT | June | 4 | Diptera | Tabanidae | Predators | 1 | ||
| PONT | June | 4 | Gastropoda | Valvatidae | Valvata | piscinalis | Gathering collectors | 1 |
| PONT | July | 1 | Trichoptera | Limnephilidae | Anabolia | nervosa | Shredders | 1 |
| PONT | July | 1 | Crustacea | Asellidae | Asellus | aquaticus | Gathering collectors | 17 |
| PONT | July | 1 | Trichoptera | Leptoceridae | Athripsodes | sp. | Shredders | 6 |
| PONT | July | 1 | Gastropoda | Bithynidae | Bithynia | tentaculata | Filtering collectors | 143 |
| PONT | July | 1 | Ephemeroptera | Caenidae | Caenis | horaria | Gathering collectors | 130 |
| PONT | July | 1 | Ephemeroptera | Caenidae | Caenis | luctuosa | Gathering collectors | 1 |
| PONT | July | 1 | Diptera | Ceratopogonidae | Gathering collectors | 10 | ||
| PONT | July | 1 | Diptera | Chironomidae | Gathering collectors | 354 | ||
| PONT | July | 1 | Heteroptera | Corixidae | Corixinae | sp. | Gathering collectors | 24 |
| PONT | July | 1 | Ephemeroptera | Ephemeridae | Ephemera | sp. | Filtering collectors | 24 |
| PONT | July | 1 | Odonata | Coenagrionidae | Erythromma | najas/viridulum | Predators | 2 |
| PONT | July | 1 | Odonata | Coenagrionidae | Erythromma | najas/viridulum | Predators | 7 |
| PONT | July | 1 | Hirudinida | Glossiphonidae | Glossiphonia | sp. | Predators | 33 |
| PONT | July | 1 | Gastropoda | Planorbidae | Gyraulus | sp. | Grazers | 13 |
| PONT | July | 1 | Gastropoda | Planorbidae | Haitia | acuta | Grazers | 3 |
| PONT | July | 1 | Coleoptera | Haliplidae | Haliplus | sp. | Predators | 4 |
| PONT | July | 1 | Gastropoda | Planorbidae | Hippeutis | complanatus | Grazers | 2 |
| PONT | July | 1 | Hydracarina | Predators | 18 | |||
| PONT | July | 1 | Trichoptera | Limnephilidae | Limnephilus | lunatus | Shredders | 1 |
| PONT | July | 1 | Heteroptera | Corixidae | Micronecta | sp. | Gathering collectors | 50 |
| PONT | July | 1 | Trichoptera | Leptoceridae | Mystacides | azurea | Gathering collectors | 1 |
| PONT | July | 1 | Odonata | Libellulidae | Orthetrumalbistylum | Predators | 1 | |
| PONT | July | 1 | Gastropoda | Tateidae | Potamopyrgus | antipodarum | Gathering collectors | 5 |
| PONT | July | 1 | Megaloptera | Sialidae | Sialis | sp. | Predators | 8 |
| PONT | July | 1 | Bivalvia | Sphaeridae | Filtering collectors | 1 | ||
| PONT | July | 1 | Diptera | Tabanidae | Predators | 1 | ||
| PONT | July | 1 | Gastropoda | Valvatidae | Valvata | piscinalis | Gathering collectors | 3 |
| PONT | July | 3 | Trichoptera | Leptoceridae | Athripsodes | sp. | Shredders | 1 |
| PONT | July | 3 | Ephemeroptera | Caenidae | Caenis | horaria | Gathering collectors | 22 |
| PONT | July | 3 | Diptera | Chironomidae | Gathering collectors | 54 | ||
| PONT | July | 3 | Heteroptera | Corixidae | Corixinae | sp. | Gathering collectors | 6 |
| PONT | July | 3 | Gastropoda | Planorbidae | Gyraulus | sp. | Grazers | 2 |
| PONT | July | 3 | Gastropoda | Planorbidae | Haitia | acuta | Grazers | 1 |
| PONT | July | 3 | Coleoptera | Haliplidae | Haliplus | sp. | Predators | 3 |
| PONT | July | 3 | Coleoptera | Dytiscidae | Laccophilus | sp. | Predators | 1 |
| PONT | July | 3 | Odonata | Lestidae | Lestes | viridis | Predators | 2 |
| PONT | July | 3 | Heteroptera | Corixidae | Micronecta | sp. | Gathering collectors | 7 |
| PONT | July | 3 | Bivalvia | Sphaeridae | Pisidium | sp. | Filtering collectors | 7 |
| PONT | July | 3 | Megaloptera | Sialidae | Sialis | sp. | Predators | 4 |
| PONT | July | 3 | Bivalvia | Sphaeridae | Filtering collectors | 8 | ||
| PONT | July | 3 | Gastropoda | Valvatidae | Valvata | piscinalis | Gathering collectors | 17 |
| PONT | July | 4 | Crustacea | Asellidae | Asellus | aquaticus | Gathering collectors | 4 |
| PONT | July | 4 | Gastropoda | Bithynidae | Bithynia | tentaculata | Filtering collectors | 20 |
| PONT | July | 4 | Ephemeroptera | Caenidae | Caenis | horaria | Gathering collectors | 18 |
| PONT | July | 4 | Diptera | Chironomidae | Gathering collectors | 56 | ||
| PONT | July | 4 | Heteroptera | Corixidae | Corixinae | sp. | Gathering collectors | 2 |
| PONT | July | 4 | Gastropoda | Planorbidae | Gyraulus | sp. | Grazers | 2 |
| PONT | July | 4 | Gastropoda | Planorbidae | Haitia | acuta | Grazers | 1 |
| PONT | July | 4 | Coleoptera | Dytiscidae | Laccophilus | sp. | Predators | 2 |
| PONT | July | 4 | Odonata | Lestidae | Lestes | viridis | Predators | 2 |
| PONT | July | 4 | Heteroptera | Corixidae | Micronecta | sp. | Gathering collectors | 1 |
| PONT | July | 4 | Megaloptera | Sialidae | Sialis | sp. | Predators | 9 |
| PONT | July | 4 | Bivalvia | Sphaeridae | Filtering collectors | 3 | ||
| PONT | July | 4 | Gastropoda | Valvatidae | Valvata | piscinalis | Gathering collectors | 2 |
References
- Blackburn, T.M.; Gaston, K.J. Animal body size distributions: Patterns, mechanisms and implications. Trends Ecol. Evol. 1994, 9, 471–474. [Google Scholar] [CrossRef]
- Blackburn, T.M.; Gaston, K.J. The relationship between animal abundance and body size: A review of the mechanisms. Adv. Ecol. Res. 1999, 28, 181–210. [Google Scholar]
- Woodward, G.U.Y.; Hildrew, A.G. Body size determinants of niche overlap and intraguild predation within a complex food web. J. Anim. Ecol. 2002, 71, 1063–1074. [Google Scholar] [CrossRef]
- Woodward, G.; Ebenman, B.; Emmerson, M.; Montoya, J.M.; Olesen, J.M.; Valido, A.; Warren, P.H. Body size in ecological networks. Trends Ecol. Evol. 2005, 20, 402–409. [Google Scholar] [CrossRef] [Green Version]
- Brown, J.H. Macroecology; University of Chicago Press: Chicago, IL, USA, 1995. [Google Scholar]
- Gaston, K.J.; Blackburn, T.M. Pattern and Process in Macroecology; Blackwell Science: Oxford, UK, 2000. [Google Scholar]
- White, E.P.; Ernest, S.M.; Kerkhoff, A.J.; Enquist, B.J. Relationships between body size and abundance in ecology. Trends Ecol. Evol. 2007, 22, 323–330. [Google Scholar] [CrossRef] [Green Version]
- Damuth, J.D. Population density and body size in mammals. Nature 1981, 290, 699–700. [Google Scholar] [CrossRef]
- Damuth, J.D. Of size and abundance. Nature 1991, 351, 268–269. [Google Scholar] [CrossRef]
- Damuth, J.D. Population ecology: Common rules for animals and plants. Nature 1998, 395, 115–116. [Google Scholar] [CrossRef]
- Brown, J.H.; Gilloly, J.F.; Allen, A.P.; Savage, V.M.; West, G.B. Toward a metabolic theory of ecology. Ecology 2004, 85, 1771–1789. [Google Scholar] [CrossRef]
- Brown, J.H.; Maurer, B.A. Evolution of species assemblages: Effects of energetic constraints and species dynamics on the diversification of the North American avifauna. Am. Nat. 1987, 130, 1–17. [Google Scholar] [CrossRef]
- Damuth, J. Cope’s rule, the island rule and the scaling of mammalian population density. Nature 1993, 365, 748–750. [Google Scholar] [CrossRef] [PubMed]
- Illius, A.W.; Gordon, I.J. Modelling the nutritional ecology of ungulate herbivores: Evolution of body size and competitive interactions. Oecologia 1992, 89, 428–434. [Google Scholar] [CrossRef] [PubMed]
- Gaston, K.J.; Blackburn, T.M. Global scale macroecology: Interactions between population size, geographic range size and body size in the Anseriformes. J. Anim. Ecol. 1996, 65, 701–714. [Google Scholar] [CrossRef]
- Siemann, E.; Tilman, D.; Haarstad, J. Insect species diversity, abundance and body size relationships. Nature 1996, 380, 704–706. [Google Scholar] [CrossRef]
- Nee, S.; Read, A.F.; Greenwood, J.J.; Harvey, P.H. The relationship between abundance and body size in British birds. Nature 1991, 351, 312–313. [Google Scholar] [CrossRef]
- Blackburn, T.M.; Harvey, P.H.; Pagel, M.D. Species number, population density and body size relationships in natural communities. J. Anim. Ecol. 1990, 59, 335–345. [Google Scholar] [CrossRef]
- Blackburn, T.M.; Brown, V.K.; Doube, B.M.; Greenwood, J.J.; Lawton, J.H.; Stork, N.E. The relationship between abundance and body size in natural animal assemblages. J. Anim. Ecol. 1993, 62, 519–528. [Google Scholar] [CrossRef]
- Cyr, H.; Peters, R.H.; Downing, J.A. Population density and community size structure: Comparison of aquatic and terrestrial systems. Oikos 1997, 80, 139–149. [Google Scholar] [CrossRef]
- Jonsson, T.; Cohen, J.E.; Carpenter, S.R. Food webs, body size, and species abundance in ecological community description. Adv. Ecol. Res. 2005, 36, 1–84. [Google Scholar]
- Cyr, H. Individual energy use and the allometry of population density. In Scaling in Biology; Brown, J.H., West, G.B., Eds.; University Press: Oxford, UK, 2000; pp. 267–283. [Google Scholar]
- Marquet, P.A.; Navarrete, S.A.; Castilla, J.C. Scaling population-density to body size in rocky intertidal communities. Science 1990, 250, 1125–1127. [Google Scholar] [CrossRef]
- Schmid-Araya, J.M.; Schmid, P.E.; Majdi, N.; Traunspurger, W. Biomass and production of freshwater meiofauna: A review and a new allometric model. Hydrobiologia 2020, 847, 2681–2703. [Google Scholar] [CrossRef]
- Arim, M.; Berazategui, M.; Barreneche, J.M.; Ziegler, L.; Zarucki, M.; Abades, S.R. Determinants of density–body size scaling within food webs and tools for their detection. Adv. Ecol. Res. 2011, 45, 1–39. [Google Scholar]
- Gjoni, V.; Cozzoli, F.; Rosati, I.; Basset, A. Size-density relationships: A cross-community approach to benthic macroinvertebrates in Mediterranean and Black Sea lagoons. Estuar. Coast 2017, 40, 1142–1158. [Google Scholar] [CrossRef]
- Lawton, J.H. Species richness and population dynamics of animal assemblages. Patterns in body size: Abundance space. Philos. Trans. R. Soc. Lond. B Biol. Sci. 1990, 330, 283–291. [Google Scholar]
- Cotgreave, P. The relationship between body size and population abundance in animals. Trends Ecol. Evol. 1993, 8, 244–248. [Google Scholar] [CrossRef]
- Marquet, P.A.; Navarrete, S.A.; Castilla, J.C. Body size, population density, and the energetic equivalence rule. J. Anim. Ecol. 1995, 64, 325–332. [Google Scholar] [CrossRef]
- Greve, M.; Gaston, K.J.; Van Rensburg, B.J.; Chown, S.L. Environmental factors, regional body size distributions and spatial variation in body size of local avian assemblages. Glob. Ecol. Biogeogr. 2008, 17, 514–523. [Google Scholar] [CrossRef]
- Kozłowski, J.; Gawelczyk, A.T. Why are species’ body size distributions usually skewed to the right? Funct. Ecol. 2002, 16, 419–432. [Google Scholar] [CrossRef]
- Statzner, B.; Moss, B. Linking ecological function, biodiversity and habitat: A mini-review focusing on older ecological literature. Basic Appl. Ecol. 2004, 5, 97–106. [Google Scholar] [CrossRef]
- Stead, T.K.; Schmid-Araya, J.M.; Schmid, P.E.; Hildrew, A.G. The distribution of body size in a stream community: One system, many patterns. J. Anim. Ecol. 2005, 74, 475–487. [Google Scholar] [CrossRef]
- Schmid, P.E.; Tokeshi, M.; Schmid-Araya, J.M. Scaling in stream communities. Proc. R. Soc. Lond. B 2002, 269, 2587–2594. [Google Scholar] [CrossRef] [PubMed] [Green Version]
- Schmid, P.E.; Tokeshi, M.; Schmid-Araya, J.M. Relation between population density and body size in stream communities. Science 2000, 289, 1557–1560. [Google Scholar] [CrossRef] [PubMed] [Green Version]
- Bell, S.S.; McCoy, E.D.; Mushinsky, H.R. Habitat Structure: The Physical Arrangement of Objects in Space; Chapman and Hall: London, UK, 1991. [Google Scholar]
- Stelzer, P.S.; Mazzuco, A.C.A.; Gomes, L.E.; Martins, J.; Netto, S.; Bernardino, A.F. Taxonomic and functional diversity of benthic macrofauna associated with rhodolith beds in SE Brazil. PeerJ 2021, 9, e11903. [Google Scholar] [CrossRef] [PubMed]
- Wallace, J.B.; Webster, J.R. The role of macroinvertebrates in stream ecosystem function. Annu. Rev. Entomol. 1996, 41, 115–139. [Google Scholar] [CrossRef]
- Cummins, K.W.; Merritt, R.W.; Andrade, P.C. The use of invertebrate functional groups to characterize ecosystem attributes in selected streams and rivers in south Brazil. Stud. Neotrop. Fauna Environ. 2005, 40, 69–89. [Google Scholar] [CrossRef]
- Olivier, J.M.; Carrel, G.; Lamouroux, N.; Dole-Olivier, M.J.; Malard, F.; Bravard, J.P.; Amoros, C. Chapter 7—The Rhône River Basin. In Rivers of Europe; Academic Press: Cambridge, MA, USA, 2009; pp. 247–295. [Google Scholar]
- Marle, P.; Riquier, J.; Timoner, P.; Mayor, H.; Slaveykova, V.I.; Castella, E. The interplay of flow processes shapes aquatic invertebrate successions in floodplain channels—A modelling applied to restoration scenarios. Sci. Total Environ. 2021, 750, 142081. [Google Scholar] [CrossRef]
- Blinn, W.; Shannon, J.P.; Stevens, L.E.; Carder, J.P. Consequences of fluctuating discharge for communities. J. N. Am. Benthol. Soc. 1995, 14, 233–248. [Google Scholar] [CrossRef]
- Humphries, P.; King, A.J.; Koehn, J.D. Fish, flows and flood plains: Links between freshwater fishes and their environment in the Murray-Darling River system, Australia. Environ. Biol. Fishes 1999, 56, 129–151. [Google Scholar] [CrossRef]
- King, A.J.; Humphries, P.; Lake, P.S. Fish recruitment on floodplains: The roles of patterns of flooding and life history characteristics. Can. J. Fish. Aquat. Sci. 2003, 60, 773–786. [Google Scholar] [CrossRef]
- Marle, P.; Rabarivelo, S.; Marechal, S.; Castella, E.; Rosset, V.; Roger, M. Light-trapped caddisfly assemblages in two floodplain reaches of the French upper Rhone River [Trichoptera]. Ephemera 2016, 18, 41–59. [Google Scholar]
- Smith, R.J. Use and misuse of the reduced major axis for line-fitting. Am. J. Phys. Anthropol. 2009, 140, 476–486. [Google Scholar] [CrossRef] [PubMed]
- Glazier, D.S. A unifying explanation for diverse metabolic scaling in animals and plants. Biol. Rev. 2010, 85, 111–138. [Google Scholar] [CrossRef] [PubMed]
- Kerkhoff, A.J.; Enquist, B.J. Multiplicative by nature: Why logarithmic transformation is necessary in allometry. J. Theor. Biol. 2009, 257, 519–521. [Google Scholar] [CrossRef]
- Glazier, D.S. Log-transformation is useful for examining proportional relationships in allometric scaling. J. Theor. Biol. 2013, 334, 200–203. [Google Scholar] [CrossRef]
- Gjoni, V.; Ghinis, S.; Pinna, M.; Mazzotta, L.; Marini, G.; Ciotti, M.; Rosati, I.; Vignes, F.; Arima, S.; Basset, A. Patterns of functional diversity of macroinvertebrates across three aquatic ecosystem types, NE Mediterranean. MMS 2019, 20, 703–717. [Google Scholar] [CrossRef] [Green Version]
- Gjoni, V.; Basset, A. A cross-community approach to energy pathways across lagoon macroinvertebrate guilds. Estuar. Coast 2018, 41, 2433–2446. [Google Scholar] [CrossRef]
- Gjoni, V.; Glazier, D.S. A perspective on body size and abundance relationships across ecological communities. Biology 2020, 9, 42. [Google Scholar] [CrossRef] [Green Version]
- Blackburn, J.H.; Gaston, J.F. A critical assessment of the form of the interspecific relationship between abundance and body size in animals. J. Anim. Ecol. 1997, 66, 233–249. [Google Scholar] [CrossRef]
- Pagel, M.D.; Harvey, P.H.; Godfray, H.C.J. Species-abundance, biomass, and resource-use distributions. Am. Nat. 1991, 138, 836–850. [Google Scholar] [CrossRef]
- Brawn, J.D.; Karr, J.R.; Nichols, J.D. Demography of birds in a Neotropical forest: Effects of allometry, taxonomy, and ecology. Ecology 1995, 76, 41–51. [Google Scholar] [CrossRef]
- Russo, S.E.; Robinson, S.K.; Terborgh, J. Size-abundance relationships in an Amazonian bird community: Implications for the energetic equivalence rule. Am. Nat. 2003, 161, 267–283. [Google Scholar] [CrossRef] [PubMed] [Green Version]
- Glazier, D.S. The 3/4-power law is not universal: Evolution of isometric, ontogenetic metabolic scaling in pelagic animals. BioScience 2006, 56, 325332. [Google Scholar] [CrossRef] [Green Version]
- Shokri, M.; Ciotti, M.; Vignes, F.; Gjoni, V.; Basset, A. Components of standard metabolic rate variability in three species of gammarids. Web. Ecol. 2019, 19, 1–13. [Google Scholar] [CrossRef]
- Cozzoli, F.; Shokri, M.; Ligetta, G.; Ciotti, M.; Gjoni, V.; Marocco, V.; Vignes, F.; Basset, A. Relationship between individual metabolic rate and patch departure behaviour: Evidence from aquatic gastropods. Oikos 2020, 129, 1657–1667. [Google Scholar] [CrossRef]
- Glazier, D.S.; Butler, E.M.; Lombardi, S.A.; Deptola, T.J.; Reese, A.J.; Satterthwaite, E.V. Ecological effects on metabolic scaling: Amphipod responses to fish predators in freshwater springs. Ecol. Monog. 2011, 81, 599–618. [Google Scholar] [CrossRef]
- Glazier, D.S.; Borrelli, J.J.; Hoffman, C.L. Effects of fish predators on the mass-related energetics of a keystone freshwater crustacean. Biology 2020, 9, 40. [Google Scholar] [CrossRef] [Green Version]
- Gjoni, V.; Basset, A.; Glazier, D.S. Temperature and predator cues interactively affect ontogenetic metabolic scaling of aquatic amphipods. Biol. Lett. 2020, 16, 20200267. [Google Scholar] [CrossRef]
- Glazier, D.S.; Gring, J.P.; Holsopple, J.R.; Gjoni, V. Temperature effects on metabolic scaling of a keystone freshwater crustacean depend on fish-predation regime. J. Exp. Biol. 2020, 223, jeb232322. [Google Scholar] [CrossRef]
- Gaston, K.J. Patterns in the local and regional dynamics of moth populations. Oikos 1988, 53, 49–57. [Google Scholar] [CrossRef]
- Morse, D.R.; Stork, N.E.; Lawton, J.H. Species number, species abundance and body length relationships of arboreal beetles in Bornean lowland rain forest trees. Ecol. Entomol. 1988, 13, 25–37. [Google Scholar] [CrossRef]
- Verberk, W.C.; Siepel, H.; Esselink, H. Life-history strategies in freshwater macroinvertebrates. Fresh. Biol. 2008, 53, 17221738. [Google Scholar] [CrossRef]
- McHugh, P.A.; Thompson, R.M.; Greig, H.S.; Warburton, H.J.; McIntosh, A.R. Habitat size influences food web structure in drying streams. Ecography 2015, 38, 700–712. [Google Scholar] [CrossRef]
- Tockner, K.; Pennetzdorfer, D.; Reiner, N.; Schiemer, F.; Ward, J.V. Hydrological connectivity, and the exchange of organic matter and nutrients in a dynamic river-floodplain system (Danube, Austria). Fresh. Biol. 1999, 41, 521–535. [Google Scholar] [CrossRef]
- Keckeis, S.; Baranyi, C.; Hein, T.; Holarek, C.; Riedler, P.; Schiemer, F. The significance of zooplankton grazing in a floodplain system of the River Danube. J. Plankton Res. 2003, 25, 243–253. [Google Scholar] [CrossRef] [Green Version]
- Olden, J.D.; Konrad, C.P.; Melis, T.S.; Kennard, M.J.; Freeman, M.C.; Mims, M.C.; Williams, J.G. Are large-scale flow experiments informing the science and management of freshwater ecosystems? Front. Ecol. Environ. 2014, 12, 176–185. [Google Scholar] [CrossRef] [Green Version]
- Poff, N.L.; Schmidt, J.C. How dams can go with the flow. Science 2016, 353, 1099–1100. [Google Scholar] [CrossRef]
Figure 1.
The Rhône River in the valley between Geneva and Lyon and locations of the two studied floodplain channels: Molottes (MOLO) and Ponton (PONT).
Figure 1.
The Rhône River in the valley between Geneva and Lyon and locations of the two studied floodplain channels: Molottes (MOLO) and Ponton (PONT).

Figure 2.
Log10−log10 relationship between average body size (wet weight) and abundance (number of individuals) per macroinvertebrate taxon between the two channels (all months included). Dashed line represents the energetic equivalence hypothesis value of −0.75.
Figure 2.
Log10−log10 relationship between average body size (wet weight) and abundance (number of individuals) per macroinvertebrate taxon between the two channels (all months included). Dashed line represents the energetic equivalence hypothesis value of −0.75.

Figure 3.
Log10−log10 relationship between macroinvertebrate body size (wet weight) and abundance (number of individuals) per macroinvertebrate taxon between the two channel sites and across month. Dashed line represents the energetic equivalence hypothesis value of −0.75.
Figure 3.
Log10−log10 relationship between macroinvertebrate body size (wet weight) and abundance (number of individuals) per macroinvertebrate taxon between the two channel sites and across month. Dashed line represents the energetic equivalence hypothesis value of −0.75.

Figure 4.
Log10−log10 relationship between macroinvertebrate body weight (wet weight) and abundance (number of individuals) per macroinvertebrate taxon between the two channel sites and across functional feeding groups. Dashed line represents the energetic equivalence hypothesis value of −0.75.
Figure 4.
Log10−log10 relationship between macroinvertebrate body weight (wet weight) and abundance (number of individuals) per macroinvertebrate taxon between the two channel sites and across functional feeding groups. Dashed line represents the energetic equivalence hypothesis value of −0.75.

Figure 5.
Boxplot of log10 body size distribution across functional feeding groups (filtering collectors—FC, gathering collectors—GC, grazers—GR, predators—PR, shredders—SH) at monthly scale.
Figure 5.
Boxplot of log10 body size distribution across functional feeding groups (filtering collectors—FC, gathering collectors—GC, grazers—GR, predators—PR, shredders—SH) at monthly scale.

Figure 6.
Boxplot of log10 abundance distribution across functional feeding groups (filtering collectors—FC, gathering collectors—GC, grazers—GR, predators—PR, shredders—SH) at monthly scale.
Figure 6.
Boxplot of log10 abundance distribution across functional feeding groups (filtering collectors—FC, gathering collectors—GC, grazers—GR, predators—PR, shredders—SH) at monthly scale.

Table 1.
The physical and chemical characteristics of the water column in MOLO and PONT channels.
| MOLO Channel | PONT Channel | ||||
|---|---|---|---|---|---|
| Physicochemical Factors | Month | Mean | SE | Mean | SE |
| Dissolved oxygen (mg/L) | April | 5.35 | 5.26 | 6.88 | 9.49 |
| May | 5.97 | 4.5 | 5.95 | 8.22 | |
| June | 5.52 | 3.76 | 3.47 | 4.92 | |
| July | 4.85 | 0.73 | 7.38 | 1.12 | |
| Temperature (°C) | April | 13.68 | 0.38 | 13.7 | 0.66 |
| May | 16.58 | 0.76 | 14.86 | 0.55 | |
| June | 19.36 | 0.95 | 18.23 | 0.31 | |
| July | 21.86 | 0.28 | 21.55 | 0.46 | |
| Conductivity (μS/cm) | April | 259.49 | 29.62 | 242.08 | 3.31 |
| May | 293.32 | 31.73 | 295.08 | 17.28 | |
| June | 242.58 | 5.51 | 271.00 | 0.44 | |
| July | 260.8 | 20.9 | 275.02 | 6.01 | |
Table 2.
Results of the LSR analyses of log10 abundance in relation to log10 body weight in two floodplain channels of the Rhone River.
Table 2.
Results of the LSR analyses of log10 abundance in relation to log10 body weight in two floodplain channels of the Rhone River.
| Sampling Site | n | Slope | 95% CI | Intercept | r2 | p |
|---|---|---|---|---|---|---|
| MOLO | 162 | −0.39 | −0.53 to −0.24 | −0.19 | 0.19 | *** |
| PONT | 193 | −0.33 | −0.45 to −0.21 | −0.07 | 0.13 | *** |
*** p < 0.001.
Table 3.
Results of the LSR analyses of log10 abundance in relation to log10 body weight in two floodplain channels of the Rhone River across time.
Table 3.
Results of the LSR analyses of log10 abundance in relation to log10 body weight in two floodplain channels of the Rhone River across time.
| Sampling Site | Month | n | Slope | 95% CI | Intercept | r2 | p |
|---|---|---|---|---|---|---|---|
| MOLO | April | 35 | −0.31 | −0.56 to −0.06 | −0.10 | 0.16 | * |
| May | 53 | −0.42 | −0.69 to −0.14 | −0.22 | 0.15 | ** | |
| June | 38 | −0.48 | −0.85 to −0.10 | −0.35 | 0.16 | * | |
| July | 36 | −0.34 | −0.60 to −0.07 | −0.10 | 0.16 | * | |
| PONT | April | 50 | −0.53 | −0.79 to −0.27 | −0.38 | 0.26 | *** |
| May | 41 | −0.28 | −0.55 to −0.01 | −0.04 | 0.10 | * | |
| June | 55 | −0.26 | −0.49 to −0.02 | −0.04 | 0.10 | * | |
| July | 47 | −0.29 | −0.52 to −0.07 | 0.09 | 0.12 | * |
* p < 0.05; ** p < 0.005; *** p < 0.001.
Table 4.
Results of the LSR analyses of log10 abundance in relation to log10 body weight in two floodplain channels of the Rhone River across functional diversity.
Table 4.
Results of the LSR analyses of log10 abundance in relation to log10 body weight in two floodplain channels of the Rhone River across functional diversity.
| Sampling Site | Functional Feeding Group | n | Slope | 95% CI | Intercept | r2 | p |
|---|---|---|---|---|---|---|---|
| MOLO | Filterers | 18 | −0.27 | −0.58 to 0.03 | −0.16 | 0.19 | * |
| Gatherers | 51 | −0.60 | −0.98 to −0.22 | −0.82 | 0.15 | *** | |
| Grazers | 31 | −0.31 | −0.80 to 0.17 | −0.42 | 0.06 | ns | |
| Predators | 48 | −0.02 | −0.22 to 0.18 | −0.41 | 0.00 | ns | |
| Shredders | 14 | −0.49 | −1.11 to 0.13 | −0.37 | 0.22 | * | |
| PONT | Filterers | 33 | −0.35 | −0.63 to −0.07 | 0.04 | 0.18 | ** |
| Gatherers | 75 | −0.45 | −0.79 to −0.12 | −0.15 | 0.10 | *** | |
| Grazers | 19 | −0.28 | −0.51 to −0.04 | −0.27 | 0.27 | * | |
| Predators | 58 | −0.16 | −0.29 to −0.04 | −0.07 | 0.11 | * | |
| Shredders | 8 | −0.04 | −0.32 to 0.23 | −0.01 | 0.02 | ns |
* p < 0.05; ** p < 0.005; *** p < 0.001, ns—not significant
Publisher’s Note: MDPI stays neutral with regard to jurisdictional claims in published maps and institutional affiliations. |
© 2022 by the authors. Licensee MDPI, Basel, Switzerland. This article is an open access article distributed under the terms and conditions of the Creative Commons Attribution (CC BY) license (https://creativecommons.org/licenses/by/4.0/).
Share and Cite
MDPI and ACS Style
Gjoni, V.; Marle, P.; Ibelings, B.W.; Castella, E. Size–Abundance Relationships of Freshwater Macroinvertebrates in Two Contrasting Floodplain Channels of Rhone River. Water 2022, 14, 794. https://doi.org/10.3390/w14050794
AMA Style
Gjoni V, Marle P, Ibelings BW, Castella E. Size–Abundance Relationships of Freshwater Macroinvertebrates in Two Contrasting Floodplain Channels of Rhone River. Water. 2022; 14(5):794. https://doi.org/10.3390/w14050794
Chicago/Turabian StyleGjoni, Vojsava, Pierre Marle, Bastiaan W. Ibelings, and Emmanuel Castella. 2022. "Size–Abundance Relationships of Freshwater Macroinvertebrates in Two Contrasting Floodplain Channels of Rhone River" Water 14, no. 5: 794. https://doi.org/10.3390/w14050794
Note that from the first issue of 2016, this journal uses article numbers instead of page numbers. See further details here.