Article

The Partitioning of Catchment Evapotranspiration Fluxes as Revealed by Stable Isotope Signals in the Alpine Inland River Basin

1
Key Laboratory of Tibetan Plateau Land Surface Processes and Ecological Conservation (Ministry of Education), Qinghai Normal University, Xining 810008, China
2
Qinghai Province Key Laboratory of Physical Geography and Environmental Process, Xining 810008, China
3
Academy of Plateau Science and Sustainability, People’s Government of Qinghai Province and Beijing Normal University, Xining 810008, China
4
College of Geographic Science, Qinghai Normal University, Xining 810008, China
*
Author to whom correspondence should be addressed.
Water 2022, 14(5), 790; https://doi.org/10.3390/w14050790
Submission received: 10 February 2022 / Revised: 25 February 2022 / Accepted: 26 February 2022 / Published: 2 March 2022
(This article belongs to the Special Issue Isotope Tracers in Watershed Hydrology)

Abstract

:
Evapotranspiration is an important process in the water budget of an ecosystem. Quantifying the components of evapotranspiration is of great significance in revealing the ecohydrological process of alpine inland river basins. In this study, the evapotranspiration fluxes in the Shaliu River basin were classified by hydrogen and oxygen stable isotope technology and remote sensing technology. The results showed the following: (1) The average value of soil fractional evaporation (E1) in the summer of 2018 and 2019 was 7.59 mm and 2.10 mm, respectively. (2) The average ratio of soil evaporation (Esoil) in the summer of 2018 was 48.82%, 68.11%, 54.99%, respectively. The average ratio of Esoil in the summer of 2019 was 66.86%, 57.50%, 55.53%, respectively. The average value of Esoil in the summer of 2018 and 2019 was 42.84 mm and 35.36 mm, respectively. (3) The average ratio of vegetation transpiration (T) in the summer of 2018 was 51.18%, 31.89%, and 45.01%, respectively. The average ratio of T in the summer of 2019 was 33.14%, 42.50%, and 44.47%, respectively. The average value of T in the summer of 2018 and 2019 was 32.59 mm and 26.23 mm, respectively. Obviously, the soil fractionation was stronger in the summer of 2018 than that in the summer of 2019. At the same time, both soil evaporation and plant transpiration in summer 2018 were higher than those in summer 2019, and soil evaporation in the Shaliu River basin was greater than plant transpiration in summer during the study period. The results of this study can provide data reference for mastering the eco-hydrological process of the Shaliu River basin.

1. Introduction

Evapotranspiration (ET) plays an important role in the ecological hydrological cycle and is also an important hydrological cycle link [1,2,3]. ET actually consists of two parts: soil evaporation (Esoil) and plant transpiration (T) [4]. Recognizing ET from its components (Esoil and T) is therefore one of the most critical ecohydrological scientific issues and has important implications, not only for understanding the water cycle and ecohydrology processes, but also for improving the accuracy of ecological water consumption [5,6]. It is important to clarify that Esoil and T are of great significance to the regional eco-hydrological process and hydrological cycle process. It is therefore critically important to perform integrative analyses of spatiotemporal variability of ET components and to evaluate the driving factors involved at watershed scale.
The Qinghai-Tibet Plateau(QTP), known as the “Asian Water Tower” and the Earth’s “Third Pole” [7,8,9,10,11], is the main source of great rivers in Asia, and is the main source of an important area for water security in China and even the world. Esoil and T are important links in the hydrological cycle of the QTP and also hotspots in hydrometeorological research on the QTP in recent years. At present, the research on Esoil and T is mainly based on the observation site scale to calculate local evapotranspiration components. For example, Tong et al. [12] used the Yamanaka dual-source model to study the evapotranspiration components of alpine meadows in the Heihe River basin. Han et al. [13] conducted a simulation study of evapotranspiration components based on the Shuttleworth–Wallace model in Xiaobo Lake and the headwater of Shaliu River. Guo et al. [14] conducted a quantitative study on the division of ET in the Magazangbu basin. Although these studies have accurately resolved the evapotranspiration components at each site scale, there are few reports on the changes of evapotranspiration components at the watershed scale. To this end, this study conducted a quantitative study on the division of ET flux in the alpine inland river basin at the basin scale, and provided data reference for revealing the eco-hydrological process of the alpine inland river basin on the QTP.
Hydrogen and oxygen stable isotope technology is a good tracer for the ecological hydrological cycle. It is widely used in the study of hydrological cycle [15,16,17], but the results have been temporal and spatial in regional differences [18,19,20]. This highlights the necessity for further research into Esoil and T in different regions and environments. Furthermore, the processes which lie behind Esoil are complex [14,21], because there are spatiotemporal differences in the isotopic composition of these fluxes. The processes, leading to lighter vapor isotopic composition than the source moisture, are referred to as the fractionated soil evaporation (E1) in this study [14]. If the soil moisture evaporates completely within a certain time interval, the cumulative vapor isotope composition will be the same as the original moisture; this process leading to apparent isotopic non-fractionation is referred to as non-fractionated soil evaporation (E2) [14]. Precise determination of isotopic changes occurring in soil processes is a challenge in most field studies due to the large number of samples required [14,22,23]. In this case, soils are often simply treated as T [24] in water balance assessments at the watershed scale, which makes the division of fractionated and non-fractionated contributions at the watershed scale less accurate, especially in spatial (not quite accurate). The degree of soil fractionation was quantified by calculating the ratio of complete fractionation (E1, which corresponds to complete evaporation from the water surface) and non-fractionation (E2), while E and T were quantified based on the degree of soil fractionation. This study is crucial for clarifying the eco-hydrological processes in the alpine inland river basin of the QTP.
Qinghai Lake, known as “the most beautiful lake in China”, is the largest inland saltwater lake in country and a natural barrier protecting the ecological security of the northeastern QTP [25]. In recent years, due to global climate change, the water cycle in the Qinghai Lake basin [25,26], biodiversity [27], runoff processes [28,29], and water balance [30], have changed. The Shaliu River, known as the Ikulan River, is the second largest river in the Qinghai Lake basin, its length is about 106 km. The area of the Shaliu River basin isonly 1679.2 km2 [31], but its runoff is large [30], the annual runoff accounts for one-fifth of the total runoff in the entire Qinghai Lake Basin, and the flood season is mainly from June to September each year [28]. In addition, the Shaliu River basin is relatively closed and complete, with complete vegetation types, and its hydrological cycle process is very representative, which can basically reflect the hydrological cycle of the entire Qinghai Lake Basin. The above characteristics determine that the Shaliu River basin is an ideal area to carry out quantitative research on the partitioning of catchment evapotranspiration fluxes at the basin scale. Under the background of global warming, the hydrological cycle process of the Shaliu River basin has changed, which has a certain impact on water resources and the ecological environment [28,29,32]. However, the understanding of the partitioning of catchment evapotranspiration fluxes in the Shaliu River basin is not deep enough.
Located in the northeastern part of the QTP, Qinghai Lake is the largest inland lake in China and an important water body that maintains the ecological security of the northeastern QTP [28,29]. Existing studies have used hydrogen and oxygen stable isotope technology to study atmospheric precipitation, water vapor sources, and runoff processes in the Qinghai Lake basin [28,29,32,33,34]. However, there are few reports on the partitioning of catchment evapotranspiration fluxes using stable isotopes. The Shaliu River basin is relatively closed and complete, with complete vegetation types, and its hydrological cycle process is very representative; for this reason, it was selected as the research area for this study. The monthly hydrogen and oxygen stable isotope data of precipitation was selected as from June to August in 2018 and 2019, using hydrogen and oxygen stable isotope technology and remote sensing technology to study the partitioning of catchment evapotranspiration fluxes of the northeast of the QTP. The purpose is to (1) clarify the partitioning of catchment evapotranspiration fluxes in the Shaliu River basin of the northeast of the QTP, and (2) master the spatiotemporal characteristics of evapotranspiration flux distribution in the basin, (3) calculate E1, E2, Esoil and T values and ratio, and (4) quantify the percentage of composition of ET. The research results can provide data support and theoretical research for the water cycle, hydrological process research, and water resources protection and management in the alpine inland river of the QTP.

2. Materials and Methods
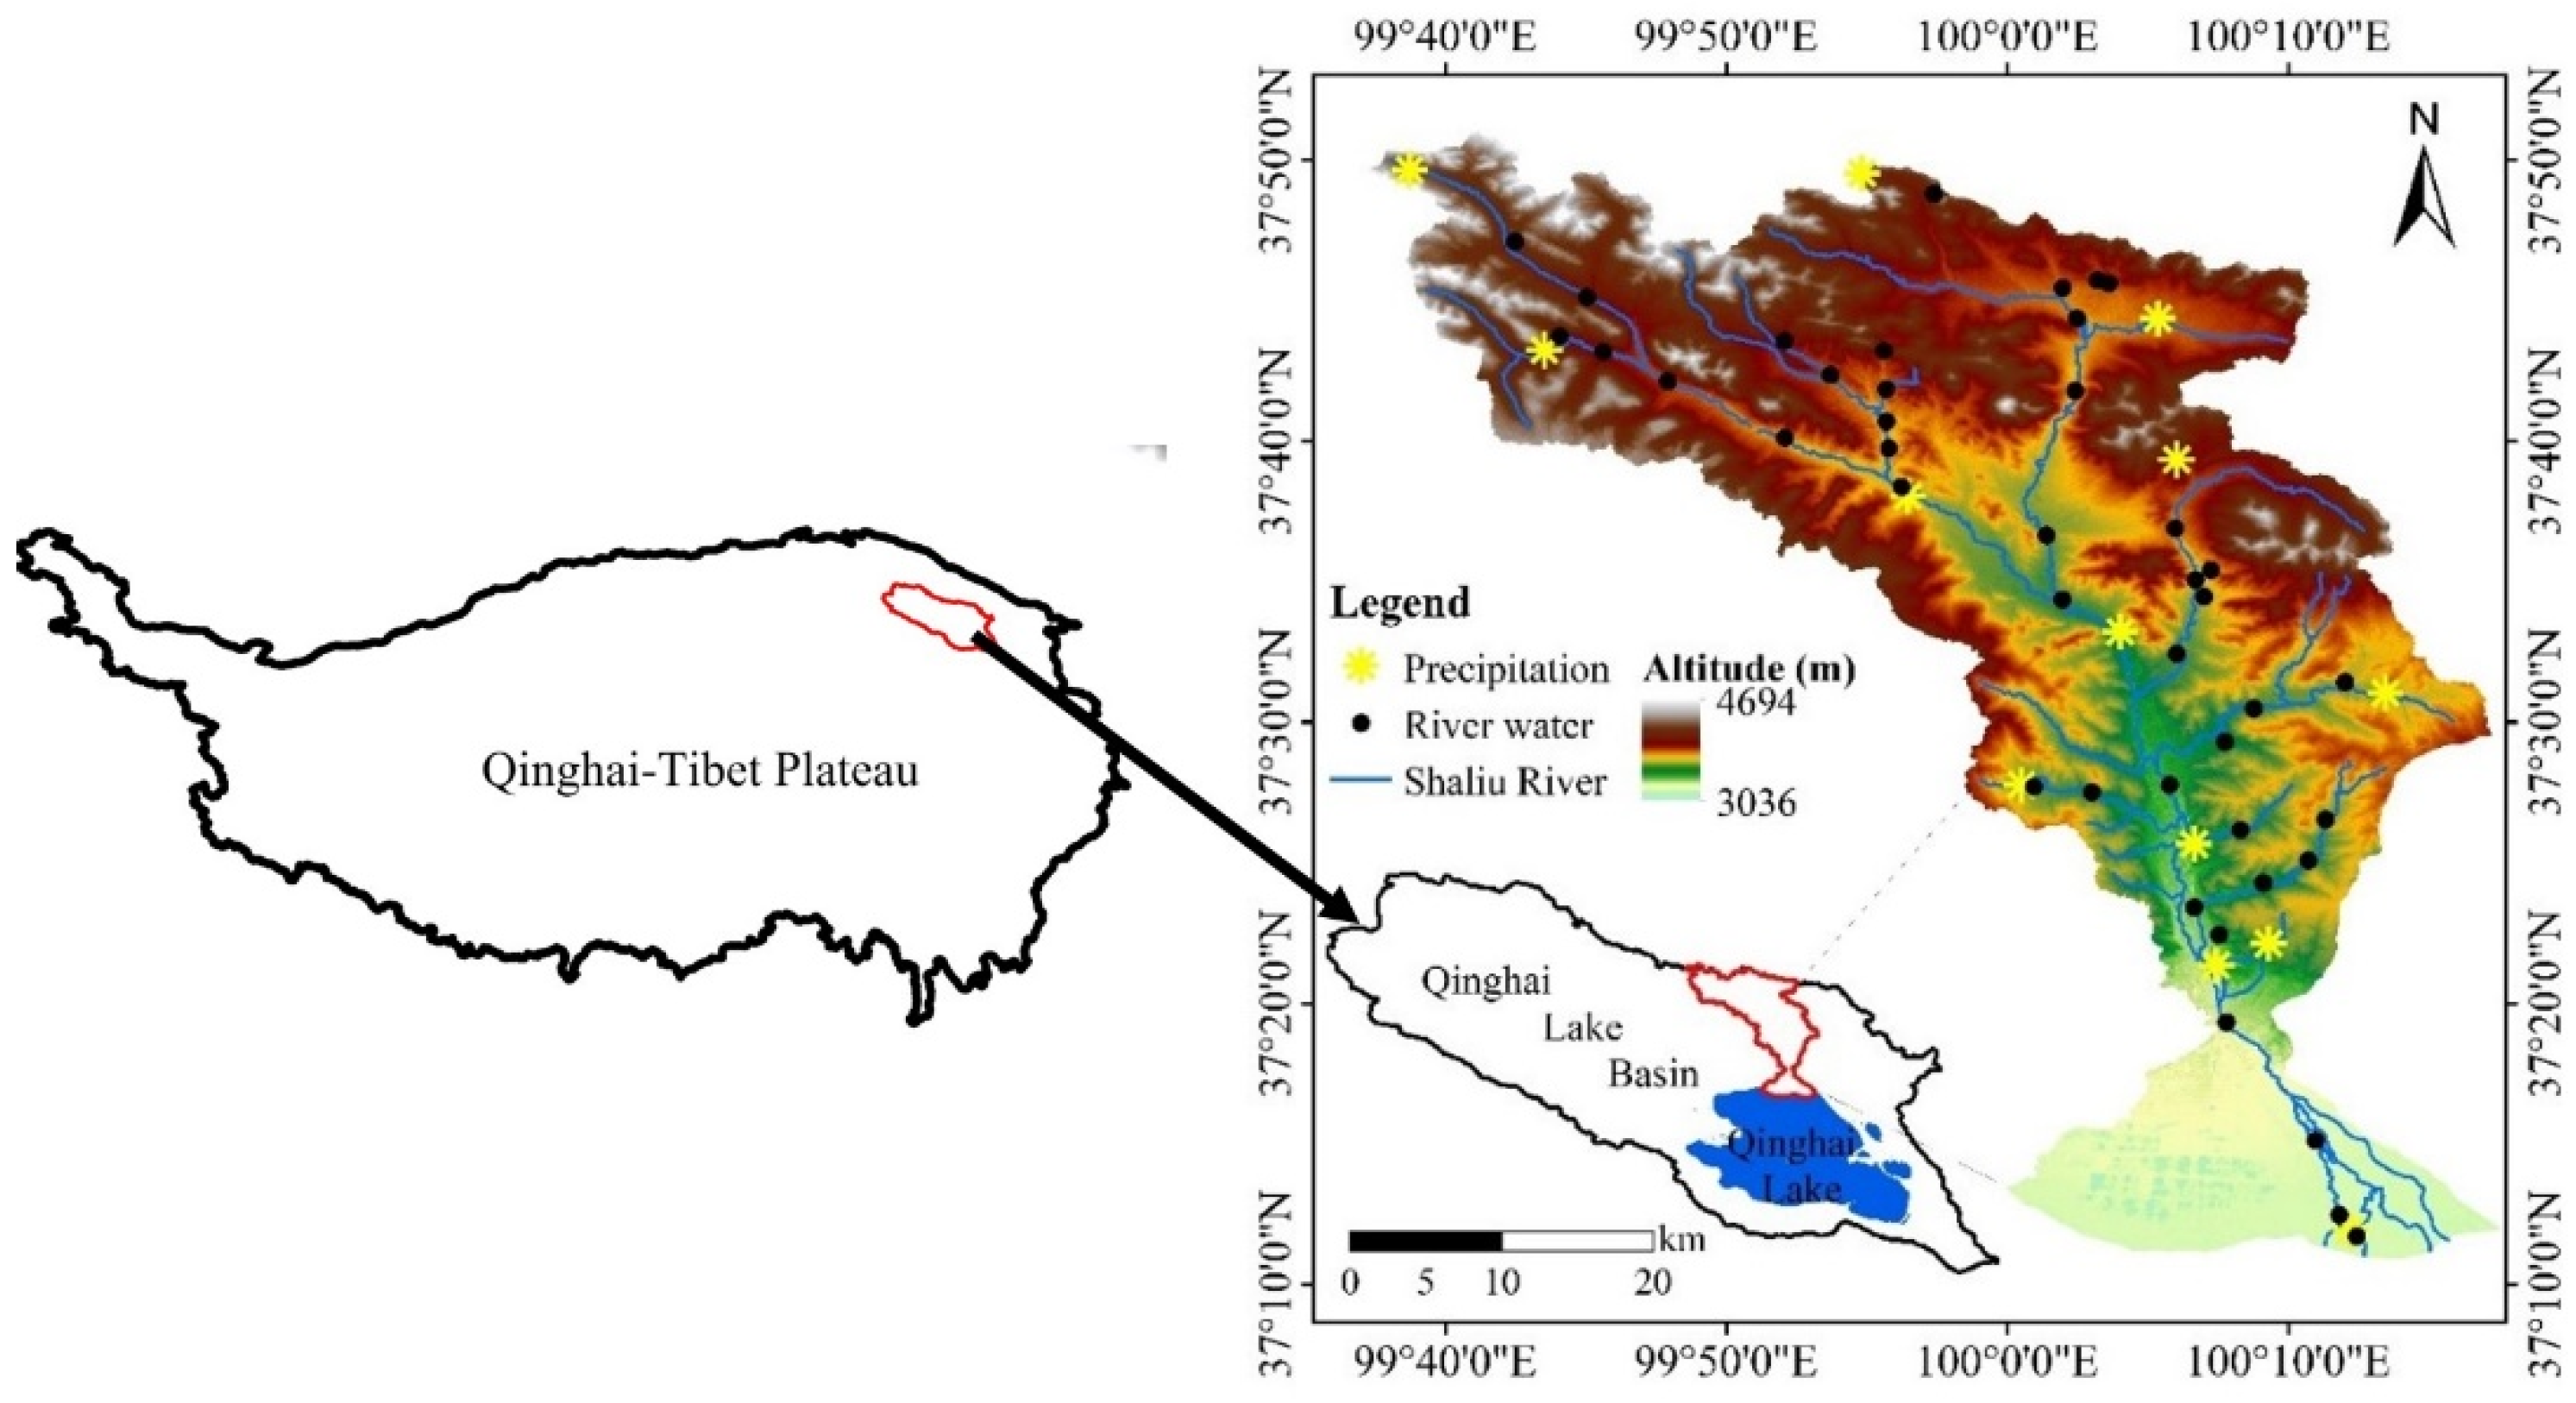
2.1. The Study Area

The area of the Shaliu River basin (37°10′55.92″–37°51′2.16″ N, 99°37′10.20″–100°17′9.96″ E) is 1679.2 km2, located in the north of Qinghai Lake in northeastern QTP (Figure 1). The altitude is between 3036 m and 4696 m [11]. The temperature in the Shaliu River basin has obvious seasonal changes, and the annual range is relatively large. The average temperature in January was −22.1–14.0 °C; the average temperature in July was 10.0–11.5 °C, the annual average temperature was −0.13 °C. The annual precipitation in the basin was between 300 mm and 600 mm, the precipitation was mainly concentrated in May to September. The annual average precipitation was 389.66 mm.

2.2. Sample Collection and Data Determination

The precipitation from June to August from 2018 to 2019 was collected in the Shaliu River basin using anti-evaporation rainwater harvesting devices, and the river water was collected on the spot. The precipitation and river water samples were collected in purified 60 mL high-density polyethylene bottles, sealed with Parafilm film, and brought back to the laboratory for refrigerated storage. The hydrogen and oxygen stable isotopic compositions (δ18O and δD) in the precipitation samples were tested with LGR’s IWA-35EP (model: 912-0026-0001, Mountain View, CA, USA) liquid water isotope analyzer. The test was completed at the Key Laboratory of Natural Geography and Environmental Processes of Qinghai Province. The test result is expressed in thousand points relative to the Vienna Standard Mean Seawater (V-SMOW), and the calculation formula is as follows [35]:
δ = ( R s a m p l e R s t a n d a r d 1 ) × 1000
where, Rsample measures the molar ratio of D/H or 18O/16O in the sample water, Rstandard is the molar ratio of D/H or 18O/16O in the standard sample.

2.3. Evapotranspiration Fluxes Model

Based on the water balance and isotope mass balance equations in the basin, fractionated evapotranspiration (E1) and unfractionated evapotranspiration (E2 + T) were calculated in the Shaliu River basin. The calculation formula is as follows [14]:
P = Q + E 1 + E 2 + T
P * δ P = Q * δ Q + E 1 * δ E + ( E 2 + T ) δ T
where P is precipitation (mm), Q is runoff (mm), E1 is the fully evaporated part of soil evaporation (mm), E2 is the incomplete evaporation part of soil evaporation (mm), and T is plant transpiration (mm). δP and δQ are the isotopic values in the weighted precipitation and the isotopic values in the weighted river runoff, respectively. δT is the incompletely evaporated isotope value, which is equal to δP. δE is the isotope value of completely evaporated water vapor, calculated using the Craig–Gordon model. The calculation formula is as follows [14]:
δ E = δ L R H × δ A ( ε k + ε ) 1 R H
where δL and δE are the isotopic values of liquid and gaseous water, respectively. RH is the relative humidity, ε s the liquid–gas equilibrium evaporation coefficient.
α is the equilibrium fractionation factor, calculated by the following formula [14]:
10 3 ln α 2 H = 24.844 ( 10 6 T 2 ) 76.248 ( 10 3 T 2 ) + 52.612
10 3 ln α 18 O = 1.137 ( 10 6 T 2 ) 0.4356 ( 10 3 T 2 ) + 2.0667
In Formulas (5) and (6), T is temperature in K.
The water balance and isotope mass balance equations are transformed, and the Esoil:T equation is established by combining vegetation cover data and evapotranspiration data. The conversion formula of the water balance equation and the isotope mass balance equation is as follows [14]:
P = Q + E s o i l + T
P * δ P = Q * δ Q + [ β % * δ E + ( 1 β % ) * δ T ] * E s o i l + T * δ T
The vegetation coverage was calculated by the following formula [14]:
V F C = ( N D V I N D V I s o i l ) / ( N D V I v e g N D V I s o i l )
where, NDVIsoil is equal to the minimum value of NDVI, and NDVIveg is the maximum value of NDVI. In this study, the value of cumulant less than 5% is selected as NDVIveg, and the value of cumulant greater than 95% is NDVIsoil.
Using the values of vegetation coverage area (Sveg, km2) and bare soil area (Ssoil, km2), the ratio of Esoil:T can be estimated using formulas [14]:
E s o i l : T = ( S s o i l + S v e g * c ) / [ S v e g * ( 1 c ) * M ]
where, Esoil:T is the actual ratio of soil evaporation to plant transpiration. Ssoil and Sveg represent bare soil area and vegetation coverage area (km2); c is the grassland Esoil coefficient. M is the 100% VFC and 0% VFC ET ratio of a grid.

2.4. Data Sources and Processing

The ET dataset comes from NASA (https://nasa.gov/, accessed on 23 July 2021), and the resolution of the data was 500 m × 500 m. Using ArcGIS10.3 software (Redlands, CA, USA) to preprocess the dataset, first remove invalid values, then calculate monthly evapotranspiration in the Salius River Basin from June to August in 2018 and 2019. To explore the relationship between temperature, precipitation and evapotranspiration components, the monthly temperature and precipitation data come from the National Earth Science Data Center in China (http://www.geodata.cn/, accessed on 25 July 2021), and the resolution of the data was 1 km × 1 km. Using arcGIS10.3 software to preprocess the dataset, first remove invalid values, cut them to the study area, and finally use the latitude and longitude coordinates of the sampling point to extract the temperature and precipitation values. To accurately calculate δE, this research required accurate relative humidity data. Relative humidity data was from the National Meteorological Data Center (http://data.cma.cn/, accessed on 18 October 2021). The relative humidity of 17 meteorological stations near the Shaliu River basin was used for spatial interpolation. In the summer of 2018 and 2019, the average errors of spatial interpolation accuracy in the Shaliu River Basin were 0.02 and 0.07, respectively, and the interpolation accuracy met the research needs.

3. Results

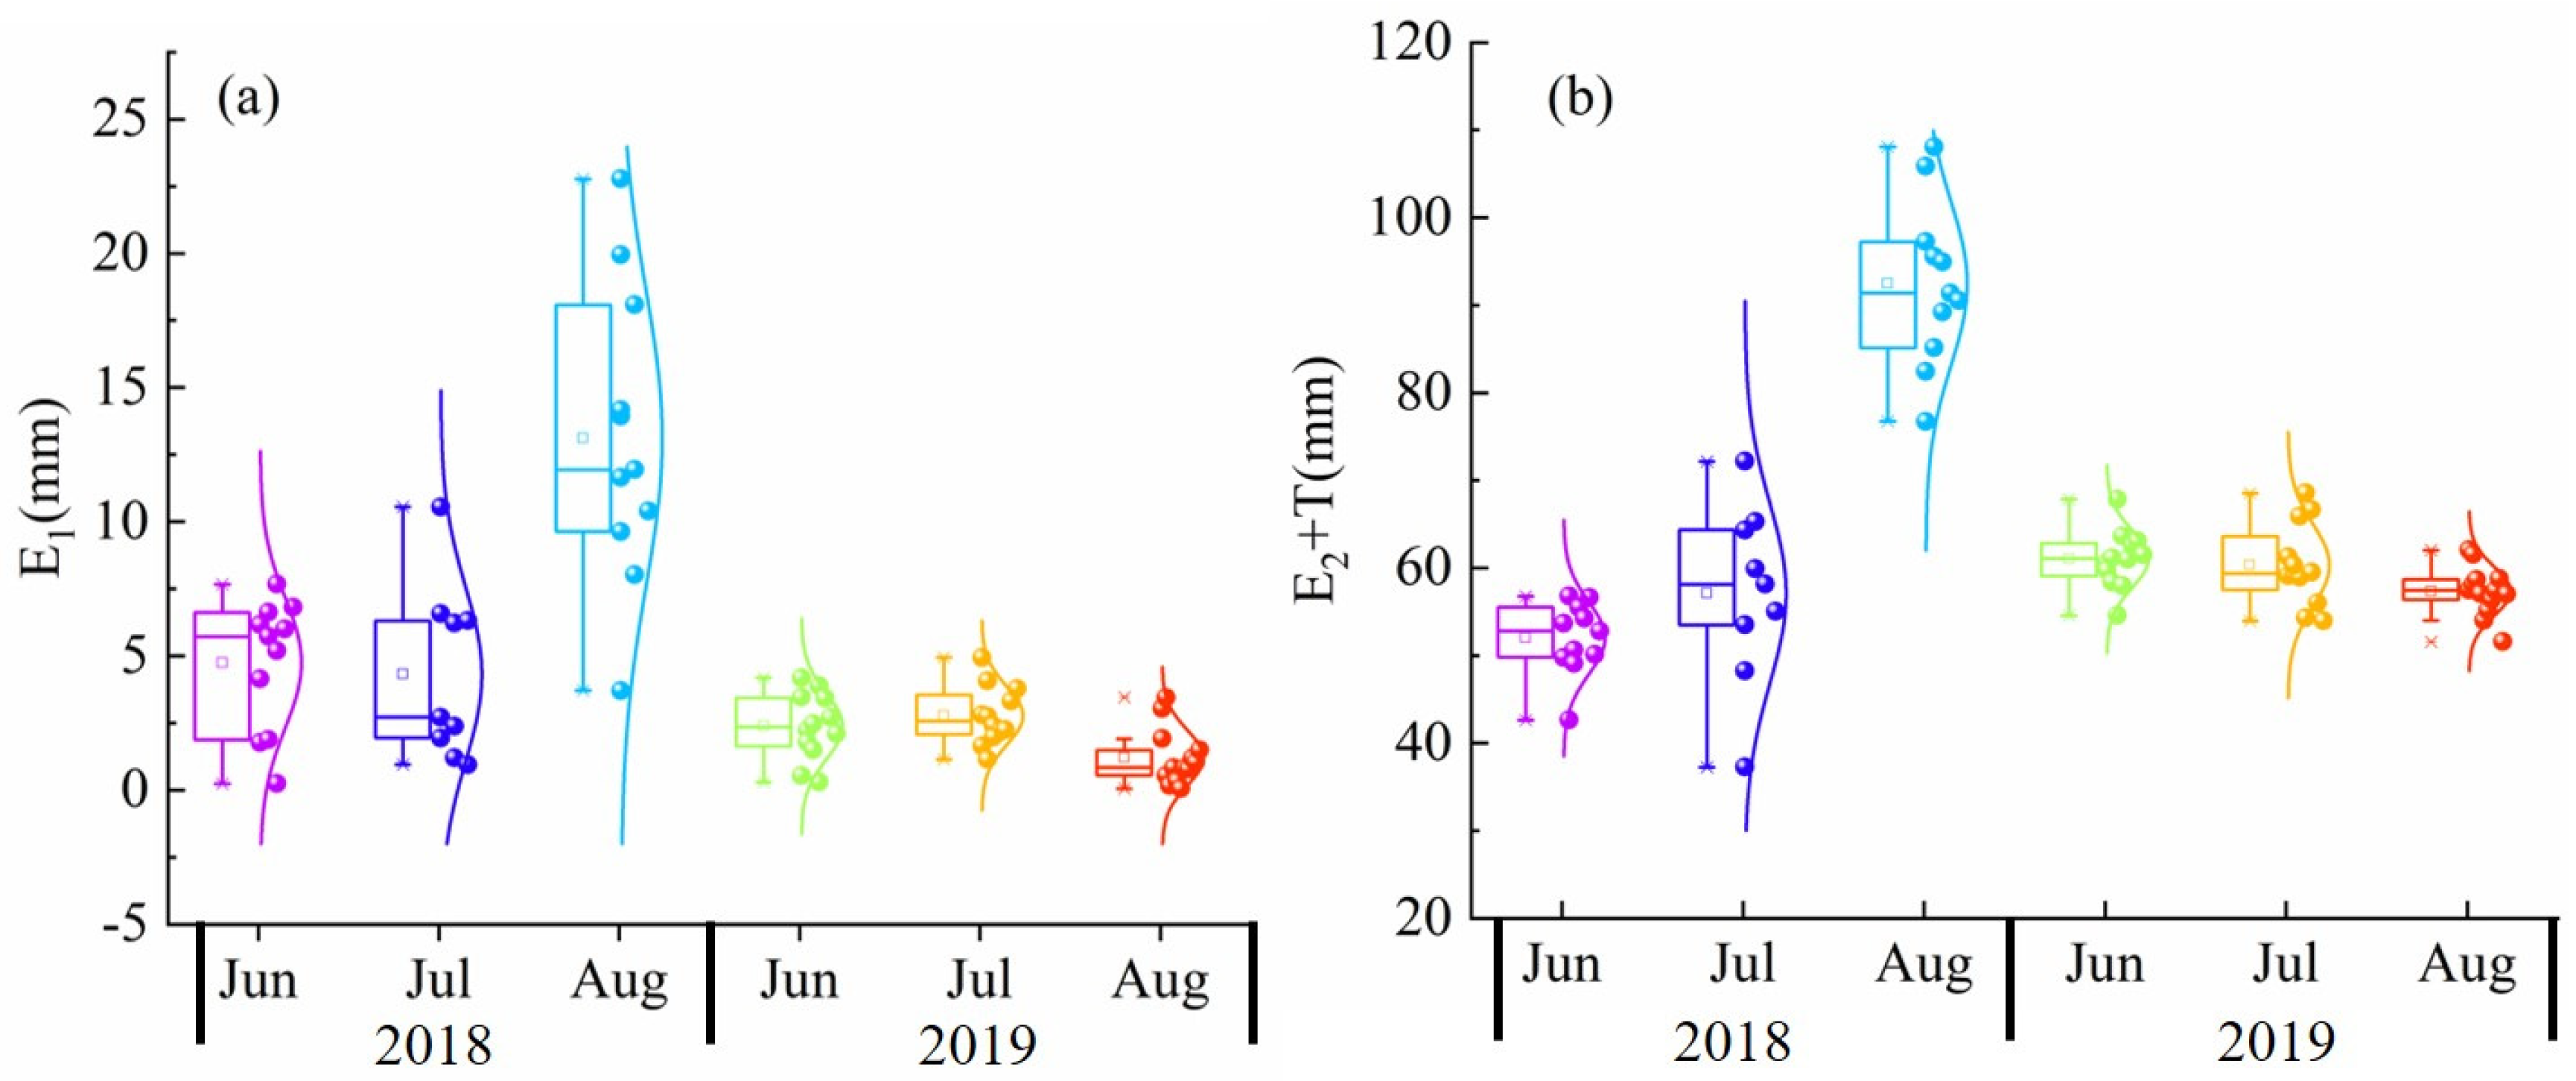
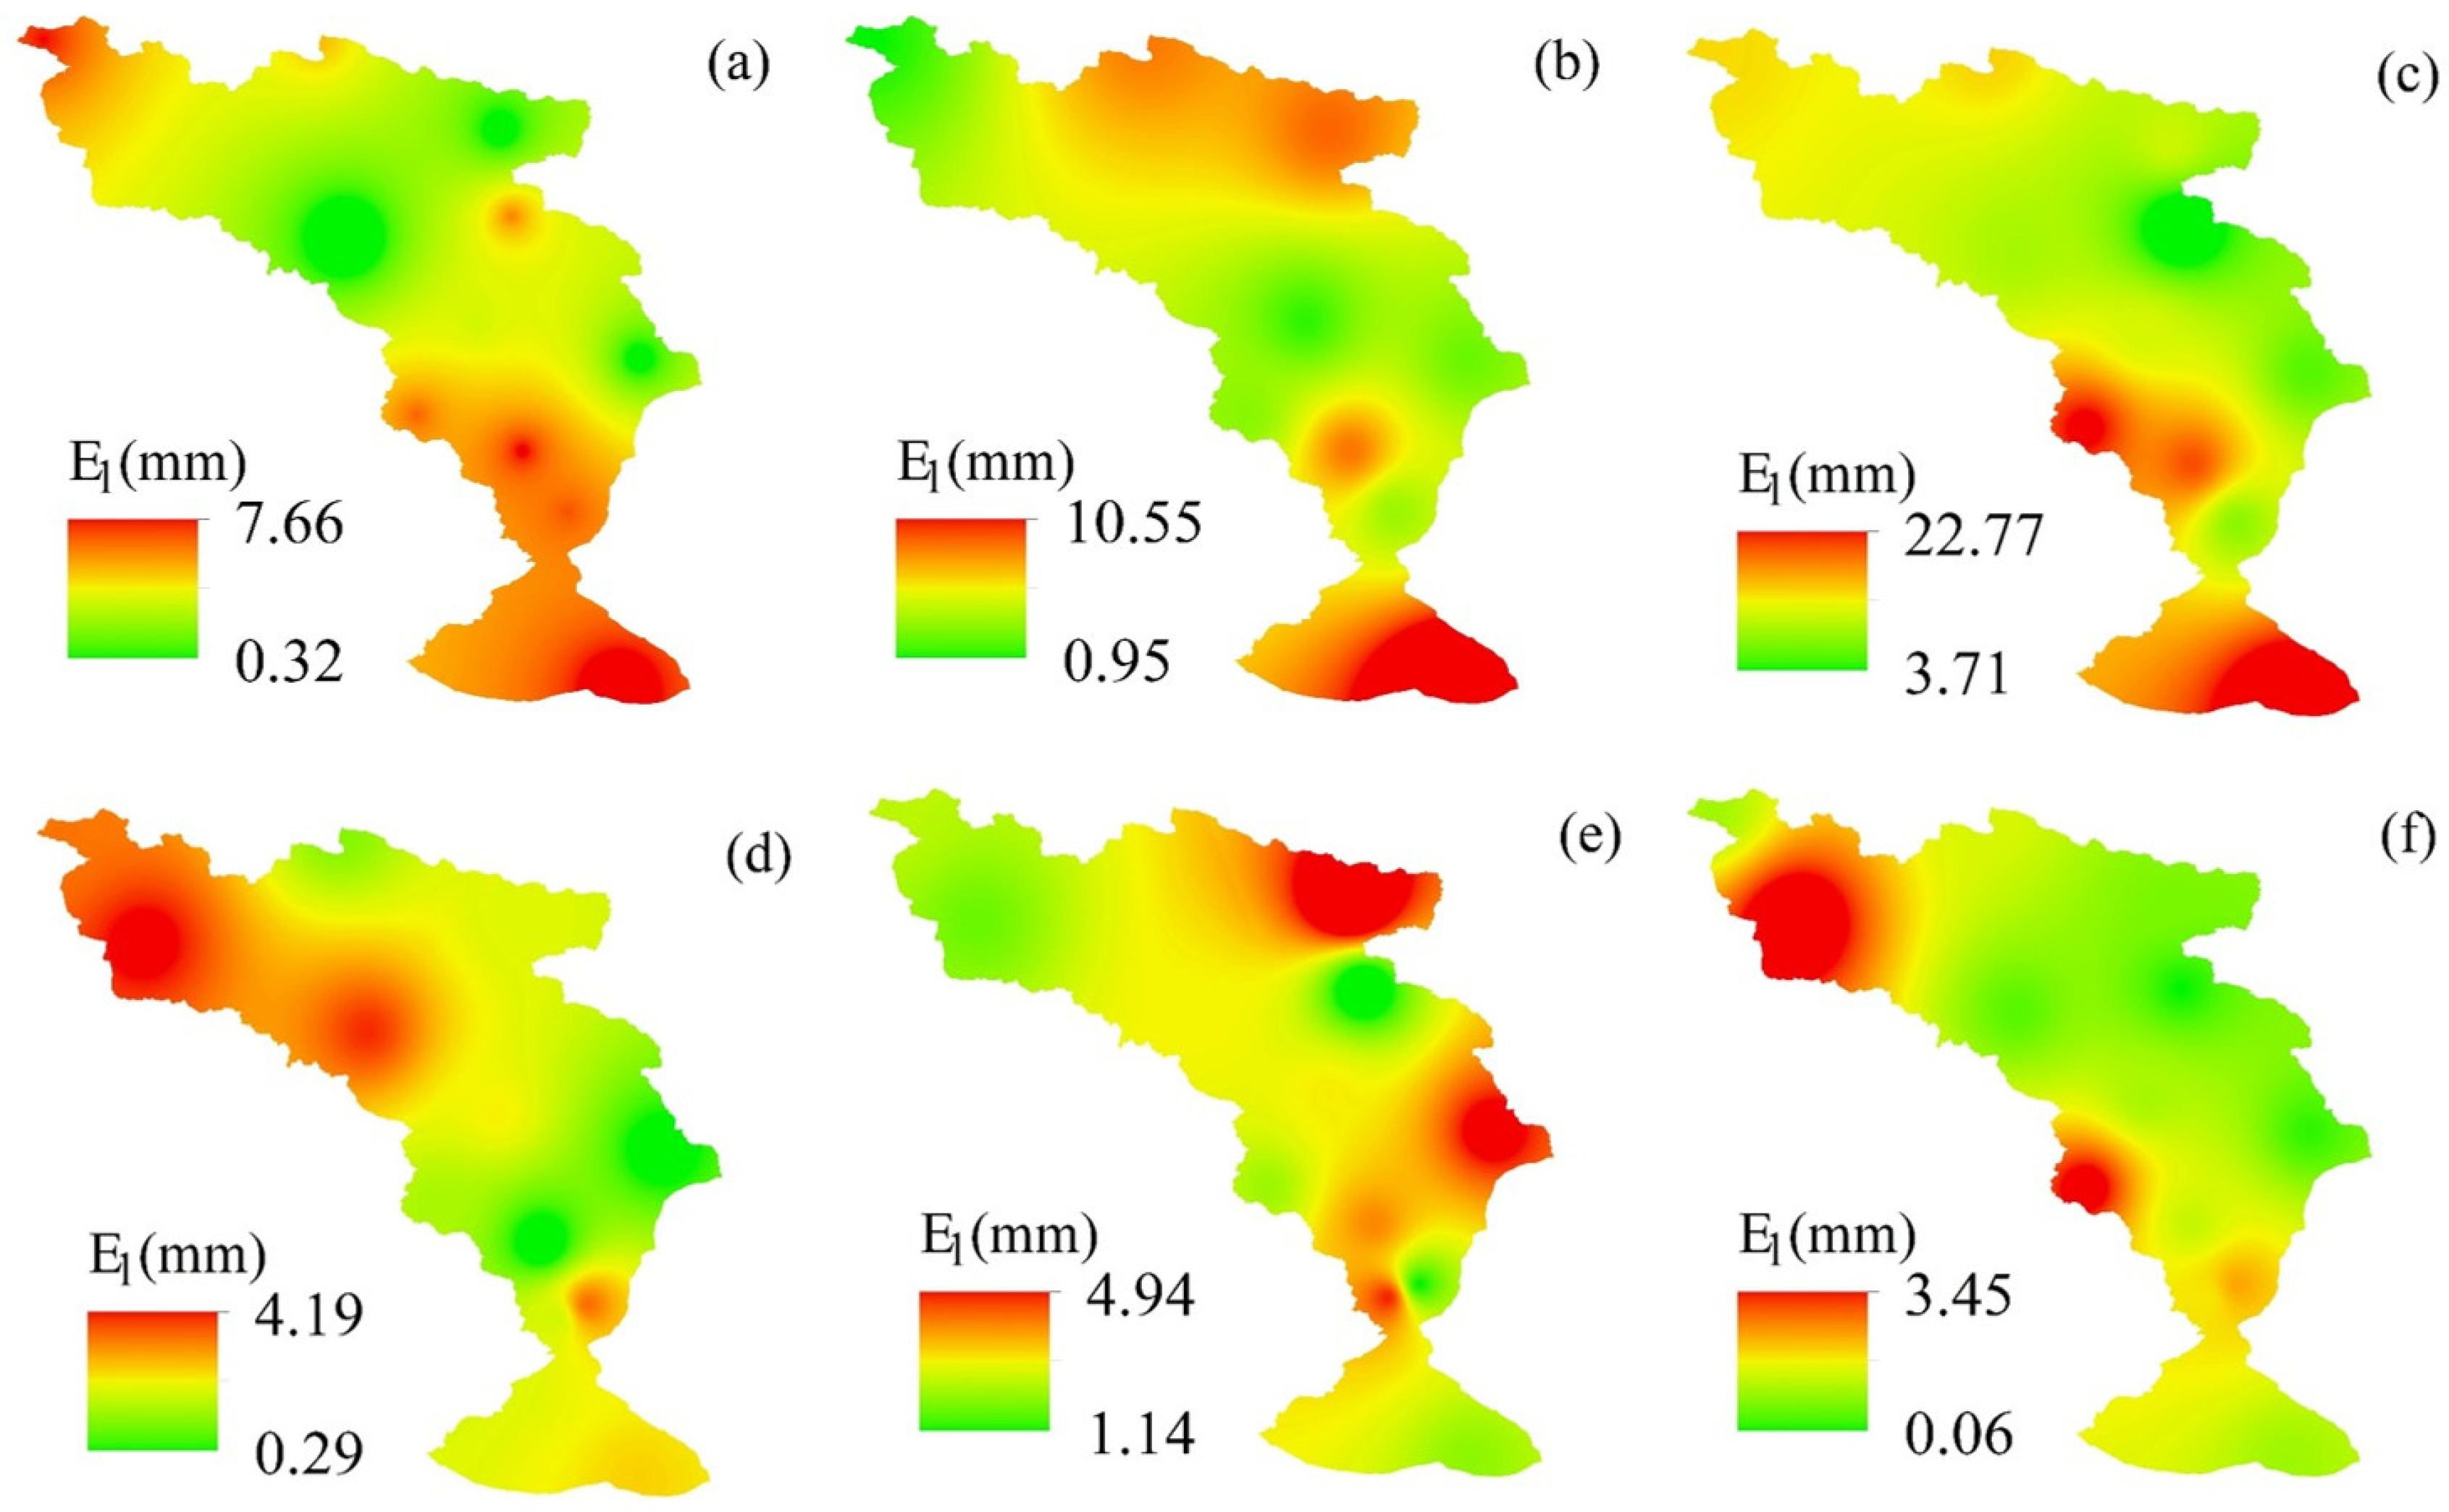
3.1. Partition of E1 and (E2 + T) from Total ET

In June to August 2018, in terms of monthly variations, E1 in the Shaliu River basin was 0.32 mm to 7.67 mm, 0.95 mm to 10.55 mm, and 3.71 mm to 22.77 mm, respectively. The average value of E1 was 4.75 mm, 4.31 mm, and 13.11 mm, respectively (Figure 2a). The variation of the average E1 value in the summer of 2018 showed a trend of first decreasing and then increasing. The maximum average E1 value was in August and the minimum value in July (Figure 2a). In terms of spatial variation, the high-value areas of E1 were mainly distributed in the southern part of the basin, indicating that the E1 evaporative fractionation was stronger in the southern part of the basin (Figure 3a–c). In June to August 2019, E1 in the Shaliu River basin was 0.29 mm to 4.19 mm, 1.14 mm to 4.49 mm, 0.06 mm to 3.45 mm, respectively. The average value of E1 was 2.38 mm, 2.77 mm, 1.21 mm, respectively (Figure 2a). The variation of the average E1 value in the summer of 2019 showed a trend of first increasing and then decreasing. The maximum average E1 value was in July and the minimum value was in August (Figure 2a). In terms of spatial variation, the high-value areas of E1 were mainly distributed in the northwest and northeast part of the basin, indicating that the E1 evaporative fractionation was stronger in that part of the basin (Figure 3d–f). There were certain differences in the monthly and spatial changes of E1 in the Shaliu River basin in the summer of 2019, indicating that the E1 in the basin has obvious regional differences.
In terms of monthly variations, E2 + T, in June to August 2018 in the Shaliu River basin was 42.63 mm to 56.79 mm, 37.27 mm to 72.17 mm, and 76.73 mm to 108.08 mm, respectively. The average value of E2 + T was 51.99 mm, 57.10 mm, and 92.47 mm, respectively (Figure 2b). The variation of the average E2 + T value in the summer of 2018 showed an increasing trend. The maximum average E2 + T value was in August and the minimum value was in June (Figure 2b). In terms of spatial variation, the high-value areas of E2 + T were mainly distributed in the northern part of the basin, indicating that the E2 + T was stronger in the northern part of the basin (Figure 4a–c). In June to August 2019, E2 + T in the Shaliu River basin was 54.58 mm to 67.85 mm, 53.97 mm to 68.55 mm, and 51.57 mm to 62.05 mm, respectively. The average value of E2 + T was 61.02 mm, 60.32 mm, and 57.32 mm, respectively (Figure 2b). The variation of the average E2 + T value in the summer of 2019 showed a decreasing trend. The maximum average E2 + T value was in June and the minimum value was in August (Figure 2b). In terms of spatial variation, the high-value areas of E2 + T were mainly distributed in the central part of the basin, indicating that the E2 + T was stronger in that part of the basin (Figure 4d–f). There were certain differences in the monthly and spatial variations of E2 + T in the Shaliu River basin in the summer of 2019.

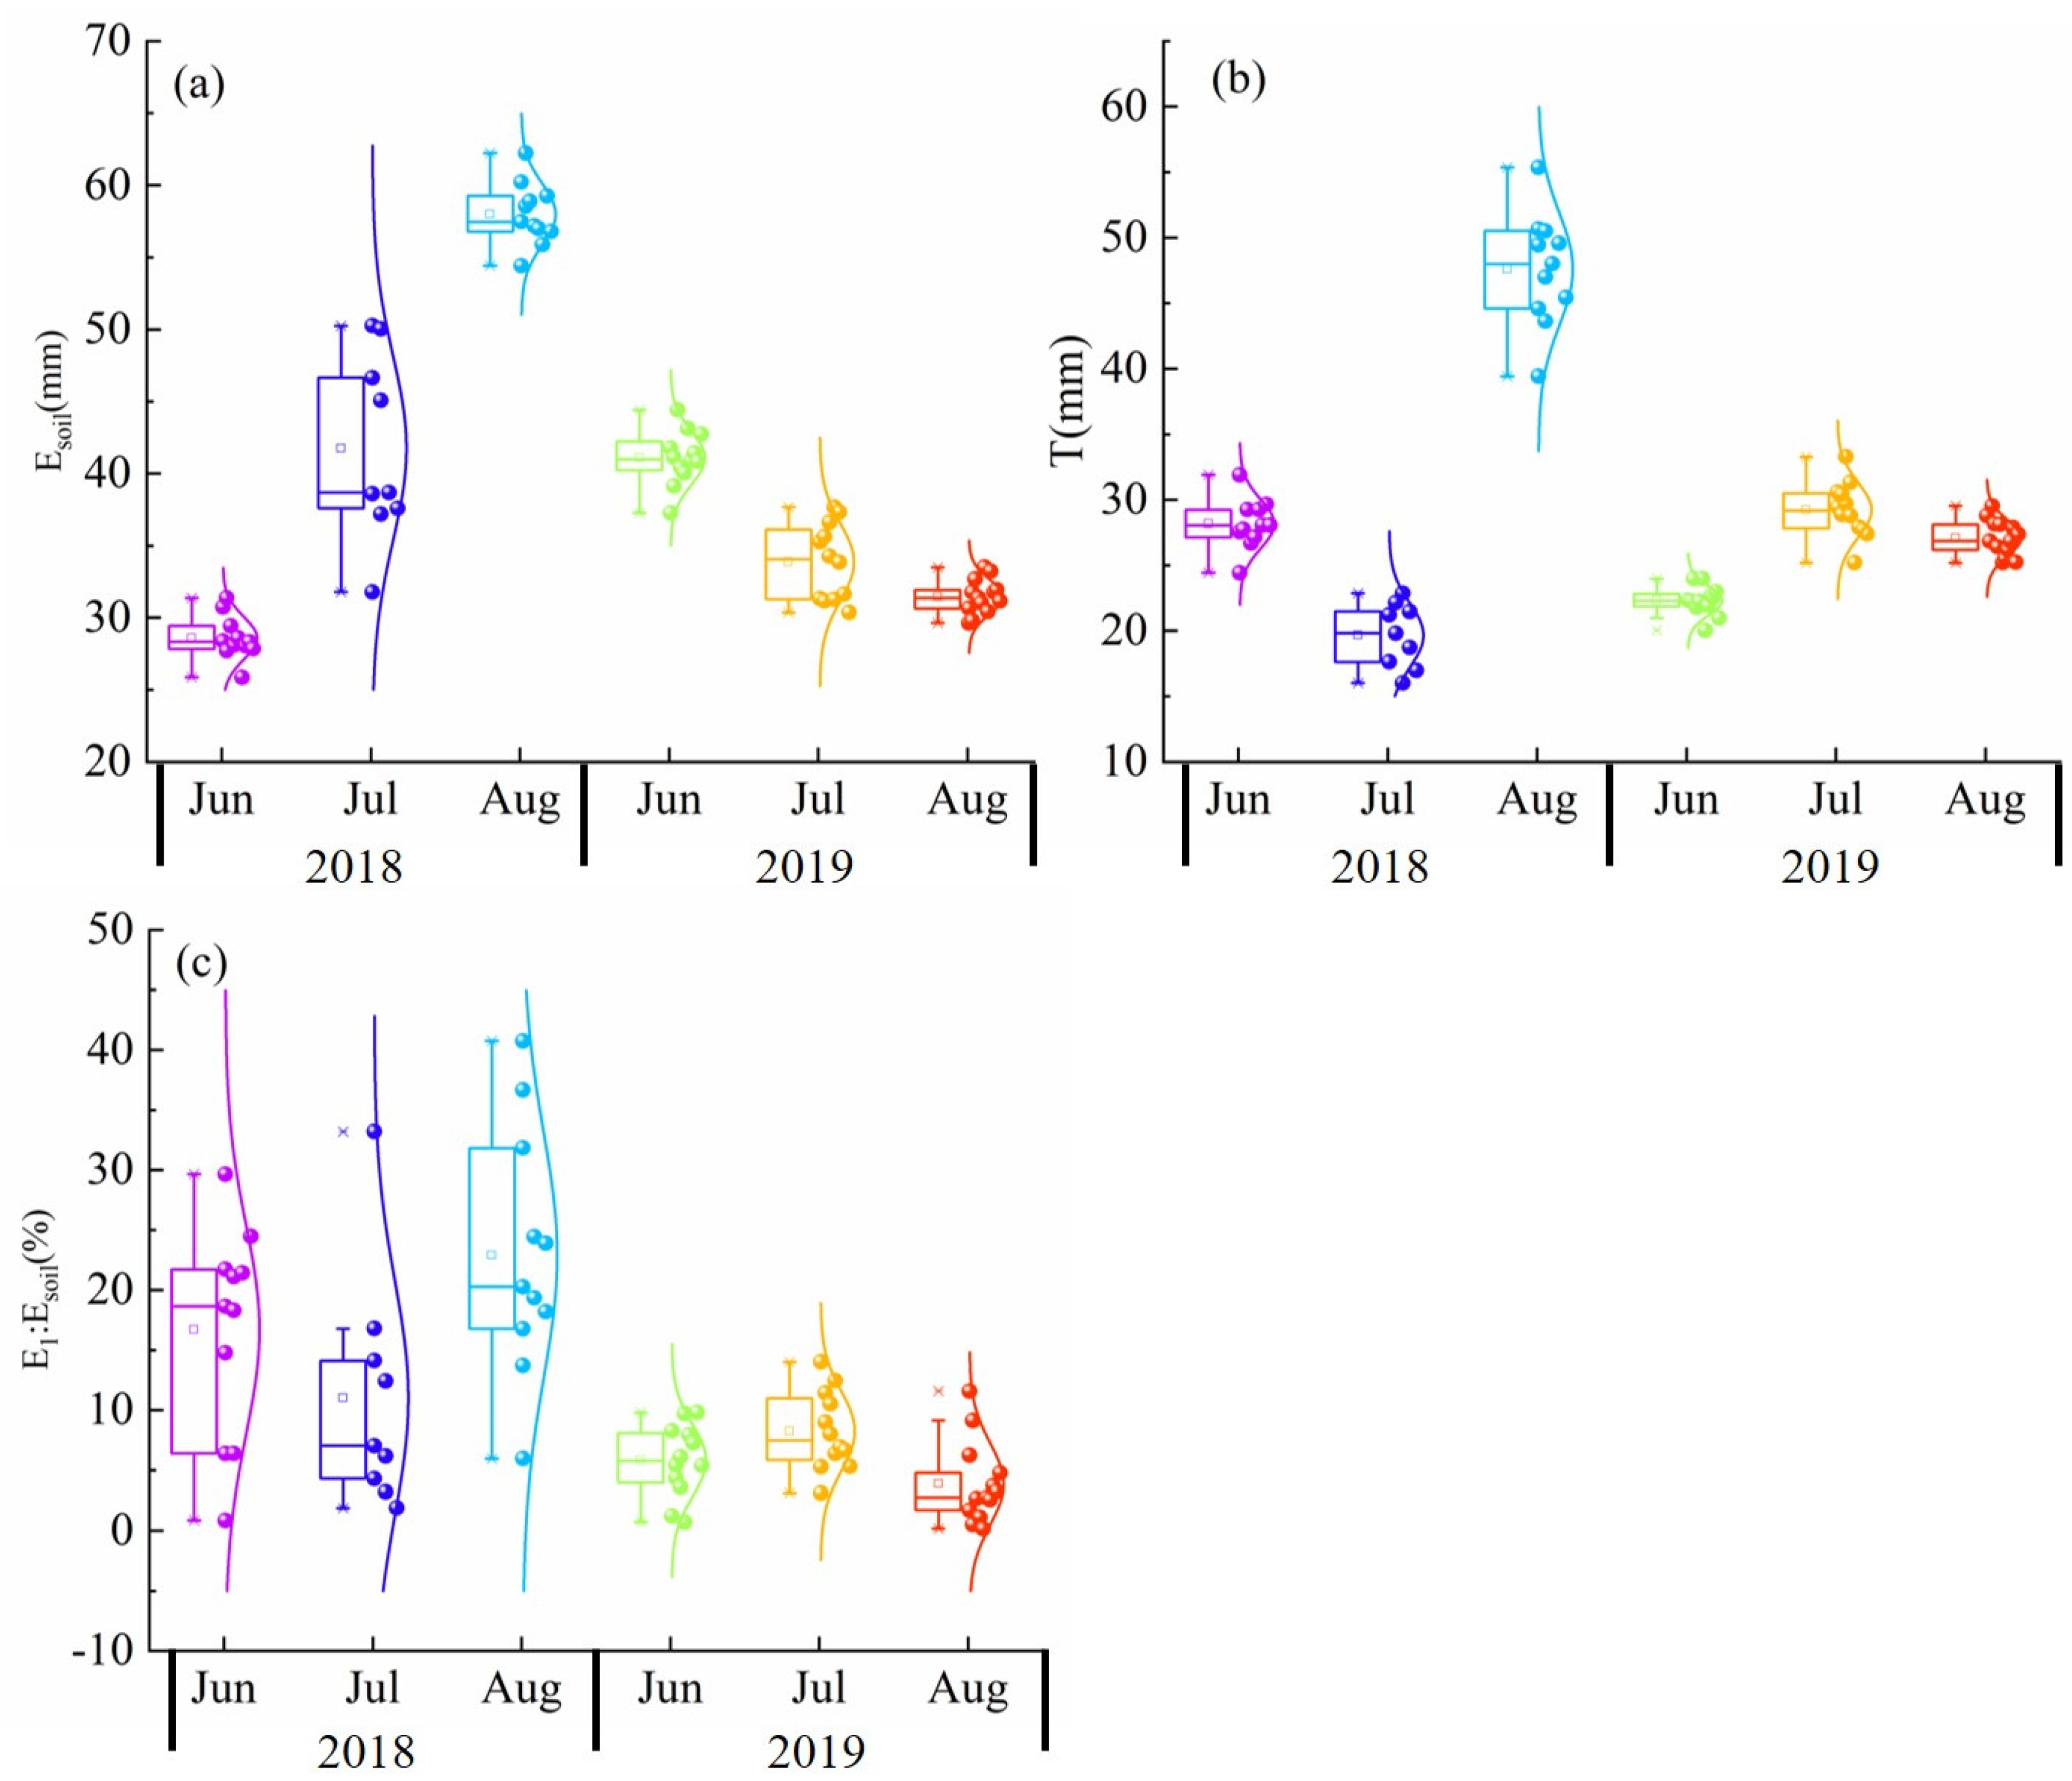
3.2. Partition of E1 from Esoil and T

In terms of monthly variations, Esoil in June to August 2018 in the Shaliu River basin was 25.87 mm to 31.38 mm, 31.79 mm to 50.25 mm, and 54.43 mm to 62.23 mm, respectively. The average value of Esoil was 28.58 mm, 41.76 mm, 57.99 mm, respectively (Figure 5a). The variation of the average Esoil value in the summer of 2018 showed an increasing trend. The maximum average Esoil value was in August and the minimum value was in June (Figure 5a). In terms of spatial variation, the high-value areas of Esoil were mainly distributed in the northern part of the basin, indicating that the Esoil was stronger in the northern part of the basin (Figure 6a–c). In June to August 2019, Esoil in the Shaliu River basin was 37.26 mm to 44.42 mm, 30.36 mm to 37.67 mm, and 29.63 mm to 33.49 mm, respectively. The average value of Esoil was 41.09 mm, 33.87 mm, and 31.45 mm, respectively (Figure 5a). The variation of the average Esoil value in the summer of 2019 showed a decreasing trend. The maximum average Esoil value was in June and the minimum value was in August (Figure 5a). In terms of spatial variation, the high-value areas of Esoil were mainly distributed in the central and northern part of the basin, indicating that the Esoil was stronger in that part of the basin (Figure 6d–f). There were certain differences in the monthly and spatial variations of Esoil in the Shaliu River basin in the summer of 2019, indicating that the Esoil in the basin has regional differences.
In terms of monthly variations, T, in June to August 2018 in the Shaliu River basin, was 24.43 mm to 31.89 mm, 16.03 mm to 22.87 mm, and 39.41 mm to 55.36 mm, respectively. The average value of T was 28.16 mm, 19.66 mm, and 47.60 mm, respectively (Figure 5b). The variation of the average T value in the summer of 2018 showed a trend of first decreasing and then increasing. The maximum average T value was in August and the minimum value was in July (Figure 5b). In terms of spatial variation, the high-value areas of T were mainly distributed in the northern and central part of the basin, indicating that T was stronger in that part of the basin (Figure 7a–c). In June to August 2019, T in the Shaliu River basin was 20.03 mm to 23.98 mm, 25.18 mm to 33.28 mm, and 25.18 mm to 29.54 mm, respectively. The average value of T was 22.31 mm, 29.22 mm, and 27.08 mm, respectively (Figure 5b). The variation of the average T value in the summer of 2019 showed a trend of first increasing and then decreasing. The maximum average T value was in July and the minimum value was in June (Figure 5b). In terms of spatial variation, the high-value areas of T were mainly distributed in the central and northern part of the basin, indicating that T was stronger in the that part of the basin (Figure 7d–f). There were certain differences in the monthly and spatial variations of T in the Shaliu River basin in the summer of 2019.
In terms of monthly variations, the proportion soil fractionation in soil evaporation, (E1:Esoil), in June to August 2018 in the Shaliu River basin was 0.86% to 29.64%, 1.89% to 33.19%, and 5.97% to 40.75%, respectively. The average ratio of E1:Esoil was 16.70%, 11.01%, and 22.90%, respectively (Figure 5c). The variation of the average E1:Esoil ratio in the summer of 2018 showed a trend of first decreasing and then increasing. The maximum average E1:Esoil ratio was in August and the minimum value was in July (Figure 5c). In terms of spatial variation, the high- ratio areas of E1:Esoil were mainly distributed in the southern part of the basin (Figure 8a–c). In June to August 2019, E1:Esoil in the Shaliu River basin was 0.72% to 9.81%, 3.13% to 14.01%, and 0.18% to 11.57%, respectively. The average ratio of E1:Esoil was 5.82%, 8.26%, and 3.87%, respectively (Figure 5c). The variation of the average E1:Esoil ratio in the summer of 2019 showed a trend of first increasing and then decreasing. The maximum average E1:Esoil ratio was in July and the minimum ratio was in August (Figure 5a). In terms of spatial variation, the high-ratio areas of E1:Esoil were mainly distributed in the northwestern part of the basin (Figure 8d–f). There were certain differences in the monthly and spatial variations of E1:Esoil in the Shaliu River basin in the summer of 2019, indicating that the E1:Esoil in the basin has regional differences.

3.3. Partition of Each ET Component

In terms of monthly variations, the ratio of E1 in June to August 2018 in the Shaliu River basin was 0.36% to 12.34%, 1.34% to 22.72%, and 3.32% to 22.87%, respectively. The average ratio of E1 was 6.83%, 7.72%, and 12.57%, respectively (Figure 9a). The variation of the average E1 ratio in the summer of 2018 showed a trend of first decreasing and then increasing. The maximum average E1 ratio was in August and the minimum value was in July (Figure 9a). In terms of spatial variation, the high-value areas of E1 ratio were mainly distributed in the southern part of the basin (Figure 10a–c). In June to August 2019, E1 ratio in the Shaliu River basin was 0.72% to 9.81%, 3.13% to 14.01%, and 0.17% to 11.57%, respectively. The average ratio of E1 was 5.82%, 8.26%, and 3.87%, respectively (Figure 9a). The variation of the average E1 value in the summer of 2019 showed a trend of increasing. The maximum average E1 value was in August and the minimum value was in June (Figure 9a). In terms of spatial variation, the high-ratio areas of E1 were mainly distributed in the northwestern and northeastern part of the basin (Figure 10d–f). There were certain differences in the monthly and spatial variations of E1 in the Shaliu River basin in the summer of 2019, indicating that the E1 in the basin has regional differences.
In terms of monthly variations, the ratio of E2 in June to August 2018 in the Shaliu River basin was 36.19% to 50.87%, 44.41% to 67.42%, and 32.81% to 52.35%, respectively. The average ratio of E2 was 41.98%, 60.38%, and 42.41%, respectively (Figure 9b). The variation of the average E2 ratio in the summer of 2018 showed a trend of first increasing and then decreasing. The maximum average E2 ratio was in July and the minimum value was in June (Figure 9b). In terms of spatial variation, the high-value areas of E2 were mainly distributed in the northern part of the basin (Figure 11a–c). In June to August 2019, E2 ratio in the Shaliu River basin was 58.06% to 64.15%, 45.93% to 52.92%, and 47.89% to 54.27%, respectively. The average ratio of E2 was 61.04%, 49.24%, and 51.66%, respectively (Figure 9b). The variation of the average E2 value in the summer of 2019 showed a trend of first decreasing and then increasing. The maximum average E2 ratio was in June and the minimum value was in July (Figure 9b). In terms of spatial variation, the high-ratio areas of E2 were mainly distributed in the northern and central part of the basin (Figure 11d–f). There were certain differences in the monthly and spatial variations of E2 ratio in the Shaliu River basin in the summer of 2019, indicating that the E2 ratio in the basin has regional differences.
In terms of monthly variations, the ratio of T in June to August 2018 in the Shaliu River basin was 48.77% to 52.79%, 29.51% to 37.28%, and 40.88% to 48.61%, respectively. The average ratio of T was 51.18%, 31.89%, and 45.01%, respectively (Figure 9c). The variation of the average T ratio in the summer of 2018 showed a trend of first decreasing and then increasing. The maximum average T ratio was in August and the minimum ratio was in July (Figure 9c). In terms of spatial variation, the high-ratio areas of T were mainly distributed in the northern and central part of the basin (Figure 12a–c). In June to August 2019, T ratio in the Shaliu River basin was 31.54% to 35.34%, 38.71% to 45.89%, and 40.05% to 47.23%, respectively. The average ratio of T was 33.14%, 42.5%, and 44.47%, respectively (Figure 9b). The variation of the average T ratio in the summer of 2019 showed a trend of first increasing and then decreasing. The maximum average T ratio was in July and the minimum value was in June (Figure 9b). In terms of spatial variation, the high- ratio areas of T were mainly distributed in the northern and central part of the basin (Figure 12d–f). There were certain differences in the monthly and spatial variations of T in the Shaliu River basin in the summer of 2019, indicating that the T ratio in the basin has regional differences.

4. Discussion

4.1. Comparison with Related Research Results

The average ratio of E1 in summer 2018 and 2019 in the Shaliu River basin was 9.04% and 5.98%, respectively. The average value of E2 + T in summer 2018 and 2019 in the Shaliu River basin was 90.96% and 94.02%, respectively. The average value of E2 in summer 2018 and 2019 in the Shaliu River basin was 48.26% and 53.98%, respectively. The calculation results of this study are close to the results of the Nagqu River study [24], but different from those of the Lhasa River and Magazangbu areas [14,36]. This is because the soil fractionation of the Lhasa River is affected by human activities, and the valley is the main cultivated land. The difference from the soil fractionation in Magazangbu area is because the overall altitude of this area is higher than that of the Shaliu River basin, the surface temperature is lower, and the soil type and surface cover are relatively simple, so the soil fractionation intensity is weaker than that of the Shaliu River basin.
The average ratio of Esoil in summer 2018 and 2019 in the Shaliu River basin was 57.30% and 59.96%, respectively. The average ratio of T in summer 2018 and 2019 in the Shaliu River basin was 42.7% and 40.04%, respectively. Han et al. [13] studied the average values of vegetation transpiration and soil evaporation in the source region of the Shaliu River, which were 27.37% and 72.63%, respectively. Hu et al. [37] studied alpine meadow vegetation transpiration and soil evaporation averaged ratio was 44% and 56%, respectively. Tong et al. [12] showed that the proportion of T in the alpine meadow in the Heihe River basin was about 53%. Therefore, for the entire Shaliu River basin, the average ratio of T in 2018 and 2019 in the Shaliu River basin was 42.69% and 40.03%, respectively, which was basically consistent with the results of Hu’s study. In addition, the previous studies were mostly based on models to estimate vegetation transpiration at the site scale, and there were certain uncertainties. The important thing was that previous studies are based on the calculation results of the observation site scale, and have not been extended to the watershed scale, because there will be regional differences in the watershed scale. Hydrogen and oxygen stable isotopes and remote sensing technology provided a new method for accurately calculating vegetation transpiration and soil evaporation in the entire Shaliu River basin.

4.2. Effects of Climatic Factors on Evapotranspiration Flux Components

Climate is an important factor affecting soil evaporation and vegetation transpiration [3,14,28,29]. For soil fractionation in the Shaliu River basin, there was no significant correlation with air temperature and precipitation. E2 + T have extremely significant correlations with precipitation, indicating that incomplete soil evaporation mainly comes from precipitation storage (Table 1). Soil evaporation and plant transpiration were significantly correlated with precipitation, indicating that precipitation was the main water supply source for soil evaporation and plant transpiration (Table 1). Obviously, precipitation is the main climatic factor affecting the delineation of evapotranspiration flux in the Shaliu River Basin of Qinghai Lake. Since the summer precipitation in 2018 (about 400 mm) was significantly more than that in the summer of 2019 (about 300 mm) in the Shaliu River basin; this has caused both soil evaporation and vegetation transpiration in the basin in summer 2019 to be smaller than those in 2018.
Air temperature is one of the factors affecting evaporative fractionation [3,14,28,29]. In 2018 and 2019, there was no significant correlation between soil evaporative fractionation and air temperature in the Shaliu River Basin, indicating that the effect of soil evaporative fractionation was not affected by local air temperature (Table 2). This was because the monthly variation of temperature in the Shaliu River basin is smaller, and there is no obvious trend of significant increase in temperature. Moreover, there are great regional differences affected by altitude and topography, so only soil evaporation and vegetation transpiration in June and July 2019 were affected by temperature (Table 2). This is because the temperature in the summer of 2019 showed a significant upward trend, which affected soil evaporation and vegetation transpiration.
The results from the distribution of evapotranspiration in the basin affected by climate showed that temperature and precipitation were not the main factors affecting soil fractionation, but precipitation was the main factor affecting soil evaporation and vegetation transpiration.

4.3. Deficiency and Uncertainty Analysis of Research

This study conducted a quantitative study on the division of evapotranspiration flux in the Shaliu River Basin of Qinghai Lake, clarified the soil fractionation ratio, temporal and spatial variation characteristics of soil transpiration and vegetation evaporation in the Shaliu River Basin of Qinghai Lake, and revealed its main climate influencing factors. However, the cost and workload of direct observation and verification in this research work are relatively large. The research was mainly compared with the research results in nearby areas. The results showed that the calculation results of this research have high reliability. However, in future research work, research needs to adjust the calculation parameters to make the calculation results more accurate. In addition, due to the limitation of sample collection work and time conditions, future research needs to study the interannual variation of evapotranspiration flux at the basin scale. Its driving mechanism and change mechanism need to be revealed. Of course, there are many factors that affect soil fractionation, soil evaporation, and plant transpiration. This study focuses on the impact of climatic factors on them and draws good conclusions. However, more factors need to be considered, such as soil temperature humidity, vegetation cover, net radiation factor, potential evapotranspiration, etc. The study need to further explore the impact of internal and external factors on soil evaporation and vegetation transpiration in the basin scale, reveal the proportion of their contribution, and provide a theoretical basis for a more in-depth understanding of the ecological and hydrological processes of the Shaliu River basin in the future.

5. Conclusions

In this study, the delineation of summer evapotranspiration flux in the Shaliu River Basin of Qinghai Lake was studied using hydrogen and oxygen stable isotope technology and remote sensing technology, and the following conclusions were drawn.
(1)
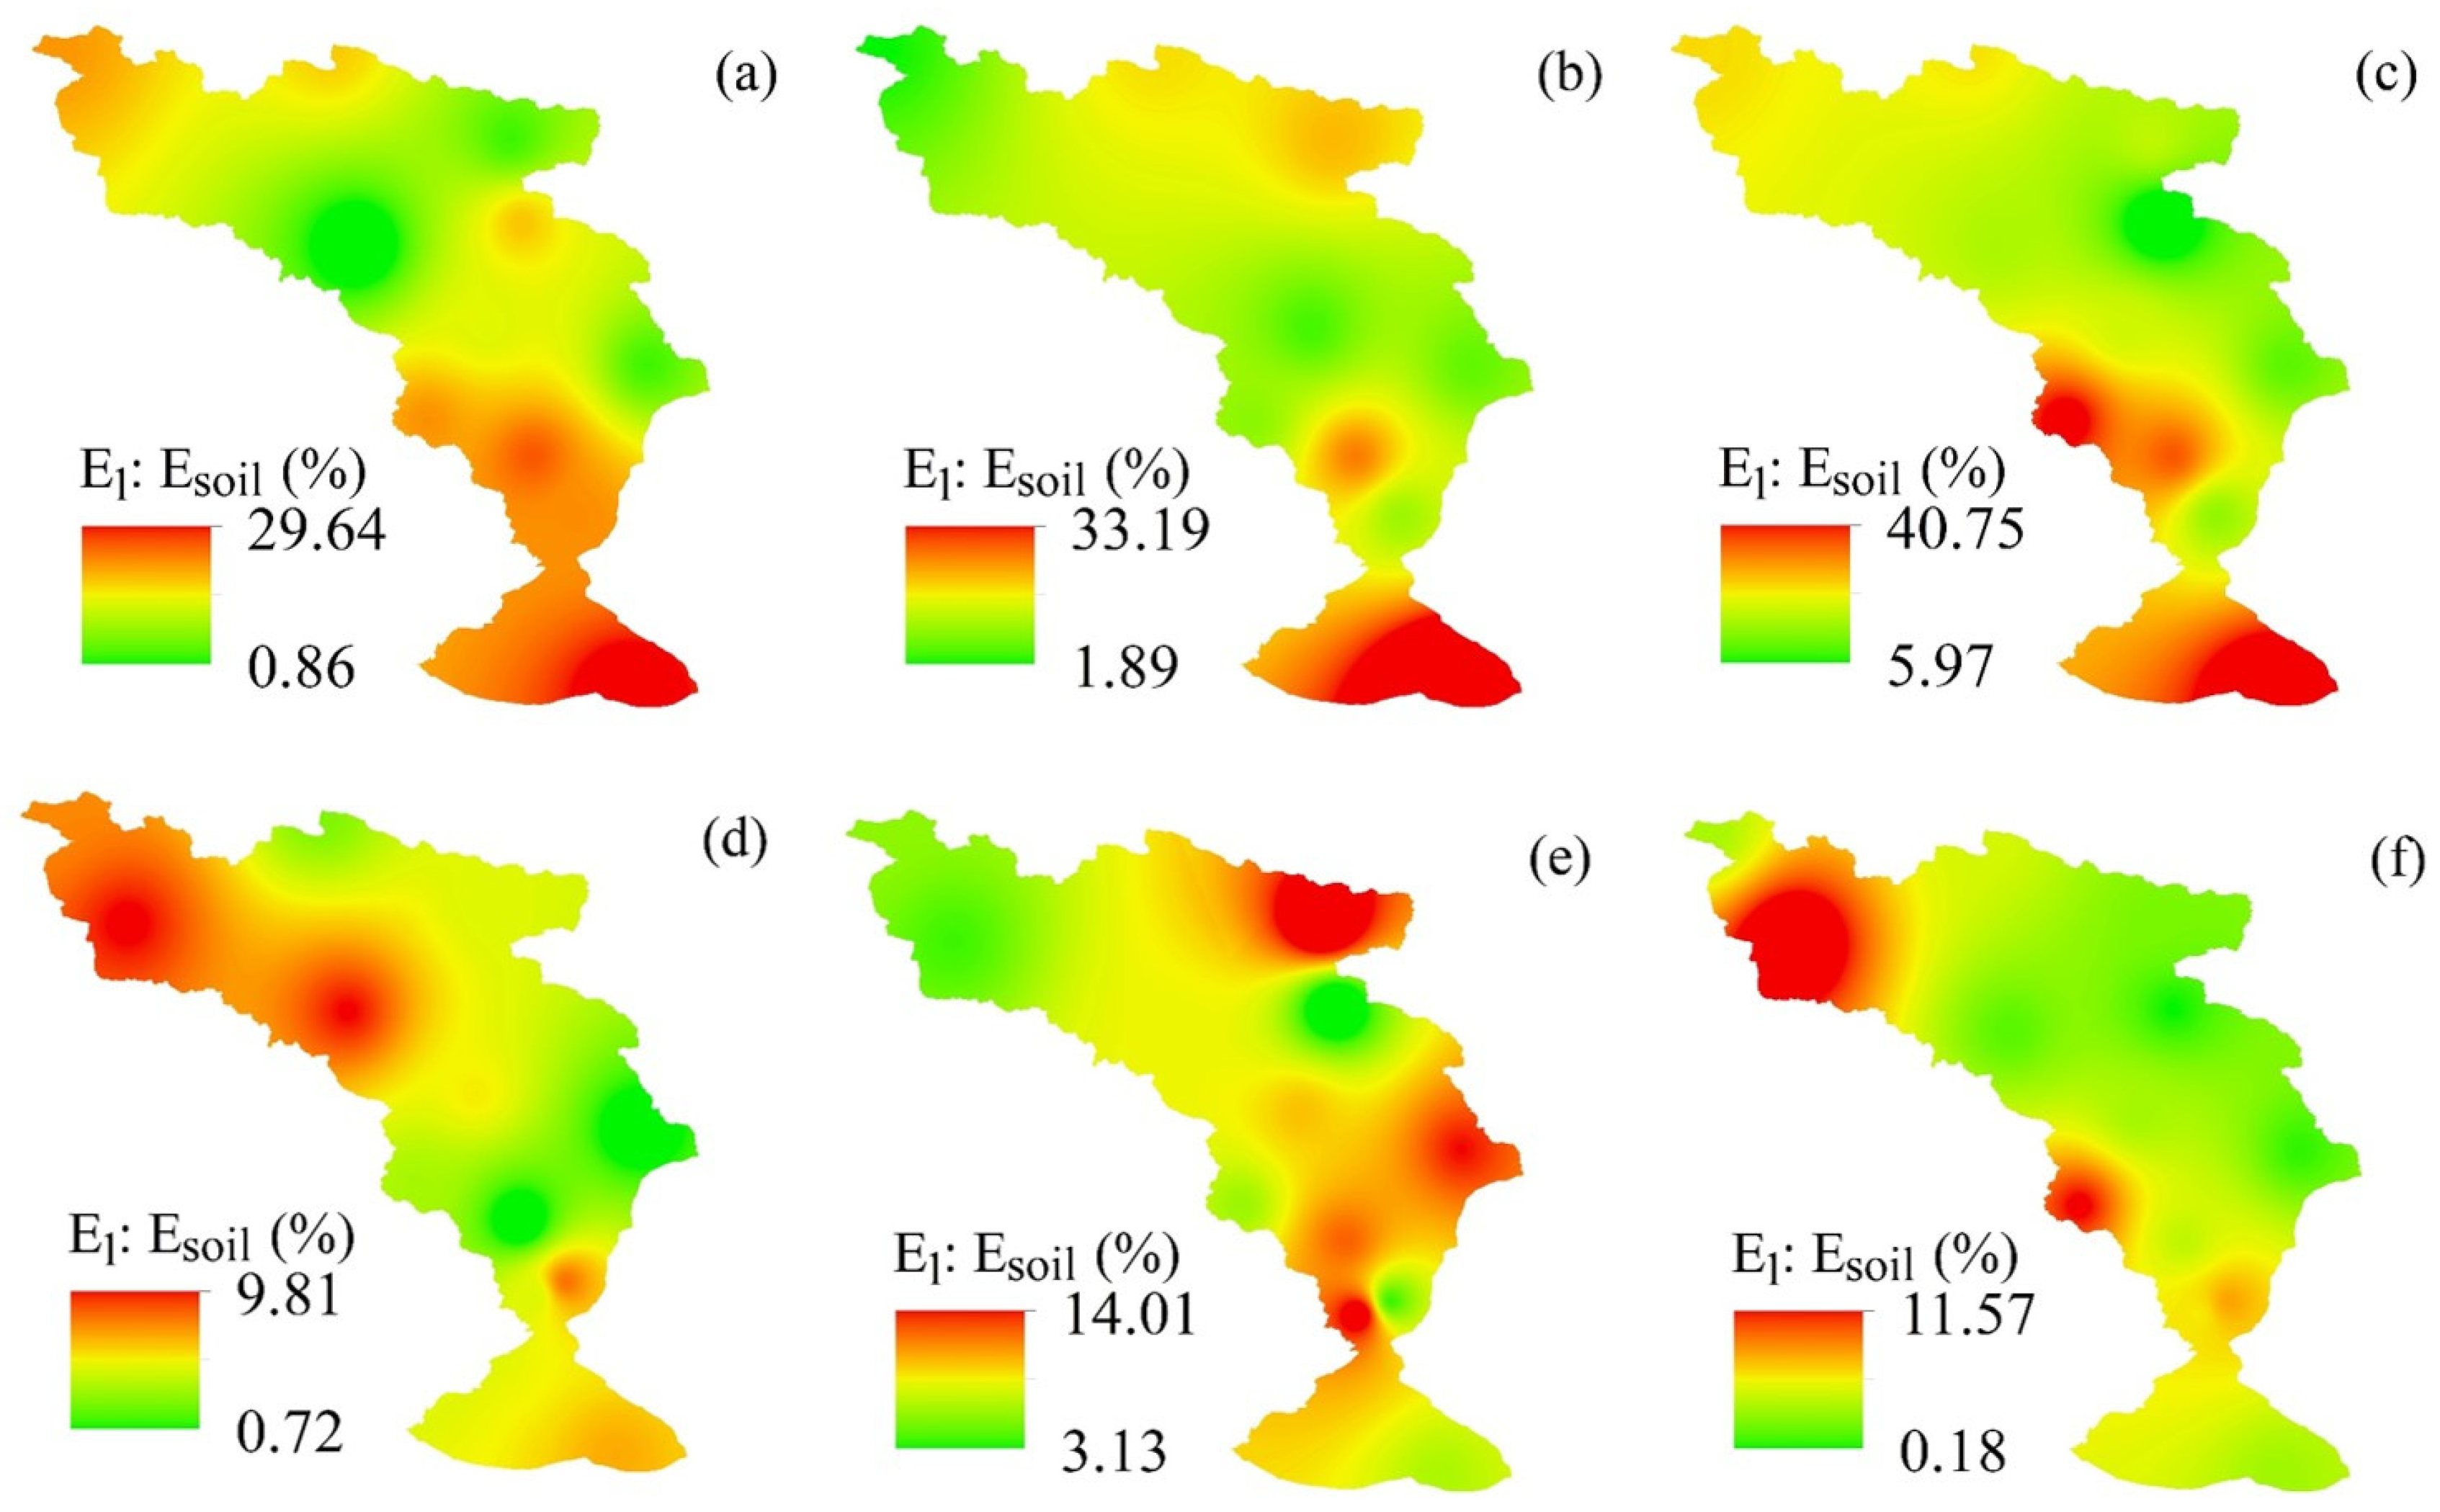
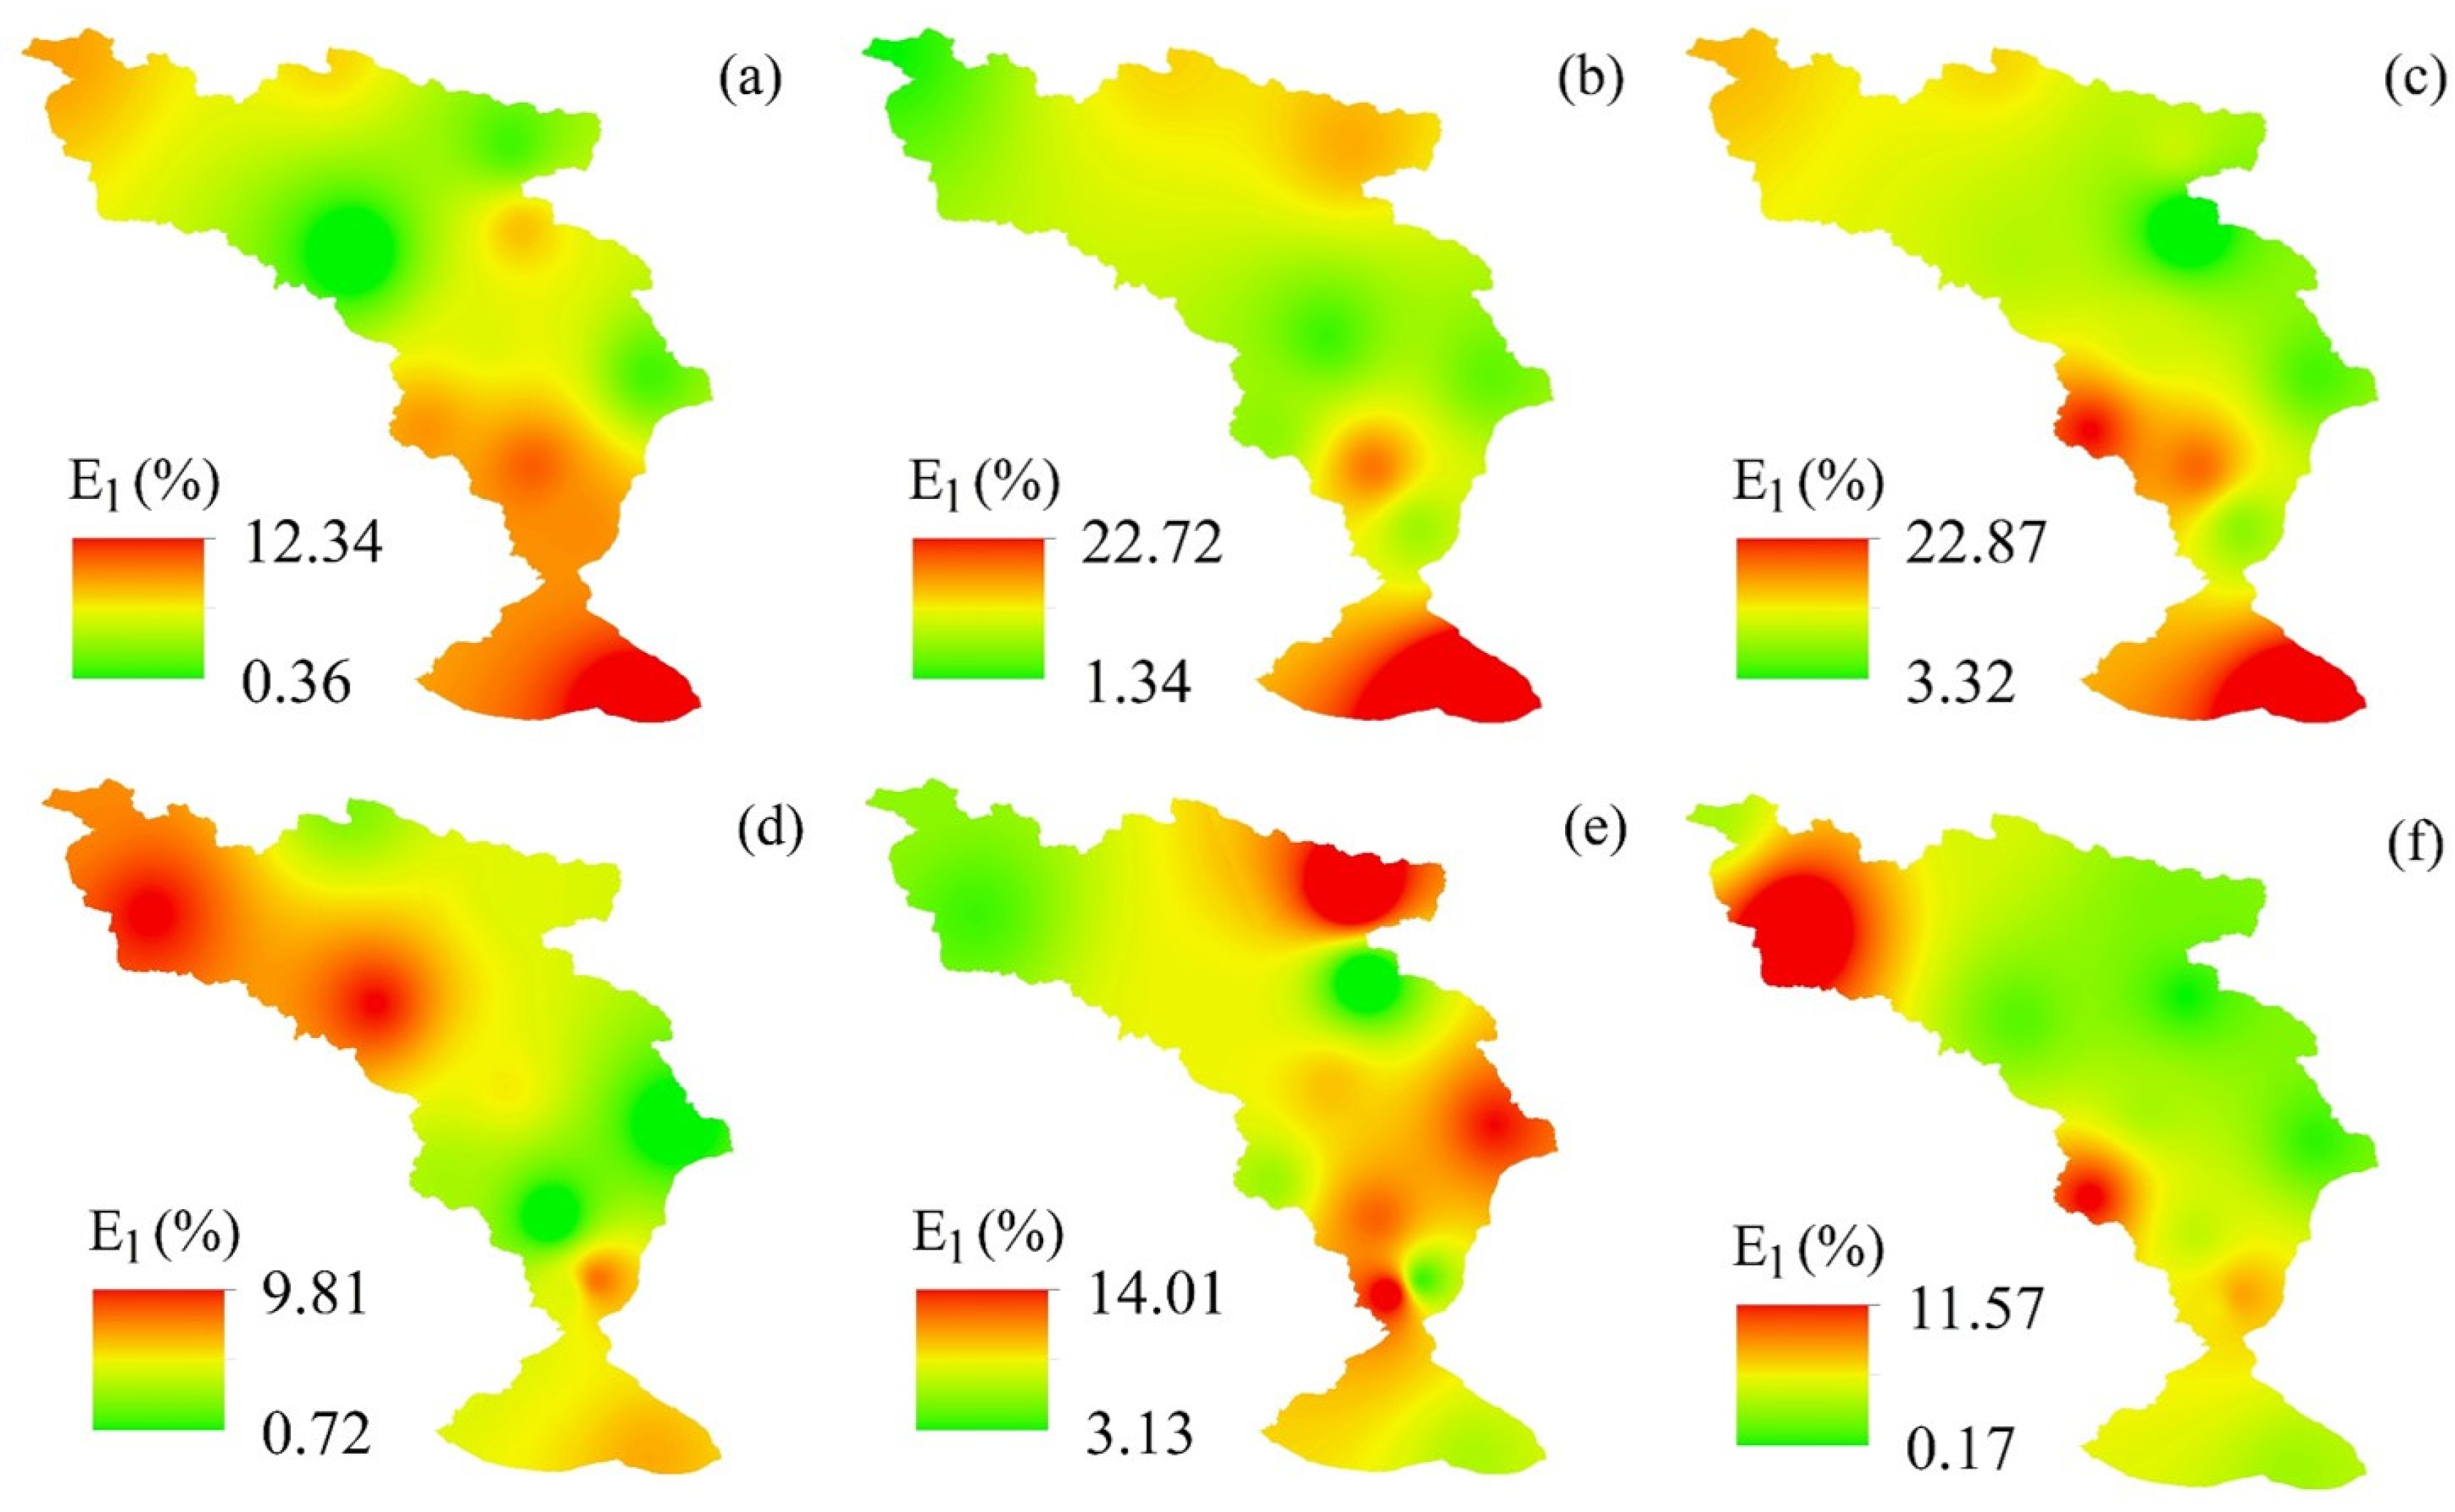
The average ratio of E1 in the summer of 2018 and 2019 in the Shaliu River basin was 9.04% and 5.98%, respectively. The average E1 of the watershed in the summer of 2018 and 2019 was 7.59 mm and 2.10 mm, respectively. The soil fractionation was stronger in the summer of 2018 than that in the summer of 2019.
(2)
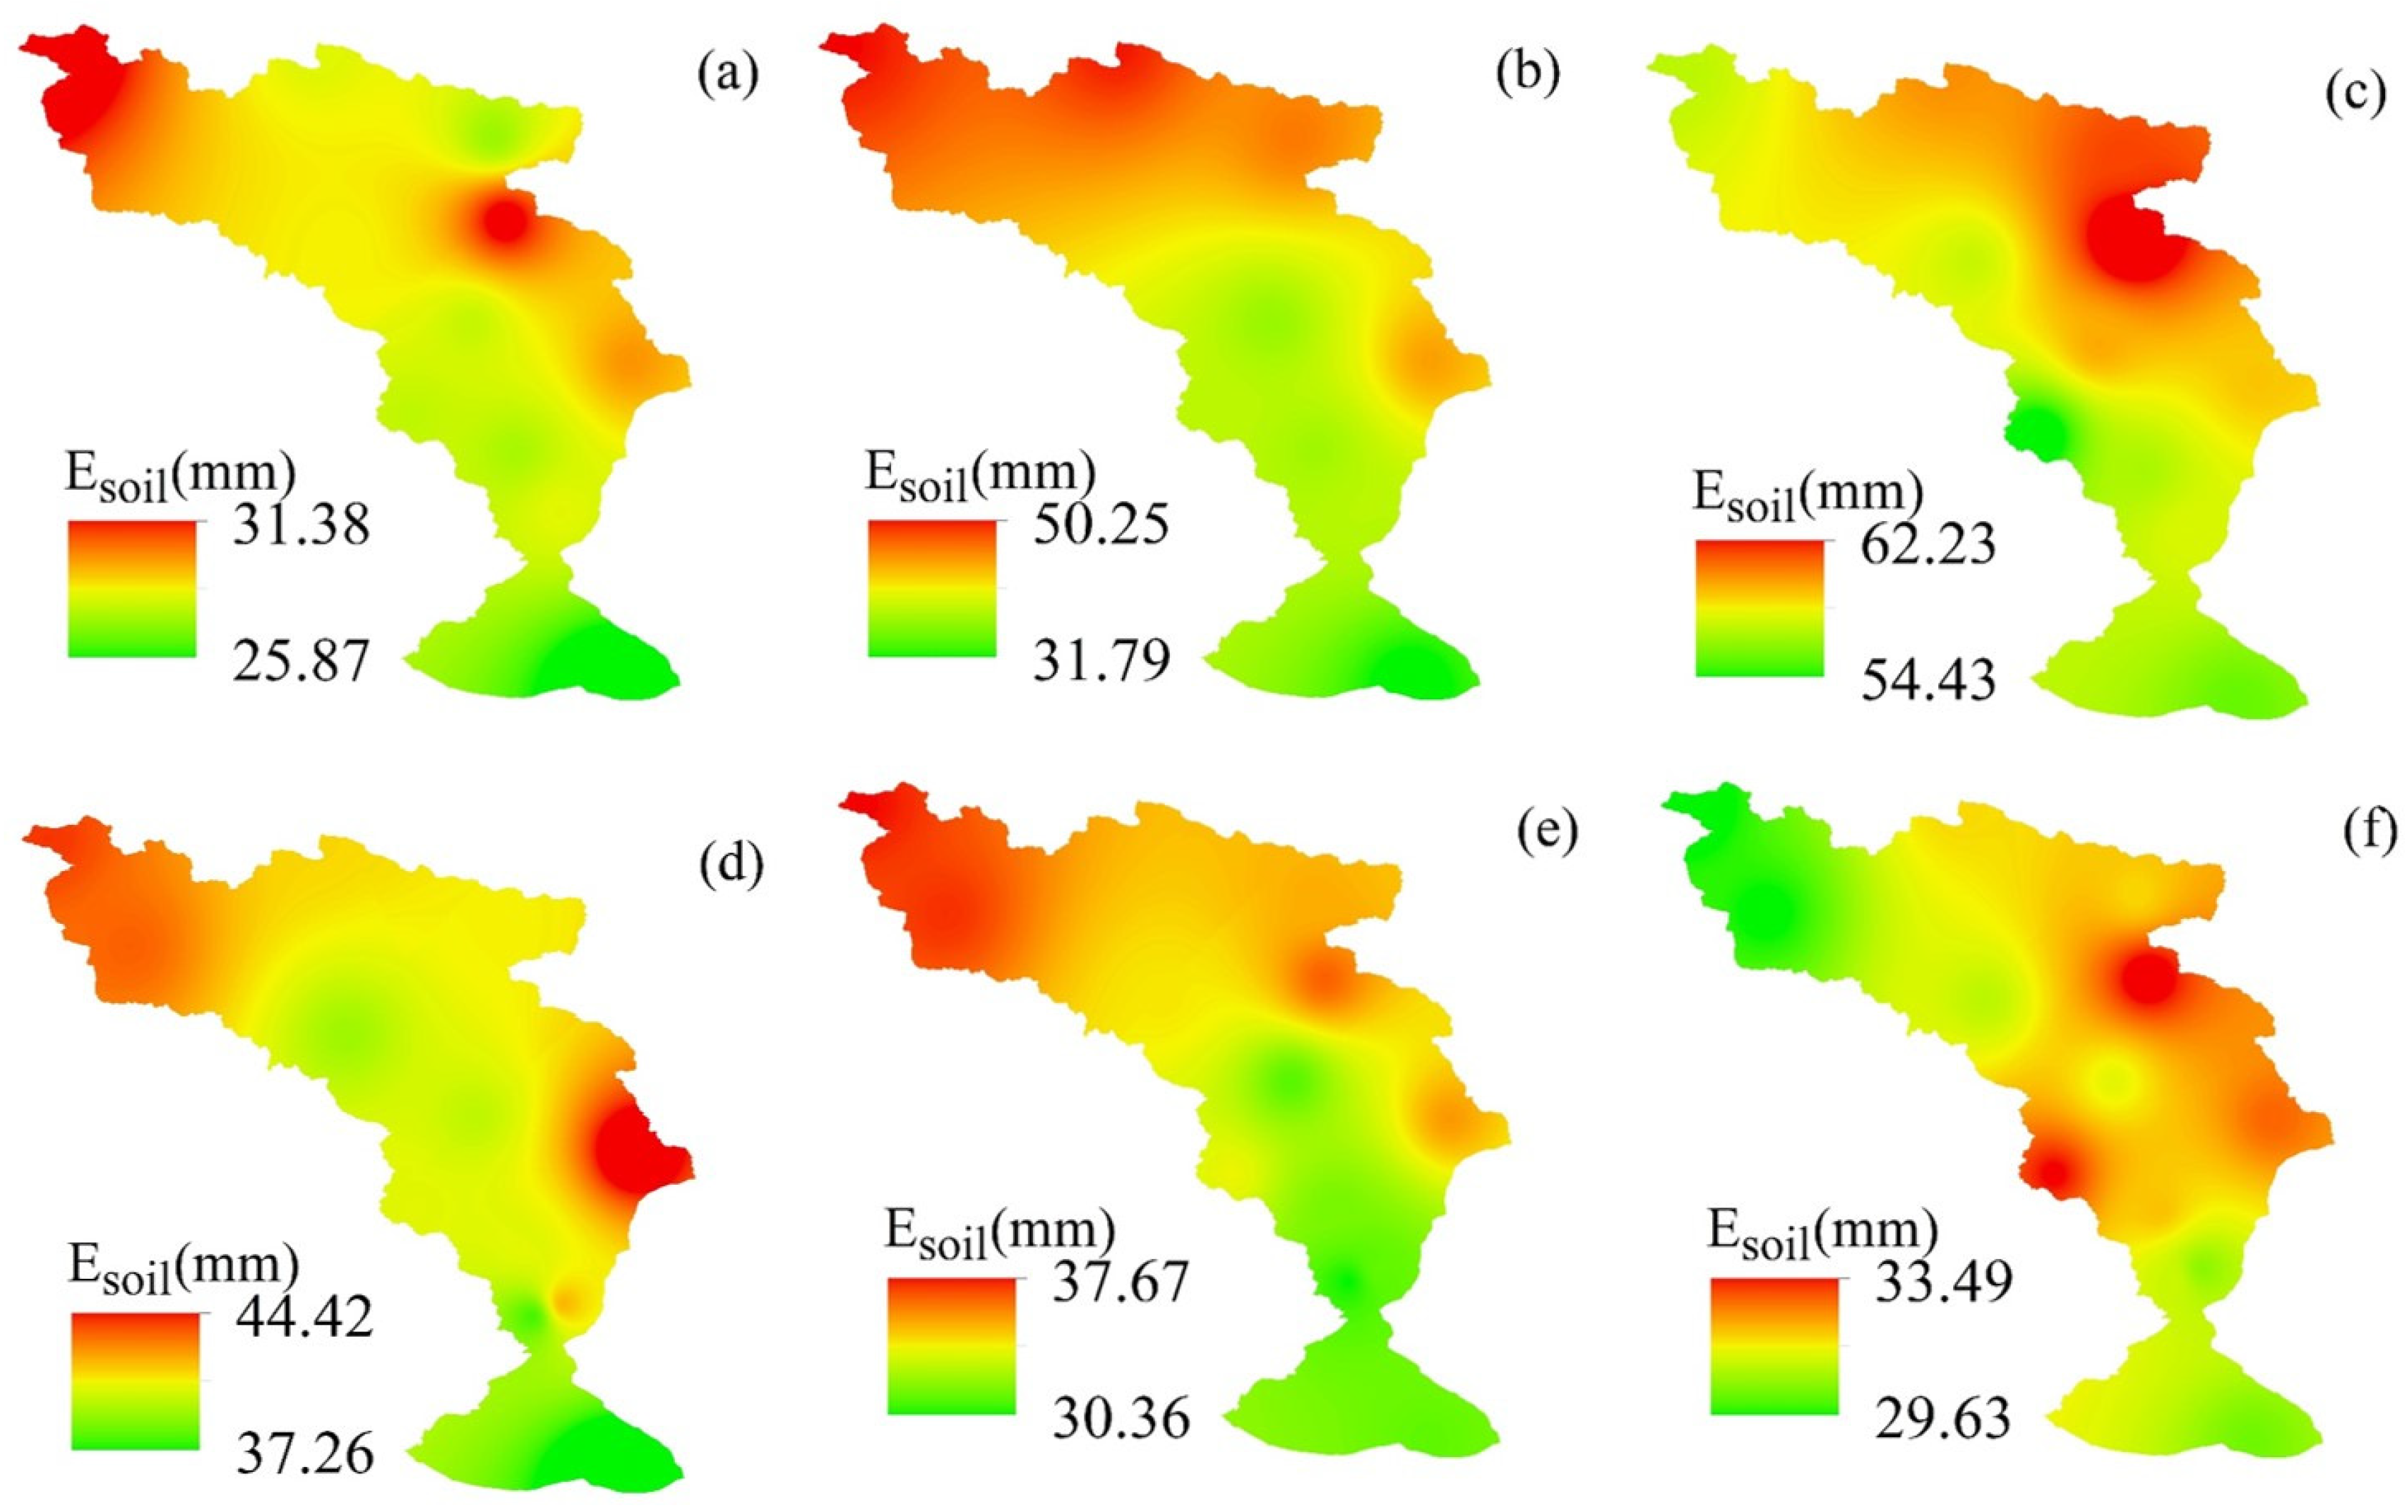
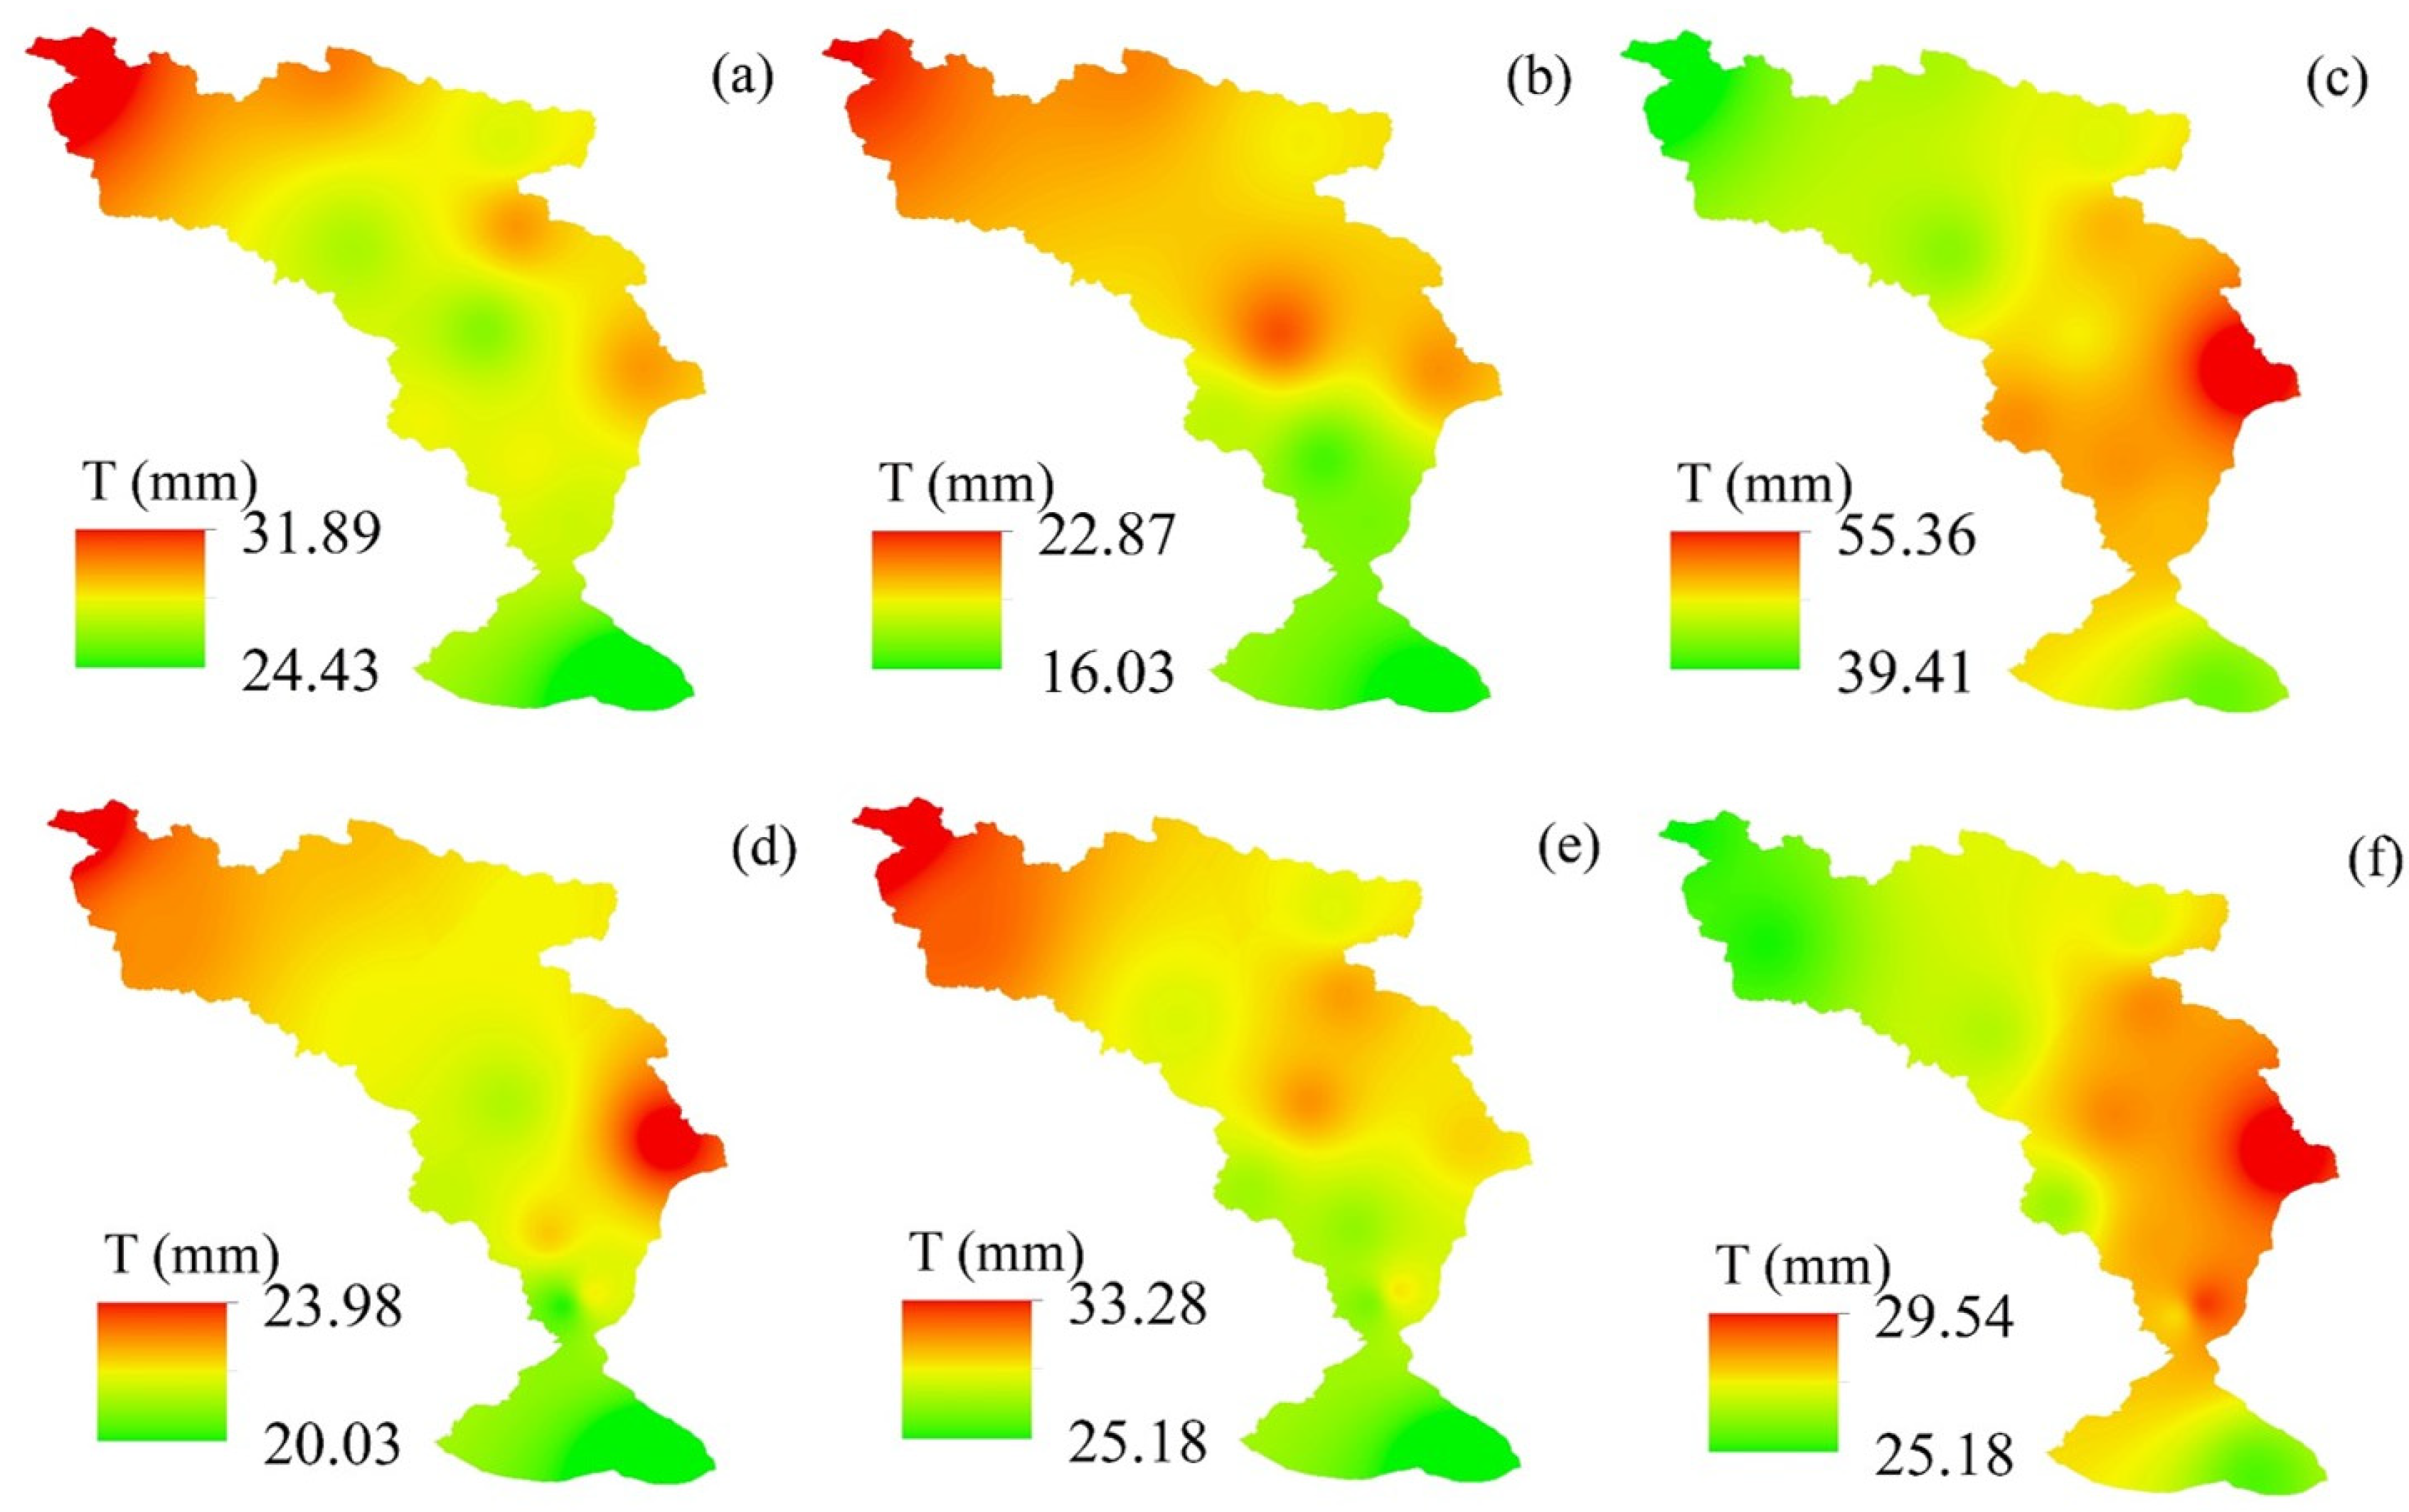
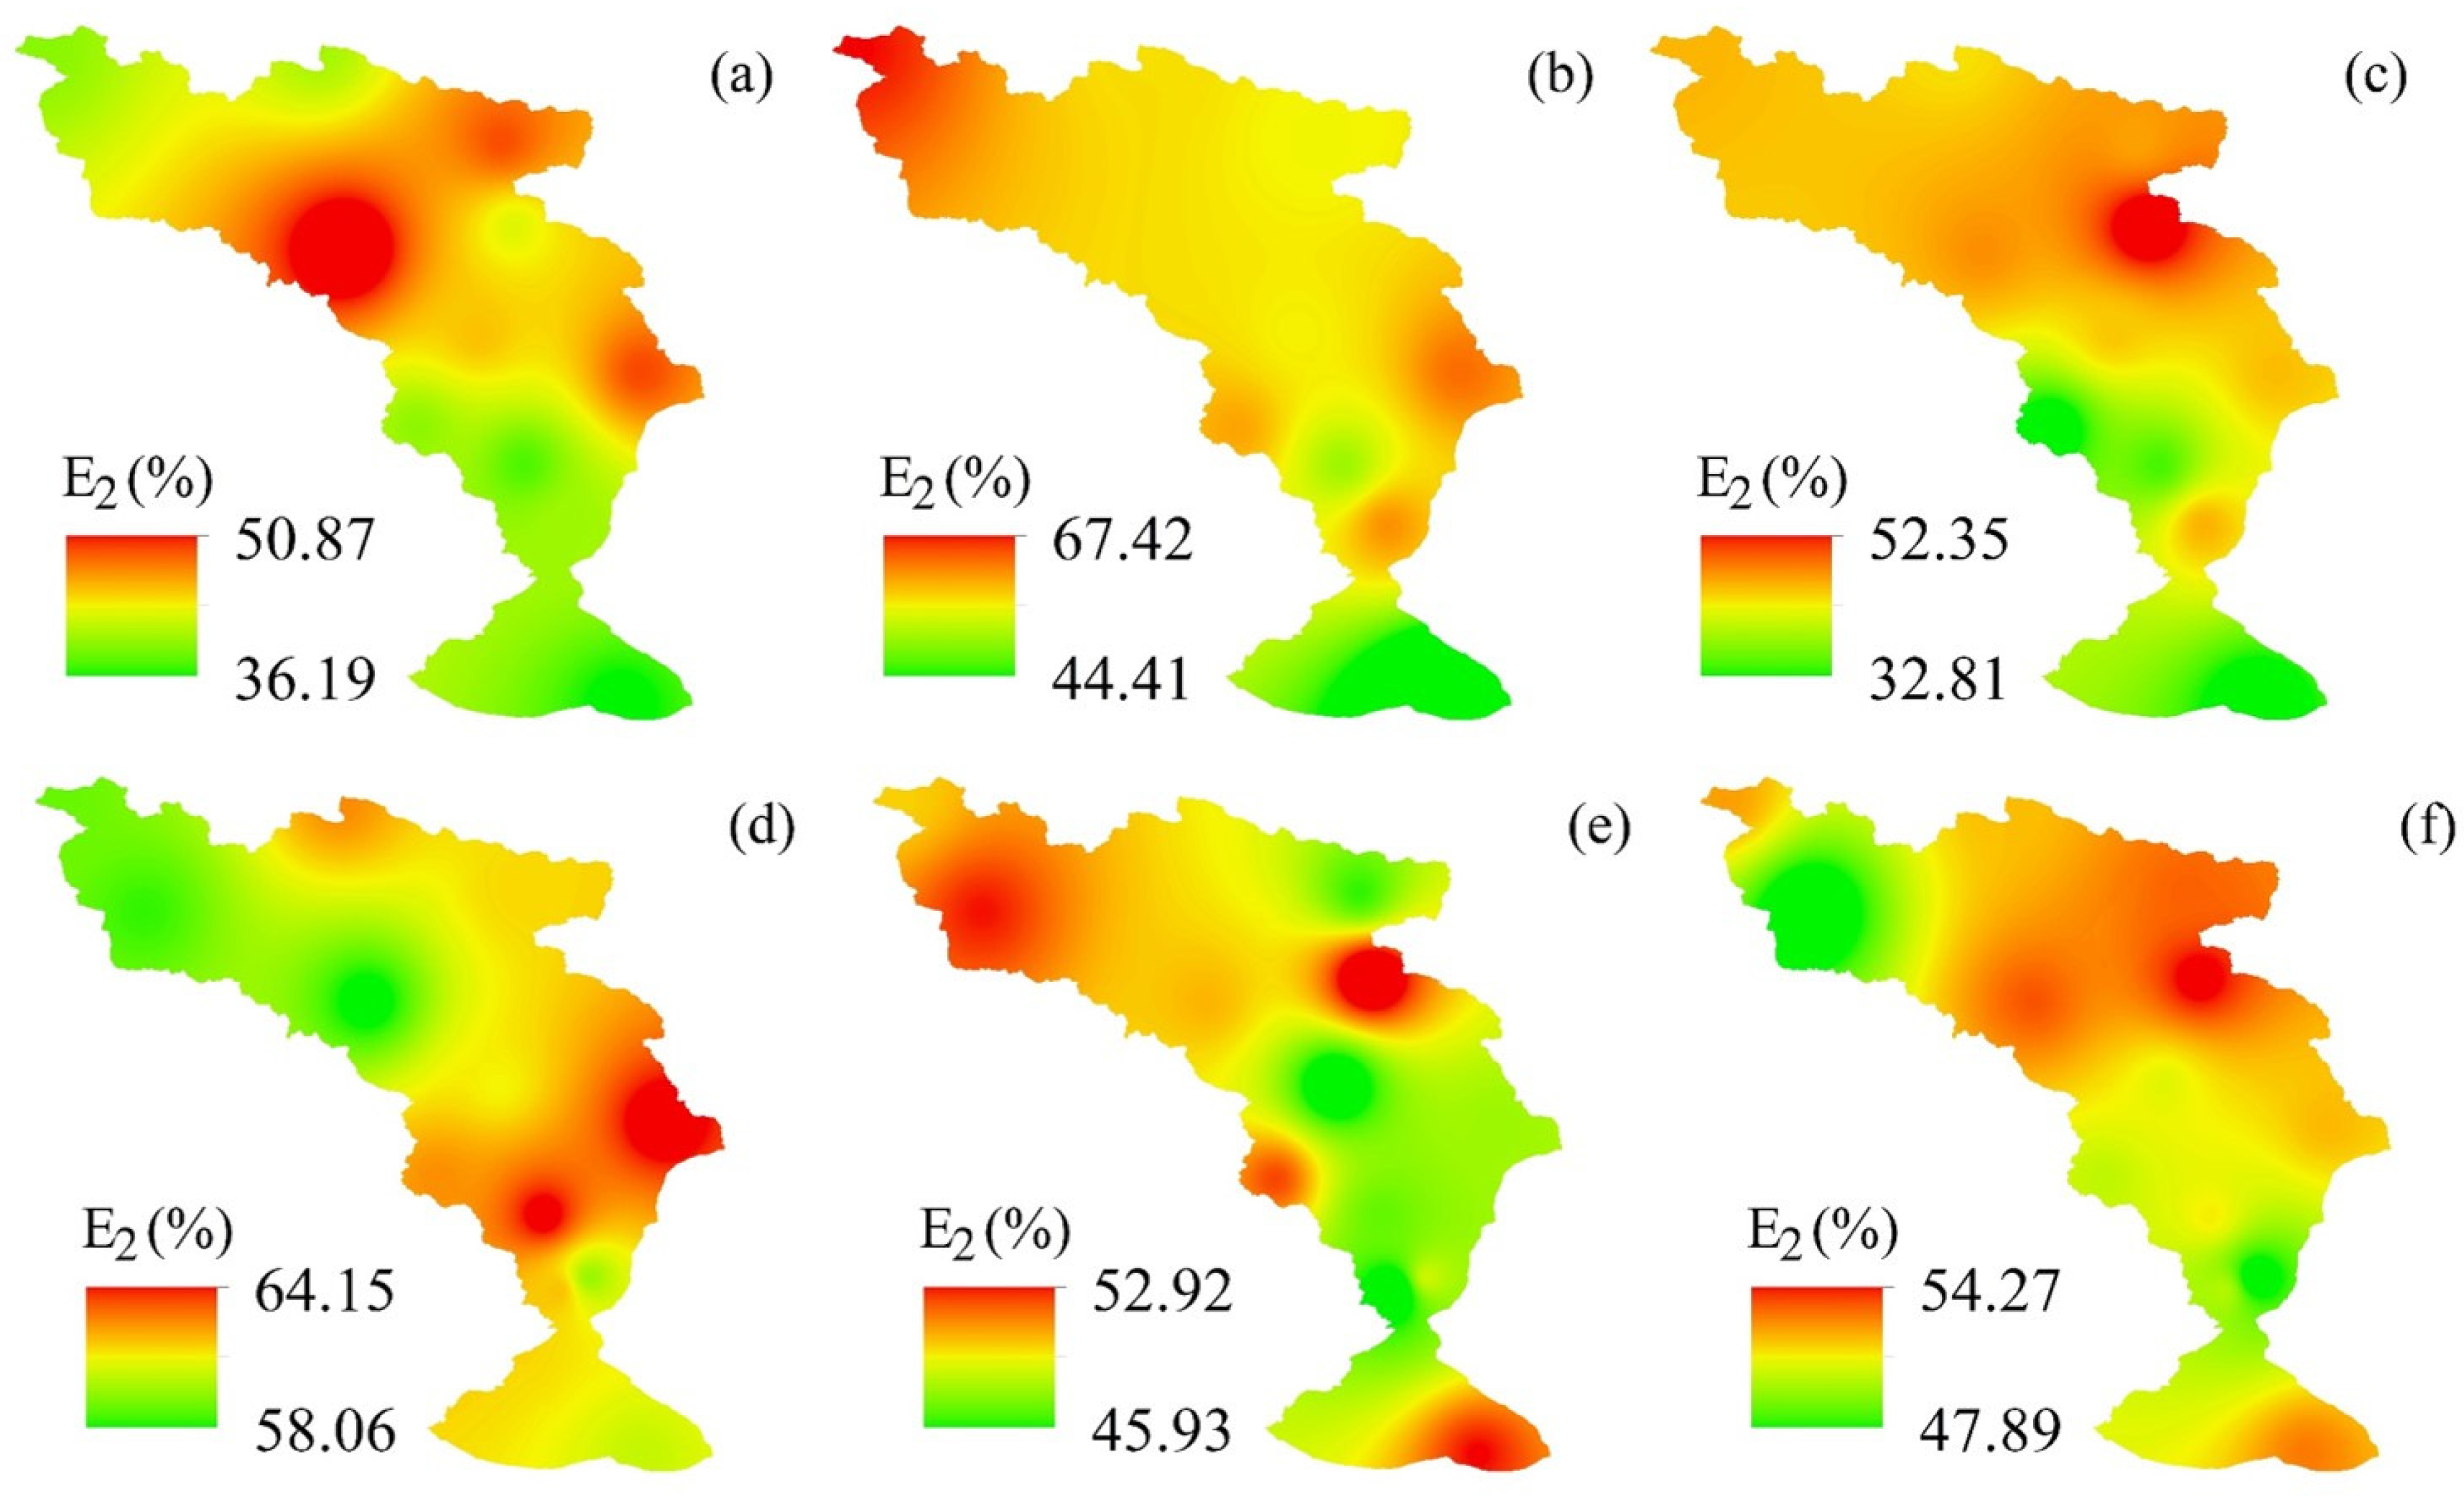
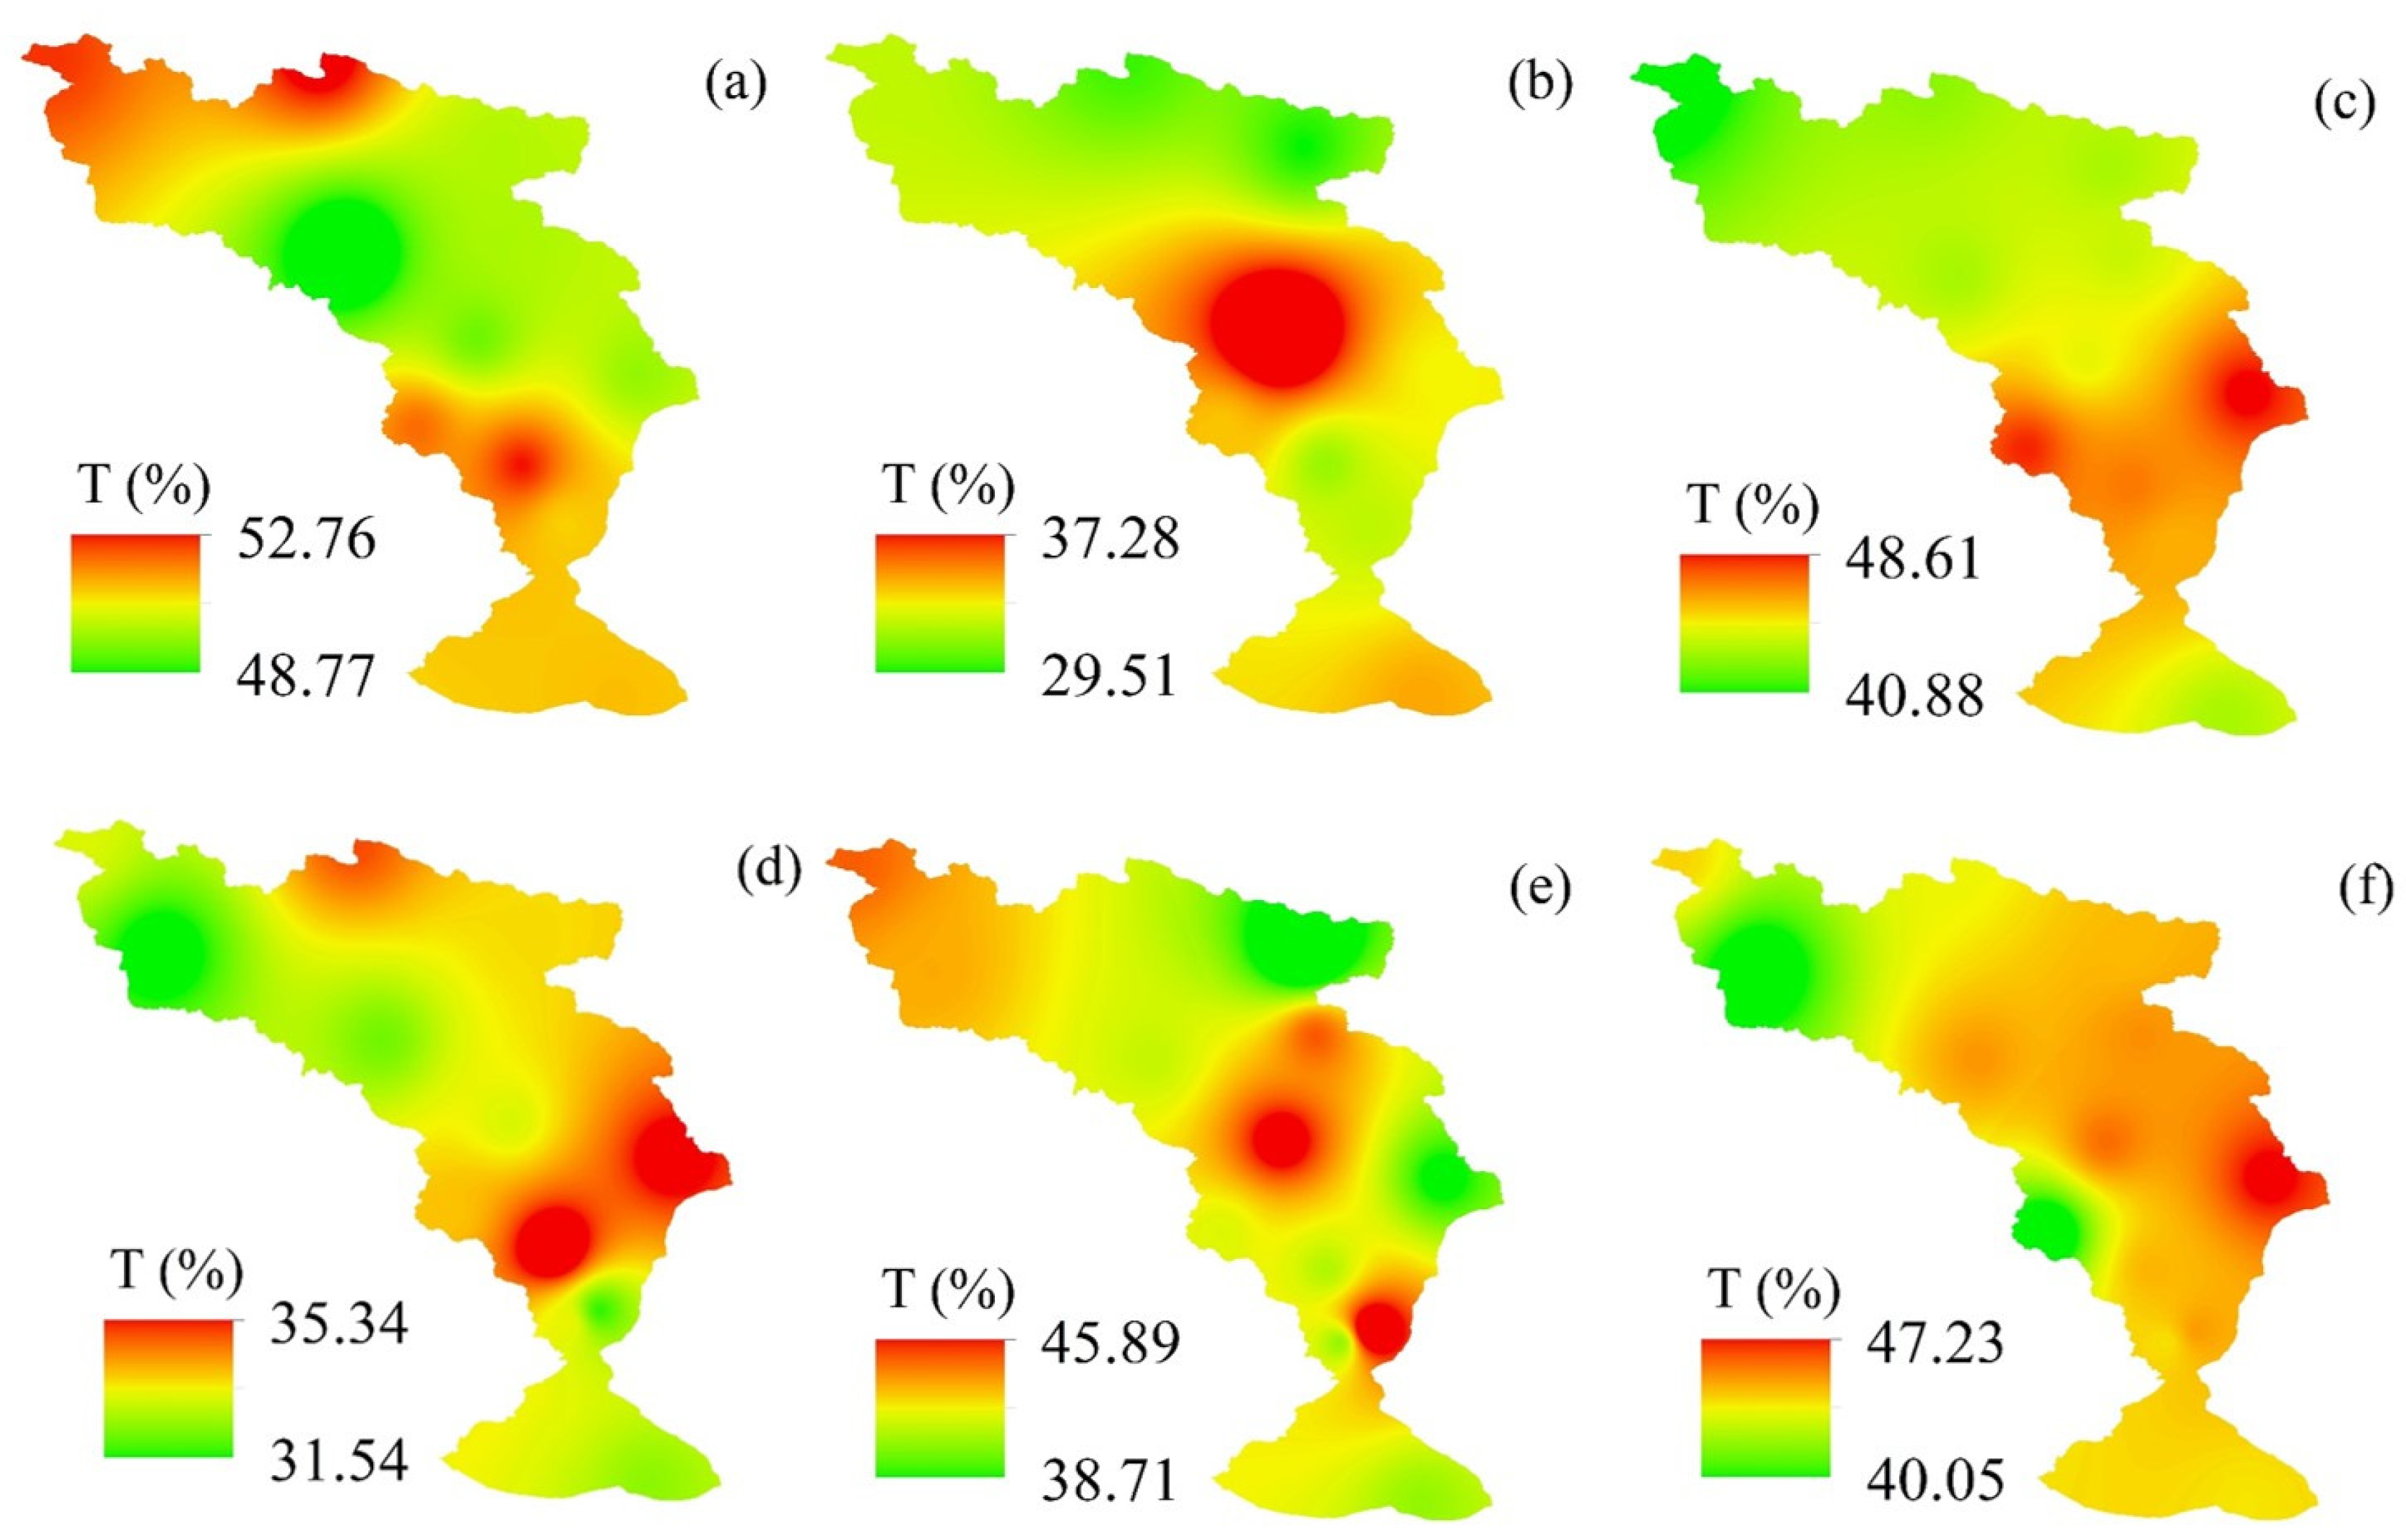
The average soil transpiration and vegetation transpiration in the summer of 2018 were 42.84 mm and 32.59 mm, the average soil transpiration and vegetation transpiration in the summer of 2019 were 35.36 mm and 26.23 mm. Therefore, both soil evaporation and plant transpiration in summer 2018 were higher than those in summer 2019, and soil evaporation was greater than plant transpiration in summer during the study period in the Shaliu River basin.
(3)
Precipitation is the main climatic factor affecting the delineation of evapotranspiration flux in the Shaliu River basin of Qinghai Lake.
This study quantified soil evaporation and vegetation transpiration in the Shaliu River basin in summer, mastered the temporal and spatial variation characteristics of soil evaporation and vegetation transpiration in the basin, and revealed that precipitation is the main factor affecting soil evaporation and vegetation transpiration. The research results can provide a reference for in-depth understanding of the ecological and hydrological processes of alpine inland river basins.

Author Contributions

All of the authors have contributed to the manuscript. Z.W. and S.C. led the write-up of the manuscript with significant contribution. G.C. collected the data and analyzed the data. Y.H., Y.W. and L.K. collected samples and analyzed data. All authors have read and agreed to the published version of the manuscript.

Funding

This research was financially supported by the Natural Science Foundation of Qinghai Province, China (2018-ZJ-905).

Institutional Review Board Statement

Not applicable.

Informed Consent Statement

Not applicable.

Data Availability Statement

Publicly available data sets were analyzed in this study. This data can be found here: https://nasa.gov/ (accessed on 23 July 2021), http://www.geodata.cn (accessed on 25 July 2021), http://data.cma.cn/ (accessed on 18 October 2021).

Conflicts of Interest

The authors declare no conflict of interest.

References

  1. Wilcox, B.P.; Thurow, T.L. Emerging Issues in Rangeland Ecohydrology: Vegetation Change and the Water Cycle. Rangel. Ecol. Manag. 2006, 59, 220–224. [Google Scholar] [CrossRef]
  2. Jung, M.; Reichstein, M.; Ciais, P.; Seneviratne, S.I.; Sheffield, J.; Goulden, M.L.; Bonan, G.; Cescatti, A.; Chen, J.; De Jeu, R.; et al. Recent decline in the global land evapotranspiration trend due to limited moisture supply. Nature 2010, 467, 951–954. [Google Scholar] [CrossRef] [PubMed]
  3. Ma, Y.-J.; Li, X.-Y.; Liu, L.; Yang, X.-F.; Wu, X.-C.; Wang, P.; Lin, H.; Zhang, G.-H.; Miao, C.-Y. Evapotranspiration and its dominant controls along an elevation gradient in the Qinghai Lake watershed, northeast Qinghai-Tibet Plateau. J. Hydrol. 2019, 575, 257–268. [Google Scholar] [CrossRef]
  4. Katul, G.; Oren, R.; Manzoni, S.; Higgins, C.; Parlange, M.B. Evapotranspiration: A process driving mass transport and energy exchange in the soil-plant-atmosphere-climate system. Rev. Geophys. 2012, 50, RG3002. [Google Scholar] [CrossRef] [Green Version]
  5. Zhou, S.; Yu, B.; Zhang, Y.; Huang, Y.; Wang, G. Partitioning evapotranspiration based on the concept of underlying water use efficiency. Water Resour. Res. 2016, 52, 1160–1175. [Google Scholar] [CrossRef] [Green Version]
  6. Wang, P.; Li, X.; Wang, L.; Wu, X.; Hu, X.; Fan, Y.; Tong, Y. Divergent evapotranspiration partition dynamics between shrubs and grasses in a shrub-encroached steppe ecosystem. New Phytol. 2018, 219, 1325–1337. [Google Scholar] [CrossRef] [PubMed] [Green Version]
  7. Yao, T.D.; Masson, D.V.; Gao, J.; Yu, W.; Yang, X.; Risi, C.; Sturm, C.; Werner, M.; Zhao, H.; He, Y.; et al. A review of climatic controls on δ18O in precipitation over the Tibetan Plateau: Observations and simulations. Rev. Geophys. 2013, 51, 525–548. [Google Scholar] [CrossRef]
  8. Zhang, Y.L.; Li, B.Y.; Liu, L.S.; Zheng, D. Redetermine the region and boundaries of Tibetan Plateau. Geogr. Res. 2021, 40, 1543–1553. [Google Scholar]
  9. Wang, Z.; Cao, S.; Cao, G.; Lan, Y. Effects of vegetation phenology on vegetation productivity in the Qinghai Lake Basin of the Northeastern Qinghai–Tibet Plateau. Arab. J. Geosci. 2021, 14, 1–15. [Google Scholar] [CrossRef]
  10. Wang, Z.; Cao, S.; Cao, G.; Hou, Y.; Wang, Y.; Kang, L. Tracing the process of precipitation cycle in the headwater area of Qinghai-Tibet Plateau. Arab. J. Geosci. 2022, 15, 1–22. [Google Scholar] [CrossRef]
  11. Sun, H.L.; Zheng, D.; Yao, T.D.; Zhang, Y.L. Protection and Construction of the National Ecological Security Shelter Zone on Tibetan Plateau. Acta Geogr. Sin. 2012, 67, 3–12. [Google Scholar]
  12. Tong, Y.Q.; Wang, P.; Li, X.Y.; Zhang, C.C.; Bai, Y. Water budget and evapotranspiration partition in an alpine meadow ecosystem in the upstream of the Heihe River, China. Acta Ecol. Sin. 2018, 38, 7400–7411. [Google Scholar]
  13. Han, G.; Cao, G.; Cao, S.; Cheng, K.; Yang, Y.; Liu, Y. Simulation of Evapotranspiration of Xiaopo Lake and Shaliu River Headwater Wetlands Based on Shuttleworth-Wallace Model. Wetl. Sci. 2019, 17, 519–526. [Google Scholar]
  14. Guo, X.Y.; Tian, L.D.; Wang, L.; Yu, W.; Qu, D. River recharge sources and the partitioning of catchment evapotranspiration fluxes asrevealed by stable isotope signals in a typical high-elevation arid catchment. J.Hydrol. 2017, 549, 616–630. [Google Scholar] [CrossRef]
  15. Aemisegger, F.; Pfahl, S.; Sodemann, H.; Lehner, I.; Seneviratne, S.I.; Wernli, H. Deuterium excess as a proxy for continental moisture recycling and plant transpiration. Atmos. Chem. Phys. 2014, 14, 4029–4054. [Google Scholar] [CrossRef] [Green Version]
  16. Aggarwal, P.K.; Romatschke, U.; Araguas-Araguas, L.; Belachew, D.; Longstaffe, F.J.; Berg, P.; Schumacher, C.; Funk, A. Pro-portions of convective and stratiform precipitation revealed in water isotope ratios. Nat. Geosci. 2016, 9, 624–629. [Google Scholar] [CrossRef] [Green Version]
  17. Fischer, B.M.C.; Van Meerveld, H.I.; Seibert, J. Spatial variability in the isotopic composition of rainfall in a small headwater catchment and its effect on hydrograph separation. J. Hydrol. 2017, 547, 755–769. [Google Scholar] [CrossRef] [Green Version]
  18. Wang, X.-F.; Yakir, D. Using stable isotopes of water in evapotranspiration studies. Hydrol. Process. 2000, 14, 1407–1421. [Google Scholar] [CrossRef]
  19. Gibson, J.J.; Edwards, T.W.D. Regional water balance trends and evaporation-transpiration partitioning from a stable isotope survey of lakes in northern Canada. Global Biogeochem. Cy. 2002, 16, 1026. [Google Scholar] [CrossRef] [Green Version]
  20. Ferretti, D.F.; Pendall, E.; Morgan, J.A.; Nelson, J.A.; LeCain, D.; Mosier, A.R. Partitioning evapotranspiration fluxes from a Colorado grassland using stable isotopes: Seasonal variations and ecosystem implications of elevated atmospheric CO2. Plant Soil 2003, 254, 291–303. [Google Scholar] [CrossRef]
  21. Braud, I.; Bariac, T.; Vauclin, M.; Boujamlaoui, Z.; Gaudet, J.P.; Biron, P.; Richard, P. SiSPATIsotope, a coupled heat, water and stable isotope (HDO and (H2O)-18O) transport model for bare soil. Part II. Evaluation and sensitivity tests using two laboratory data sets. J. Hydrol. 2005, 309, 277–300. [Google Scholar] [CrossRef]
  22. Lai, C.T.; Ehleringer, J.R.; Bond, B.J.; Paw, U.K.T. Contributions of evaporation, isotopic nonsteady state transpiration and atmospheric mixing on the delta O-18 of water vapour in Pacific Northwest coniferous forests. Plant Cell Environ. 2006, 29, 77–94. [Google Scholar] [CrossRef] [PubMed]
  23. Wang, L.; Caylor, K.; Villegas, J.C.; Barron-Gafford, G.A.; Breshears, D.D.; Huxman, T.E. Partitioning evapotranspiration across gradients of woody plant cover: Assessment of a stable isotope technique. Geophys. Res. Lett. 2010, 37, L09401. [Google Scholar] [CrossRef] [Green Version]
  24. Liu, Z.F. Stable Isotopes in the Hydrological Process in the Nagqu River Basin of the Central Tibetan Plateau. Ph.D. Thesis, Chinese Academy of Sciences, Beijing, China, 2008. (In Chinese). [Google Scholar]
  25. Ma, Y.-J.; Li, X.-Y.; Liu, L.; Huang, Y.-M.; Li, Z.; Hu, X.; Wu, X.-C.; Yang, X.-F.; Wang, P.; Zhao, S.-J.; et al. Measurements and Modeling of the Water Budget in Semiarid High-Altitude Qinghai Lake Basin, Northeast Qinghai-Tibet Plateau. J. Geophys. Res. Atmos. 2018, 123, 10857–10871. [Google Scholar] [CrossRef]
  26. Ge, Q.S.; Zheng, J.Y.; Hao, Z.X.; Liu, Y.; Li, M. Climate reconstruction and extreme events in China during the past 2000 years. J. Geogr. Sci. 2016, 26, 27–854. [Google Scholar] [CrossRef] [Green Version]
  27. Zhang, B.; Zhang, H.; Jing, Q.; Wu, Y.; Ma, S. Differences in species diversity, biomass, and soil properties of five types of alpine grass-lands in the Northern Tibetan Plateau. PLoS ONE 2020, 15, e0228277. [Google Scholar]
  28. Cui, B.L.; Li, X.Y. Runoff processes in the Qinghai Lake Basin, Northeast Qinghai-Tibet Plateau, China: Insights from stable isotope and hydrochemistry. Quat. Int. 2015, 380–381, 123–132. [Google Scholar] [CrossRef]
  29. Cui, B.L.; Li, X.Y. Stable isotopes reveal sources of precipitation in the Qinghai Lake Basin of the northeastern Tibetan Plateau. Sci. Total Environ. 2015, 527–528, 26–37. [Google Scholar] [CrossRef]
  30. Li, X.Y.; Xu, H.Y.; Sun, Y.L.; Zhang, D.S.; Yang, Z.P. Lake-level change and water balance analysis at Lake Qinghai, west China during recent decades. Water Resour. Manag. 2007, 21, 1505–1516. [Google Scholar] [CrossRef]
  31. Henderson, A.C.G.; Holmes, J.A.; Leng, M.J. Late Holocene isotope hydrology of Lake Qinghai, NE Tibetan Plateau: Effective moisture variability and atmospheric circulation changes. Quat. Sci. Rev. 2010, 29, 2215–2223. [Google Scholar] [CrossRef] [Green Version]
  32. Wu, H.W.; Li, X.Y.; He, B.; Li, J.; Xiao, X.; Liu, L.; Liu, J. Characterizing the Qinghai Lake watershed using oxygen-18 and deuterium stable isotopes. J. Great Lakes Res. 2017, 43, 33–42. [Google Scholar] [CrossRef]
  33. Wu, H.; Zhao, G.; Li, X.Y.; Wang, Y.; He, B.; Jiang, Z.; Zhang, S.; Sun, W. Identifying water sources used by alpine riparian plants in a restoration zone on the Qing-hai-Tibet Plateau: Evidence from stable isotopes. Sci. Total Environ. 2019, 679, 134092. [Google Scholar] [CrossRef] [PubMed]
  34. Wu, H.; Li, X.; Zhang, J.; Li, J.; Liu, J.; Tian, L.; Fu, C. Stable isotopes of atmospheric water vapour and precipitation in the northeast Qing-hai-Tibetan Plateau. Hydrol. Processes 2019, 33, 2997–3009. [Google Scholar] [CrossRef]
  35. Gui, J.; Li, Z.; Feng, Q.; Yuan, R.; Liang, P. Environmental effect and spatiotemporal pattern of stable isotopes in pre-cipitation on the transition zone between the Tibetan Plateau and arid region. Sci. Total Environ. 2020, 749, 141559. [Google Scholar]
  36. Ren, W. Spatial and temporal variability of the stable isotopic composition in waters and implications for water cycle in the Yarlung Zangbo River basin. Ph.D. Thesis, Physical Geography of Tibetan Plateau Research, Chinese Academy of Sciences, Beijing, China, 2014. (In Chinese). [Google Scholar]
  37. Hu, Z.M.; Yu, G.R.; Zhou, Y.L.; Sun, X.; Li, Y.; Shi, P.; Wang, Y. Partitioning of evapotranspiration and its controls in four grassland ecosystems: Application of a two—source model. Agric. For. Meteorology. 2009, 149, 1410–1420. [Google Scholar] [CrossRef]
Figure 1. Location of the study area and water sampling sites.
Water 14 00790 g001
Figure 2. Temporal variation in soil fractionation values (E1) (a) and incomplete evaporation values (E2 + T) (b) in the summer of 2018 and 2019.
Water 14 00790 g002
Figure 3. Spatial variation of soil fractionation (E1) values in summer 2018 (ac) and 2019 (df).
Water 14 00790 g003
Figure 4. Spatial variation of soil fractionation values (E2 + T) in summer 2018 (ac) and 2019 (df).
Water 14 00790 g004
Figure 5. Temporal changes in soil evaporation (Esoil) (a) and plant transpiration (T) (b) values and the proportion soil fractionation in soil evaporation (E1:Esoil) (c) in summers of 2018 and 2019.
Water 14 00790 g005
Figure 6. Spatial variation of soil evaporation value (Esoil) in summer 2018 (ac) and 2019 (df).
Water 14 00790 g006
Figure 7. Spatial variation of plant transpiration (T) value in summer 2018 (ac) and 2019 (df).
Water 14 00790 g007
Figure 8. Spatial variation of the proportion of soil fractionation in soil evaporation (E1:Esoil) in summer 2018 (ac) and 2019 (df).
Water 14 00790 g008
Figure 9. Temporal variation in soil fractionation ratio (E1) (a), soil non-evaporated ratio (E2) (b) and plant transpiration ratio (T) (c) in summer of 2018 and 2019.
Water 14 00790 g009
Figure 10. Spatial variation of soil fractionation ratio (E1) in summer 2018 (ac) and 2019 (df).
Water 14 00790 g010
Figure 11. Spatial variation of soil non-evaporated ratio (E2) in summer 2018 (ac) and 2019 (df).
Water 14 00790 g011
Figure 12. Spatial variation of plant transpiration ratio (T) in summer 2018 (ac) and 2019 (df).
Water 14 00790 g012
Table 1. Correlation between precipitation and evapotranspiration flux components.
Time20182019
Componentsof ETJune PJuly PAugust PJune PJuly PAugust P
E1 (mm)−0.01−0.2−0.34−0.01−0.03−0.13
E2 + T (mm)0.66 **0.92 **0.77 **0.86 **0.95 **0.88 **
Esoil (mm)0.94 **0.96 **0.89 **0.99 **0.88 **0.74 **
T (mm)0.92 **0.74 **0.82 **0.97 **0.81 **0.80 **
E1/Esoil (%)0.03−0.36−0.33−0.03−0.11−0.15
E1 (%)0.03−0.340.42 *−0.03−0.11−0.15
E2 (%)0.010.51 *0.120.020.120.05
T (%)0.02−0.130.45 *0.060.020.2
Note: E1 (mm) represents soil fractionation value, E2 + T (mm) represents incomplete evaporation value, Esoil (mm) represents soil evaporation value, T (mm) represents vegetation evaporation value, E1/Esoil represents the proportion of soil fractionation in soil evaporation, E1 (%) represents soil fractionation ratio, E2 (%) represents soil unfractionation ratio, T (%) represents vegetation evaporation ratio. * represents significant correlation, ** represents extremely significant correlation.
Table 2. Correlation between temperature and evapotranspiration flux components.
Time20182019
Componentsof ETJune TJuly TAugust TJune TJuly TAugust T
E1 (mm)0.31−0.01−0.04−0.040.01−0.01
E2 + T (mm)0.020.01−0.01−0.38−0.82 **0.03
Esoil (mm)0.020.010.1−0.54 *−0.75 **0.01
T (mm)0.070.01−0.38−0.64 **−0.78 **0.02
E1/Esoil (%)0.280.01−0.05−0.010.06−0.01
E1 (%)0.280.010.02−0.010.06−0.01
E2 (%)−0.320.010.180.04−0.05−0.01
T (%)0.310.010.55 *0.010.020.02
Note: E1 (mm) represents soil fractionation value, E2 + T (mm) represents incomplete evaporation value, Esoil (mm) represents soil evaporation value, T (mm) represents vegetation evaporation value, E1/Esoil represents the proportion of soil fractionation in soil evaporation, E1 (%) represents soil fractionation ratio, E2 (%) represents soil unfractionation ratio, T (%) represents vegetation evaporation ratio. * represents significant correlation, ** represents extremely significant correlation.
Publisher’s Note: MDPI stays neutral with regard to jurisdictional claims in published maps and institutional affiliations.

