
Habitat Changes along Ipoly River Valley (Hungary) in Extreme Wet and Dry Years
by
 , ,
, ,
Ildikó T.-Járdi
1,* ,
,
Dénes Saláta
2,
Eszter S.-Falusi
1,
Gergő Péter Kovács
3,
Réka Láposi
1,
Zalán Zachar
1 and
Károly Penksza
1 1
Department of Botany, Institute of Crop Production, Hungarian University of Agriculture and Life Sciences (MATE), Páter Károly u. 1., H-2100 Gödöllő, Hungary
2
Institute of Wildlife Management and Nature Conservation, Hungarian University of Agriculture and Life Sciences (MATE), Páter Károly u. 1., H-2100 Gödöllő, Hungary
3
Department of Agronomy, Institute of Crop Production, Hungarian University of Agriculture and Life Sciences (MATE), Páter Károly u. 1., H-2100 Gödöllő, Hungary
*
Author to whom correspondence should be addressed.
Water 2022, 14(5), 787; https://doi.org/10.3390/w14050787
Submission received: 7 February 2022
/
Revised: 13 February 2022
/
Accepted: 28 February 2022
/
Published: 2 March 2022
(This article belongs to the Section Water and Climate Change)
Abstract
:The Ipoly Valley is a natural habitat along the Ipoly River, only slightly affected by water management; therefore, this is an especially sensitive area and reflects well the vegetation changes in the driest (2020) and wettest (2010) years. The study’s aim is to identify natural changes within habitats and the evaluation of habitat types’ boundaries. For the study, a hand-held GPS device was applied on-site. The habitat identification is based on the General National Habitat Classification System (Á-NÉR). In addition to on-site data, Sentinel-2A satellite data were used to compare different extreme years 2020 and 2021—changes in different habitat patches using different vegetation indices. A change in precipitation causes shifts in the vegetation, this is shown on a map. As we predicted, decreasing the precipitation results in a decrease of the area of wet habitat patches. The satellite image shows a more accurate picture of the real location of the associations, which is important for long-term research. In addition, we can get accurate data on the situation of areas (roads and paths) affected by anthropogenic factors.
1. Introduction
It can be seen in a previous study that the Ipoly region is sensitive to environmental changes, in which it has been shown that certain wetlands change significantly [1]. In recent decades, an increase in climate extremes has been observed in Europe due to global climate change [2], therefore, more frequent droughts and floods were measured in the Carpathian Basin [3,4]. Since the beginning of the 19th century, the wetland areas have decreased significantly [5]. The biodiversity and ecosystem functions of river floodplains are considered to be extremely valuable with high conservation status, and they are increasingly exposed to these changes [6]. Floodplain areas are even more vulnerable to invasive species due to climatic effects [7]; in addition, the changes in land use pose a threat to the ecosystems [8]. Rainfall data has been recorded since 1901 in Hungary [9], and measurements presented that from the beginning of the 20th century the national average annual rainfall decreased gradually [10,11]. The year 2010 was the wettest in the examined period [4,9,10,11]. However, after the year 2010, extremely low annual rainfall was measured several times. The year 2020 was the third driest year in the past 120 years [12]. The vegetation and habitats of flood-basin areas along the rivers, which are known to react the most sensitively to environmental changes (in this case to the change in water table) [1,8,13,14], as the Ipoly Valley. Although it has a linear nature, Ipoly Valley harbors especially mosaic-like vegetation, mainly because it is a nonregulated, natural watercourse [1]; Ipoly River is one of the last rivers least affected by water management in Hungary. Correlation between the soil moisture level and degree of vegetation heterogeneity was also detected in other watercourses in the Pannonian region [14], and changes in groundwater clearly influence the spatial pattern of vegetation types as shown by previous studies [15,16]. Moreover, with the growing expansion of agriculture, most of the pastures were drained and plowed [17], and for all these reasons the Ipoly Valley offers an ideal research space to explore changes in natural habitat.
Our questions were the following: Could we identify the effects of precipitation on vegetation based on habitat maps from the extreme years 2010 and 2020? Could we identify habitat transformation and if a change is detected, what kind of vegetation and habitat types are affected and in what way? In addition, we would like to confirm the finding of what differences or similarities can be found when using a non-traditional (satellite-based) method when comparing 2 years between different precipitation conditions. Finally, due to ecological and conservational reasons, it is important to study the anthropogenic phenomena, such as arable fields or routes by available satellite-based possibilities, like the application of different indexes.
2. Materials and Methods
The study site is located in northern Hungary, along the River Ipoly, between Dejtár and Ipolyvece villages. Its extent is 430.4 hectares of floodplain in the Ipoly Valley, which is a protected nature reserve area; in addition, it is also a nature conservation area (HUDI20026) and bird sanctuary (HUDI10008), and it is subject to the Ramsar Convention site as well [18,19].
The habitat maps present ways of biotope changes by the extreme climate and rainfall patterns caused by climate change and allows us to understand the local impacts. The habitat surveys of the study site were made in 2010 and 2020. For the study, a hand-held GPS device was applied on-site. The habitat identification is based on the General National Habitat Classification System (Á-NÉR) (Table 1) [20]. In general, habitat patches belong to only one habitat category (e.g., H5b), but some habitat plots were characterized by several habitat types. The area of Ipoly Valley is extremely mosaic, therefore, in some cases, it was difficult to present the habitat due to the size of the biotope; in these cases habitat complex H5b × P2b was used. Table 2 helps to interpret the changes and quantitative comparison of the habitat types, while the habitat maps were designed with the same key to helping identify changes.
In addition to on-site data, Sentinel-2A satellite data were used to compare changes in different habitat patches. Sentinel-2A was launched on 23 June 2015 as a part of the European Copernicus Program [21]. Sentinel-2A offers a 60-m solution from 10 m [22]. In comparison with the Landsat OLI/TIRS recordings with spectral selection, the Sentinel-2A is capable of the transmission of near-infrared and red bands at 10 m solution. This method allows the mapping of the area at the vegetation level [23]. Satellite images provide the possibility to evaluate the areas that are physically hard to reach. The research was made on 22 May 2020 and 16 June in 2021 Sentinel-2A data. The satellite data were not available in 2010 in the first survey year; we selected the wettest year that was available (2021) based on data from the National Meteorological Service (Figure 1) in order to compare 2 years with different humidity based on satellite images. The categories of anthropogenic habitat patches (U7 × U11) were merged for satellite data to better represent human factors.
Our study applies the frequent use of NDVI compared to other vegetation indices used for the monitoring of vegetation [24]. All vegetation indexes were calculated by satellite bands. NDVI (Normalized Difference Vegetation Index) is a non-dimensional value that reflects the vegetation activity of a given area. It is returned by the quotient of the sum and the difference of the reflected intensity of NIR and RED [25].
GNDVI (Green Normalized Difference Vegetation Index) is more sensitive to chlorophyll concentration than the NDVI index. Therefore, this index is a good indicator of discharge period or drought [25].
The research applied two, water-based indexes that were used by the 20 m resolution band. One of them is the NDWI (Normalized Difference Water Index) for detecting changes in water bodies but shows a higher value in addition to the built-up areas [26]. Therefore, in addition to NDWI, the MNDWI (Modified Normalized Difference Water Index) index was also used based on the literature; this index will show a more accurate picture of the status of wetlands [27]. MNDWI seemed a more reliable indicator because it could enhance the water surface [28].
Based on the Sentinel-2A dataset, figures were calculated by using different algorisms from pixels compared with the 2020 hand-held category. To visualize the latter, 10 points were selected randomly to each Á-NÉR category, then the algorithms of the points were assigned to the categories. To compare the chosen four indexes’ differences habitat by habitat, we analyzed the data set with multivariate, hierarchical cluster method UPGMA (unweighted paired group average) with Euclidean similarity index, where the clusters of the dendrogram are joined average distance based [29]. Data were analyzed using Microsoft Excel and PAST (PAleontological STatistics) 4.08 software [29], while the design and data processing of the maps, QGIS 3.4.14 ‘Madeira’ software was used.
3. Results
3.1. Introduction of Habitat Map
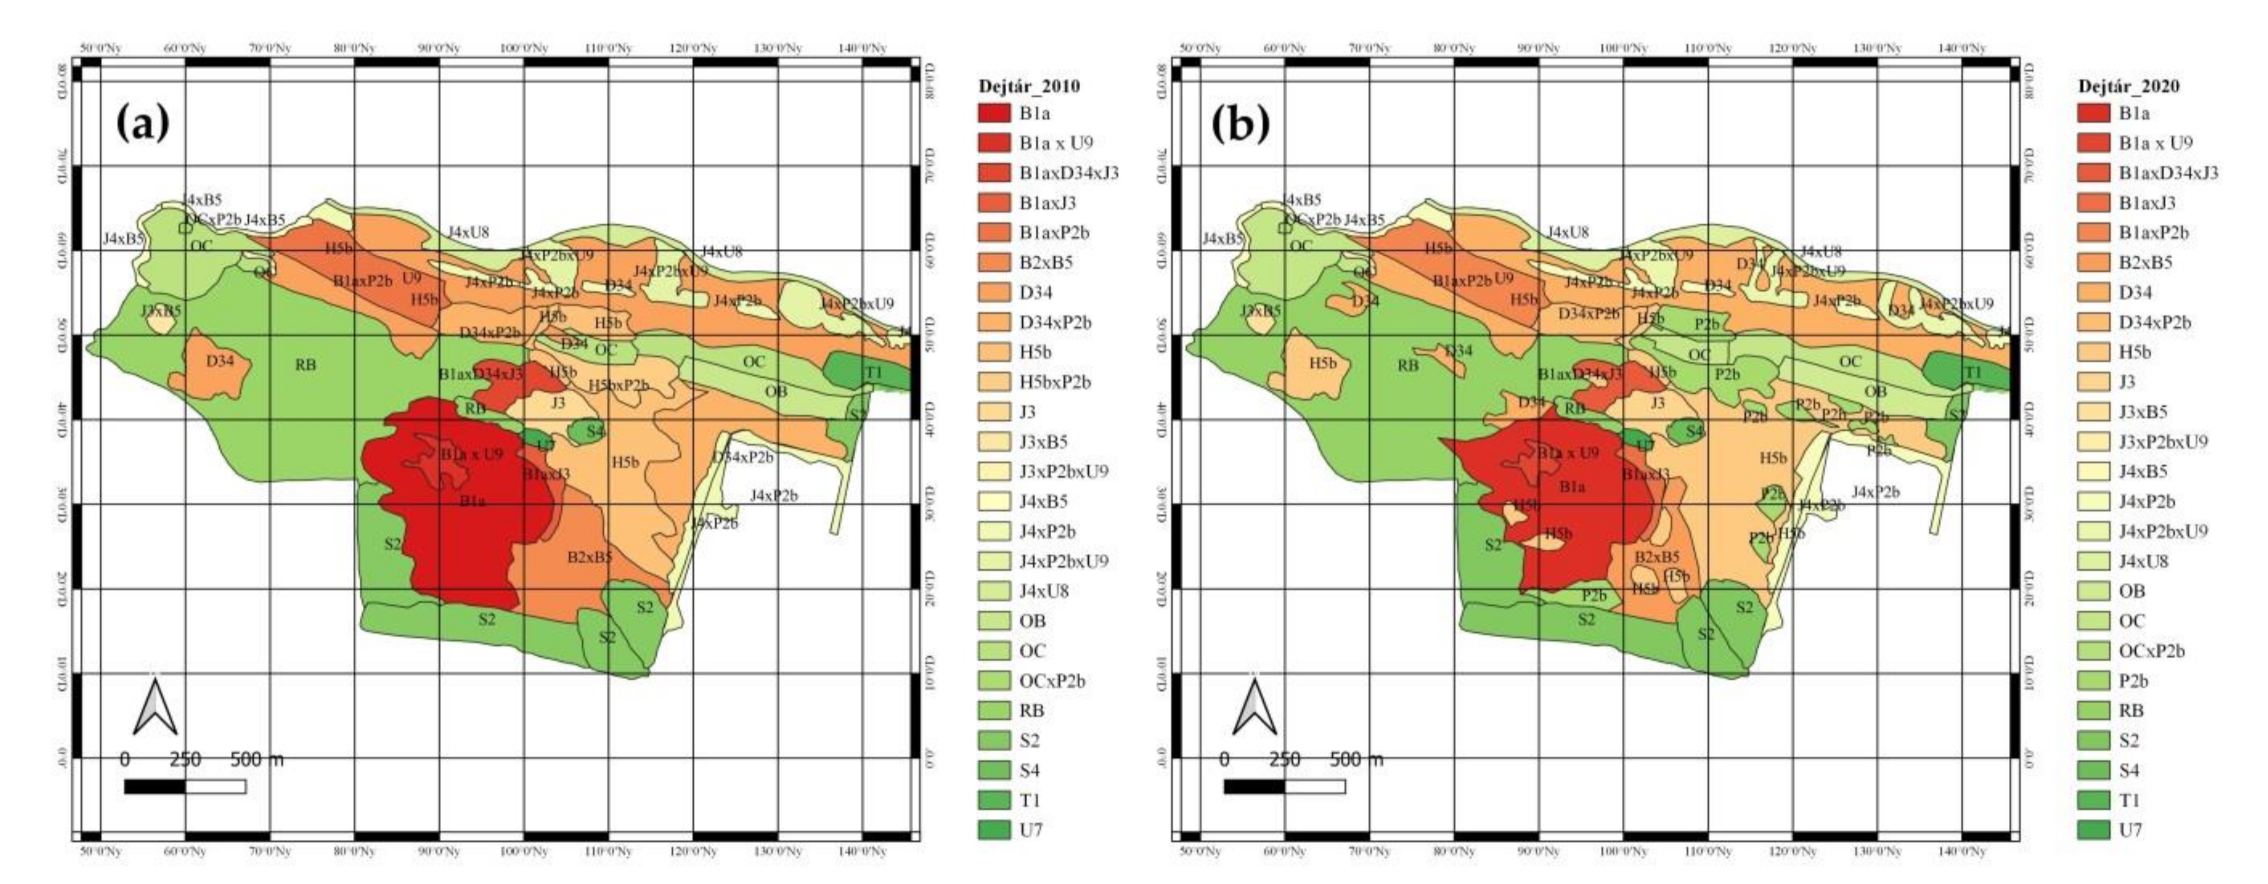
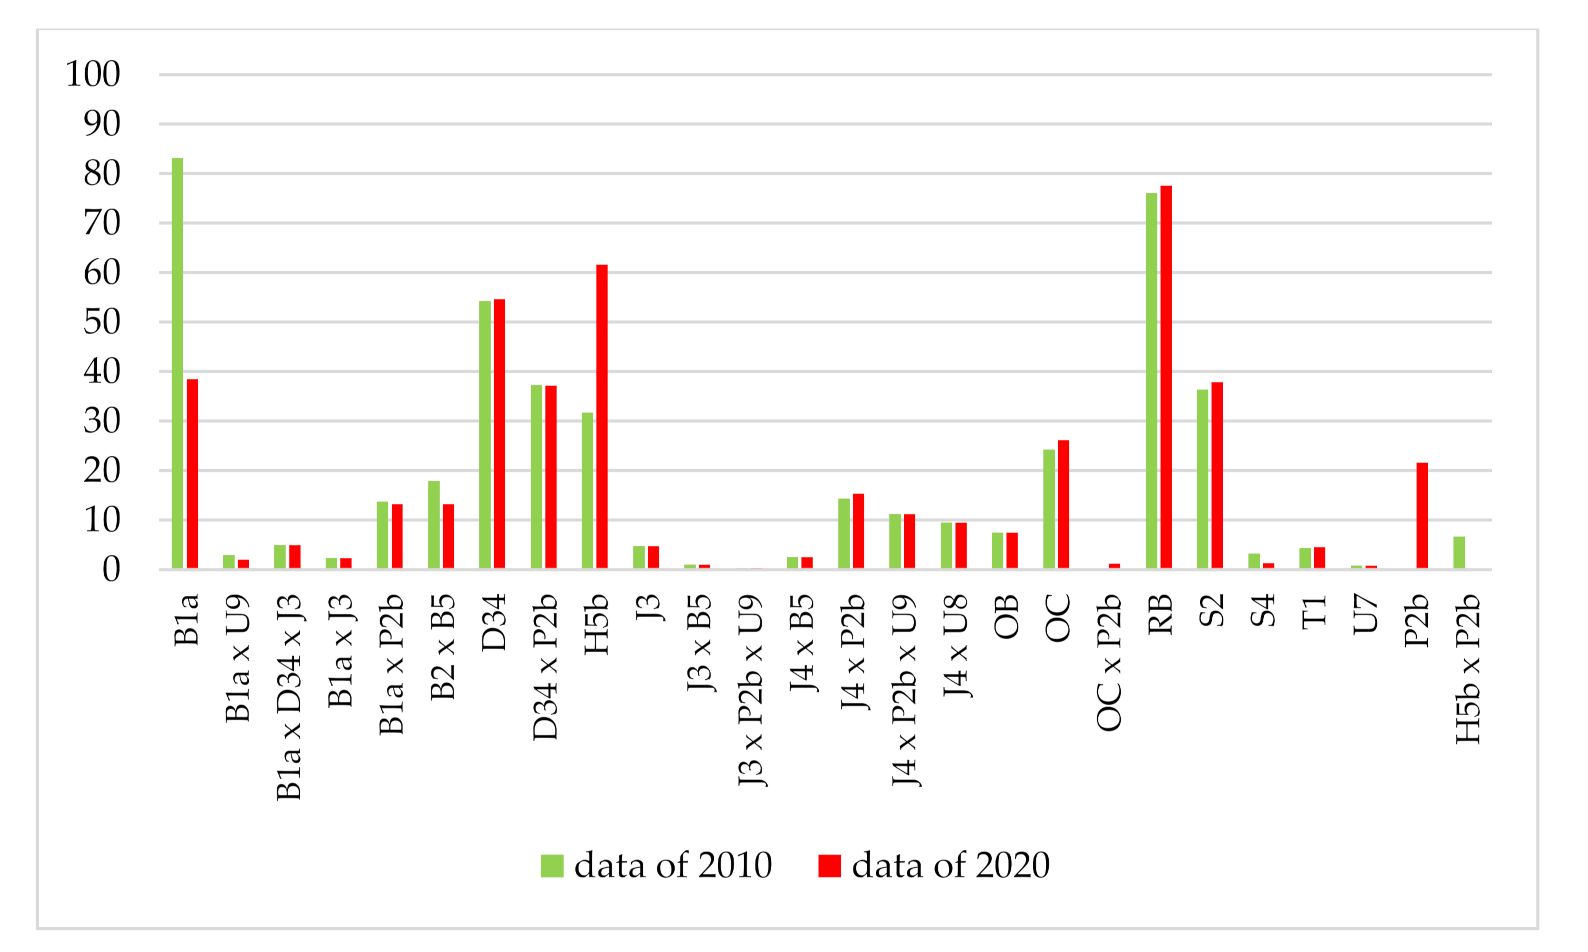
Based on the general system, Á-NÉR 51 habitat plots from 21 habitat types (in 2010) and 80 habitat plots from 19 habitat types (in 2020) were recorded in the research area (Table 2). Maps show clearly that there is a significant difference in the aspect of research area between the two examined periods. Changes were found in the coverage of habitats and in the characteristics of habitat types of certain habitat plots and more fragments were identified. The number and extent of wetlands decreased significantly in 2020. The number of habitat plots in eu- and mesotrophic reed and Typha beds (B1a) habitat category decreased from two areas to one area, while their surface area decreased from 83.16 hectares to 38.55 hectares (Table 2, Figure 2). If we consider the wetlands (B and D habitats and their complexes) as a whole in 2010, the results show they were present on 166.9 hectares of 17 plots in the dry period and on 216.7 hectares of 14 plots in the humid period. We observed in wet patches of the habitat that the species change as well; some indicators of the dry habitats are Achillea collina, Plantago lanceolata, Dactylis glomerata, Agropyron repens, and Festuca arundinacea.
The main difference in habitats between the two maps is that there are two different complexes. On the 2010 map, we can find the H5b × P2b complex, which is noticeably separated by 2020. Therefore, for the year 2020, H5b and P2b were recorded separately. In both years, only seven categories (B1a × D34 × J3, J3, J3 × P2b × U9, J4 × B5, J4 × P2b × U9, J4 × U8 and U7) were presented entirely, thus most of the complexes were transformed. The map made in the wetter year (2010) shows the decreasing trend of the aquatic vegetation in low-lying woodless habitats. A significant change occurred in the closed sand steppes (H5b) and the aspects of their subtypes, too. They went through a total transformation and their presence was lower in 2010 than in 2020. Their area was 70.4 hectares in 2010, then it increased to 145.5 hectares in 2020. According to the maps, the vegetation changed significantly in the compared years, under extremely dry conditions (2020) and in the extremely wet year (2010). The two examined years’ vegetation showed a huge difference, which appropriately indicated the environmental changes. The extension of grassland increased significantly. Areas of closed sand steppes (H5b) increased due to the presence of persistent rainfall shortages, the number of plots extremely increased from 6 (in 2010) to 14 (in 2020). To sum up, it can be observed that the presence of dry habitats increased and several dry fragments were formed within 10 years (Figure 3).
3.2. Introduction of Maps Based on Satellite Images Data
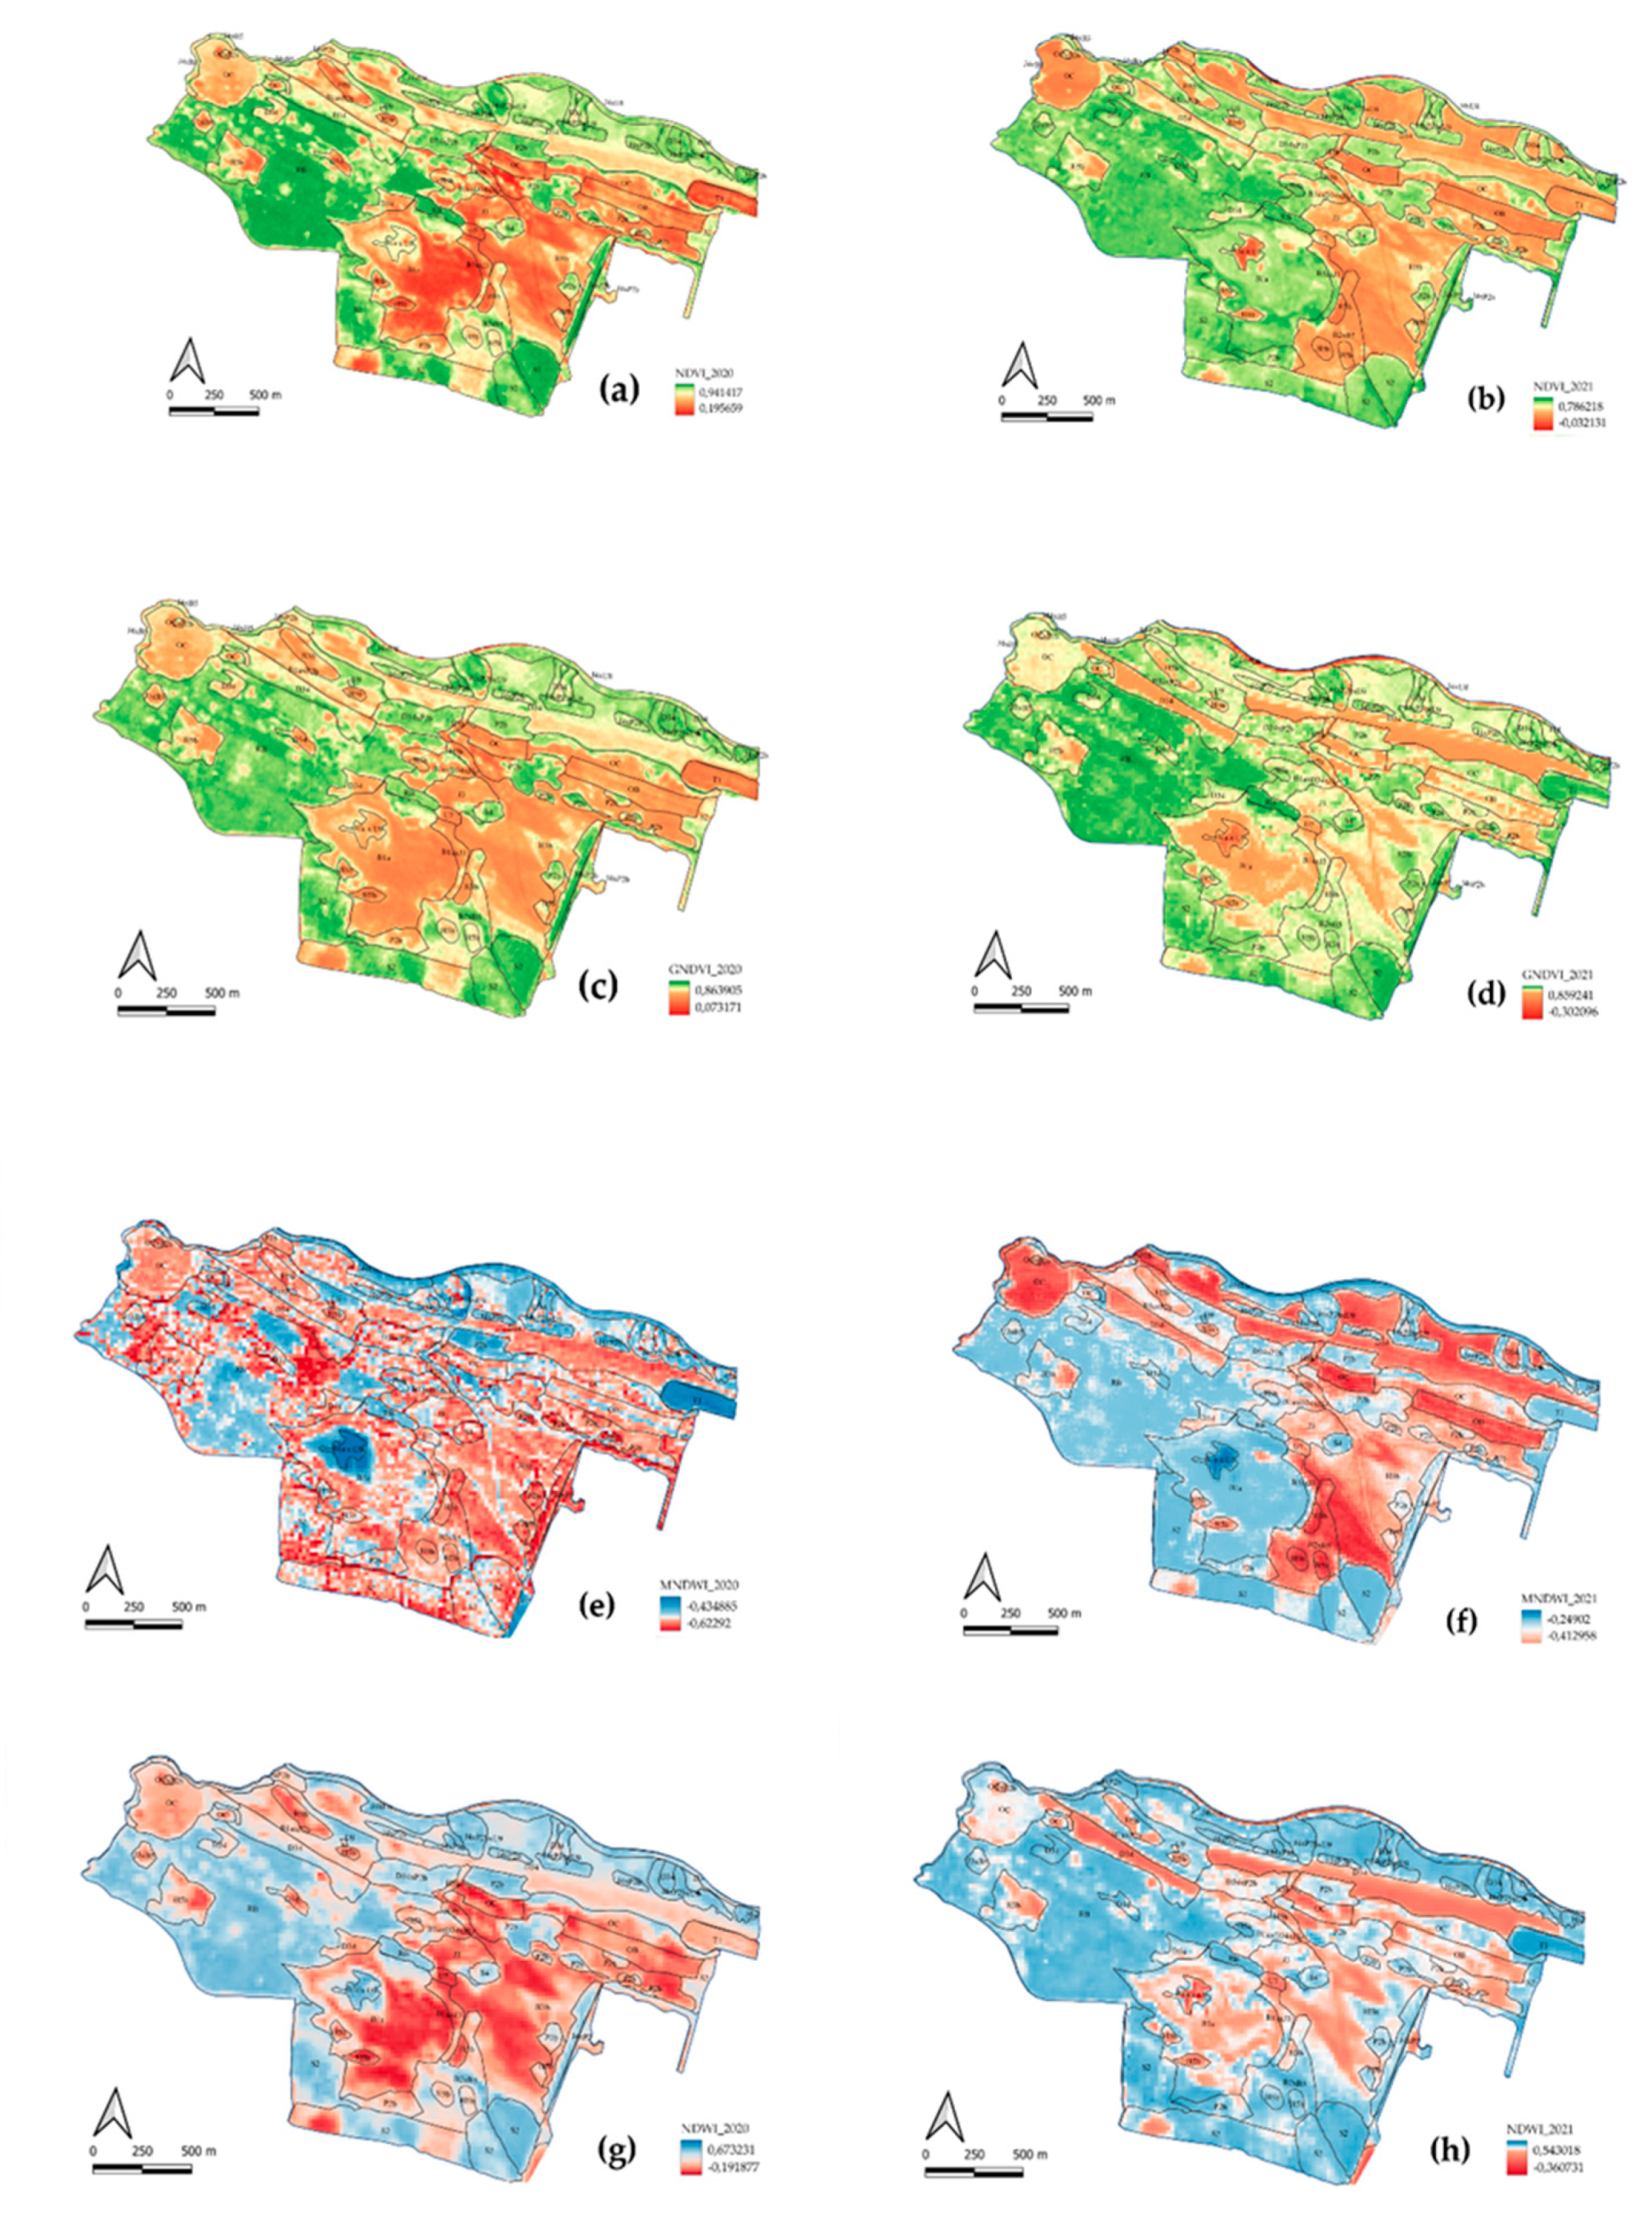
In some cases, it was difficult to make the hand-held field survey due to the field environment. In this case, satellite data can be quite useful as a monitoring method. In the maps, the NDVI and GNDV indices are uniform in color—the lower values are red and the highest values are green. For the NDWI and MNDVI indices, high values are indicated in blue and lower values are indicated in red. Based on the NDVI and GNDVI index data, the water space shows the lowest value due to the low biological activity. The urbanized area showed a lower NDVI (Figure 4) value, for example, the NDVI value of the loess walls (U7). In the other anthropogenic affected areas, the biological activity of annual intensive arable land (T1) was equally low due to the fallow areas. GNDVI (Figure 4) is also well separated in the drier parts of the habitats as the NDVI. Comparing the satellite images from 2020 (Figure 4a) and 2021 (Figure 4e), it can be seen that the eu- and mesotrophic reed and Typha beds (B1a) habitat in a large area in the middle of the map show a higher NDVI value, indicating a more advanced phenological phase of the vegetation due to higher precipitation. Furthermore, the lake and reed (B1a × U9) habitat complex is also strongly red colored in the 2021 image, which is also visible due to higher rainfall. In the case of wetlands, the water has a decisive role, therefore, it is important to examine water indices as well. When compared, the NDVI and NDWI (Figure 4) indices highlight water and dense vegetation, but the NDWI alone is not suitable for detecting water bodies, as several pointed out. The MNDWI (Figure 4) is a better indicator due to enhancing the water surface [28]. In addition, the MNDWI index proved to be the most suitable for detecting anthropogenic phenomena like roads and paths, because the open sandy soil is compacted and does not cover the vegetation, making the water body of the soil even more visible. Comparing the 2020 (Figure 4d) and 2021 (Figure 4h) images, the MNDWI index showed the best difference between the precipitations of the 2 years. In the year 2020, scattered dry spots (red coloring) can be observed in almost all habitats, while in the 2021 image, the higher humidity (blue coloring) is more visible.
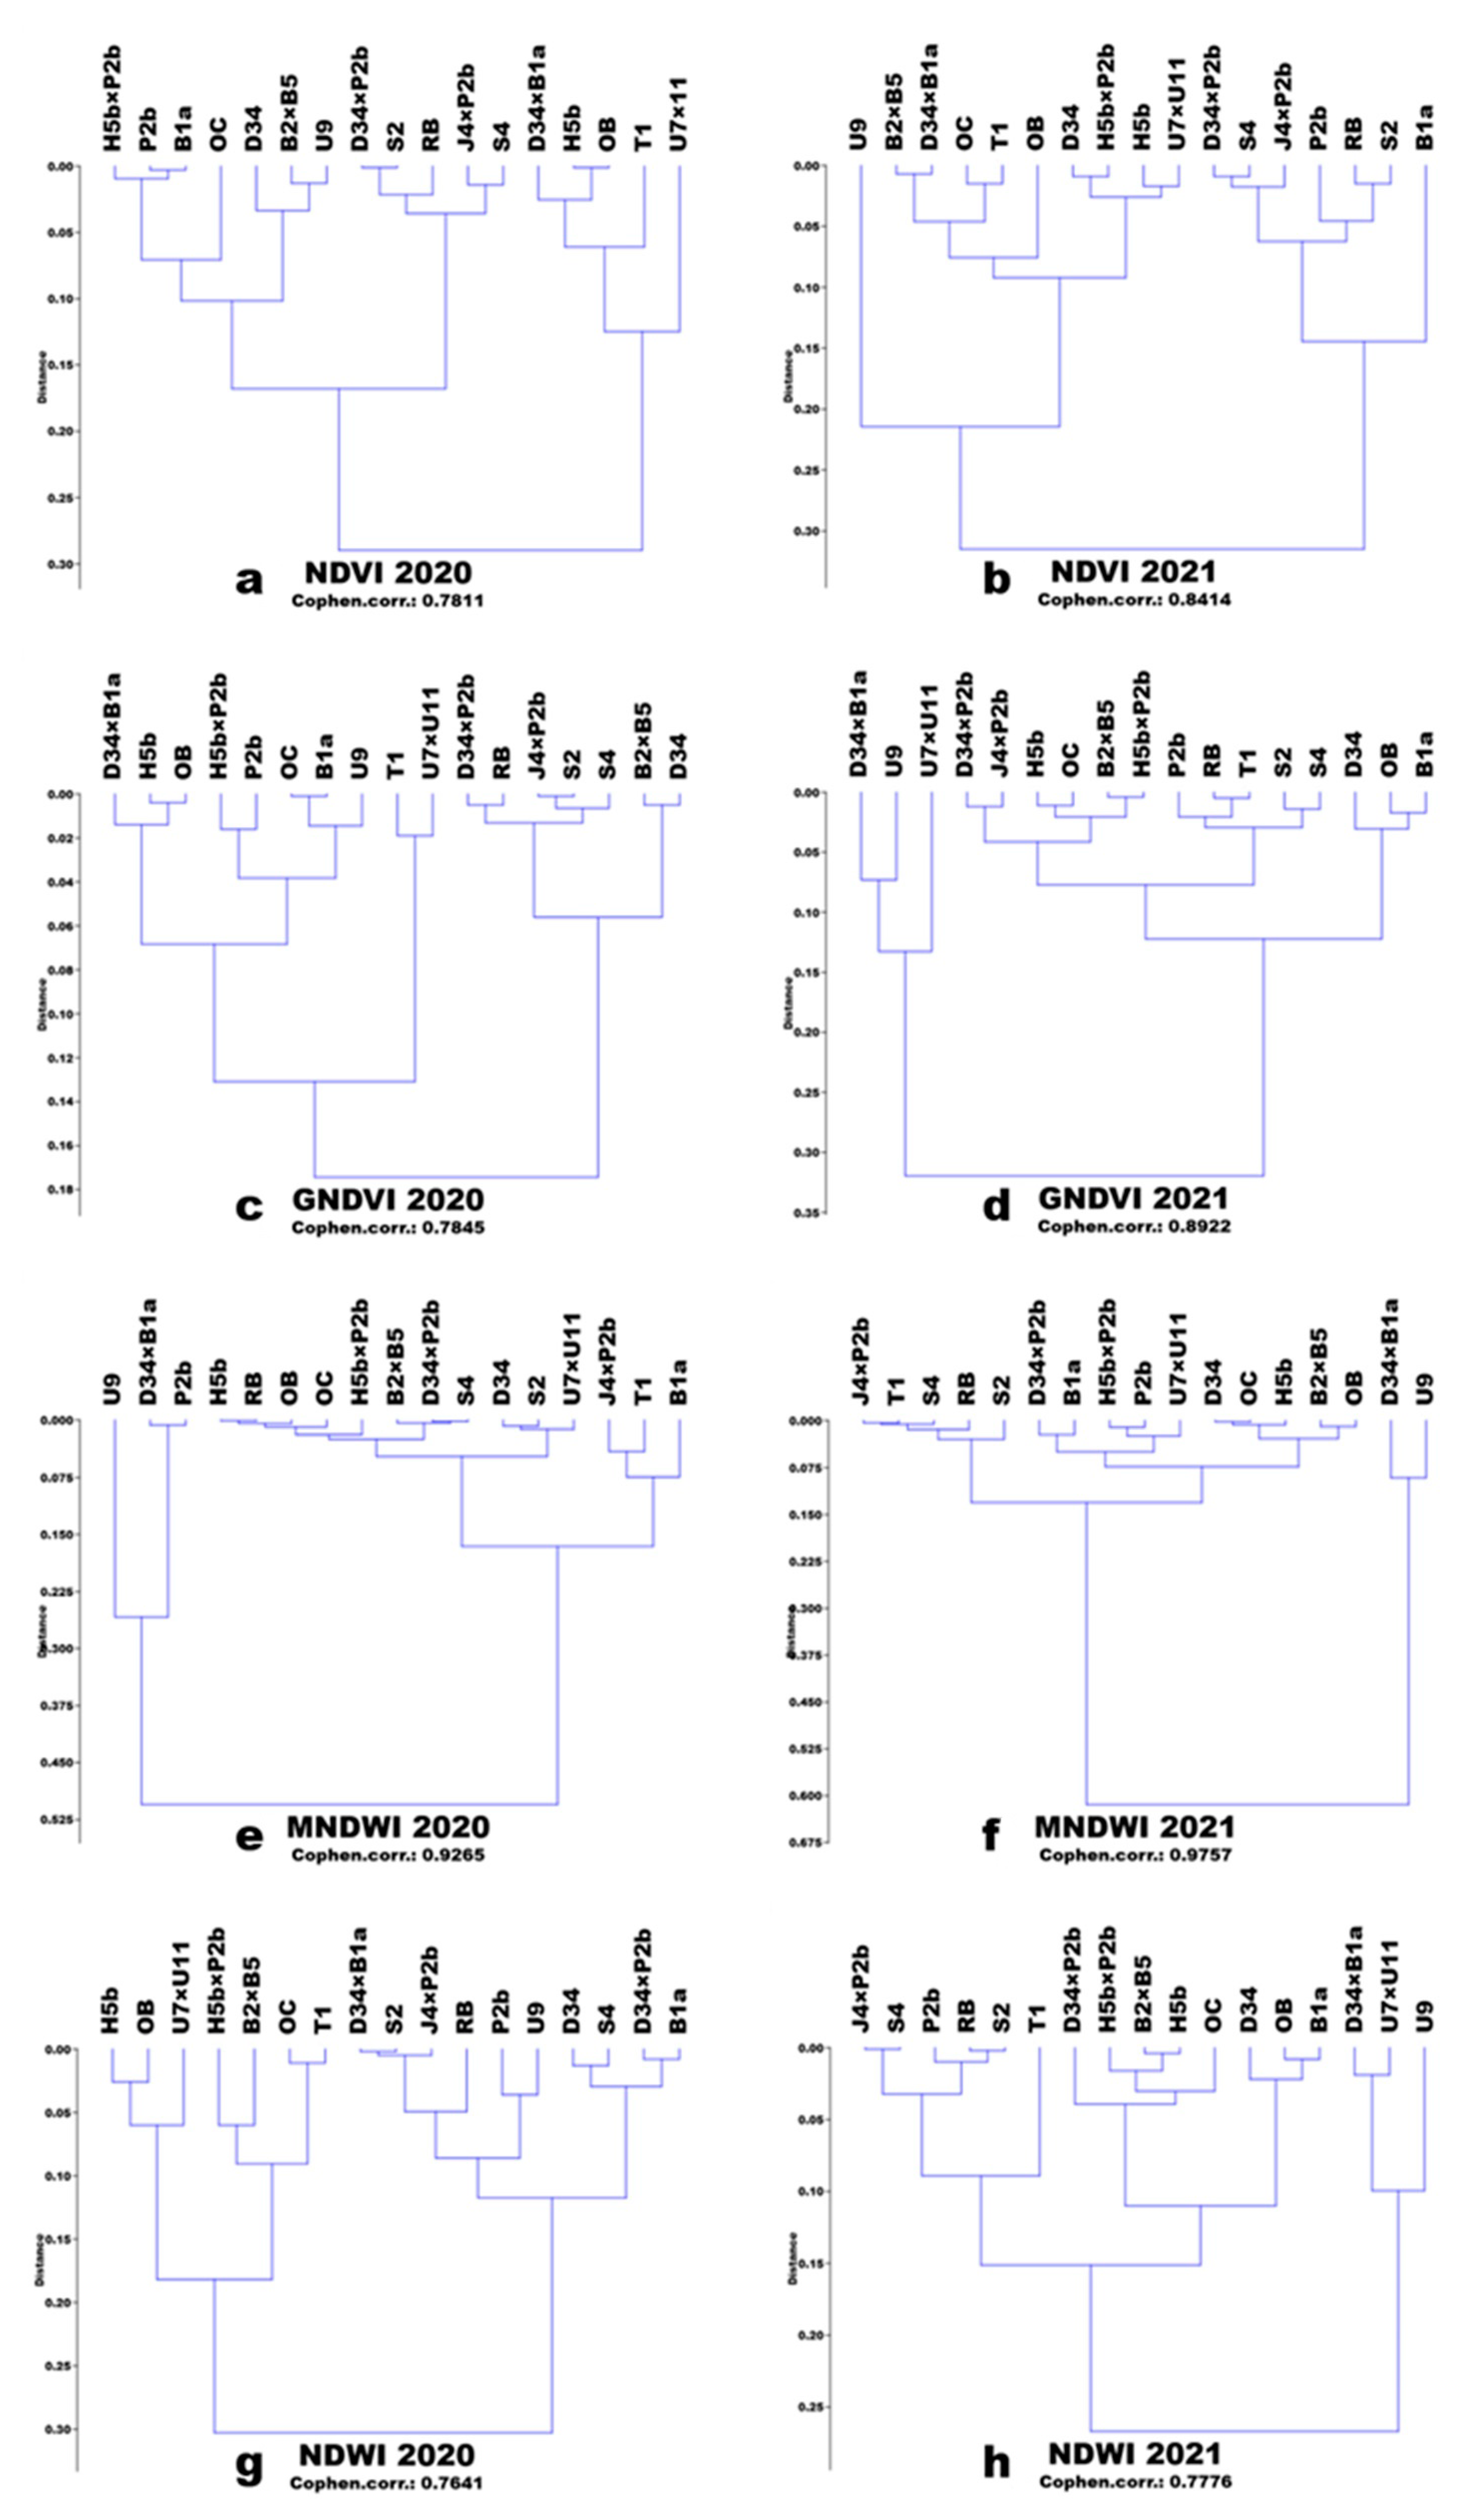
The dendrogram of the hierarchical cluster analysis shows the distribution of different indexes of the Á-NÉR habitat categories in 2020 (Figure 5). NDVI (5a) values present four different groups of the Á-NÉR categories, one of the urbanized and water areas (T1, U9, and U11), forestry areas (RB, S2, and S4), grassland areas (H2b), and more biomass containing grassland areas. Division of groups was similar in the other indexes, but in the case of MNDWI (5d), it separates well the dry grassland categories from the wetland categories [30,31]. Roads of anthropogenic origin are also completely separated using the MNDWI index, which is not observed for the other indices. In the NDVI cluster 2021, it can be seen that the groups with high biological activity (B1a, S4, S2) are completely separated from the habitats covered with low vegetation (U11, U7, H2b). Comparing the data of the NDWI and MNDWI indices for 2020 and 2021, which was also shown in the analysis of the maps, the areas with higher water content are separated from the drier habitats.
4. Discussion
The Carpathian Basin is sometimes characterized by extreme climatic conditions. Observations were made in two key years, one rainy (2010) and one dry (2020). In the maps, (Figure 2) shows clearly that there is a significant difference in the aspect of research area between the two examined periods. Changes were found in the coverage of habitats and in the characteristics of habitat types of certain habitat plots, and more fragments were identified. The number and extent of wetlands decreased significantly in 2020. Based on our study, it can be stated that a change can be observed between habitat maps, mainly with a decrease in wet habitats (B1a) and an increase in dry associations (H2b), which was also seen in the previous study [1]. In the sand steppe habitat (H5b) among dominant species such as Corinophorus canescens (L.) P. B., Jasione montana L., Veronica ssp., however, the dominant species Festuca vaginata W. ET K. did not occur. The dominant taxon in the more closed stands habitat (H2b) was Festuca pseudovina, which also indicates the degradation of the vegetation [14,32]. The occurrence of Festuca rupicola suggests cooler environmental conditions and climatic effects [33]. Complex patches appear in the deeper areas (D34), mostly characteristic of individual Hungarian habitats [1,34,35]; and wet, swampy, marshy, or water-bound vegetation (D34) patches appear in the depressions on-site [36,37,38]. In the wet habitats (D34), in the patches of the habitat that the species change as well, appear some indicators of the dry habitats, such as Achillea collina, Plantago lanceolata, Dactylis glomerata, Agropyron repens, and Festuca arundinacea.
The Sentinel-2A satellite data offer an opportunity for mapping natural habitats [32,39]. As no satellite image was available for the wet year of 2010, we were able to compare precipitation data from different years. We found that 2021 was the wettest year available, and we compared the data for this year to 2020. A dominant taxon of the association may affect the result if the test is performed in a phenological phase when the plant stand dries out or the green surface appears later. Phragmites australis intensively dominates the B1a area where we observed that the earlier satellite recording showed a much lower NDVI value in that area than the later recording. This may be due to the fact that the dried plant parts of Phragmites australis the previous year no longer contain chlorophyll. Based on our study, it can be seen that the individual vegetation patches can be distinguished well based on the Á-NÉR categories, thus the field mapping is facilitated by the data of satellite images in hard-to-reach areas, as others noticed during their work [40].
In contrast, the regularities are clearly outlined in the studied habitats, and the agricultural area shows a homogeneous picture since the harvest of the arable field shows a negative NDVI value [30,31]. Paths formed due to anthropogenic factors can also be detected with the help of satellite data, which has already been examined [33] based on the NDVI index. Of the indices used in our study, MNDWI proved to be the most suitable for detecting roads.
5. Conclusions
The importance of our work is also underlined by the fact that there were no habitat surveys in these areas before 2010. With the help of habitat maps, the direction, quality, and scale of the habitat transformation types could be determined, and the changes could be evaluated with relevant databases. During the intervals of the two mapping times, the changes in the vegetation could be well monitored; the effect of the extreme drought on the vegetation could be detected. By using maps, multidisciplinary research can be conducted on vegetation. A combined study of the mapped area and other features of the area (meteorological, hydrological, and soil) can be used to analyze the causal relationships between environmental features and vegetation. Using data from Sentinel-2A surveys also gives more accurate data of vegetation in hard-to-reach areas. The satellite image shows a more accurate picture of the real location of the associations, which is of great importance for long-term research. In addition, we can get accurate data on the situation of areas (roads and paths) affected by anthropogenic factors. Maps provide important information on land use, management, conservation planning, and the importance of long-term monitoring studies.
Author Contributions
Conceptualization, E.S.-F.; methodology, D.S.; software, I.T.-J.; validation, K.P. and Z.Z.; data curation, I.T.-J.; writing—original draft preparation, I.T.-J.; writing—review and editing, D.S. and R.L.; supervision, G.P.K. and D.S.; project administration, G.P.K. and R.L. All authors have read and agreed to the published version of the manuscript.
Funding
The work was funded by OTKA K-125423, NKFIH-1159-6/2019 and ÚNKP-21-4.
Institutional Review Board Statement
Not applicable.
Informed Consent Statement
Not applicable.
Data Availability Statement
The data presented in this study are available on request from the corresponding author.
Acknowledgments
Our studies received financial support from the Higher Education Institutional Excellence Pro-gram (NKFIH-1159-6/2019) awarded by the Ministry for Innovation and Technology and by OTKA K-125423. Supported by the ÚNKP-21-4 new national excellence program of the ministry for innovation and technology from the source of the national research, development and innovation fund.
Conflicts of Interest
The authors declare no conflict of interest.
References
- Penksza, K.; Nagy, A.; Laborczi, A.; Pintér, B.; Házi, J. Wet habitats along River Ipoly (Hungary) in 2000 (extremely dry) and 2010 (extremely wet). J. Maps 2012, 8, 157–164. [Google Scholar] [CrossRef]
- IPCC Climate Change Mitigation of Climate Change: Contribution of Working Group III to the Fifth Assessment Report of the Intergovernmental Panel; Cambridge University Press, 2014; p. 1132. Available online: https://www.ipcc.ch/report/ar5/wg2/ (accessed on 6 February 2022).
- Bartholy, J.; Pongracz, R. Regional analysis of extreme temperature and precipitation indices for the Carpathian Basin from 1946 to 2001. Glob. Planet. Chang. 2007, 57, 83–95. [Google Scholar] [CrossRef]
- Bartholy, J.; Pongracz, R.; Pieczka, I. How the climate will change in this century? Hung. Geogr. Bull. 2014, 63, 55–67. [Google Scholar] [CrossRef] [Green Version]
- Čížková-Končalová, H.; Květ, J.; Comín, F.; Laiho, R.; Pokorný, J.; Pithart, D. Actual state of European wetlands and their possible future in the context of global climate change. Aquat. Sci. 2013, 75, 1–24. [Google Scholar] [CrossRef] [Green Version]
- Capon, S.J.; Chambers, L.E.; Nally, R.M.; Naiman, R.J.; Davies, P.; Marshall, N.; Pittock, J.; Reid, M.; Capon, T.; Douglas, M.; et al. Riparian ecosystems in the 21st century: Hotspots for climate change adaptation. Ecosystems 2013, 16, 359–381. [Google Scholar] [CrossRef]
- Schmotzer, A. Mapping of Invasive Alien Plants along the Common Middle Section of the Ipoly River (Hungary/Slovakia): Methodology, Management, Evaluation. In Proceedings of the Habitat Monitoring for Nature Conservation—Lessons from Applications for Future Concepts, International Conference HABMON, Program and Abstracts, Freiburg, Germany, 1–3 December 2014; p. 25. [Google Scholar]
- Mosner, E.; Weber, A.; Carambia, M.; Nilson, E.; Schmitz, U.; Zelle, B.; Donath, T.; Horchler, P. Climate change and floodplain vegetation—future prospects for riparian habitat availability along the Rhine River. Ecol. Eng. 2015, 82, 493–511. [Google Scholar] [CrossRef]
- Hungarian Meteorological Service—Weather Forecasting and Climate Department—Climate Analysis Division. 2020. (In Hungarian). Available online: https://www.met.hu/omsz/OMSZ_hirek/index.php?id=2961 (accessed on 6 February 2022).
- Bartholy, J.; Pongracz, R. Tendencies of extreme climate indicates based on daily precipitation in the Carpathian Basin for the 20th century. Időjárás 2005, 109, 1–20. [Google Scholar]
- Bartholy, J.; Pongracz, R. Comparing tendencies of some temperature and precipitation on global and regional scales. Időjárás 2006, 110, 35–48. [Google Scholar]
- Hungarian Meteorological Service. Weather Forecasting and Climate Department—Climate Analysis Division; Hungarian Meteorological Service: Budapest, Hungary, 2011. (In Hungarian) [Google Scholar]
- Simon, T. A Magyarországi Edényes Flóra Határozója. Harasztok-Virágos Növények; Tankönyvkiadó: Budapest, Hungary, 2000. [Google Scholar]
- Borhidi, A. Magyarország Növénytársulásai; Akadémiai Kiadó: Budapest, Hungary, 2003. [Google Scholar]
- Mjazovszky, Á.; Csontos, P.; Tamás, J. Vegetation studies along streams in four regions of Hungary (In Hungarian). Bot. Közlemények 2007, 94, 45–55. [Google Scholar]
- Verrasztó, Z. Environmental monitoring studies on the watershed of the Ipoly river (Objectives and general information) (In Hungarian). Tájökológiai Lapok 2010, 8, 535–561. [Google Scholar]
- Nagy, G.; Déri, E.; Lengyel, S. Irányelvek a Pannon Száraz Lösz—és Szikespuszta Gyepek Rekonstrukciójához és Természetvédelmi Szempontú Kezeléséhez; Hortobágyi Nemzeti Park Igazgatóság: Debrecen, Hungary, 2008; p. 57. [Google Scholar]
- Fodor, I.; Gálosi-Kovács, B. A Kárpát-medence határokon átnyúló természeti értékei. In A Környezet és a Határok Kutatója. Tiszteletkötet Nagy Imre 65. Születésnapja Alkalmából; Gál, Z., Ricz, A., Eds.; Regional Scientific Society: Subotica, Serbia, 2019; pp. 39–51. Available online: http://hdl.handle.net/11155/22019 (accessed on 6 February 2022).
- Brow, A.G.; Lespez, L.; Sear, D.A.; Macaire, J.; Houben, P.; Klimek, K.; Brazier, R.E.; Van Oost, K.; Pears, B. Natural vs. anthropogenic streams in Europe: History, ecology and implications for restoration, river-rewilding and riverine ecosystem services. Earth-Sci. Rev. 2018, 180, 185–205. [Google Scholar] [CrossRef]
- Fekete, G.; Molnár, Z.; Horváth, F. A Magyarországi Élőhelyek Leírása, Határozója és a Nemzeti Élőhely-Osztályozási Rendszer. Nemzeti Biodiverzitás-Monitorozó Rendszer II; MTM: Budapest, Hungary, 1997. [Google Scholar]
- Sentinel-2A Website. Available online: https://scihub.copernicus.eu/ (accessed on 15 October 2017).
- Drusch, M.; Del Bello, U.; Carlier, S.; Colin, O.; Fernandez, V.; Gascon, F.; Hoersch, B.; Isola, C.; Laberinti, P.; Martimort, P.; et al. Sentinel-2: ESA’s Optical High-Resolution Mission for GMES Operational Services. Remote Sens. Environ. 2012, 120, 25–36. [Google Scholar] [CrossRef]
- Kaplan, G. Mapping and Monitoring Wetlands Using Sentinel 2 Satellite Imagery. ISPRS Ann. Photogramm. Remote Sens. Spat. Inf. Sci. 2017, IV-4/W4, 271–277. Available online: https://pdfs.semanticscholar.org/a101/515a9d639c896364cec0b589172af3649717.pdf (accessed on 15 October 2017). [CrossRef] [Green Version]
- Gobron, N.; Pinty, B.; Verstraete, M.; Widlowski, J. Advanced Vegetation Indices Optimized for Up-Coming Sensors: Design, Performance and Applications. IEEE Trans. Geosci. Remote Sens. 2000, 38, 2489–2505. [Google Scholar]
- Gitelson, A.; Merzlyak, M. Remote Sensing of Chlorophyll Concentration in Higher Plant Leaves. Adv. Space Res. 1998, 22, 689–692. [Google Scholar] [CrossRef]
- Gao, B.-C. NDWI—A normalized difference water index for remote sensing of vegetation liquid water from space. Remote Sens. Environ. 1996, 58, 257–266. [Google Scholar] [CrossRef]
- Xu, H. Modification of Normalised Difference Water Index (NDWI) to Enhance Open Water Features in Remotely Sensed Imagery. Int. J. Remote Sens. 2006, 27, 3025–3033. [Google Scholar] [CrossRef]
- Szabó, S.; Gácsi, Z.; Balázs, B. Specific features of NDVI, NDWI and MNDWI as reflected in land cover categories. Landsc. Environ. 2016, 10, 194–202. [Google Scholar] [CrossRef]
- Hammer, Ø. PAST–PAleontological STatictics Version 4.07 Reference Manual; Natural History Museum–University of Oslo: Oslo, Norway, 2021; p. 293. [Google Scholar]
- Du, Y.; Zhang, Y.; Ling, F.; Wang, Q.; Li, W.; Li, X. Water Bodies’ Mapping from Sentinel-2 Imagery with Modified Normalized Difference Water Index at 10-m Spatial Resolution Produced by Sharpening the SWIR Band. Remote Sens. 2016, 8, 354. [Google Scholar] [CrossRef] [Green Version]
- Bekkema, M.E.; Eleveld, M. Mapping Grassland Management Intensity Using Sentinel-2 Satellite Data. GI_Forum 2018, 1, 194–213. [Google Scholar] [CrossRef]
- Bátori, Z.; Farkas, T.; Erdős, L.; Tölgyesi, C.; Körmöczi, L.; Vojtkó, A. A comparison of the vegetation of forested and non-forested solution dolines in Hungary: A preliminary study. Biologia 2014, 69, 1339–1348. [Google Scholar] [CrossRef]
- Belenok, V.; Noszczyk, T.; Hebryn-Baidy, L.; Kryachok, S. Investigating anthropogenically transformed landscapes with remote sensing. Remote Sens. Appl. Soc. Environ. 2021, 24, 100635. [Google Scholar] [CrossRef]
- Borhidi, A. Social behaviour types, the naturalness and relative ecological indicator values of the higher plants in the Hungarian flora. Acta Bot. Acad. Sci. Hung. 1995, 39, 97–181. [Google Scholar]
- Pongrácz, R.; Bartholy, J.; Szabó, P.; Gelybó, G. A comparison of observed trends and simulated changes in extreme climate indices in the Carpathian Basin by the end of this century. Int. J. Glob. Warm. 2009, 1, 336–355. [Google Scholar] [CrossRef]
- Malatinszky, Á.; Ádám, S.; Falusi, E.; Saláta, D.; Penksza, K. Climate change related land user problems in protected wetlands: A study in a seriously affected Hungarian area. Clim. Chang. 2013, 118, 671–683. [Google Scholar] [CrossRef]
- Uj, B.; Nagy, A.; Saláta, D.; Laborczi, A.; Malatinszky, A.; Bakó, G.; Danyik, T.; Tóth, A.; -Falusi, E.S.; Gyuricza, C.; et al. Habitat map of Kis-Sárrét (Körös-Maros National Park, Hungary) with special regard to the changes of wetlands. J. Maps 2015, 10, 211–221. [Google Scholar] [CrossRef]
- Courtwright, J.; Findlay, S.E.G. Effects of microtopography on hydrology, physicochemistry, and vegetation in a tidal swamp of the Hudson River. Wetlands 2011, 31, 239–249. [Google Scholar] [CrossRef]
- Majasalmi, T.; Rautiainen, M. The potential of Sentinel-2 data for estimating biophysical variables in a boreal forest: A simulation study. Remote Sens. Lett. 2016, 7, 427–436. [Google Scholar] [CrossRef]
- Burai, P.; Lenart, C.; Valkó, O.; Bekő, L.; Szabó, Z.; Deák, B. Vegetation mapping in an alkali landscape—application of airborne hyperspectral data. Tájökológiai Lapok 2016, 14, 1–12. (In Hungarian) [Google Scholar]
Figure 1.
Meteorological data based on NMS (precipitation (mm) in the 30 days before the vegetation survey.
Figure 1.
Meteorological data based on NMS (precipitation (mm) in the 30 days before the vegetation survey.

Figure 2.
Habitat maps of Dejtár area in 2010 (a) and 2020 (b).

Figure 3.
Habitat cover (hectares) of Dejtár area in 2010 and 2020.

Figure 4.
2020 and 2021 habitat map with coloring based on the selected values—(a) NDVI_2020, (b) GNDVI_2020, (c) NDWI_2020, (d) MNDWI_2020, (e) NDVI_2021, (f) GNDVI_2021, (g) NDWI_2021, and (h) MNDWI_2021.
Figure 4.
2020 and 2021 habitat map with coloring based on the selected values—(a) NDVI_2020, (b) GNDVI_2020, (c) NDWI_2020, (d) MNDWI_2020, (e) NDVI_2021, (f) GNDVI_2021, (g) NDWI_2021, and (h) MNDWI_2021.

Figure 5.
UPGMA cluster analysis of vegetation indexes—(a) NDVI_2020, (b) NDVI_2021 (c) GNDVI_2020, (d) GNDVI_2021, (e) MNDWI_2020, (f) MNDWI_2021, (g) NDWI_2020, and (h) NDWI_2021.
Figure 5.
UPGMA cluster analysis of vegetation indexes—(a) NDVI_2020, (b) NDVI_2021 (c) GNDVI_2020, (d) GNDVI_2021, (e) MNDWI_2020, (f) MNDWI_2021, (g) NDWI_2020, and (h) NDWI_2021.


Table 1.
Habitats revealed in the study area, using the categories of the Hungarian Habitat Classification System (ÁNÉR).
Table 1.
Habitats revealed in the study area, using the categories of the Hungarian Habitat Classification System (ÁNÉR).
| ÁNÉR Categories | Description |
|---|---|
| B1a | Eu- and mesotrophic reed and Typha beds |
| B5 | Non-tussock tall-sedge beds |
| D34 | Mesotrophic wet meadows |
| H5b | Closed sand steppes |
| P2b | Dry and semi-dry pioneer scrub |
| P2a | Wet and mesic pioneer scrub |
| J3 | Riverine willow scrub |
| J4 | Riverine willow-poplar woodlands |
| OB | Uncharacteristic mesic grasslands |
| OC | Uncharacteristic dry and semi-dry grasslands |
| P2b | Dry and semi-dry pioneer scrub |
| RB | Uncharacteristic or pioneer softwood forests |
| S2 | Populus × euramericana plantations |
| S4 | Scots and black pine plantations |
| T1 | Annual intensive arable fields |
| U8 | Water streams |
| U7 | Sand, gravel, clay and peat mines, loess walls |
| U9 | Standing waters |
| U11 | Roads and railroads |
Table 2.
Data of the areas of different years (2010 and 2020) of the habitat maps.
| (a) Mapping Data of 2010 | (b) Mapping Data of 2020 | ||||||
|---|---|---|---|---|---|---|---|
| Number | Type of Habitats | Number of Plots (Pieces) | Area (Hectares) | Number | Type of Habitats | Number of Plots (Pieces) | Area (Hectares) |
| 1. | B1a | 2 | 83.16 | 1. | B1a | 1 | 38.55 |
| 2. | B1a × U9 | 1 | 2.97 | 2. | B1a × U9 | 1 | 2.04 |
| 3. | B1a × D34 × J3 | 1 | 5.04 | 3. | B1a × D34 × J3 | 1 | 5.04 |
| 4. | B1a × J3 | 1 | 2.34 | 4. | B1a × J3 | 1 | 2.36 |
| 5. | B1a × P2b | 1 | 13.75 | 5. | B1a × P2b | 1 | 13.25 |
| 6. | B2 × B5 | 1 | 17.91 | 6. | B2 × B5 | 1 | 13.30 |
| 7. | D34 | 4 | 54.26 | 7. | D34 | 8 | 56.68 |
| 8. | D34 × P2b | 3 | 37.28 | 8. | D34 × P2b | 3 | 37.19 |
| 9. | H5b | 6 | 31.72 | 9. | H5b | 14 | 61.70 |
| 10. | H5b × P2b | 1 | 6.70 | 10. | J3 | 1 | 4.80 |
| 11. | J3 | 1 | 4.80 | 11. | J3 × B5 | 1 | 1.04 |
| 12. | J3 × B5 | 1 | 1.04 | 12. | J3 × P2b × U9 | 1 | 0.37 |
| 13. | J3 × P2b × U9 | 1 | 0.37 | 13. | J4 × B5 | 3 | 2.54 |
| 14. | J4 × B5 | 3 | 2.54 | 14. | J4 × P2b | 9 | 15.41 |
| 15. | J4 × P2b | 9 | 14.34 | 15. | J4 × P2b × U9 | 3 | 11.22 |
| 16. | J4 × P2b × U9 | 3 | 11.22 | 16. | J4 × U8 | 2 | 9.58 |
| 17. | J4 × U8 | 2 | 9.58 | 17. | OB | 1 | 9.56 |
| 18. | OB | 1 | 7.55 | 18. | OC | 4 | 26.24 |
| 19. | OC | 4 | 24.23 | 19. | OC × P2b | 1 | 1.21 |
| 20. | OC × P2b | 1 | 0.21 | 20. | P2b | 11 | 21.70 |
| 21. | RB | 2 | 76.11 | 21. | RB | 2 | 77.66 |
| 22. | S2 | 5 | 36.40 | 22. | S2 | 5 | 37.90 |
| 23. | S4 | 2 | 3.31 | 23. | S4 | 1 | 1.31 |
| 24. | T1 | 1 | 4.40 | 24. | T1 | 1 | 4.60 |
| 25. | U7 | 1 | 0.82 | 25. | U7 | 1 | 0.82 |
| Total | 58 | 452.03 | Total | 78 | 452.03 | ||
Publisher’s Note: MDPI stays neutral with regard to jurisdictional claims in published maps and institutional affiliations. |
© 2022 by the authors. Licensee MDPI, Basel, Switzerland. This article is an open access article distributed under the terms and conditions of the Creative Commons Attribution (CC BY) license (https://creativecommons.org/licenses/by/4.0/).
Share and Cite
MDPI and ACS Style
T.-Járdi, I.; Saláta, D.; S.-Falusi, E.; Kovács, G.P.; Láposi, R.; Zachar, Z.; Penksza, K. Habitat Changes along Ipoly River Valley (Hungary) in Extreme Wet and Dry Years. Water 2022, 14, 787. https://doi.org/10.3390/w14050787
AMA Style
T.-Járdi I, Saláta D, S.-Falusi E, Kovács GP, Láposi R, Zachar Z, Penksza K. Habitat Changes along Ipoly River Valley (Hungary) in Extreme Wet and Dry Years. Water. 2022; 14(5):787. https://doi.org/10.3390/w14050787
Chicago/Turabian StyleT.-Járdi, Ildikó, Dénes Saláta, Eszter S.-Falusi, Gergő Péter Kovács, Réka Láposi, Zalán Zachar, and Károly Penksza. 2022. "Habitat Changes along Ipoly River Valley (Hungary) in Extreme Wet and Dry Years" Water 14, no. 5: 787. https://doi.org/10.3390/w14050787
Note that from the first issue of 2016, this journal uses article numbers instead of page numbers. See further details here.