
Development of Methods for Diagnosing the Operating Conditions of Water Supply Networks over the Last Two Decades


Institute of Environmental Engineering, Wroclaw University of Environmental and Life Sciences, Grunwaldzki Sq. 24, 50-363 Wroclaw, Poland
*
Author to whom correspondence should be addressed.
Water 2022, 14(5), 786; https://doi.org/10.3390/w14050786
Submission received: 26 January 2022
/
Revised: 28 February 2022
/
Accepted: 28 February 2022
/
Published: 2 March 2022
(This article belongs to the Section Urban Water Management)
Abstract
:The need for water supply companies to exercise control over the operating conditions of water supply networks has contributed to the development of a number of methods for their diagnosis. The diagnostics of technical infrastructure is a constantly developing field, and therefore, over the years, we have observed the development of various methods of diagnosing network operating conditions and their classification. The article presents, in a synthetic way, the division and review of the previously used methods of diagnosing the operating conditions of water supply networks. The authors also classified and assessed the usefulness of the methods of diagnosis in specific operating conditions. The review carried out by the authors shows that there is a need for research on the detection of operating conditions of water supply networks under the operating conditions of real systems. The results of our deep analysis allow for the understanding of the most important areas of research, as well as the existing worldwide trends in the development of methods for leak diagnosis and detection in water distribution networks. This review is a compendium of knowledge on the detection and diagnosis of water supply networks.
1. Introduction
The conditions of water distribution systems depend on many deterministic and random factors [1]. Due to the complexity of the processes affecting the achieved values of the operating condition parameters of the water supply network, their diagnosis is a multi-faceted issue. Moreover, the cyclicity observed in the time series of flow rate and pressure makes these data non-stationary [2]. The need to solve problems concerning the accurate assessment of the state of operation of water supply infrastructure has contributed to the development of a number of diagnostic methods. In order to speak unambiguously about the conditions of water supply network operations, the issue should not be considered only in the category of typical emergency situations [3]. Addressing the problem in a comprehensive way, that is, analysis of the shape of the parameters of the network operating conditions (flow rate or pressure) during abnormal water intake (public holidays, game break, New Year’s Eve, vacation season), and under specific operating conditions of pressure management, forced the development of appropriate methods and mathematical procedures [4]. To be able to unequivocally determine the operating conditions of a water supply network, it must be considered both technically and operationally. Technical condition assessment employs, among other things, risk analysis to reduce the level of threats to the operation of a technical system or enterprise [5]. Risk is understood as the likelihood of the occurrence of events that generate economic, technical, or environmental hazards or contribute to material, social, or environmental losses. The operational condition of a system, object, or technical device is a momentary phase of exploitation, which is described by the results of measurements of physical quantities that characterize the operational features of the system or its individual components. It should be noted that in technical systems, in a given moment, there are many operating conditions within individual devices and objects, and in the case of linear systems, such as water supply networks, they are also within different points of water supply systems. Water supply networks are subject to measurements of flow and pressure at various control points, water consumption by consumers and selected indications of water quality. Parameters of water supply network conditions are defined as a set or elements of a set of measurements of the water volume flow rate or pressure at the analyzed point. Most contemporary scientific studies place the greatest emphasis on diagnosing the operating conditions of a water supply network but mainly in the context of its failure rate and potential water leakage [6], while they are less related to the detection of abnormal conditions related to its operation. Such situations may also include the outbreak of the COVID-19 pandemic, as studies indicate a significant increase in residential water use following the introduction of government restrictions [7]. The random nature of water consumption, and the hydraulic parameters achieved as a result, presents a serious barrier to assessing whether or not the operating condition of a network can be considered relatively normal.
In order to be able to speak unambiguously about the state of operation of the water supply network, this issue should be treated in a comprehensive manner. Due to parameters constantly changing in water supply systems (roughness coefficients of pipes, water levels in reservoirs, and water demand), the assessment of their operating conditions is a complicated and multi-criteria task. The need to solve the above-described problems concerning the assessment of the operating conditions of water supply infrastructure has contributed to the development of a number of diagnostic methods. For the first time, most of these methods were applied to gas and oil pipelines, mainly for safety reasons and awareness of the toxicity of the transmitted medium and the consequences that failures can bring. Although this aspect also applies to other linear infrastructure, it is in the case of water supply systems that the greatest number of deterministic and random factors can be observed that influence the complex character of phenomena occurring inside the pipes.
This paper presents a synthetic overview and a breakdown of methods for the detection of water supply network operating conditions, for which a growing interest has been observed in the last two decades. Due to the methodology based on different parameters of water network operating conditions and the diversity in implementation possibilities, the authors’ classification is proposed. The aim of this study was not only to systematize the existing knowledge on the methods used for the detection of operating conditions of water distribution systems but also to analyze the range of possibilities of implementation of particular methods in selected operating conditions of water supply networks. The gathered knowledge, presented as a review of selected studies and experiences from over 20 years, is a source of information on the detection of operating conditions of water supply networks, which can be useful not only for the scientific community but also for the managers and operators of water supply networks.
2. Materials and Methods
With the rapid increase in the volume and diversity of research and the availability of metadata about research from different literature databases, existing worldwide trends in the development of methods for leak diagnosis and detection in water distribution networks have been examined. Scopus was one database selected for this study since it is the largest database of peer-reviewed documents delivering a comprehensive overview of the world’s research output in the fields of engineering. Scopus is the largest abstract and citation database of peer-reviewed literature, including scientific journals (over 22,000 of them), books, and conference proceedings. Another database used for the review was Web of Science (Web of Knowledge) maintained by Clarivate Analytics. This database covers more than 8500 notable journals encompassing 150 disciplines. This paper describes the results of the analysis of the almost 80 documents found and selected from almost 300, which were read at the stage of preliminary research. The database of publications finally selected for the article includes works published from 1992 through 2021.
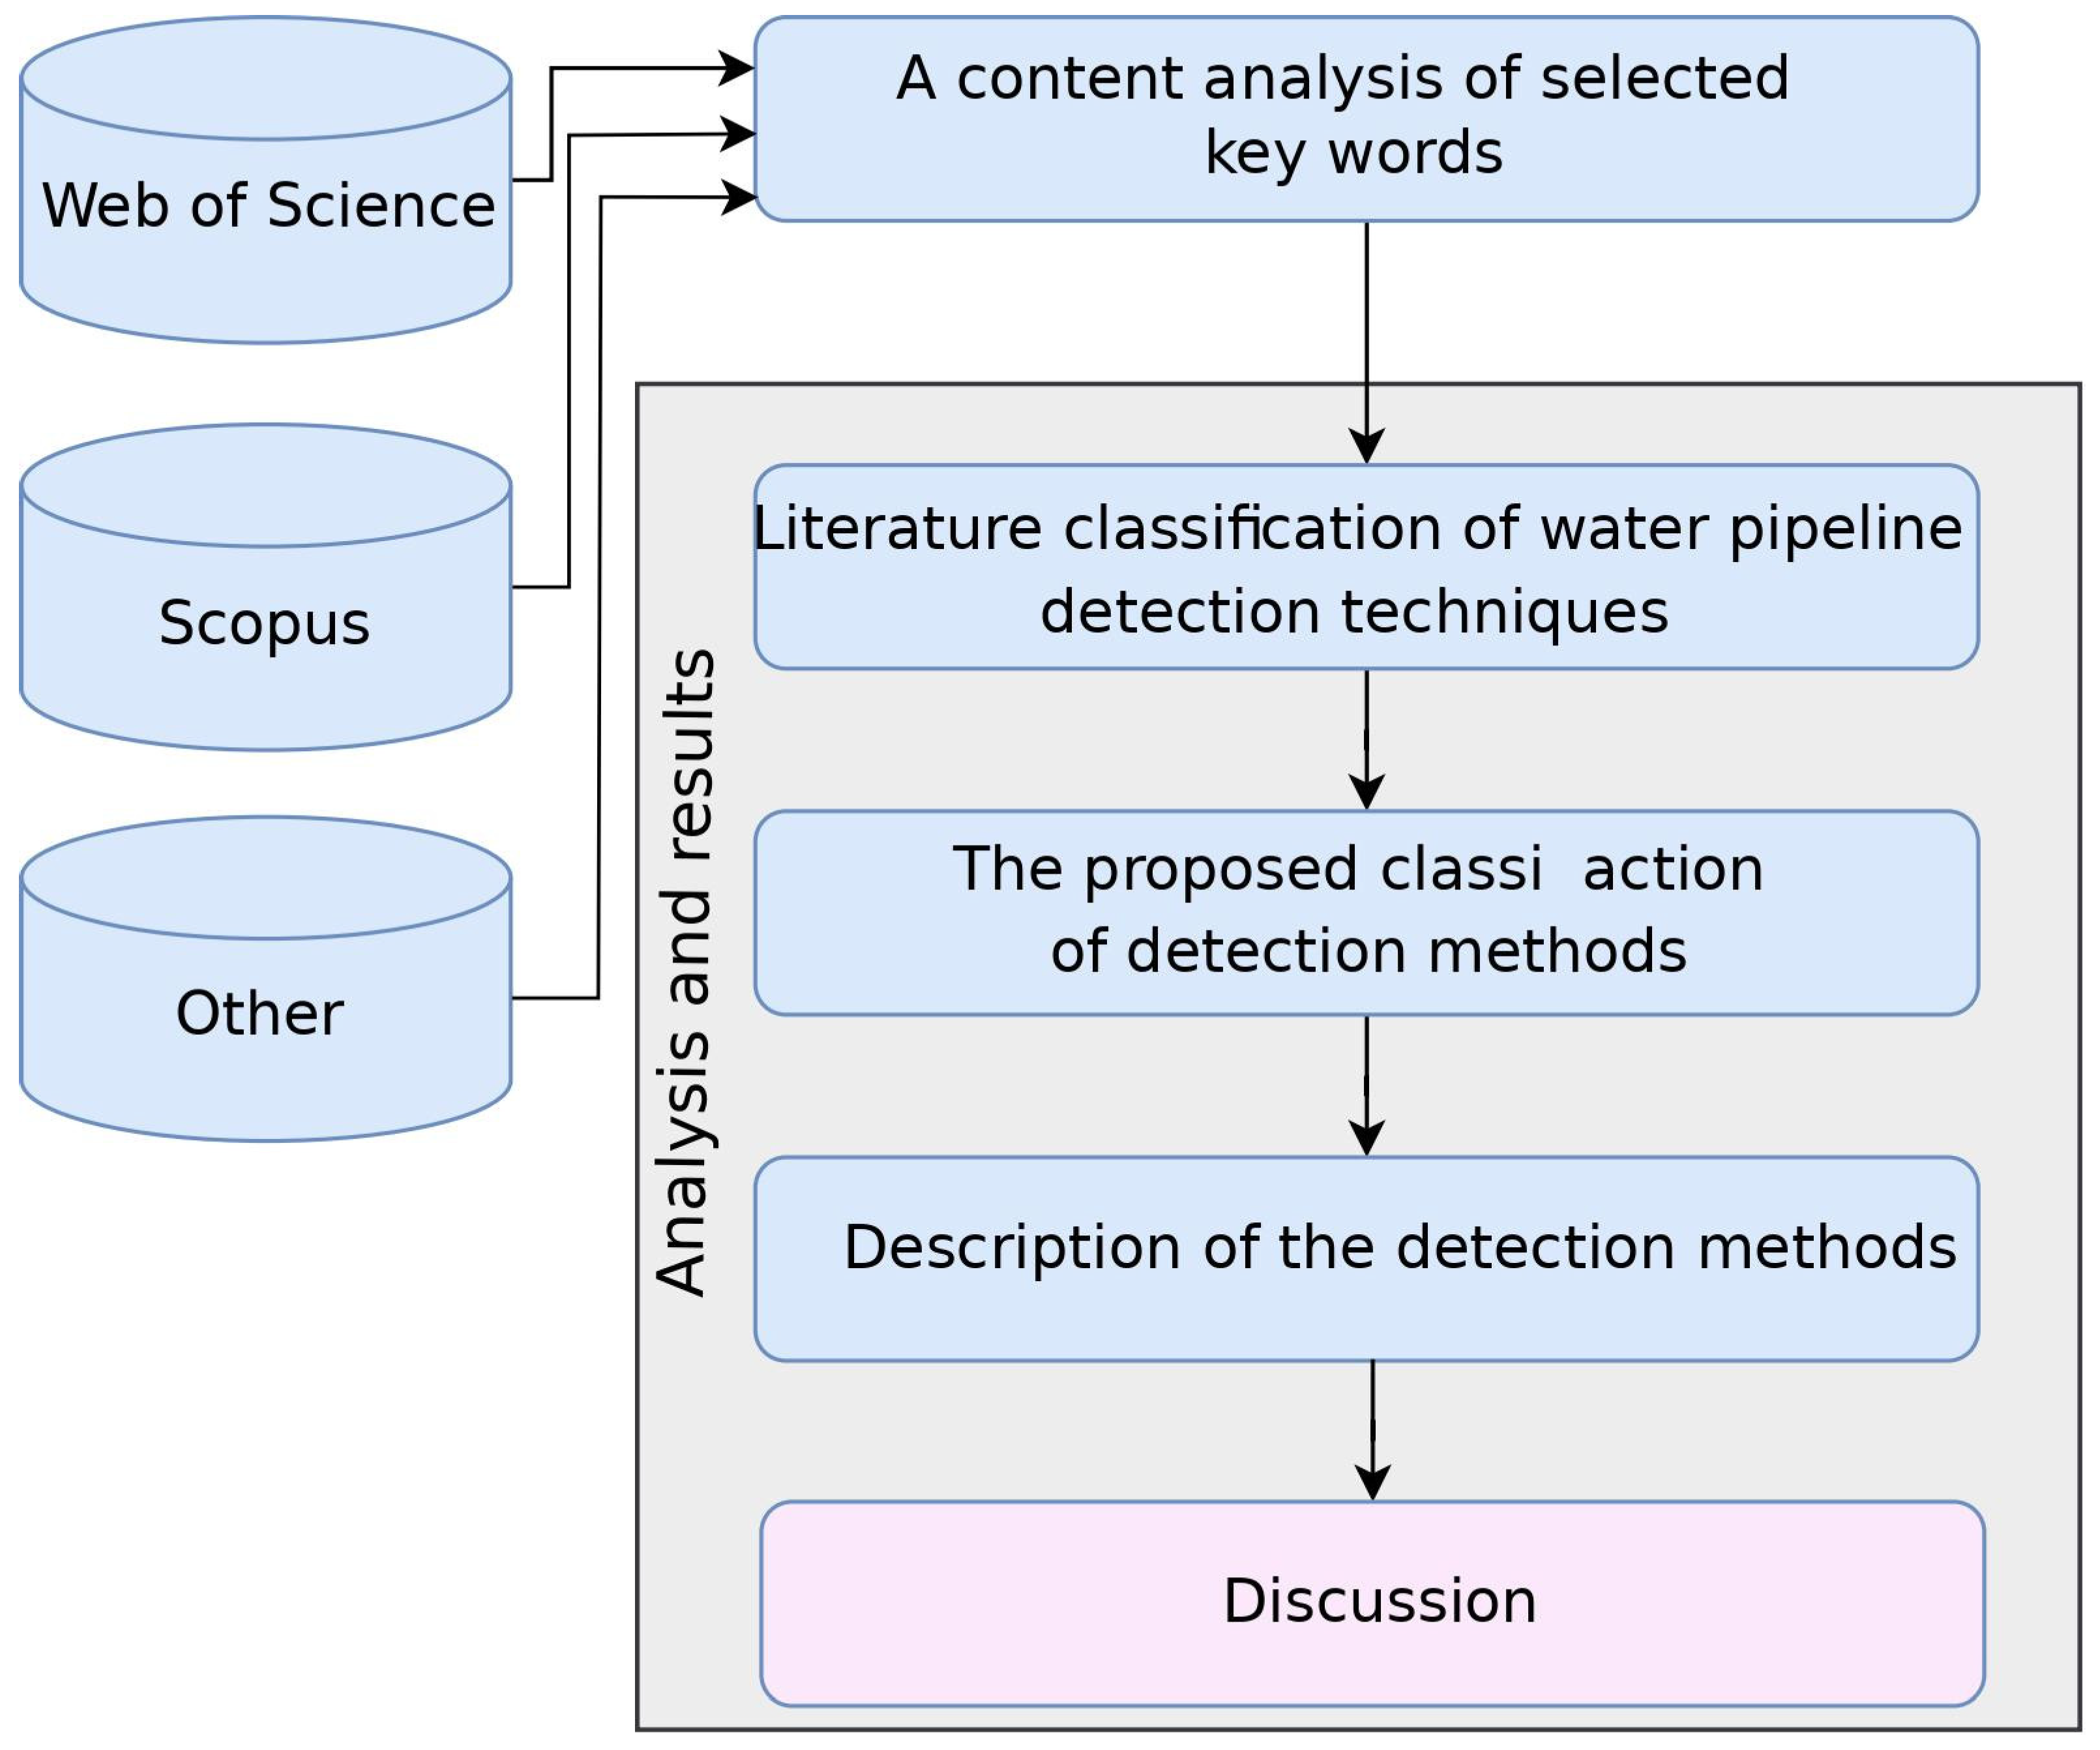
In the first part of the analysis, the popularity of keywords in the search engines of the Scopus and Web of Sciences databases in relation to the detection of water network operating conditions was reviewed. Selected keywords (detection techniques, detection in water distribution systems, water leakage, water leak detection, failure water supply, condition water supply system) were related to leakage in water distribution systems, detection methods, and failures of water supply systems. Next, based on literature reports since 2000, the approaches to dividing the methods of water supply system operating condition diagnosis proposed by authors in the last two decades were reviewed and an attempt was made to systematize this knowledge. The last part of the research was the authors’ classification of existing methods, clearly separating the analysis of acoustic data from the hydraulic parameters (flow rate and pressure), which are the basis of the diagnostic methods. The scheme of the methodical actions taken is presented in Figure 1.
3. Results
The diagnostics of technical infrastructure is a young and constantly developing field. As a result, over the years, we have observed a variety of ways to classify methods of detection of the working conditions of water supply networks. The development of methods has been influenced by such factors as, among others, the progress of technology, the development of mathematical algorithms, and increased awareness of the need for diagnostic teams in water supply companies.
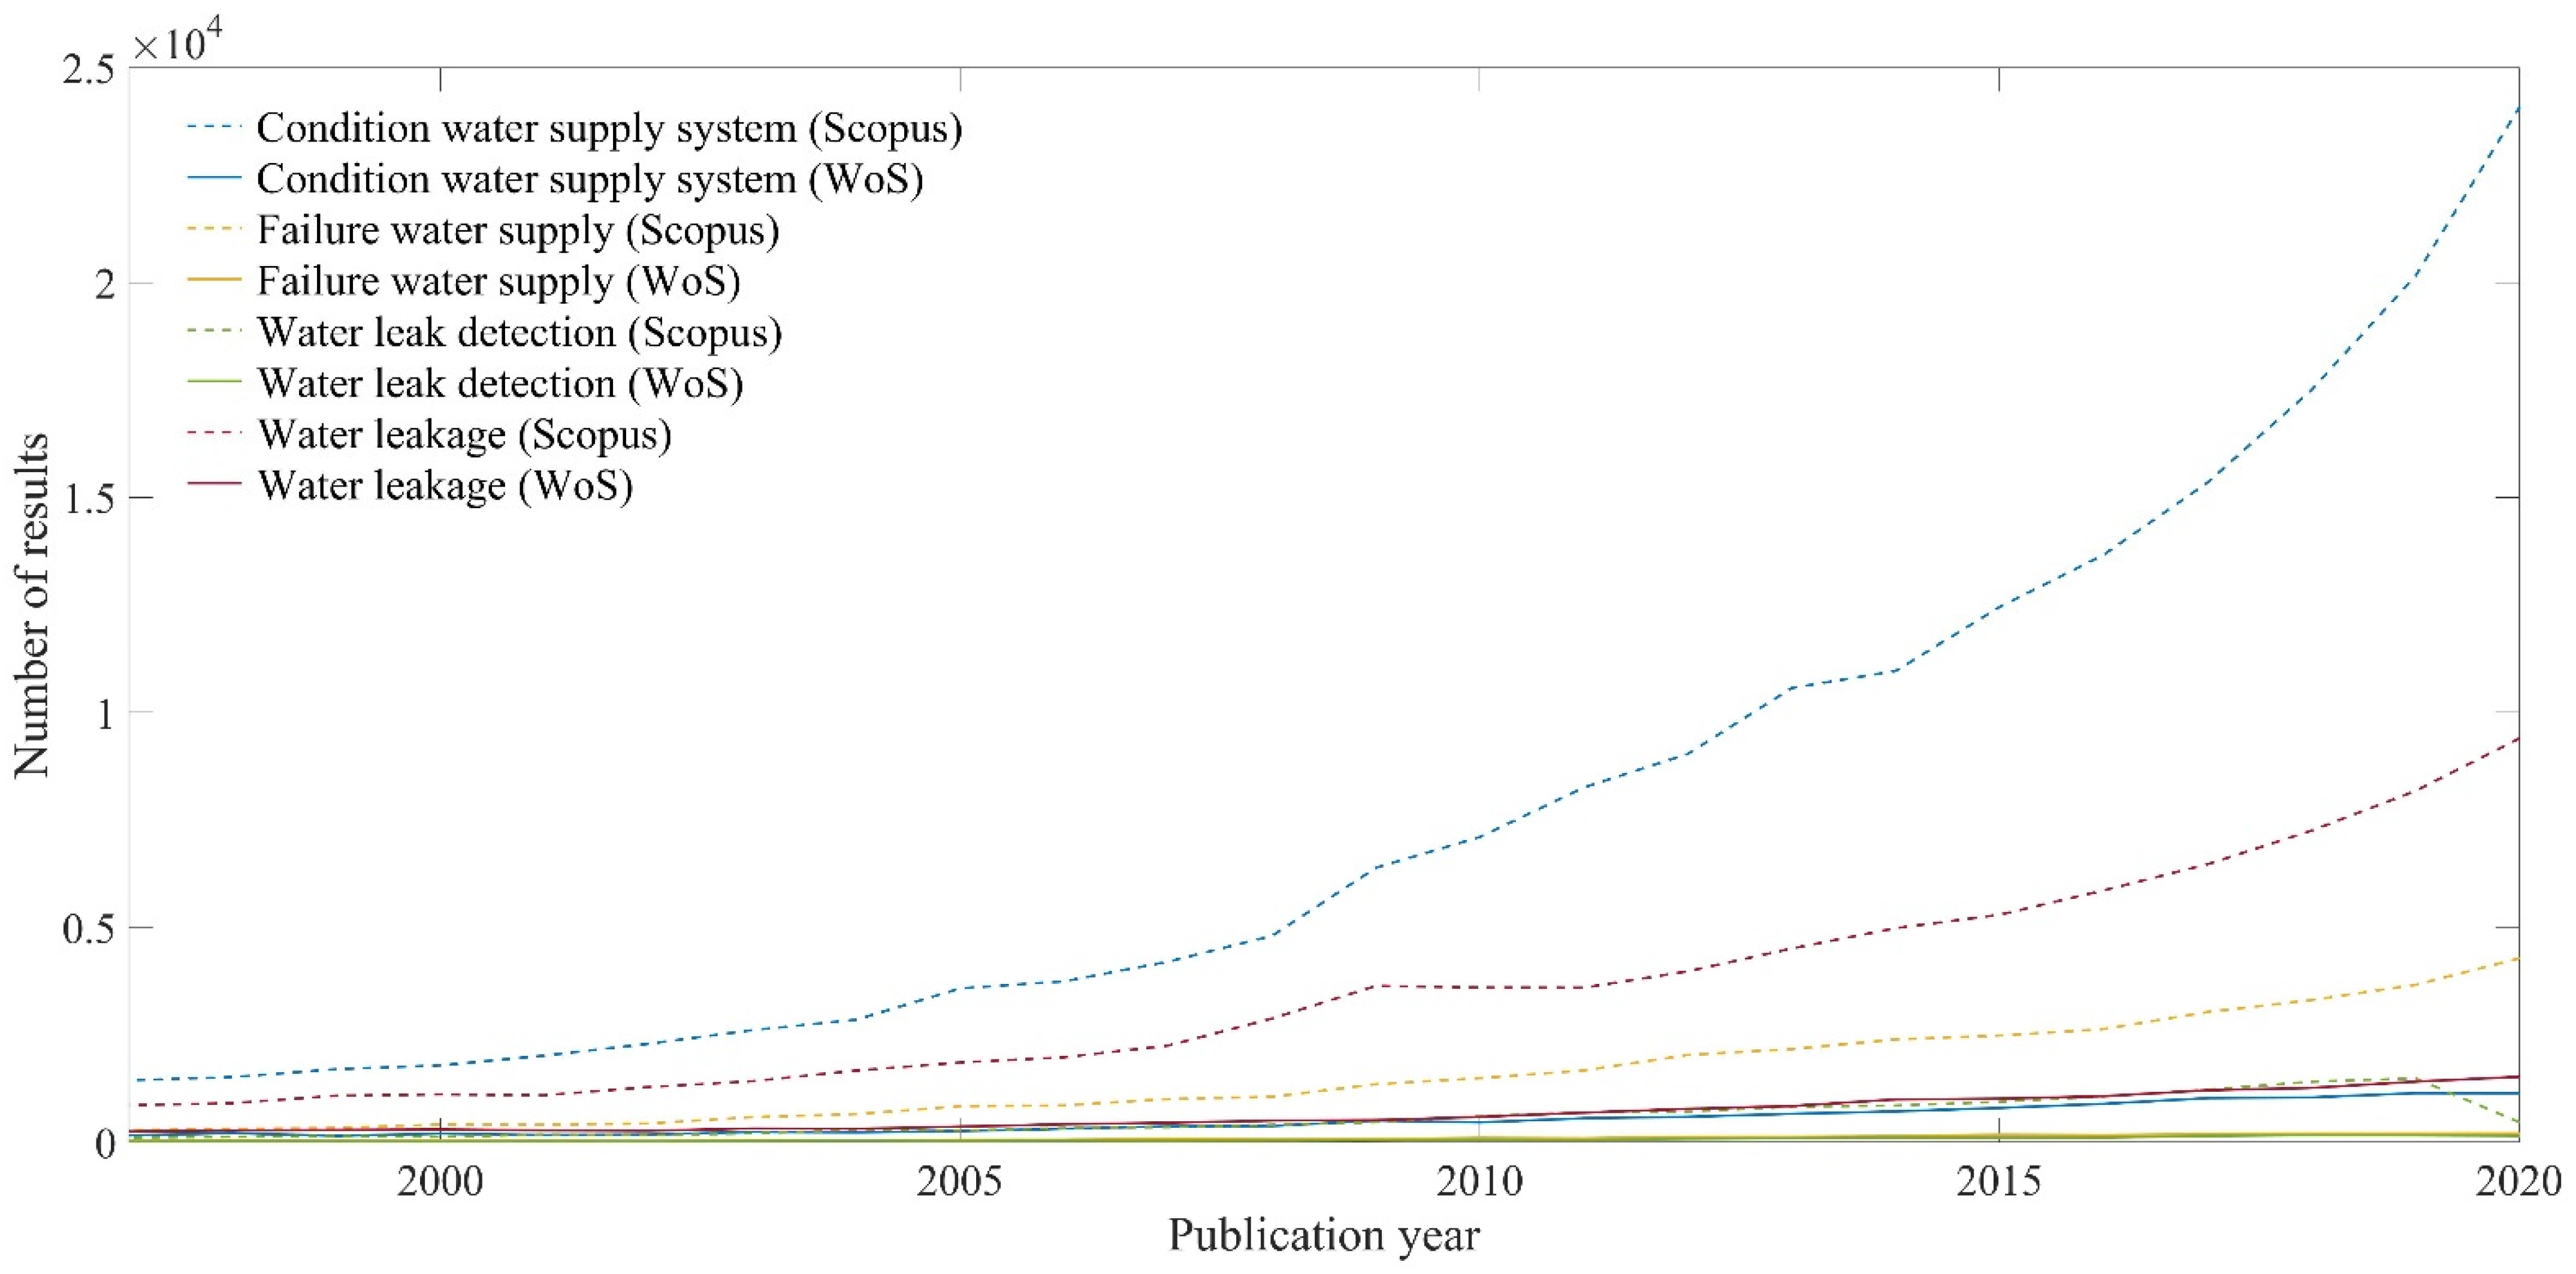
It is evident that there is an ever-increasing interest in the topic of the detection of water supply network operating conditions, including the failure rate [8]. Figure 2 shows the number of publications related to sequentially searched keywords that fall within the scope of water supply network operating condition diagnosis.
Both Scopus and Web of Science show an increase in the number of publications, indicating a growing interest in these issues after 2005. In spite of the COVID-19 pandemic, or perhaps especially because of it (due to changes in the conditions of water consumption by residents who switched to a remote mode of work, the closure of service points, and a reduction in the working hours of some of the industrial plants [9]), the diagnosis of water supply networks is a very current scientific research problem and there is a high probability it can be assumed that in the following years, there will be a continuing upward trend in the number of publications in this area.
Some of the methods of detecting the operating conditions of the water supply network are commonly used in the operating conditions of the water supply network and some in laboratory conditions. The approaches to classification of the methods of water supply infrastructure diagnosis used so far are varied. Many authors have undertaken the classification of methods used for water supply network diagnostics, but due to their multiplicity, the methods of division are not identical.
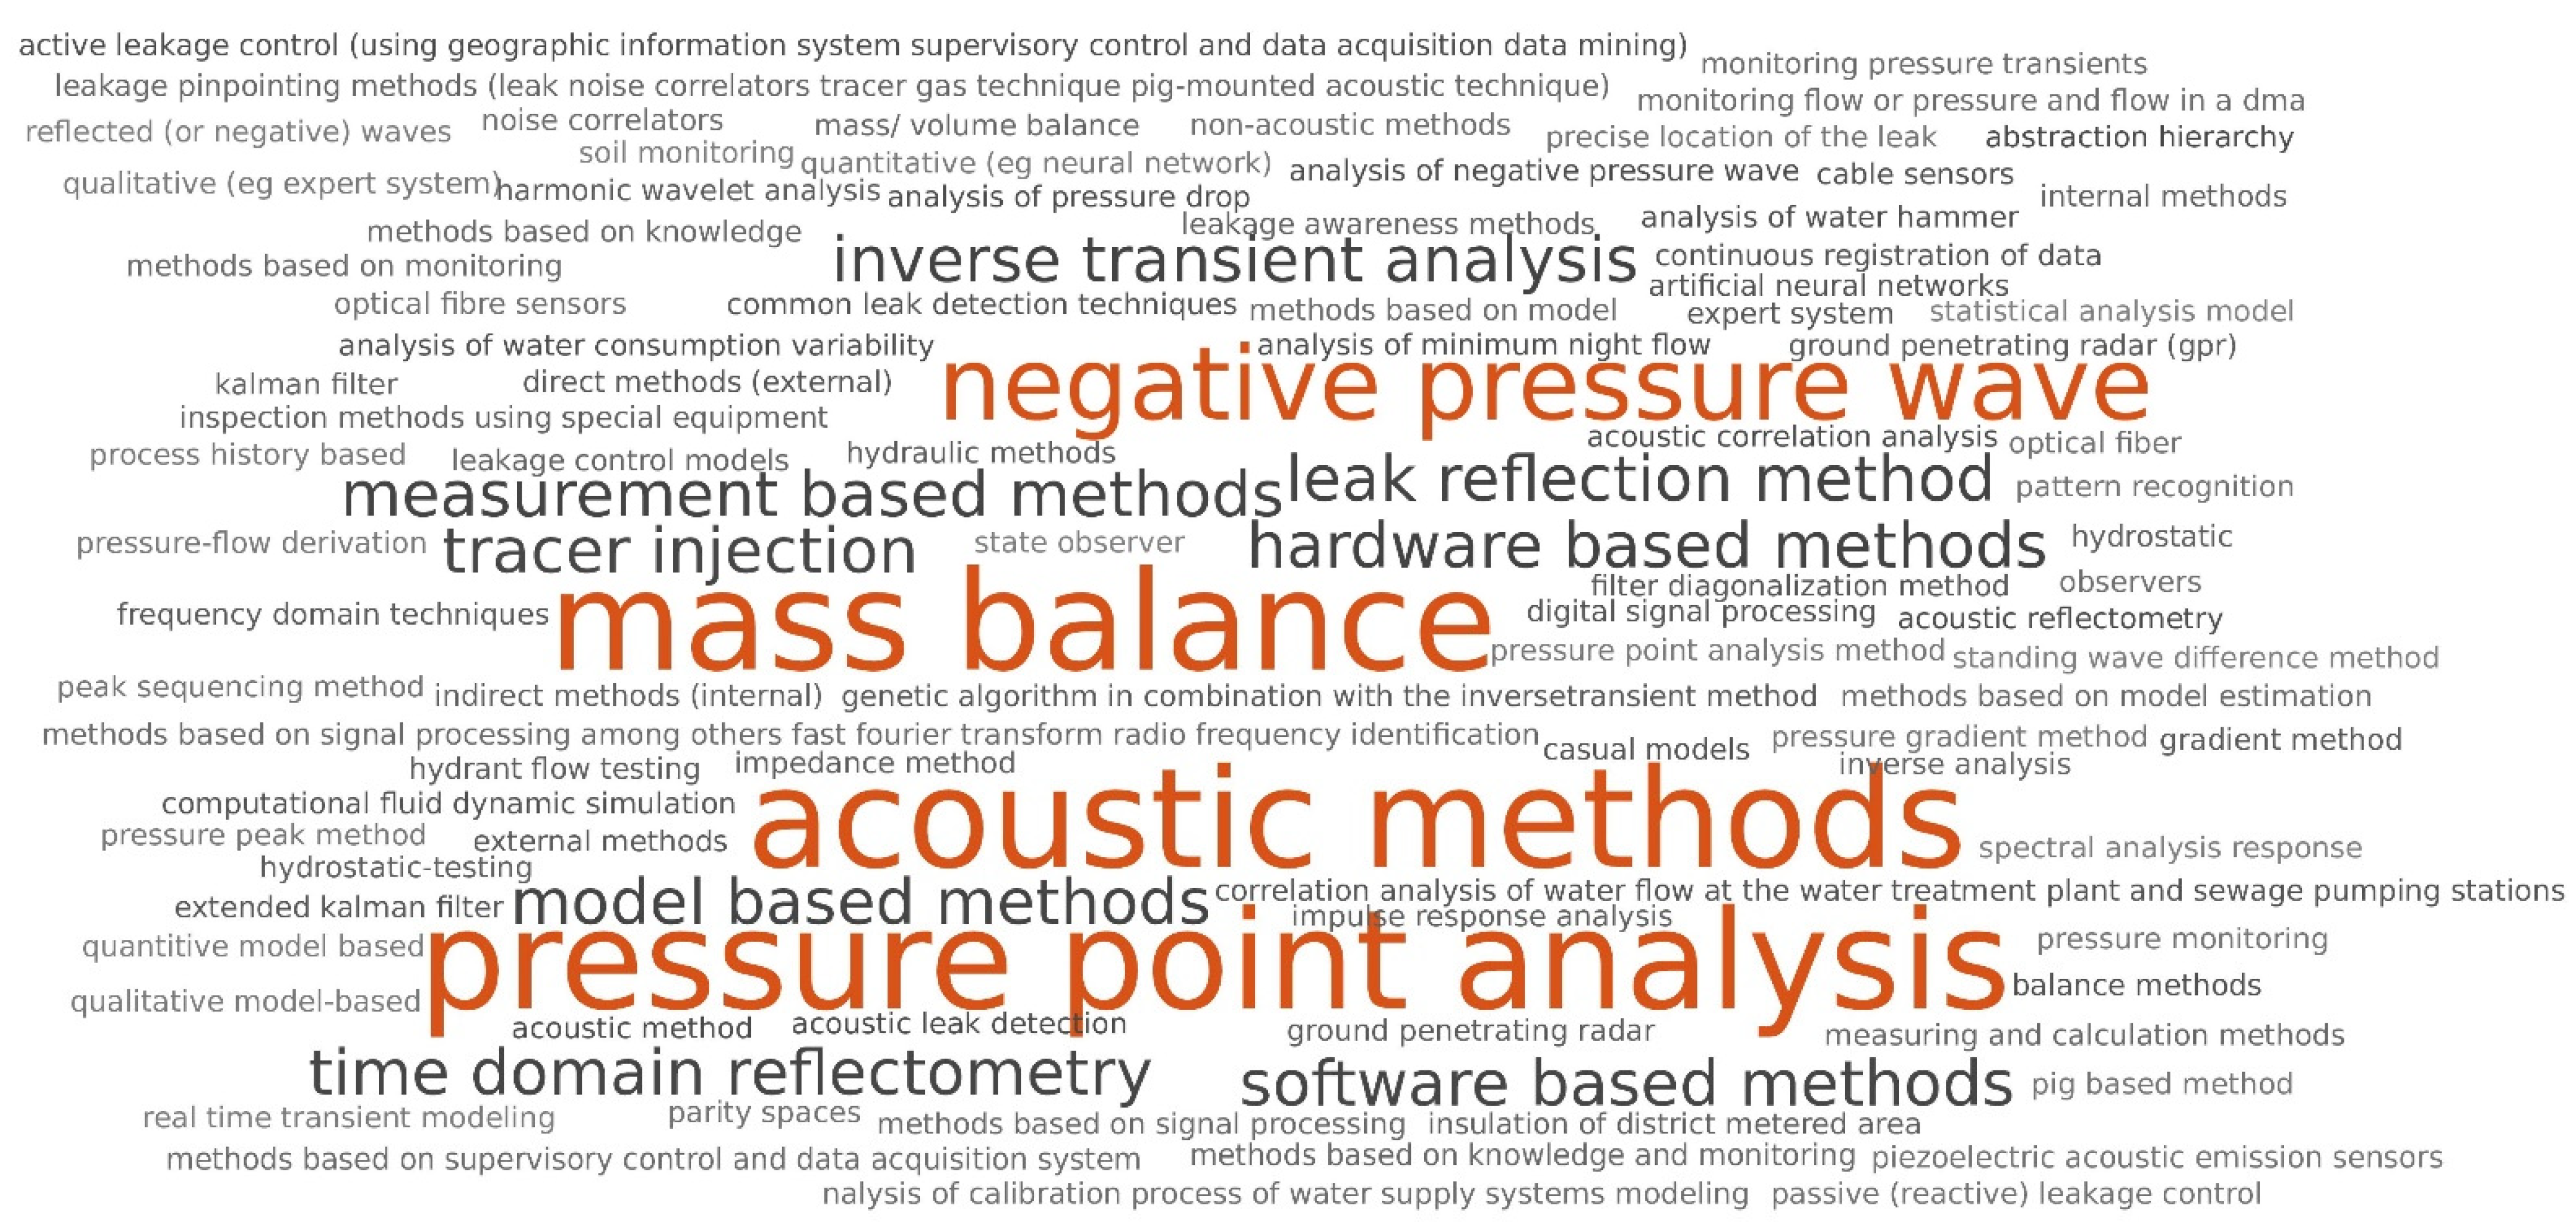
A word cloud chart (Figure 3) was created from the literature selected for analysis and categorization of methods presented therein for the detection of water supply system operating conditions. In Figure 3, some types of methods, which are mentioned most often in the literature, are clearly distinguished. Authors have most often included acoustic and balance methods, as well as those based on pressure parameter analyses. Typically, these methods are classified into hardware and software methods as well as into measurement- and model-based methods.
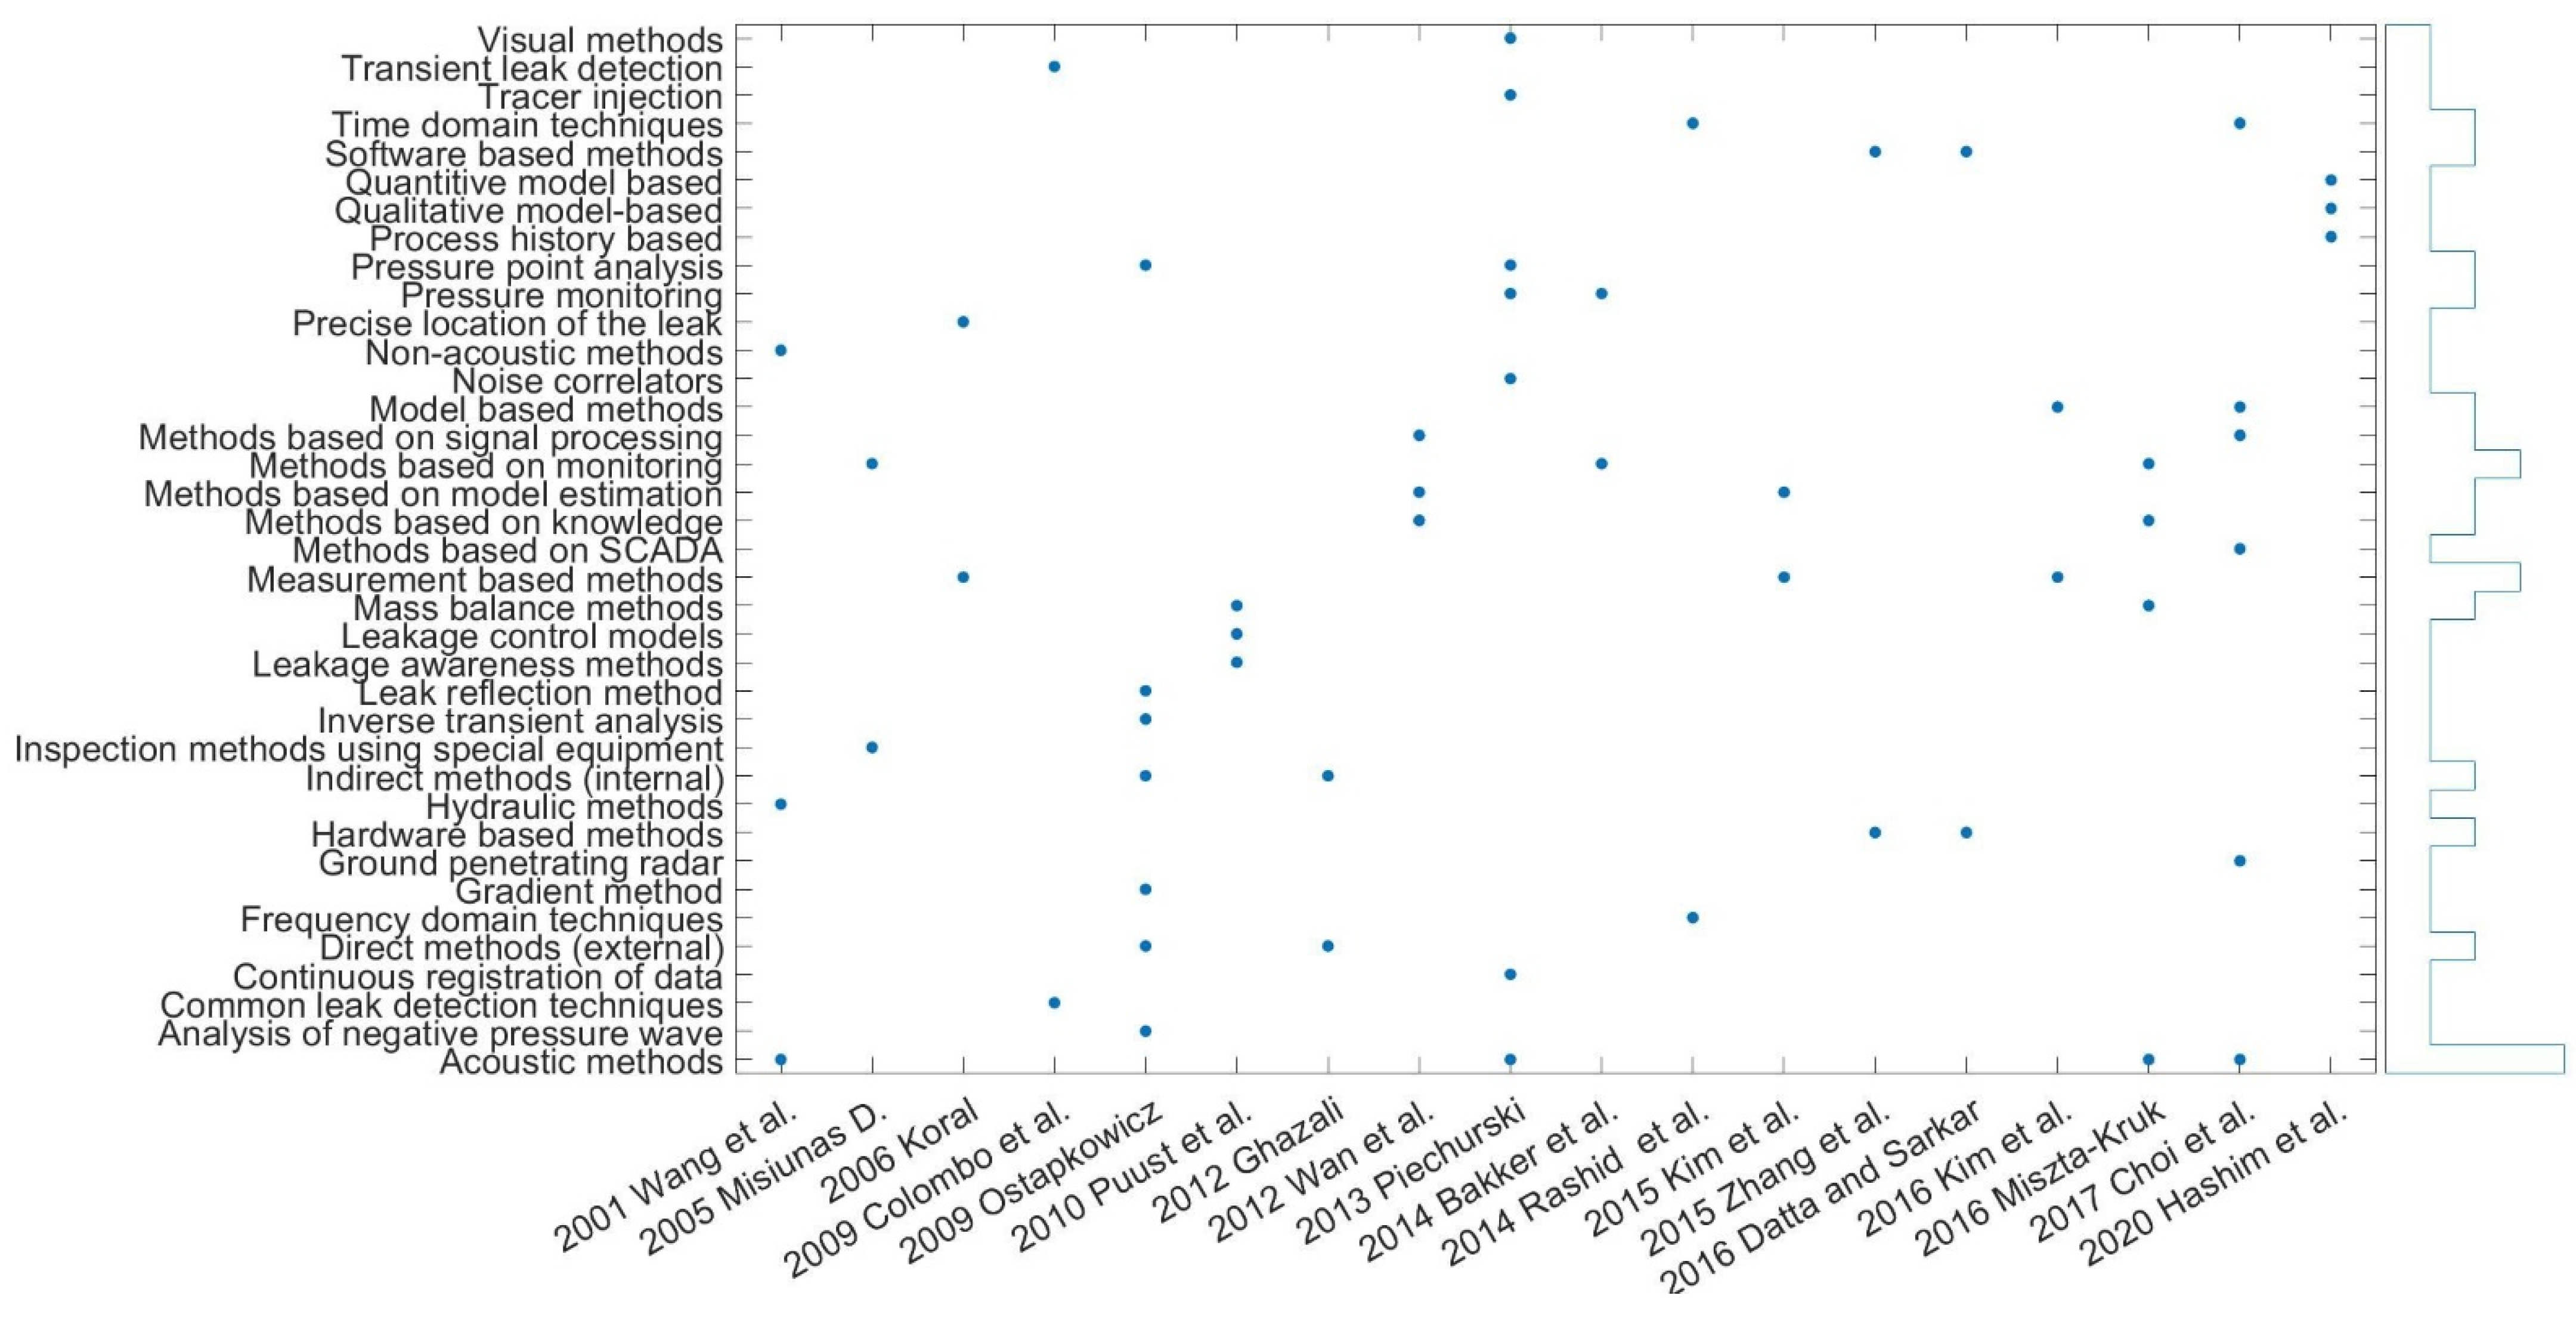
More details about the methods for diagnosing the operating conditions of water supply systems, based on works from the last 20 years presented by specifically selected authors [10,11,12,13,14,15,16,17,18,19,20,21,22,23,24,25,26,27], are illustrated in Figure 4. In spite of the various divisions of methods for detecting the operating conditions of water supply networks found in the literature, the most common classification distinguishes acoustic methods from the others. Undoubtedly, the direct localization of failures by means of physical diagnostic tools should be distinguished from the methods used to diagnose the conditions of water supply networks by means of analyses of hydraulic parameters. Solutions based on the analyses of recorded time series include not only the knowledge of failures but also abnormal water intake resulting from other factors, including anthropogenic ones. One of the reasons for the rapid development of methods for detecting the operating states of a water supply network in the last two decades is the fact that real-time monitoring alone is not a sufficient diagnostic tool. More important is the analysis and interpretation of measurement data. For this reason, many new methods have implemented advanced computational algorithms to analyze the recorded parameters.
4. New Classification of Methods for the Detection of Water Network Operating Conditions
Having analyzed the existing methods of categorizing the techniques of water network operating conditions assessment, the authors’ proposed their own modification (Figure 5). The general concept is similar to the one presented in the scientific literature; however, according to the authors, within the framework of software methods, the interpretation of acoustic signals should be explicitly separated from the processing of time series of water network operating parameters (pressure and flow rate). This decision is based on the different nature of analytical procedures for these quantities and the use of a different type of equipment for their measurement and recording. In Section 4.1 and Section 4.2, methods of detection of water supply system operating conditions are characterized according to their proposed classification.
4.1. Hardware Methods (Direct)
4.1.1. Acoustic Methods
Acoustic methods are among the oldest methods for identifying leaks in the water supply system. Initially, listening sticks and microphones were used to detect pipeline leaks [28]. This method involves listening to sounds along the route of the pipe and finding areas where the acoustic band has changed due to leaking water.
Today, leak detectors are widely used for condition surveillance of linear facilities around the world [17,29]. Surveillance is very often carried out using satellite communications. Modern devices allow for leak detection with an accuracy of up to 1 m in up to 15 min [30]. The premise of microphone-based line leak detection was originally developed for gas pipeline operations by Richardson in 1935 (after [31]). Sound analyzers for leak detection in water supply networks began to be used in the late 1970s [32]. According to [33], during failure, the frequency of sounds increases to above 200 Hz and is usually contained in the 400–500 Hz band.
Leak noise correlators (LNC) are used to process the sounds recorded by a pair of serially mounted microphones. Sound correlators use computational techniques of signal analysis. Therefore, this method can be classified as a hardware–software method. The sound signals are usually sampled using a Hanning window, and then, using fast Fourier transform (FFT), periodograms are calculated in the form of a signal power spectrum as a function of frequency. A cross-correlation is calculated for the discrete signal power spectra from the two microphones, which is a measure of the similarity between the two signals [34].
Another acoustic method has its origins in mechanical scrubbers used to remove sediment from pipelines. These are known in the literature as pipeline inspection gauges (PIGs) [35,36]. With the development of sensors called hydrophones, which allow for the recording of sounds propagating in water, floats equipped with these sensors began to be introduced into water pipes in place of scrubbers. Methods using this technique are known as pipe-mounted acoustic (PMA). An example of a PMA method is the so-called smart ball used since 2007 [37]. Before testing, the device should be calibrated each time. The ball is equipped with sound detectors and a GPS receiver to locate it in the water pipe. Simultaneously with the measurements carried out by the ball as it moves along the water pipe, the recording of acoustic waves is carried out by sensors mounted on the outer walls of the pipe in order to eliminate ambient sounds reaching up to 70 dB [38].
4.1.2. Non-Acoustic Methods
Non-acoustic methods use changes in environmental properties that occur near leaks to locate them. Pipeline leaks can be detected by the tracer gas technique (TGT), that is, tracer gas injection. A non-toxic, lighter-than-air gas, most commonly helium and less commonly hydrogen, is added to the tap water. At the point of leakage from the water into the soil air and then into the atmosphere, the gas travels by diffusion. The presence of gas is detected using sensitive detectors.
Water leakage sites can be located using thermal imaging cameras, which locate temperature differences between the pipeline and its surroundings. The ground in the vicinity of a damaged water pipe, due to increased moisture content, has a different thermal conductivity, which causes a different temperature distribution in the vicinity of the leak compared to the surrounding area. Thermal imaging scanning is performed by cameras installed on drones or helicopters [39].
In water supply companies, ground-penetrating radar (GRP) is often used to detect water leaks. The working principle is based on sending electromagnetic waves with frequencies ranging from short to ultra-short radio waves to the ground medium and analyzing the spectrum of reflected waves using specialized software. This method can be classified as an instrumental–software method.
In recent years, hybrid methods using both GPR and high-precision acoustic devices have also been applied for leak detection [40]. The operation of these devices must be synchronized over time. This solution improves leak localization, but in urban conditions, due to noise and the previously mentioned disadvantages of geophones, it has not found much use in water supply companies so far.
4.2. Software Methods (Indirect)
4.2.1. Mass/Volume Balance Methods
The implementation of balance methods in water supply companies results mainly from economic needs [41]. Water losses and related network failure rates are measures of the quality of the water distribution system management. Water losses are commonly understood as the difference between the amount of water injected into the water distribution network and the sum of water used for the system’s technological purposes and sold to customers. According to the traditional methodology, water losses are given as an index defining the percentage of the sum of the annual volume of water sold and used out of the annual volume of water injected into the water network. The value of the water loss index, according to the classic method of their estimation, should not be greater than 10%.
In 1999, the International Water Association (IWA) appointed a task force to develop guidelines for standardizing the methodology of tap water loss control. Since 2002, conferences have been organized by this team to present lessons learned from implemented procedures. The water balance framework defines, among others, the Infrastructure Leakage Index (ILI), the Unavoidable Annual Real Losses (UARL), the Real Loss Basic (RLB), and the Non-Revenue Water Basic (NRWB) volume index [42].
Balance methods, as common solutions, have already been implemented in many water supply companies but should find wider application. This is possible provided that the calculations are automated, which reduces the time consumption and increases the reliability of the performed balances. Knobloch et al. [43] developed a water balance system according to IWA standards based on geographic information system GIS) software. Silva et al. [44] showed that significant drawbacks of balance methods for the diagnostic purposes of anomalous distributions are very often too little data and their low reliability. In order to improve the diagnoses based on the balance method, simulations were performed using the Monte Carlo method of generating pseudo-random numbers and the high-density regions (HDR) method of probability distribution. A more advanced solution [45] implemented multi-criteria decision analysis (MCDA) to support water supply network management and anomalous condition detection. The mass and volume methods are widely used in management at the decision-making stage.
4.2.2. Acoustic Signal Processing
There are many modern methods of acoustic signal interpretation in the context of detecting failures of technical networks using the phenomenon of sound wave propagation. They require the additional use of bandpass filters, which remove the noise generated by the external environment surrounding the pipes.
According to the methods based on acoustic signal interpretation, the aim is to learn the spatial distribution of the sound effect accompanying the failure by rendering it using modern signal processing techniques. The main parameter subjected to analysis is the amplitude of the sound wave, defined by sound pressure (expressed in Pa) [46].
Depending on the acoustic signal processing and interpretation techniques used, the related methods are divided into three subcategories. The first one, and the most comprehensive, uses wireless sensor networks (WNSs) along with built-in algorithms for signal processing at the site of registration. The second type of method that interprets acoustic signals is based on the wavelet transform (WT) of the signal recorded by traditional acoustic sensors acoustic emission (AE). The last type of method has implemented algorithms for the cross-correlation of two time series recorded by AE before and after the leakage site.
The application of acoustic sensors is easy to use, operate, and locate, and is flexible, efficient, and relatively cheap [47]. In addition, the sensors can be placed at quite considerable distances from each other outside or inside of the pipeline. Acoustic sensors combined with machine learning are currently state-of-the-art in detecting water supply network operating conditions [48].
4.2.3. Flow Rate and Pressure Signal Processing
The limitations of methods analyzing acoustic signals mobilize the scientific community to select newer techniques of the processing and use of time series of parameters of the state of network operations—the flow rate and/or pressure. One of them is flow rate and pressure signal processing. The analyses performed under laboratory and field conditions are presented in Appendix A. Table A1 and Table A2 summarize the more important publications presenting the results of studies in which software analyses of controlled signals were applied for the purpose of assessing the operating conditions of water supply networks.
Water Demand Forecasting
The methods based on forecasting consist of predicting the water demand of the water supply network customers based on historical water consumption and flow rates. Due to the influence of hourly, daily, weekly, and seasonal variability of water consumption, these solutions require long-term measurements. Methods that use archival measurements to estimate their future distributions are called autoregressive integrated moving average (ARIMA) [49] or autoregressive integrated moving average with exogenous variables ARIMAX) models. The significant role of seasonal variability in the application of predictive methods was demonstrated by Eliades and Polycarpou [50] in their analyses of water flow rates. It was proved that the omission of seasonal variation can generate false alarms. The main disadvantages of the developed failure detection method are the omission of already existing leaks in the network and the initial assumption of their absence. Moreover, the failure information is provided to the network manager with a time delay.
The CUSUM algorithm, compared to heuristic methods, was also implemented in the study of Bakker et al. [19]. The created solution was tested with nine real water supply network failures and compared to the results obtained by heuristic methods. The model created by the authors was able to forecast water consumption volumes for the next 48 h with a 15 min time step. Each difference between the predicted value and the observed one was treated as a failure (taking into account the 5% error boundary).
The future of anomalous condition detection combined with predictive methods is the water demand forecasting model (WDFM) based on the hydraulic model of the water supply network and parameter estimation through, among others, the Kalman Filter [51]. The WDFM is updated with actual inventoried measurements with a 15 min time step and is subject to multiple linear regression (MLR) [52]. The results show that the WDFM system identified the most leakage (80–100%) for the largest failures.
There are also a number of solutions based on historical water flow rates recorded during real failures. Cluster analysis is used to interpret them [53]. By knowing the coordinates of the position of hydraulic parameters during failures in space, the level of risk of uncontrolled leaks in the future can be determined. Sun et al. [53] demonstrated that cluster analysis can be applied to pre-process data and locate them in two-dimensional space.
Wu et al. [54] investigated the flow rates of a selected DMA zone to detect the failure of a water supply network. The methodology used, cluster analysis, allowed for the determination of the distance between the means of the measurements, the Euclidean distance, and the density of the distribution. The results indicated that false positive alarms accounted for 0.41–0.76% of the measurements and true positives accounted for 71.43%.
Time Domain Analysis
When a water pipe bursts as a result of a failure, there is a rapid drop in the pressure at a given control point and an increase in flow velocity. The consequence is the phenomenon of hydraulic shock, accompanied by the formation of a wave propagating in both directions from the place of failure, the so-called negative pressure wave NPW). This forms the basis for methods based on the analysis of short-term transients in the time domain.
Depending on the pipeline material, foundation conditions, and soil, the propagation velocity of the NPW is between 250–1500 m/s [55]. The wavefront may be well-defined for large faults, or weaker for smaller faults. Solutions based on the analysis of short-term transients (transient phenomenon) include transient analysis TA). Short-term transients are events within the water supply network that are transmitted as a pressure wave or hydraulic shock, resulting in a sudden change in flow velocity. The TA approach is based on the comparison of the pressure distribution under normal network operating conditions with the signal recorded during a failure, which contains information about the transition wave. The methods are implemented by analyzing a forced, short-lived hydraulic shock created by the sudden closing or opening of a valve on an example network installed (typically) under laboratory conditions. The point of the proposed solutions is the detection and localization of failures based on the analysis of the sequence of the passage of the hydraulic shock wavefront, the so-called pressure wavefront tracking. The biggest problem concerns the calibration of the unknown roughness coefficient of the ducts, which reveals the range of the wave attenuation generated by the short transient. The procedure is supposed to lead to the minimization of the objective function, that is, the difference between the measured and estimated values of the hydraulic parameters.
Initially, attempts were made to determine the internal roughness of a conduit based on network analysis under steady-state flow conditions, but the significant limitations of this approach did not yield the expected results. Pioneers in this field, Pudar and Liggett [56], were the first to implement the inverse transient analysis (ITA) method, which consists in estimating the roughness coefficient on the basis of recording pressure values at selected points in the water supply network. Subsequently, Liggett and Chen [57] incorporated the formation of short-term transients into the above methodology. TA, in contrast to ITA, consists of estimating the hydraulic parameters of the water supply network based on its characteristics (known roughness coefficients, material and length of pipes). Liggett, Pudar, and Chen reversed the meaning of TA; based on known recorded pressures and flow rates, they attempted to determine the internal roughness of the pipelines by implementing an algorithm that minimizes the Levenberg–Marquardt objective function (LM) [58].
Covas et al. [59] were among the first to implement methods based on hydraulic shock transition wave analysis at a semi-technical (rather than laboratory) scale. The propagation speed of the hydraulic shock wave between two sensors was analyzed. The authors implemented the inverse transient solver (ITS), which is an optimization algorithm that minimizes the sum of the squares of the differences between the observed and simulated hydraulic parameter values.
The study also used a system for the detection of water main failures along with the estimation of the magnitude of uncontrolled discharge using a machine learning process [60]. The phenomenon of the appearance of the negative pressure wave (NPW) was interpreted using methods such as support vector (SVM), k-nearest neighbors (k-NN), Gaussian mixture model (GMM), and naive Bayes classifier (NBC). They pointed out the problem that too much data is created by traditional methods and is not properly interpreted later because its time-consuming analysis is too expensive. Therefore, they focused on processing the information at the point of acquisition. The machine learning and inference module is “asleep” under normal network operating conditions and is only stimulated when a potential failure occurs. The naive NBC had the highest accuracy (94.8%) in the failure detection situation. This study debuted the combination of WNS sensors with optimization methods and classifiers that process data in situ.
Frequency Domain Analysis
Methods based on the analysis of short-term transients in the frequency domain, that is, the frequency response method (FRM), consist of the analysis of the pressure transition waveform distribution in the frequency domain. These solutions are reduced to the observation of dominant frequencies, which are included in the failure time series. Results obtained via FRM depend largely on the shape of the generated waveform and the location of the sensor.
The need to remove measurement noise from signals recorded during short transients was demonstrated by Guo et al. [61]. In their study, the authors determined the so-called adaptive threshold, which defines the boundary between the normal and failure operation of the water supply network. To obtain the de-noised time series, wavelet transform was used, which gives satisfactory results when processing a signal loaded with the white noise of Gaussian distribution. The mean squared error (MSE) between the estimated values and the estimators was analyzed. The TSWA algorithm was compared with the back-propagation neural network BPNN) method based on the LM algorithm. Finally, the smallest MSE error was obtained for the proposed solution (at 0.01097).
Ghazali [16] demonstrated the usefulness of analyzing the pressure signal in the frequency domain using Hilbert transform (HT) and Hilbert–Huang transform (HHT). The process of locating the failure was done using the decomposition of the signal into empirical modes, known as empirical mode decomposition (EMD). HT and HHT allowed for the analysis of the instantaneous nature of the pressure wave for experimental and model data. Successively, the data were filtered through EMD.
The signal analysis approach of an artificially created transition wave in the FRM frequency domain was implemented in the study by Srirangarajan et al. [62]. They mainly interpreted the wavelet coefficient and Lipschitz exponent, which contain information about the nature of the signal and can be useful for classification processes. When a leakage occurs, the analysis of the extremes of the wavelet of the hydraulic shock transition can be detected by applying a bandpass filter. It is observable when it is possible to change the frequency of a given signal. However, this methodology is effectively applicable when the signal is isolated and free of noise. Identification of a failure signal allows for the observation of changes in the values of the wavelet coefficients at each step of its decomposition.
The feature extraction (FE) method for evaluating the occurrence of a water supply network failure from a pressure signal was applied by Gamboa-Medina et al. [63]. The time series were clustered into two groups—failure measurements (LEAK) and normal measurements (NOLEAK). The results showed that during uncontrolled water outflow, a more frequent occurrence of low frequencies for energy and high frequencies for enthalpy can be observed. The zero crossing count (ZCC) for the emergency signal is characterized by fewer transitions through zero. In analyzing the distribution of the decomposed signal, it can be seen that low frequencies reach samples mainly in the absence of leakage.
Bergant et al. [64] dealt with factors affecting the shape and weakening of pressure transition waves, thus proving that dynamic friction and gas cavitation phenomena are the most common causes. Modeling transition wave processes is a complex activity, even for simple duct sections. It was also shown that the wave dispersion and energy dissipation are higher for plastic than for copper pipelines, thus raising the issue of material elasticity.
Hydraulic Modeling and Hybrid Algorithms
Solutions based on hydraulic modeling, in the procedures of which clustering algorithms are implemented, are aimed at minimizing erroneous indications from measuring devices and supplementing missing data forming time series. The results are simulations of a faithfully calibrated model of the water supply network, which reflects the real conditions of its operation. Modern computer software allows for analyses to be performed under steady-state (SS), dynamic extended period simulation (EPS), or short-term transient analysis (TA) [11].
Brown [65] and Misiunas [11] implemented TA and ITA methodologies in their studies analyzing hydraulic models calibrated from pressure measurements. They interpreted the relationship between the operating pressure maintained in the zone and the amount of uncontrolled discharge. The simulations were conducted with WaterCAD software. The conclusions made by the authors indicate that the detection of an anomalous state of water network operations by means of analyses of a calibrated hydraulic model is possible.
A system based on fuzzy clustering (FC) analysis [66] is also a support for water network managers, minimizing the time of failure detection. Li et al. [67] developed a solution for the detection, prediction, and warning of the occurrence of an emergency condition. It was based on GIS and the measurements of acoustic phenomena occurring inside the ducts. At the stage of creating prognostic tools, the naive Bayes classifier (NBC), statistical regression, artificial neural networks (ANNs), and the genetic algorithm (GA) were used.
The usefulness of using hydraulic modeling in detecting and reducing the failure rate of a water supply network was also demonstrated by Karadirek et al. [68]. Based on real data on reservoir water levels, flow rates, and pressures, they developed procedures to reduce uncontrolled leaks. Simulations conducted in EPANET led to the identification of DMA zones where the ILI was too high and the optimal (lower than the current) operating pressure was selected for each area.
5. Discussion
An accurate water supply condition detection system should be based on efficient and fast leakage diagnosis as well as the prediction and estimation of the probability of future events of this type. The problematic issues are the drawbacks of specific methods for the detection of water supply network operating conditions, which cannot always be meaningfully implemented in every water supply system.
Non-acoustic methods, such as tracer injection, are characterized by high costs but have the advantage of high leak detection and the possibility of locating leaks in pipes of deeper locations. The thermal imaging method can only be used to locate leaks at times when the temperature of the water flowing in the water supply system is higher than the ambient temperature. This method is particularly suitable for detecting pre-failure conditions in water supply networks during winter and spring. Temperature drops and ground freezing in winter are causes of water supply failures that become apparent after the frost has subsided. Fittings installed on water supply lines, such as gate valves and hydrants, are particularly vulnerable to this type of failure [39]. The strengths of the GPR method are the ability to detect water leaks in pipes not only made of metal and the possibility of performing tests at a speed of up to 15–30 km of network per hour. The main disadvantage is the difficulty of selecting the appropriate wave frequency, which depends primarily on the composition and structure of the ground medium. In urban agglomerations, the amount of underground infrastructure and the variability of the structure of the topsoil, due to the fact that it is anthropogenic soil, is the cause of numerous false alarms of leaks in places where they do not occur [69,70]. On the other hand, acoustic methods are time-consuming and costly and do not produce satisfactory results for heavily corroded or sediment-covered pipelines. The resulting turbulence due to the increase in the roughness of the inner walls of the pipelines strongly affects the recorded sound intensity levels [38].
Due to the severe limitations of the aforementioned hardware methods, the scientific community is focusing more attention on the implementation capabilities of software methods. Acoustic signal analysis, due to the novelty it represents, is mainly implemented on a semi-technical scale (small-scale prototype). This solution is expensive because to achieve a satisfactory effect, it requires the installation of multiple sensors located across short distances. Moreover, it is necessary to apply signal filtering, which will get rid of noise masking the leakage. The biggest inconvenience of using, for example, wavelet transform for the detection of abnormal operating conditions of technical infrastructure is the necessity of fitting an appropriate wavelet function to the vibration distribution of acoustic waves. Its shape is a key issue in the later reconstruction of the signal in a time-frequency domain. Another disadvantage is the selection of the number of signal decompositions. The more of them there are, the better measurement noise is eliminated, but at the same time, more individual and local signal characteristics can be lost. Moreover, the filtering of measurement data alone is not sufficient; it is necessary to use a classifier of network operating states. Noise extraction using wavelet transform can result in the attenuation of acoustic phenomena accompanying a pipeline being torn apart as a result of a failure [33]. This implies the loss of relevant information about the event along with noise separation and rejection. However, when combined with computational intelligence methods, acoustic signal analysis allows for the accurate diagnosis of the operating conditions of a water supply network [48]. All acoustic methods are affected by noise from the external (urban) environment [38]. It is, therefore, required to know the acoustic background and noise level maps before analyzing such signals and to look at the noise level maps for the area. An additional disadvantage is that plastic pipelines transmit sound waves less than metal pipelines. Satisfactory results of this type of method are achieved only when a dense network of sensors is used, which increases costs, and the selection of an appropriate sensor placement technique can be a key issue in the subsequent analysis of the signals coming from them [67]. The interpretation of sound wave parameters gives satisfactory results most often when straight sections of ducts are considered. Any changes in the direction cause the attenuation of acoustic phenomena, making the signals weaker [71].
All the above-mentioned limitations of the methods analyzing acoustic signals mobilize the scientific community to select more modern techniques of the processing and use of time series of network operating parameters, such as flow rate and/or pressure [72]. Despite the fact that attempts are made to test more advanced methods (e.g., based on the analysis of the hydraulic shock transition wave) in the conditions of an exploited water supply network, these methods are rarely implemented permanently into professional (operational) practice. Rashid et al. [20] highlighted the problem of too much data being produced by traditional methods and not being properly interpreted afterwards because their time-consuming analyses are too expensive. A shortcoming of the methods based on short-term transients is the need to determine the roughness coefficient, which is the primary cause of attenuation of the hydraulic shock wave. The estimation of its value is a very complicated task under real operating conditions. Most methods work much better for large outflows from water supply systems because the effect on flow or pressure parameters is more noticeable. Research results suggest that large outflows are much easier to detect because the “bending” of the curve showing pressure and pressure drops are more visible [20]. One of the most frequently cited drawbacks of transient analysis is the limited number of experiments conducted in operational conditions of network operations and only on laboratory systems, which reduces the implementation reliability of these methods and idealizes the test conditions [13,25]. The reason for this is the inability to simulate short-term transients on an operational, real-world network due to the safety of these systems. Such experiments could cause duct damage and water contamination resulting from backflow [73,74].
Another issue with measurement methods is the proper location of the sensor so that a transition wave of significant power is recorded [15,51]. Too much distance causes attenuation of the wave along its length due to friction (roughness of the duct), so that its energy is dissipated and, consequently, it may not be captured by the sensor. Perelman et al. [75] showed that the main disadvantage of measurement indirect methods is the dependence of their effectiveness on the location and number of measurement devices.
The best effect of detecting the operating conditions of a water supply network using hydraulic modeling can only be obtained by properly calibrating it and using machine learning methods simultaneously [76]. This is evidenced by the results obtained by combining hydraulic modeling with deep neural networks, during which 90% leak detection accuracy was obtained. Although methods based on hydraulic modeling are among the cheapest, they require faithful calibration to obtain reliable results. This requires the use of a densely deployed sensor monitoring network, which is a guarantee of good model quality. Another issue is the use of emergency historical data to create algorithms for warning against abnormal conditions in the future; each uncontrolled water leak has its own specific distribution that affects the characteristics of the pipeline. It does not always generate an unambiguous response in time series. It is also important to estimate the size of the water demand for individual consumers. Only simultaneous water meter readings would allow for an accurate calibration of the model in real time.
6. Conclusions
Previous research that was carried out in the last two decades of the 21st century was focused on trying to solve the problem of failure detection, its localization, the most effective locations of measuring sensors, and minimizing their number. Many authors have also touched upon the issue of appropriate time intervals of the performed measurements. Due to the time-consuming and costly methods of the direct detection of water supply network failures, the world’s research focuses mainly on software solutions based on the analysis of time series of parameters of the water supply network operating status—hydraulic or acoustic phenomena. Devices used in the hardware approach are the domain of commercial companies, which compete in patents for tools for precise leak localization.
None of the methods currently used to detect water main failures are universal. This is due to the specific characteristics of water supply systems. Various methods have numerous advantages and disadvantages and are diverse in terms of implementation costs, speed of failure detection, and the possibility of assessing the amount of water outflow due to an uncontrolled leak.
For these reasons, in the authors’ opinion, failure detection processes should be carried out in two stages. The first one consists of a global detection of failures and the initial selection of their localization by means of software solutions, using the analysis of hydraulic measurements made with high-precision sensors. Next, it is necessary to implement tools for the precise localization of the method in order to detect the place of leakage. These issues are a new field that is subject to continuous scientific and technological development, which gives hope for the application of increasingly recognized advanced methods on a wider scale in the practice of operating water supply networks.
Author Contributions
J.S. conceived of the presented idea. J.S. and E.B.-A. developed the theory and performed the review. All authors discussed the results and contributed to the final manuscript. All authors have read and agreed to the published version of the manuscript.
Funding
This work was supported by Wrocław University of Environmental and Life Sciences (Poland) under the Ph.D. research program Innowacyjny Naukowiec, no. N060/0014/21.
Institutional Review Board Statement
Not applicable.
Informed Consent Statement
Not applicable.
Data Availability Statement
Not applicable.
Acknowledgments
The authors wish to thank Janusz Łomotowski for consultation, valuable comments, and tips.
Conflicts of Interest
The authors declare no conflict of interest.
Appendix A

Table A1.
Overview of experiments carried out in the laboratory for the development of methods of identifying operating conditions (own elaboration).
Table A1.
Overview of experiments carried out in the laboratory for the development of methods of identifying operating conditions (own elaboration).
| Source | Material and Methods, Results |
|---|---|
| Covas et al. (2004) [59] | Type of signal: flow rate, pressure Number of sensors: 1 flow meter, 8 pressure transducers Measurement time step: no data Pipeline characteristics: pipe material—PE, pipe length—277 m, internal diameter—50.6 mm Leak size: 0.10–0.55 dm3/s Methods: optimization techniques Levenberg–Marquart (LM), genetic algorithm (GA), hydraulic transient solver (HTS) Error of leak location: 0.3–13.0% |
| Bratek and Turkowski (2012) [77] | Type of signal: pressure Number of sensors: 2 Measurement time step: 1 s Pipeline characteristics: pipe material—PE, pipe length—380 m, nominal diameter—34 mm Leak size: 2–5% QN Methods: low-pass filter (LPF), gradient method (GM) Error of leak location: 0.09–1.45% |
| Gamboa-Medina et al. (2014) [63] | Type of signal: pressure Number of sensors: 15 Measurement time step: 0.25 s Pipeline characteristics: pipe material—PVC, pipe length—200 m, nominal diameter—53–101 mm Leak size: <3% and >11% QN Methods: wavelet transform (WT)—Daubechies wavelet, feature extraction (FE) |
| Rashid et al. (2014) [20] | Type of signal: pressure Number of sensors: 6 Measurement time step: 0.1 s Pipeline characteristics: pipe material—galvanized steel, pipe length—14.2 m, nominal diameter—50.80 mm Leak size: area 6.35–38.10 mm2 Methods: wavelet transform (WT)—Daubechies, Haar, Symlet wavelet |
| Zhang et al. (2015) [22] | Type of signal: flow rate, pressure Number of sensors: 2 flow meters, 2 pressure transducers Measurement time step: <0.001 s Pipeline characteristics: pipe material—steel, pipe length—14 m, internal diameter—500 mm Leak size: opening of valve from 30° to 60° Methods: hybrid technique (the stimulus response method) Error of leak location: 5–8% |
| Rashid et al. (2015) [60] | Type of signal: pressure Number of sensors: 5 pressure transducers Measurement time step: 0.1 s Pipeline characteristics: pipe material—galvanized steel, pipe length—14.2 m, nominal diameter—50.80 mm Leak size: area 6.35–38.10 mm2 Methods: wavelet transform (WT)—Daubechies, support vector machine (SVM), k-nearest neighbors algorithm (k-NN), naive Bayes classifier (NBC), Gaussian mixture model (GMM) |
| Ostapkowicz (2016) [78] | Type of signal: pressure Number of sensors: 2 pressure transducers, 2 membrane correctors Measurement time step: 1 s Pipeline characteristics: pipe material—HDPE, pipe length—380 m, internal diameter—34 mm Leak size: 1–10% QN Methods: gradient method (GM), analysis of weak inter-object interaction signals Error of leak location: 2.4–65.5% |
| Pan et al. (2021) [79] | Type of signal: pressure Sensors: pressure transducers Sampling frequency: 1024 Hz Pipeline characteristics: pipe material—HDPE, pipe length—166.28 m, internal diameter—0.0933 m Leak size: 0.327 L/s Methods: frequency response function (FRF)-based transient wave analysis method (TWAM) |
Table A2.
Overview of experiments carried out in field conditions for the development of methods of identifying operating conditions (own elaboration).
Table A2.
Overview of experiments carried out in field conditions for the development of methods of identifying operating conditions (own elaboration).
| Source | Material and Methods, Results |
|---|---|
| Misiunas et al. (2005) [11] | Type of signal: pressure Number of sensors: 3 Measurement time step: 0.005 s Pipeline characteristics: 108 pipes, pipe material—asbestos cement, pipe length—70–210 m, nominal diameter—100–250 mm Leak size: area 2.0 mm2 Methods: recursive least squares (RLS), cumulative sum control chart (CUSUM) |
| Ye and Fenner (2011) [80] | Type of signal: flow rate, pressure Number of sensors: 1 flow meter, 1 pressure transducer Measurement time step: 15 min. Pipeline characteristics: DMA, pipe length—17.8 km, 897 house connections, 28 industrial connections Leak size: 6.2 dm3/s Methods: Kalman filter (KF) |
| Eliades and Polycarpou (2012) [50] | Type of signal: flow rate Number of sensors: 1 Measurement time step: 5 min Pipeline characteristics: DMA Leak size: 0.14 dm3/s Methods: Fourier transform (FT), cumulative sum control chart (CUSUM) |
| Srirangarajan et al. (2013) [62] | Type of signal: pressure Number of sensors: 3 Measurement time step: 0.004 s Pipeline characteristics: pipe material—steel, nominal diameter—500 mm, pipe material—ductile iron, nominal diameter—300 mm, research area 1 km2 Leak size: 5 dm3/s, 9 dm3/s Methods: wavelet transform (WT), graph-based localization algorithm, cumulative sum control chart (CUSUM) |
| Okeya et al. (2014) [52] | Type of signal: flow rate, pressure Number of sensors: 3 flow meters, 1 pressure transducer Measurement time step: 15 min Pipeline characteristics: DMA, 238 pipes, 305 junctions Methods: Kalman filter (KF) |
| Kim et al. (2015, 2016) [21,24] | Type of signal: pressure Number of sensors: 3 and 6 Measurement time step: 0.04 s Pipeline characteristics: first DMA: pipe length—7267 m, 861 junctions; second DMA: pipe length—10,168 m, 1154 junctions Leak size: 3 dm3/s Methods: Kalman filter (KF), statistical analysis Error of leak location: 55 m and 161 m |
| Wu et al. (2016) [54] | Type of signal: flow rate Number of sensors: 5 Measurement time step: 5 min Pipeline characteristics: DMA, research area—6.5 km2, nominal diameter—400–1000 mm Leak size: 60–120 dm3/s Methods: cluster analysis (CA) Accuracy of leak location: 71.43% |
| Silva et al. (2018) [44] | Type of signal: flow rate Case study: 87,383 customers, 66,648 customers Methods: water balance, high-density regions (HDR), delta method, Monte Carlo simulations |
References
- Voskamp, I.M.; Sutton, N.B.; Stremke, S.; Rijnaarts, H.H. A Systematic Review of Factors Influencing Spatiotemporal Variability in Urban Water and Energy Consumption. J. Clean. Prod. 2020, 256, 120310. [Google Scholar] [CrossRef]
- Ioannou, A.E.; Creaco, E.F.; Laspidou, C.S. Exploring the Effectiveness of Clustering Algorithms for Capturing Water Consumption Behavior at Household Level. Sustainability 2021, 13, 2603. [Google Scholar] [CrossRef]
- Barton, N.A.; Farewell, T.S.; Hallett, S.H.; Acland, T.F. Improving Pipe Failure Predictions: Factors Affecting Pipe Failure in Drinking Water Networks. Water Res. 2019, 164, 114926. [Google Scholar] [CrossRef] [PubMed]
- Altowayti, W.A.; Othman, N.; Tajarudin, H.A.; Al-Dhaqm, A.; Asharuddin, S.M.; Al-Gheethi, A.; Alshalif, A.F.; Salem, A.A.; Din, M.F.; Fitriani, N.; et al. Evaluating the Pressure and Loss Behavior in Water Pipes Using Smart Mathematical Modelling. Water 2021, 13, 3500. [Google Scholar] [CrossRef]
- Pietrucha-Urbanik, K.; Rak, J.R. Consumers’ Perceptions of the Supply of Tap Water in Crisis Situations. Energies 2020, 13, 3617. [Google Scholar] [CrossRef]
- Motiee, H.; Ghasemnejad, S. Prediction of Pipe Failure Rate in Tehran Water Distribution Networks by Applying Regression Models. Water Supply 2019, 19, 695–702. [Google Scholar] [CrossRef] [Green Version]
- Kalbusch, A.; Henning, E.; Brikalski, M.P.; de Luca, F.V.; Konrath, A.C. Impact of Coronavirus (COVID-19) Spread-Prevention Actions on Urban Water Consumption. Resour. Conserv. Recycl. 2020, 163, 105098. [Google Scholar] [CrossRef] [PubMed]
- Tariq, S.; Hu, Z.; Zayed, T. Micro-Electromechanical Systems-Based Technologies for Leak Detection and Localization in Water Supply Networks: A Bibliometric and Systematic Review. J. Clean. Prod. 2020, 289, 125751. [Google Scholar] [CrossRef]
- Dzimińska, P.; Drzewiecki, S.; Ruman, M.; Kosek, K.; Mikołajewski, K.; Licznar, P. The Use of Cluster Analysis to Evaluate the Impact of COVID-19 Pandemic on Daily Water Demand Patterns. Sustainability 2021, 13, 5772. [Google Scholar] [CrossRef]
- Wang, X.-J.; Lambert, M.F.; Simpson, A.R.; Vítkovský, J.P. Leak Detection in Pipeline Systems and Networks: A Review. In Proceedings of the 6th Conference on Hydraulics in Civil Engineering, Hobart, Australia, 28–30 November 2001; pp. 391–400. [Google Scholar]
- Misiunas, D.; Lambert, M.; Simpson, A.; Olsson, G. Burst Detection and Location in Water Distribution Networks. Water Sci. Technol. Water Supply 2005, 5, 71–80. [Google Scholar] [CrossRef]
- Koral, W. Metodyka Obniżania Poziomu Przecieków w Sieciach Wodociągowych. Wodociągi-Kanalizacja 2006, 6, 26–29. (In Polish) [Google Scholar]
- Colombo, A.F.; Lee, P.; Karney, B.W. A Selective Literature Review of Transient-Based Leak Detection Methods. J. Hydro-Environ. Res. 2009, 2, 212–227. [Google Scholar] [CrossRef]
- Ostapkowicz, P. Improving the Efficiency of Diagnosing of Leaks from Liquid Transmission Pipelines by Using the New Diagnostic Information–the Signals of Weak Interactions between Objects. In Proceedings of the Solid State Phenomena; Trans Tech Publications: Zurich, Switzerland, 2009; Volume 147, pp. 492–497. [Google Scholar] [CrossRef]
- Puust, R.; Kapelan, Z.; Savic, D.; Koppel, T. A Review of Methods for Leakage Management in Pipe Networks. Urban Water J. 2010, 7, 25–45. [Google Scholar] [CrossRef]
- Ghazali, M.F. Leak Detection Using Instantaneous Frequency Analysis. Ph.D. Thesis, University of Sheffield, Sheffield, UK, 2012. [Google Scholar]
- Wan, J.; Yu, Y.; Wu, Y.; Feng, R.; Yu, N. Hierarchical Leak Detection and Localization Method in Natural Gas Pipeline Monitoring Sensor Networks. Sensors 2012, 12, 189–214. [Google Scholar] [CrossRef] [PubMed] [Green Version]
- Piechurski, F.G. Urządzenia Do Wyszukiwania Wycieków. Wodociągi-Kanalizacja 2013, 40, 42–45. (In Polish) [Google Scholar]
- Bakker, M.; Jung, D.; Vreeburg, J.; Van de Roer, M.; Lansey, K.; Rietveld, L. Detecting Pipe Bursts Using Heuristic and CUSUM Methods. Procedia Eng. 2014, 70, 85–92. [Google Scholar] [CrossRef] [Green Version]
- Rashid, S.; Qaisar, S.; Saeed, H.; Felemban, E. A Method for Distributed Pipeline Burst and Leakage Detection in Wireless Sensor Networks Using Transform Analysis. Int. J. Distrib. Sens. Netw. 2014, 10, 939657. [Google Scholar] [CrossRef] [Green Version]
- Kim, Y.; Lee, S.J.; Park, T.; Lee, G.; Suh, J.C.; Lee, J.M. Robust Leakage Detection and Interval Estimation of Location in Water Distribution Network. IFAC-PapersOnLine 2015, 48, 1264–1269. [Google Scholar] [CrossRef]
- Zhang, T.; Tan, Y.; Zhang, X.; Zhao, J. A Novel Hybrid Technique for Leak Detection and Location in Straight Pipelines. J. Loss Prev. Process Ind. 2015, 35, 157–168. [Google Scholar] [CrossRef]
- Datta, S.; Sarkar, S. A Review on Different Pipeline Fault Detection Methods. J. Loss Prev. Process Ind. 2016, 41, 97–106. [Google Scholar] [CrossRef]
- Kim, Y.; Lee, S.J.; Park, T.; Lee, G.; Suh, J.C.; Lee, J.M. Robust Leak Detection and Its Localization Using Interval Estimation for Water Distribution Network. Comput. Chem. Eng. 2016, 92, 1–17. [Google Scholar] [CrossRef]
- Miszta-Kruk, K. Wykorzystanie Krótkotrwałych Stanów Przejściowych w Sieciach Wodociągowych Do Wykrywania Wycieków Wody. Ochrona Środowiska 2016, 38, 39–43. (In Polish) [Google Scholar]
- Choi, J.; Shin, J.; Song, C.; Han, S.; Park, D.I. Leak Detection and Location of Water Pipes Using Vibration Sensors and Modified ML Prefilter. Sensors 2017, 17, 2104. [Google Scholar] [CrossRef] [PubMed] [Green Version]
- Hashim, H.; Ryan, P.; Clifford, E. A Statistically Based Fault Detection and Diagnosis Approach for Non-Residential Building Water Distribution Systems. Adv. Eng. Inform. 2020, 46, 101187. [Google Scholar] [CrossRef]
- Khulief, Y.A.; Khalifa, A.; Mansour, R.B.; Habib, M.A. Acoustic Detection of Leaks in Water Pipelines Using Measurements inside Pipe. J. Pipeline Syst. Eng. Pract. 2012, 3, 47–54. [Google Scholar] [CrossRef]
- Mostafapour, A.; Davoodi, S. Continuous Leakage Location in Noisy Environment Using Modal and Wavelet Analysis with One AE Sensor. Ultrasonics 2015, 62, 305–311. [Google Scholar] [CrossRef] [PubMed]
- Meinert, D.; Gorny, M.; Pollmann, A.; Chen, J.-W.; Garbi, A. Monitoring Acoustic Noise in Steel Pipelines. In Proceedings of the International Pipeline Conference, Calgary, AB, Canada, 29 September–3 October 2008; Volume 48579, pp. 509–516. [Google Scholar] [CrossRef]
- Thien, H.D.; Tamás, M.; Molnár, J. Investigation Methods for Pipe Line Tracing on University Campus, and Leakage Detecting in Water Utility Networks: A Case Study in Miskolc. Adv. Environ. Sci. 2017, 9, 193–206. [Google Scholar]
- Gao, Y.; Brennan, M.J.; Joseph, P.F.; Muggleton, J.M.; Hunaidi, O. A Model of the Correlation Function of Leak Noise in Buried Plastic Pipes. J. Sound Vib. 2004, 277, 133–148. [Google Scholar] [CrossRef]
- Guo, C.; Wen, Y.; Li, P.; Wen, J. Adaptive Noise Cancellation Based on EMD in Water-Supply Pipeline Leak Detection. Measurement 2016, 79, 188–197. [Google Scholar] [CrossRef]
- Hunaidi, O.; Chu, W.T. Acoustical Characteristics of Leak Signals in Plastic Water Distribution Pipes. Appl. Acoust. 1999, 58, 235–254. [Google Scholar] [CrossRef] [Green Version]
- Sadeghioon, A.M.; Metje, N.; Chapman, D.N.; Anthony, C.J. SmartPipes: Smart Wireless Sensor Networks for Leak Detection in Water Pipelines. J. Sens. Actuator Netw. 2014, 3, 64–78. [Google Scholar] [CrossRef]
- Thiberville, C.; Wang, Y.; Waltrich, P.; Williams, W.; Kam, S.I. Modeling of Smart Pigging for Pipeline Leak Detection. SPE Prod. Oper. 2020, 35, 610–627. [Google Scholar] [CrossRef]
- Fletcher, R.; Chandrasekaran, M. SmartBallTM: A New Approach in Pipeline Leak Detection. In Proceedings of the International Pipeline Conference, Calgary, AB, Canada, 29 September–3 October 2008; Volume 48586, pp. 117–133. [Google Scholar] [CrossRef]
- Bunn, F.; Zannin, P.H.T. Assessment of Railway Noise in an Urban Setting. Appl. Acoust. 2016, 104, 16–23. [Google Scholar] [CrossRef]
- Shakmak, B.; Al-Habaibeh, A. Detection of Water Leakage in Buried Pipes Using Infrared Technology; a Comparative Study of Using High and Low Resolution Infrared Cameras for Evaluating Distant Remote Detection. In Proceedings of the 2015 IEEE Jordan Conference on Applied Electrical Engineering and Computing Technologies (AEECT), Amman, Jordan, 3–5 November 2015; IEEE: Piscataway, NJ, USA, 2015; pp. 1–7. [Google Scholar] [CrossRef] [Green Version]
- Kapelan, Z.S.; Savic, D.A.; Walters, G.A. A Hybrid Inverse Transient Model for Leakage Detection and Roughness Calibration in Pipe Networks. J. Hydraul. Res. 2003, 41, 481–492. [Google Scholar] [CrossRef]
- Ahopelto, S.; Vahala, R. Cost–Benefit Analysis of Leakage Reduction Methods in Water Supply Networks. Water 2020, 12, 195. [Google Scholar] [CrossRef] [Green Version]
- Lambert, A.O. International Report: Water Losses Management and Techniques. Water Sci. Technol. Water Supply 2002, 2, 1–20. [Google Scholar] [CrossRef] [Green Version]
- Knobloch, A.; Guth, N.; Klingel, P. Automated Water Balance Calculation for Water Distribution Systems. Procedia Eng. 2014, 89, 428–436. [Google Scholar] [CrossRef] [Green Version]
- Silva, M.A.; Amado, C.; Loureiro, D. Propagation of Uncertainty in the Water Balance Calculation in Urban Water Supply Systems–A New Approach Based on High-Density Regions. Measurement 2018, 126, 356–368. [Google Scholar] [CrossRef]
- Zyoud, S.H.; Kaufmann, L.G.; Shaheen, H.; Samhan, S.; Fuchs-Hanusch, D. A Framework for Water Loss Management in Developing Countries under Fuzzy Environment: Integration of Fuzzy AHP with Fuzzy TOPSIS. Expert Syst. Appl. 2016, 61, 86–105. [Google Scholar] [CrossRef]
- Bianchi, L.; Antonacci, F.; Sarti, A.; Tubaro, S. Model-Based Acoustic Rendering Based on Plane Wave Decomposition. Appl. Acoust. 2016, 104, 127–134. [Google Scholar] [CrossRef]
- Tariq, A.-K.; Ziyad, A.-T.; Abdullah, A.-O. Wireless Sensor Networks for Leakage Detection in Underground Pipelines: A Survey Paper. Procedia Comput. Sci. 2013, 21, 491–498. [Google Scholar] [CrossRef] [Green Version]
- Ravichandran, T.; Gavahi, K.; Ponnambalam, K.; Burtea, V.; Mousavi, S.J. Ensemble-Based Machine Learning Approach for Improved Leak Detection in Water Mains. J. Hydroinform. 2021, 23, 307–323. [Google Scholar] [CrossRef]
- Łomotowski, J.; Siwoń, Z. Metodyka Analizy Danych Pochodzących z Monitoringu Systemów Wodociągowych i Kanalizacyjnych. Gaz Woda i Technika Sanitarna 2010, 3, 16–20. (In Polish) [Google Scholar]
- Eliades, D.G.; Polycarpou, M.M. Leakage Fault Detection in District Metered Areas of Water Distribution Systems. J. Hydroinform. 2012, 14, 992–1005. [Google Scholar] [CrossRef] [Green Version]
- Oven, S. Leak Detection in Pipelines by the Use of State and Parameter Estimation. Master’s Thesis, Norges Teknisk-NaturvitEnskapelige Universitet, Trondheim, Norway, 2014. [Google Scholar]
- Okeya, I.; Kapelan, Z.; Hutton, C.; Naga, D. Online Burst Detection in a Water Distribution System Using the Kalman Filter and Hydraulic Modelling. Procedia Eng. 2014, 89, 418–427. [Google Scholar] [CrossRef] [Green Version]
- Sun, J.; Wang, R.; Wang, X.; Yang, H.; Ping, J. Spatial Cluster Analysis of Bursting Pipes in Water Supply Networks. Procedia Eng. 2014, 70, 1610–1618. [Google Scholar] [CrossRef] [Green Version]
- Wu, Y.; Liu, S.; Wu, X.; Liu, Y.; Guan, Y. Burst Detection in District Metering Areas Using a Data Driven Clustering Algorithm. Water Res. 2016, 100, 28–37. [Google Scholar] [CrossRef]
- Ghidaoui, M.S.; Zhao, M.; McInnis, D.A.; Axworthy, D.H. A Review of Water Hammer Theory and Practice. Appl. Mech. Rev. 2005, 58, 49–76. [Google Scholar] [CrossRef]
- Pudar, R.S.; Liggett, J.A. Leaks in Pipe Networks. J. Hydraul. Eng. 1992, 118, 1031–1046. [Google Scholar] [CrossRef]
- Liggett, J.A.; Chen, L.-C. Inverse Transient Analysis in Pipe Networks. J. Hydraul. Eng. 1994, 120, 934–955. [Google Scholar] [CrossRef]
- Covas, D.; Ramos, H. Hydraulic Transients Used for Leakage Detection in Water Distribution Systems. In Proceedings of the 4th Conference on Water Pipeline Systems: Managing Pipeline Assets in an Evolving Market, York, UK, 28–30 March 2001; pp. 227–241. [Google Scholar]
- Covas, D.; Ramos, H.; Graham, N.; Maksimovic, C. Application of Hydraulic Transients for Leak Detection in Water Supply Systems. Water Sci. Technol. Water Supply 2004, 4, 365–374. [Google Scholar] [CrossRef]
- Rashid, S.; Akram, U.; Khan, S.A. WML: Wireless Sensor Network Based Machine Learning for Leakage Detection and Size Estimation. Procedia Comput. Sci. 2015, 63, 171–176. [Google Scholar] [CrossRef] [Green Version]
- Guo, X.; Yang, K.; Guo, Y. Hydraulic Pressure Signal Denoising Using Threshold Self-Learning Wavelet Algorithm. J. Hydrodynam. B 2008, 20, 433–439. [Google Scholar] [CrossRef]
- Srirangarajan, S.; Allen, M.; Preis, A.; Iqbal, M.; Lim, H.B.; Whittle, A.J. Wavelet-Based Burst Event Detection and Localization in Water Distribution Systems. J. Signal Process. Syst. 2013, 72, 1–16. [Google Scholar] [CrossRef] [Green Version]
- Gamboa-Medina, M.M.; Reis, L.R.; Guido, R.C. Feature Extraction in Pressure Signals for Leak Detection in Water Networks. Procedia Eng. 2014, 70, 688–697. [Google Scholar] [CrossRef] [Green Version]
- Bergant, A.; Tijsseling, A.; Vítkovský, J.; Covas, D.; Simpson, A.; Lambert, M. Further Investigation of Parameters Affecting Water Hammer Wave Attenuation, Shape and Timing. Part 2: Case Studies. In Proceedings of the 11th International Meeting of the IAHR Work Group on the Behaviour of Hydraulic Machinery under Steady Oscillatory Conditions, Stuttgart, Germany, 8–10 October 2003. [Google Scholar]
- Brown, K. Modeling Leakage in Water Distribution Systems. Master’s Thesis, The Florida University, Gainesville, FL, USA, 2007. [Google Scholar]
- Islam, M.S.; Sadiq, R.; Rodriguez, M.J.; Francisque, A.; Najjaran, H.; Hoorfar, M. Leakage Detection and Location in Water Distribution Systems Using a Fuzzy-Based Methodology. Urban Water J. 2011, 8, 351–365. [Google Scholar] [CrossRef]
- Li, W.; Ling, W.; Liu, S.; Zhao, J.; Liu, R.; Chen, Q.; Qiang, Z.; Qu, J. Development of Systems for Detection, Early Warning, and Control of Pipeline Leakage in Drinking Water Distribution: A Case Study. J. Environ. Sci. 2011, 23, 1816–1822. [Google Scholar] [CrossRef]
- Karadirek, I.E.; Kara, S.; Yilmaz, G.; Muhammetoglu, A.; Muhammetoglu, H. Implementation of Hydraulic Modelling for Water-Loss Reduction through Pressure Management. Water Resour. Manag. 2012, 26, 2555–2568. [Google Scholar] [CrossRef]
- Demirci, S.; Yigit, E.; Eskidemir, I.H.; Ozdemir, C. Ground Penetrating Radar Imaging of Water Leaks from Buried Pipes Based on Back-Projection Method. NDT E Int. 2012, 47, 35–42. [Google Scholar] [CrossRef]
- Atef, A.; Zayed, T.; Hawari, A.; Khader, M.; Moselhi, O. Multi-Tier Method Using Infrared Photography and GPR to Detect and Locate Water Leaks. Autom. Constr. 2016, 61, 162–170. [Google Scholar] [CrossRef]
- Yu, W.; Wang, X.; Wu, R.; Yu, J.; Jiang, Z.; Mao, D. Wave Propagation in a Waveguide with Continuous Right-Angled Corners: Numerical Simulations and Experiment Measurements. Appl. Acoust. 2016, 104, 6–15. [Google Scholar] [CrossRef]
- Liu, H.; Zhu, Y.; Pei, S.; Savić, D.; Fu, G.; Zhang, C.; Yuan, Y.; Zhang, J. Flow Regime Identification for Air Valves Failure Evaluation in Water Pipelines Using Pressure Data. Water Res. 2019, 165, 115002. [Google Scholar] [CrossRef] [PubMed]
- Di Nardo, A.; Di Natale, M.; Guida, M.; Musmarra, D. Water Network Protection from Intentional Contamination by Sectorization. Water Resour. Manag. 2013, 27, 1837–1850. [Google Scholar] [CrossRef]
- Fox, S.; Shepherd, W.; Collins, R.; Boxall, J. Experimental Proof of Contaminant Ingress into a Leaking Pipe during a Transient Event. Procedia Eng. 2014, 70, 668–677. [Google Scholar] [CrossRef]
- Perelman, L.S.; Abbas, W.; Koutsoukos, X.; Amin, S. Sensor Placement for Fault Location Identification in Water Networks: A Minimum Test Cover Approach. Automatica 2016, 72, 166–176. [Google Scholar] [CrossRef] [Green Version]
- Quiñones-Grueiro, M.; Milián, M.A.; Rivero, M.S.; Neto, A.J.S.; Llanes-Santiago, O. Robust Leak Localization in Water Distribution Networks Using Computational Intelligence. Neurocomputing 2021, 438, 195–208. [Google Scholar] [CrossRef]
- Bratek, A.; Turkowski, M. Analytical System of Leak Detection and Localization for Long Range Liquid Pipelines. Pomiary Automatyka Kontrola 2012, 58, 15–18. [Google Scholar]
- Ostapkowicz, P. Leak Detection in Liquid Transmission Pipelines Using Simplified Pressure Analysis Techniques Employing a Minimum of Standard and Non-Standard Measuring Devices. Eng. Struct. 2016, 113, 194–205. [Google Scholar] [CrossRef]
- Pan, B.; Duan, H.-F.; Meniconi, S.; Brunone, B. FRF-Based Transient Wave Analysis for the Viscoelastic Parameters Identification and Leak Detection in Water-Filled Plastic Pipes. Mech. Syst. Signal Process. 2021, 146, 107056. [Google Scholar] [CrossRef]
- Ye, G.; Fenner, R.A. Kalman Filtering of Hydraulic Measurements for Burst Detection in Water Distribution Systems. J. Pipeline Syst. Eng. Pract. 2011, 2, 14–22. [Google Scholar] [CrossRef]
Figure 1.
The methodology scheme.

Figure 2.
The evolution of the number of publications per year.

Figure 3.
The word cloud chart for detection methods of water supply systems.

Figure 4.
The diagnosis methods of water supply networks used by selected researchers.

Figure 5.
Proposed classification of methods for detection of water supply network operating conditions (own elaboration).
Figure 5.
Proposed classification of methods for detection of water supply network operating conditions (own elaboration).

Publisher’s Note: MDPI stays neutral with regard to jurisdictional claims in published maps and institutional affiliations. |
© 2022 by the authors. Licensee MDPI, Basel, Switzerland. This article is an open access article distributed under the terms and conditions of the Creative Commons Attribution (CC BY) license (https://creativecommons.org/licenses/by/4.0/).
Share and Cite
MDPI and ACS Style
Stańczyk, J.; Burszta-Adamiak, E. Development of Methods for Diagnosing the Operating Conditions of Water Supply Networks over the Last Two Decades. Water 2022, 14, 786. https://doi.org/10.3390/w14050786
AMA Style
Stańczyk J, Burszta-Adamiak E. Development of Methods for Diagnosing the Operating Conditions of Water Supply Networks over the Last Two Decades. Water. 2022; 14(5):786. https://doi.org/10.3390/w14050786
Chicago/Turabian StyleStańczyk, Justyna, and Ewa Burszta-Adamiak. 2022. "Development of Methods for Diagnosing the Operating Conditions of Water Supply Networks over the Last Two Decades" Water 14, no. 5: 786. https://doi.org/10.3390/w14050786
Note that from the first issue of 2016, this journal uses article numbers instead of page numbers. See further details here.