Article

Ecological Assessment, Spatial Analysis, and Potential Sources of Heavy Metals (HMs) in Soils with High Background Values in the Lead-Zinc Mine, Hezhang County, Southwestern China

1
Institute of Geophysical & Geochemical Exploration, Chinese Academy of Geological Sciences, Langfang 065000, China
2
Key Laboratory of Geochemical Cycling of Carbon and Mercury in the Earth’s Critical Zone, Chinese Academy of Geological Sciences, Langfang 065000, China
3
College of Earth Sciences, Chengdu University of Technology, Chengdu 610059, China
*
Authors to whom correspondence should be addressed.
Water 2022, 14(5), 783; https://doi.org/10.3390/w14050783
Submission received: 18 January 2022 / Revised: 18 February 2022 / Accepted: 28 February 2022 / Published: 2 March 2022

Abstract

:
The heavy metals (HMs) usually have high natural background levels in lead-zinc mines. Strengthening the ecological risk assessment and accurate identification sources of HMs is an important component of land resource utilization and food security. A total of 795 soil samples (with a depth of 0~20 cm) were collected in Hezhang County, an area of typical high background levels of HMs with more than 18 large lead-zinc deposits. In this study, inductively coupled plasma emission spectrometry (ICP-OES), inductively coupled plasma mass spectrometry (ICP-MS), atomic fluorescence spectrometry (AFS), and the potentiometric method (POT) were used to test the total concentration of HMs and pH values. The geographic information system was used to model the concentration distribution of HMs, and the ecological risk was assessed according to the source analysis results. The results suggest that: (1) the mean concentration of As, Cd, Cr, Cu, Hg, Ni, Pb, and Zn were 24.55, 2.25, 176.4, 89.6, 0.19, 64.2, 102, and 257 mg·kg−1, respectively, which exceeded the average background value of soils in Guizhou Province by 1.23, 3.41, 1.84, 2.80, 1.73, 1.64, 2.90, and 2.58 times, respectively, and the average concentrations of Cd, Cr, Cu, Ni, Pb and Zn exceed the screening values specified in soil contamination risk in agricultural land; (2) the results of enrichment factor (EF) showed that 29.73% of Cd are moderately polluted, and other HMs were slightly polluted in a small area or near the baseline value (EF ≈ 1); and (3) PMF analysis showed that there are five main sources, pyrite, lead-zinc ore, basalt, carbonate rock, and agricultural production, with the risk contribution ratios of 5.25%, 27.37%, 28.94%, 17.91%, and 20.53%, respectively.

1. Introduction

Soil is the basis for agricultural production and human survival, and it is also the guarantee for human food and the ecological environment [1]. With the development of industry and the continuous expansion of urbanization in recent years, the problem of soil pollution caused by heavy metals (HMs) has become a hot issue in modern society [2,3]. The HMs with persistent and irreversible characteristics will pose significant risks to human health and the ecosystem [4,5,6]. When HMs in the soil are transformed into ionic form and enter into the crops, they are then introduced into the human body through the food chain, which may cause serious harmful impacts on human health [7,8,9,10,11,12,13]. In view of the above problems, many government departments, such as the United States Environmental Protection Agency (USEPA) and the Ministry of Ecology and Environment of China (MEE), have formulated the maximum allowable limits of HMs in agricultural soils to protect environmental quality and human health [14].
China’s economy has grown rapidly, with an increasingly prominent soil pollution problem. China has been suffering from severe heavy metals pollution [9,15,16]; that is, about 10 million hectares of cultivated land have been polluted by HMs, and 12 million tons of grain by excessive HMs [17]. According to the open report of the China Geological Survey (CGS), the combined proportion of survey spots with moderate and heavy pollution in China accounts for 2.5%, covering an area of 23,300 km2 [18]. The geochemical survey of land quality (GSLQ), as a new national geochemical mapping project implemented by the Ministry of Natural Resources of China, has made significant contributions to the prevention and control of soil pollution, land resource management, agricultural plan structure, and targeted poverty alleviation [11,19,20,21,22,23]. Funded by this project, the ecological risk assessment of HMs has been carried out in Southwest China, where a complex geological background and multiple ecological factors affect the environment. Carbonate and basalt are widely distributed, and HMs have inherent high background levers [24].
The China Cultivated Land Geochemical Survey Report (CCLGSR) shows that the area of polluted cultivated land has been found to total 2.195 million hectares in Southwest China, accounting for 28.9% of the total polluted cultivated land in China [18]. The GSLQ also confirmed that the high HM background in Southwest China is closely related to the special geological process in this area. Most HMs are in the form of “high background and low bioavailability” [25]. In the natural state, the HM bioavailability is low. However, with the increasing human activities and the changed type of land use, the physical and chemical properties and configuration of soil change, causing the bioavailability of HMs to increase, putting agricultural products at high risk [26]. Therefore, ecological environment risk assessment and contamination sources identification are necessary for bettering the soil environment and protecting human health.
The quantitative identification of the sources of HMs is important for controlling pollutants [27,28]. Based on Geographical Information System (GIS), the spatial distribution of HMs can precisely reflect the HMs pollution and identify the “hotspots”. The main methods for identifying the sources of heavy metals include principal component analysis (PCA), isotope labeling (IL), multivariate statistical analyses (MSA), cluster analyses (CA), and chemical mass balance (CMB) [29,30,31,32], which have their own advantages and disadvantages in practical application [33,34,35]. To quantify the source of HMs accurately and comprehensively in soil, this study used positive matrix factorization (PMF); the PMF does not need the complex mass spectra, and not only limits the decomposition matrix elements and guarantees the partake rate to be non-negative, but also deals with missing and inaccurate data. The model has been used in the quantitative source apportionment of pollutants in the atmosphere [36,37] and sediment [38,39,40], and has begun to be used in soil HM source apportionment in the last few years [41,42].
Guizhou Province is located in the southwest of China. Hezhang County, a typical mineral county in Guizhou Province, is the study area. The GSLQ Project shows that the county has the highest concentration of HMs in the soil of Guizhou Province. There are 18 large lead-zinc mines and iron mines, and the old-fashioned activities of zinc smelting have lasted for many years, and with high ecological risk. The emissions of Cd and Zn in the study area are high [43], and the concentration of Pb and Zn in corn grain exceed the national food limit value [44], which poses potential ecological risks to human health. However, the pollution level and ecological risk in the study area is unknown, and the boundary of ecological risks is unclear, so it is urgent to carry out soil pollution and ecological risk assessment. The three main objectives of this study were (1) to investigate the concentration distribution of HMs in topsoil in Hezhang County, (2) to analyze the potential source of pollution and quantify their contributions using the PMF model combined with geological background, mining activity, and land use investigation, and (3) to assess ecological risks through the distribution and potential sources of HMs. This research elected Hezhang County, with its high geological background and mining activity dual risk, as a case study, and will provide information on how the relationship between ecological risks and geological background, parent materials, mining activity, will ensure food security.

2. Materials and Methods
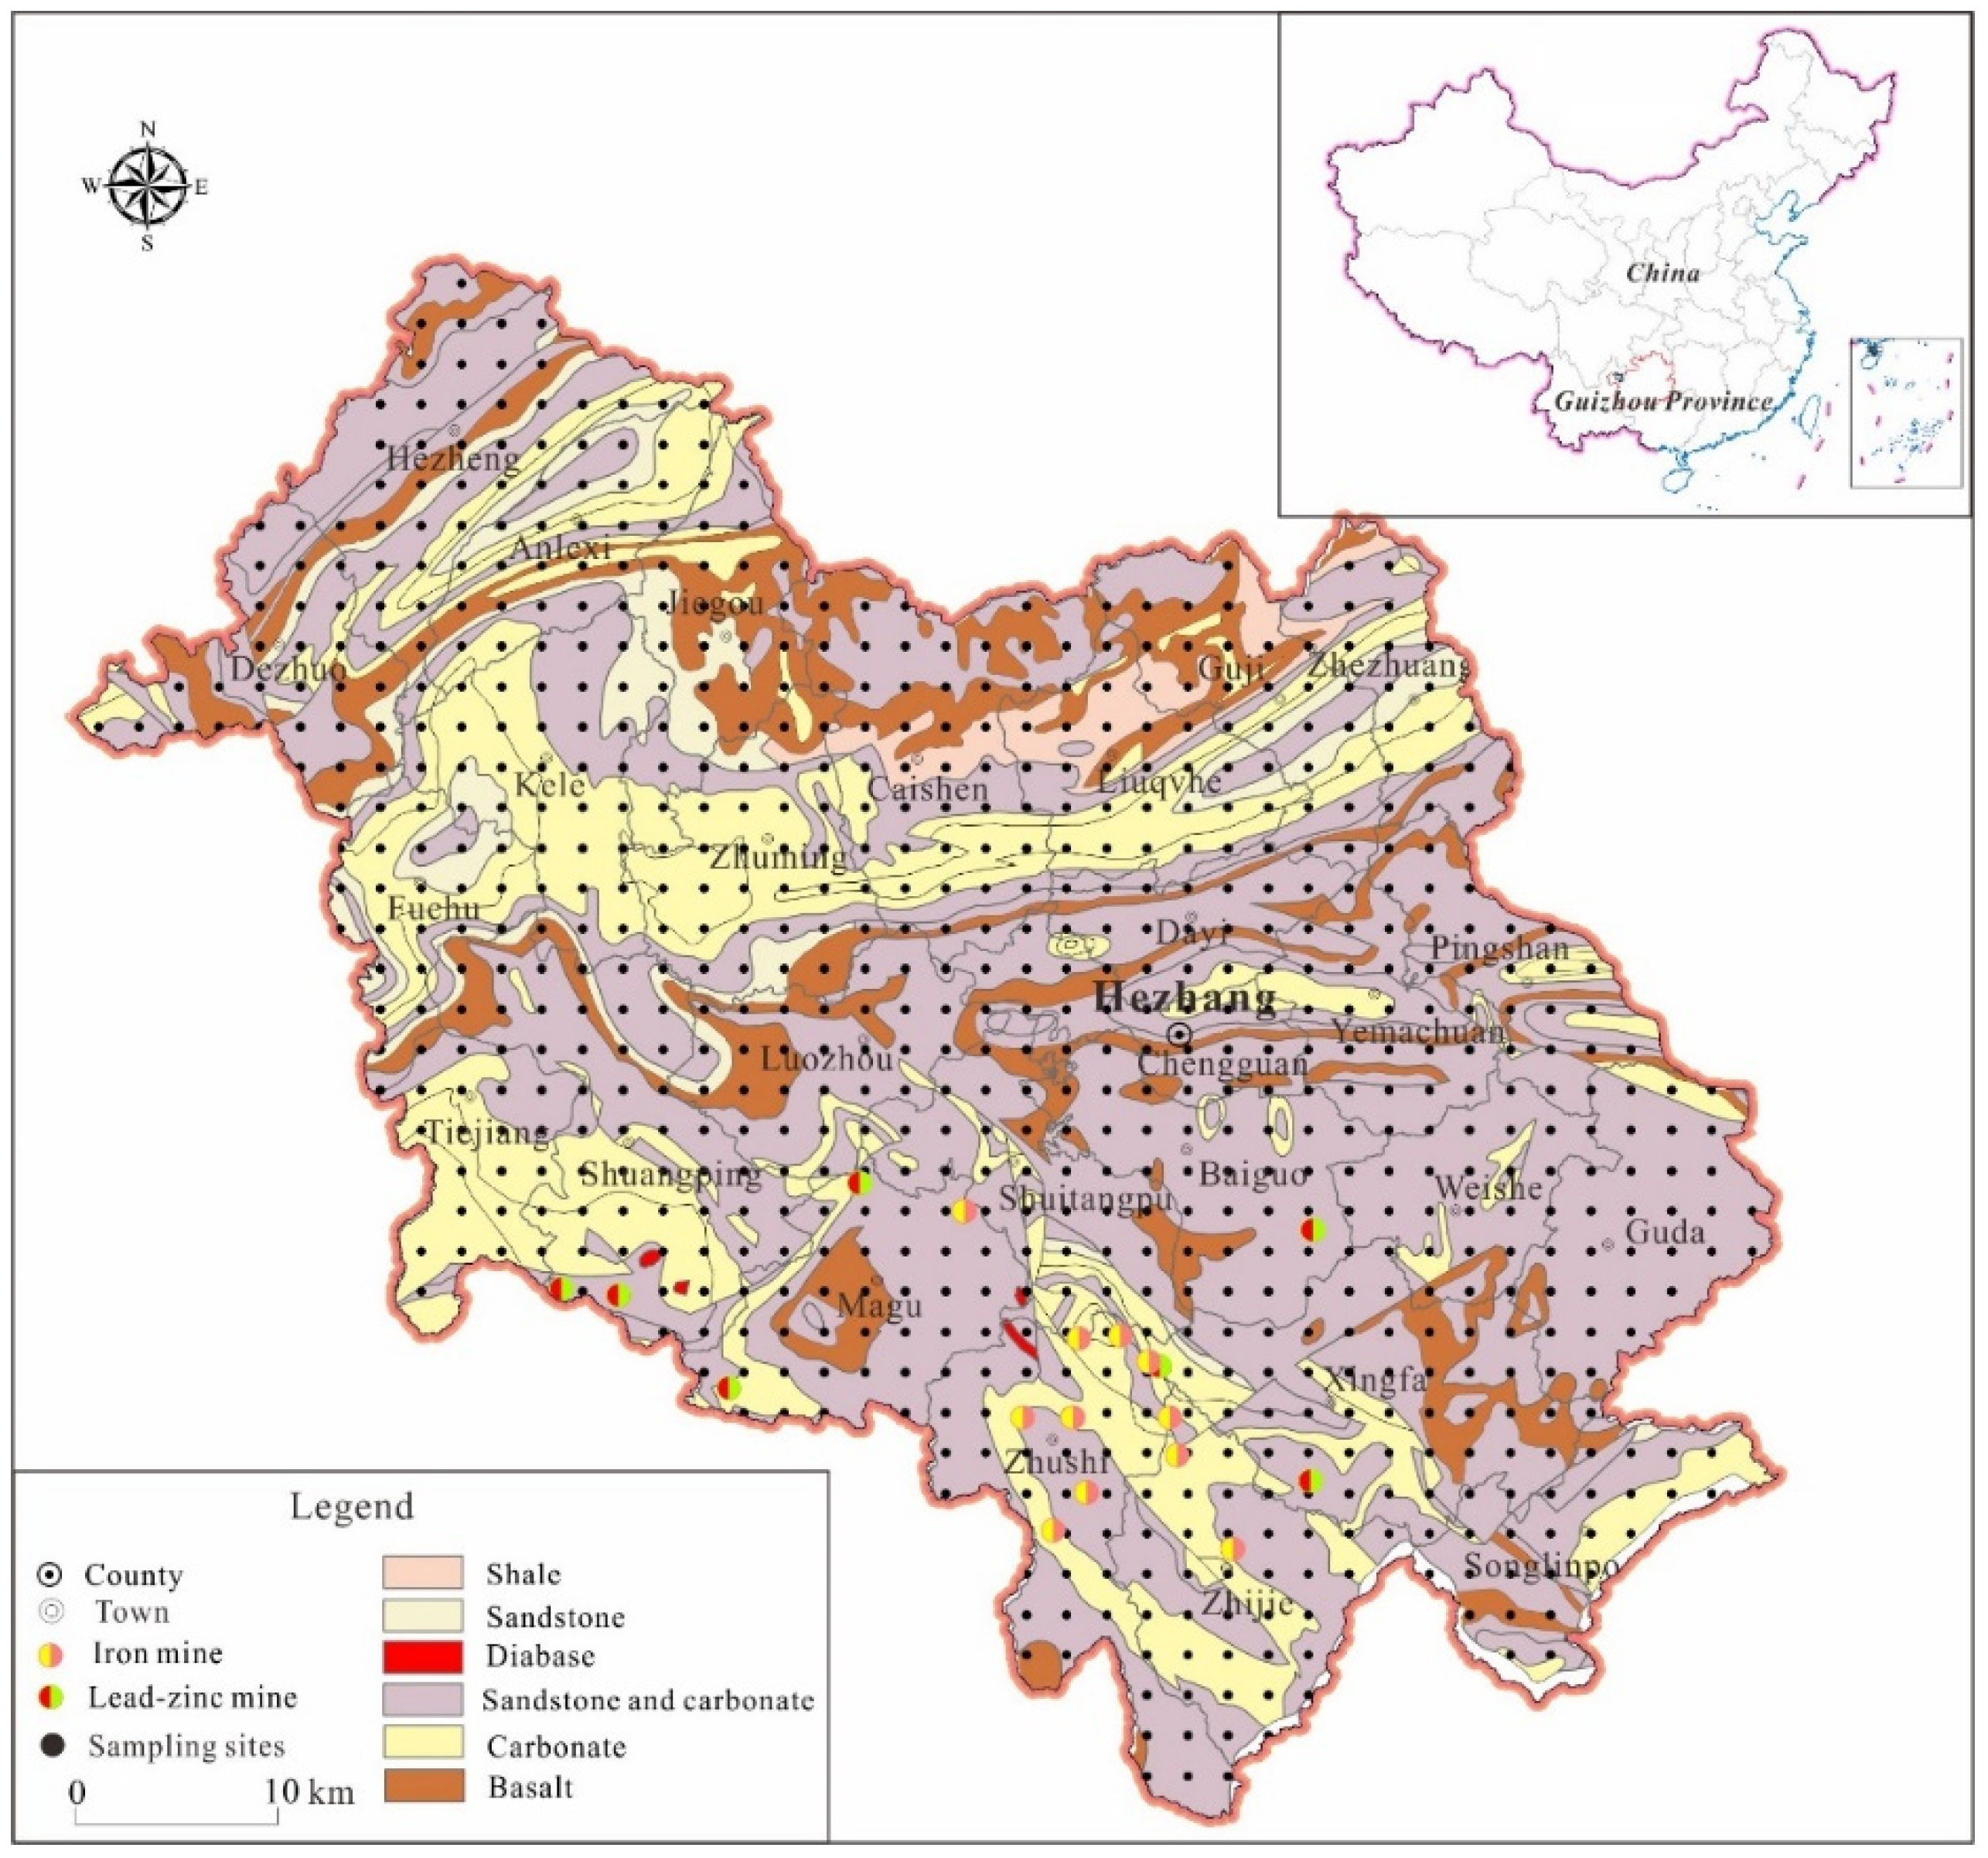
2.1. Study Area

Hezhang County (104°10′~105°01′ E, 26°46′~27°28′ N), with an area of 3250 km2, is an economically disadvantaged area of Wumeng Mountain at the junction of Guizhou and Yunnan provinces (Figure 1). It is a national-level poverty-stricken county and a key county for poverty alleviation and development identified by the State Council. The terrain is high in the west and low in the east, with an average altitude of 1996 m. It belongs to the warm temperate zone, with an average annual temperature of 12.6 °C and an average annual rainfall of 885.5 mm. Influenced by bioclimatic conditions and soil parent materials, soil types are complex and diverse. The main soil types in the study area were brown soil, yellow brown soil, red soil, and lime soil. Brown soil accounted for about 72% of the total soil area in the study area, and all samples collected were silty loam. The mean values of organic matter, N, P, and K were 39.59, 1.98, 1.17, and 11.50 g/kg, respectively. The average pH value of soil was 6.04. The exposed lithology is mainly Emeishan basalt and carbonate rocks, which contain a variety of metallic and non-metallic minerals, of which the iron-mine reserves are 1.08 billion tons, accounting for 50% of the proven reserves in Guizhou Province, the lead-zinc mine reserves are 7.82 million tons, and the copper mine reserves are 0.38 million tons [43,44]. Hezhang County is an indigenous zinc smelting area with a long history, with mining and agriculture as its pillar industries.

2.2. Soil Sampling and Analysis

In July 2019, a total of 795 topsoil samples (from 0~20 cm depth) were collected in the whole county with a grid of 4 km × 4 km. At each site, four to six individual soil samples were collected from an area of approximately 10 m2 and were mixed to form a combined sample. Roots, straws, stones, insects, and other debris were removed from the soil samples. Samples (about 1 kg dry weight) were packed into cotton bags and transported to the laboratory. The test items were As, Cd, Cr, Cu, Hg, Ni, Pb, Zn, and pH.
The total concentration of HMs in the soil samples were determined by the analytical center of the Chinese Academy of Geological Sciences. After fully air drying and mixing uniformly, 100 g of the sample was taken by the quartering method and ground with a planetary ball mill to 200 mesh size. A 0.1 g sample was weighed and placed in a Teflon crucible, wetted with water, and HF, HCl, HNO3, and HClO4 were added, extracted with HCl to a constant volume to 10 mL, and drawn to the standard curve with three groups of mixed standard solutions in a 10% HCl medium solution. According to the quality level of the different analytical methods, the total concentrations of Cr were determined by inductively coupled plasma emission spectrometry (ICP 7400 RADIAL, Thermo Fisher Scientific, Waltham, MA, USA), and Pb, Ni, Zn, Cd, and Cu were measured by inductively coupled plasma mass spectrometry (iCAP Qc, Thermo Fisher Scientific, Waltham, MA, USA). The process involved weighing a 0.5 g sample in a 50 mL beaker, adding 20 mL (1 + 1) of aqua regia, heating and decomposing it on an electric heating plate, extracting with HCl, to a constant volume of 50 mL, and dividing 25 mL into colorimetric tube. The total concentrations of As and Hg were determined by atomic fluorescence spectrometry (XGY-2020A, Kaiyuan High Technology Development Company, Langfang, Hebei, China). pH was tested in solution with a 10.0 g sample in distilled water without carbon dioxide by potentiometric method (PHBJ-260F, Electrical Scientific Instrument Co., Ltd., Shanghai China). The detection limits of As, Cd, Cr, Cu, Hg, Ni, Pb, and Zn were 0.2, 0.02, 1.5, 0.1, 0.0005, 0.2, 0.2, and 1 mg/kg, respectively. Twelve national standard reference materials (SRM) (GSS1-GSS12) were inserted blindly and analyzed simultaneously with the samples to control the analytical accuracy and precision. Each sample was measured 12 times, and the logarithmic difference (ΔlgC) and relative standard deviation (RSD%) between the average value and the standard value of each measured item was counted. All SRMs met the requirement of a ΔlgC < 10%, and all replicates met the requirement of an RD% < 10% in this study. In October 2019, all the testing work had been completed and accepted by the competent authorities, and the analysis and test data are reliable.

2.3. Statistical and Geostatistical Analyses

All the geochemical statistics were completed using Microsoft Excel 2020 (Microsoft, Redmond, WA, USA, 2020) and SPSS version 22 for Windows (SPSS Inc., Chicago, IL, USA), the Kolmogorov–Smirnov test was used for assessing the normality of the original concentration data. Moreover, Arcgis version 10.2 (ESRI Inc., Redlands, CA, USA) was used for graphic processing, and source apportionment of the pollutants by PMF model (Ver. 5.0 USEPA).

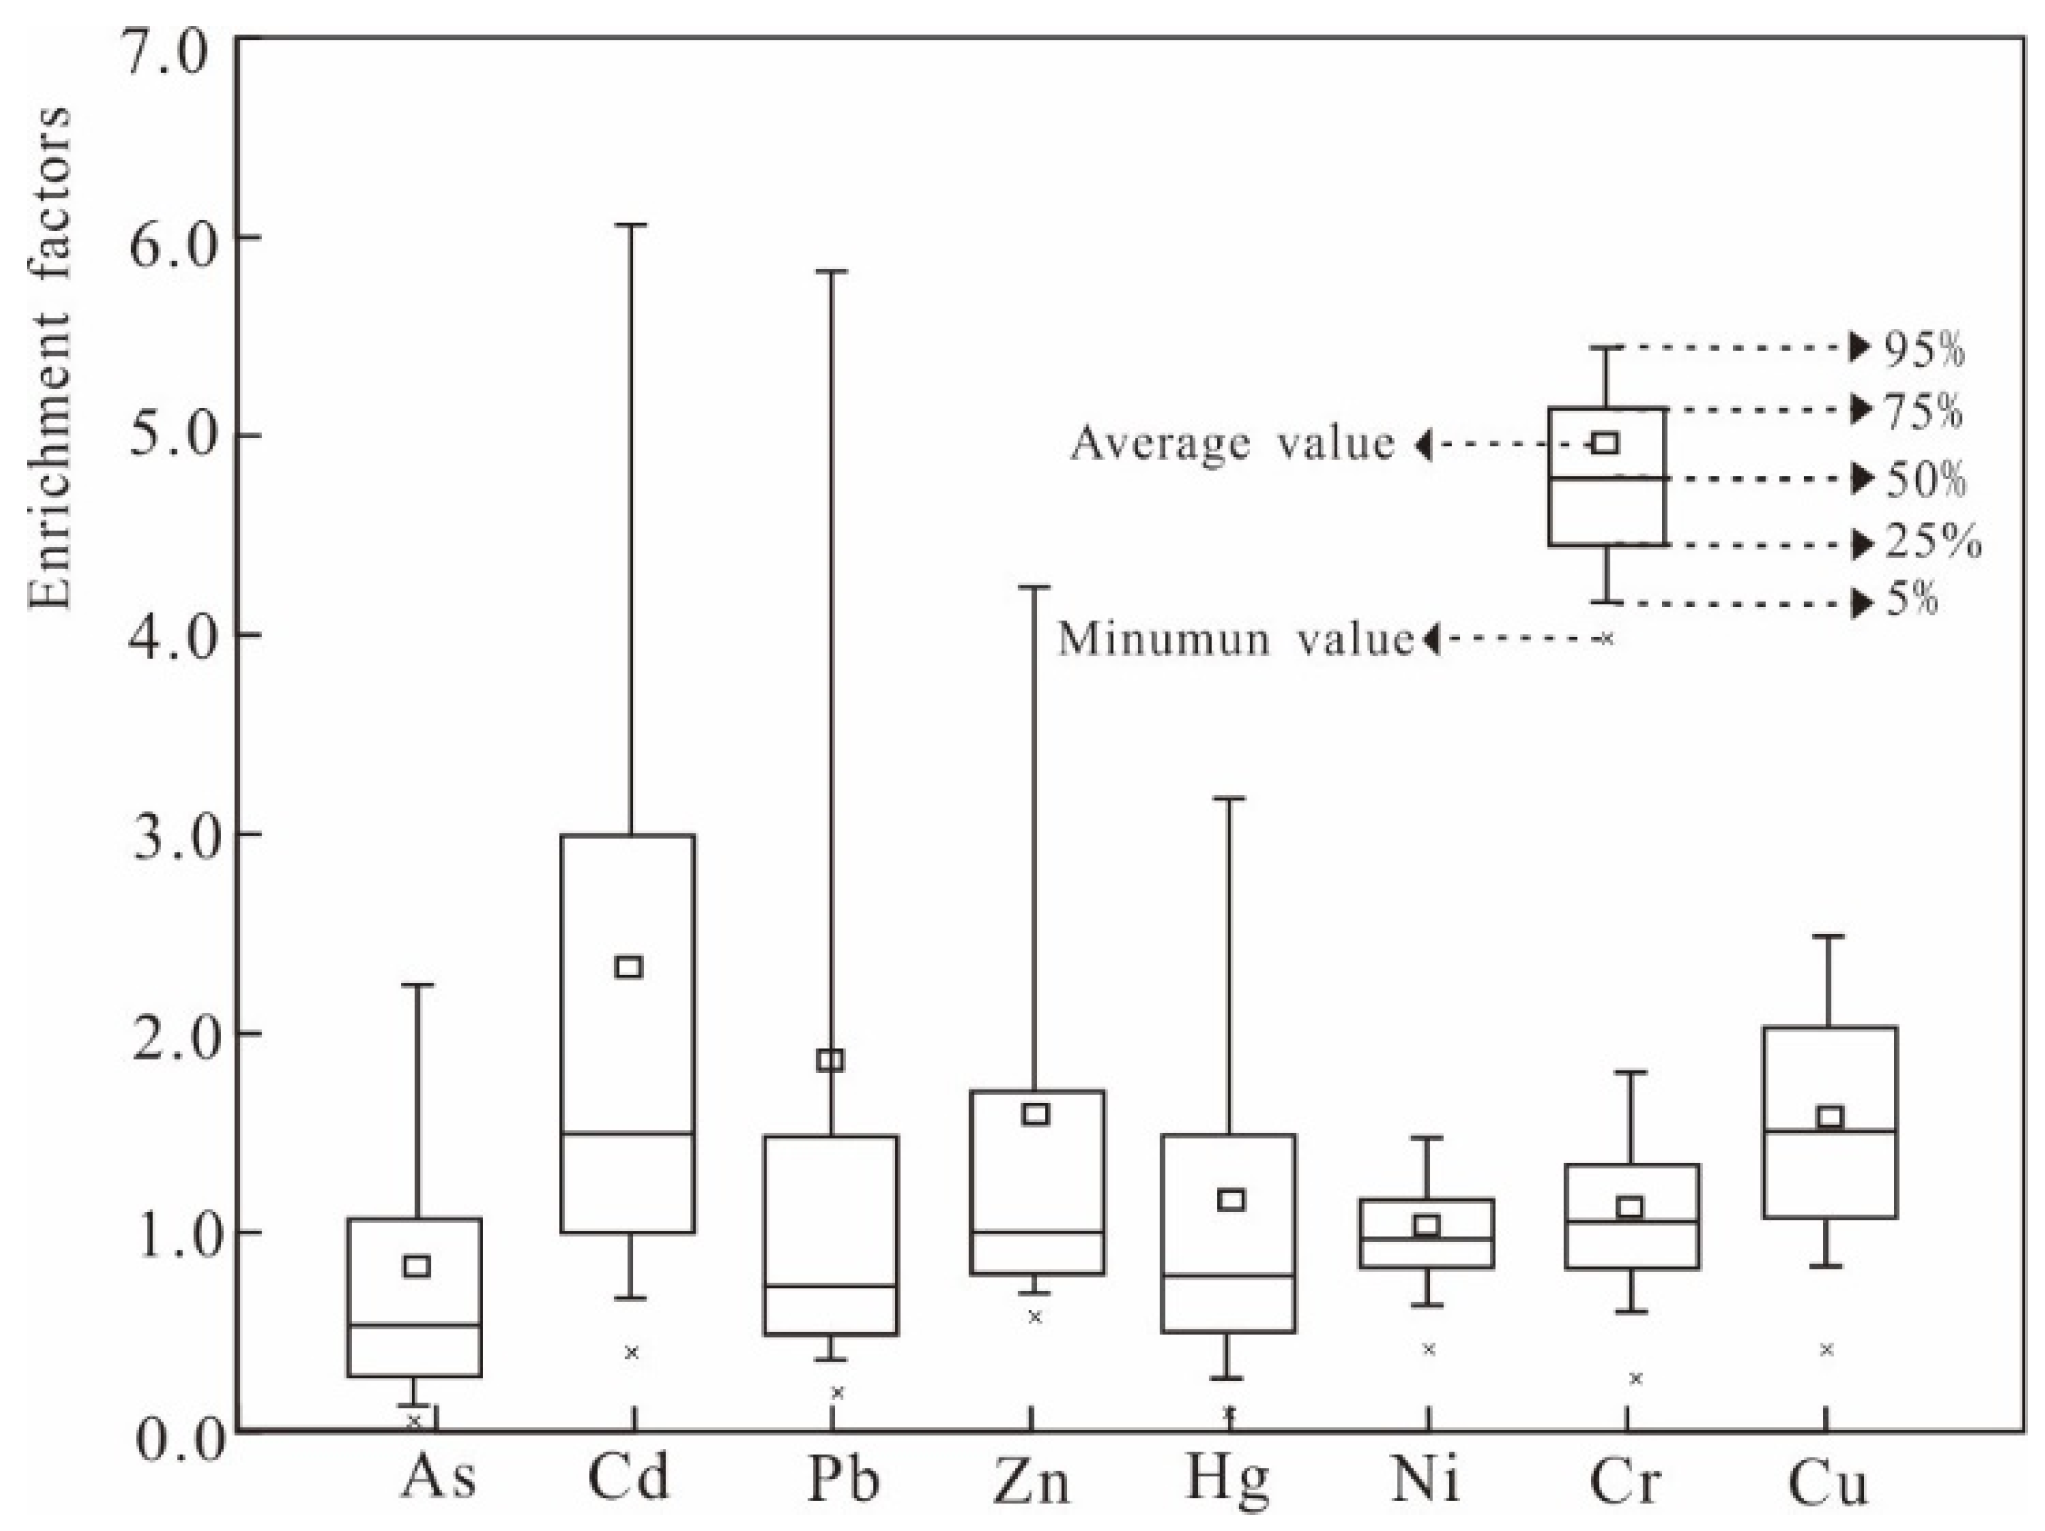
2.4. Enrichment Factor

Enrichment factors (EF), proposed by Buat-Menard and Chesselet in 1979 [45], were used to evaluate the degree of HM pollution, and to assess the degree of human impact. This was calculated as Equation (1):
EF = ( C i / C oi ) sample ( C i / C oi ) background
where Ci is the concentration of i metal element (mg/kg), and Coi is the concentration of reference elements in the sediment (mg/kg). The reference element is generally selected from low volatility elements in the Earth’s crust with less artificial pollution, chemical stability, and high analytical accuracy. Elements Ti, Al, Fe, Ca, Si, or Sc are generally served as acceptable EF reference elements [46,47,48], and Fe was selected as the reference element since it is one of the major components of the local soil. Six categories were used in the present study: EF < 1, no pollution; 1 ≤ EF < 2, slight pollution; 2 ≤ EF < 5, moderate pollution; 5 ≤ EF < 20, significant pollution; 20 ≤ EF < 40, very high pollution; and 40 ≤ EF, extremely high pollution [49].

2.5. PMF Model

PMF has been recommended by USEPA as a general apportionment modeling tool. To solve factor analysis problems, the method of least squares was used in PMF by integrating non-negative constraints into the optimization process and using the error estimate for each data value as a pointwise error estimate [50,51,52]. Based on the uncertainty of each observation, PMF provides a solution that minimizes the objective function, Q. This function is defined as:
X i j = K = 1 P g i k f k j + e i j
Q = i = 1 n j = 1 m e i j u i j 2
where xij is a measured variable j in sample i, gik is the contribution of source k to sample i, fkj is the contribution of variable j to source profile k and eij gives the modeled part of xij, and p is the number of source factors, and where uij are estimates of the uncertainties in the jth variable measured in the ith sample. When the concentration value of the element was below or equal to the corresponding method detection limit (MDL), use Equation (4) to calculate the uncertainty, otherwise, use Equation (5).
u i j = 5 6 × M D L
u i j = ( δ × c ) 2 + 1 4 M D L 2
where δ is the relative standard deviation, usually 5% [53,54], and c is the concentration of the element.

2.6. Potential Ecological Risk Index

The potential ecological risk index (PERI) was used to assess the degree of HMs and ecological risks in sediment [55]. It is calculated as follows:
E r i = T r i × C d i C l i
P E R I = i = 1 m E r i
where C d i is the measured concentration of element i in topsoil, and C l i is the corresponding geochemical background reference value in soil. E r i is the PERI of element i in topsoil, and T r i is the toxicity response factor for element i, where T r i for As = 10, Cd = 30, Cr = 2, Cu = 5, Hg = 40, Ni = 5, Pb = 5, and Zn = 1 [56].
The E r i describes the degree of pollution of element i, which is divided into five grades, and the PERI a composite value that describes the PERI for multiple pollutants at a given point; this value is divided into four grades [55]: E r i < 40, low ecolxogical risk; 40 ≤ E r i < 80, moderate risk; 80 ≤ E r i < 160, strong risk; 160 ≤ E r i < 320, quite strong risk; E r i ≥ 320, extremely strong risk. PERI < 150, low ecological risk; 150 ≤ PERI < 300, moderate risk; 300 ≤ PERI < 600, strong risk; and PERI > 600, quite strong risk.

3. Results and Discussion

3.1. Concentrations of HMs in Topsoil Samples

The statistical results of HMs (As, Cd, Cr, Cu, Hg, Ni, Pb, and Zn) and pH values in topsoil are shown in Table 1. The mean concentration of target elements exceeded the average background value (ABV) of Guizhou Province [54], which were 1.23, 3.41, 1.84, 2.80, 1.73, 1.64, 2.90, and 2.58 times the ABV, respectively. Besides As and Hg, the average concentration values of all target elements exceeded the screening values detailed in the risk control standard for the soil contamination of agricultural land (GB 15618–2018), which were 7.50, 1.18, 1.79, 1.07, 1.40, and 1.29 times the screening values, respectively.
Enrichment factor (EF) box plot shows (Figure 2) the descending order of EF values were Cd (2.33) > Pb (1.87) > Zn (1.63) > Cu (1.61) > Hg (1.18) > Cr (1.17) > Ni (1.02) > As (0.83), and Cd has a large area of moderate pollution, and Pb, Zn, and Cu have a small area of slight pollution. The EF values of Hg, Cr, Ni, and As were near the baseline value (EF ≈ 1), and the contaminations are slight or none. Table 2 shows the statistics of the environmental risk levels of HMs in topsoil. Approximately 40% EF values of Cd exceed 2, and more than 15% EF values of Pb, Zn, and Cu were higher than 2, showing moderate or higher pollution. Other HMs are mostly none or slight pollution. Therefore, Hezhang County is a superimposed area with the combined pollution of HMs, which deserves that the academic world and government departments pay particular attention.

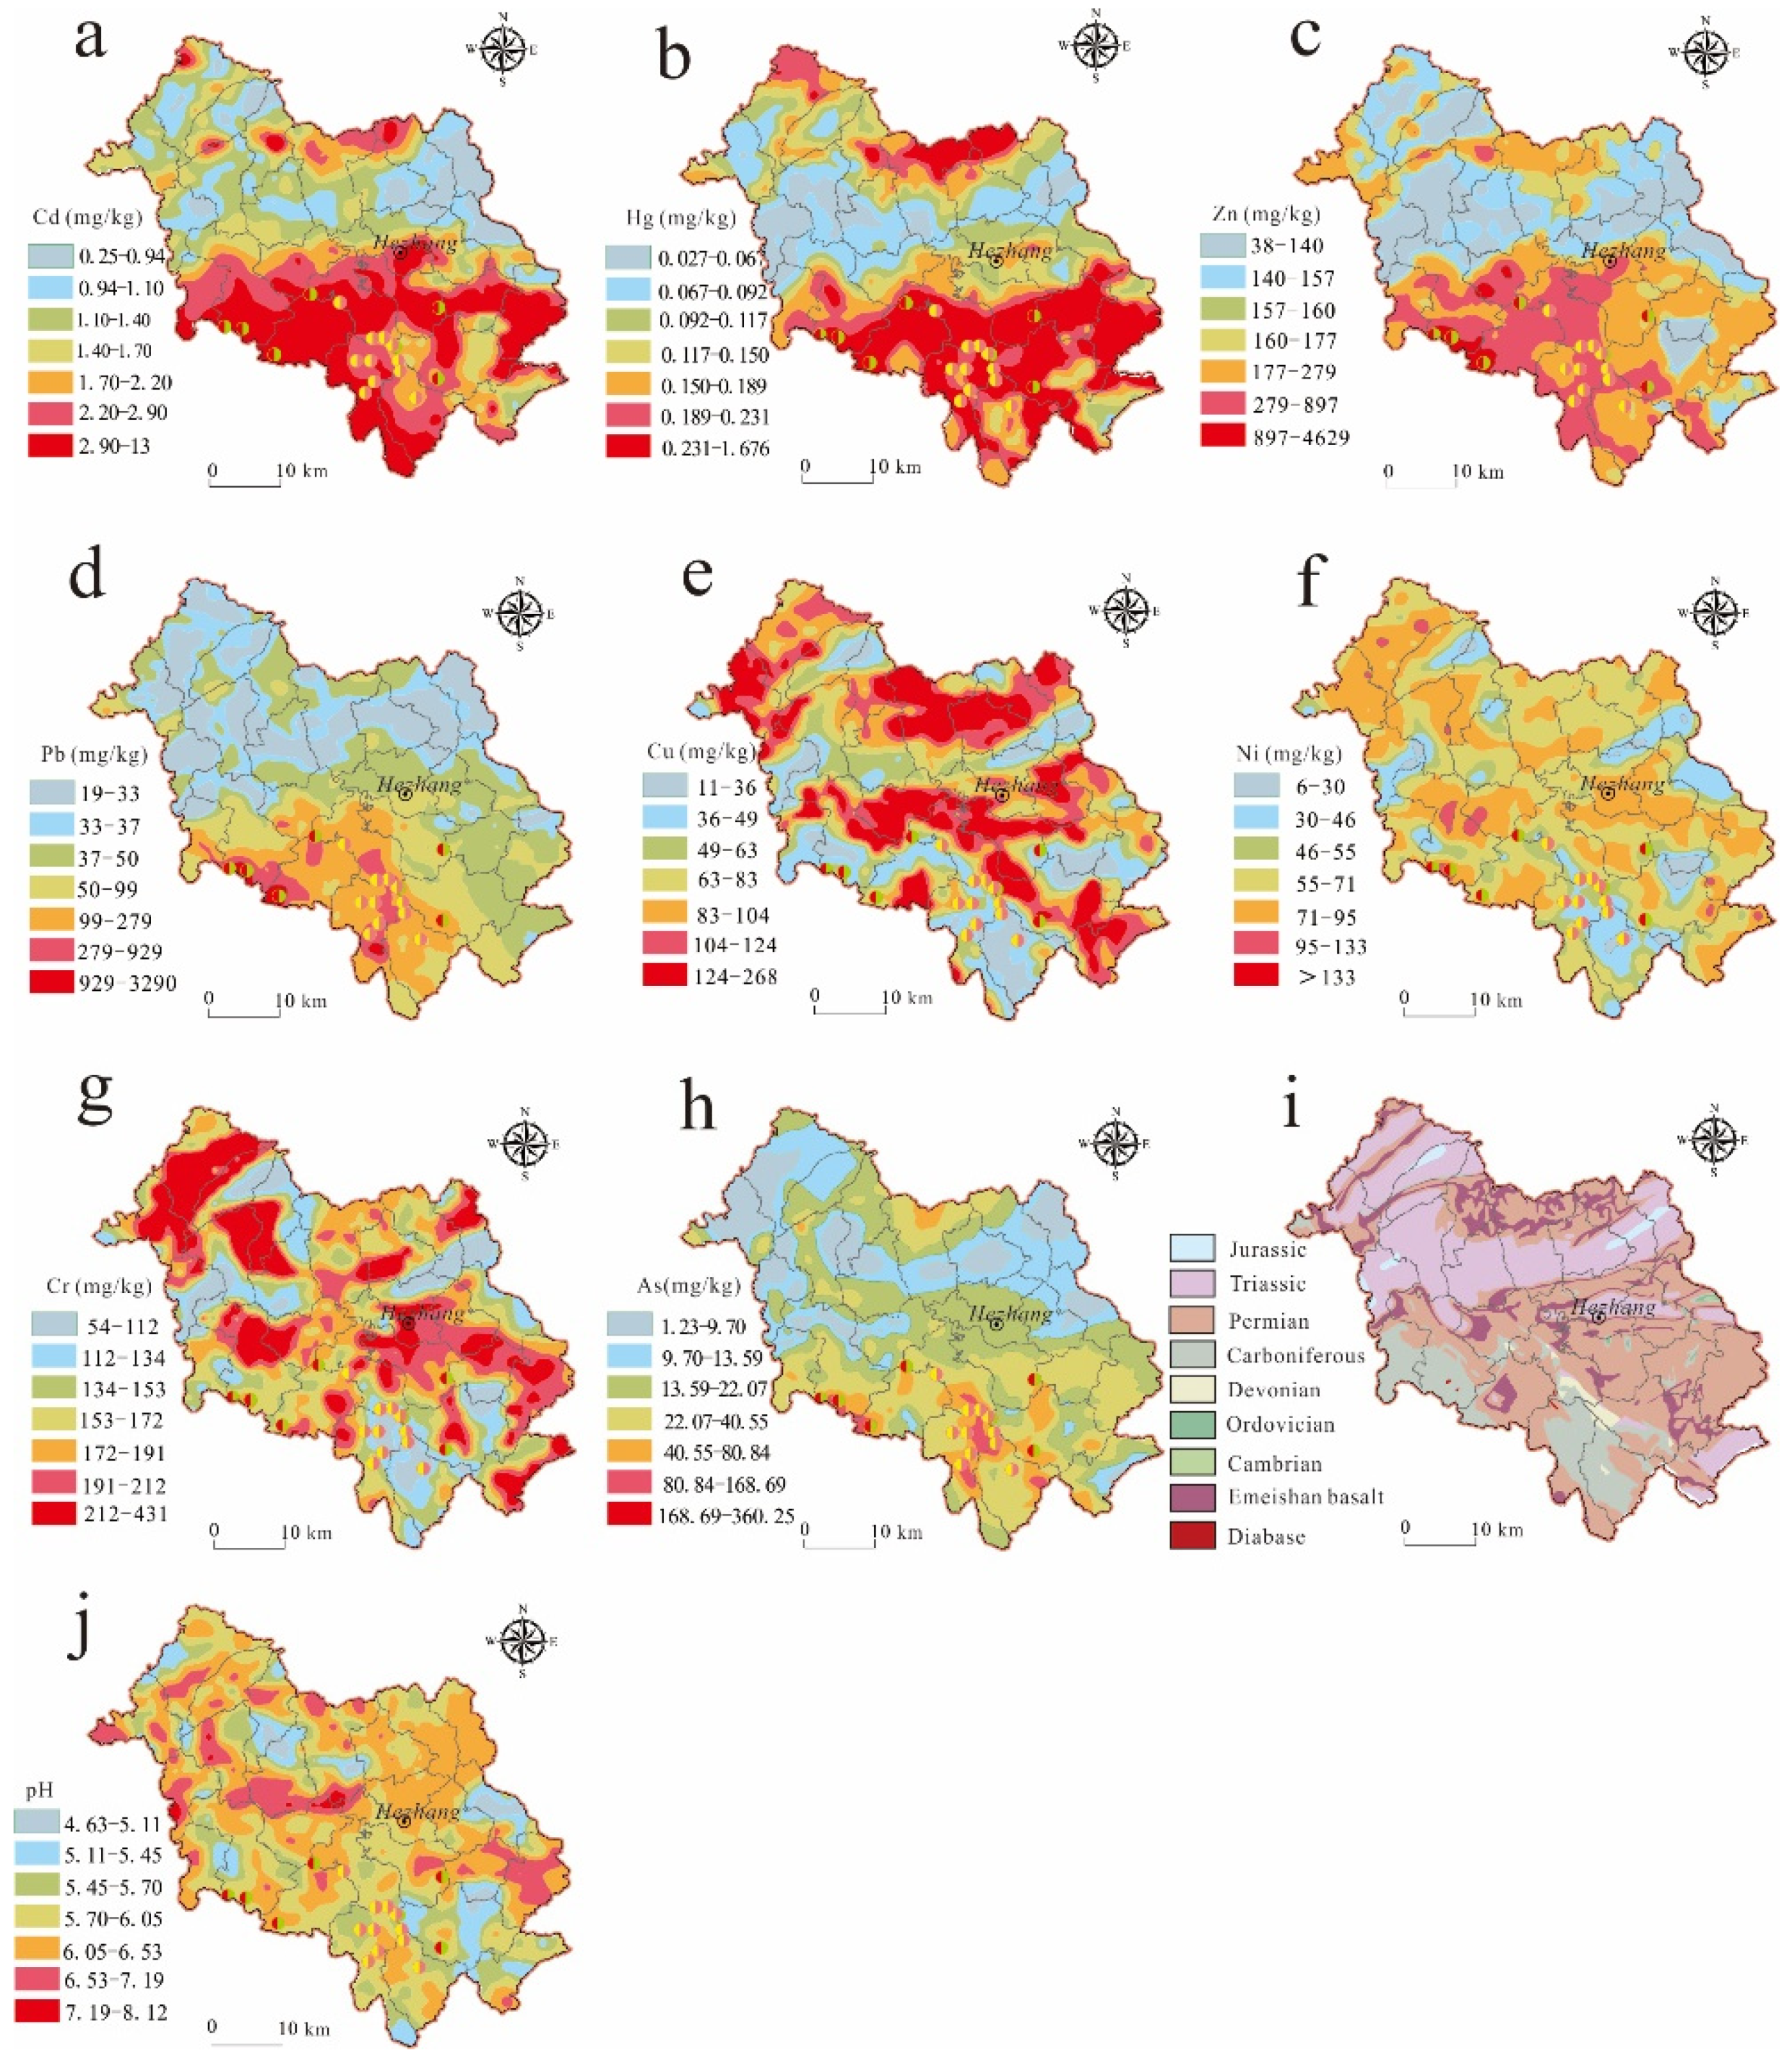
3.2. Spatial Distribution of HMs

The spatial distribution of target elements is presented in Figure 3. These maps illustrated the distinct zones of lower or higher concentrations in the study area. The spatial distribution trends of Cd, Hg, Pb, Zn, and As were similar and their concentration generally increased from the northern to the southwestern region (Figure 3a–d,h). The high value areas have close relationships with large iron mines and lead-zinc mines in the study area (Figure 3). The components of these mines are mainly Cd, Pb, Zn, and Fe, and are accompanied by Cu, Hg, and As. There are varying degrees of mineralization around the parent rock, including hematitization, pyritization, and carbonation. HMs enter the soil with natural subsidence and water leaching, resulting in enrichment. The soil parent rocks are mainly carbonate rock (Figure 3i), and HMs have natural high background properties, so secondary enrichment is easy to occur in the process of carbonate weathering. The spatial distributions of Cr, Cu, and Ni are very similar, and there was a “hotspot” area observed in the central and northern regions with high concentrations (Figure 3e–g). Apparently, Cr, Cu, and Ni have the same source and are affected by basalt in the study area (Figure 3i). Cr, Ni, and Cu, as the iron family elements, have similar geochemical properties and behaviors. The high value areas of Cd, Cr, and Cu are distributed in the junctions of townships (Figure 3e–g), which indicate the influence of human activity.

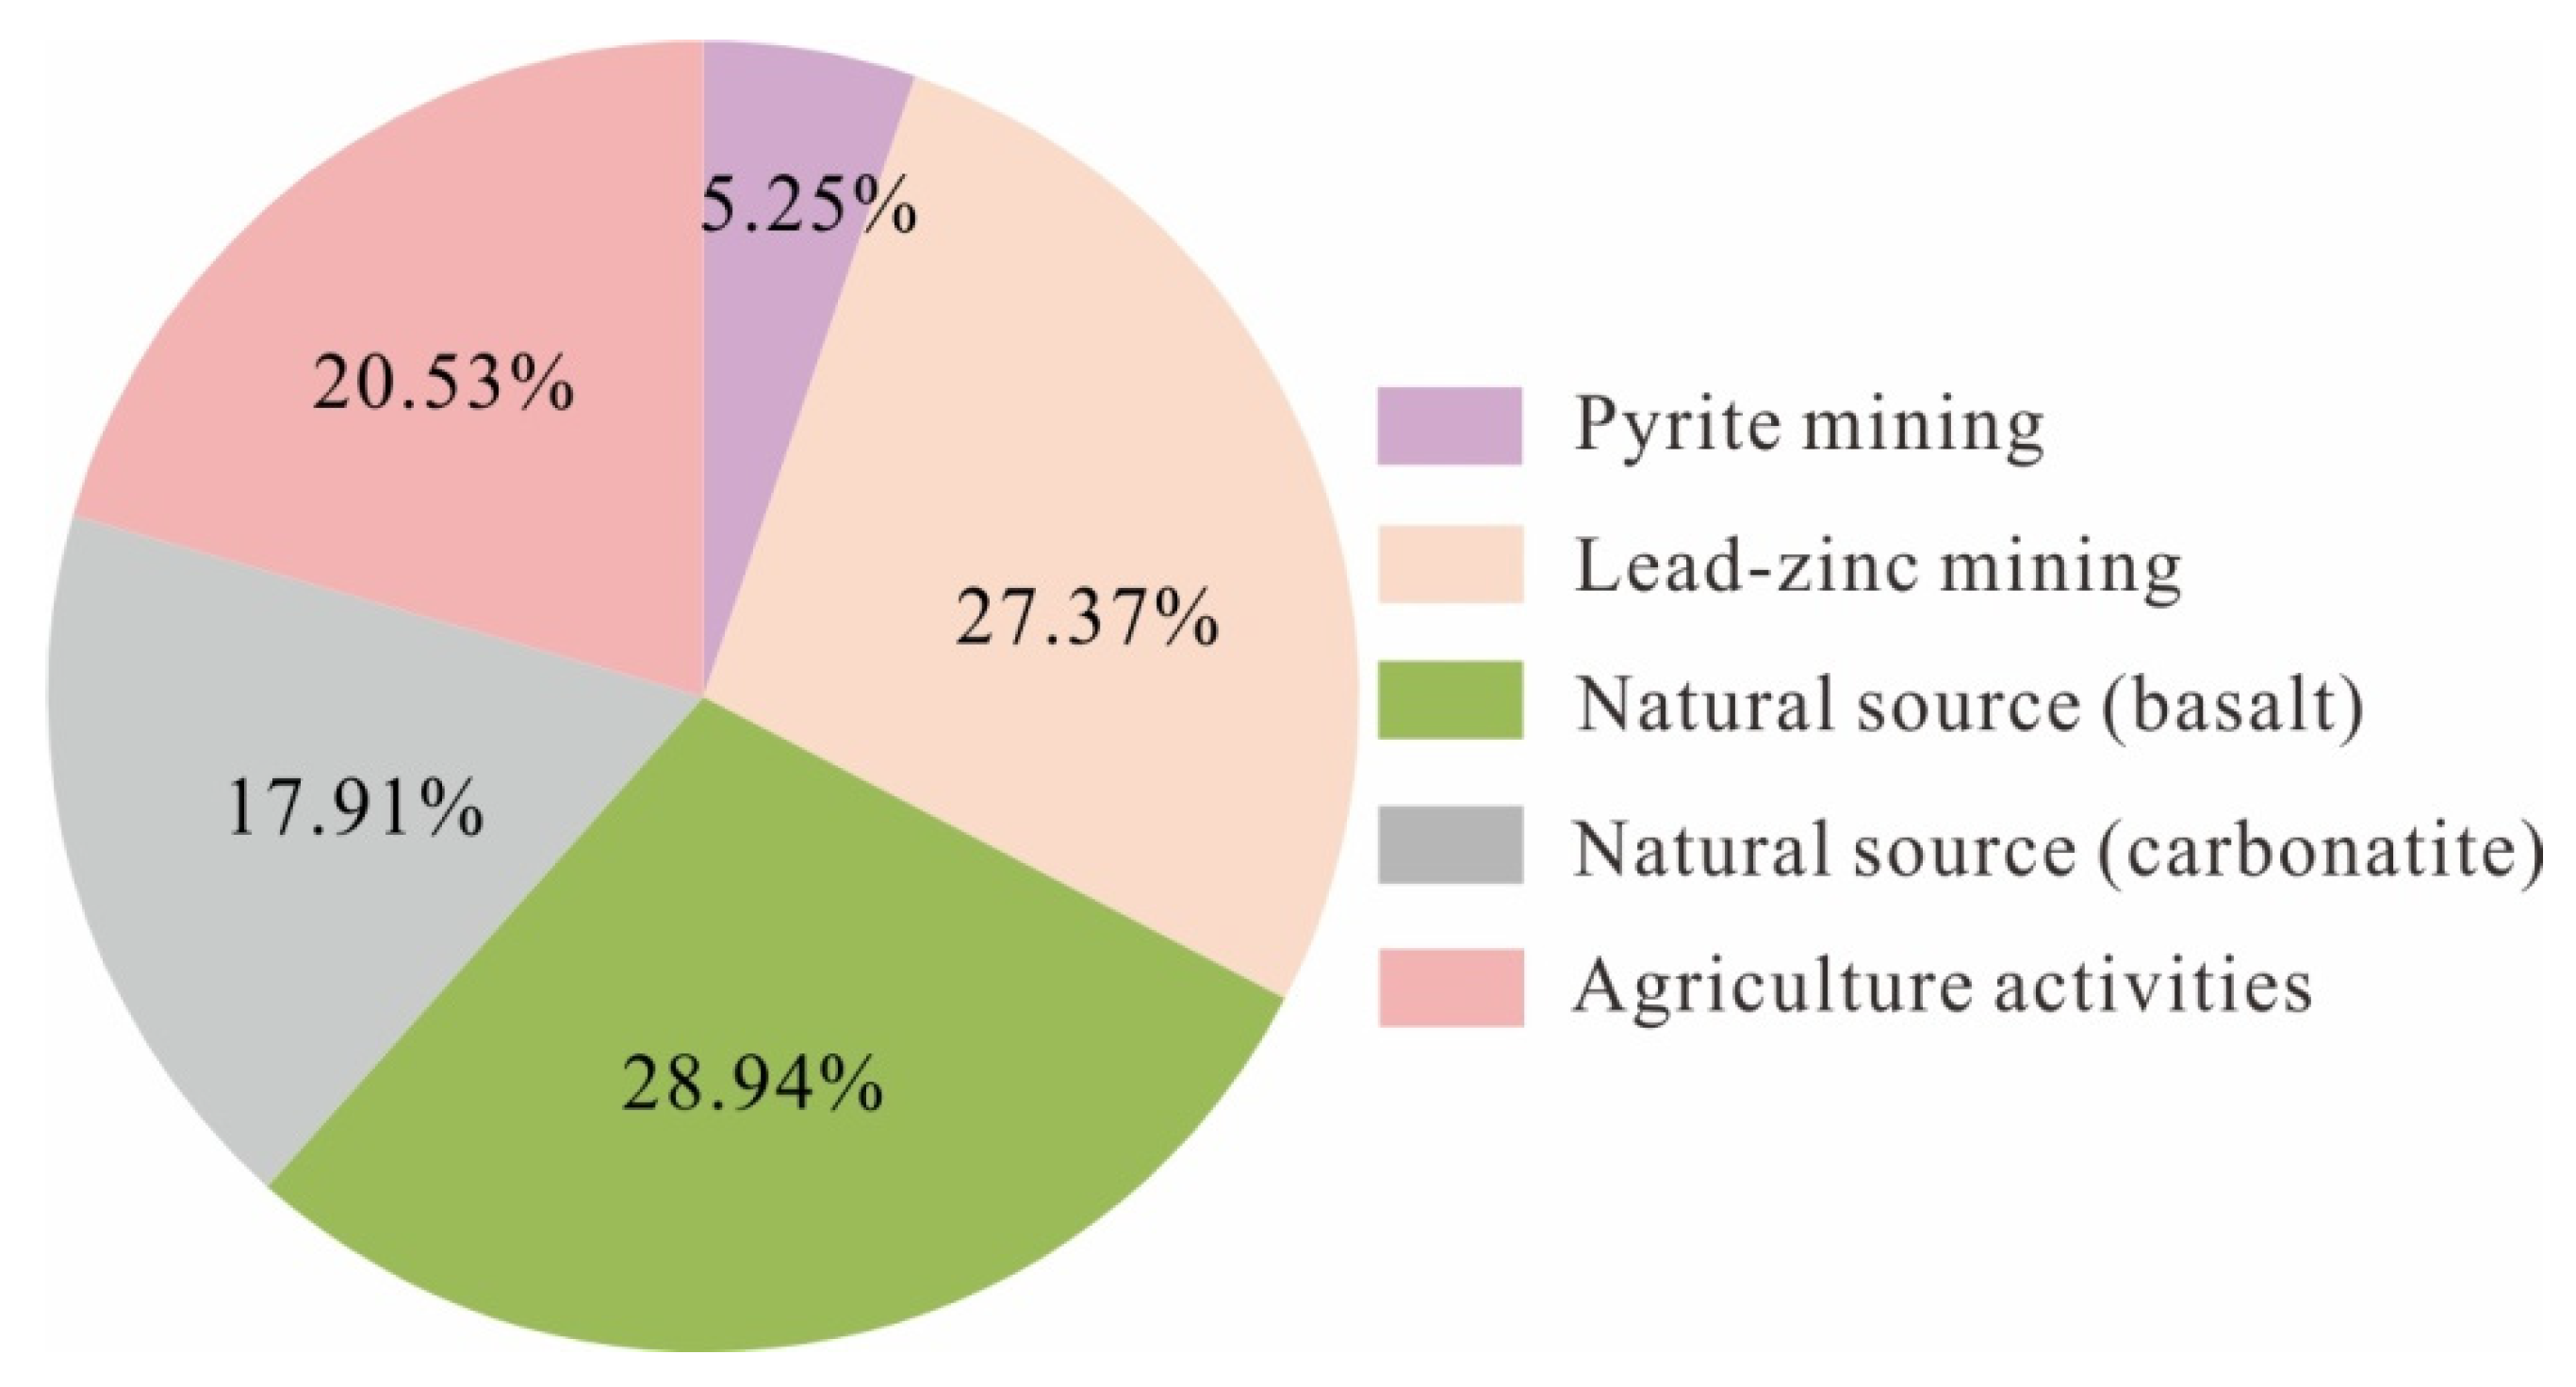
3.3. Sources Identification of HMs

The correlation analysis is an effective approach to reflect the possible sources of HMs. The correlation coefficients (r) between HMs (As, Cd, Cr, Cu, Hg, Ni, Pb, and Zn) and Fe concentration are shown in Table 3. The high correlation coefficients between HMs are used to measure the correlation degree. The high correlation coefficients were observed between As and Pb, Pb and Zn, and As and Zn at 0.01 levels (r > 0.8), which indicate they may have a common origin. The correlation coefficients between Cr and Hg are greater than 0.5 (r = 0.506). The correlation coefficients among Cd, Hg, As, Pb, and Zn are greater than 0.2 at 0.01 levels (r > 0.2), which suggest they may have the same contamination sources.
Cr, Ni, Cu, and Fe, as the iron group elements, are commonly siderophile. The correlation coefficients are high among these elements. The high concentrations of Cr, Ni, and Cu are closely related to large areas of exposed basalt, and that of Fe2O3 represents an important product of the weathering of the parent rock. It is speculated that the high concentrations of Cr, Ni, and Cu may be caused by the influence of lithology.
To further identify and quantify the sources and contributions of HMs in soils, in this paper, the PMF 5.0 model was used to explore the main sources of pollution. The input data set includes eight species and 795 samples. Uncertainty estimates of species and samples were provided by the analytical lab. To make sure the model is reasonable, HMs were set as strong (As, Cu, Ni, Pb, Zn) and weak (Cd, Cr, Hg) according to their signal-to-noise ratios (S/N) and the residual variance and concentration scatter plot. The number of factors is set as 3, 4, 5, and 6, the number of runs was set to 20 and a random start number was selected. When setting the number of factors to 5, the runs converged and the Q values were stable.
The source profile and source contribution ratios of HMs are shown in Table 4. The contribution ratio of As in Factor 1 is 77%, which is much larger than other HMs. As is usually accompanied by pyrite, and will inevitably enter the environment. During the weathering process, as in the arsenic-containing waste residue, filling material and smelting residue was leached and activated, and it may be released into the surrounding environment, causing As pollution in the atmosphere, water, and soil. The pollution level of As is low and the range is small, mainly distributed in the mining area. Factor 1 denotes the pollution source of mining pyrite.
Pb, Zn, and Cd have high contribution rates in Factor 2, with contribution rates of 74.7%, 46.5%, and 20.7%, respectively. Wastewater, mineral dust, and slag generated during lead and zinc smelting processes could be the main sources of pollution. Pb, Zn and Cd contamination can be found in soil near the lead-zinc deposit. Cd pollution is caused by the lead-zinc deposit with high Cd. Pb and Zn were extracted, and Cd was not recycled and was released into the environment during smelting. Therefore, Factor 2 can be explained as the human pollution caused by lead-zinc mining.
Cr and Ni have high contribution rates in Factor 3, with contribution rates of 64.6% and 63.0%, respectively. Cr and Ni, as the iron group elements, are commonly siderophile. The correlation coefficients are high among these elements. The high concentrations of Cr and Ni are closely related to large areas of exposed basalt. Factor 3 can be explained as the natural source caused by large-area exposure of basalt.
In factor 4, Cu, Cd, and Hg have higher contribution rates than the other elements, and the contribution ratio of Pb, Zn, and Cd were 85.0%, 67.4%, and 79.4%, respectively. Soil pH is one of the most important chemical properties. Alkaline soil is less in the study area, and acidic soil is more. In the high acidified zone, the concentrations of Al3+ and Al (OH)2+ are generally high, the Al3+ is more likely to occupy the position where Cd is adsorbed, which resulted in a high concentration of Cd in soil [57]. The soil parent rocks are mainly carbonate rocks, and HMs such as Cd and Hg have a natural high background, secondary enrichment is easy to occur in the process of carbonate weathering. The high value areas of Cu are closely related to large areas of exposed basalt. The fourth factor was a natural source. Therefore, both factor 3 and factor 4 could be explained as natural sources.
For the fifth factor, Ni, Cr, and Zn have high contribution rates and the contribution ratios were 32.3%, 26.8%, and 22.5%, respectively. In Hezhang, as an agricultural county, the high value distribution of Ni, Cr, and Zn coincides with the distribution of farming. Manure and wastewater are directly discharged into the surrounding environment, HMs accumulate in soils. In addition, fertilizers, pesticides, and agricultural supplies are also the main sources of HMs in agricultural soil. The accumulation of Cd is also related to the input of agricultural supplies. Therefore, factor 5 mainly comes from agricultural production.
Based on the above discussion, there are five sources of HMs in Hezhang County, namely pyrite mining, lead-zinc mining, natural source (basalt), natural source (carbonate), and agriculture production. The risk contribution ratios of the five sources of HMs are 5.25%, 27.37%, 28.94%, 17.91%, and 20.53%, respectively (Figure 4). Both pyrite mining and lead-zinc mining are industrial emissions, which was consistent with the fact that mining is a pillar industry in Hezhang County, and the total risk contribution ratio was 32.62%. Both factor 3 and factor 4 could be defined as natural sources, which coincided with the distribution of parent rocks, and the total risk contribution ratio was 46.85%. Factor 5 mainly comes from agricultural production, as agriculture is a pillar industry in the study area.

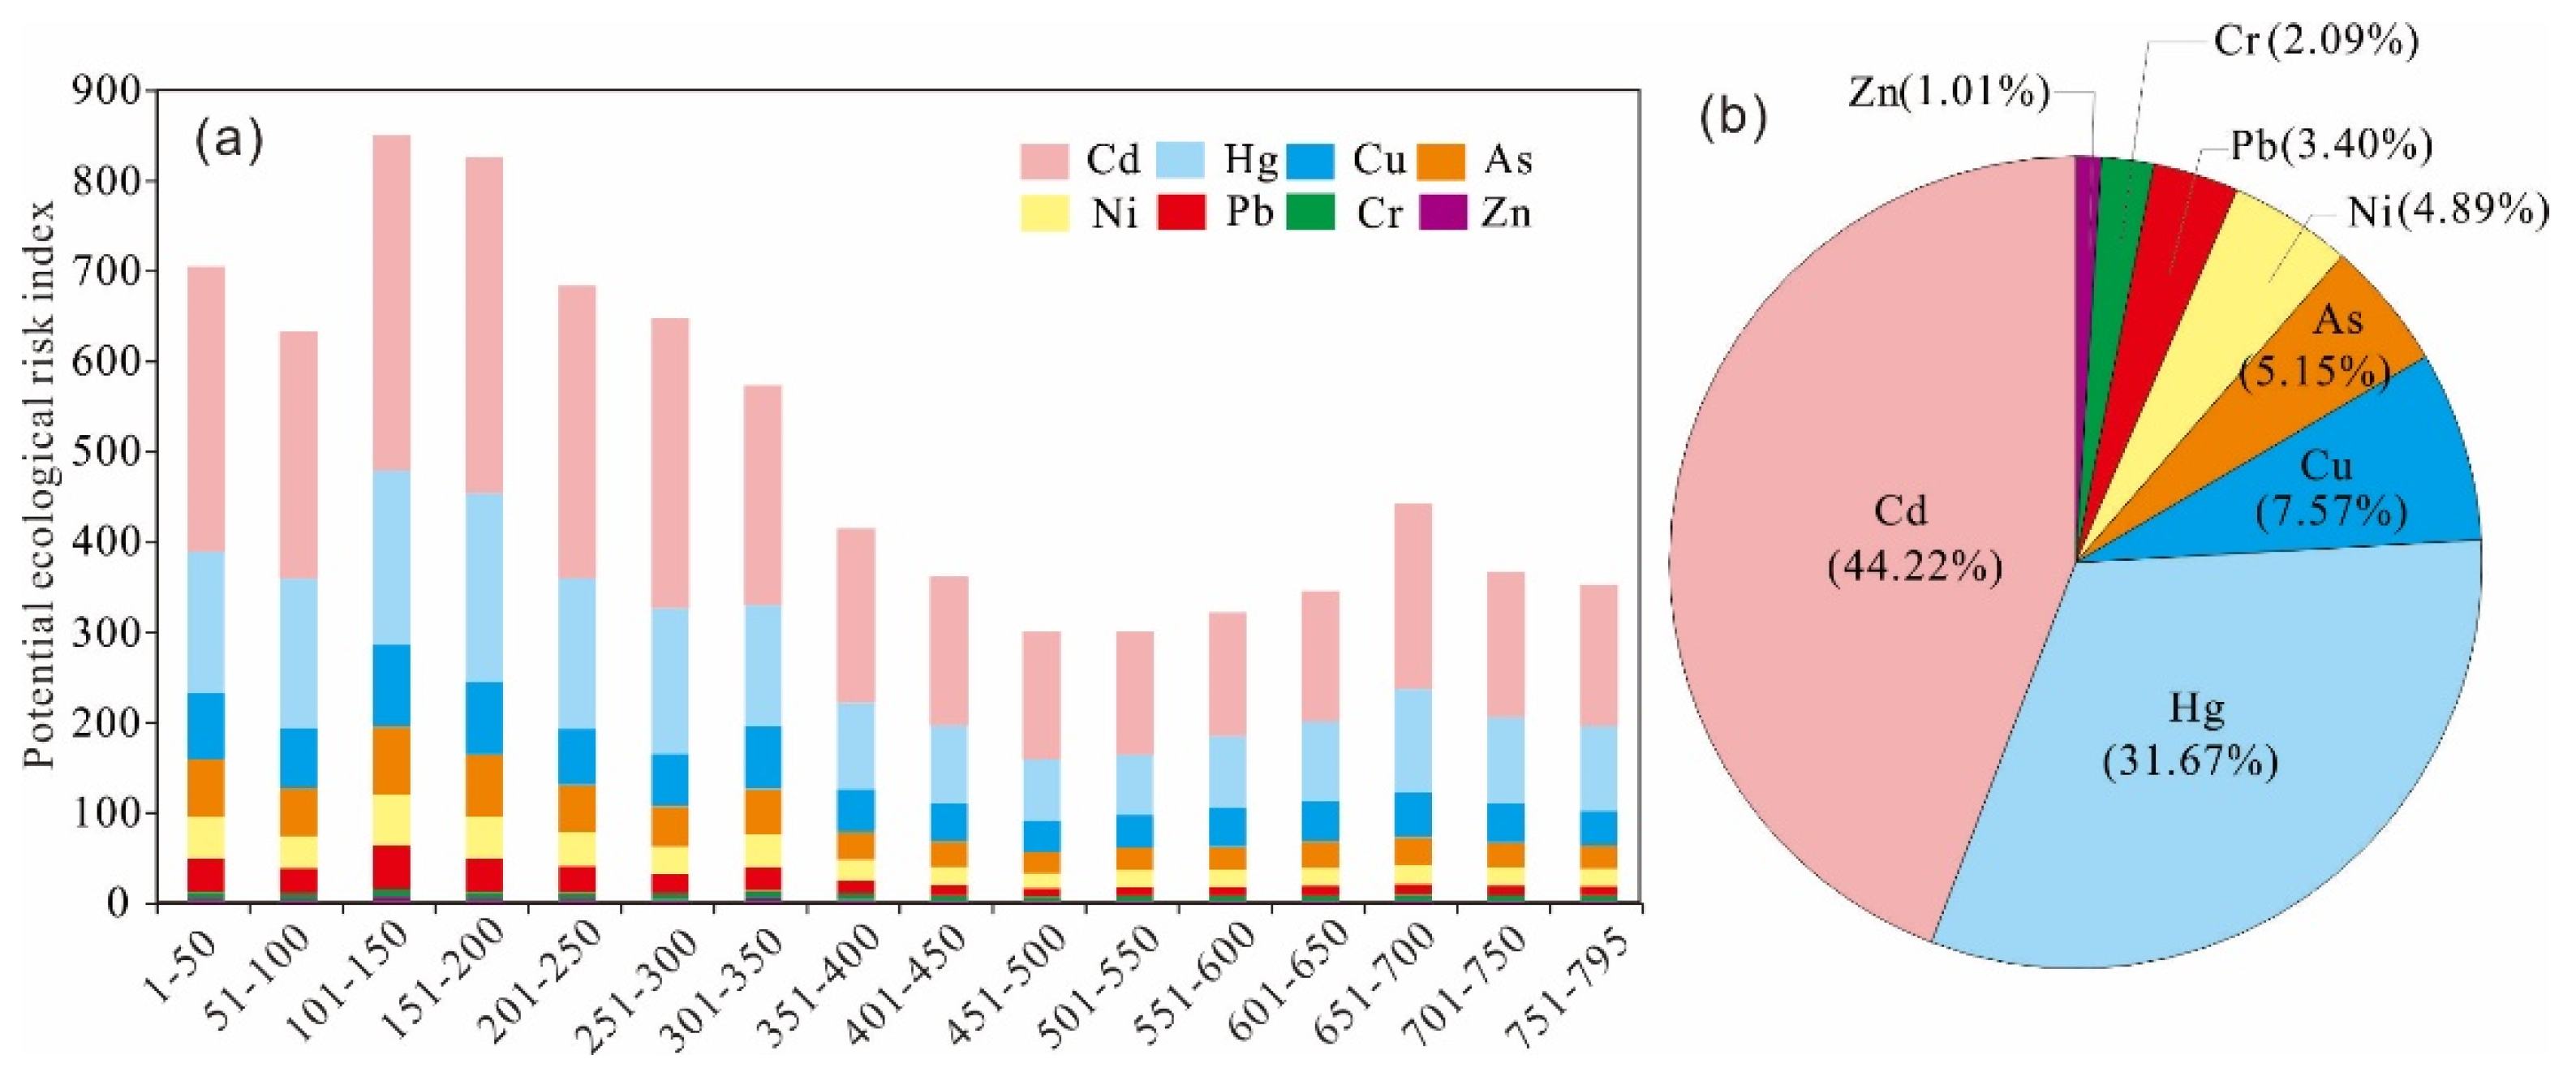
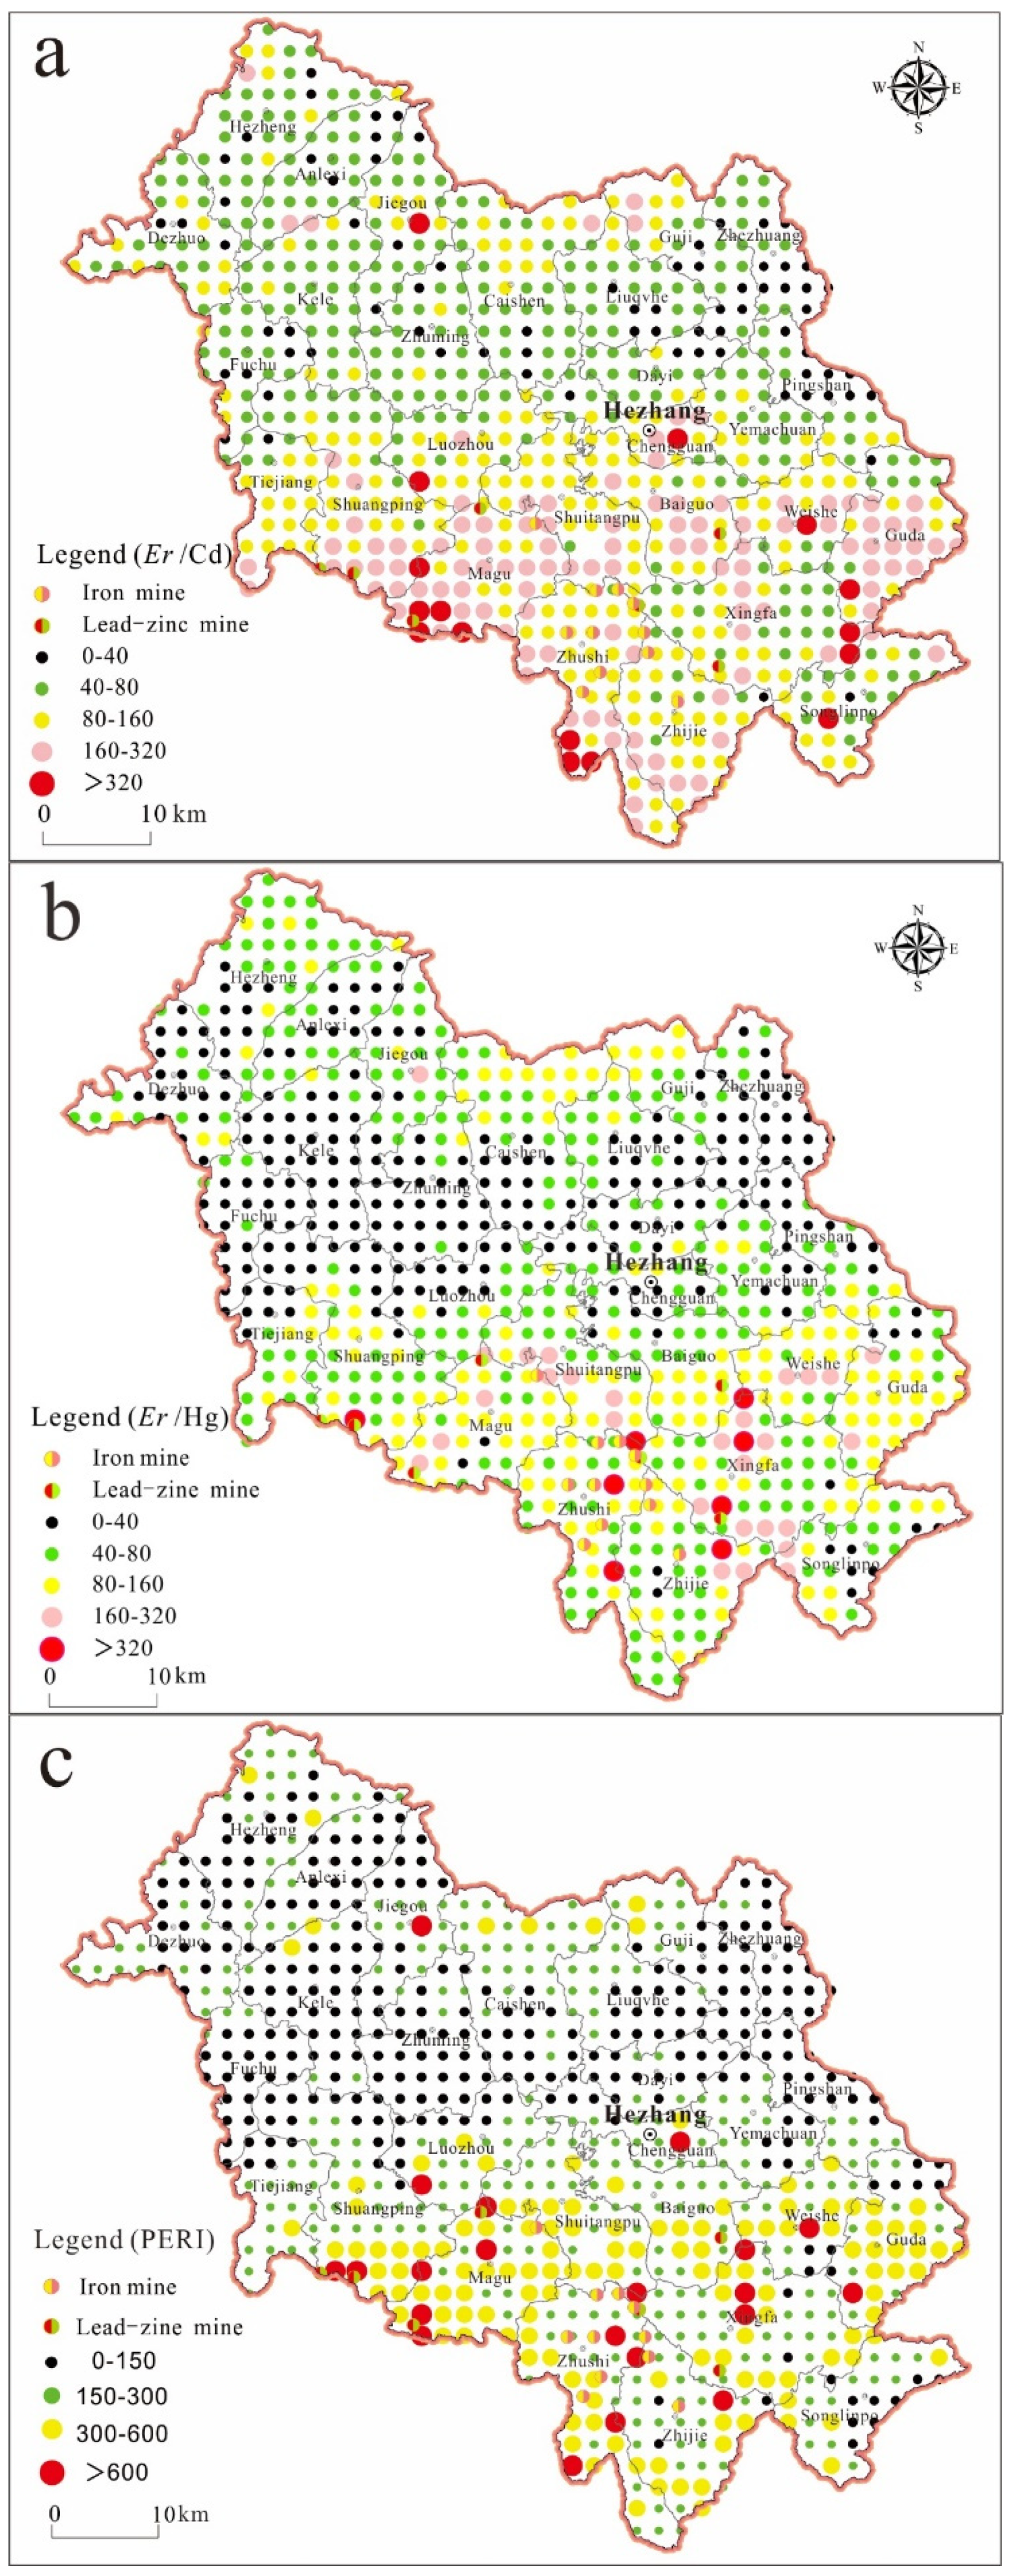
3.4. Ecological Risk Assessment

The PERI of HMs in topsoil were shown in Table 5. It was obvious that 297 sampling sites presented low ecological risk (PERI < 150), 341 sampling sites presented moderate risk (150 ≤ PERI < 300), 136 sampling sites presented strong risk (300 ≤ PERI < 600), and 21 sampling sites presented quite strong risk (PERI > 600), accounting for 37.36%, 42.89%, 17.11%, and 2.64% of the total number of samples, respectively. The average PERI is calculated for each set of 50 samples, and the ecological risks of all sampling sites exceed 300, with five sets of sampling sites over 600 (Figure 5a). The descending order of PERI values was Cd > Hg > Cu > As > Ni > Pb > Cr > Zn, with contribution rates of 44.22%, 31.67%, 7.57%, 5.15%, 4.89%, 3.40%, 2.09%, and 1.01%, respectively. Hg and Cd were the main risk elements because of high toxicity coefficients and enrichment factors (Figure 5b).
The ecological risk of Cd and Hg in the study area was evaluated by the integrating ArcGIS 10.2. The spatial distribution of different ecological risk level of Cd, Hg, and the comprehensive ecological risk level for eight types of HMs in Hezhang county are presented in Figure 6. Cd pollution was serious in Hezhang County (Figure 6a); of the total sampling sites, only 9.56% have slight pollution risk, and the proportions of moderate risk, strong risk, quite strong risk and extremely strong risk are 42.39%, 31.45%, 14.59%, and 2.01%, respectively (Table 5). Figure 6a shows that quite strong risk-extremely strong risk is primarily distributed in Magu, Shuangping, Guda, Zhushi, Weishe, and Chengguan. According to the study, the large iron and lead-zinc mine areas are mainly located near the junction of these townships, and mining activity can lead to the leakage of Cd into the environment. The ecological risk of Hg is less than Cd; of the total sampling sites, 33.71% have slight pollution risk, and the proportions of moderate risk, strong risk, quite strong risk and extremely strong risk are 38.11%, 23.65%, 3.52%, and 1.01%, respectively (Table 5). The ecological risk regions remain identical for Hg pollution and Cd pollution, and are also distributed (Figure 6b). The spatial distribution of Hg has a strong similarity with that of Cd, and the areas with high ecological hazard coefficients are mainly distributed in the large iron and lead-zinc mine areas.
The spatial distribution of the comprehensive ecological risk index shows that areas with slight ecological risk, moderate risk, strong risk, and quite strong risk to the total sampling sites are 37.36%, 42.89%, 17.11%, and 2.64%, respectively (Table 5). The spatial distribution of strong risk and quite strong risk are mainly distributed in the large iron and lead-zinc mine areas, and is highly consistent with Cd and Hg (Figure 6c).

4. Conclusions

The mean concentrations of HMs in topsoil are higher than the ABV of Guizhou Province, and the average concentrations of Cd, Cr, Cu, Ni, Pb, and Zn exceed the screening values specified in the risk control standard for soil contamination of agricultural land (GB 15618–2018), indicating HMs accumulated in the topsoil. The high value areas of Cd, Hg, Pb, Zn, and As are closely related to large iron and lead-zinc mines in the study area, and Cr, Cu, and Ni are highly consistent with the distribution of the basalt, which were affected by mining and soil parent rocks. The EFs show that Cd has a large area of moderate pollution, Pb, Zn, and Cu have a small area of slight pollution, the EFs values of Hg, Cr, Ni, and As are near the baseline value (EF ≈ 1), and the contaminations are in slight or none. The PERI indicates that low ecological risk, moderate risk, strong risk, and quite strong risk account for 37.36%, 42.89%, 17.11%, and 2.64% of the total number of samples, respectively. The PMF indicates there are five sources, namely pyrite mining, lead-zinc mining, natural source (basalt), natural source (carbonate), and agricultural production, with contribution rates of 5.25%, 27.37%, 28.94%, 17.91%, and 20.53%, respectively. The results show that the mining activities have caused serious environmental pollution. The local government should prohibit growing agricultural products in lead-zinc mining areas and encourage people to cultivate more plants that have super accumulation and enrichment of HMs. Scientific measures should be taken to control soil acidification and activation of HMs and ensure the safe use of land.

Author Contributions

Conceptualization, methodology, writing-Original Draft, F.Z., C.W. and L.H.; software, F.Z. and X.C.; investigation, and visualization, F.Z. and H.M.; data curation, X.C. and H.M.; validation and formal analysis, F.Z., X.C. and H.M.; writing—review and editing, F.Z. and C.W.; supervision, L.H. All authors have read and agreed to the published version of the manuscript.

Funding

This research was supported by the Geochemical Survey of Land Quality Project (Grant No. DD20160313, DD20190522).

Institutional Review Board Statement

Not applicable.

Informed Consent Statement

Not applicable.

Data Availability Statement

The data presented in this study are available on request from the corresponding author. The processed data are not publicly available as the data also form part of an ongoing study.

Conflicts of Interest

The authors declare no conflict of interest.

References

  1. Drobnik, T.; Greiner, L.; Keller, A.; Grêt-Regamey, A. Soil quality indicators—from soil functions to ecosystem services. Ecol. Indic. 2018, 94, 151–169. [Google Scholar] [CrossRef]
  2. Zhu, L.; Liu, J.; Xu, S.; Xie, Z. Deposition behavior, risk assessment and source identification of heavy metals in reservoir sediments of Northeast China. Ecotoxicol. Environ. Saf. 2017, 142, 454–463. [Google Scholar] [CrossRef] [PubMed]
  3. Hu, W.; Zhang, Y.; Huang, B.; Teng, Y. Soil environmental quality in greenhouse vegetable production systems in eastern China: Current status and management strategies. Chemosphere 2017, 170, 183–195. [Google Scholar] [CrossRef]
  4. Liang, J.; Feng, C.; Zeng, G.; Gao, X.; Zhong, M.; Li, X.; Li, X.; He, X.; Fang, Y. Spatial distribution and source identification of heavy metals in surface soils in a typical coal mine city, Lianyuan, China. Environ. Pollut. 2017, 225, 681–690. [Google Scholar] [CrossRef]
  5. Yu, L.; Zhang, F.; Zang, K.; He, L.; Wan, F.; Liu, H.; Zhang, X.; Shi, Z. Potential Ecological Risk Assessment of Heavy Metals in Cultivated Land Based on Soil Geochemical Zoning: Yishui County, North China Case Study. Water 2021, 13, 3322. [Google Scholar] [CrossRef]
  6. Mwesigye, A.R.; Young, S.D.; Bailey, E.H.; Tumwebaze, S.B. Population exposure to trace elements in the Kilembe copper mine area, Western Uganda: A pilot study. Sci. Total Environ. 2016, 573, 366–375. [Google Scholar] [CrossRef]
  7. Giller, K.E.; McGrath, S.P. Pollution by toxic metals on agricultural soils. Nature 1988, 335, 676. [Google Scholar] [CrossRef]
  8. Liu, X.; Yu, T.; Yang, Z.F.; Hou, Q.Y.; Yang, Q.; Li, C.; Ji, W.B.; Li, B.; Duan, Y.R.; Zhang, Q.Z.; et al. Transfer mechanism and bioaccumulation risk of potentially toxic elements in soil–rice systems comparing different soil parent materials—ScienceDirect. Ecotoxicol. Environ. Saf. 2021, 216, 112214. [Google Scholar] [CrossRef]
  9. Cheng, S. Heavy metal pollution in China: Origin, pattern and control. Environ. Sci Pollut. Res. 2003, 10, 192–198. [Google Scholar] [CrossRef]
  10. Naveed, M.; Tanvir, B.; Wang, X.K.; Brtnicky, M.; Ditta, A.; Kucerik, J.; Subhani, Z.; Nazir, M.Z.; Radziemska, M.; Saeed, Q.; et al. Co-composted biochar enhances growth, physiological, and phytostabilization efficiency of brassica napus and reduces associated health risks under chromium stress. Front. Plant Sci. 2021, 12, 775785. [Google Scholar] [CrossRef]
  11. Cheng, H.; Li, M.; Xie, X.J. Exploring China: Environment and resources. J. Geochem. Explor. 2014, 139, 1–3. [Google Scholar] [CrossRef]
  12. Chen, H.; Teng, Y.; Lu, S.; Wang, Y.; Wang, J. Contamination features and health risk of soil heavy metals in China. Sci. Total Environ. 2015, 512–513, 143–153. [Google Scholar] [CrossRef] [PubMed]
  13. Ullah, I.; Ditta, A.; Jan, A.U.; Rizwan, M.S.; Rizwan, M. Assessment of health and ecological risks of heavy metal contamination: A case study of agricultural soils in Thall, Dir-Kohistan. Environ. Monit. Assess. 2020, 192, 786. [Google Scholar] [CrossRef] [PubMed]
  14. MEE (Ministry of Ecology and Environment of the People’s Republic of China). Soil Environment Quality Risk Control Standard for Soil contamination of Agriculture Land (GB 15168-2018); China Environment Publishing Group: Beijing, China, 2018.
  15. Gu, Q.B.; Yang, Z.F.; Yu, T.; Yang, Q.; Hou, Q.Y.; Zhang, Q.Z. From soil to rice—A typical study of transfer and bioaccumulation of heavy metals in China. Acta Agric. Scand. Sect. B 2018, 68, 631–642. [Google Scholar] [CrossRef]
  16. Wang, Q.; Dong, Y.; Cui, Y.; Liu, X. Instances of soil and crop heavy metal contamination in China. Soil Sediment Contam. 2001, 10, 497–510. [Google Scholar] [CrossRef]
  17. Teng, Y.; Ni, S.; Wang, J.; Zuo, R.; Yang, J. A geochemical survey of trace elements in agricultural and non-agricultural topsoil in Dexing area, China. J. Geochem. Explor. 2010, 104, 118–127. [Google Scholar] [CrossRef]
  18. China Cultivated Land Geochemical Survey Report. Available online: http://www.cgs.gov.cn/upload/201506/20150626/gdbg.pdf (accessed on 25 June 2015).
  19. Cheng, H.; Li, K.; Li, M.; Yang, K.; Liu, F.; Cheng, X. Geochemical background and baseline value of chemical elements in urban soil in China. Front. Earth Sci. 2014, 21, 265–306. [Google Scholar] [CrossRef]
  20. Cheng, H.; Li, M.; Zhao, C.; Yang, K.; Li, K.; Peng, M.; Yang, Z.; Liu, F.; Liu, Y.; Bai, R.; et al. Concentrations of toxic metals and ecological risk assessment for sediments of major freshwater in China. J. Geochem. Explor. 2015, 157, 15–26. [Google Scholar] [CrossRef]
  21. Li, K.; Peng, M.; Zhao, C.; Yang, K.; Zhou, Y.; Liu, F.; Tang, S.; Yang, F.; Han, W.; Yang, Z.; et al. Vicennial Implementation of Geochemical Survey of Land Quality in China. Front. Earth Sci. 2019, 26, 128–158. [Google Scholar] [CrossRef]
  22. Li, M.; Xi, X.; Xiao, G.; Cheng, H.; Yang, Z.; Zhou, G.; Ye, J.; Li, Z. National multi−purpose regional geochemical survey in China. J. Geochem. Explor. 2014, 139, 21–30. [Google Scholar] [CrossRef]
  23. Peng, M.; Zhao, C.; Ma, H.; Yang, Z.; Yang, K.; Liu, F.; Li, K.; Yang, Z.; Tang, S.; Guo, F.; et al. Heavy metal and Pb isotopic compositions of soil and maize from a major agricultural area in Northeast China: Contamination assessment and source apportionment. J. Geochem. Explor. 2019, 208, 106403. [Google Scholar] [CrossRef]
  24. Duan, Y.R.; Yang, Z.F.; Yu, T.; Liu, X.; Ji, W.B.; Jiang, H.Y.; Zhuo, X.X.; Wu, T.S.; Qin, J.X.; Wang, L. Geogenic cadmium pollution in multi-medians caused by black shales in Luzhai, Guangxi. Environ. Pollut. 2020, 260, 113905. [Google Scholar] [CrossRef] [PubMed]
  25. Wen, Y.B.; Li, W.; Yang, Z.F.; Zhang, Q.Z.; Ji, J.F. Enrichment and source identification of Cd and other heavy metals in soils with high geochemical background in the karst region, Southwestern China. Chemosphere 2020, 245, 125620. [Google Scholar] [CrossRef] [PubMed]
  26. Tu, C.; He, T.; Liu, C.; Lu, X. Effects of land use and parent materials on trace elements accumulation in topsoil. J. Environ. Qual. 2013, 42, 103–110. [Google Scholar] [CrossRef]
  27. Zhao, Y.; Wang, Z.; Sun, W.; Huang, B.; Shi, X.; Ji, J. Spatial interrelations and multi-scale sources of soil heavy metal variability in a typical urban–rural tran-sition area in Yangtze River Delta region of China. Geoderma 2010, 156, 216–227. [Google Scholar] [CrossRef]
  28. Pan, Y.; Wang, Y. Atmospheric wet and dry deposition of trace elements at 10 sites in Northern China. Atmos. Chem. Phys. 2015, 15, 951–972. [Google Scholar] [CrossRef] [Green Version]
  29. Li, S.; Zhang, Q. Response of dissolved trace metals to land use/land cover and their source apportionment using a receptor model in a subtropic river, China. J. Hazard Mater. 2011, 190, 205–213. [Google Scholar] [CrossRef] [PubMed]
  30. Huang, J.; Cheng, W.; Shi, Y.; Zeng, G.; Yu, H.; Gu, Y.; Shi, L.; Yi, K. Honeycomblike carbon nitride through supramolecular preorganization of monomers for high photocatalytic performance under visible light irradiation. Chemosphere 2018, 211, 324–334. [Google Scholar] [CrossRef]
  31. Luo, X.; Xue, Y.; Wang, Y.; Cang, L.; Xu, B.; Ding, J. Source identification and apportionment of heavy metals in urban soil profiles. Chemosphere 2005, 127, 152–157. [Google Scholar] [CrossRef]
  32. Nanos, N.; Rodríguez Martin, J.A. Multiscale analysis of heavy metal contents in soils: Spatial variability in the Duero river basin (Spain). Geoderma 2012, 189–190, 554–562. [Google Scholar] [CrossRef]
  33. Huang, J.; Li, F.; Zeng, G.; Liu, W.; Huang, X.; Xiao, Z.; Wu, H.; Gu, Y.; Li, X.; He, X.; et al. Integrating hierarchical bioavailability and population distribution into potential eco-risk assessment of heavy metals in road dust: A case study in Xiandao District, Changsha city, China. Sci. Total Environ. 2016, 541, 969–976. [Google Scholar] [CrossRef] [PubMed]
  34. Huang, J.; Peng, S.; Mao, X.; Li, F.; Guo, S.; Shi, L.; Shi, Y.; Yu, H.; Zen, G. Source apportionment and spatial and quantitative ecological risk assessment of heavy metals in soils from a typical Chinese agricultural county. Process. Saf. Environ. 2019, 126, 339–347. [Google Scholar] [CrossRef]
  35. Pan, H.; Lu, X.; Lei, K. A comprehensive analysis of heavy metals in urban road dust of Xi’an, China: Contamination, source apportionment and spatial distribution. Sci. Total Environ. 2017, 609, 1361–1369. [Google Scholar] [CrossRef] [PubMed]
  36. Alleman, L.Y.; Lamaison, L.; Perdrix, E.; Robache, A.; Galloo, J. PM10 metal concentrations and source identification using positive matrix factorization and wind sectoring in a French industrial zone. Atmos. Res. 2010, 96, 612–625. [Google Scholar] [CrossRef]
  37. Amil, N.; Latif, M.T.; Khan, M.F.; Mohamad, M. Seasonal variability of PM2.5 composition and sources in the Klang Valley urban-industrial environment. Atmos. Chem. Phys. 2016, 16, 5357–5381. [Google Scholar] [CrossRef] [Green Version]
  38. Pekey, H.; Doğan, G. Application of positive matrix factorisation for the source apportionment of heavy metals in sediments: A comparison with a previous factor analysis study. Microchem. J. 2013, 106, 233–237. [Google Scholar] [CrossRef]
  39. Chen, H.; Teng, Y.; Wang, J.; Song, L.; Zuo, R. Source apportionment of sediment PAHs in the Pearl River Delta region (China) using nonnegative matrix factorization analysis with effective weighted variance solution. Sci. Total Environ. 2013, 444, 401–408. [Google Scholar] [CrossRef]
  40. Comero, S.; Vaccaro, S.; Locoro, G.; Capitani, L.D.; Gawlik, B.M. Characterization of the Danube River sediments using the PMF multivariate approach. Chemosphere 2014, 95, 329–335. [Google Scholar] [CrossRef]
  41. Xue, J.; Zhi, Y.; Yang, L.; Shi, J.; Zeng, L.; Wu, L. Positive matrix factorization as source apportionment of soil lead and cadmium around a battery plant (Changxing County, China). Environ. Sci. Pollut. Res. 2014, 21, 7698–7707. [Google Scholar] [CrossRef]
  42. Schaefer, K.; Einax, J.W. Source apportionment and geostatistics: An outstanding combination for describing metals distribution in soil. CLEAN-Soil Air Water 2016, 44, 877–884. [Google Scholar] [CrossRef]
  43. Bi, X.Y.; Feng, X.B.; Yang, Y.G.; Qiu, G.L.; Li, G.H.; Li, F.L.; Liu, T.Z.; Fu, Z.Y.; Jin, Z.S. Environmental contamination of heavy metals from zinc smelting areas in Hezhang County, western Guizhou, China. Environ. Int. 2006, 32, 883–890. [Google Scholar] [CrossRef]
  44. Bi, X.Y.; Feng, X.B.; Yang, Y.G.; Qiu, G.L.; Li, G.H. Quantitative assessment of cadmium emission from zinc smelting and its influences on the surface soils and mosses in Hezhang County, Southwestern China. Atmos. Environ. 2006, 40, 4228–4233. [Google Scholar] [CrossRef]
  45. Buat-Menard, P.; Chesselet, R. Variable influence of the atmospheric flux on the trace metal chemistry of oceanic suspended matter. Earth Planet Sci. Lett. 1979, 42, 399–411. [Google Scholar] [CrossRef]
  46. Hsu, C.; Chiang, H.; Lin, S.; Chen, M.; Lin, T.; Chen, Y. Elemental characterization and source apportionment of PM10 and PM2.5 in the western coastal area of central Taiwan. Sci. Total Environ. 2016, 541, 1139–1150. [Google Scholar] [CrossRef] [PubMed]
  47. Kara, M.; Dumanoglu, Y.; Altiok, H.; Elbir, T.; Odabasi, M.; Bayram, A. Spatial distribution and source identification of trace elements in topsoil from heavily industrialized region, Aliaga, Turkey. Environ. Monit. Assess. 2014, 186, 6017–6038. [Google Scholar] [CrossRef]
  48. Szolnoki, Z.; Farsang, A.; Puskas, I. Cumulative impacts of human activities on urban garden soils: Origin and accumulation of metals. Environ. Pollut. 2013, 177, 106–115. [Google Scholar] [CrossRef]
  49. Sutherland, R.A. Bed sediment-associated trace metals in an urban stream, Oahu. Hawaii. Environ. Geol. 2000, 39, 611–627. [Google Scholar] [CrossRef]
  50. Paatero, P.; Tapper, U. Positive matrix factorization: A non-negative factor model with optimal utilization of error estimates of data values. Environmetrics 1994, 5, 111–126. [Google Scholar] [CrossRef]
  51. Kim, E.; Hopke, P.K.; Edgerton, E.S. Improving source identification of Atlanta aerosol using temperature resolved carbon fractions in positive matrix factorization. Atmos. Environ. 2004, 38, 3349–3362. [Google Scholar] [CrossRef]
  52. Begum, B.A.; Kim, E.; Biswas, S.K.; Hopke, P.K. Investigation of sources of atmospheric aerosol at urban and semi-urban areas in Bangladesh. Atmos. Environ. 2004, 38, 3025–3038. [Google Scholar] [CrossRef]
  53. Eunhwa, J.; Mohammed, S.A.; Roy, M.H. Source apportionment of polycyclic aromatic hydrocarbons in urban air using positive matrix factorization and spatial distribution analysis. Atmos. Environ. 2013, 79, 271–285. [Google Scholar] [CrossRef]
  54. Guan, Q.; Wang, F.; Xu, C.; Pan, N.; Lin, J.; Zhao, R.; Yang, Y.; Luo, H. Source apportionment of heavy metals in agricultural soil based on PMF: A case study in Hexi Corridor, northwest China. Chemosphere 2017, 193, 189–197. [Google Scholar] [CrossRef]
  55. Hakanson, L. An ecological risk index for aquatic pollution control. a sedimentological approach. Water Res. 1980, 14, 975–1001. [Google Scholar] [CrossRef]
  56. CNEMC (China National Environmental Monitoring Centre). The Backgrounds of Soil Environment in China; China Environmental Science Press: Beijing, China, 1990.
  57. Zhang, F.G.; Pen, M.; He, L.; Ma, H.H. Sources identification, ecological risk assessment, and controlling factors of potential toxic elements in typical lead-zinc mine area, Guizhou province, Southwest China. Environ. Sci. 2022, 43, 385–397. [Google Scholar] [CrossRef]
Figure 1. Map of the study area and location of sampling sites. The map of China was downloaded from http://bzdt.ch.mnr.gov.cn/ (accessed on 10 October 2021).
Water 14 00783 g001
Figure 2. The enrichment factors (EFs) of heavy metals in topsoil.
Water 14 00783 g002
Figure 3. Spatial distribution of (a) Cd, (b) Hg, (c) Zn, (d) Pb, (e) Cu, (f) Ni, (g) Cr, (h) As, (j) pH, and (i) geological map of study area. Note: in study area, Late Permian Emeishan formation is dominated with greyish-green dense, amygdaloidal basalt, and other formations are mainly composed of limestone and dolomite.
Water 14 00783 g003
Figure 4. Factor contributions of potential ecological risk.
Water 14 00783 g004
Figure 5. Total potential ecological risk assessment of HMs in the sampling sites (a), and the contribution of HMs to potential ecological risks (b).
Water 14 00783 g005
Figure 6. Spatial distribution of potential ecological risks of Cd (a), Hg (b) and eight heavy metals (c) in study area.
Water 14 00783 g006
Table 1. Summary statistics of trace metal concentrations in topsoil samples.
ElementspHAsCdCrCuHgNiPbZn
Minimum4.63 1.230.2554.311.40.036.31938
Maximum8.12 360.2512.72430.8267.71.68191.632904629
Mean6.04 24.552.25176.489.60.1964.2102257
Median5.98 17.741.67172.583.60.1565.741173
Coefficient variation0.12 1.230.730.30.50.840.331
Standard deviation0.71 30.111.6459.148.10.1619.7258358
ABV of Guizhou a4.26200.6695.9320.1139.135.299.5
Screening value bpH < 6.5400.3150501.87090200
6.5 < pH < 7.5300.32001002.4100120250
pH > 7.5250.62501003.4190170300
Note. N = 795, pH dimensionless quantity, mg·kg−1 for other elements. a Soil average background. values of Guizhou Province reported by CNEMC [56]. b Risk screening values for soil contamination of agricultural land (GB 15618-2018) set by MEE [14].
Table 2. Environmental risk levels of heavy metals in study area.
ElementsEF < 1
No Pollution
1 ≤ EF < 2
Slight Pollution
2 ≤ EF < 5
Moderate Pollution
5 ≤ EF < 20
Significant Pollution
20 ≤ EF < 40
Very High Pollution
40 ≤ EF
Extremely High Pollution
n%n%n%n%n%n%
As58072.9615920.00486.0481.0100.0000.00
Cd19624.6527935.0923429.438610.8200.0000.00
Cr29937.6147659.87202.5200.0000.0000.00
Cu9411.8247659.8722528.3000.0000.0000.00
Hg45857.6122127.8010413.08121.5100.0000.00
Ni38848.8140050.3170.8800.0000.0000.00
Pb48360.7517121.519211.57374.65111.3810.13
Zn36846.2929537.1110513.21243.0230.3800.00
Note: n represents the number of samples for a certain risk level; % represents the proportion of samples for a certain risk level to the total number of samples.
Table 3. Pearson correlations matrix for heavy metal concentrations in topsoil.
ElementsAsCrCuNiPbZnFe2O3CdHg
As1
Cr−0.0411
Cu0.0470.256 **1
Ni−0.0040.801 **0.435 **1
Pb0.905 **−0.0380.0650.0081
Zn0.825 **0.0100.100 **0.082 *0.942 **1
Fe2O30.0220.408 **0.879 **0.595 **0.0640.108 **1
Cd0.206 **0.096 **−0.094 **0.175 **0.220 **0.294 **−0.099 **1
Hg0.357 **0.015−0.070*0.0270.289 **0.291 **−0.093 **0.506 **1
Note. ** Correlation is significant at p < 0.01 (two-tailed); * Correlation is significant at p < 0.05 (two-tailed).
Table 4. Source profile and source contribution ratios for different heavy metals by PMF.
ElementsSource Profiles/mg·kg−1Source Contribution Ratios/%
Factor 1Factor 2Factor 3Factor 4Factor 5Factor 1Factor 2Factor 3Factor 4Factor 5
As18.911.880.003.500.2677.07.70.014.21.0
Cr4.011.59108.488.9445.012.40.964.65.326.8
Cu3.300.260.0376.259.883.70.30.085.011.0
Ni1.841.1940.350.0020.692.91.963.00.032.3
Pb1.5368.424.987.199.531.774.75.47.810.4
Zn6.31113.4643.9725.1554.912.646.518.010.322.5
Cd0.000.410.131.320.100.020.76.767.45.3
Hg0.00630.00140.01490.13170.01153.80.89.079.46.9
Table 5. Assessment on potential ecological risk of heavy metals in the study area.
ElementsPERI < 150
low ecological risk
150 ≤ PERI < 300
moderate risk
300 ≤ PERI < 600
strong risk
600 ≤ PERI
quite strong risk
n (%)n (%)n (%)n (%)
HMs297 (37.36)341 (42.89)136 (17.11)21 (2.64)
E r i
Elements E r i < 40,
low ecological risk
40 ≤ E r i < 80,
moderate risk
80 ≤ E r i < 160,
strong risk
160 ≤ E r i < 320,
quite strong risk
E r i ≥ 320,
extremely strong risk
n (%)n (%)n (%)n (%)n (%)
Cd76 (9.56)337 (42.39)250 (31.45)116 (14.59)16 (2.01)
Hg268 (33.71)303 (38.11)188 (23.65)28 (3.52)8 (1.01)
Note: n represents the number of samples for a certain risk level; % represents the proportion of samples for a certain risk level to the total number of samples.
Publisher’s Note: MDPI stays neutral with regard to jurisdictional claims in published maps and institutional affiliations.

