
Risk-Based Evaluation of Improvements in Drinking Water Treatment Using Cost-Benefit Analysis
by
 , ,
, ,
Nils-Petter Sköld
1,*, 
Viktor Bergion
1,
Andreas Lindhe
1,
Alexander Keucken
2,3 and
Lars Rosén
1 1
Department of Architecture and Civil Engineering, Chalmers University of Technology, SE-412 96 Gothenburg, Sweden
2
Vatten & Miljö i Väst AB, SE-311 22 Falkenberg, Sweden
3
Water Resources Engineering, Lund University, P.O. Box 118, SE-221 00 Lund, Sweden
*
Author to whom correspondence should be addressed.
Water 2022, 14(5), 782; https://doi.org/10.3390/w14050782
Submission received: 15 December 2021
/
Revised: 26 January 2022
/
Accepted: 25 February 2022
/
Published: 2 March 2022
(This article belongs to the Special Issue Risk Assessment and Decision Support in Drinking Water Systems)
Abstract
:Reliable and safe drinking water supply requires adequate risk management. Decision support models can aid decisionmakers to effectively evaluate risk mitigation measures and allocate societal resources. Here, a Swedish case study illustrates how the installation of ultrafiltration membranes can be evaluated by combining risk assessment and cost-benefit analysis. Quantitative microbial risk assessment was used to assess several contamination sources and estimate the achieved risk reduction from waterborne pathogens using Campylobacter, Norovirus, and Cryptosporidium as reference pathogens. The societal value of the improved water quality was estimated in the cost-benefit analysis by monetising the gained quality adjusted life years and aesthetic water quality improvements. The calculated net present value (mean of 7 MEUR) indicated that the installation of the ultrafiltration membranes was a sound investment from a societal economic perspective. The ultrafiltration membranes reduced the annual probability of infection from 3 × 10⁻² to 10−7, well below the U.S. EPA’s acceptable level, as well as improving the aesthetic quality of the drinking water. The results provide a novel example of the importance for water distributors to consider not only health-related metrics when evaluating treatment options or monitoring the drinking water quality, but to also consider the aesthetic quality of the drinking water.
1. Introduction
Good decisions, or rather good outcomes, are always sought after in any decision-making process. Yet, in more complex fields, the formation of good decision often requires a deeper form of analysis [1,2]. One such field is the management and handling of risk [3,4,5]. Risk is defined as the combination of a hazardous event’s expected consequence and its probability of occurrence. The International Organisation for Standardisation (ISO) has suggested an iterative risk management approach that involves the assessment and possible treatment of risks, as well as a continuous communication and monitoring of the process [6].
Risk management is of particular importance within the drinking water sector, as insufficiently treated drinking water may result in high costs to society, due to, e.g., water supply interruptions, chemical exposure, and waterborne diseases [7,8,9]. To handle this, the World Health Organisation (WHO) suggests the use of comprehensive and holistic approaches, e.g., water safety plans (WSPs), to ensure a safe and reliable supply of drinking water [10]. WSP is meant to be implemented as part of a comprehensive risk management approach, including an assessment of the drinking water system’s sub-systems, the raw water source, the drinking water treatment plant (DWTP), and the supply network [11,12].
Quantitative microbial risk assessment (QMRA) is an established approach to estimate the impact of waterborne diseases [13,14,15]. It is an assessment which combines the information of a pathogen exposure and its health effects to generate a quantitative measure of the risk, generally reported as the probability of infection (Pinf), quality adjusted life years (QALYs), or disability adjusted life years (DALYs) [13,14]. The Pinf only assesses a pathogen’s likelihood of infection, whereas the QALY and DALY also take the morbidity and mortality of a disease into account, assessing a person’s health-related impact with a single metric [16].
Burgman [5] states that a risk assessment should account for the full extent of possibilities, at the tails of the distribution. The total risk of a system is, therefore, best assessed via a holistic approach, which takes both expected and unexpected, or rare, events into account. The inclusion of several hazardous events can be qualitatively or semi-quantitatively considered or quantified to a total risk via the utilisation of a probability consequence diagram [17]. In a drinking water system (DWS), the assessed total risk, in terms of, e.g., Pinf, QALYs or DALYs, can be compared to an acceptable or tolerable risk in order to determine whether any risk reducing measures are required. Here, drinking water producers commonly use the acceptable risk suggested by the WHO, i.e., 10−6 DALY per person per year [10,14] or the U.S. EPA of an annual Pinf of 10−4 [18].
Risk-based decision models for evaluating and comparing microbial risk mitigation measures, e.g., cost benefit analysis (CBA), are available to aid decisionmakers in order to use societal resources effectively, e.g., [13,19]. Hu et al. [20] evaluated the microbial, chemical, and aesthetic quality of drinking water, but they did not evaluate any risk mitigation measures. Furthermore, only parts of mitigation measures’ effects (risk reduction, etc.) [21] are commonly considered, and thus important benefits can be omitted, especially intangible and social factors such as aesthetic qualities. Investigations of decisions already taken (ex-post) may provide additional insight into what aspects justified the decision. Ex-post analysis may also provide more accurate estimations of costs and benefits that were difficult to quantify ex-ante, and have been applied for evaluating, e.g., dams [22], landslide debris flows [23], sanitation interventions [24], and mitigation of eutrophication [25]. In this study, QMRA and CBA were used in combination to provide an estimation on the analysed measure’s effect on microbial health risk and its societal profitability.
The overall aim of this study was to conduct an ex-post analysis of the recently installed ultrafiltration (UF) membranes at the Kvarnagårdens DWTP in order to determine their societal value and assess the decision outcome in monetary terms. The specific objectives of the study were to
- ➢
- Establish a decision support model based on CBA and QMRA, which included the three steps (i–iii):
- i.
- Set up a QMRA-model for Kvarnagården DWTP, including both surface water and groundwater sources;
- ii.
- Identify, estimate, and (as far as possible) monetise relevant cost and benefits from the installed UF membranes at the DWTP;
- iii.
- Combine the QMRA results with additional benefits and costs in a CBA to estimate whether the installation of UF membranes was beneficial from a societal point of view.
- ➢
- We analysed uncertainties using a probabilistic model approach in order to investigate how uncertainties in the model affected the results.
2. Methods
The health-related risk reduction of the installed UF membrane (Ultrafiltration membrane: X-flow Aquaflex 55) at Kvarnagården DWTP was estimated using QMRA and quantified in terms of number of reduced infections and gained QALYs per year. The latter was also monetised and analysed, in combination with aesthetic quality improvements and costs, in a CBA, in order to determine if the installation of the UF membranes was societally profitable.
2.1. Limitations
The data obtained in the analyses were solely based on literature findings and previous measurements by, e.g., the drinking water producers Vatten och miljö i Väst AB (VIVAB) or the Public Health Agency of Sweden. Only microbial risk reduction was included. Any chemical risk reduction which may have been acquired from the UF membranes was excluded, as their 20 nm pore size is unlikely to remove any chemicals <800 Da from the effluent [10].
2.2. Study Area
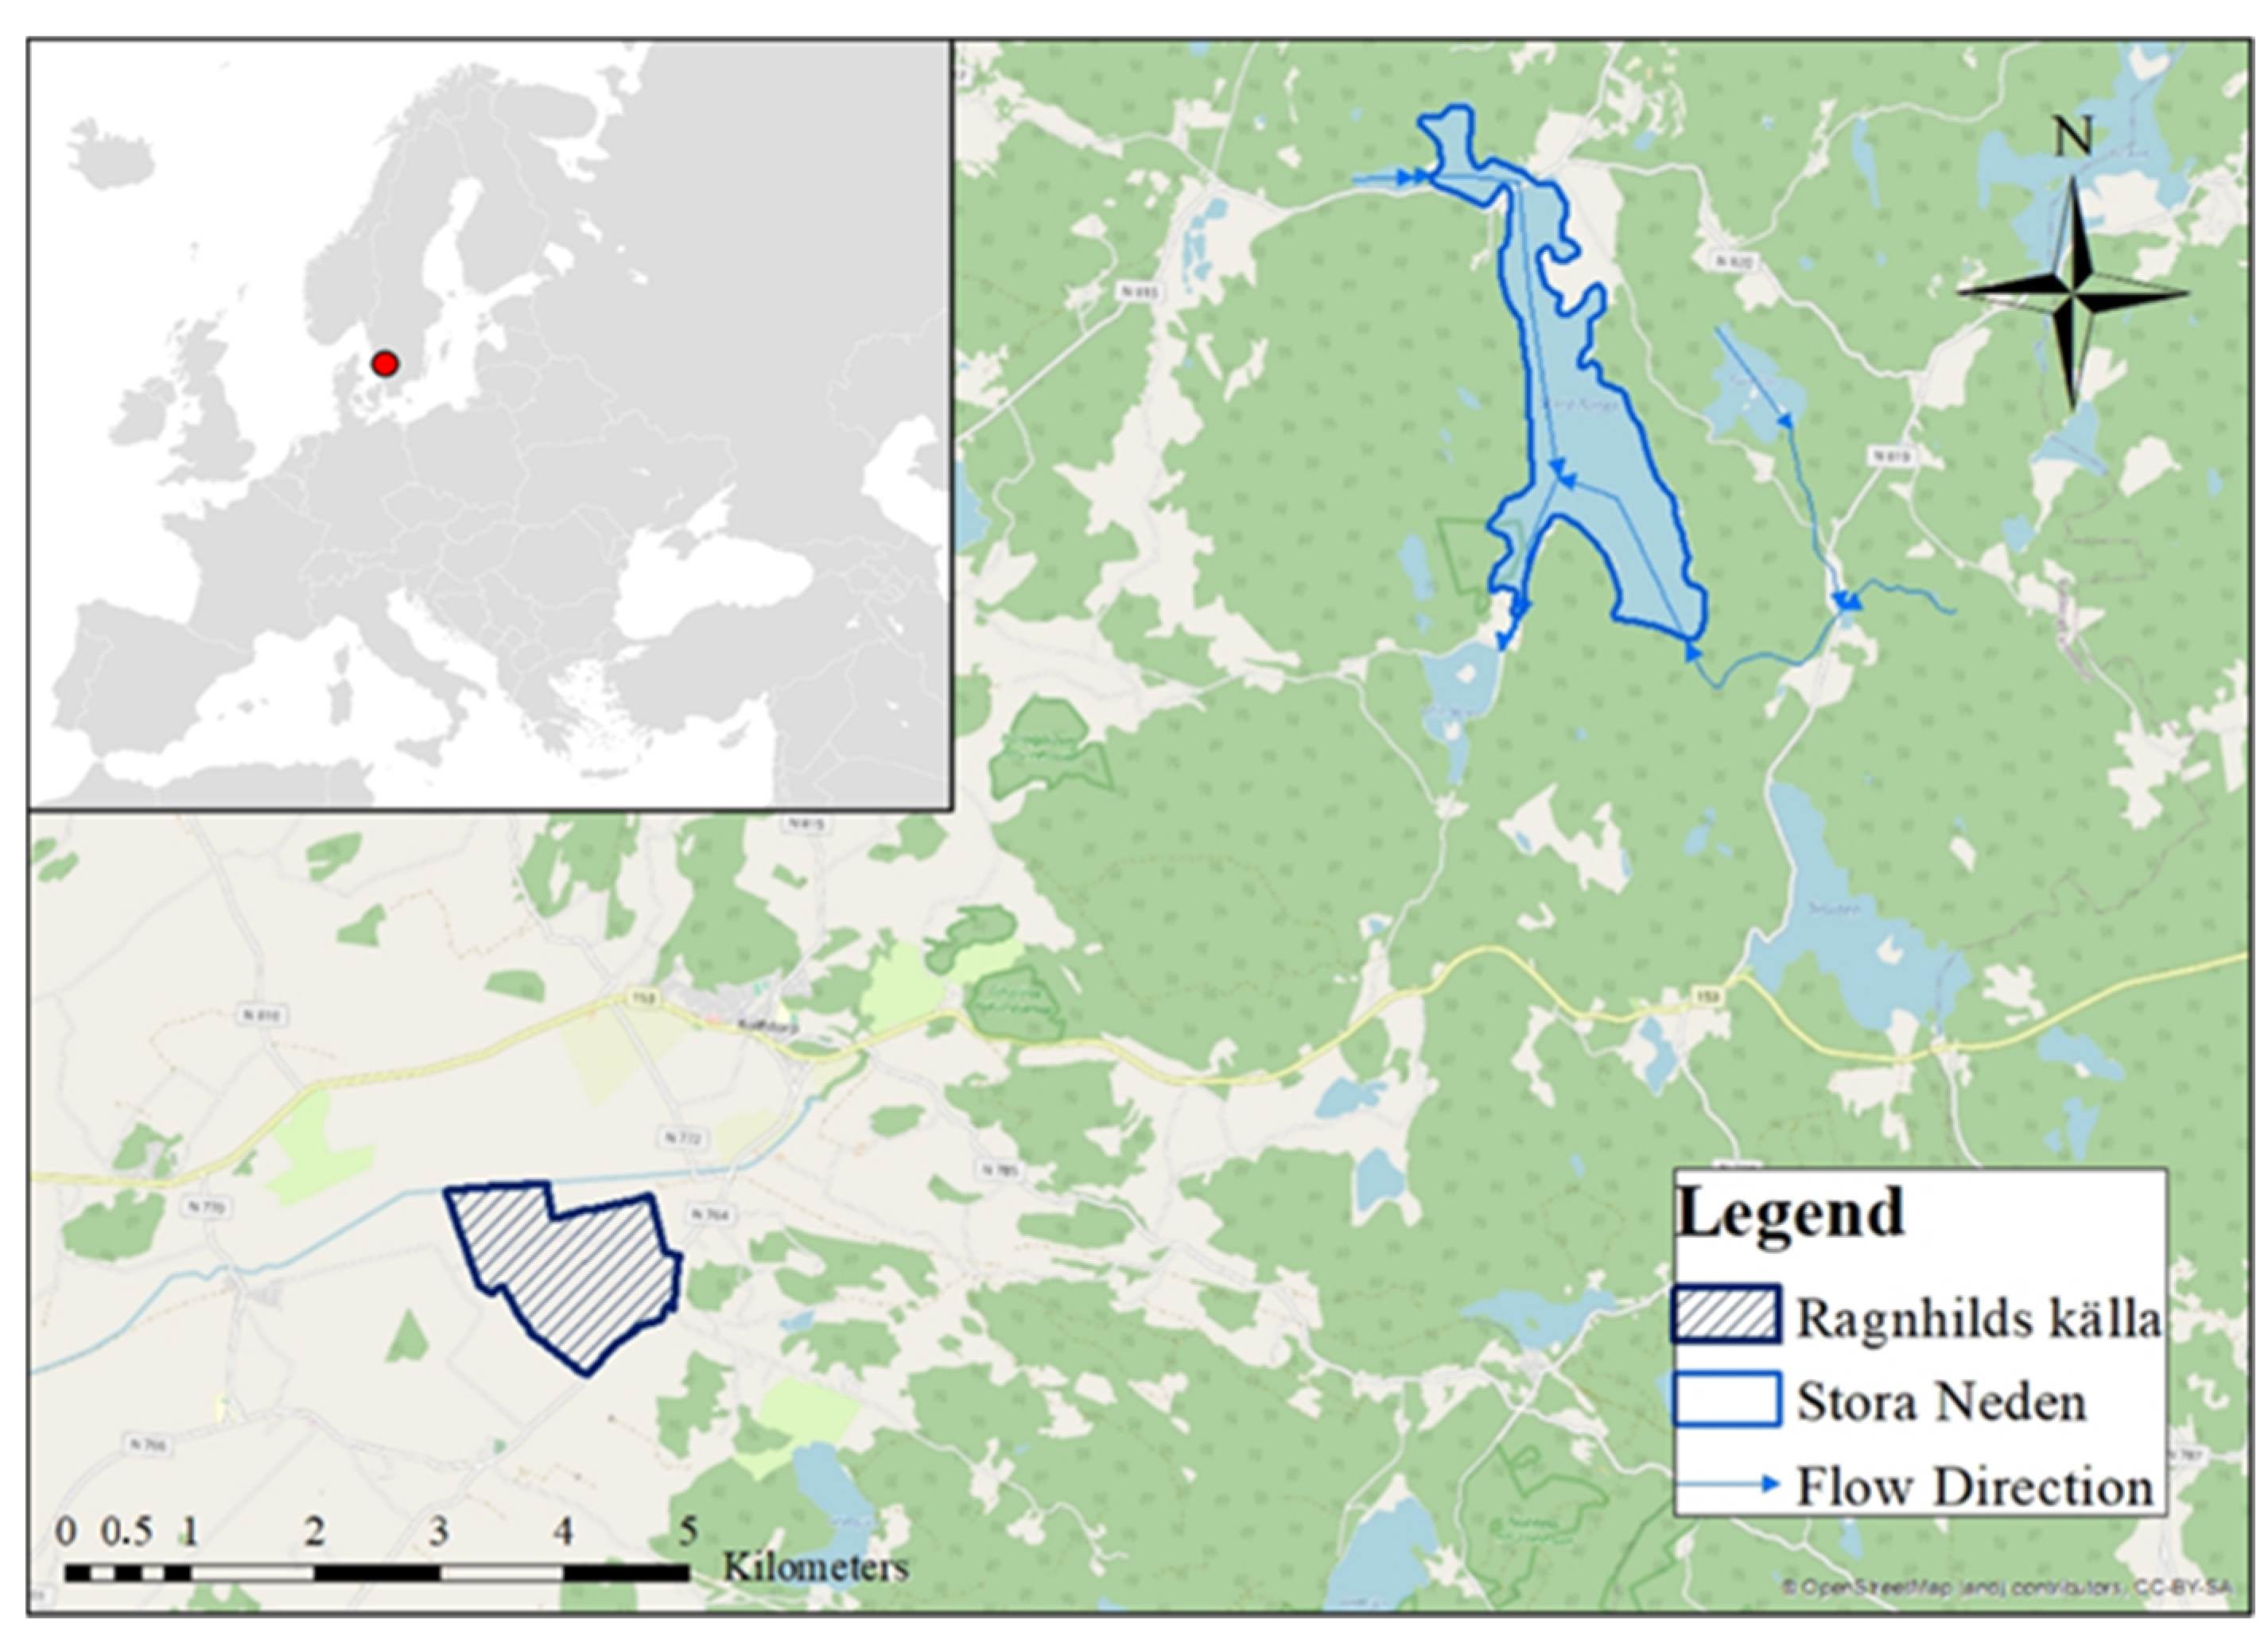
Kvarnagården DWTP is located in the municipality of Varberg, located in the southwest part of Sweden. It supplies drinking water to 99% of the municipality’s 62,000 inhabitants, as well as its local industries. The DWTP combines the raw water of two distinct sources. The lake Stora Neden (Figure 1) currently constitutes for about 80 ± 5% of the DWTP’s total intake volume, while the aquifer Ragnhilds källa covers the remaining 20 ± 5% of the volume. Both of these sources have been classified as good to moderately good for their utilisation as drinking water sources [26]. Increasing levels of Natural Organic Matter (NOM) have been observed in the past years at the lake Stora Neden. NOM does not pose any direct threat to the health of the drinking water consumers, but it may affect the aesthetic quality of the drinking water, primarily causing taste, colour, and odour problems.
The area of the lake Stora Neden has been measured to about 2,900,000 m2 with an estimated volume of approximately 61,100,000 m3. The thermocline of the lake has been measured to vary between 7 and 9 m [27].
The Swedish water and wastewater association (SWWA) has recommended that DWTPs, which utilise surface water as a raw water source, should have at least two microbial barriers in their treatment chain [28]. Here, the previous treatment steps at Kvarnagården DWTP consisted of one separation step, rapid sand filter, followed by two disinfection steps, UV at 250 Jm−2, and a chloramine dosage, before the distribution network. Note that only the UV disinfection is considered as a microbial barrier by the Swedish Food Agency (SFA) [29]. The UF membranes were therefore installed to ensure that the DWTP met the SFA and SWWA requirement of two microbial barriers, as well as to provide the capacity to handle the increasing levels of NOM in lake Stora Neden.
The decision to implement the UF membranes as an additional treatment step was decided by VIVAB on the basis of previous decision support analyses, e.g., [30], which mainly focused on the health-related features of the treatment, rather than on the economic aspects. A more extensive valuation of the economic aspects of the implemented measure, to evaluate the decision ex-post, was therefore of interest for VIVAB in order to improve the strength of available decision support material for future decisions.
2.3. QMRA-Model
The QMRA was set up in a similar way to that of Bergion, Lindhe, Sokolova, and Rosén [19,31] by assessing the health-related impact of the improved treatment at Kvarnagården DWTP, in a number of gained QALYs, using the incidence data for three reference pathogens Campylobacter, Norovirus, and Cryptosporidium (each pathogen represented their respective pathogen group in the corresponding order: bacteria, virus, and protozoa). The selection was based on the pathogens’ low infection doses, their prevalence in Swedish waters, and their connection to previous waterborne disease outbreaks in Sweden [32,33]. The total risk of the DWS was estimated on the basis of five hazardous events, defined on the basis of the information regarding the regulations of Stora Neden’s and Ragnhilds källa’s water protection areas.
The first hazardous event was the expected load, i.e., the baseline risk level (with an estimated annual probability of occurrence (p1) of 1) from the on-site wastewater treatment systems (OWTSs) within the lake Stora Neden’s catchment area. The second event, with annual p2 = 1 × 10⁻², was the leakage of a manure tank within the pumping cone of the wells at the aquifer Ragnhilds källa. The third event, with annual p3 = 5 × 10⁻³, was based on the same pathogen source as the base-line risk but was assessed to determine the possible impact of a dysfunctional UV barrier. The fourth event, with annual p4 = 1 × 10⁻³, was based on an event of a manure transport driving into the lake Stora Neden. The fifth event, with annual p5 = 2 × 10⁻⁵, involved a pipe-burst in an OWTS nearby the aquifer Ragnhilds källa, given that all residents of the connected household discharged pathogens to the sewage system, leaking untreated sewage directly into the aquifer. The assumptions used for estimating the different events probability of occurrence (p1–5) is available in the Supplementary Material [34,35,36,37,38,39,40,41,42,43,44,45,46,47,48,49,50,51,52,53,54,55,56,57,58,59,60,61,62,63,64,65,66,67,68,69].
The consequence of a hazardous event (c) is estimated as the event’s total number of lost QALYs () and was calculated as
where N represents the total number of assessed pathogens, is a pathogen’s number of annually infected drinking water consumers (calculated by multiplying t the total number of drinking water consumers with the pathogens annual probability of infection), and is a pathogen’s effect on the infected consumer’s QALY (an infection’s impact on a person’s QALY; Campylobacter = 0.0165, Norovirus = 0.0009, Cryptosporidium = 0.0035) [19,70]. The Pinf for each respective pathogen was calculated as
where r represents a pathogen’s infectivity, described as a sample from a beta distribution with statistical parameters set for each pathogen’s dose response, and D is the simulated daily pathogen dose. The pathogen’s annual probability of infection was calculated as
where d is the expected number of days per year that the set dose, D, will be present in the drinking water.
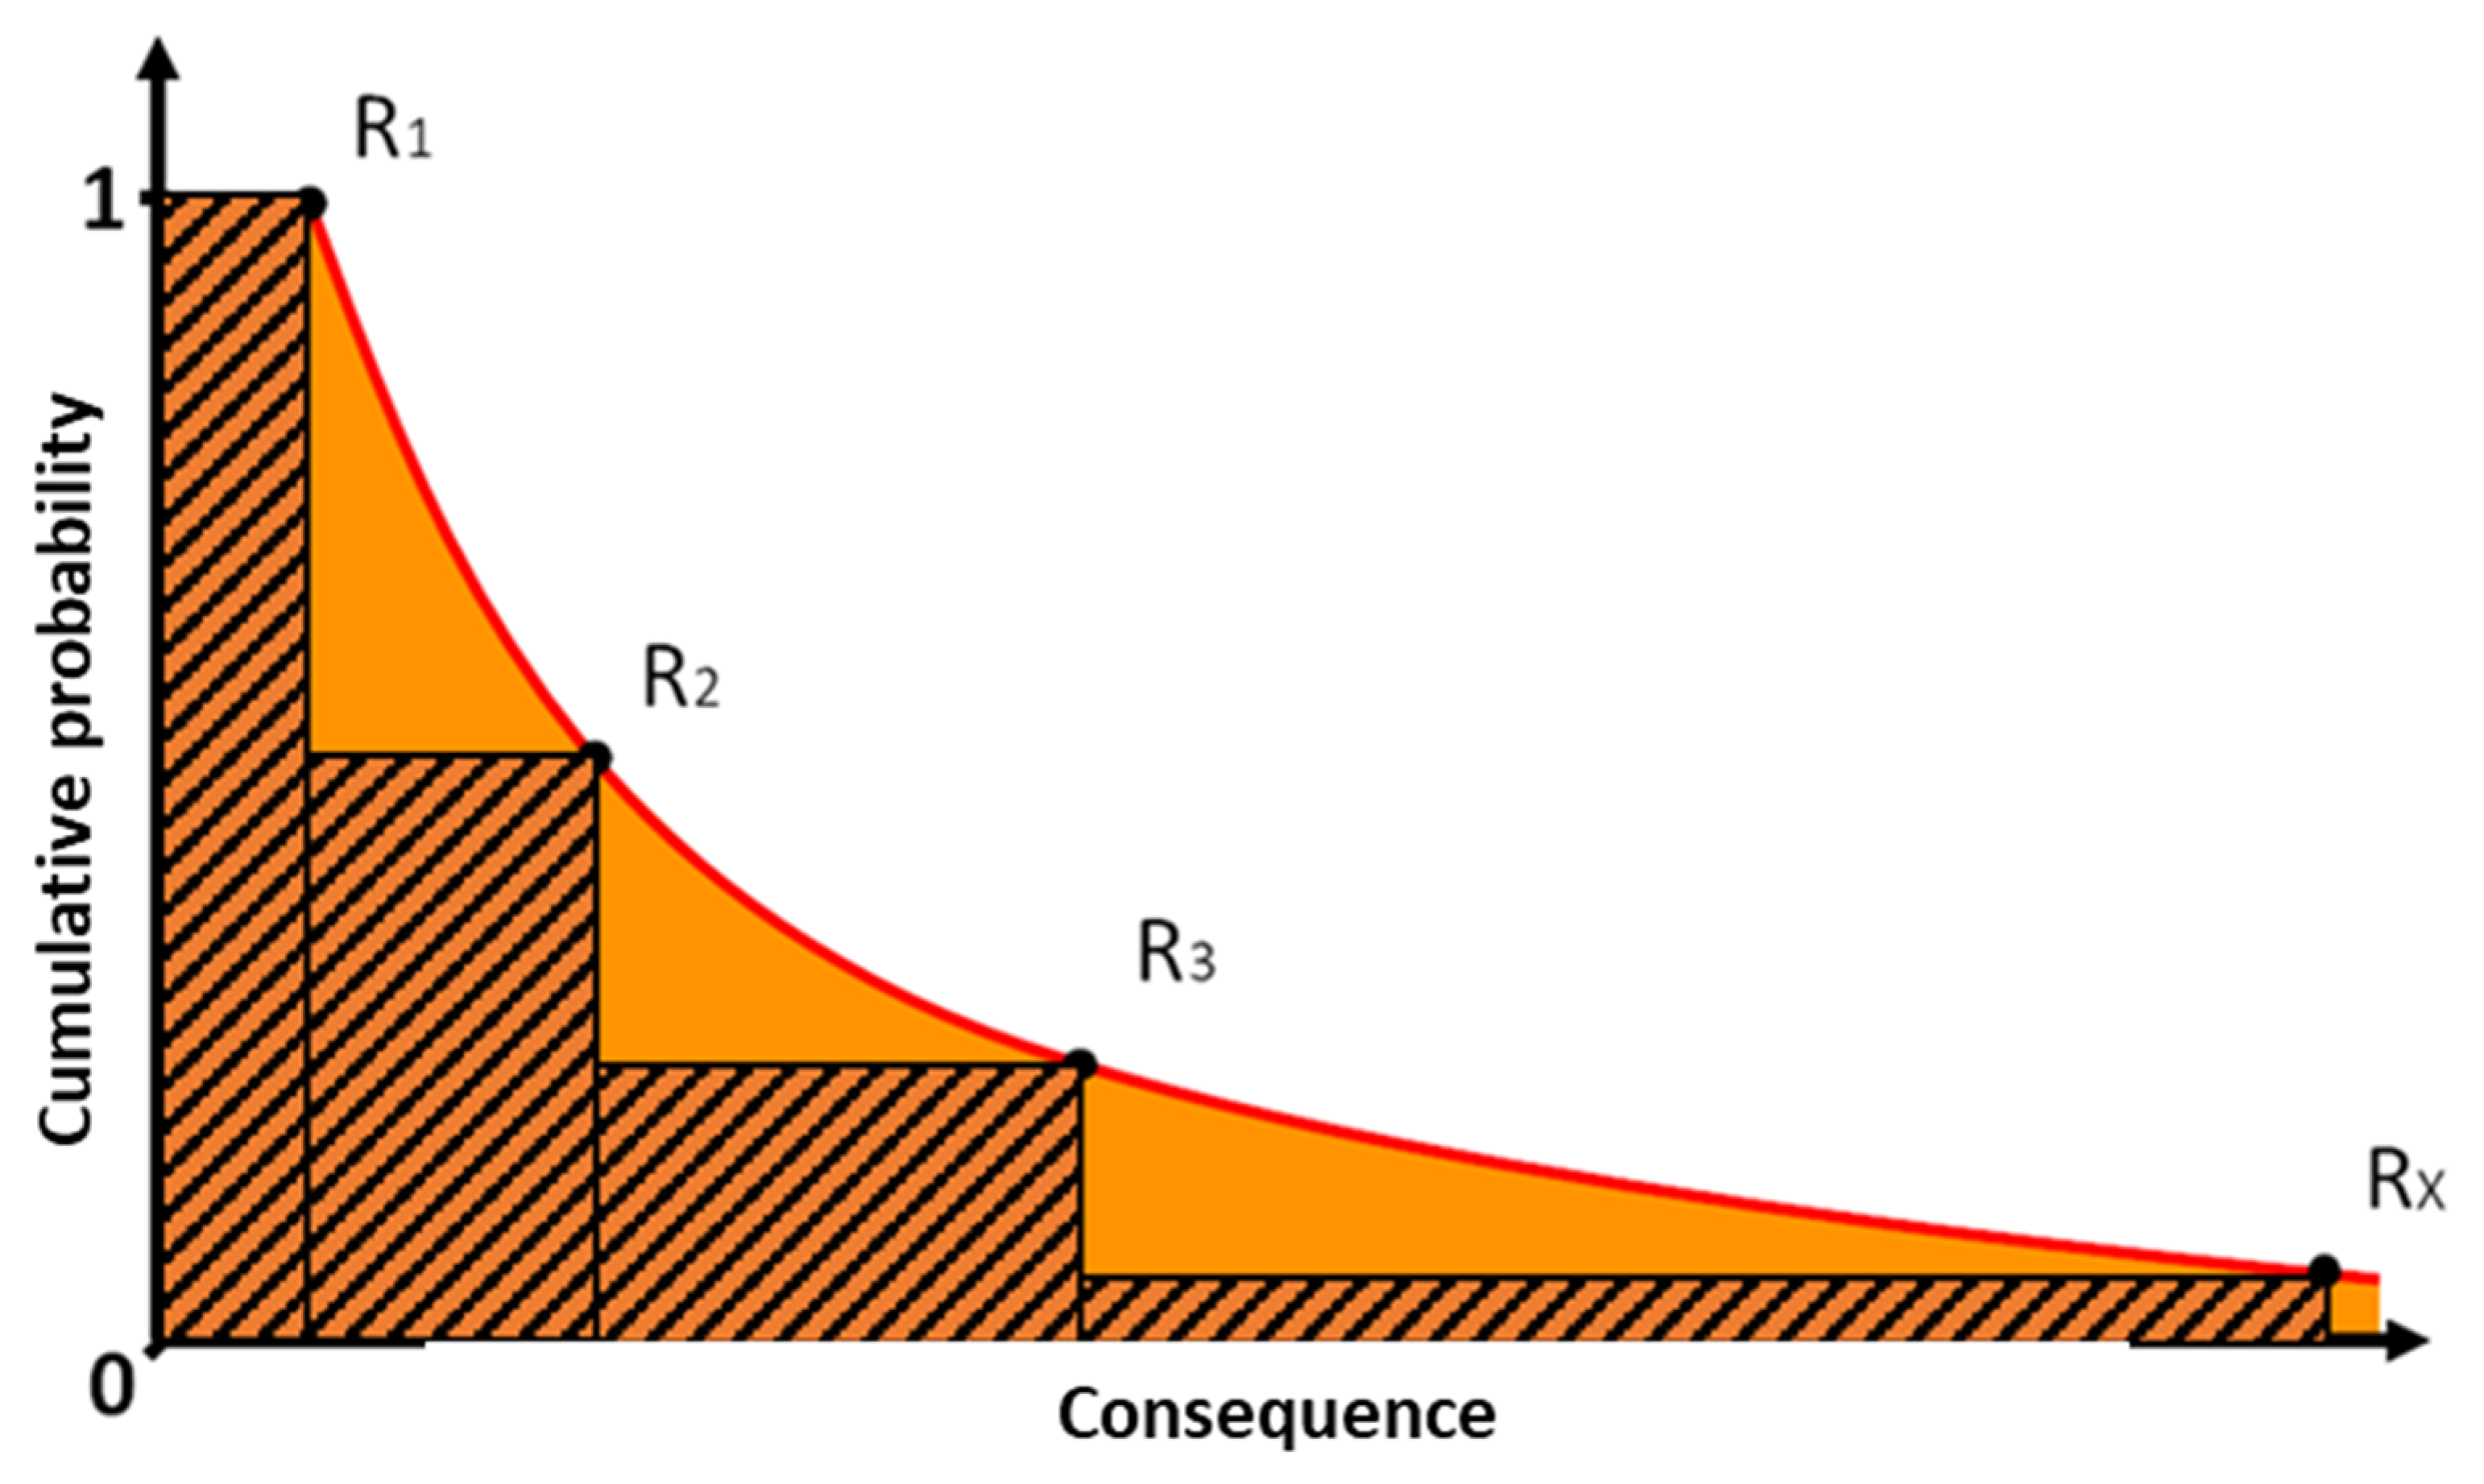
The total microbial risk (), i.e., the combined risk for all assessed hazardous events, was then estimated as the total area below a risk graph in a probability consequence diagram (see Figure 2). The integral of the risk graph was simplified and calculated as
where X is the total number of assessed events, is an event’s consequence, and is the same event’s cumulative probability of occurrence.
A more detailed description of how the contamination of the drinking water was evaluated can be found in the Supplementary Material, including the raw water source characterisation, treatment chain, and risk characterisation.
Lastly, the expected number of gained QALYs from the installation of UF membrane filtration was calculated as
The UF membrane risk reduction was seen as independent for each year over the analysed time horizon, and the annual risk reduction was assigned using a discrete distribution. The combined uncertainty of the UF membrane risk reduction over the analysed time horizon was calculated by assigning each year with the calculated discrete distribution of an independent year.
2.4. CBA Model
The net present value (NPV) of the UF membranes was calculated as
where B and C are, respectively, the benefits and costs in a year, t; T is the set time horizon; and r is the applied discount rate. T was set to 50 years with an a corresponding discount rate of 3.5%, in accordance with the Swedish Transport Administration [71].
Costs for investments and maintenance were directly based on the actual cost for VIVAB. Investment cost was 10 MEUR, and the annual maintenance was 0.2 MEUR. Note that these values were considered as certainties, as they were assessed after installing the UF membranes and did not include any variability or uncertainty in the analysis.
Benefits (B) were calculated as
where are the annual health benefits; are the annual benefits related to increased water quality in terms of taste, odour, and colour; and Bother are the non-monetised benefits. was identified as the improved treatments gained QALYs and is calculated as
where is the monetary value of a QALY, set as a triangular distribution of 70,000 (min), 100,000 (mode), and 130,000 (max) EUR. The distribution’s values VQALY is based on the findings of Ryen and Svensson [72] and the Swedish governments revealed preference value for a QALY [73].
The drinking water’s aesthetic improvement was identified, albeit not quantified, by VIVAB’s customer service. Since the UF membrane installation in 2016, the customer service office has received an increasing number of verbal appreciations regarding the municipality’s drinking water quality and is likely explained by the UF membrane reduction of NOM in the distributed drinking water. Further, the monetary value of was set to beta-PERT distributions of EUR 20 (min), 40 (mode), and 60 (max) per household per year for a total of 20,000 households. The monetary valuation was defined on the basis of the findings of three contingent valuation studies [74,75,76], one household production study [77], and the municipality of Varberg’s 2017 water bill (which includes the supply of drinking water and the collection of wastewater but excludes the collection of storm water) of EUR 183 per apartment per year.
Bother involved benefits which have been identified but not monetised, e.g., the benefits for the water-dependent industries in the municipality, which is DWTP’s main industrial user, and the reduced biofilm in the DWS’s distribution network. Further, if the output’s minimum value () is negative, the required cumulative value of the non-monetised benefits, to ensure a positive NPV, can be calculated as
The model’s input variables’ sensitivity was analysed using the Spearman rank approach to determine their respective impact on the result. A variable’s Spearman rank determines its correlation to the final outcome of the result. The Spearman rank can have a value between −1 and 1 and describes the strength and direction of the monotonic relationship between two variables. A value close to indicates a strong relationship, and hence the analysed variable is of major importance for the results and its uncertainties. A value close to zero indicates a weak relationship. A positive rank implies a positive correlation with the result, i.e., that the result varies (increases or decreases) in the same direction as the variable, whereas a negative value implies a negative correlation to the result, i.e., that the result varies in the opposite direction to the variable. Note that a Spearman rank analysis is only applicable to monotonic functions, i.e., functions which are either continuously decreasing or increasing.
2.5. Software
All calculations were performed as Monte Carlo simulations, using the Microsoft Excel add-in software Palisade @RISK, version 7.5.1., at 10,000 iterations. The Monte Carlo simulation’s random sampling allows the model to combine the input variables’ uncertainties into a combined uncertainty for the output variable.
3. Results and Discussion
3.1. QMRA Results
The mean annual Pinf for the assessed pathogens in the water supply system prior installation of UF membranes was calculated to 3 × 10⁻² (1 × 10⁻⁵ for Campylobacter, 3 × 10⁻² for Norovirus, 1 × 10⁻⁴ for Cryptosporidium). The mean Pinf value for the assessed pathogens exceeded the acceptable risk of 10−4, recommended by the U.S. EPA [18], by a factor of 300, and is equal to approximately 1800 infections in a year. In addition, the annual probability of exceeding the acceptable risk was estimated to be 53%, and an annual probability of a major waterborne disease outbreak, infecting more than 10,000 people, was estimated to be 4.6%. Note that the U.S. EPA recommendation refers to Giardia infections [18], and it may be more appropriate to compare their standard to the assessed annual Pinf of Cryptosporidium (estimated at just above 1 × 10⁻⁴), which would characterize the risk prior to the UF membrane installation as more or less acceptable.
Since the UF membranes were installed in 2016, the mean annual Pinf of the assessed pathogens has been reduced to 10−7, and the annual probability of exceeding a Pinf of 10−4 is currently less than 0.01%. It is, therefore, clear that the UF membranes have effectively safeguarded the DWTP’s treatment efficiency.
The mean total health improvement of the UF membranes, illustrated by the green area in Figure 3, was calculated at 1.8 (P5 = 3 × 10⁻⁴; P95 = 8.7) gained QALYs per year. Note that the baseline risk accounted for approximately 1.7 of the total mean’s 1.8 lost QALYs per year. Hence, the largest improvements from the installation of the UF membranes came from the reduction of the baseline risk.
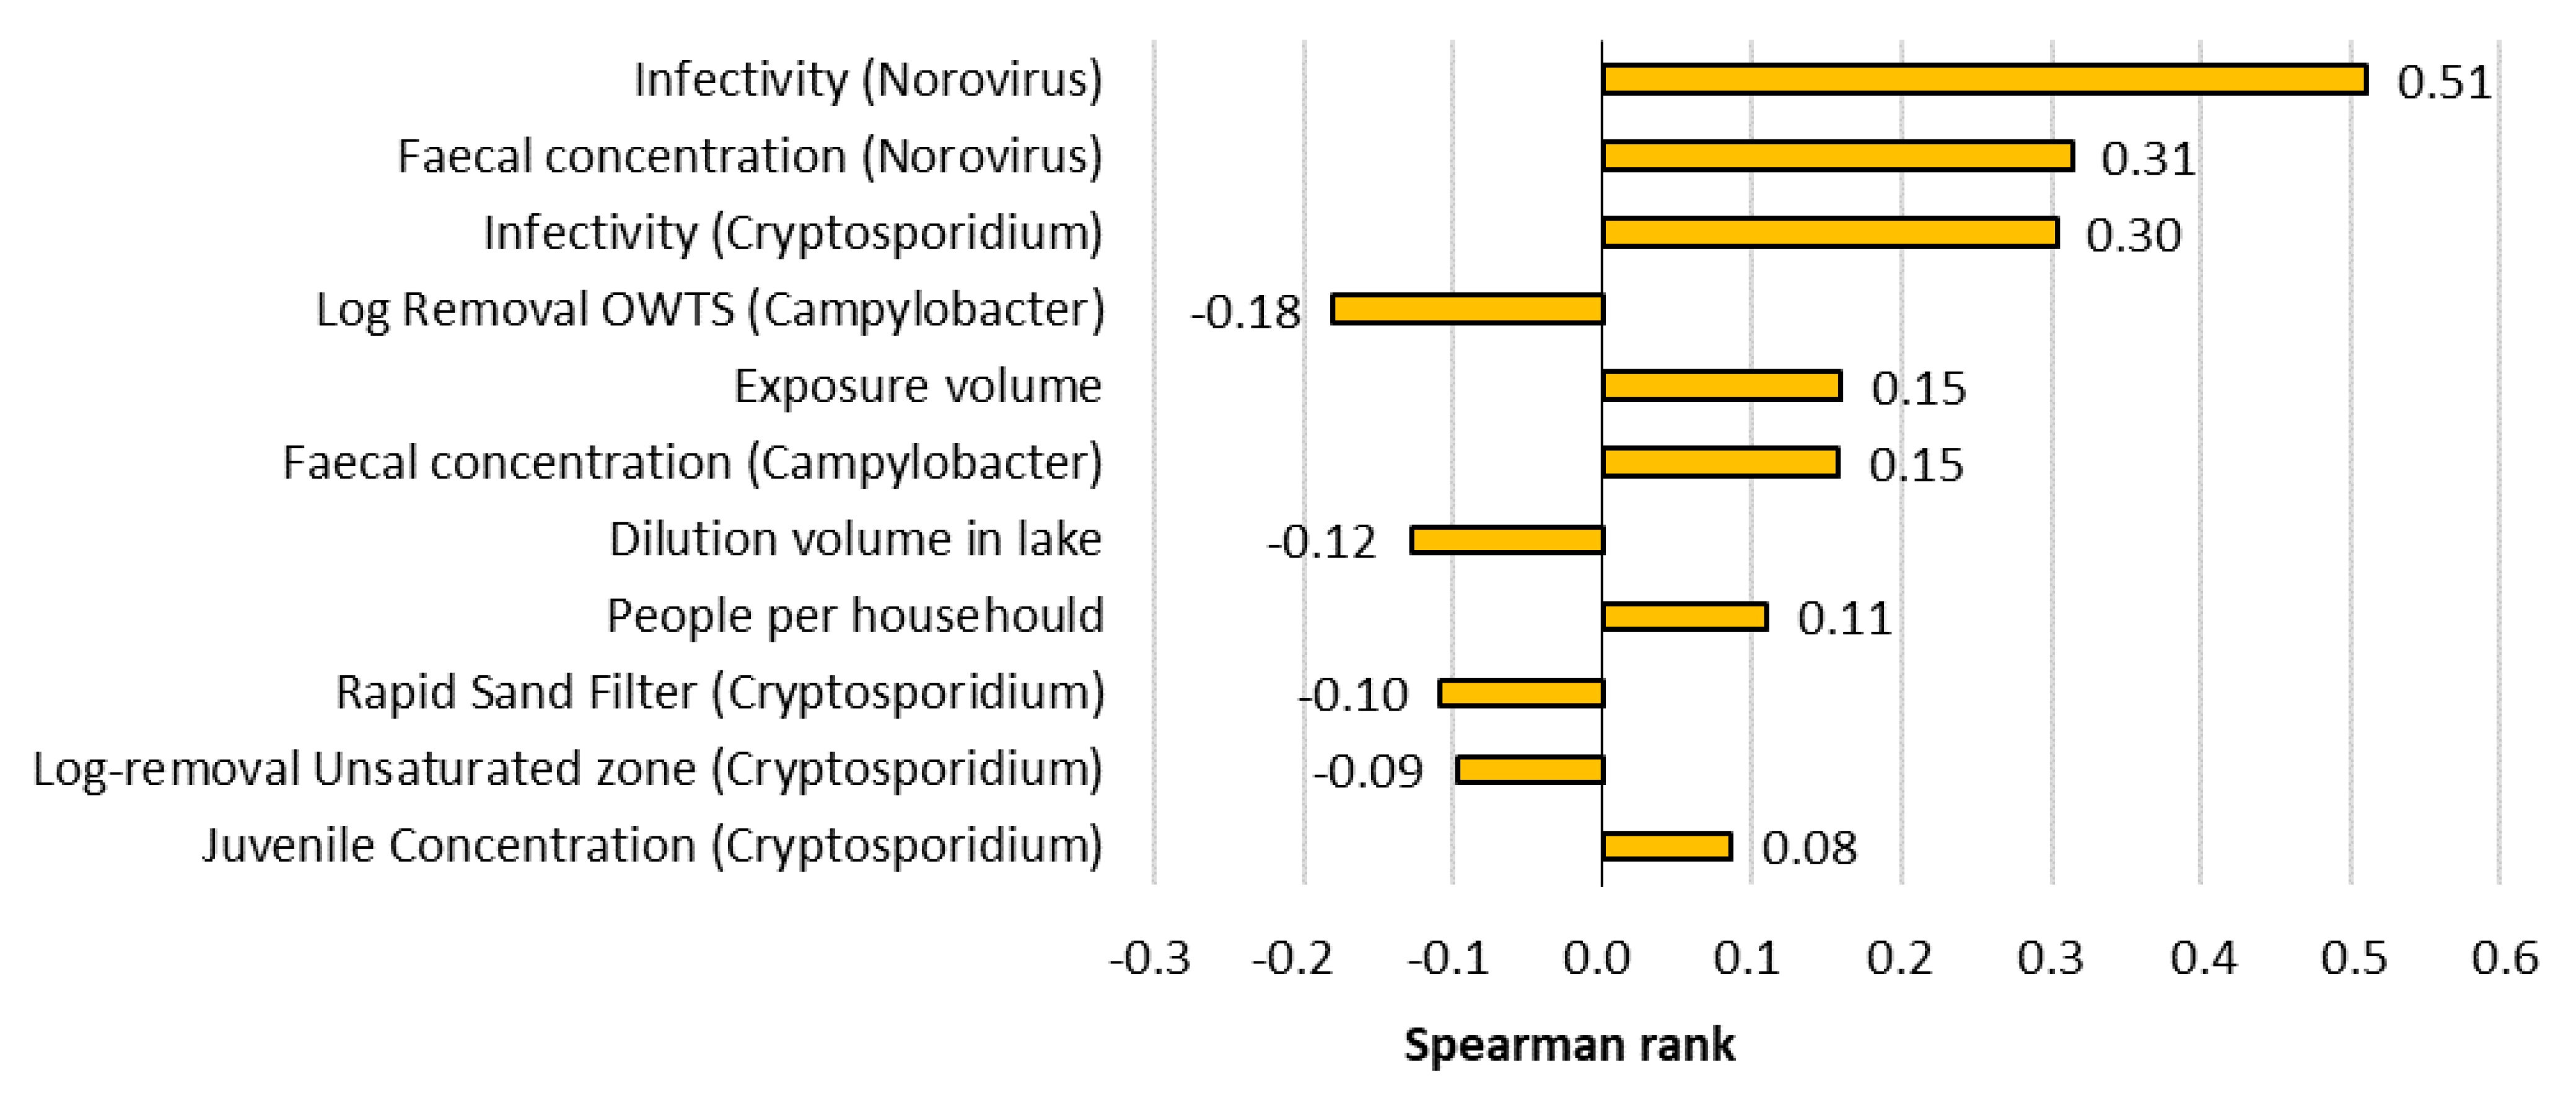
A sensitivity analysis of the QMRA result (Figure 4) showed that the infectivity of the pathogens (primarily Norovirus (α = 0.04 and β = 0.055)), faecal concentrations of pathogens (given infection), Log-removal of the OWTS, and exposure volume (i.e., consumed amount of unboiled water per person per day) appeared to be the variables that had the highest impact on the uncertainty of the result.
The high impact of the Norovirus infectivity may, to some extent, explain why no major waterborne disease outbreaks has yet been recorded in Varberg, even though the risk of an outbreak appears to have been relatively high (approximately 5% per year) prior to the UF membrane installation. Waterborne disease outbreaks caused by pathogens with low disease burdens (e.g., Norovirus) may have passed below the threshold of detection and may as such not have been recognised by the general public [13]. Another explanation for why no waterborne disease outbreaks have been recorded in Varberg may be that the actual pathogen load is lower than what has been estimated in the model, e.g., due to an underestimation of the impact of the raw water sources’ established water protection areas and the retention time.
3.2. CBA Results
The NPV of installing UF membranes (Figure 5) was calculated as 7 (P5 = −6; P95 = +17) MEUR, and the probability of a NPV larger than zero was estimated at 86%. If the non-monetised benefits exceeded 0.4 MEUR per year, the probability of a positive NPV would be 100%. The amount of 0.4 MEUR per year can be compared with the mean annual value of the health-related and aesthetic benefits, calculated as 0.17 and 0.80 MEUR, respectively.
The likelihood of a positive NPV indicated that the installation of UF membranes at Kvarnagården’s DWTP was a sound investment, a result that may be useful for other water distributors, considering adding risk mitigating measures in their DWTP.
When we compared the proportion of each monetised benefit (i.e., reduced disease burden (health) and aesthetic improvements of the drinking water quality) against the UF membrane costs, as shown in Figure 5, the aesthetic benefits appeared to overshadow the health-related benefits. Further, given the suggested valuation methods, the NPV would have been negative if the aesthetic benefits were excluded from the calculation.
The analysed value of the health-related benefit was estimated to, as far as possible, represent the society’s general WTP to pay for an improved health, i.e., improved QALYs. Put in perspective in terms of the Swedish gross domestic product (GDP), the value of a QALY fell in the range between 1.5 and 3 times the 2015 Swedish GDP per capita [78]. Note that this general societal WTP may be lower than the actual cost of a lost QALY.
The Swedish Civil Contingencies Agency (SCCA) report that the total cost of the 2011 cryptosporidium outbreak in Östersund (27,000 people were estimated to have been infected during the outbreak) ranged between 14 and 22 MEUR [79]. Further, by combining this cost with the findings of Batz, Hoffmann, and Morris [70] (a cryptosporidium infection is estimated to decrease a person’s health with 0.0035 QALY per infection), the value of a lost QALY would range between EUR 150,000 and 230,000, or 3.5 to 5.5 times the 2015 Swedish GDP per capita, for a water-borne disease outbreak. It is therefore possible that the value of a QALY may be valued higher in the drinking water sector than in the general domain, as the failure to distribute a sufficiently treated drinking water may have such extensive consequences. The findings of [79] provide an approximately twice as high value for a QALY as the findings of Ryen and Svensson [72] and the Swedish government’s revealed preference value for a QALY [73], which ranges from approximately EUR 70,000 to 130,000.
By using the valuation of the health-related benefits, in line with the findings of the SCCA, one can see how a higher valuation would impact the calculated results by changing the mean value of the health-related benefits to 7 (P5 = 1; P95 = +16) and the mean NPV of the aesthetic and health-related benefits to 10 (P5 = −5; P95 = +23). The aesthetic benefits would, however, still account for the major part of the NPV and be associated with the highest Spearman rank value (reduced from 0.92 to 0.78 if the higher valuation of QALY is used).
It should be noted that the valuation methods for the aesthetic and the health-related benefits differ, which may explain why the aesthetic benefits receive a comparatively higher valuation in the study than the health-related benefits: ex-ante valuation (e.g., contingent valuation for aesthetic water quality improvements) acknowledges people’s risk preferences, whereas ex-post valuations (e.g., revealed preference value for a QALY) do not.
It is, however, intriguing that the health-related benefits had such little impact on the NPV, even though the reduction of the previous mean Pinf (0.03), i.e., almost 300 times greater than the U.S. EPA’s recommended acceptable risk, was reduced to well below acceptable levels (10−7). This is likely explained by the low morbidity of the Norovirus (which is the main contributor to the high annual Pinf -value), which greatly reduces the amount of QALY that is impacted by the disease. Similar results have, however, also been found by Bergion, Lindhe, Sokolova, and Rosén [19,80], indicating that safe drinking water should be valued for more than just its health-related cost and benefits.
Social factors, e.g., social capital, appears to play major part for the economic value of a safe and reliable water supply, although in this study, the social factors were likely covered by the aesthetic benefits. Notwithstanding, general methods for the inclusion of social factors should be developed to further improve the creation of holistic and comprehensive decision support models for the drinking water sector.
This study may not have assigned the improved aesthetic quality with an exact monetary value or shown a novel method of how to best assess it, but it shows that it can have an impact on the net present value. Aesthetic water quality can have a substantial impact on people’s risk perception, as well as the willingness to drink tap water or buy bottled water [20,81]. We therefore suggest that further research should be conducted to increase our understanding of the societal value of an aesthetically pleasing water quality and how to better incorporate it in decision support models.
The results also show the importance for water distributors to both monitor parameters that have an impact on the aesthetic quality of the drinking water, e.g., turbidity, colour, and smell, but to also document possible complaints and trends regarding the water quality.
4. Conclusions
The results show the importance of having a holistic approach when assessing the societal economic value of improvements in drinking water treatment. The results from this study are expected to be useful for decisionmakers and strategic planners in water management organisations. The study provides an example on how the societal economic value of a measure can be evaluated ex-post. It also shows the importance of not only focusing on health-related aspects when evaluating either different treatment options or choosing a raw water source and to also include soft variables in the decision-making process, e.g., how consumers may perceive or experience the water quality.
Overall, the installation of UF membranes at Kvarnagården’s DWTP appears to have been a sound investment from both a health-related as well as an economic perspective. The mean annual Pinf has been reduced from the previous unacceptable level of 3 × 10⁻² to a currently well-acceptable level of 1.6 × 10⁻⁷, and the aesthetic water quality has been improved and the mean NPV was calculated to 7 (P5 = −6; P95 = +17) MEUR.
In this paper, the aesthetic benefits obtained by installing UF membranes appeared to be substantially higher than the health-related benefits (both when assigning a low and high QALY value), albeit this may not be the case for another study area.
Lastly, it should be noted that a probabilistic approach is more or less necessary for an assessment to determine to what extent a measure may be profitable or not, due to the large uncertainties, both aleatoric and epistemic, of the input variables connected to the assessment of a DWS.
Supplementary Materials
The following supporting information can be downloaded at: https://www.mdpi.com/article/10.3390/w14050782/s1, SUPPLEMENTARY MATERIAL—QMRA.
Author Contributions
Conceptualization and methodology, N.-P.S., V.B., A.L. and L.R.; software, N.-P.S.; validation and formal analysis, V.B., A.L., A.K. and L.R.; investigation, N.-P.S.; resources, A.K., A.L. and L.R.; data curation and writing—original draft preparation, N.-P.S.; writing—review and editing, N.-P.S., V.B., A.L., A.K. and L.R.; visualization, N.-P.S.; supervision, V.B., A.L. and L.R.; project administration and funding acquisition, A.L. and L.R. All authors have read and agreed to the published version of the manuscript.
Funding
This research was performed within the DRICKS center for drinking water research in Sweden, coordinated by Chalmers University of Technology and funded by Svenskt Vatten and the members of the center.
Institutional Review Board Statement
Not applicable.
Informed Consent Statement
Not applicable.
Data Availability Statement
The data supporting the reported results can be found in the supplementary material, available online at https://www.mdpi.com/article/10.3390/w14050782/s1.
Acknowledgments
The authors gratefully acknowledge the contributions by Vatten & Miljö i Väst AB (VIVAB) and for enabling the case study presented in the paper.
Conflicts of Interest
The authors declare no conflict of interest.
Abbreviations
| Abbreviation: | Meaning: |
| CBA | Cost-benefit analysis |
| DALY | Disability adjusted life years |
| DWTP | Drinking water treatment plant |
| DWS | Drinking water system |
| GDP | Gross domestic product |
| ISO | International Organisation for Standardisation |
| NOM | Natural organic matter |
| NPV | Net present value |
| OWTS | On-site wastewater treatment systems |
| Pinf | Probability of infection |
| QALY | Quality adjusted life years |
| QMRA | Quantitative microbial risk assessment |
| SCCA | Swedish civil contingencies agency |
| SFA | Swedish food agency |
| SWWA | Swedish water and wastewater association |
| UF | Ultra-filter |
| U.S. EPA | United States Environmental Protection Agency |
| VIVAB | Vatten och miljö i Väst AB (the municipal water supplier) |
| WHO | World Health Organisation |
| WSP | Water safety plans |
References
- Keeney, R.L. Decision Analysis: An Overview. Oper. Res. 1982, 30, 803–838. [Google Scholar] [CrossRef] [PubMed] [Green Version]
- Parnell, G.S.; Bresnick, T.A.; Tani, S.N.; Johnson, E.R. Handbook of Decision Analysis. John Wiley & Sons: Hoboken, NJ, USA, 2013; Volume 6. [Google Scholar]
- Kaplan, S.; Garrick, B.J. On The Quantitative Definition of Risk. Risk Anal. 1981, 1, 11–27. [Google Scholar] [CrossRef]
- Aven, T.; Kørte, J. On the use of risk and decision analysis to support decision-making. Reliab. Eng. Syst. Saf. 2002, 79, 289–299. [Google Scholar] [CrossRef]
- Burgman, M.A. Risks and Decisions for Conservation and Environmental Management; Cambridge University Press—M.U.A: Cambridge, UK, 2005. [Google Scholar]
- ISO. Risk Management—Guidelines; International Organization for Standardization: Geneva, Switzerland, 2018. [Google Scholar]
- Corso, P.S.; Kramer, M.H.; Blair, K.A.; Addiss, D.G.; Davis, J.P.; Haddix, A.C. Costs of Illness in the 1993 Waterborne Cryptosporidium Outbreak, Milwaukee, Wisconsin. Emerg. Infect. Dis. 2003, 9, 426–431. [Google Scholar] [CrossRef] [PubMed]
- Lindhe, A.; Rosén, L.; Norberg, T.; Bergstedt, O. Fault tree analysis for integrated and probabilistic risk analysis of drinking water systems. Water Res. 2008, 43, 1641–1653. [Google Scholar] [CrossRef]
- Larsson, C.; Andersson, Y.; Allestam, G.; Lindqvist, A.; Nenonen, N.; Bergstedt, O. Epidemiology and estimated costs of a large waterborne outbreak of norovirus infection in Sweden. Epidemiol. Infect. 2014, 142, 592–600. [Google Scholar] [CrossRef] [Green Version]
- WHO. Guidelines for Drinking-Water Quality, 4th ed.; Incorporating the 1st Addendum, 4 ed.; World Health Organization: Geneva, Switzerland, 2017. [Google Scholar]
- Bartram, J.; Corrales, L.; Davison, A.; Deere, D.; Drury, D.; Gordon, B.; Howard, G.; Rinehold, A.; Stevens, M. Water Safety Plan Manual: Step-By-Step Risk Management for Drinking-Water Suppliers; World Health Organization: Geneva, Switzerland, 2009. [Google Scholar]
- Lindhe, A.; Rosén, L.; Norberg, T.; Bergstedt, O.; Pettersson, T.J.R. Cost-effectiveness analysis of risk-reduction measures to reach water safety targets. Water Res. 2011, 45, 241–253. [Google Scholar] [CrossRef]
- Haas, C.N.; Rose, J.B.; Gerba, C.P. Quantitative Microbial Risk Assessment; Wiley: Hoboken, NJ, USA, 2014. [Google Scholar] [CrossRef]
- WHO. Quantitative Microbial Risk Assessment: Application for Water Safety Management; World Health Organization: Geneva, Switzerland, 2016; ISBN 978-92-4-156537-0. [Google Scholar]
- Viñas, V.; Malm, A.; Pettersson, T.J.R. Overview of microbial risks in water distribution networks and their health consequences: Quantification, modelling, trends, and future implications. Can. J. Civ. Eng. 2019, 46, 149–159. [Google Scholar] [CrossRef]
- Gold, M.R.; Stevenson, D.; Fryback, D.G. HALYs and QALYs and DALYs, oh my: Similarities and differences in summary measures of population health. Annu. Rev. Public Health 2002, 23, 115–134. [Google Scholar] [CrossRef] [Green Version]
- Ale, B.; Burnap, P.; Slater, D. On the origin of PCDS—(Probability consequence diagrams). Saf. Sci. 2015, 72, 229–239. [Google Scholar] [CrossRef]
- Macler, B.A.; Regli, S. Use of microbial risk assessment in setting US drinking water standards. Int. J. Food Microbiol. 1993, 18, 245–256. [Google Scholar] [CrossRef]
- Bergion, V.; Lindhe, A.; Sokolova, E.; Rosén, L. Risk-based cost-benefit analysis for evaluating microbial risk mitigation in a drinking water system. Water Res. 2018, 132, 111–123. [Google Scholar] [CrossRef] [PubMed] [Green Version]
- Hu, G.; Mian, H.R.; Abedin, Z.; Li, J.; Hewage, K.; Sadiq, R. Integrated probabilistic-fuzzy synthetic evaluation of drinking water quality in rural and remote communities. J. Environ. Manag. 2022, 301, 113937. [Google Scholar] [CrossRef] [PubMed]
- Tamblyn, D.R. Using Economic Optimization to Derive Site-Specific Treatment Objectives. Water Econ. Policy 2021, 7, 2140001. [Google Scholar] [CrossRef]
- Whittington, D.; Smith, V.K. The Ex-Ante Economic Analysis of Investments in Large Dams: A Brief History. Water Econ. Policy 2020, 6, 2050010. [Google Scholar] [CrossRef]
- Lee, H.C.; Chen, H.; Lin, M.C.; Chang, C.H.; Chuang, M.J.; Yin, H.Y. A method for ex-post benefit-cost assessment for engineering remediation of debris flow impacts. Eng. Geol. 2021, 286, 106084. [Google Scholar] [CrossRef]
- Cha, S.; Jung, S.; Bizuneh, D.B.; Abera, T.; Doh, Y.A.; Seong, J.; Ross, I. Benefits and costs of a community-led total sanitation intervention in rural Ethiopia—A trial-based ex post economic evaluation. Int. J. Environ. Res. Public Health 2020, 17, 5068. [Google Scholar] [CrossRef]
- Häggmark Svensson, T.; Elofsson, K. The Ex-Post Cost-Effectiveness of Nitrogen Load Reductions From Nine Countries to the Baltic Sea Between 1996 and 2010. Water Resour. Res. 2019, 55, 5119–5134. [Google Scholar] [CrossRef]
- WISS. Water Information System Sweden. Available online: https://ext-geoportal.lansstyrelsen.se/standard/?appid=1589fd5a099a4e309035beb900d12399 (accessed on 9 February 2021).
- County Administative Board of Halland. Net Fishing for Fish Sampling in the County of Halland 2006—Evaluation of Biological Effects from Lime Treatment; County Administative Board of Halland: Halmstad, Sweden, 2007.
- SWWA. Microbial Barriers—Status after Database Update 2014; Unr 1320009768; The Swedish Water & Wastewater Association: Uppsala, Sweden, 2014. [Google Scholar]
- SFA. Guidance on Drinking Water; Swedish Food Agency (Sw: Livsmedelsverket): Uppsala, Sweden, 2014.
- VIVAB. Good Disinfection Practice (GDP) and Microbial Risk Analysis (MRA) of Kvarnagårdens Water Treatment Plant, Varberg; Vatten och Miljö i Väst AB (VIVAB): Varberg, Sweden, 2012.
- Bergion, V.; Lindhe, A.; Sokolova, E.; Rosén, L. Accounting for Unexpected Risk Events in Drinking Water Systems. Expo. Health 2021, 13, 15–31. [Google Scholar] [CrossRef]
- Lindberg, T.; Lindqvist, R. Risk Profile: Drinking Water and Microbial Risks; Rapport 28—2005; Swedish Food Agency: Uppsala, Sweden, 2005.
- PHAS. Waterborne Outbreaks from Drinking Water: Outbreaks in Sweden between 1992 and 2011; Public Health Agency of Sweden (Sw: Folkhälsomyndigheten): Halmstad, Sweden, 2015; ISBN 978-91-7603-455-2.
- Bertrand, I.; Schijven, J.F.; Sánchez, G.; Wyn-Jones, P.; Ottoson, J.; Morin, T.; Muscillo, M.; Verani, M.; Nasser, A.; Husman, A.M.R.; et al. The impact of temperature on the inactivation of enteric viruses in food and water: A review. J. Appl. Microbiol. 2012, 112, 1059–1074. [Google Scholar] [CrossRef]
- Gibbons, C.L.; Mangen, M.-J.J.; Plass, D.; Havelaar, A.H.; Brooke, R.J.; Kramarz, P.; Peterson, K.L.; Stuurman, A.L.; Cassini, A.; Fèvre, E.M.; et al. Measuring underreporting and under-ascertainment in infectious disease datasets: A comparison of methods. BMC Public Health 2014, 14, 147–165. [Google Scholar] [CrossRef] [PubMed] [Green Version]
- Norton, C.D.; LeChevallier, M.W. Chloramination: Its Effect on Distribution System Water Quality. Am. Water Work. Assoc. 1997, 89, 66–77. [Google Scholar] [CrossRef]
- Smeets, P.; Rietveld, L.; Hijnen, W.; Medema, G.; Stenström, T.-A. Efficacy of Water Treatment Processes; University of Delft: Delft, The Netherlands, 2006. [Google Scholar]
- SWWA. Introduktion Till Mikrobiologisk BarriärAnalys, MBA; The Swedish Water & Wastewater Association: Stockholm, Sweden, 2015. [Google Scholar]
- Hijnen, W.A.M.; Beerendonk, E.F.; Medema, G.J. Inactivation credit of UV radiation for viruses, bacteria and protozoan (oo)cysts in water: A review. Water Res. 2006, 40, 3–22. [Google Scholar] [CrossRef]
- VIVAB. Utbyggnad av Kvarnagårdens Vattenverk; Vatten och Miljö i Väst AB (VIVAB): Varberg, Sweden, 2017.
- X-Flow. Ultrafiltration Membrane: X Flow Aquaflex 55; Pentair: Twente, The Netherlands, 2018. [Google Scholar]
- Åström, J.; Pettersson, T.J.R.; Pott, B.-M. Analytica: QMRA-Verktyg för Beräkning av Hälsorisk för Grundvattenverk Och Ytvattenverk; Technical Report for Svenskt Vatten Utveckling: Bromma, Sweden, 2017. [Google Scholar]
- Bergion, V. Developement of a Risk-Based Decision Model for Prioritizing Microbial Risk Mitigation Measures in Drinking Water Systems; Chalmers University of Technology: Gothenburg, Sweden, 2017. [Google Scholar]
- Lantmäteriet. GSD-Terrängkartan_Vektor. Available online: ftp://download-opendata.lantmateriet.se/GSD-Terrangkartan_vektor/ (accessed on 23 January 2022).
- SCB. Kommuner i Siffror: Varberg. Available online: http://www.scb.se/hitta-statistik/sverige-i-siffror/kommuner-i-siffror/#?region1=1383®ion2= (accessed on 1 January 2022).
- Folkhälsomyndigheten. Smittsamma Sjukdomar A-Ö: Campylobacterinfektion, Cryptosporidiuminfektion, Calicivirus (Noro och Sapovirus). Available online: https://www.folkhalsomyndigheten.se/smittskydd-beredskap/smittsamma-sjukdomar/ (accessed on 23 January 2018).
- Haagsma, J.A.; Geenen, P.L.; Ethelberg, S.; Fetsch, A.; Hansdotter, F.; Jansen, A.; Korsgaard, H.; O’Brien, S.J.; Scavia, G.; Spitznagel, H.; et al. Community incidence of pathogen-specific gastroenteritis: Reconstructing the surveillance pyramid for seven pathogens in seven European Union member states. Epidemiol. Infect. 2013, 141, 1625–1639. [Google Scholar] [CrossRef] [PubMed] [Green Version]
- Lindqvist, R.; Andersson, Y.; Lindbäck, J.; Wegscheider, M.; Eriksson, Y.; Tideström, L.; Lagerqvist-Widh, A.; Hedlund, K.-O.; Löfdahl, S.; Svensson, L.; et al. A One-Year Study of Foodborne Illnesses in the Municipality of Uppsala, Sweden. BMC Infect. Dis. 2001, 7, 588–592. [Google Scholar]
- Petterson, S.R.; Mitchell, V.G.; Davies, C.M.; O’Connor, J.; Kaucner, C.; Roser, D.; Ashbolt, N. Evaluation of three full-scale stormwater treatment systems with respect to water yield, pathogen removal efficacy and human health risk from faecal pathogens. Sci. Total Environ. 2016, 543, 691–702. [Google Scholar] [CrossRef]
- Fine, K.; Fordtran, J. The effect of diarrhea on fecal fat excretion. Gastroenterology 1992, 102, 1936–1939. [Google Scholar] [CrossRef]
- Petterson, S.R.; Stenström, T.A.; Ottoson, J. A theoretical approach to using faecal indicator data to model norovirus concentration in surface water for QMRA: Glomma River, Norway. Water Res. 2016, 91, 31–37. [Google Scholar] [CrossRef]
- SMHI. Svenskt Vatten Arkiv [Online]; Swedish Meteorological and Hydrological Institute: Norrköping, Sweden, 2016.
- USEPA. Onsite Wastewater Treatment Systems Manual; United States Environmental Protection Agency: Washington, DC, USA, 2002.
- VIVAB. Mikrobiologiska Barriärer vid Kvarnagårdens Vattenverk; Vatten och Miljö i Väst AB (VIVAB): Varberg, Sweden, 2011.
- Ferguson, C.; Kay, D. Transport of microbial pollution in catchment systems. In Animal Waste, Water Quality and Human Health; Dufour, A., Bartram, J., Gannon, V.R.B., Eds.; World Health Organization: Geneva, Switzerland, 2012. [Google Scholar]
- Harrigan, T. Efficient Liquid Manure Transport and Land Application; Michigan State University: East Lansing, MI, USA, 2011. [Google Scholar]
- SWWA. Facts on Water Supply and Sanitation in Sweden; The Swedish Water & Wastewater Association: Bromma, Sweden, 2009. [Google Scholar]
- Ho, G.E.; Gibbs, R.A.; Mathew, K.; Parker, W.F. Groundwater recharge of sewage effluent through amended sand. Water Res. 1992, 26, 285–293. [Google Scholar] [CrossRef]
- Sinton, L.W. Investigations into the Use of the Bacterial Species Bacillus Stearothermophilus and Escherichia Coli (H2s Positive) as Tracers of Groundwater Movement; Water & Soil Technical Publication: Christchurch, New Zealand, 1980.
- Teunis, P.; Van den Brandhof, W.; Nauta, M.; Wagenaar, J.; Van den Kerkhof, H.; Van Pelt, W. A reconsideration of the Campylobacter dose-response relation. Epidemiol. Infect. 2005, 133, 583–592. [Google Scholar] [CrossRef]
- Teunis, P.F.; Moe, C.L.; Liu, P.; Miller, S.E.; Lindesmith, L.; Baric, R.S.; Le Pendu, J.; Calderon, R.L. Norwalk virus: How infectious is it? J. Med. Virol. 2008, 80, 1468–1476. [Google Scholar] [CrossRef]
- Teunis, P.F.M.; Chappell, C.L.; Okhuysen, P.C. Cryptosporidium dose response studies: Variation between isolates. Risk Anal. 2002, 22, 175–183. [Google Scholar] [CrossRef] [PubMed]
- Westrell, T.; Andersson, Y.; Stenström, T.A. Drinking water consumption patterns in Sweden. J. Water Health 2006, 4, 511–522. [Google Scholar] [CrossRef] [PubMed] [Green Version]
- Chan, M.C.W.; Sung, J.J.Y.; Lam, R.K.Y.; Chan, P.K.S.; Lee, N.L.S.; Lai, R.W.M.; Leung, W.K. Fecal Viral Load and Norovirus-associated Gastroenteritis. Emerg. Infect. Dis. 2006, 12, 1278–1280. [Google Scholar] [CrossRef] [PubMed]
- Atmar, R.L.; Opekun, A.R.; Gilger, M.A.; Estes, M.K.; Crawford, S.E.; Neill, F.H.; Graham, D.Y. Norwalk Virus Shedding after Experimental Human Infection. Emerg. Infect. Dis. 2008, 14, 1553–1557. [Google Scholar] [CrossRef]
- Newman, K.L.; Moe, C.L.; Kirby, A.E.; Flanders, W.D.; Parkos, C.A.; Leon, J.S. Norovirus in symptomatic and asymptomatic individuals: Cytokines and viral shedding. Clin. Exp. Immunol. 2016, 184, 347–357. [Google Scholar] [CrossRef] [Green Version]
- Teunis, P.F.M.; Sukhrie, F.H.A.; Vennema, H.; Bogerman, J.; Beersma, M.F.C.; Koopmans, M.P.G. Shedding of norovirus in symptomatic and asymptomatic infections. Epidemiol. Infect. 2015, 143, 1710–1717. [Google Scholar] [CrossRef] [Green Version]
- SGU. Geokartan. Available online: https://apps.sgu.se/geokartan/ (accessed on 22 February 2022).
- Sweco. Ragnhilds Källa, Revideringen av Vattenskyddsområde; Sweco: Gothenburg, Sweden, 2017. [Google Scholar]
- Batz, M.; Hoffmann, S.; Morris, J.G.J. Disease-Outcome Trees, EQ-5D Scores, and Estimated Annual Losses of Quality-Adjusted Life Years (QALYs for 14 Foodborne Pathogens in the United States. Foodborne Pathog. Dis. 2014, 11, 395–402. [Google Scholar] [CrossRef]
- Swedish Transport Administration. Principles and Values that Are Recommended to Be Used in Social Cost-Benefit Analyses: ASEK 7.0; Swedish Transport Administration: Borlänge, Sweden, 2020.
- Ryen, L.; Svensson, M. The Willingness to Pay for a Quality Adjusted Life Year: A Review of the Empirical Literature. Health Econ. 2015, 24, 1289–1301. [Google Scholar] [CrossRef]
- Svensson, M.; Nilsson, F.O.L.; Arnberg, K. Reimbursement Decisions for Pharmaceuticals in Sweden: The Impact of Disease Severity and Cost Effectiveness. Pharm. Econ. 2015, 33, 1229–1236. [Google Scholar] [CrossRef]
- Brox, J.A.; Kumar, R.C.; Stollery, K.R. Willingness to Pay for Water Quality and Supply Enhancements in the Grand River Watershed. Can. Water Resour. J./Rev. Can. Des Ressour. Hydr. 1996, 21, 275–288. [Google Scholar] [CrossRef] [Green Version]
- Polyzou, E.; Jones, N.; Evangelinos, K.I.; Halvadakis, C.P. Willingness to pay for drinking water quality improvement and the influence of social capital. J. Socio-Econ. 2011, 40, 74–80. [Google Scholar] [CrossRef]
- Beaumais, O.; Briand, A.; Millock, K.; Nauges, C. What are Households Willing to Pay for Better Tap Water Quality? A Cross-Country Valuation Study; Fondazione Eni Enrico Mattei: Milano, Italy, 2014. [Google Scholar]
- Lanz, B.; Provins, A. The demand for tap water quality: Survey evidence on water hardness and aesthetic quality. Water Resour. Econ. 2016, 16, 52–63. [Google Scholar] [CrossRef] [Green Version]
- Gunér, S. National Accounts 2015; Statistics Sweden: Stockholm, Sweden, 2017. [Google Scholar]
- SCCA. Parasite Outbreak in Östersund 2022/2011—Study of the Societal Costs; Swedish Civil Contingencies Agency (Sw: Myndigheten för samhälsskydd och beredskap): Karlstad, Sweden, 2014. [Google Scholar]
- Hutton, G. Economic evaluation and priority setting in water and sanitation interventions. In Water Quality: Guidelines, Standards and Health. Assessment of Risk and Risk Management for Water-Related Infectious Disease; Fewtrell, L., Bartram, J., Eds.; International Water Association: London, UK, 2001. [Google Scholar]
- McLeod, L.; Bharadwaj, L.; Waldner, C. Risk factors associated with perceptions of drinking water quality in rural Saskatchewan. Can. Water Resour. J./Rev. Can. Des Ressour. Hydr. 2015, 40, 36–46. [Google Scholar] [CrossRef]
Figure 1.
Map over Kvarnagården DWTP’s raw water sources; the lake Stora Neden and the aquifer Ragnhilds källa.
Figure 1.
Map over Kvarnagården DWTP’s raw water sources; the lake Stora Neden and the aquifer Ragnhilds källa.

Figure 2.
Conceptual graph for calculating a system’s total risk (orange area), in a probability consequence diagram, similar to the findings of Ale, Burnap, and Slater [17]. R1 represent the baseline risk, i.e., an event that is expected to occur on regular basis, whereas Rx represents the most severe event. The black striped area represents the events’ calculated total risk.

Figure 3.
Plot of the total risk of the hazardous events prior and after the UF membrane installation, plotting each event’s cumulative probability of occurrence against its mean consequence. The total risk reduction of the UF membranes is illustrated by the green area, while the total remaining risk is illustrated in blue.

Figure 4.
Spearman rank of input variables used in the QMRA.

Figure 5.
Bar chart of the UF membrane calculated costs, benefits, and NPV, for a 50 year time horizon at a 3.5% discount rate. The uncertainty of the calculated benefits and NPV is illustrated using their 5, 50, and 95 percentile value.
Figure 5.
Bar chart of the UF membrane calculated costs, benefits, and NPV, for a 50 year time horizon at a 3.5% discount rate. The uncertainty of the calculated benefits and NPV is illustrated using their 5, 50, and 95 percentile value.

Publisher’s Note: MDPI stays neutral with regard to jurisdictional claims in published maps and institutional affiliations. |
© 2022 by the authors. Licensee MDPI, Basel, Switzerland. This article is an open access article distributed under the terms and conditions of the Creative Commons Attribution (CC BY) license (https://creativecommons.org/licenses/by/4.0/).
Share and Cite
MDPI and ACS Style
Sköld, N.-P.; Bergion, V.; Lindhe, A.; Keucken, A.; Rosén, L. Risk-Based Evaluation of Improvements in Drinking Water Treatment Using Cost-Benefit Analysis. Water 2022, 14, 782. https://doi.org/10.3390/w14050782
AMA Style
Sköld N-P, Bergion V, Lindhe A, Keucken A, Rosén L. Risk-Based Evaluation of Improvements in Drinking Water Treatment Using Cost-Benefit Analysis. Water. 2022; 14(5):782. https://doi.org/10.3390/w14050782
Chicago/Turabian StyleSköld, Nils-Petter, Viktor Bergion, Andreas Lindhe, Alexander Keucken, and Lars Rosén. 2022. "Risk-Based Evaluation of Improvements in Drinking Water Treatment Using Cost-Benefit Analysis" Water 14, no. 5: 782. https://doi.org/10.3390/w14050782
Note that from the first issue of 2016, this journal uses article numbers instead of page numbers. See further details here.