
Field Investigation of Hydraulics and Fish Guidance Efficiency of a Horizontal Bar Rack-Bypass System
by
 and
and
Mohammadreza Maddahi
1,2, 
Roland Hagenbüchli
1,3,
Ricardo Mendez
4,
Claudia Zaugg
5,
Robert Michael Boes
1 and
Ismail Albayrak
1,* 1
(Formerly) Laboratory of Hydraulics, Hydrology and Glaciology (VAW), ETH Zurich, 8093 Zurich, Switzerland
2
Department of Water Engineering, Shahid Bahonar University, Kerman 76169-14111, Iran
3
Botanik Sämereien GmbH, 8808 Pfäffikon, Switzerland
4
Axpo Power AG, 5401 Baden, Switzerland
5
Aquarius GmbH, 4552 Derendingen, Switzerland
*
Author to whom correspondence should be addressed.
Water 2022, 14(5), 776; https://doi.org/10.3390/w14050776
Submission received: 31 January 2022
/
Revised: 23 February 2022
/
Accepted: 24 February 2022
/
Published: 1 March 2022
(This article belongs to the Special Issue Fish Passage at Hydropower Dams)
Abstract
:This paper investigates the hydraulics and fish guidance efficiency of a Horizontal Bar Rack-Bypass System (HBR-BS) installed at a hydropower plant with a design discharge of 33 m3/s. The HBR is placed at a horizontal rack angle of 38° to the flow direction with clear bar spacing of 20 mm. The BS has a vertical-axis flap gate with two openings. The HBR-BS complies with most literature design criteria. Velocity measurements were conducted using a moving-vessel Acoustic Doppler Current Profiler (ADCP). The fish monitoring study was conducted using a stow net, video, and ARIS sonar recordings. The fish monitoring calculations imply guidance efficiency of 84%, even for fish with total body lengths below 10 cm. Furthermore, the hydraulic results show that the flow field is favorable in terms of fish guidance due to a good alignment of the rack and the BS, corroborating the fish monitoring results. The results indicate that the HBR-BS functions not only as a physical barrier but also as a mechanical behavioral barrier for some small fish that are capable of physically passing the HBR. The present results are compared and discussed with the laboratory and field results from different studies in the literature.
1. Introduction
Hydropower is the most important renewable energy resource for electricity generation and its share is expected to increase in many countries to mitigate the effect of climate change. However, hydropower plants (HPPs) have negative impacts on aquatic environments such as blocking fish migration and sediment movement, resulting in an impairment of biodiversity and river morphology [1,2]. Regarding the former, the main issues associated with HPPs are blocking or delaying up- and downstream fish migration, and fish injury or mortality when passing turbines, weirs, or spillways. While upstream fish passage technologies are well developed and have been applied for decades, downstream fish passage poses challenges to scientists, engineers, local authorities, and HPP operators due to the current lack of design standards [3]. This has therefore driven many research projects, resulting in technological developments such as fish-friendly turbines, physical fish protection barriers, mechanical and behavioral barriers, fish collection systems, and fish-friendly operations. Most of these technologies have been developed for salmonids and applied in North America [4]. Depending on the ecological and biomechanical requirements of fish species in different regions, flow and site conditions, and cost-effectiveness, one or a combination of these technologies can be used at HPPs [5]. Furthermore, region-specific fish passage designs should be incorporated [6].
2. State-of-the-Art Review
Among the downstream fish passage technologies, fish guidance racks (FGRs) with adjacent bypass systems present promising technical solutions for safe downstream fish passage at HPPs. The FGRs can be classified into two categories: FGRs with (i) wide and (ii) narrow bar spacing [7,8]. They function differently depending on the bar spacing and orientation and are applied to different scales of HPPs. In this study, we focus on (ii), while giving brief information on (i).
Louvers Modified Angled Bar Racks (MBRs) and recently developed Curved Bar Racks (CBRs) which belong to FGRs with wide bar spacing between sb = 25 mm and 100 mm, function as mechanical and behavioral barriers, and are effective solutions for small-to-large scale HPPs (in terms of turbine design discharge) [3,9,10,11,12,13,14,15]. These types of FGRs consist of vertical bars with different shapes placed at a horizontal angle to the flow direction between β = 45 and 90°, while the rack angle to flow direction in plan view varies between α = 10 and 45°. Such a bar arrangement creates highly turbulent flow zones, flow separations around the bars, and high spatial velocity and pressure gradients in front and between the bars, which fish can sense and react with behavioral avoidance [11,15]. Furthermore, the rack angle creates a rack parallel, so-called sweeping velocity component, vp = Ur × sin (α), and a rack normal velocity component, vn = Ur × cos (α), where Ur is the time-averaged resulting flow velocity (see Figure 1 for the definition of these velocities). Two FGR design criteria to enable high Fish Guidance Efficiencies (FGEs) are related to these velocities: (i) vp/vn should be larger than unity to guide fish along the rack towards the bypass inlet [2], and (ii) vn should be less than vsus ≈ 0.5 m/s (depending on the fish species) to avoid fish impingement at the rack, where vsus is the critical sustained fish swimming speed referring to the aerobically fueled swimming activity that can be maintained by the fish over several hours, typically for more than 200 min, without muscular fatigue [16]. FGE is defined as the ratio between the number of fish successfully bypassed and the total number of fish approaching an FGR. Although the mentioned local flow velocities are important for the design of an FGR, numerical or physical model investigation is often required to determine the effective flow velocity components for different and mostly very site-specific HPP layouts. If such velocity data are not available, Ur can be replaced with U0 to calculate Vn and Vp, where U0, Vn, and Vp are the cross-sectionally averaged approach flow velocity, rack normal velocity, and rack parallel velocity, respectively. In general, the rack angle α is calculated by a given vsus of the target fish species and U0.
For small-to-medium scale HPPs with a design discharge of Qd < 120 m3/s, FGRs with horizontal bars and narrow bar spacing (HBR) are supposed to provide effective fish protection and guidance, which have been widely prescribed by authorities [17,18,19]. HBRs with typical bar spacing of 10 mm ≤ sb ≤ 30 mm function as physical fish protection and guidance barriers for parts of the fish population, depending on fish size. Despite this, they may also function as a behavioral barrier due to repelling and guidance effects of the flow field in front of the rack and between the bars for some fish species [20,21]. Up to now, HBRs have been typically installed at rack angles between α = 30° and 65° to the main flow direction and for U0 ranging from 0.20 to 0.80 m/s [6,18,19,22,23], while Ebel [22] recommends α = 20–40°. The discharge limitation of the HBRs, i.e., vn or Vn ≤ 0.50 m/s, is related to (i) the velocity limitation to avoid fish impingement at the rack and (ii) their small bar spacing causing relatively high clogging and thus operational problems including increased head loss compared to FGRs with wider bar spacing [3,18,19,23]. The above-described velocity criteria for the FGRs with wide bar spacing are also applied for HBRs. In addition, for a high FGE, the ratio of the cross-sectionally averaged bypass inlet velocity Ub to the approach flow velocity U0 is an important parameter (Figure 1). Ebel [22] recommends ratios between Ub/U0 = 1 and 2 for HBRs, while USBR [4] recommends values from 1.1 to 1.5 for louvers. In a recent study, Beck et al. [15] and Meister [21] obtained higher FGEs for Ub/U0 = 1.2 compared to Ub/U0 = 1.4 in ethohydraulic tests of a range of fish species at a laboratory for CBR-BS and HBR-BS, respectively. A typical bypass layout of HBRs is shown in Figure 1 [24]. The layout consists of a vertical-axis flap gate with top and bottom openings installed at the bypass entrance, followed by a sloping weir to control the bypass discharge. During fish movement, two openings in the flap gate are used, while during floods and rack cleaning, the flap gate is fully opened to flush floating debris. The weir slope can be fixed at 10 to 30° or be adjustable for flushing purposes. Top openings are generally preferred by salmon, trout, and other salmonids, while the bottom openings are often used by more bottom-oriented eels and cyprinids [1,25,26]. Furthermore, Ebel [22] recommends either the bottom or both top and bottom overlays for HBRs to improve FGEs and the diversion of bedload and/or driftwood to the bypass. EPRI and DML [9] and Albayrak et al. [11] proved that a bottom overlay increased FGEs of louvers and MBRs in corresponding laboratory studies.
Albayrak et al. [23] and Meister et al. [19] studied head losses caused by HBRs for a range of rack angles, bar shapes, bar spacing, and overlays and developed the first head loss prediction equation. The latter presented new equations for HBRs by extending the parameter range of [23] and included different HPP layouts, i.e., block- and diversion-types. Regarding bar shapes, Meister et al. [18,19] tested rectangular bars, rectangular bars with a circular tip, bars with an ellipsoidal tip, and tail and foil-shaped bars, and recommended foil-shaped bars for HBRs because of their 40% reduction of head loss and slightly more symmetrical turbine admission flow as compared to rectangular bars.
Despite a few recent studies on head loss and hydraulics of HBRs, there are only two systematic laboratory studies on FGEs of HBR-BSs, according to the authors’ knowledge. Berger [27] studied FGEs of HBR-BSs with α = 30°, 45°, 55°, and 70° and sb = 10, 18 and 30 mm. The HBR-BSs were tested with salmon smolts (Salmo salar) for approach flow velocities of U0 = 0.4, 0.5, 0.7, and 0.8 m/s. In addition, silver eel (Anguilla anguilla) tests were performed but limited to HBR-BS with α = 30° and sb = 18 mm for the same approach flow velocities. Based on the laboratory test results, Berger [27] recommends HBR-BS with sb = 18 mm, α = 30 to 55°, and U0 ≤ 0.8 m/s for 100% fish protection efficiency. In a recent study, Meister [21] conducted live-fish tests for HBR configurations with a full-depth open channel bypass, α = 30° and sb = 15 and 20 mm at U0 = 0.5 and 0.7 m/s and Ub/U0 = 1.2 and 1.4 in a large ethohydraulic laboratory flume. The HBR-BS configurations were tested with different fish species such as spirlin (Alburnoides bipunctatus), barbel (Barbus barbus), brown trout (Salmo trutta), salmon parr, European eel, and juvenile nase (Chondrostoma nasus). No injuries or impingements were observed during all tests. The results show that HBR-BSs with sb = 20 mm have almost no protective effect for juvenile nase with an average total size of 72 mm, whereas the fish protection efficiency (FPE) exceeded 90% for spirlin and eel. FPE is defined as the ratio between the number of fish successfully bypassed and/or refusing to swim through the rack or into the bypass, i.e., staying upstream of the HBR-BS, over the whole test duration and the total number of fish approaching an FGR. It was observed that part of the tested species, except eel, rotated themselves and passed between the horizontally aligned bars and concluded that both fish body height hf and width wf should be larger than sb for fish to be fully protected by HBRs. Based on these test results, Meister [21] developed the following equations to predict FGE and FPE (in [%]) for an HBR-BS:
FGE = 140 wf/sb − 50
FPE = 150 wf/sb − 50
Equations (1) and (2) were validated with data from HBR-BS field monitoring campaigns. The application limits are 0.36 ≤ wf/sb ≤ 1 (Equation (1)) and 1/3 ≤ wf/sb ≤ 1 (Equation (2)), which means that FGE = 0% and FPE = 0% for wf/sb ≤ 0.36 and wf/sb ≤ 1/3, respectively. Meister [21] proposes to presume constant FGE for wf/sb ≥ 1, i.e., FGE = 90%. Fish with wf/sb > 1 are physically protected by the HBR, such that FPE = 100% for wf/sb > 1. For spirlin, Meister [21] recommends replacing wf with hf. Depending on the target FGE and FPE, an HBR can be designed using these formulas, but the effect of the approach flow velocities, particularly for low values, must be considered.
In addition to the laboratory studies, there are several field studies conducted at small-to-medium-scale HPPs equipped with HBR-BS in Europe (some of them are listed in Table 1 with corresponding hydraulics and rack parameters [22,28]). Hereafter, the results from the studies at selected HPPs are briefly reported regarding fish monitoring results. Ebel et al. [29] evaluated the FGE of HBR-BS with sb = 20 mm, α = 38°, and 0.60 m of a bottom overlay at Rothenburg HPP in Germany (Table 1). The width and height of the top and bottom bypass openings at this HPP are 0.45 m and 0.50 m, respectively, followed by an open channel. [29] reported that 83.3% of European eels migrated through the bypass and the rest of the fish passed the HBR and the turbines with an overall mortality rate of 2.5%. Nyqvist et al. [30] evaluated the FGE of an HBR-BS at Herting HPP in Sweden (Table 1). The HBR-BS guided and bypassed 70–95% of the tagged Atlantic salmon smolts. Furthermore, [30] reports that the Herting HBR-BS has high passage efficiencies without delay for both salmon smolts and kelts and silver eel. For the HBR-BS of HPP Rappenberghalde in Germany (Table 1), a low FPE of 54% on average was reported for 21 fish species and a total number of 1757 fish [31]. The lowest protection rate of 10% is reported for eels, despite a 15 mm bar spacing. The results of the radio-telemetry study indicated that the HBR had a good fish guiding effect towards the bypass when the fish was in contact with the rack but only one of 65 tagged fish passed downstream using the bypass [31]. At this HPP, the bypass is not located at the end of the HBR but a large distance from it at the right riverbank, and there is a so-called discharge channel between the HBR and BS. The bypass is in operation discontinuously and functions as a collection chamber of the fish, which are then flushed downstream intermittently. Such an HBR-BS layout and discontinuous bypass operation, which deviate from the recommendations (Figure 1), cause unfavorable hydraulic conditions, resulting in a poor fish attraction to and detectability of the bypass. Recently, Ebel [24] reported the monitoring results from seven HPPs equipped with HBR-BSs including the present case HPP Stroppel. The clear bar spacing and rack angle of the HBR-BSs at these HPPs are 12 to 20 mm and 30 to 54°, respectively. The FGEs of the HBR-BSs are 83.3 to 100% for eel, 86.9 to 100% for salmon smolts, 100% for salmon kelts, and 24.7 to 90% for potamodromous fish species. Ebel [24] relates low FGEs to the bar spacing, bypass location, flow condition, and rack angle.
Overall, these field studies highlight that fish monitoring is of prime importance to evaluate the efficiency of the HBR-BS. Not only the HBR layout but also the bypass design are the key elements of a successful design of a downstream fish passage facility. More field and laboratory studies including fish monitoring and investigation of flow fields are needed to better assess the performance of different HBR-BS configurations for various fish species from different geographical regions and for various hydraulic conditions. Both laboratory and field data will allow the establishment of robust design criteria for HBR-BS.
The present study aims at filling a portion of the research gaps and contributing to a hydraulically optimal and biologically effective design of HBR-BS. To this end, we investigated the hydraulics and FGE of the HBR-BS at HPP Stroppel on the Limmat river in Switzerland. The objectives of the study are to measure the flow field in the headrace channel and around the HBR-BS, to relate the results from a fish monitoring study conducted by Zaug and Mendez [20] to the hydraulic results, and finally to present recommendations for the design of HBR-BS. The findings of the present study are meant to contribute to the sustainable and efficient usage of hydropower by providing detailed geometric and hydraulic information on the HBR-BS for optimum engineering solutions accounting for safe fish guidance and project cost-benefit ratio.
3. Materials and Methods
3.1. Study Site
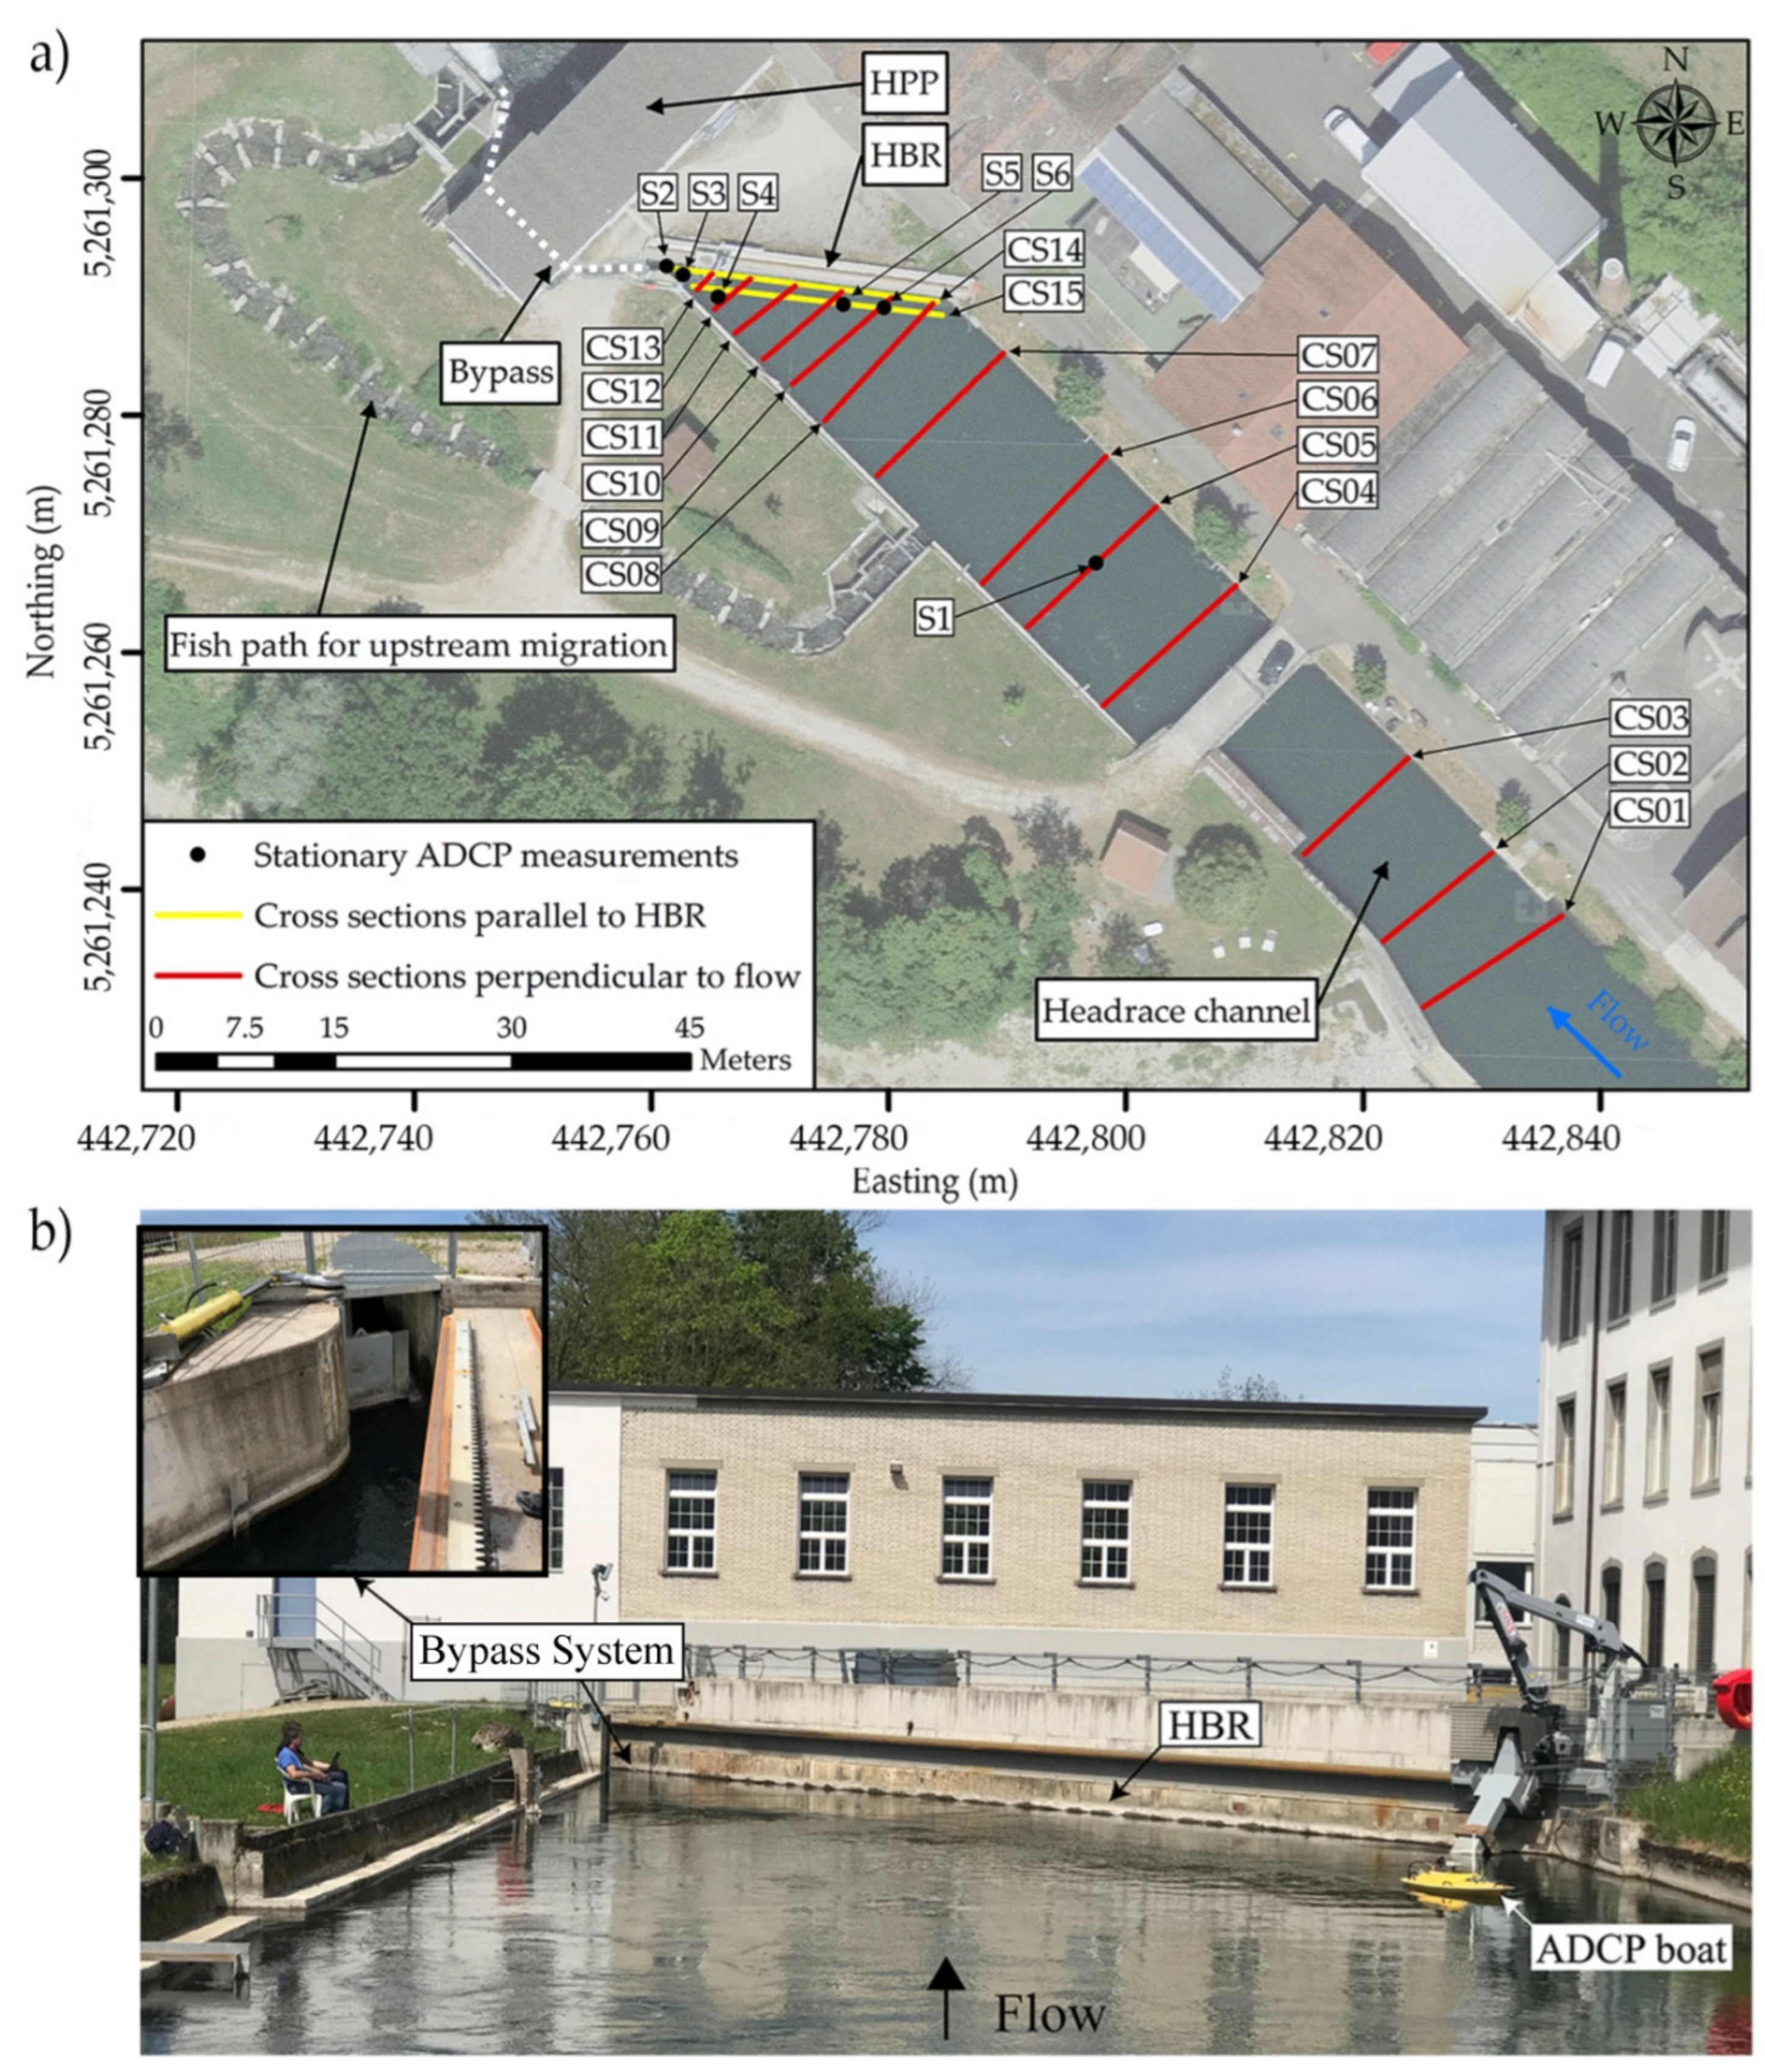
The fish monitoring and hydraulic studies were conducted at HPP Stroppel located on the Limmat river around 35 km downstream of Lake Zurich. The HPP has a design discharge of Qd = 33 m3/s which drives two Francis and one Kaplan turbines with a total output of 840 kW. About 450 m upstream of the HPP, the river flow is divided into a residual flow stream and a headrace channel conveying water to the power house. The headrace channel of the HPP contains a 350 m long side weir that diverts the flow above the design discharge to the residual flow reach. An HBR-BS designed according to Ebel [22] was commissioned in 2014 (Figure 2). The rack is horizontally aligned with a rack angle of α = 38° to the approach flow. The net bar spacing is sb = 20 mm and the bars are of fishbelly shape. The length and height of the HBR are 25.32 m and 2.7 m, respectively, which leads to a cross-sectionally averaged flow velocity normal to the rack of Vn = 0.48 m/s at design discharge. The HBR includes a bottom channel to guide bottom-oriented fish and sediments towards the bypass, which is located at the end of the HBR on the left riverbank. The bypass design discharge is Qb = 0.69 m3/s. It consists of a vertical-axis inlet flap gate with top and bottom openings installed at the bypass entrance, followed by a weir to control the bypass discharge. Top and bottom openings have dimensions (width × height) of 0.6 m × 0.4 m and 0.4 m × 0.4 m, respectively. These two openings at the inlet gate are used during fish migration and normal operation conditions, while during floods and rack cleaning, the gate is fully opened to flush floating debris. Figure 2 gives a top view of HPP Stroppel and the velocity measurement locations and a photo during the velocity measurements in front of the HBR-BS.
3.2. Hydraulic Measurements
Three-dimensional (3D) flow velocity and bathymetry measurements were conducted in the headrace channel and around the HBR-BS on 24 April 2019, using an ADCP mounted on a remote-control boat equipped with a Real-Time Kinematic Global Positioning System (RTK-GPS) (Figure 2). The ADCP is a River Pro 1200 kHz including piston style four-beam transducer with a 5th independent 600 kHz vertical beam on a Q-Boat, both supplied by Teledyne Marine, USA. The sampling configuration for all measurements were: blanking distance of 0.25 m below the water surface; automatic water mode and ADCP submergence depth of 0.12 m from the water surface. Figure 2 shows the position of the conducted cross-sectional measurements in the headrace channel. For every cross-section, 3D velocities of four to twelve transects were recorded. To better assess the velocity distribution along the rack, two measurements parallel to the rack were conducted (CS 14, 0.50 m away from the rack, and CS 15, 1.75 m away from the rack). The Q-Boat velocity and track position were held as constant as possible along predetermined cross-sections. During all measurements, the Q-Boat velocity was less than the flow velocity and maximum lateral deviations from the cross-section lines were ±2 m. Data acquisition was done using the WinRiver II software from Teledyne and processed with the MATLAB-based velocity mapping toolbox VMT (United States Geological Survey, Reston, VA, USA) [33]. In addition to fifteen cross-sections, six stationary measurements of 10 to 15 min duration were also conducted. The positions of these measurements are shown in Figure 2a (S1–S6). For the velocity assessment at the bypass entrance, the ADCP was positioned as close to the entrance as possible (S2). The mean discharge of the Limmat river on the measurement day was 73.9 m3/s, measured at the upstream measurement station of the Swiss Federal Office for the Environment in Baden [34]. During measurement, the discharge in the headrace channel was quasi-constant of 26.63 m3/s, measured by the ADCP, and the rest of the river discharge was diverted to residual flow reach or overflowed from the upstream side weir. The standard deviation of discharge measurements by ADCP was 0.83 m3/s.
3.3. Fish Monitoring Campaign
To assess the effectiveness of the HBR-BS at HPP Stroppel, a fish monitoring campaign was carried out in 2015 and 2016 by Axpo Power AG and Aquarius GmbH. The main results of the fish monitoring campaign are published as a report by the authors, Zaugg and Mendez [20]. Seven blocks of fish monitoring of three days each (3 × 24 h) were planned to be conducted between April and October in 2015 and 2016 during the new moon. After the first two blocks, the duration and number of the blocks were optimized such that instead of regular, pre-determined monitoring blocks, random sampling lasting from 2–4.5 h took place to determine a high level of migration activity before each monitoring block. In addition, one monitoring block was conducted in the spring and summer of 2016 to investigate seasonal differences. The monitoring blocks were also shortened to between 38 and 48 h. Overall, five monitoring blocks with a total number of 8761 fish and nine short random sampling with a total number of 2587 fish collected in the bypass were conducted and the total duration of all monitoring was 304.75 h. A large number of fish was collected at the bypass exit from 20 to 23 October 2015 (2198) and from 25 to 27 October 2016 (6239) when the water temperature decreased to 13 °C, which possibly triggered autumn fish migration, particularly for juvenile fish. Table 2 shows the monitoring duration, water temperature, and the number of collected fish during the main blocks and short sampling periods. At each monitoring, the fish were captured in a stow net fish trap with a mesh opening of 8 mm at the bypass outlet. The collected individuals were identified and classified in fish length classes (<10 cm, 10 to 20 cm, 20 to 30 cm, >30 cm, Table 3). A total number of 28 different fish species were identified. Almost half of the captured fish was Common roach (Rutilus rutilus, 47%), followed by spirlin (~11%), barbel (~7%), common bream (Abramis brama, 6.7%), Common bleak (Alburnus alburnus, 4.78%), and European perch (Perca fluviatilis, ~4%) [20]. The fish movement at the twilight hours and during the first hour of the night was more intense than during the rest of the day and night. Around 76% of the collected fish was guided by the HBR-BS in dark hours; the peak fish passage occurred after dusk and then flattened around midnight.
To observe the behavior of the fish along the rack and in the bottom channel, six video cameras were attached directly to the rack. Two cameras each were fixed on a specially designed bracket in which the vertical position of the cameras in the water could be adjusted. In addition, a camera was attached to the left channel wall, 2 m upstream of the bypass openings. In order not to influence the behavior of the fish in the dark, infrared lights were used.
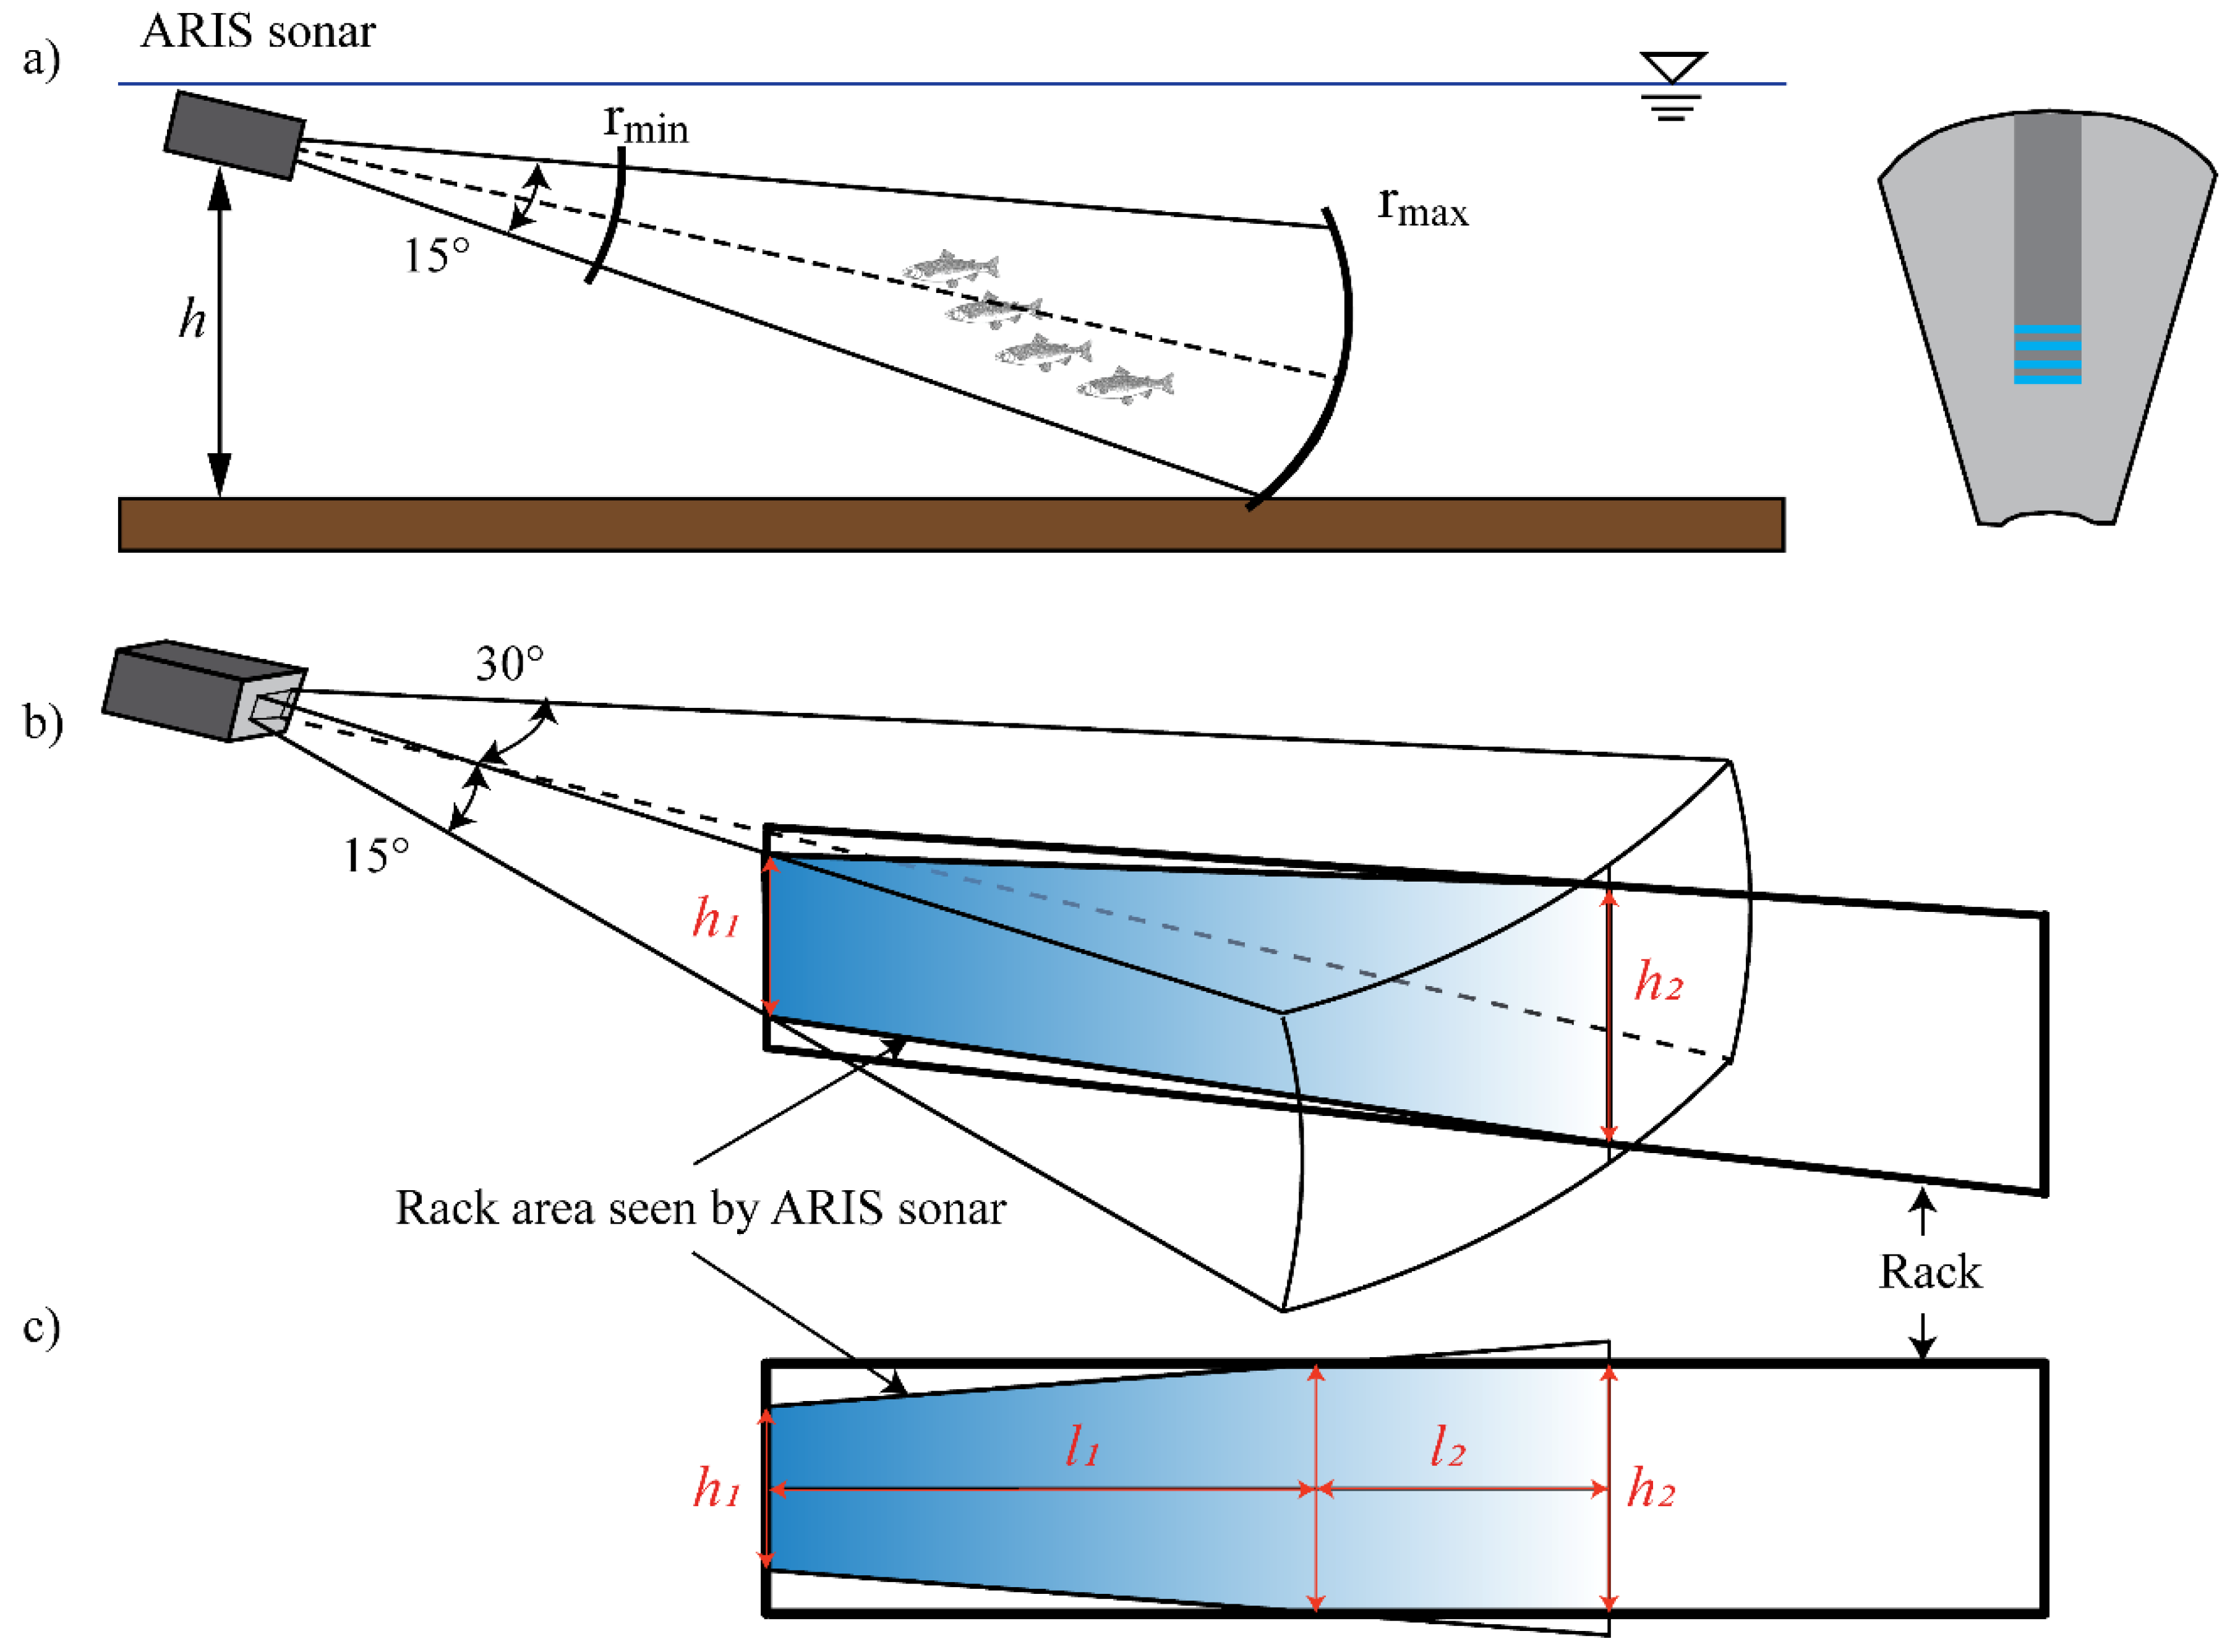
Finally, an ARIS sonar (explorer 3000) was used to determine the number of fish behind and in front of the rack during the large fish migration event between 25 and 27 October 2016 and 20 and 23 September 2015, respectively. This measurement was important to assess the FGEs of the HBR-BS. The sonar had 128 beams operating at 3 MHz and 1.8 MHz identification and detection frequencies, respectively, with a horizontal and vertical angle of 30° and 15°, respectively. The sonar was placed in front and behind the rack above the channel bed with a slight downward inclination (Figure 3).
4. Results
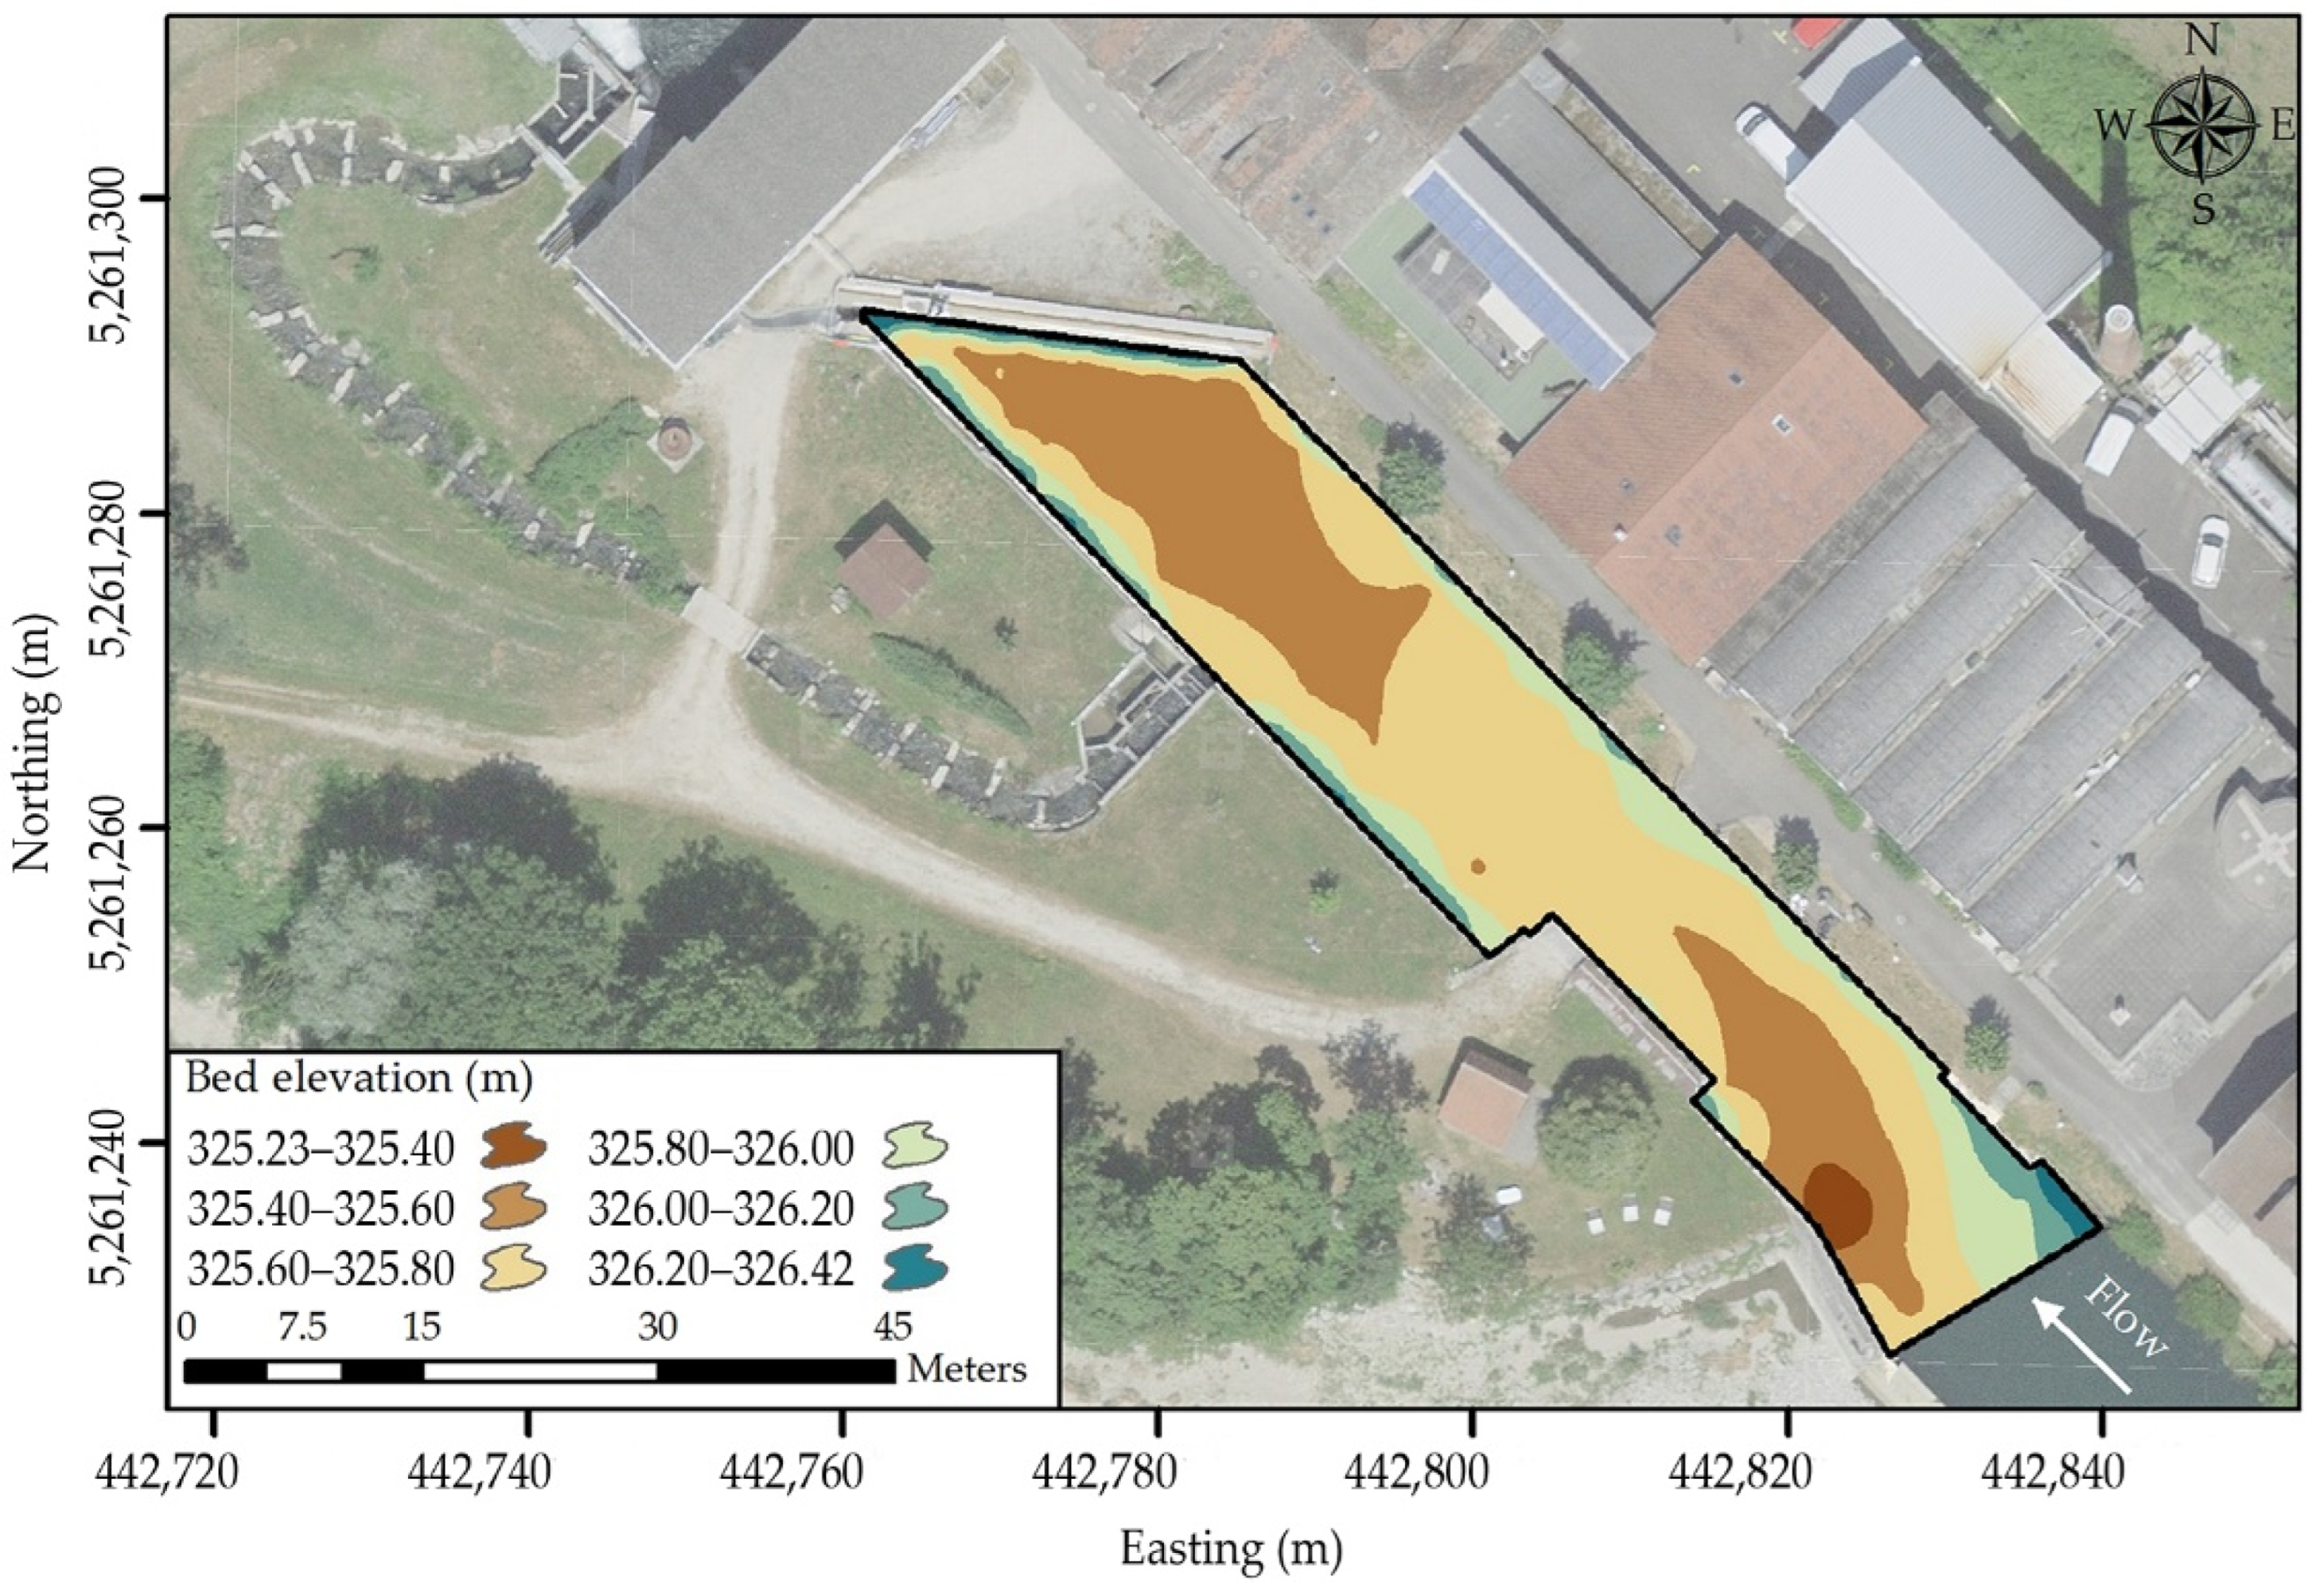
Figure 4 shows the bathymetry, i.e., the headrace channel bed form, obtained from the ADCP measurement. The channel bathymetry shows that there are no abrupt fluctuations or large-scale bedforms. For a design operating water level at 328.87 m asl, the average water depth along the headrace channel in the investigated area was approximately 3 m during the ADCP measurement.
4.1. Flow Field along Headrace Channel
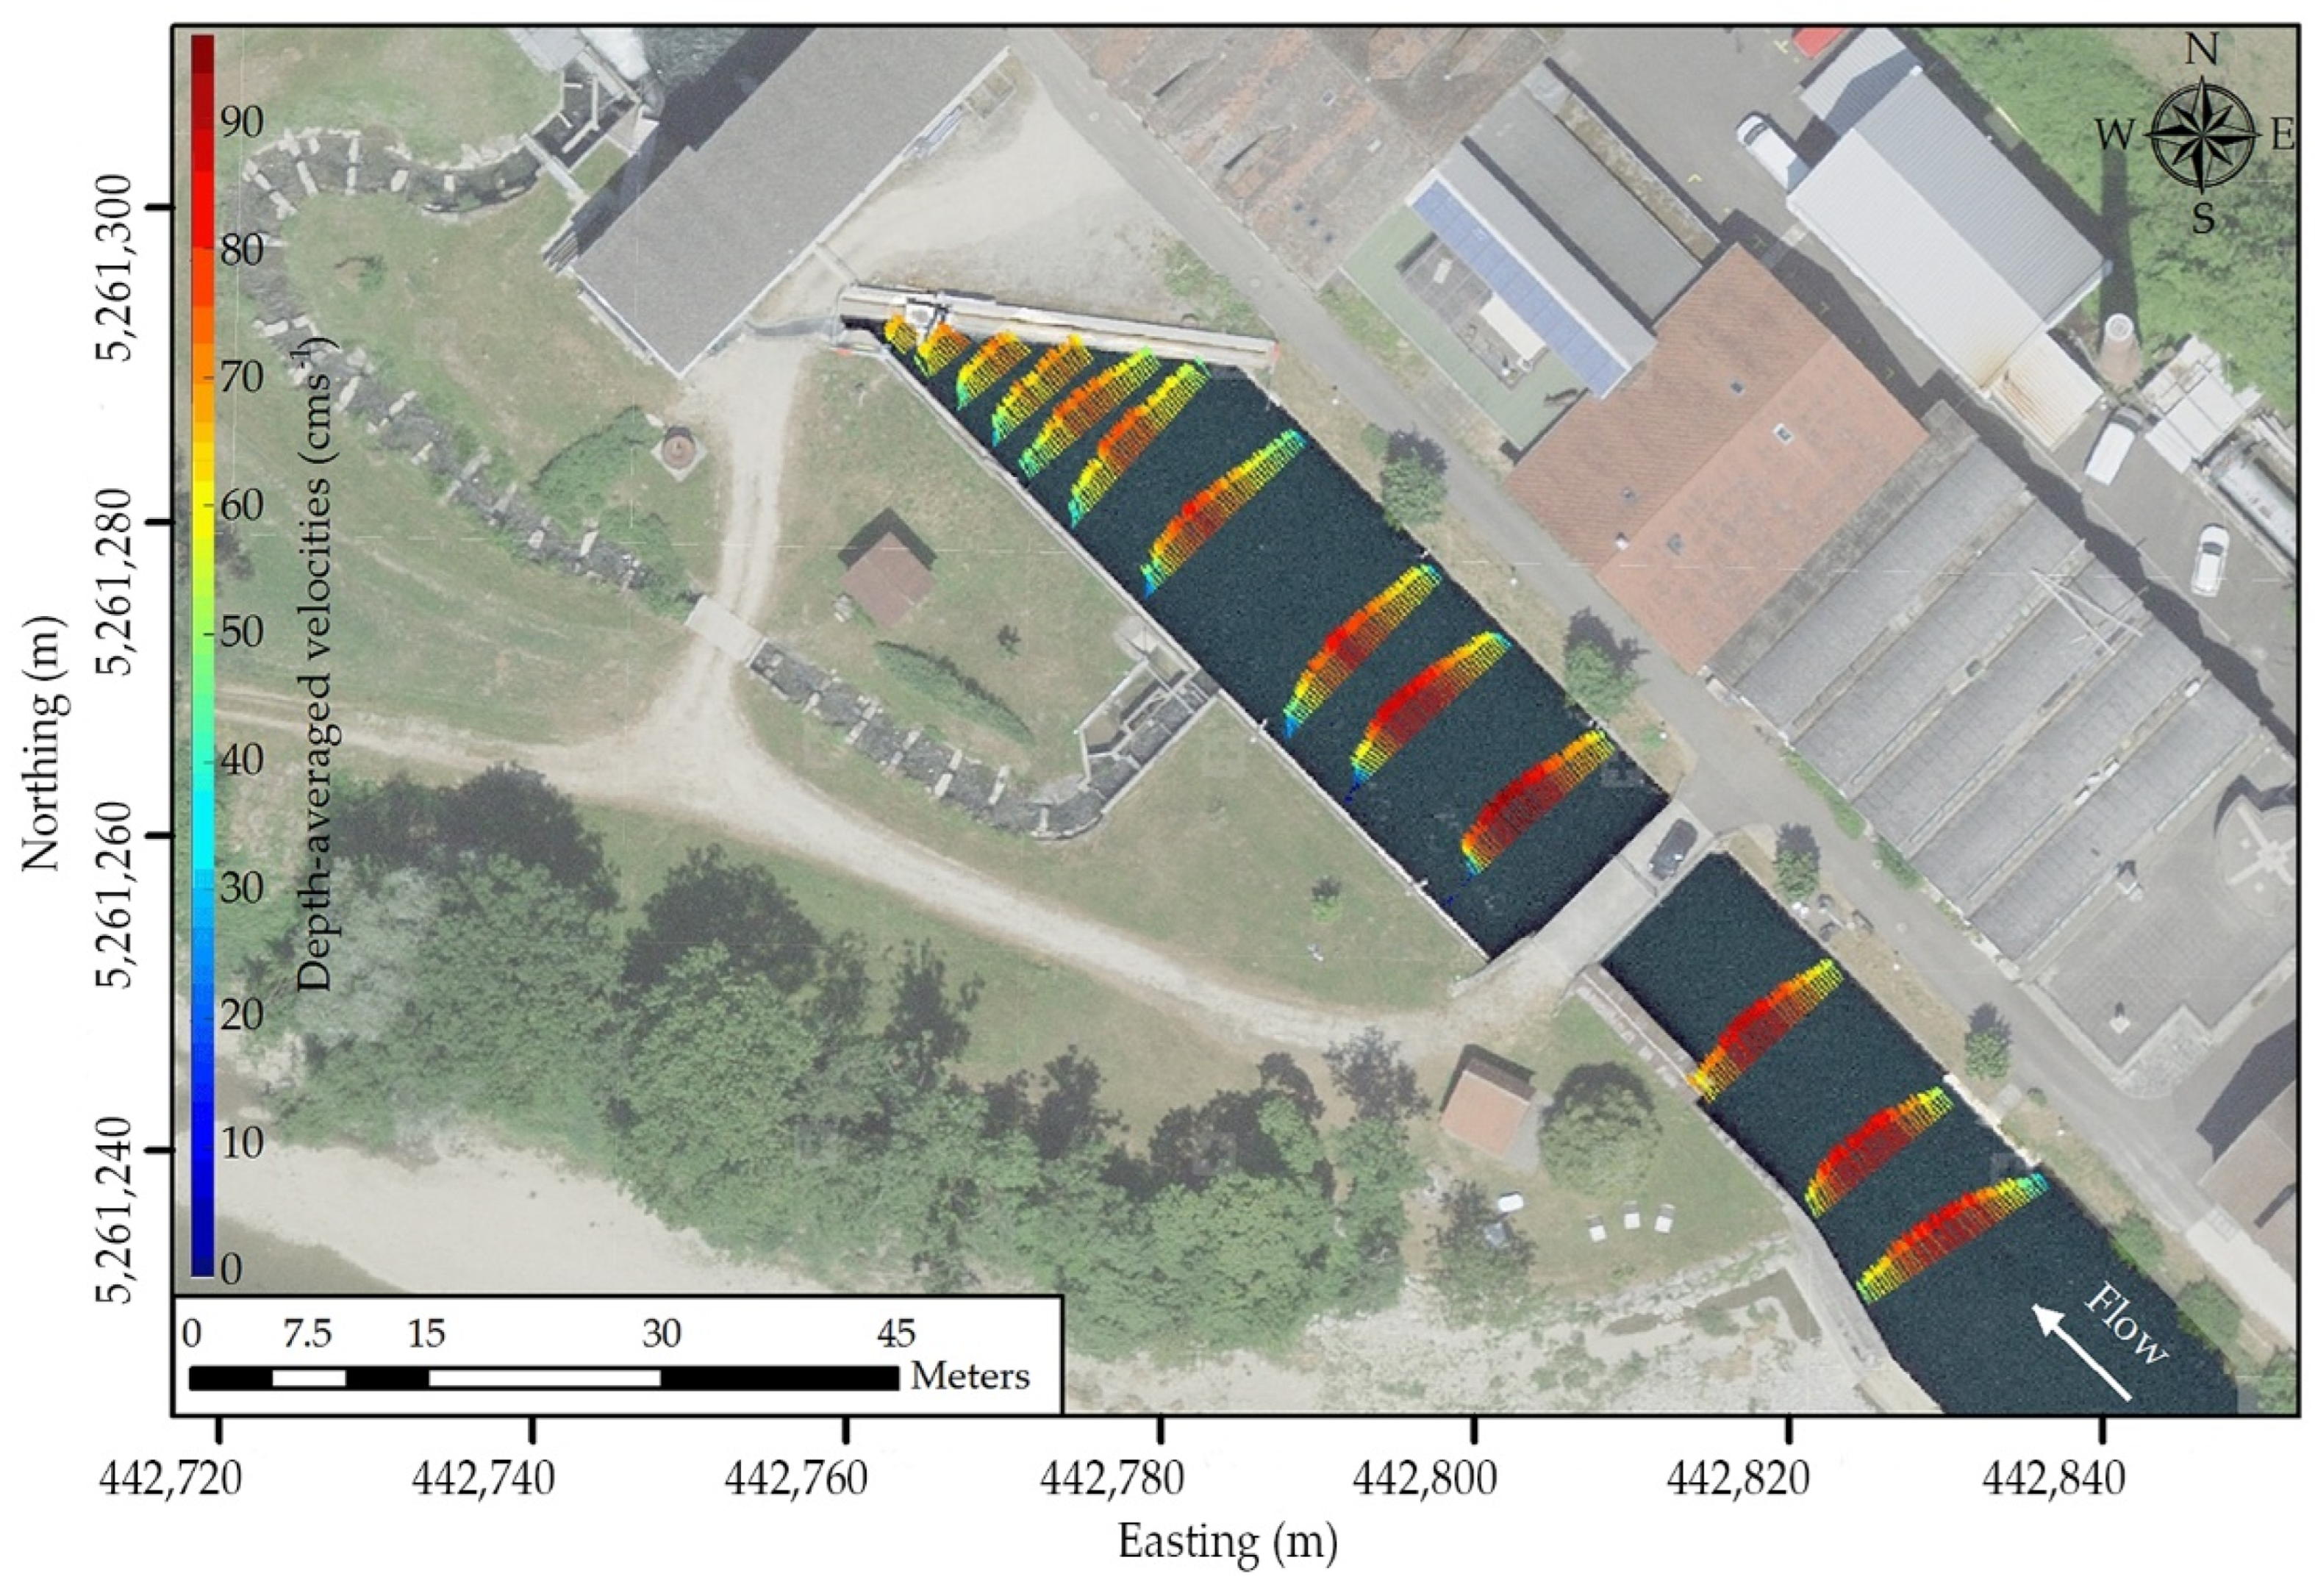
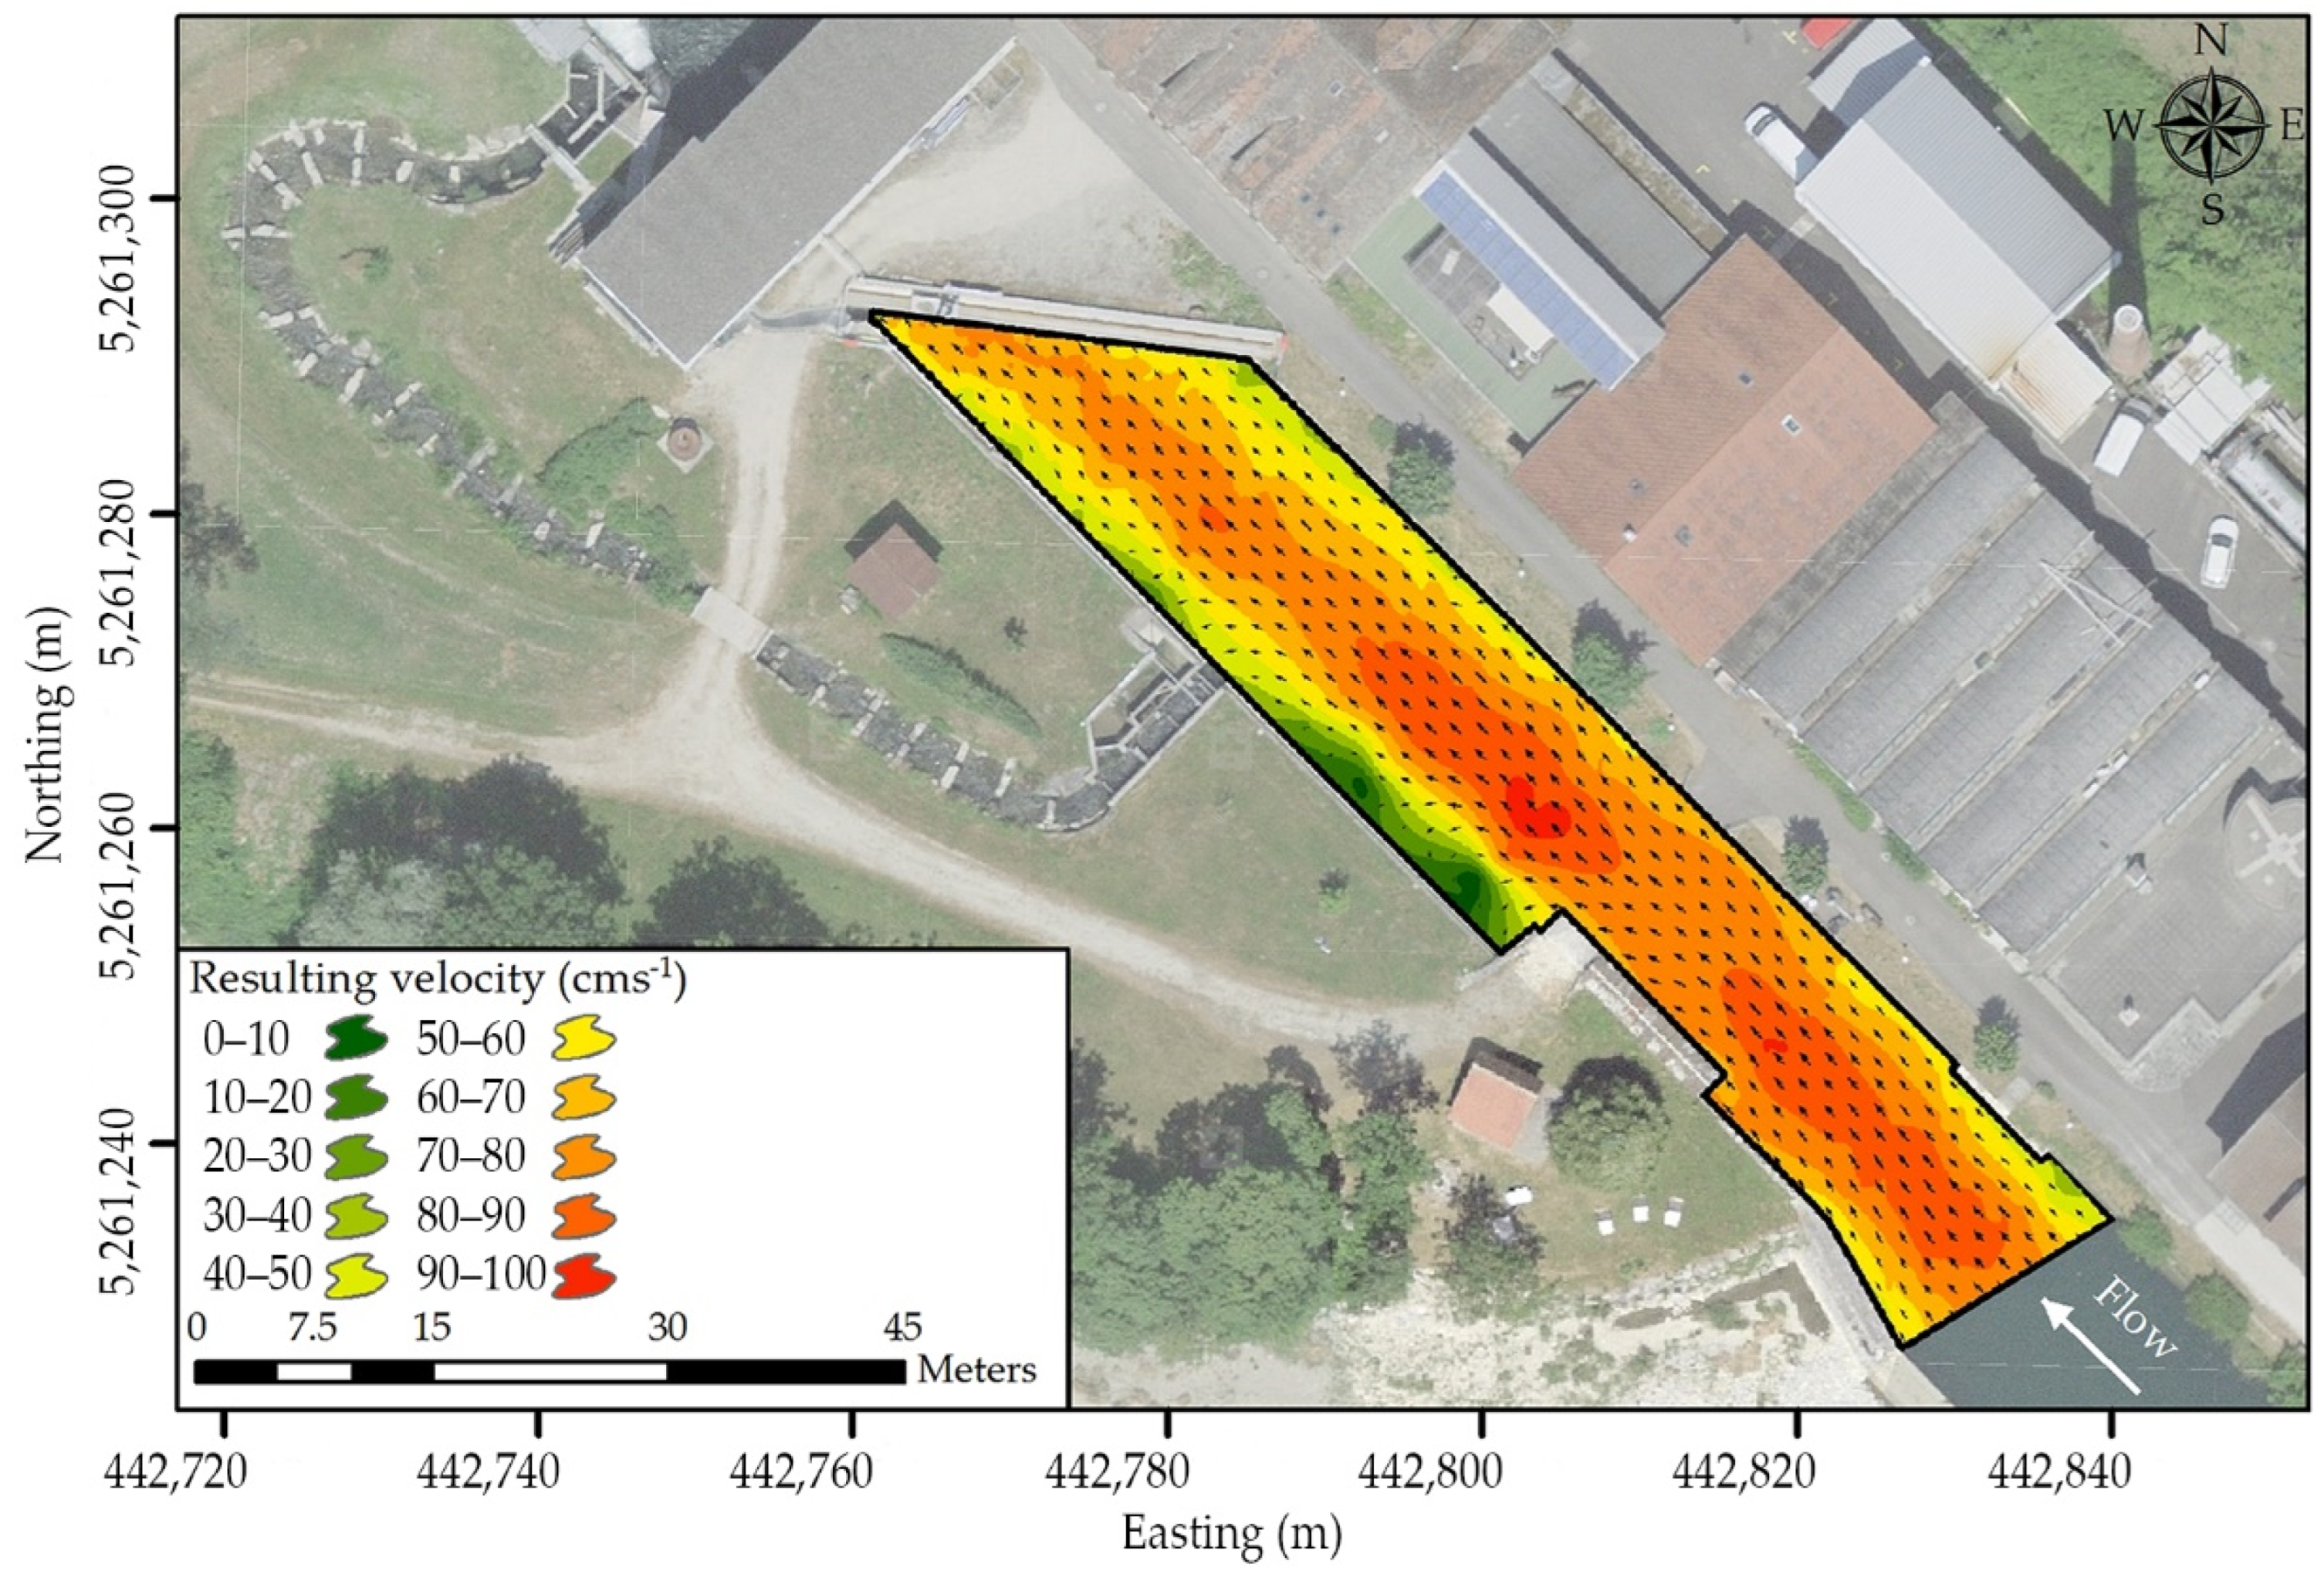
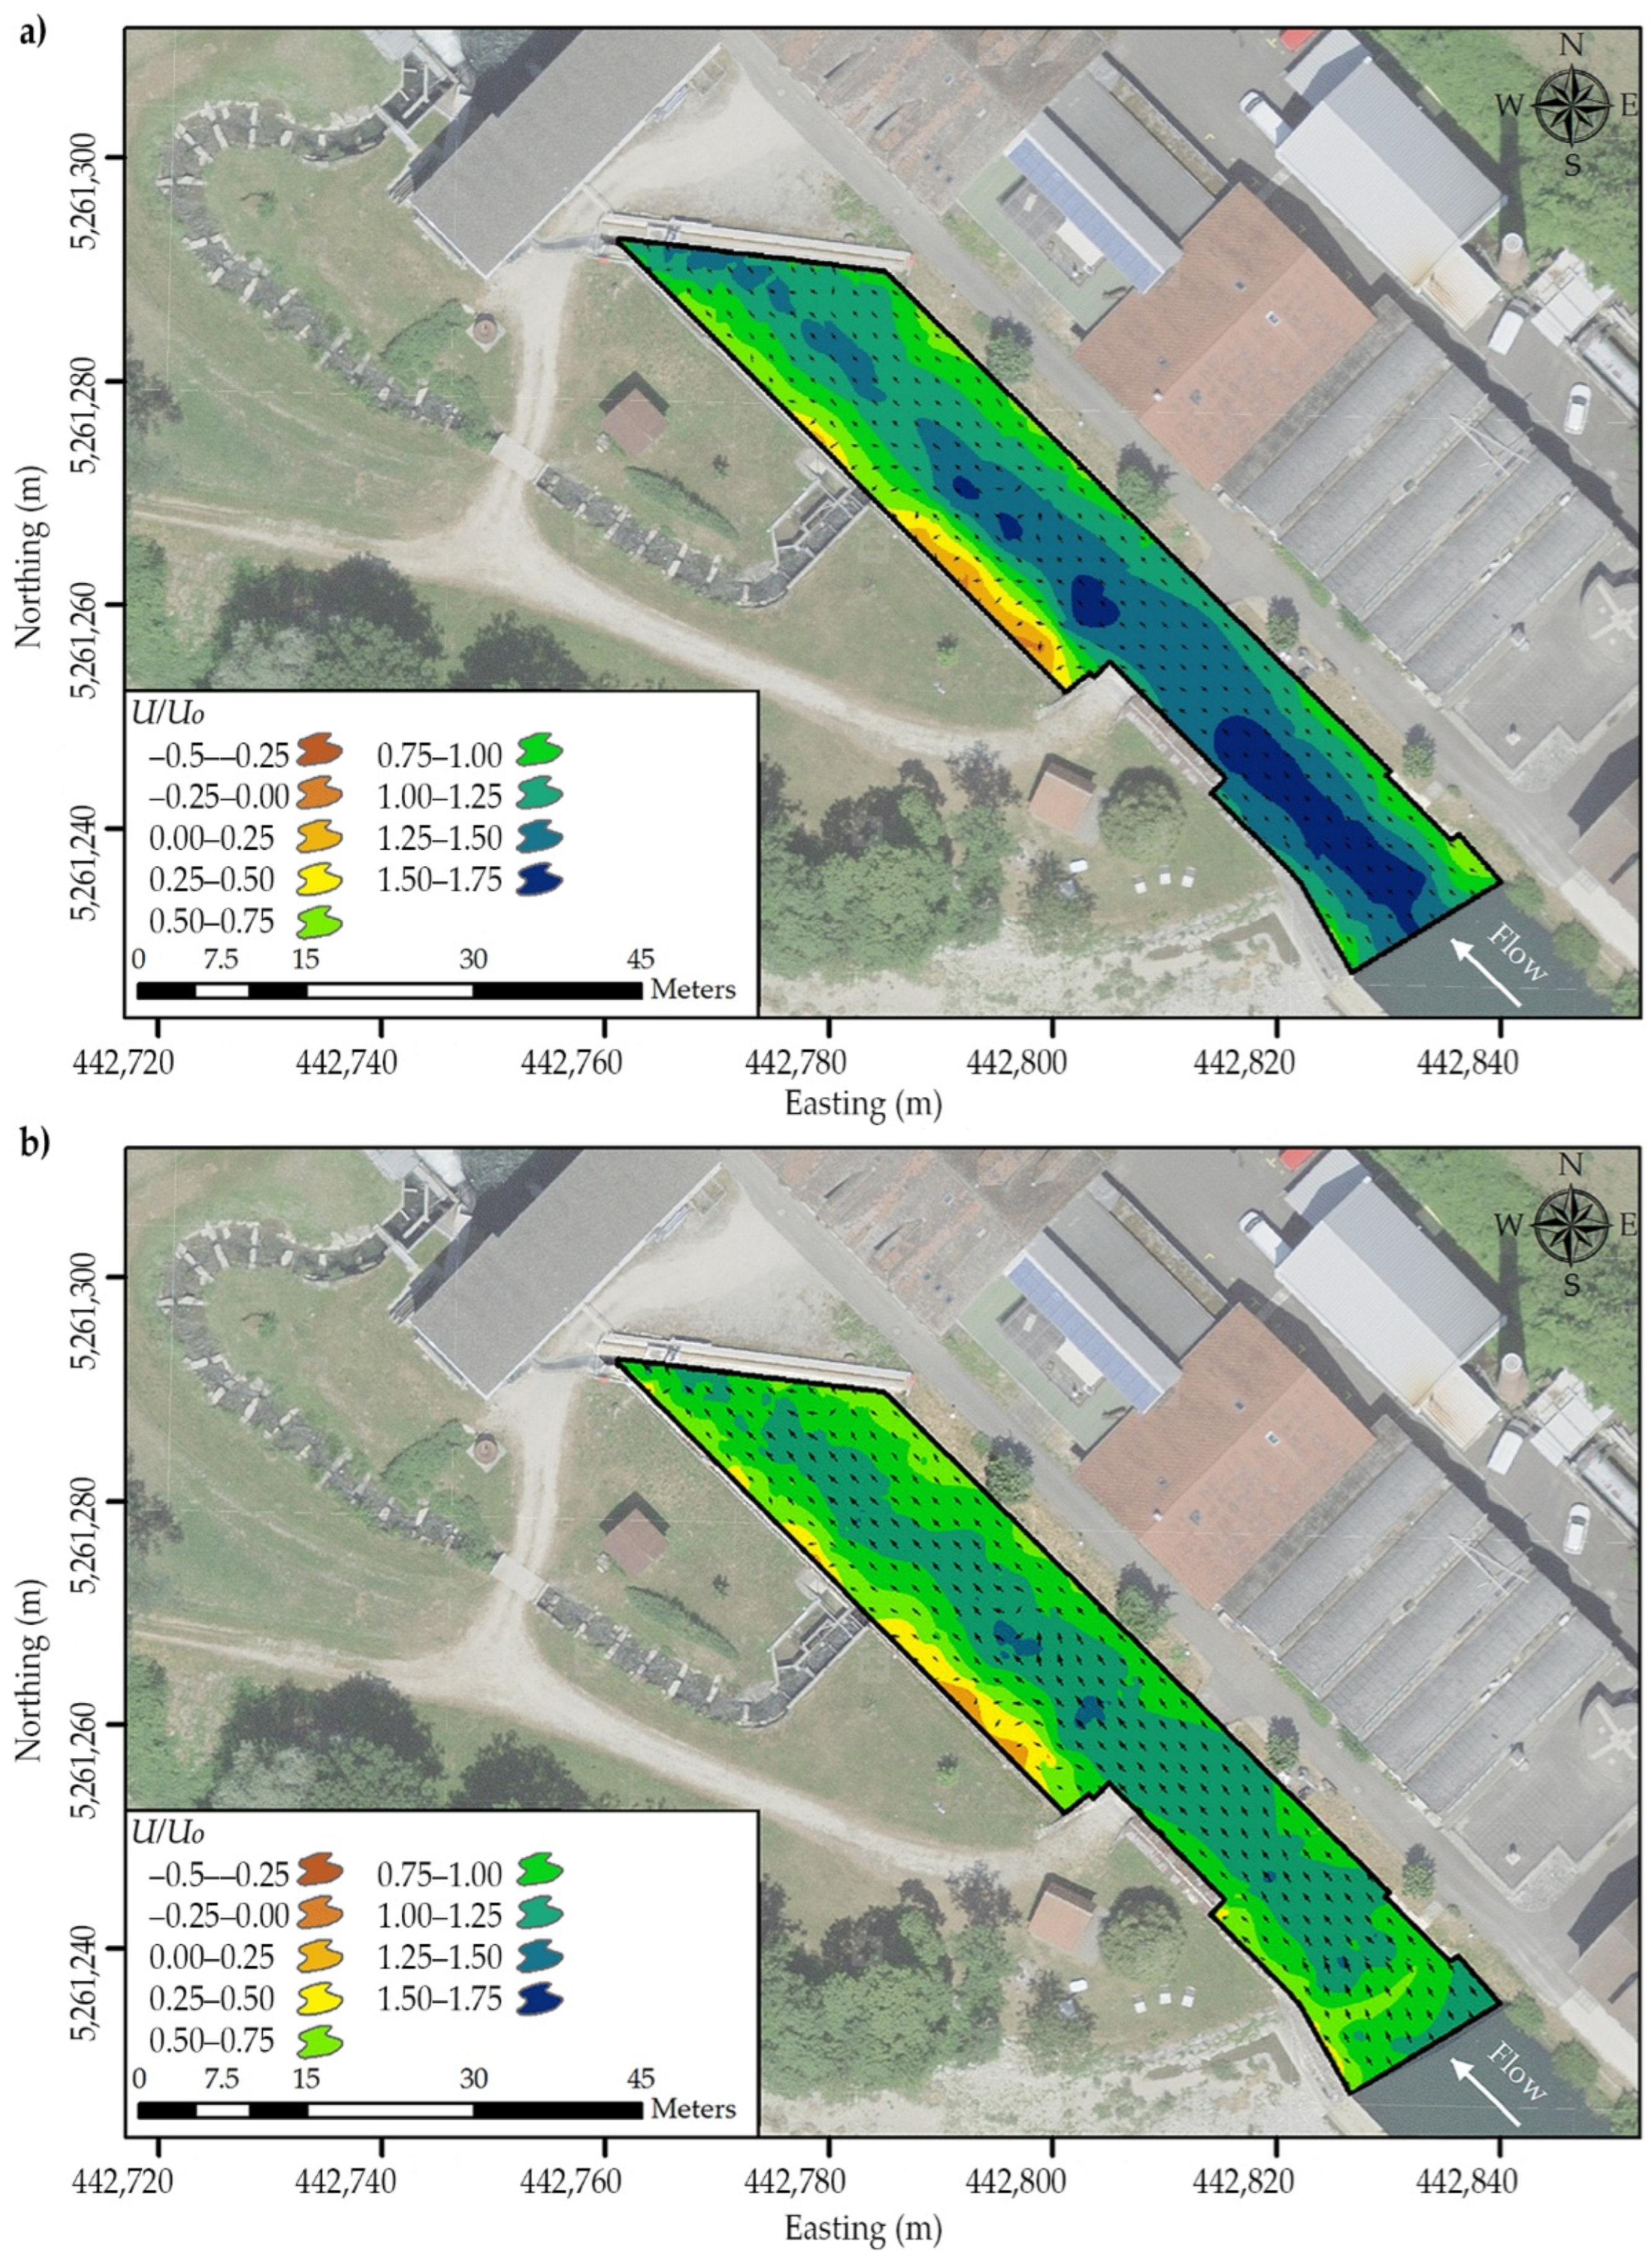
Figure 5 and Figure 6 show the depth-averaged and interpolated depth-averaged resulting velocity fields along the headrace channel, respectively. The resulting velocity was calculated as where , and are the depth-averaged streamwise, transverse, and vertical flow velocities, respectively. The discharge measured by ADCP was around 26.63 m3/s with a standard deviation of 0.83 m3/s. The maximum velocities were around 0.95 m/s at the center of the channel, decreasing from upstream towards the HBR-BS. The main flow direction was slightly shifted towards the left channel side after the flow passes the bridge abutments, which narrows the headrace channel. A return flow with negative streamwise velocities occurred downstream of the bridge’s left abutment, where the headrace channel widens. Figure 7a,b show the streamwise velocities normalized with the mean approach flow velocity U0 = 0.59 m/s along the channel at the levels of 0.38 m (z/h0 = 0.88) and 2.42 m (z/h0 = 0.2) below the water surface, respectively (z is the distance above the channel bed and h0 is the water depth). The streamwise velocity distributions at two different water levels followed the same pattern as the depth-averaged velocities. At both water levels, the maximum flow velocities were diverted in the direction of the left bank toward the bypass entrance. As expected, the flow velocities were lower near the channel bed (Figure 7b) compared to flow velocities near the water surface (Figure 7a). The highest velocities obtained from the cross-sectional velocity distributions occurred at z/h0 = 0.88. The occurrence of maximum velocities below the water surface, the so-called velocity-dip phenomenon, is related to the secondary currents of Prandtl’s second kind driven by turbulence anisotropy [35,36,37,38]. Such secondary currents exist when the channel width to water depth aspect ratio is less than 4 to 5, creating a 3D flow pattern. At HPP Stroppel, the aspect ratio was around 5 corresponding to the limit aspect ratio.
4.2. Flow Field along HBR
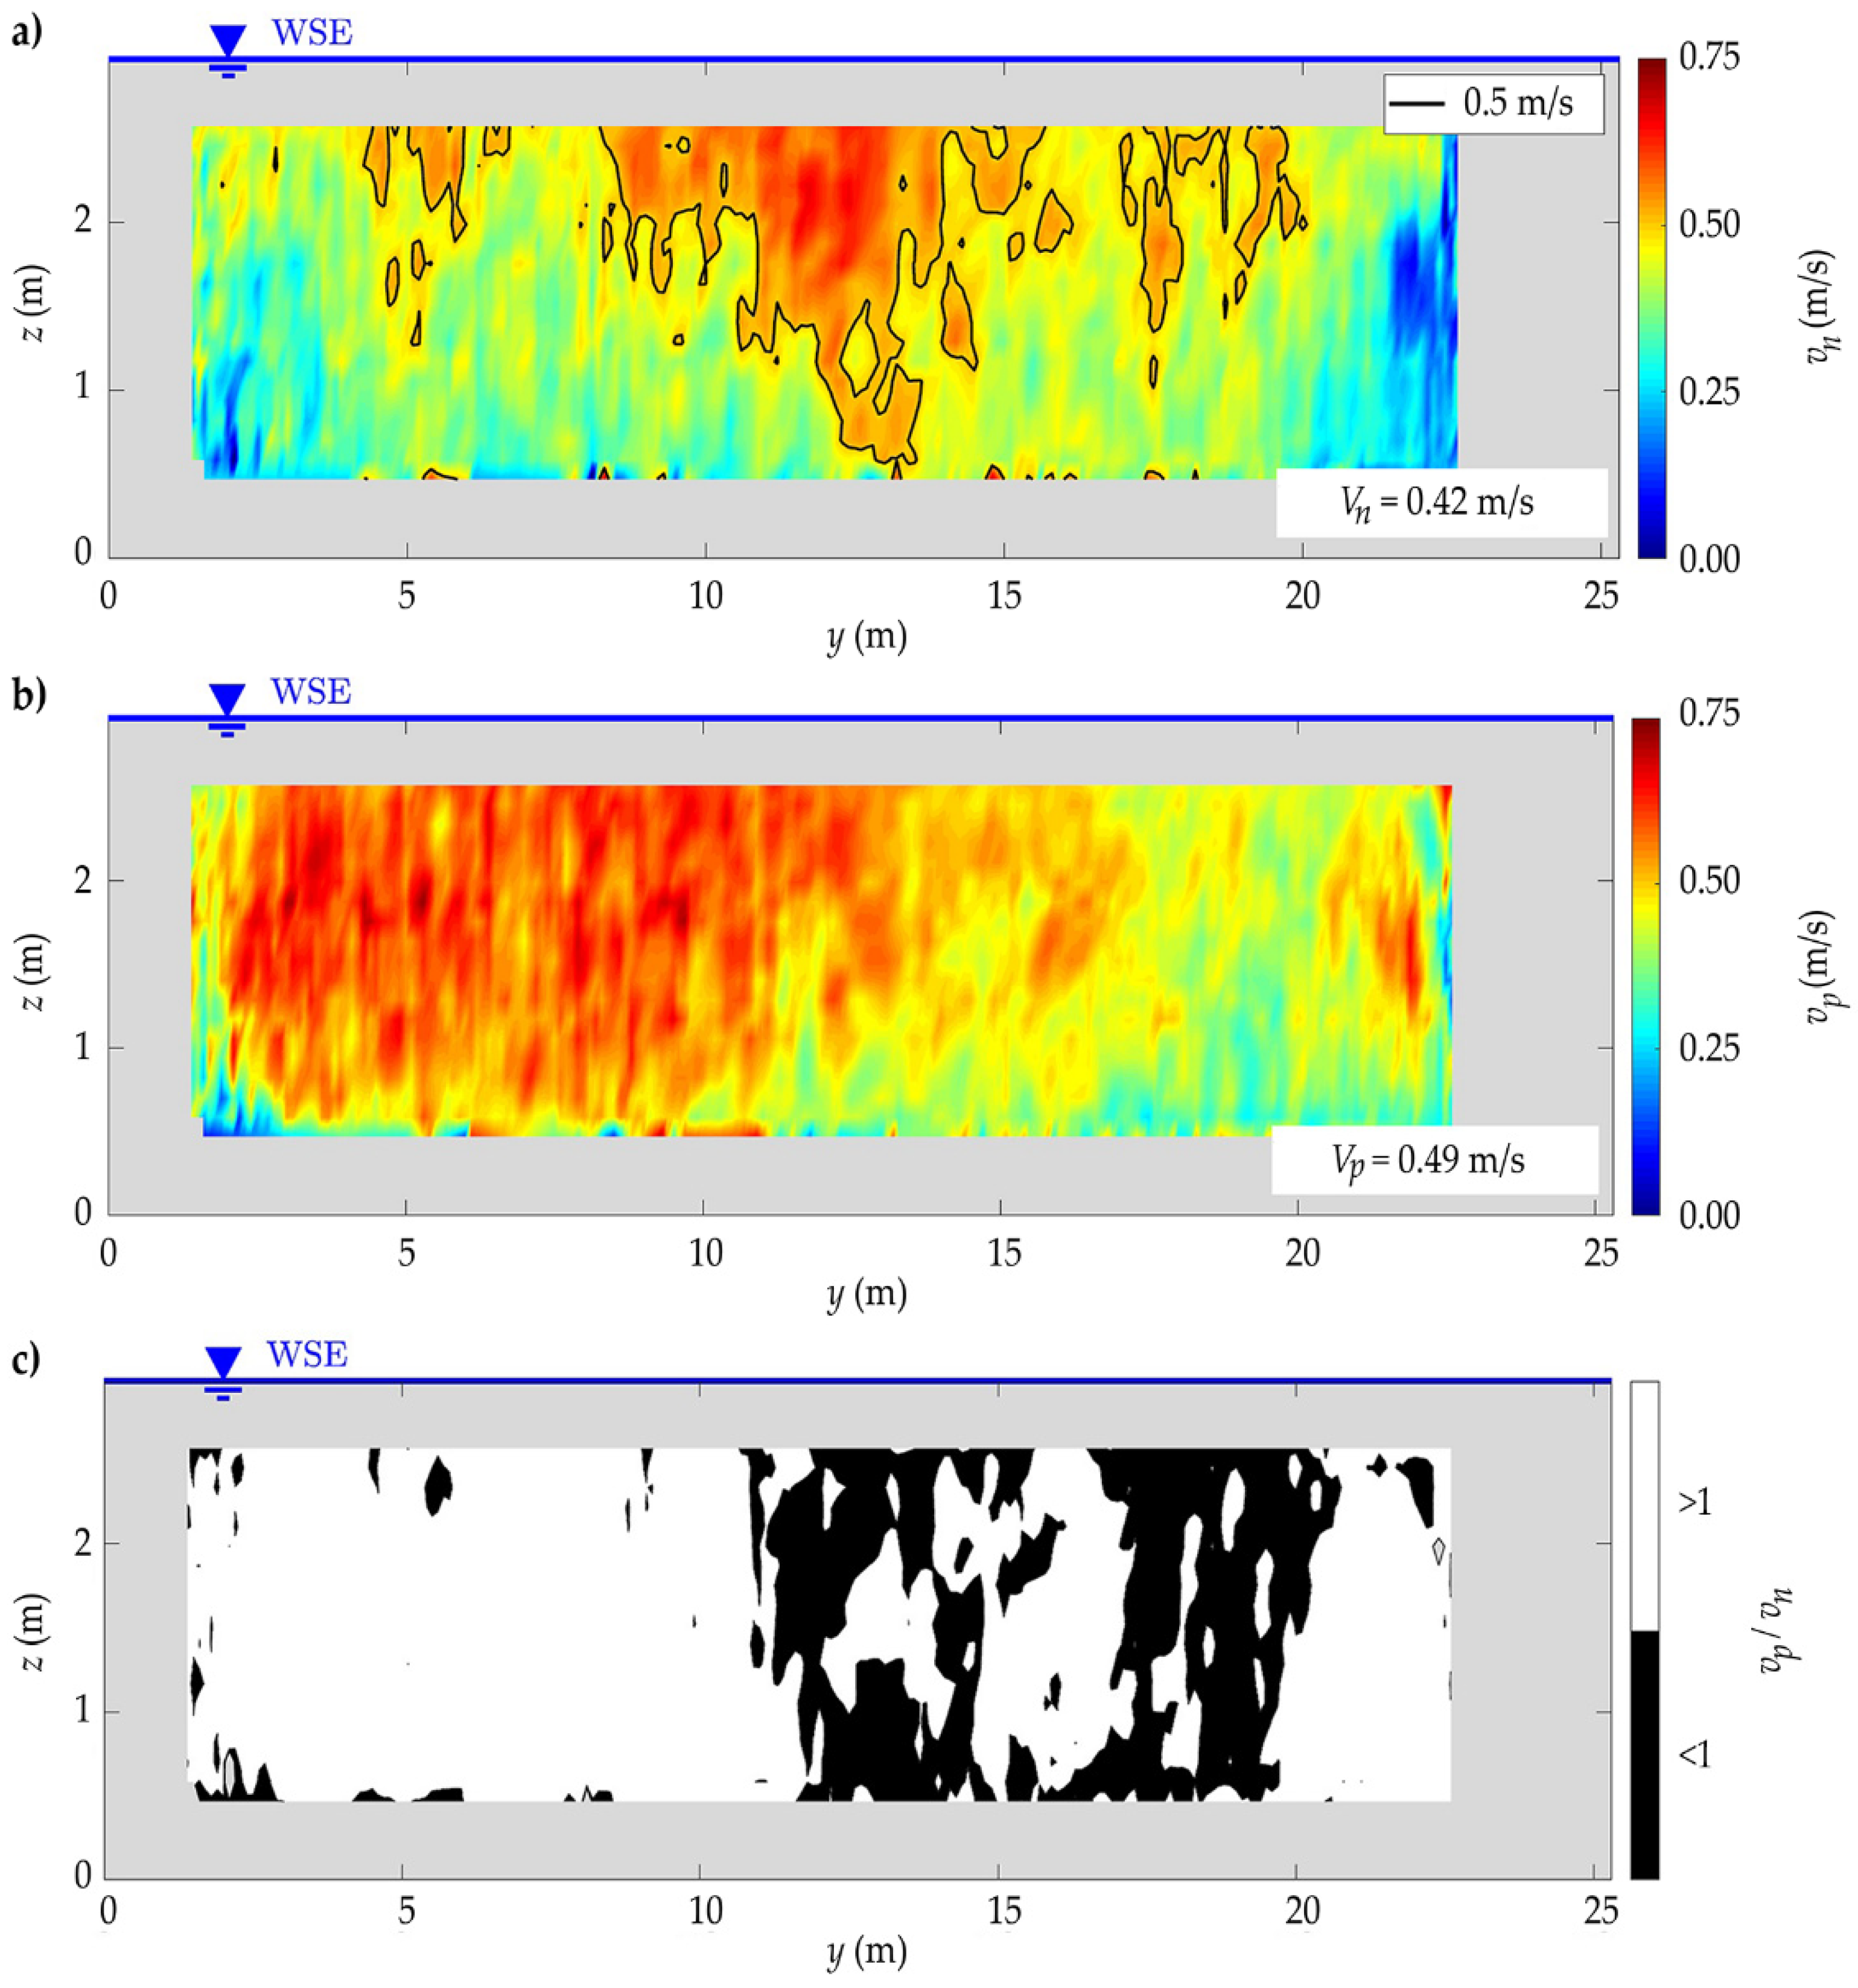
Velocity distributions along the rack were investigated to evaluate whether they followed the velocity design recommendations for the HBR-BS given by Ebel [22] and to link them to the fish monitoring results. The velocities were measured at CS14 and CS15 (parallel to the rack). Due to the ADCP beam angle of 20° to the vertical direction, data in CS14 were not available over the full depth. Below approximately z/h0 = 0.5, the ADCP beams crossed the rack, and hence no recording was possible. Therefore, the following results mainly focus on the velocity distributions at CS15, 1.7 m upstream of the rack. Furthermore, due to ADCP limitations (transducer depth, blanking distance, and side-lobe interference), no velocity information near the bottom and the water surface was available in both cross-sections. Figure 8a–c shows the cross-sectional distributions of vn, vp, and vp/vn at CS15. Thereby, z is the vertical axis starting from the channel bed and reaching its maximum h0 at the water surface, and y is the distance from the left side of the measured cross-section. The rack parallel axis starts from the left channel bank, where the bypass was located, and goes along the rack to the right channel bank. The cross-sectionally averaged rack normal velocity was Vn = 0.42 m/s. The highest local rack normal velocities were up to vn = 0.75 m/s measured in the upper half of the cross-section around the central part of the HBR, which roughly corresponded to the velocity-dip and hence indicated the effect of the secondary current even near the HBR-BS. Except for this high flow velocity zone encircled with a black line in Figure 8a, the normal flow velocities were less than 0.50 m/s in a large section of the rack. The cross-sectionally averaged velocity component parallel to the rack (Vp) in CS15 was 0.49 m/s, which is higher than Vn = 0.42 m/s (Figure 8b). Figure 8b shows a gradual increase of vp from the right side of the rack towards the bypass, reaching a maximum value of 0.75 m/s. In terms of fish guidance, such a trend is favorable and guides fish to the bypass. Furthermore, Figure 8c shows the distribution of vp/vn < 1 (black areas) and >1 (white areas) along the rack. The effective guidance of an HBR depended also on maintaining vp/vn > 1 upstream of the bypass [2]. From the center of the rack towards the bypass, vp/vn was higher than one, indicating favorable flow conditions for fish guidance to the bypass. However, at the right half of the rack, the normal velocity exceeded the parallel velocity in some areas and resulted in vp/vn ≈ 0.75, which is below the threshold of one. At these regions, the guidance effect of the HBR theoretically diminishes.
4.3. Fish Swimming Performance and Hydrodynamics
Swimming behavior and performance of target fish species are of prime importance and used as a guideline for a successful layout of HBR-BS. Therefore, an HBR must be designed in a way that the normal velocity Vn in general and the local vn, in particular, do not exceed the sustained swimming speed vsus of the target fish species, which can be maintained over long periods, typically above 200 min [39]. The swimming speed of rheophile fish vf can be calculated using Equation (3) [22].
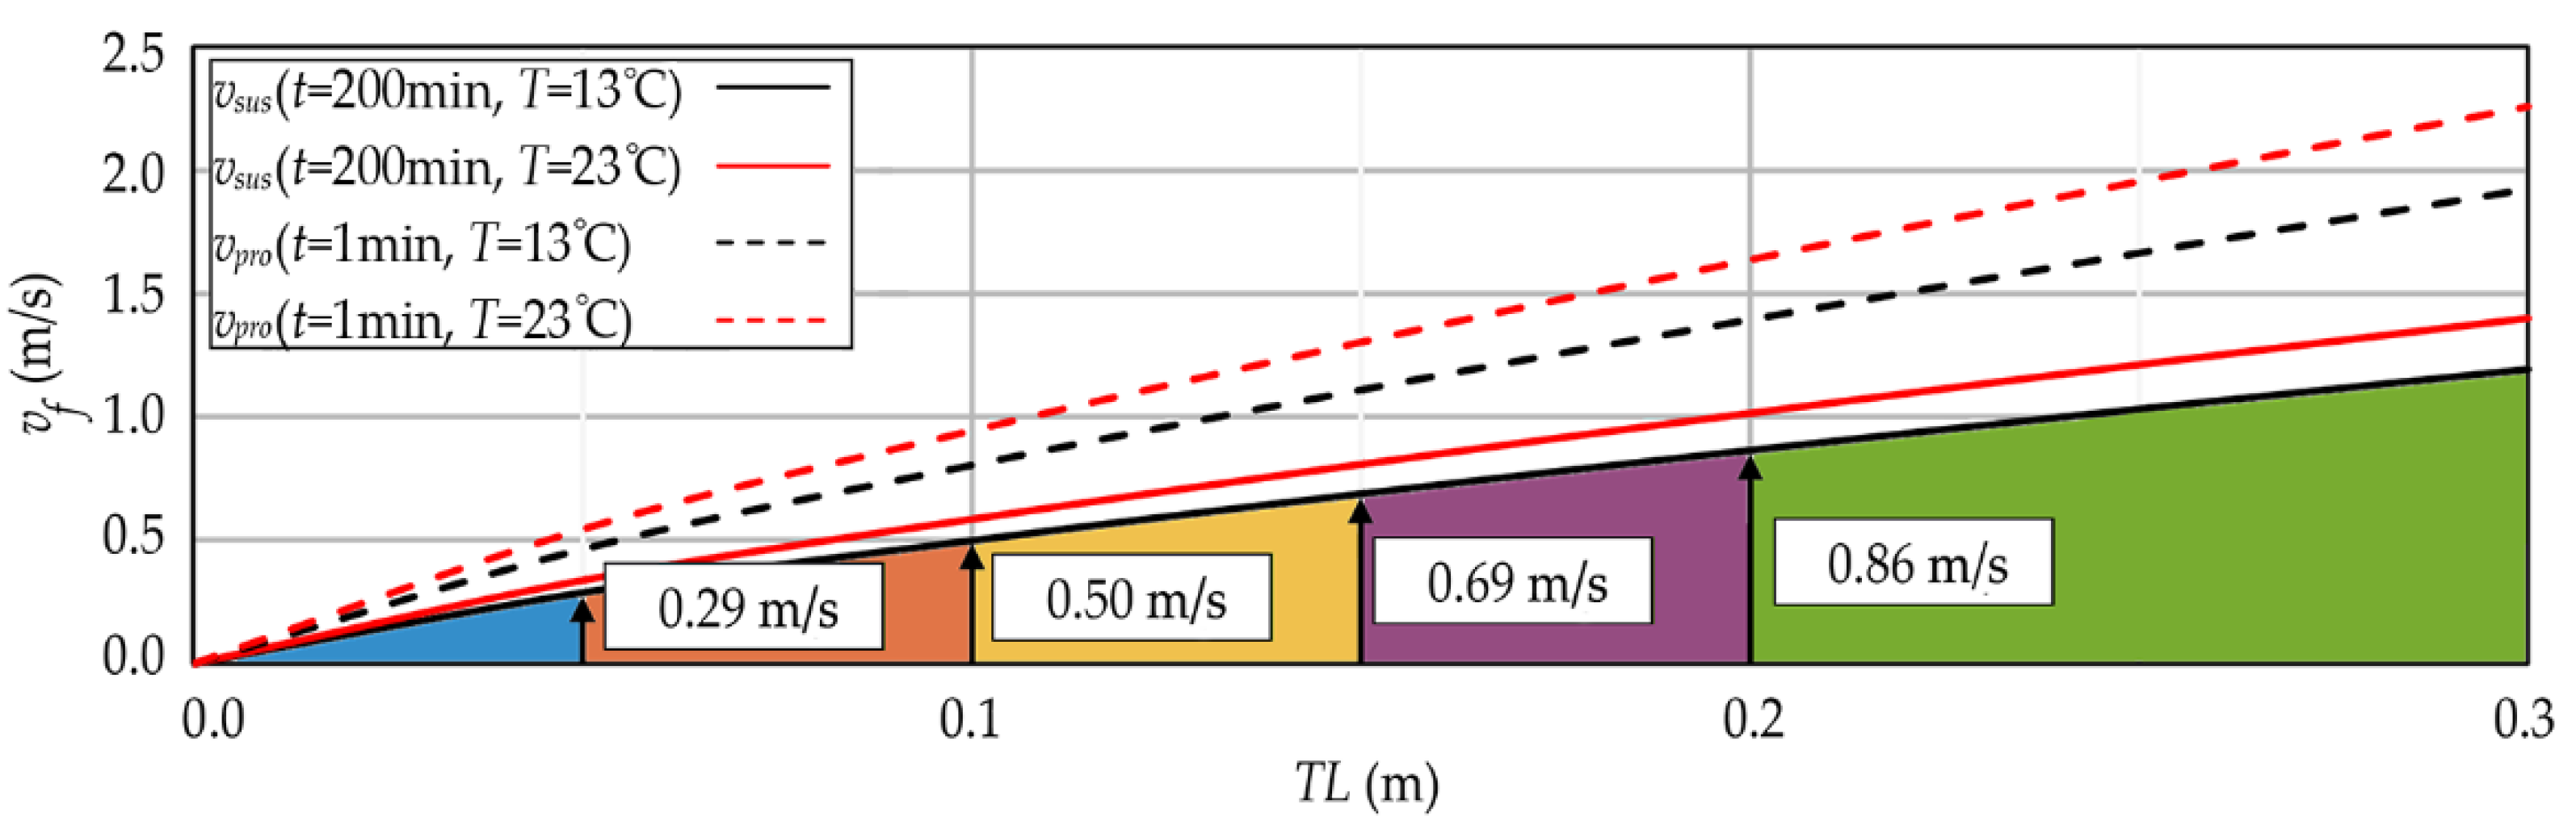
where TL is the total fish length, t is the duration, and T is the water temperature. To calculate the sustained swimming speed vsus of target fishes in this study, 200 min was used as a characteristic lower bound duration. In contrast, for the so-called prolonged swimming speed, which corresponds to an energy-consuming speed that fish can maintain for periods between 1 and 200 min [16], a characteristic duration of 1 min was used. The minimum and maximum water temperatures during the fish monitoring campaigns were 7 and 23 °C, respectively (Table 2). The number of collected fishes at 7 °C was too small (30 fishes), therefore, 13 °C was used for the minimum water temperature, as the number of collected fishes at this temperature was 6239 (Table 2).
log vf = 0.5460 + 0.7937 log(TL) − 0.0902 log(t) + 0.2813 log(T)
Figure 9 shows the sustained (full lines) and prolonged (dashed lines) fish swimming speeds vsus and vpro, respectively, versus a range of fish lengths at different water temperatures. The colors beneath the vsus curve correspond to vsus values of different fish size classes obtained from the fish monitoring campaign reported by Zaugg and Mendez [20] at a water temperature of 13 °C. Figure 10 shows the contours of the normal to the rack velocities vn for CS15, with colors matching those of Figure 9. The local vn values exceeded the cross-sectionally averaged normal velocity component of Vn = 0.42 m/s close to the water surface and at the center of the channel. According to the monitoring campaign, 98% and 86% of the fishes captured in the bypass system had a length of less than 20 cm and 10 cm, respectively [20]. In general, most of the fish were small with vsus ≤ 0.50 m/s for TL ≤ 10 cm and T ≤ 13 °C and hence subjected to high flow velocities over parts of the rack area, i.e., for the orange (and potentially purple) colored areas. Considering the prolonged swimming speeds vpro instead of vsus, fish are capable of swimming much faster. For example, fish with TL = 10 cm can swim with a velocity of 0.80 m/s for one minute, in 13 °C water. Therefore, the measured velocities along the rack can be assessed as suitable for small fishes, considering the prolonged swimming speeds. The comparison of the flow field with vsus is therefore a conservative approach. Zaugg and Mendez [20] observed several fish, especially small fish, swimming back and forth along the rack with no visible intention to move downstream. This observation indicates that even small fish were able to withstand flow velocities higher than their sustained swimming speeds.
4.4. Flow Field in Front of Bypass
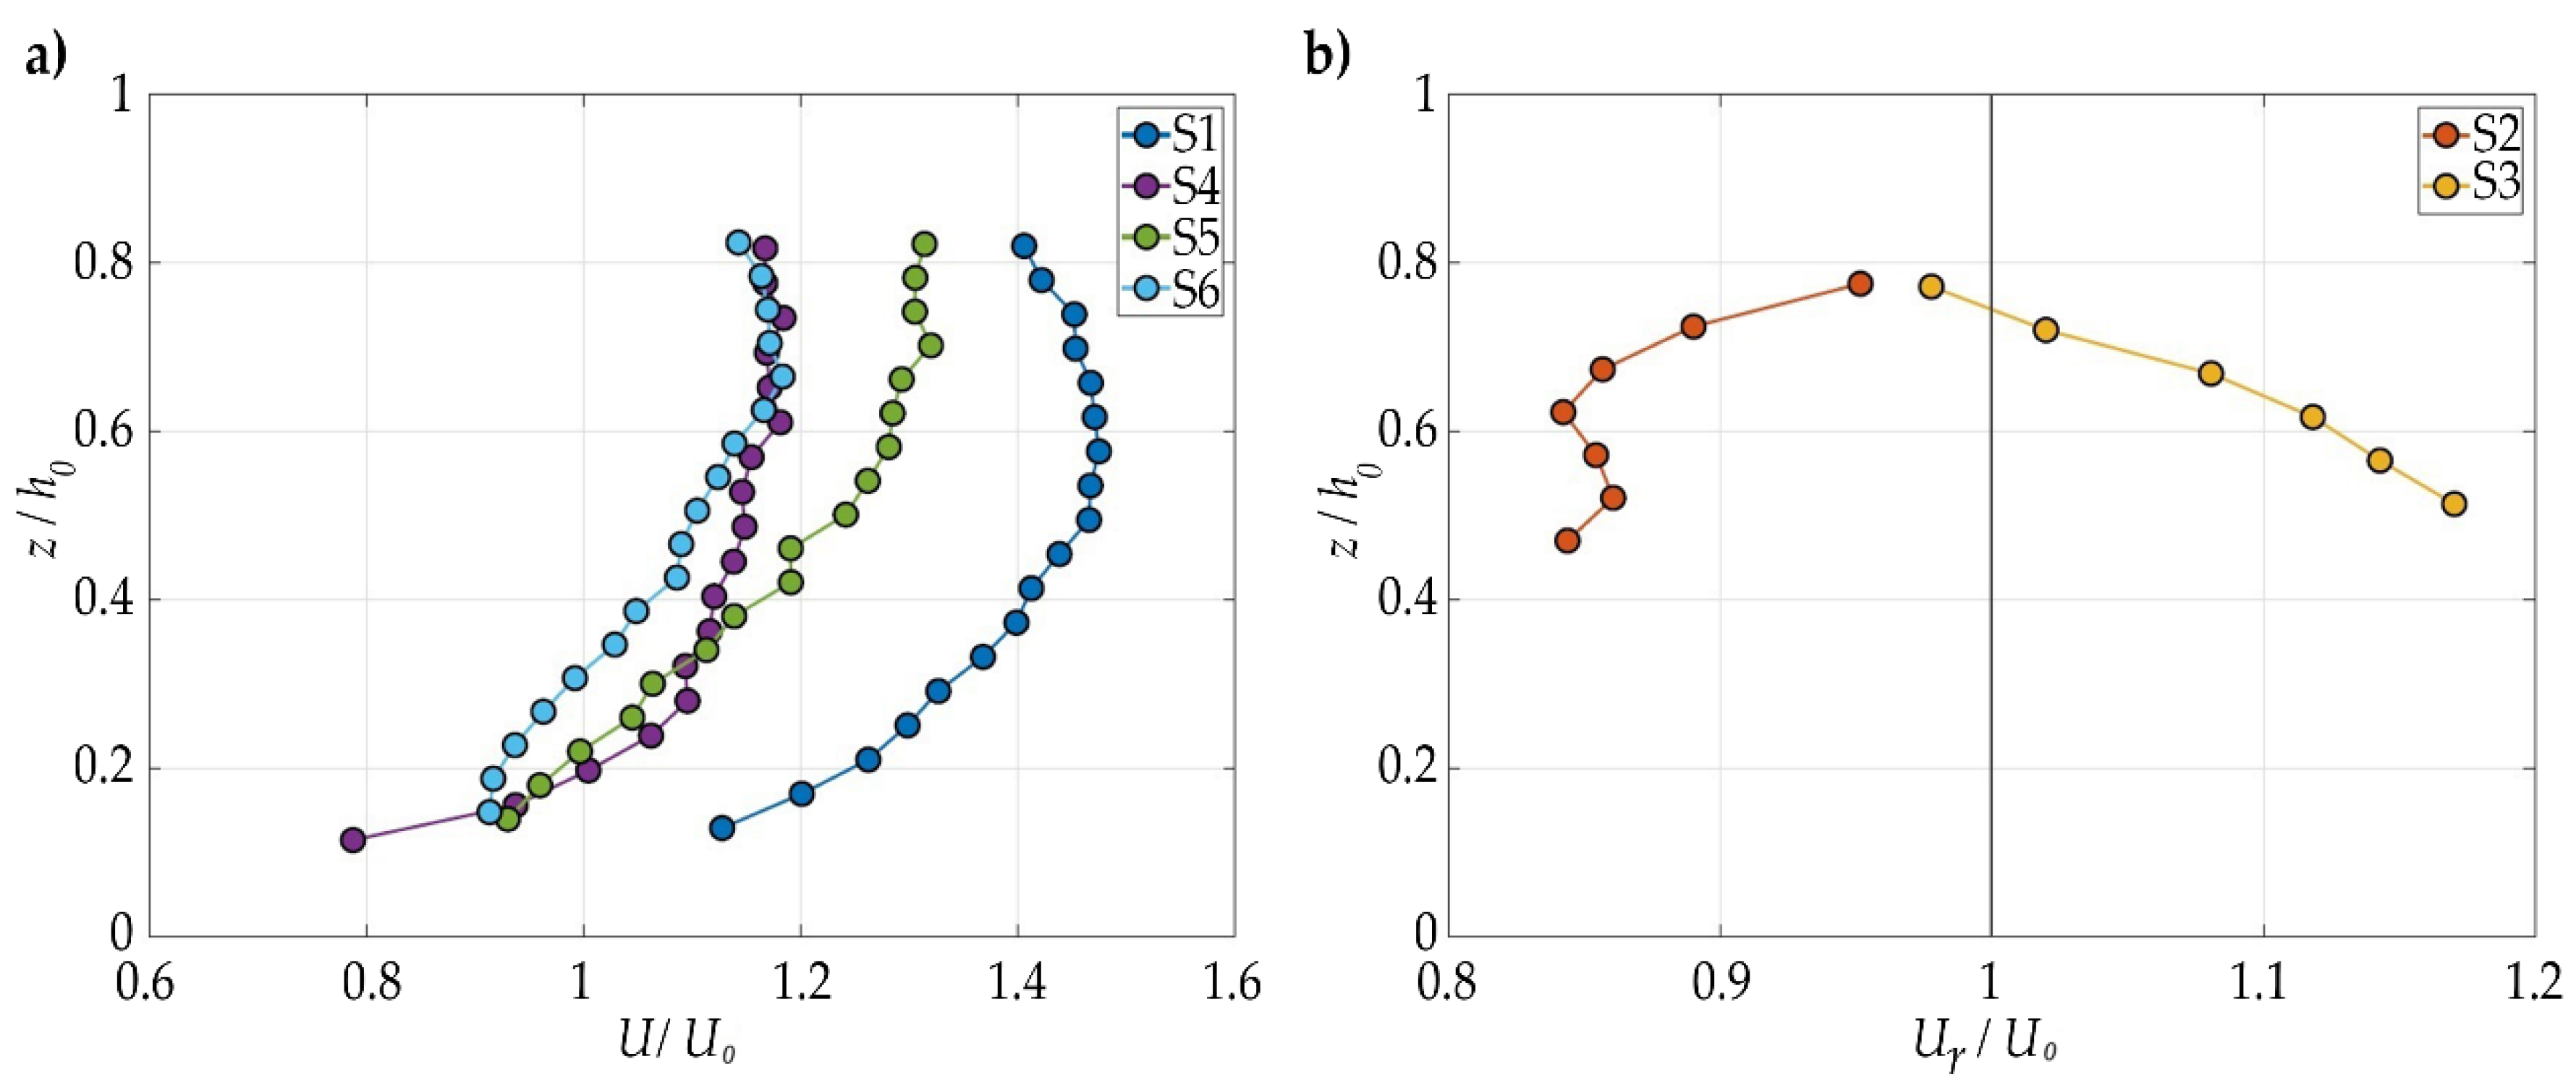
Figure 11 shows the vertical distribution of the stationary time-averaged streamwise velocities (U) in the headrace channel (a) and resulting velocity (Ur) in the bypass entrance (b). These velocities were normalized with the cross-sectionally averaged approach flow velocity U0 of 0.59 m/s calculated from CS07, which was downstream of the fish pass exit. For S1 the maximum flow velocity lied at z/h0 = 0.6 (with h0 = 2.95 m) indicating the velocity dip-phenomena caused by secondary currents [36,37]. At S4 to S6, flow velocities were lower than at S1 as a portion of the flow passed the rack and the maximum velocities at S4 to S6 occurred closer to the water surface because of the backwater effect caused by the presence of the rack and bypass gate. The normalized resulting velocity for the stationary measurements at the bypass entrance (S2 and S3) is shown in Figure 11b. The values measured at S2 were smaller than 1, whereas the values in S3 were above 1. Note that data are only available over a part of the water depth due to ADCP limitations (the beams hit the walls and the device cannot measure the whole depth). To get the full vertical profile, additional investigations with another measurement device are required. At S3, the flow velocities were higher than at S2 showing a gradual decrease of the flow velocity towards the bypass, particularly at the center of the water depth i.e., z/h0 = 0.5. Above and below this point, velocities are supposed to be higher because of the top and bottom openings at the bypass gate, although no velocity measurement could be conducted.
In addition to the ADCP measurements, the spatially averaged velocity in front of the bypass and at the two bypass openings were calculated using geometry information and the bypass design discharge. The inlet channel to the bypass had a width of 1 m and a water depth of 2.7 m. With a bypass discharge of 690 l/s, this resulted in a mean flow velocity of around 0.25 m/s in front of the bypass entrance. However, due to the bypass gate effect, Figure 11b, local flow velocities were assumed to be partially above this average value. At the bypass gate itself, the area was decreased as there were only two openings available for the water to pass. Based on the above-mentioned dimensions of the top and bottom openings, the mean velocity of both openings would be around 1.7 m/s (2.9 times the averaged approach flow velocity U0 in the head race channel).
4.5. Estimation of FGE and FPE
FGE and FPE were estimated for a range of fish sizes for HPP Stroppel based on Equations (1) and (2), respectively. In most studies, only fish length is measured and reported. Therefore, the fish width in this study was estimated using Equation (4) [40,41]. In this Equation, a and b are coefficients that have been determined for different fish species captured during the monitoring campaigns; a and b differ from 0.0501 to 0.0727 and 1.0918 to 1.2429, respectively.
wf = a TL b
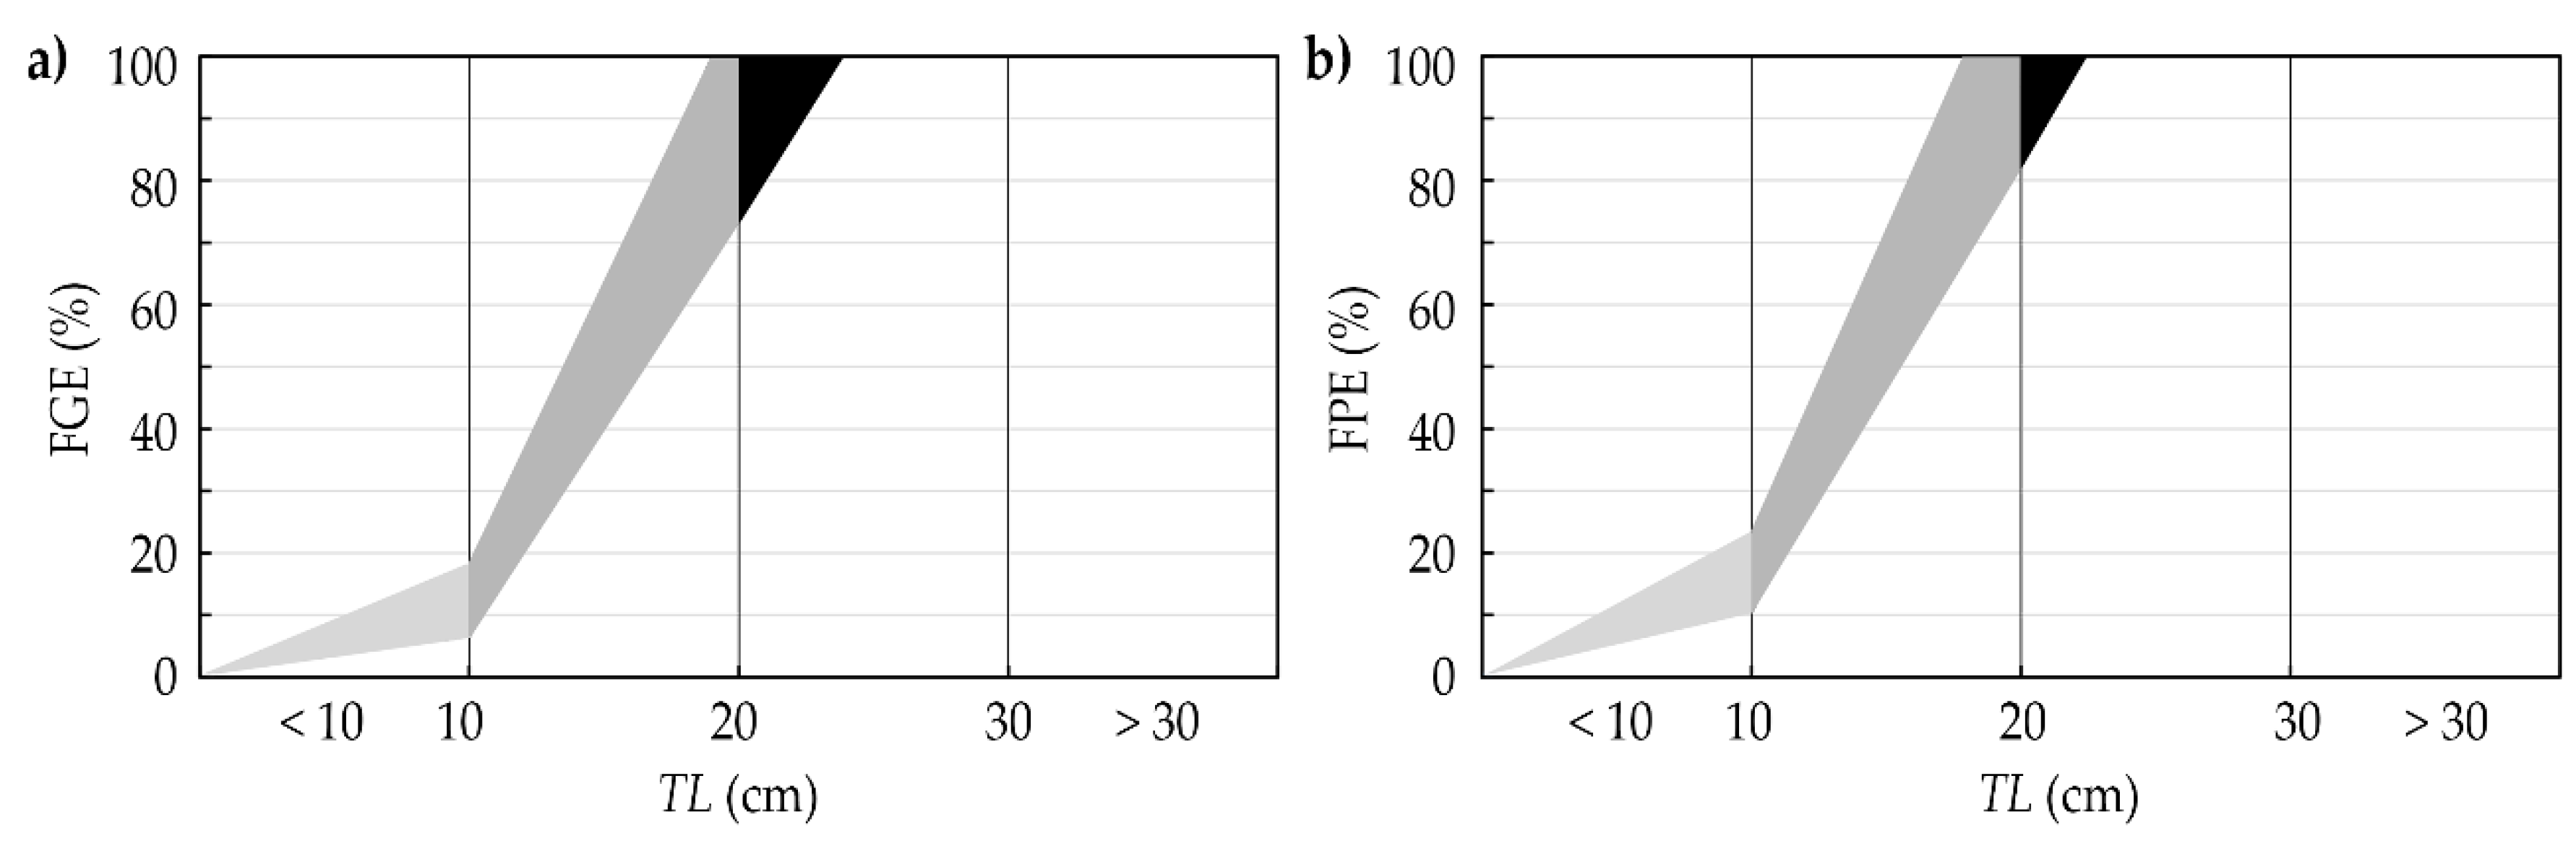
Based on Equations (1), (2), and (4), FGE and FPE for different fish length classes (Table 3) were calculated and are presented in Figure 12. FGE for different fish species with total lengths of less than 10 cm was below 17%. By increasing the fish length to 20 cm, FGE ranged from 74 to 100%. FGE for all fish species with a fish length of more than around 24 cm was 100%.
FPE for small fish with lengths of less than 10 cm, was below 22%. For fish species with lengths of 20 cm, FPE increased to between 82 and 100%. FPE for all fish species with fish lengths of more than around 22 cm was 100%. Overall, the estimated FPE and FGE for the HBR-BS were quite low for the many fish collected during the fish monitoring study (86% of the collected fish with TL < 10 cm), which is discussed in relation to the hydraulics of the HBR and fish monitoring study results in Section 4.
4.6. Fish Behavior and Rack Passage: Video and ARIS Sonar Monitoring Results
During the first fish monitoring study block (15–18 September 2015), many fish, especially small fish, were observed swimming back and forth along the rack by the camera attached to the bank wall upstream of the bypass entrance. Most of them did not descend but swam back into the headwater channel. Other fish moved back and forth in the bottom channel (e.g., perch and barbel). In October 2016, during the mass migration period, this behavior was not observed. Fish arriving at the rack rarely swam in the same place for a long time and instead, they moved into the bypass after a short time. Such a different fish behavior is related to the willingness of fish to migrate downstream or not. Furthermore, the size composition of the fish observed around the rack corresponded to the size composition of the fish using the bypass.
According to the video recordings, fish reached the rack area with their tail fin first (positive rheotaxis). After a certain time, descending fish let themselves be carried along with the flow in positive rheotaxis and go into the bypass. No special escape reactions in front of the bypass openings were observed, indicating that high flow velocities did not affect the fish bypass acceptance. Some of the fish also swam actively (head first, i.e., in negative rheotaxis) along the rack into the bypass. Small fish often used the bypass when they were in groups or schools, which were often composed of several species. Fish were observed in all water depths. Since most of the fish arrived in groups in front of the rack, the behavior of individual fish or species can only be observed in exceptional cases (e.g., eels, barbel, and perch are more frequent in the bottom channel). Groups of fish were observed in all water depths and in front of the top and bottom openings of the bypass, so it can be assumed that both openings were used by the fish.
Among the individuals that were presumably not willing to move downstream, many small fish that were observed which stayed in front of the rack swam against the flow and fed there for a long time. No fish impingement against the rack was observed in the videos during the study.
In addition to video recordings, ARIS sonar measurements were conducted between 15 and 18 September in 2015 upstream of the rack, to better understand the fish behavior near the rack. Individual fish or fish groups of one to five species stayed in front of the rack for hours and did not show any search behavior to move downstream. They stood in the current for a long time, let themselves drift back to the rack, actively swam back and forth to the rack, and then often swam up the river bank again until they reappeared in front of the sonar. These fish probably used the area in front of the rack as a habitat and were able to stand in the current without difficulty and swam upstream again, and were not pressed against the rack. These results matched with the video observations.
During the mass migration of small fish, between 25 and 27 October 2016, ARIS sonar measurements were conducted downstream of the rack to detect fish that passed the rack (Figure 3). The sonar was installed on 24 October 2016. The Sonar results showed that small fish with a body size of less than 10 cm passed the rack, and the number of those fish was significantly less than those using the bypass (Table 4). This result showed that although the HBR installed at the HPP Stroppel did not provide complete physical barrier protection, it had a very good guiding effect towards the bypass with an FGE of 98% (assuming no refusal of fish to enter the bypass). This finding of the sonar measurements matched that from the video recordings.
5. Discussion
Fish usually follow the main flow during downstream migration [22]. Depth-averaged velocity magnitude distributions along the headrace channel show that the main flow is slightly shifted towards the left channel side where the bypass is located at the end of the HBR. In terms of fish guidance towards the bypass, this development of the flow velocity is favorable for fish migrating or moving downstream [11,15,18].
Velocity distributions along the HBR show that the flow gradually increases from the right towards the left channel bank. This velocity development is positive in terms of fish guidance since fish are attracted to swim to the left channel bank where the bypass is located. To guide approaching fish at the rack successfully towards the bypass, the parallel (tangential to the rack) velocity component vp should be higher than the normal component vn [2,10]. The results show that from the center of the rack towards the bypass, the ratio of vp/vn is higher than unity, therefore indicating a favorable flow field. On the right half of the rack, the normal velocity slightly exceeds the parallel component in some areas, which could be affected by turbine operation of the HPP, rack support structures, and the channel geometry downstream of the rack with a widening at the right channel bank. Experimental results from live fish tests with louvers and angled bar racks in the Alden Research Laboratory show that a rack angle of α = 15° has more potential to guide fish to the bypass than α = 45° [9]. Furthermore, Albayrak et al. [23] reported similar results and demonstrated that an MBR with α = 30° and a bottom overlay resulted in a similar fish guidance efficiency as the MBR with α = 15°. In general, a rack angle around α = 30° is a good compromise because of its lower construction cost, while still enabling high FGE. The fish monitoring results for the present HBR-BS show that fish can be well protected and guided toward the bypass inlet [20], even with α = 38° which is in the range of 20° to 40°, recommended by Ebel et al. [29].
Swiss and German guidelines recommend a minimum approach flow velocity of U0 ≤ 0.50 m/s for a fish guidance rack independent of rack angle and sustained swimming speed of target fish species [42,43]. Such a recommended design velocity limits the applications of HBRs or other FGRs because the approach flow velocities are often higher than 0.5 m/s at many HPPs. On the contrary, UK [39] and US [4] design guidelines recommend that Vn should not exceed the sustained swimming speed vsus of the target fish species. Ebel [22] also agrees with this recommendation for the design of HBRs. The general recommendation for the maximum cross-sectional normal velocity component at the rack is Vn = 0.5 m/s to avoid fish impingement against the rack and hence fish injury. This value is around the average sustained swimming speed of most fish species for typical total lengths and water temperatures [2,10,42]. At HPP Stroppel, the measured cross-sectionally averaged Vn is around 0.42 m/s, which is below the recommended value. However, some local normal velocities vn in front of the rack are above this value (Figure 10). Of the collected fish, 86% feature TL ≤ 10 cm and their corresponding sustained swimming speed is vsus ≤ 0.50 m/s at T = 13 °C. Therefore, these small fish are theoretically at risk of rack passage along most parts of the rack, particularly at the center portion of the rack and close to the water surface. Furthermore, the FGE and FPE of the HBR of these fish calculated based on Equations (1) and (2) (Meister [21]) vary from 0% to maximum 17% and 22%, respectively. Overall, the HBR-BS at HPP Stroppel does not theoretically provide any physical protection for such small fish, which make up a large portion of the collected fish during the monitoring. However, the sonar measurements give an FGE value of 98% or a 2% rack passage rate (Table 4), which is significantly higher than the theoretically estimated FGE. Such a contrary result between the laboratory and field investigations can be related to various reasons. One reason is the limitations and coverage of the ARIS sonar. Among studies on the accuracy and precision of the ARIS and DIDSON sonars for fish length measurements [44,45,46,47,48], Egg et al. [49] particularly focused on the effect of fish size on the fish detection rate of the ARIS sonar. They compared the fish monitoring data from the sonar and GoPro camera with the fish caught in a multi-mesh stow in the Moosach river in Bavaria, Germany. The results show that the total number of fish with a total length less than 50 mm recorded in the stow net was almost three times higher than detected by the sonar (38%). For the fish size class between 50 and 100 mm, the number of fish caught in the stow net was about twice that detected by the sonar (48.37%). For the fish size class between 100 and 150 mm, both the stow net and sonar systems recorded similar numbers of fish. Based on these results, it can be assumed that the present sonar system has a similar detection rate of around 50% of the total number of fish passing the rack, and hence the total number of fish is assumed to be twice that detected by the sonar, i.e., 127 × 2 = 254 (see Table 4). Furthermore, as shown in Figure 13, the sonar covers a rack area, which is l1 ≈ 3.5 m and l2 ≈ 3.1 m long (total of 6.6 m) and h1 ≈ 1.8 m and h2 ≈ 2.7 m deep. (see Figure 3 for the definition of the parameters). By considering the total rack area of 25.32 m × 2.7 m = 68.36 m2, the area covered by the sonar is around 16.3 m2, corresponding to approximately 24% of the total rack area. If linearly scaled with the rack area, the total number of fish passing the whole rack is estimated to be 254/0.24 = 1058, which corresponds to a fish rack passage rate of 1058/(5684 + 1058) ≈ 16%. Such a correction and upscaling reduce the FGE from 98 to 84% for the HBR-BS for small fish species < 100 mm, which is still significantly higher than the theoretically estimated FGEs of less than 20%. Although the limitations and coverage of the sonar do not seem to affect the monitoring result very significantly, there are still large uncertainties from the sonar measurements. To clarify the sonar results and address the differences between the laboratory [21] and the present results, it is highly recommended to conduct fish monitoring by simultaneously installing stow nets at both the turbine and bypass outlets.
Another reason for the observed high FGE at HPP Stroppel is the fact that the HBR does not only function as a physical barrier but also as a mechanical behavioral barrier similar to louvers, MBRs, and CBRs for certain fish species. The video recordings showed that small fish swam back from the rack with a positive rheotaxis and drifted backward towards the bypass. Such observations indicate that although the fish sustained swimming speed is partly below the local normal velocity component at the rack (Figure 10), fish could still swim against the flow as their prolonged swimming speed vpro was above the velocities normal to the rack (Figure 9). Moreover, the monitoring results also indicate that despite a very low predicted physical barrier effect of the HBR for small fish, the HBR provided a higher mechanical behavioral effect for fish protection and guidance. Such an effect was also observed by Meister [21] for spirlin from laboratory tests with an HBR with sb = 20 mm. As most fish caught at HPP Stroppel were cyprinids, they are likely to behave similar to the spirlin, resulting in high FGE. The third reason for the deviation of laboratory and field results is that the HBR at HPP Stroppel has a bottom channel, which is expected to guide bottom-oriented fish towards the bypass similar to the bottom overlay effect observed by EPRI [9] and Albayrak et al. [11]. Video observations in the present study prove such an effect for barbels. A fourth reason for the high FGE at HPP Stroppel can also be related to the small corridor of approximately 1 m length between the vertical-axis bypass gate and the end of the rack, which provides a buffer zone for fishes that do not immediately pass through the bypass openings. Because of this buffer zone where the depth average flow velocity is 0.25 m/s (see Section 4.4), hesitating fishes are still in a safe area away from the rack and do not find themselves instantly in front of the rack again. Such conditions are assumed to increase bypass passage rates and hence reduce fish rack passage. Finally, the racks in rivers are often partly covered with floating debris, which may positively influence the flow field upstream of the rack, constitute an additional visual barrier effect, and hence reduce the risk of fish rack passage.
According to the literature, the bypass entrance velocity should generate a velocity field that maintains the movement of approaching fishes and attract them to the bypass [4]. The results from field and laboratory tests with live fish revealed that the FGE could be impaired by unfavorable hydraulic conditions at the bypass entrance [14,15,21,23]. Studies recommend that the ratio of the bypass velocity to the approach velocity should be in the range of 1.1 to 1.5 [4], or 1.0 to 2.0, and absolute values of 0.3 to 1.5 m/s [22]. These values are expected to be similar for all kinds of FGRs [14]. Stationary measurements in front of the bypass show that the ratio is smaller than unity at the bypass entrance at the center of the water column due to the backwater created by the bypass gate and therefore does not fully fulfill the literature recommendations. Because of ADCP limitations, the near-bed velocity profile could not be obtained, but the ratio is assumed to be higher than one because of the bottom opening. From the bypass entrance to the gate openings, the flow velocity increased from 0.25 m/s (depth-averaged flow velocity) to 1.7 m/s resulting in high spatial velocity gradients (SVG). Previous studies show that fishes avoid sudden velocity changes and prefer mild velocity gradients to optimize their energy expenditure during migration [50,51,52,53]. Haro et al. [52] recommend a maximum uniform SVG increase of 1 m/s/m with negligible hydraulic separation and turbulence and an elevated velocity bypass flow (3 m/s) at the top of the weir to attract fish. In general, recommended absolute mean flow velocities at the bypass inlet are in the range of 0.3 to 1.5 m/s [22]. In cases where the inlet does not extend across the whole water column, the recommended flow velocity may refer to the velocities in the bypass openings. In the present conditions, the SVG is slightly higher than unity, but the absolute flow velocities at the bypass openings are much lower than 3 m/s and slightly above 1.5 m/s. However, the latter results in an approach flow to bypass flow velocity ratio of 2.88, which is much higher than the recommended values of 1.0 to 2.0, reported in the literature. These results indicate that the present flow conditions at the bypass may be unfavorable for fish and likely trigger fish avoidance. Similar flow conditions around the full depth bypass inlet were reported by Albayrak et al. [11] for laboratory tests of MBRs. Despite unfavorable conditions, the FGE of the MBRs was above 60% and up to 95% depending on the rack angle. In addition to this laboratory study, high FGE for salmon smolts was reported for HPP Herting with an HBR and typical bypass system with two openings similar to HPP Stroppel and an average flow velocity of 2.55 m/s at the bypass inlet, which is higher than that at HPP Stroppel [30]. The present fish monitoring shows that migrating fishes guided toward the bypass entered the bypass actively in both positive and negative rheotaxis and without escape reactions in front of the bypass. From the results of Albayrak et al. [11], Nyqvist et al. [30], and the present study, we can deduce that: (i) such bypass flow conditions are still good and (ii) if fish are motivated to move downstream (in the migration period), such relatively unfavorable flow conditions do not deter fish from entering the bypass for a range of fish species, namely cyprinids, salmonids, and eels.
The present results can be transferred to the cyprinid family since most of the fish species captured in the bypass are cyprinids, which are also typical in the Limmat river. The transfer of the results and behavior of cyprinids to salmonids and eels is, however, not generally possible. For eels, Meister [21] and Beck et al. [15] show that this fish species hardly reacts to the hydraulics of fish guidance structures and hence the former recommends low bar spacing < 20 mm for complete protection. For brown trout and salmon smolts, 15 mm or smaller bar spacing seems to be adequate for complete or high fish protection [21,30].
6. Conclusions
This paper deals with hydraulics, fish guidance, and protection performance of an HBR-BS at the HPP Stroppel, Switzerland. Velocity measurements were conducted in the headrace channel, along the HBR, and near the bypass inlet using an ADCP mounted on a remote-controlled boat in 2019. A fish monitoring study was conducted in 2015 and 2016 by collecting fish with a stow net at the bypass outlet, as well as video observations and ARIS sonar recordings. The hydraulic results are compared to literature recommendations and linked to the findings of the fish monitoring campaign.
For the given bar opening of 20 mm, fish with a total length of more than 16 to 20 cm (depending on the species) are physically protected by the rack, while smaller fishes can theoretically pass the rack. The fish monitoring study shows that 86% of the captured fish had a total length smaller than 10 cm, but only a small percentage of these fish did pass the rack. The estimated fish rack passage is 16% based on the sonar data and the assumption of a low detection rate for fish <10 cm and upscaling of the sonar area to the total rack area. As a result, the FGE of the HBR-BS is estimated to be 84%. Five possible reasons for this high FGE that deviates from prediction equations reported in the literature are presented and discussed. Finally, fish monitoring using stow nets at both the turbine and bypass outlets is recommended to mitigate uncertainties from the sonar measurements and clarify the present results.
The velocity measurements in front of the rack indicate good guiding conditions towards the bypass. No fish impingement to the rack was expected. Both sonar and video recordings indicate that the flow field in front of the rack does not represent a dangerous area for fish and hence the HBR was designed correctly. The absolute normal to rack velocity component is in the range of fish swimming speeds even for small fishes with low swimming capabilities and the general recommendation of a maximum normal velocity of 0.5 m/s is fulfilled in most parts of HBR. The ratio of the parallel to the normal velocity component above unity satisfies the literature recommendation in large parts of the rack. Furthermore, the bottom channel functioning as a bottom overlay improves fish guidance for bottom-oriented fish species. These mostly favorable hydraulic results at the study site are corroborated by the fish monitoring data showing high FGE. Furthermore, both hydraulics and fish monitoring results also indicate that the HBR-BS functions not only as a physical barrier but also features a mechanical behavioral effect.
The depth-averaged velocity at the bypass entrance is lower than the approach flow velocity, which is typically not recommended. From the bypass entrance up to the bypass gate with top and bottom openings, the flow velocity sharply increases, resulting in high spatial velocity gradients. Such decreasing and increasing flow velocity and high spatial velocity gradients along the bypass are typically expected to cause fish avoidance reactions not to enter the bypass. However, the fish monitoring data did not indicate such a negative flow field effect on fish bypass passage.
The hydraulic investigation at HPP Stroppel equipped with an HBR-BS shows a suitable flow field in terms of fish guidance to the bypass due to favorable alignment of the rack and the bypass. Moreover, there are no weir, piers, or other hydraulic structures causing undesired competing currents. Overall, based on the field monitoring data, hydraulics and fish guidance performance of the HBR-BS at HPP Stroppel are assessed to be very good even for small fishes. Therefore, such HBR-BS design (according to Ebel [22]) with some improvement of the bypass hydraulics is recommended for diversion type HPPs for fish protection and guidance. An adapted design of HBR-BS is required for block-type HPPs due to flow conditions deviating from those at HPP Stroppel [21].
Results of this study are of prime importance to investigate the upscaling of laboratory results to prototype applications and compare fish behavior, in the present case behavior of cyprinids, under controlled laboratory conditions with prototype conditions. Furthermore, the present findings will underpin more research studies to improve HBR-BS designs, particularly bypass design and other types of FGR.
Author Contributions
Conceptualization, I.A.; methodology, M.M., R.H., R.M., C.Z. and I.A.; software, R.H., R.M., C.Z. and I.A.; validation, M.M., R.M.B. and I.A.; formal analysis, R.H., R.M. and C.Z.; investigation, M.M., R.H., R.M.B. and I.A.; resources, M.M., R.H. and I.A.; data curation, R.H., R.M., C.Z. and I.A.; writing—original draft preparation, M.M. and I.A.; writing—review and editing, M.M., R.H., R.M., C.Z., R.M.B. and I.A.; visualization, M.M., R.H., R.M., C.Z. and I.A.; supervision, M.M., R.M., R.M.B. and I.A.; project administration, R.M.B. and I.A.; funding acquisition, I.A. and R.M.B. All authors have read and agreed to the published version of the manuscript.
Funding
This research received no external funding.
Data Availability Statement
Not applicable.
Acknowledgments
The authors would like to thank Daniel Gubser from VAW who helped with field measurements. A big thank goes to Axpo Kleinwasserkraft AG for providing the study site and giving the permission to publish data.
Conflicts of Interest
The authors declare no conflict of interest.
References
- Larinier, M.; Travade, F. Downstream migration: Problems and facilities. Bull. Fr. Peche Piscic. 2002, 364, 181–207. [Google Scholar] [CrossRef] [Green Version]
- Courret, D.; Larinier, M. Guide Pour la Conception de Prises d’eau “Ichtyo Compatibles” Pour les Petites Centrales Hydroélectriques; Rapport Ghaappe RA.08.04; Agence de l’Environnement et de la Maîtrise de l’Energie (ADEME): Paris, France, 2008. (In French) [Google Scholar]
- Albayrak, I.; Kriewitz, C.R.; Hager, W.H.; Boes, R.M. An experimental investigation on louvres and angled bar racks. J. Hydraul. Res. 2018, 56, 59–75. [Google Scholar] [CrossRef]
- USBR. Fish Protection at Water Diversions: A Guide for Planning and Designing Fish Exclusion Facilities; US Department of the Interior, Bureau of Reclamation: Denver, CO, USA, 2006. [Google Scholar]
- Barrett, J.; Mallen-Cooper, M. The Murray River’s ‘Sea to Hume Dam’ fish passage program: Progress to data and lessons learned. Ecol. Manag. Restor. 2006, 7, 173–183. [Google Scholar] [CrossRef]
- Szabo-Meszaros, M.; Navaratnam, C.U.; Aberle, J.; Silva, A.T.; Forseth, T.; Calles, O.; Fjeldstad, H.-P.; Alfredsen, K. Experimental hydraulics on fish-friendly trash-racks: An ecological approach. Ecol. Eng. 2018, 113, 11–20. [Google Scholar] [CrossRef]
- Dewitte, M.; David, L. Working Basis of Solutions, Models, Tools and Devices and Identification of Their Application Range on A Regional And Overall Level to Attain Self-Sustained Fish Populations (FIThydro Deliverable 2.2). 2019. Available online: https://www.fithydro.eu/deliverable-tech/ (accessed on 17 January 2022).
- Albayrak, I.; Boes, R.; Beck, C.; Meister, J.; David, L.; Lemkecher, F.; Chatellier, L.; Courret, D.; Pineau, G.; Calluaud, D.; et al. Enhancing and Customizing Technical Solutions for Fish Migration (FIThydro Deliverable 3.4). 2020. Available online: https://www.fithydro.eu/deliverables-tech/ (accessed on 17 January 2022).
- Electric Power Research Institute (EPRI); Dominion Millstone Laboratories (DML). Evaluation of Angled Bar Racks and Louvers for Guiding Fish at Water Intakes; Report No. 1005193; EPRI: Palo Alto, CA, USA, 2001. [Google Scholar]
- Raynal, S.; Courret, D.; Chatellier, L.; Larinier, M.; David, L. An experimental study on fish-friendly trashracks—Part 1. Inclined trashracks. J. Hydraul. Res. 2013, 51, 56–66. [Google Scholar] [CrossRef] [Green Version]
- Albayrak, I.; Boes, R.M.; Kriewitz, C.R.; Peter, A.; Tullis, B.P. Fish guidance structures: Hydraulic performance and fish guidance efficiencies. J. Ecohydraul. 2020, 5, 113–131. [Google Scholar] [CrossRef]
- Beck, C. Hydraulic and fish-biological performance of fish guidance structures with curved bars. In Proceedings of the 38th IAHR World Congress, Panama City, Panama, 1–6 September 2019. [Google Scholar] [CrossRef]
- Beck, C.; Albayrak, I.; Meister, J.; Boes, R.M. Hydraulic performance of fish guidance structures with curved bars: Part 1: Head loss assessment. J. Hydraul. Res. 2020, 58, 807–818. [Google Scholar] [CrossRef]
- Beck, C.; Albayrak, I.; Meister, J.; Boes, R.M. Hydraulic performance of fish guidance structures with curved bars: Part 2: Flow fields. J. Hydraul. Res. 2020, 58, 819–830. [Google Scholar] [CrossRef]
- Beck, C.; Albayrak, I.; Meister, J.; Peter, A.; Selz, O.M.; Leuch, C.; Vetsch, D.F.; Boes, R.M. Swimming behavior of downstream moving fish at innovative curved-bar rack bypass systems for fish protection at water intakes. Water 2020, 12, 3244. [Google Scholar] [CrossRef]
- Hoover, J.J.; Zielinski, D.P.; Sorensen, P.W. Swimming performance of adult bighead carp Hypophthalmichthys nobilis (Richardson, 1845) and silver carp H. molitrix (Valenciennes, 1844). J. Appl. Ichthyol. 2017, 33, 54–62. [Google Scholar] [CrossRef]
- Boes, R.M.; Albayrak, I.; Kriewitz, C.R.; Peter, A. Fischschutz und Fischabstieg mittels vertikaler Leitrechen Bypass Systeme: Rechenverluste und Leiteffizienz (‘Fish protection and fish downstream passage using vertical fish guidance racks’). WasserWirtschaft 2016, 106, 29–35. (In German) [Google Scholar] [CrossRef]
- Meister, J.; Fuchs, H.; Beck, C.; Albayrak, I.; Boes, R.M. Velocity fields at horizontal bar racks as fish guidance structures. Water 2020, 12, 280. [Google Scholar] [CrossRef] [Green Version]
- Meister, J.; Fuchs, H.; Beck, C.; Albayrak, I.; Boes, R.M. Head losses of horizontal bar racks as fish guidance structures. Water 2020, 12, 475. [Google Scholar] [CrossRef] [Green Version]
- Zaugg, C.; Mendez, R. Kleinwasserkraftwerk Stroppel—Wirkungskontrolle Fischabstieg am Horizontalrechen mit Bypass (‘Small-Scale HPP Stroppel—Evaluation of the Fish Downstream Passage Effectiveness at the HBR-BS’). Report H16674, Axpo Kleinwasserkraft AG. 2018. Available online: https://plattform-renaturierung.ch/wp-content/uploads/2019/04/KWKSt-2018.09.04-Bericht-Erfolgskontrolle-Fischabstieg_inkl.-Anhang_final.pdf (accessed on 17 January 2022). (In German).
- Meister, J. Fish protection and guidance at water intakes with horizontal bar rack bypass systems. In VAW-Mitteilung 258; Boes, R., Ed.; Laboratory of Hydraulics, Hydrology and Glaciology (VAW): ETH Zurich, Switzerland, 2020. [Google Scholar]
- Ebel, G. Fischschutz und Fischabstieg an Wasserkraftanlagen—Handbuch Rechen-und Bypasssysteme. Ingenieurbiologische Grundlagen, Modellierung und Prognose, Bemessung und Gestaltung (‘Fish Protection and Downstream Passage at Hydropower Plants—Handbook of Rack and Bypass Systems. Basics of Engineering Biology, Modelling and Prediction, Design and Layout’), 2nd ed.; Büro für Gewässerökologie und Fischereibiologie Dr. Ebel: Halle, Germany, 2016. (In German) [Google Scholar]
- Albayrak, I.; Maager, F.; Boes, R.M. An experimental investigation on fish guidance structures with horizontal bars. J. Hydraul. Res. 2020, 58, 516–530. [Google Scholar] [CrossRef]
- Ebel, G. Biologische Wirksamkeit von Leitrechen-Bypass-Systemen: Aktueller Kenntnisstand (‘Biological effectiveness of fish guidance rack—bypass sytems: Current state of knowledge’). WasserWirtschaft 2020, 12, 18–27. (In German) [Google Scholar] [CrossRef]
- Travade, F.; Larinier, M. French experience in downstream migration devices. In Free Passage for Aquatic Fauna in Rivers and Other Water Bodies; German Associatation for Water, Wastewater and Waste (DWA): Hennef, Germany, 2006. [Google Scholar]
- Russon, I.J.; Kemp, P.S. Advancing provision of multi-species fish passage: Behavior of adult European eel (Anguilla Anguilla) and brown trout (Salmo trutta) in response to accelerating flow. Ecol. Eng. 2011, 37, 2018–2024. [Google Scholar] [CrossRef]
- Berger, C. Verluste und Auslegung von Schrägrechen anhand ethohydraulischer Studien (‘Head losses and design of angled racks based on etho-hydraulic studies’). WasserWirtschaft 2020, 12, 10–17. [Google Scholar] [CrossRef]
- Ebel, G.; Kehl, M.; Gluch, A. Fortschritte beim Fischschutz und Fischabstieg: Inbetriebnahme der Pilot-Wasserkraftanlagen Freyburg und Öblitz (‘Progress with fish protection and downstream passage: Commissioning of the pilot hydropower plants Freyburg and Öblitz’). WasserWirtschaft. 2018, 108, 54–62. (In German) [Google Scholar] [CrossRef] [Green Version]
- Ebel, G.; Gluch, A.; Kehl, M. Einsatz des Leitrechen-Bypass-Systems nach Ebel, Gluch & Kehl an Wasserkraftanlagen—Grundlagen, Erfahrungen und Perspektiven (‘Application of fish guidance bypass systems according to Ebel, Gluch & Kehl at hydropower plants—basics, experiences and perspectives’). Wasserwirtschaft 2015, 105, 44–50. (In German) [Google Scholar]
- Nyqvist, D.; Elghagen, J.; Heiss, M.; Calles, O. An angled rack with a bypass and a nature-like fishway pass Atlantic salmon smolts downstream at a hydropower dam. Mar. Freshw. Res. 2018, 69, 1894–1904. [Google Scholar] [CrossRef]
- Wagner, F.; Warth, P.; Schmalz, W. Evaluierung von Fischschutz-und Fischabstiegsmaßnahmen an einem Wasserkraftstandort für die Umsetzung des WHG § 35 (‘Evaluation of Fish Protection and Downstream Passage Measures at a Hydropower Site for the Implementation of the Federal Water Act § 35’); Final Report; Umweltbundesamt: Dessau-Roßlau, Germany, 2021. (In German) [Google Scholar]
- Map.geo.admin.ch. Available online: https://map.geo.admin.ch (accessed on 28 May 2019).
- Parsons, D.R.; Jackson, P.R.; Czuba, J.A.; Engel, F.L.; Rhoads, B.L.; Oberg, K.A.; Best, J.L.; Mueller, D.S.; Johnson, K.K.; Riley, J.D. Velocity Mapping Toolbox (VMT): A processing and visualization suite for moving-vessel ADCP measurements. Earth. Surf. Proc. Land. 2012, 38, 1244–1260. [Google Scholar] [CrossRef]
- Federal Office for the Environment FOEN. Available online: https://www.hydrodaten.admin.ch/en/2243.html (accessed on 1 September 2019).
- Albayrak, I.; Lemmin, U. Secondary currents and corresponding surface velocity patterns in a turbulent open-channel flow over a rough bed. J. Hydraul. Eng. 2011, 137, 1318–1334. [Google Scholar] [CrossRef]
- Auel, C.; Albayrak, I.; Boes, R.M. Turbulence characteristics in supercritical open channel flows: Effects of Froude number and aspect ratio. J. Hydraul. Eng. 2014, 140, 4014004. [Google Scholar] [CrossRef]
- Demiral, D.; Boes, R.M.; Albayrak, I. Effects of secondary currents on turbulence characteristics of supercritical open channel flows at low aspect ratios. Water. 2020, 12, 3233. [Google Scholar] [CrossRef]
- Nezu, I.; Nakagawa, H. Turbulence in Open-Channel Flows; IAHR-AIRH Monograph Series; Balkema: Rotterdam, The Netherlands, 1993. [Google Scholar] [CrossRef]
- Turnpenny, A.W.H.; O’Keeffe, N. Screening for Intake and Outfalls: A Best Practice Guide; Technical Report SC030231; Environment Agency: Bristol, UK, 2005. [Google Scholar]
- Schwevers, U.; Adam, B. Biometrie einheimischer Fischarten als Grundlage für die Bemessung von Fischwegen und Fischschutzanlagen (Biometry of indigenous fish species as a basis for the design of fish passes and fish protection facilities’). Wasser Abfall. 2019, 1, 46–52. (In German) [Google Scholar] [CrossRef]
- Schwevers, U.; Adam, B. Fish Protection Technologies and Fish Ways for Downstream Migration; Springer: Cham, Switzerland, 2020. [Google Scholar]
- Hefti, D. Wiederherstellung der Fischauf-und-Abwanderung bei Wasserkraftwerken. Checkliste Best Practice (‘Restoration of Fish Upstream and Downstream Migration at Hydropower Plants, Check List of Best Practice’); Swiss Federal Office for the Environment (SFOE): Bern, Switzerland, 2012. (In German) [Google Scholar]
- LUBW. Handreichung Fischschutz und Fischabstieg an Wasserkraftanlagen—Fachliche Grundlagen (‘Helping Hand Fish Protection and Downstream Passage at Hydropower Plants—Technical Basics’); Technical Report; Landesanstalt für Umwelt, Messungen und Naturschutz Baden-Württemberg: Karlsruhe, Germany, 2016. (In German) [Google Scholar]
- Burwen, D.L.; Fleischman, S.J.; Miller, J.D. Evaluation of a Dual Frequency Imaging Sonar for Detecting and Estimating the Size of migrating Salmon (Fishery Data Series No. 07–44); Alaska Department of Fish and Game: Anchorage, AK, USA, 2007. [Google Scholar]
- Burwen, D.L.; Fleischman, S.J.; Miller, J.D. Accuracy and precision of salmon length estimates taken from DIDSON sonar images. T. Am. Fish. Soc. 2010, 139, 1306–1314. [Google Scholar] [CrossRef]
- Cook, D.; Middlemiss, K.; Jaksons, P.; Davison, W.; Jerrett, A. Validation of fish length estimations from a high frequency multi-beam sonar (ARIS) and its utilisation as a field-based measurement technique. Fish. Res. 2019, 218, 59–68. [Google Scholar] [CrossRef]
- Tušer, M.; Frouzová, J.; Balk, H.; Muška, M.; Mrkvička, T.; Kubecka, J. Evaluation of potential bias in observing fish with a DIDSON acoustic camera. Fish. Res. 2014, 155, 114–121. [Google Scholar] [CrossRef]
- Helminen, J.; Dauphin, G.J.R.; Linnansaari, T. Length measurement accuracy of adaptive resolution imaging sonar and a predictive model to assess adult Atlantic salmon (Salmo salar) into two size categories with long-range data in a river. J. Fish Biol. 2020, 97, 1009–1026. [Google Scholar] [CrossRef]
- Egg, L.; Pander, J.; Mueller, M.; Geist, J. Comparison of sonar-, camera-and net-based methods in detecting riverine fish-movement patterns. Mar. Freshw. Res. 2018, 69, 1905–1912. [Google Scholar] [CrossRef]
- Enders, E.C.; Gessel, M.H.; Anderson, J.J.; Williams, J.G. Effects of decelerating and accelerating flows on juvenile salmonid behavior. T. Am. Fish. Soc. 2012, 141, 357–364. [Google Scholar] [CrossRef]
- Silva, A.T.; Katopodis, C.; Tachie, M.F.; Santos, J.M.; Ferreira, M.T. Downstream swimming behaviour of catadromous and potamodromous fish over spillways. River. Res. Appl. 2016, 32, 935–945. [Google Scholar] [CrossRef]
- Haro, A.; Odeh, M.; Noreike, J.; Castro-Santos, T. Effect of water acceleration on downstream migratory behavior and passage of Antlantic salmon smolts and juvenile American shad at surface bypasses. T. Am. Fish. Soc. 1998, 127, 118–127. [Google Scholar] [CrossRef]
- Nestler, J.M.; Goodwin, R.A.; Smith, D.L.; Anderson, J.J.; Li, S. Optimum fish passage and guidance designs are based in the hydrogeomorphology of natural rivers. River. Res. Appl. 2008, 24, 148–168. [Google Scholar] [CrossRef]
Figure 1.
Detailed geometries of Horizontal Bar Rack-Bypass System (HBR-BS) adapted from [24]: α = horizontal rack angle, in cases where the approach flow is not parallel to the channel, α is the angle between the approaching flow velocity and the rack, U0 = cross-sectionally averaged approach flow velocity, Ub = cross-sectionally averaged bypass entrance flow velocity, U = local time-averaged streamwise flow velocity, V = local time-averaged transverse flow velocity, W = local time-averaged vertical flow velocity, Ur = √(U2 + V2 + W2) = local time-averaged resulting flow velocity, vp = parallel (tangential) velocity component to the rack, vn = normal velocity component to the rack.

Figure 2.
(a) Top view of HPP Stroppel and velocity measurement locations (source of background map: Federal Office of Topography swisstopo [32]) and (b) a photo during the velocity measurements in front of the HBR-BS.
Figure 2.
(a) Top view of HPP Stroppel and velocity measurement locations (source of background map: Federal Office of Topography swisstopo [32]) and (b) a photo during the velocity measurements in front of the HBR-BS.

Figure 3.
2D and 3D illustration of the sound cone of ARIS sonar. (a) shows how the fish in the cone are seen by the sonar, (b) shows the rack area seen by the sonar when installed behind the rack at Stroppel HPP, and (c) shows the projected rack area seen by the Sonar, where l and h are length and height of the rack covered area, respectively.

Figure 4.
Bathymetry along the headrace channel in meter above mean see level (source background map: Federal Office of Topography swisstopo [32]).
Figure 4.
Bathymetry along the headrace channel in meter above mean see level (source background map: Federal Office of Topography swisstopo [32]).

Figure 5.
Depth-averaged resulting velocities along the headrace channel (source background map: Federal Office of Topography swisstopo [32]).
Figure 5.
Depth-averaged resulting velocities along the headrace channel (source background map: Federal Office of Topography swisstopo [32]).

Figure 6.
Interpolated depth-averaged resulting velocity magnitude along the headrace channel (source background map: Federal Office of Topography swisstopo [32]). The head and length of arrows show depth-averaged flow direction and velocity magnitude, respectively.
Figure 6.
Interpolated depth-averaged resulting velocity magnitude along the headrace channel (source background map: Federal Office of Topography swisstopo [32]). The head and length of arrows show depth-averaged flow direction and velocity magnitude, respectively.

Figure 7.
Normalized streamwise velocity distribution at (a) z/h0 = 0.88 and (b) 0.2 with U0 = 0.59 m/s along the headrace channel (source background map: Federal Office of Topography swisstopo [32]). The head and length of arrows show depth-averaged flow direction and velocity magnitude, respectively.

Figure 8.
Cross-sectional distributions of (a) normal to the rack velocities vn; (b) parallel to the rack velocities vp; (c) ratio of vp/vn for CS15 (1.7 m upstream of the rack).
Figure 8.
Cross-sectional distributions of (a) normal to the rack velocities vn; (b) parallel to the rack velocities vp; (c) ratio of vp/vn for CS15 (1.7 m upstream of the rack).

Figure 9.
Sustained and prolonged swimming speeds based on total fish length TL.

Figure 10.
Cross-sectional, normal to the rack velocities vn for CS15.

Figure 11.
Vertical profile of the normalized streamwise velocity (U) (a) in the channel and resulting velocity (Ur) (b) in the bypass entrance obtained from the stationary measurements. S1–S6 are the stationary measurements (Figure 2).
Figure 11.
Vertical profile of the normalized streamwise velocity (U) (a) in the channel and resulting velocity (Ur) (b) in the bypass entrance obtained from the stationary measurements. S1–S6 are the stationary measurements (Figure 2).

Figure 12.
Estimated (a) Fish guidance efficiency (FGE) and (b) Fish protection efficiency (FPE) for different fish length classes.
Figure 12.
Estimated (a) Fish guidance efficiency (FGE) and (b) Fish protection efficiency (FPE) for different fish length classes.

Figure 13.
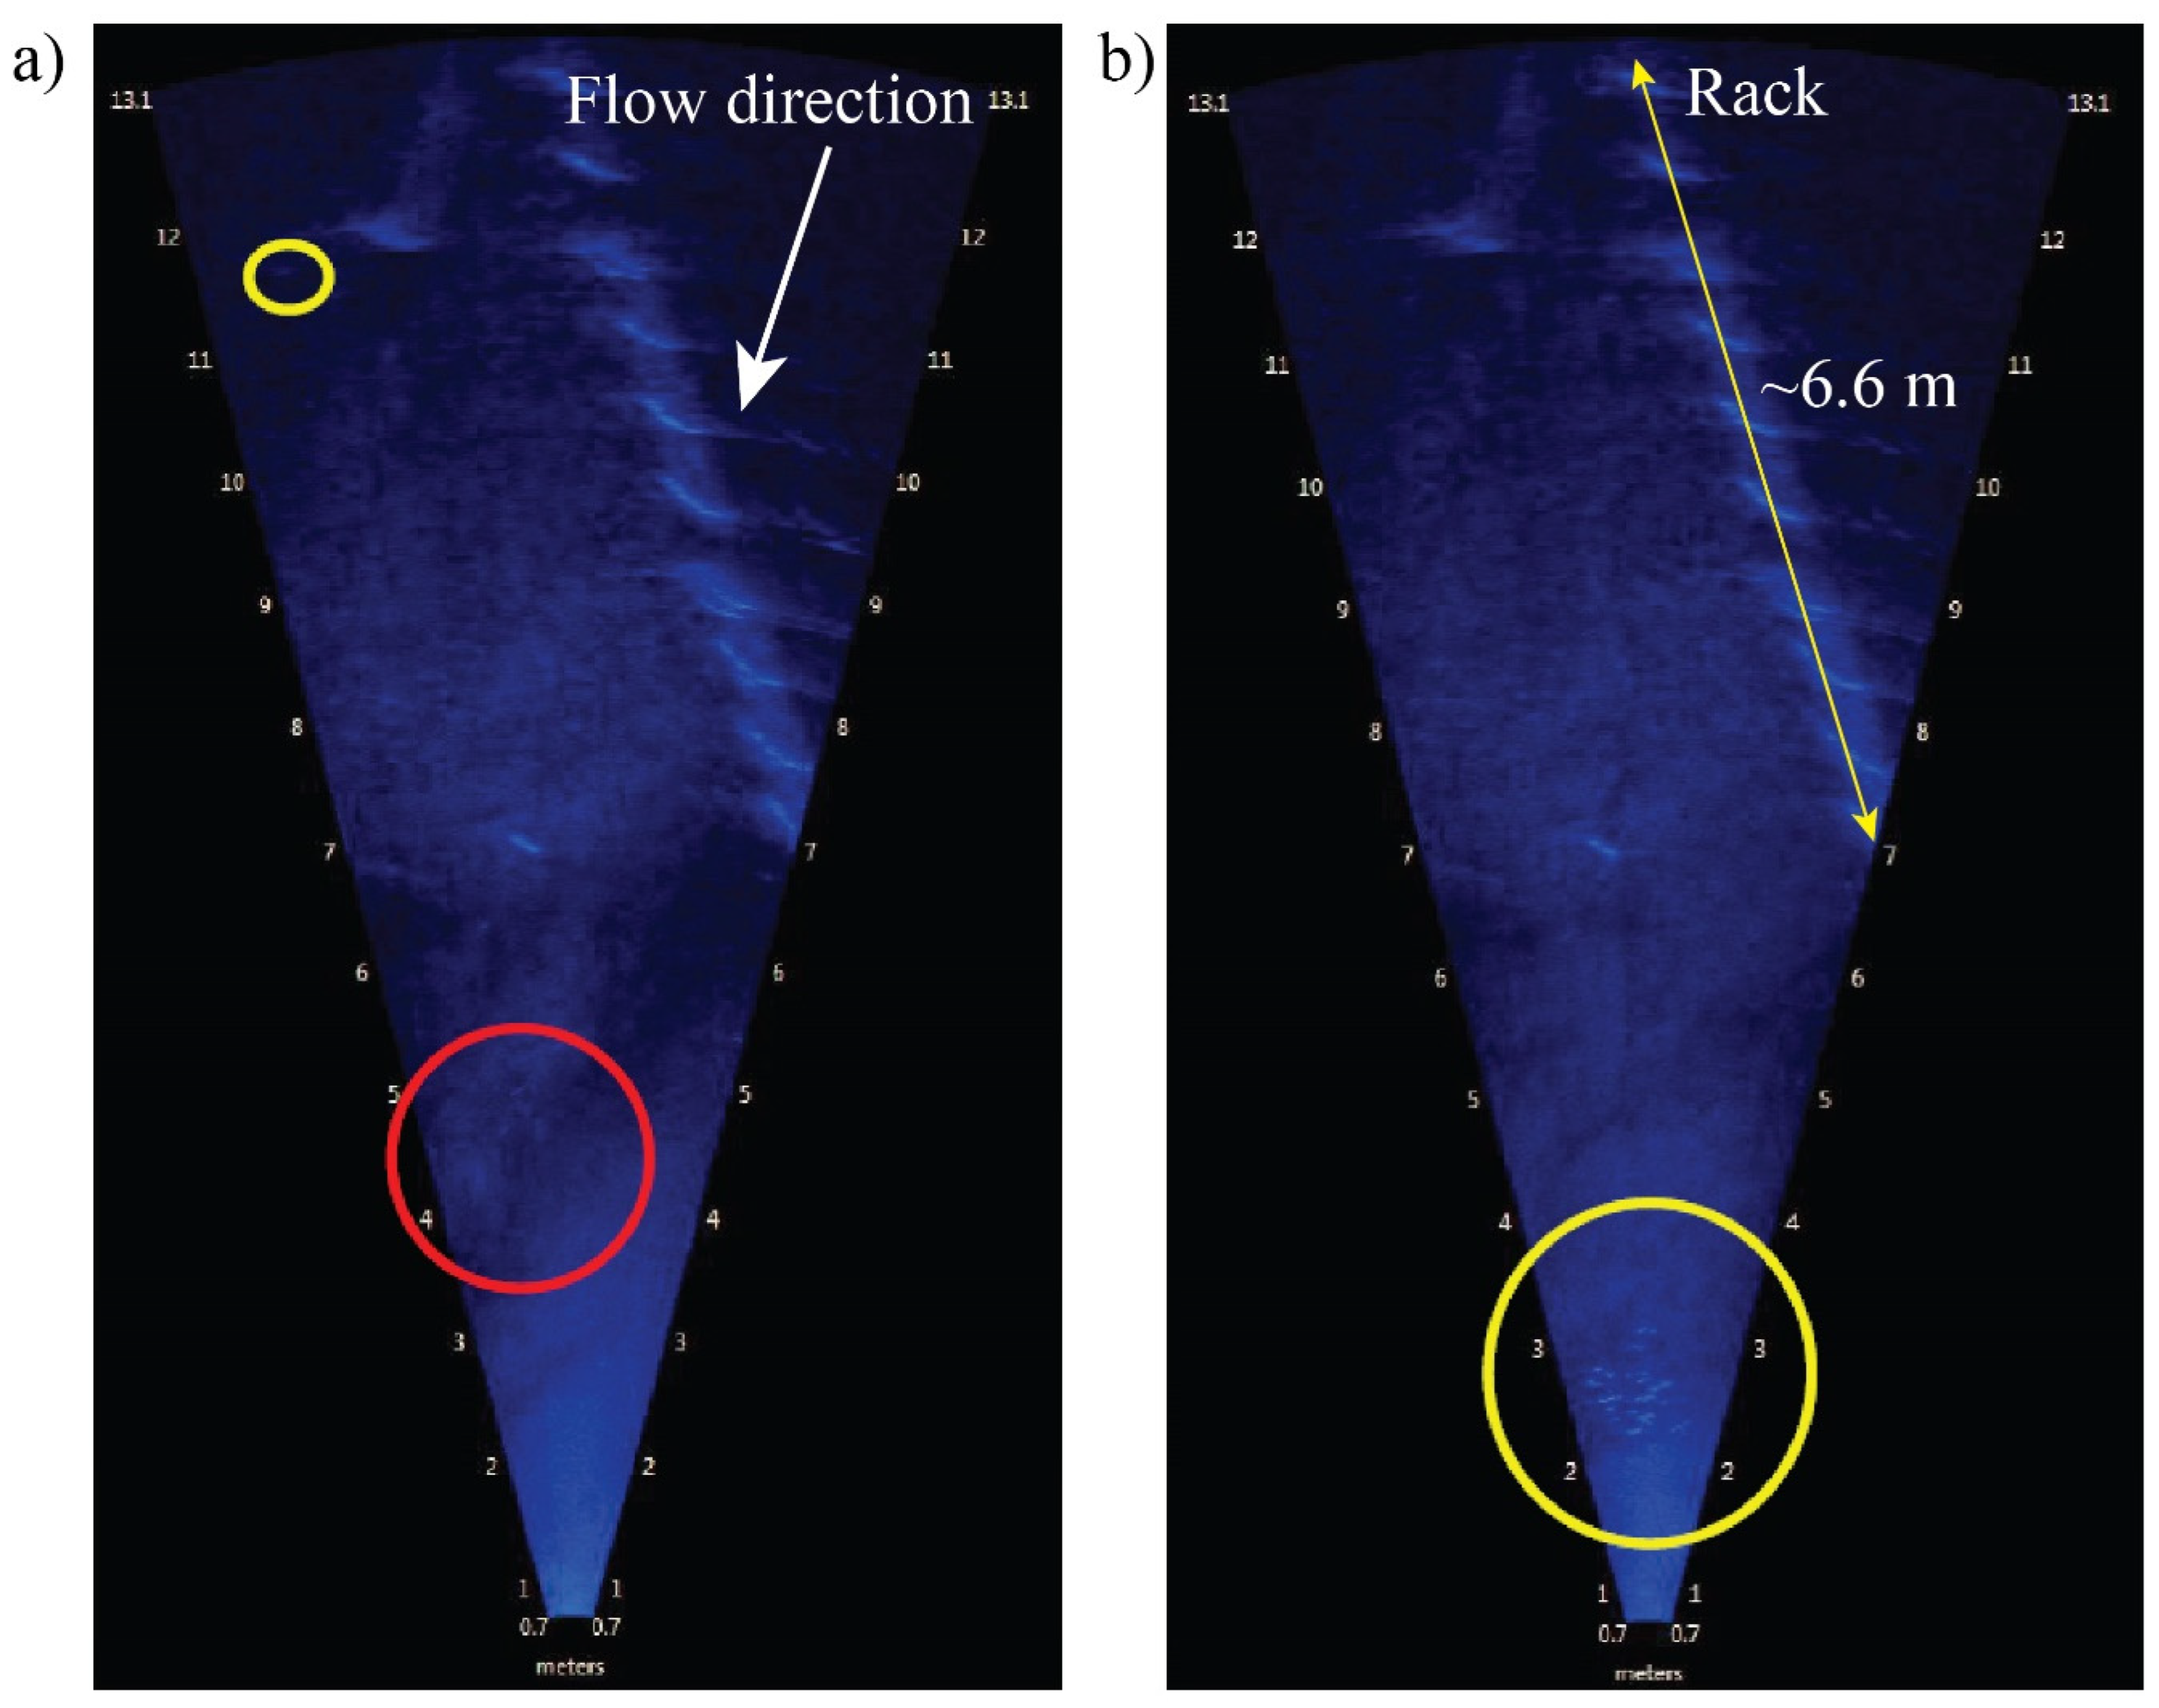
Frames from ARIS sonar recording: (a) Single fish near channel bed (yellow circle) and leaf (red circle), and (b) group of small fish at 2–3 m in front of the sonar, downstream of the rack, adapted from [20].
Figure 13.
Frames from ARIS sonar recording: (a) Single fish near channel bed (yellow circle) and leaf (red circle), and (b) group of small fish at 2–3 m in front of the sonar, downstream of the rack, adapted from [20].


Table 1.
Exemplary hydropower plants (HPPs) in Europe equipped with HBR-BS.
| Country | HPP Name | River | Qd (m3/s) | Qb (m3/s) | Qb/Qd (%) | sb (mm) | Vn (max) (m/s) | α (°) |
|---|---|---|---|---|---|---|---|---|
| Germany | Freyburg 1 | Unstrut | 25.5 | 1.10 | 4.30 | 10 | 0.30 | 38 |
| Germany | Halle-Planena 1 | Saale | 50 | 1.30 | 2.60 | 20 | 0.45 | 45 |
| Germany | Raguhn 1 | Mulde | 88 | 1.00 | 1.14 | 20 | 0.70 | 65 |
| Germany | Rothenburg 1 | Saale | 68 | 1.45 | 2.30 | 20 | 0.54 | 38 |
| Germany | Rappenberghalde 1 | Neckar | 14 | 0.16 | 1.18 | 15 | 0.30 (0.68) 2 | 30 |
| Sweden | Herting 3 | Ätran | 40 | 3.00 | 7.50 | 15 | 0.50 | 30 |
| Switzerland | Stroppel 4 | Limmat | 33 | 0.69 | 2.10 | 20 | 0.48 | 38 |
1 Ebel [22] & https://forum-fischschutz.de/ (accessed on 17 January 2022); 2 Local maximum Vn during the monitoring [31]; 3 Nyqvist et al. [30]; 4 Zaug and Mendez [20].
Table 2.
Monitoring durations, water temperature, and flow conditions during main blocks and short sampling periods.
Table 2.
Monitoring durations, water temperature, and flow conditions during main blocks and short sampling periods.
| Date | Five Main Monitoring Blocks | Nine Short Sampling Periods | ||||||||||||
|---|---|---|---|---|---|---|---|---|---|---|---|---|---|---|
| 15–18 September 2015 1 | 20–23 September 2015 1 | 10–12 May 2016 | 2–4 August 2016 | 25–27 October 2016 2 | 20 July 2016 | 21 July 2016 | 1 September 2016 | 30 September 2016 | 10 October 2016 | 17 October 2016 | 23 October 2016 | 10 November 2016 | 8 December 2016 | |
| Duration (hour) | 70 | 72 | 48 | 48 | 38 | 2 | 3 | 4.25 | 3 | 3.5 | 3 | 3.75 | 2.75 | 3.5 |
| Water temperature (°C) | 19 | 13 | 13 | 22 | 13 | 22 | 23 | 23 | 19 | 15 | 14 | 13 | 11 | 7 |
| River discharge (m3/s) | 47 | 73 | 96 | 96 | 67 | 143 | 138 | 61 | 60 | 39 | 43 | 46 | 73 | 56 |
| Number of collected fish | 88 | 2198 | 160 | 76 | 6239 | 130 | 4 | 3 | 31 | 16 | 59 | 587 | 1727 | 30 |
1 ARIS sonar measurements in front (upstream) of the rack; 2 ARIS sonar measurements behind (downstream) of the rack.
Table 3.
Size distribution of the identified fishes, data from [20].
Table 3.
Size distribution of the identified fishes, data from [20].
| Length Classes (cm) | Percentage (%) |
|---|---|
| <10 | 86 |
| 10 to 20 | 12 |
| 20 to 30 | 1 |
| >30 | 1 |
Table 4.
Quantitative analysis of the fish passing the rack and effectively using the bypass, data from [20].
Table 4.
Quantitative analysis of the fish passing the rack and effectively using the bypass, data from [20].
| Measurement Time | Fishes Downstream of the Rack Detected by ARIS Sonar | Fishes Collected at the Exit of the Bypass | Rack Passage Ratio |
|---|---|---|---|
| 25 October 2016 (18:30–19:00) | 15 | 758 | 1.9% |
| 25. October 2016 (19:00–20:00) | 50 | 528 | 8.7% |
| 25 October 2016 (20:00–21:00) | 40 | 913 | 4.2% |
| 25 October 2016 (20:00)–26 October 2016 (15:00) | 8 | 154 | 4.9% |
| 26 October 2016 (15:00–18:00) | 2 | 1447 | 0.1% |
| 26 October 2016 (18:00–23:00) | 12 | 1884 | 0.6% |
| Total | 127 | 5684 | 2.2% |
Publisher’s Note: MDPI stays neutral with regard to jurisdictional claims in published maps and institutional affiliations. |
© 2022 by the authors. Licensee MDPI, Basel, Switzerland. This article is an open access article distributed under the terms and conditions of the Creative Commons Attribution (CC BY) license (https://creativecommons.org/licenses/by/4.0/).
Share and Cite
MDPI and ACS Style
Maddahi, M.; Hagenbüchli, R.; Mendez, R.; Zaugg, C.; Boes, R.M.; Albayrak, I. Field Investigation of Hydraulics and Fish Guidance Efficiency of a Horizontal Bar Rack-Bypass System. Water 2022, 14, 776. https://doi.org/10.3390/w14050776
AMA Style
Maddahi M, Hagenbüchli R, Mendez R, Zaugg C, Boes RM, Albayrak I. Field Investigation of Hydraulics and Fish Guidance Efficiency of a Horizontal Bar Rack-Bypass System. Water. 2022; 14(5):776. https://doi.org/10.3390/w14050776
Chicago/Turabian StyleMaddahi, Mohammadreza, Roland Hagenbüchli, Ricardo Mendez, Claudia Zaugg, Robert Michael Boes, and Ismail Albayrak. 2022. "Field Investigation of Hydraulics and Fish Guidance Efficiency of a Horizontal Bar Rack-Bypass System" Water 14, no. 5: 776. https://doi.org/10.3390/w14050776
Note that from the first issue of 2016, this journal uses article numbers instead of page numbers. See further details here.