1. Introduction
Floods are substantial natural hazards worldwide due to their destructive impacts on societies and the resulting economic losses [
1,
2,
3,
4]; flood management is even more critical for decreasing the disastrous effects [
5,
6,
7,
8,
9,
10] in real-life problems in developing countries such as Turkey [
11], China [
12,
13], and Malaysia [
14,
15], as well as developed countries such as the USA [
16] and Italy [
17]. Practical flood management strategies include upstream adjustments [
18,
19,
20], flood defense infrastructure [
21,
22,
23,
24], and downstream substructures [
25,
26,
27]. Considering these flood control techniques, establishing detention basins is more applicable than other approaches, as they can detain excess runoff and protect downstream structures [
28,
29,
30,
31]. Recently, some intelligent heuristic techniques, such as the ant colony algorithm (ACO) [
32], particle swarm optimization (PSO) [
33], the genetic algorithm (GA) [
34], the simulated annealing algorithm (SA) [
35], and the long short-term memory (LSTM) network model [
36], have been adopted for flood control by detention basins. However, limited studies on the optimum design of such detention basins and their sub-structures, using well-known stochastic optimization algorithms, create a gap in the literature. Therefore, the optimum design of such basins based on stochastic optimization approaches may be considered a significant achievement in hydrologic and hydraulic engineering.
Adapting stochastic and deterministic optimization algorithms can successfully and efficiently design suitable detention basins to minimize the adverse impacts of floods. These optimization techniques include differential evolution (DE) [
37], multi-objective optimization algorithms [
38,
39,
40], and artificial intelligence (AI) models such as neural network (NN), fuzzy, and adaptive neuro-fuzzy inference system (ANFIS) algorithms [
41]. Although stochastic models ensure that certain levels of unpredictability and uncertainties exist in inflow hydrographs that pass through the detention basins, which are significant in combating the risks of floods [
42,
43,
44,
45], they have received little attention in the literature. Moreover, stochastic models are more beneficial for designing detention basins than deterministic models because they supplement uncertainties inherent in natural flood events since floods are stochastic processes [
46,
47,
48]. Considering uncertainties inherent in the system, a commendable optimization algorithm, the so-called non-dominated sorting genetic algorithm-III (NSGA-III), can efficiently model complicated hydrological systems such as detention basins and their sub-structures during floods using efficacious uncertainty assessment techniques, namely conditional value-at-risk (CVaR) and non-linear interval number programming (NINP) approaches. In addition, physically-based models have been successfully used to predict floods due to their considerable capabilities in predicting flood scenarios [
49], such as the numerical prediction models referred to as an advancement in flood analyses [
4,
50]. Nevertheless, the hybridization of models has recently undergone substantial improvements in physically-based models for floods [
4,
51]. However, there is no definite study in the literature regarding a successful and effective hybridization of the risk-based NSGA-III model and conventional numerical models for optimum design of detention basins. Therefore, applying a well-known numerical technique, the Runge-Kutta method, within the NSGA-III optimization model, based on the CVaR and NINP methods, could help achieve a reliable and realistic design for detention basins and their outlets.
The design of optimum detention basins using a hybrid risk-based NSGA-III multi-objective optimization model and the Runge-Kutta numerical model provides more effective and robust models capable of learning complex flood events in real-world problems, which may be substantially enhanced when the influence of regional and local stakeholder conditions is considered. However, the literature includes only a limited number of studies on using a robust conflict resolution approach within a hybrid NSGA-III and physical model for optimal detention basin design during a flood. The graph model for conflict resolution (GMCR) theory can consider geographical and regional standards within the stochastic optimization model to obtain compatible optimum solutions [
52,
53,
54]. Despite the application of GMCR in previous water resources management and water engineering studies, to the best of our knowledge, the compatibility of developed optimal detention basins with regional standards has not been addressed in the literature. As a result, coupling GMCR with the earlier mentioned hybrid multi-objective optimization model would lead to a novel stochastic conflict resolution optimization model for the practical, compatible, and optimum design of detention basins and their outlets.
This paper presented a stochastic conflict resolution optimization model, using NSGA-III, based on several Runge-Kutta method schemes. Within this framework, hydrological uncertainties were considered through the CVaR and NINP risk assessment techniques, involving geographical and regional standards, using the GMCR approach to identify the optimal compatible characteristics of detention basins and their outlets. This novel framework attempted to address the shortcomings of previous studies by meeting the following objectives to provide reliable, realistic, and compatible optimal designs for detention basins and their outlets in different social and geographical conditions:
Simulating roughly one hundred inflow hydrographs with various peak inflow and flood durations based on five well-known inflow patterns, namely the triangular, abrupt wave, flood pulse, broad peak, and double-peak patterns;
Assessing the accuracy of 16 schemes of the Runge-Kutta numerical method to solve flood routing equations;
Developing a hybrid stochastic conflict resolution optimization model by applying all modeled inflow hydrographs and chosen numerical methods within an NSGA-III optimization model to determine optimal geometrical features of the detention basins and their outlets with minimum risk of overtopping failure, minimum risk of flood damage, and minimum outlet dimensions;
Minimizing the risk of overtopping failure and flood damage in worst-case scenarios, among modeled inflow hydrographs, by minimizing the relevant CvaR and uncertainty variations based on the NINP approach;
Achieving compatible geometrical features for detention basins and their outlets, among optimal ones, utilizing the theory of GMCR enhanced by fuzzy preferences.
2. Materials and Methods
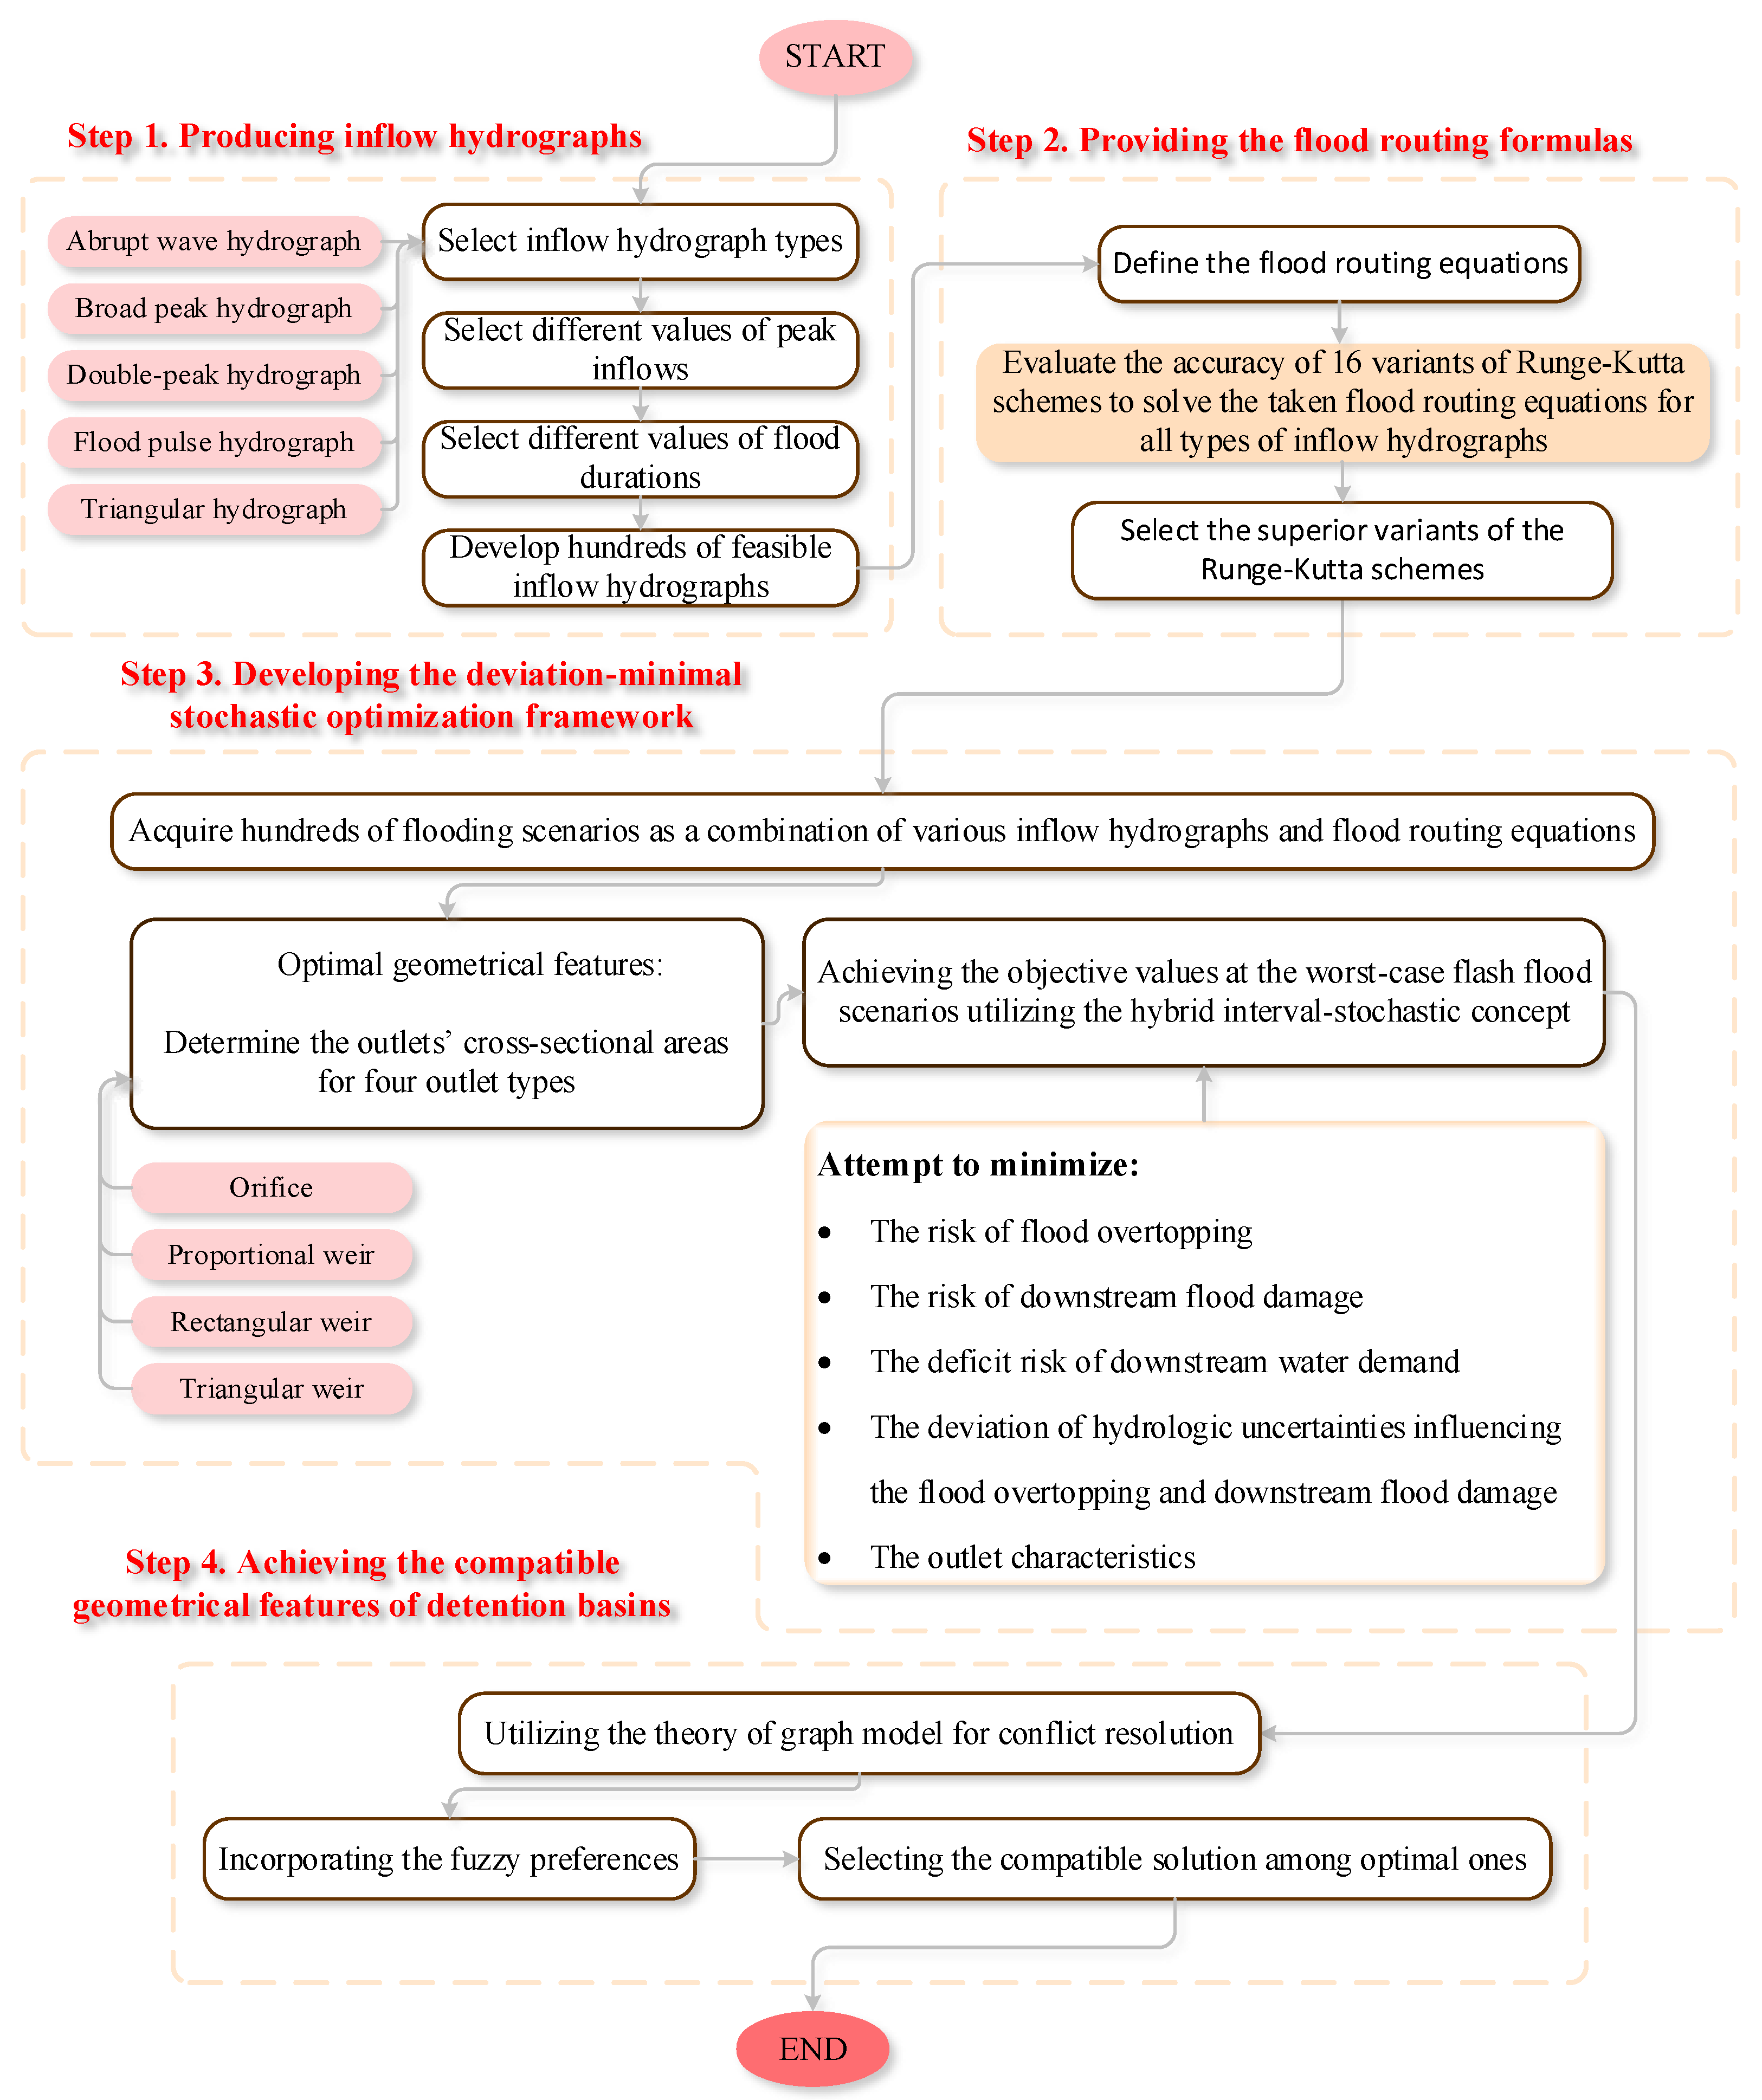
The presented framework included four substantial steps for the optimal compatible design of detention basins using the NSGA-III optimization algorithm, based on the Runge-Kutta method, considering the CVaR and NINP methods for uncertainty assessments and GMCR compatibility, to verify the approach, as illustrated in
Figure 1.
In the first step of this framework, inflow hydrographs were produced, considering five main inflow patterns: triangular, flood pulse, abrupt wave, broad peak, and double-peak inflow patterns, covering almost all of the inflow hydrograph types in simplified forms. These inflow hydrographs are synthetic since the proposed methodology was applied to a series of artificial detention basins. Next, roughly one hundred inflow hydrographs were constructed by selecting different peak inflows and flood durations.
In the second step, superior schemes of the Runge-Kutta method were selected by evaluating the accuracy of 16 Runge-Kutta technique variants for solving the flood routing equations.
In the third step, an interval-stochastic optimization framework was developed, using hundreds of flood scenarios as the input. First, the outlet type was specified as an orifice or a triangular, rectangular, or proportional weir. Then, the following objectives for this multi-objective optimization algorithm were determined for the worst-case flood scenarios using a hybrid interval–stochastic approach: Minimize the risk of flood overtopping, downstream flood damage, the deficit risk of downstream water demand, and the deviation of hydrologic uncertainties influencing flood overtopping and downstream flood damage, as well as outlet characteristics.
Finally, compatible geometrical features of the detention basins among the optimal solutions were identified using GMCR theory by incorporating fuzzy preferences. As a result, optimal and compatible designs of detention basins and their outlets were determined. The steps mentioned above are discussed thoroughly in the following subsections.
2.1. Scenarios of Inflow Hydrographs
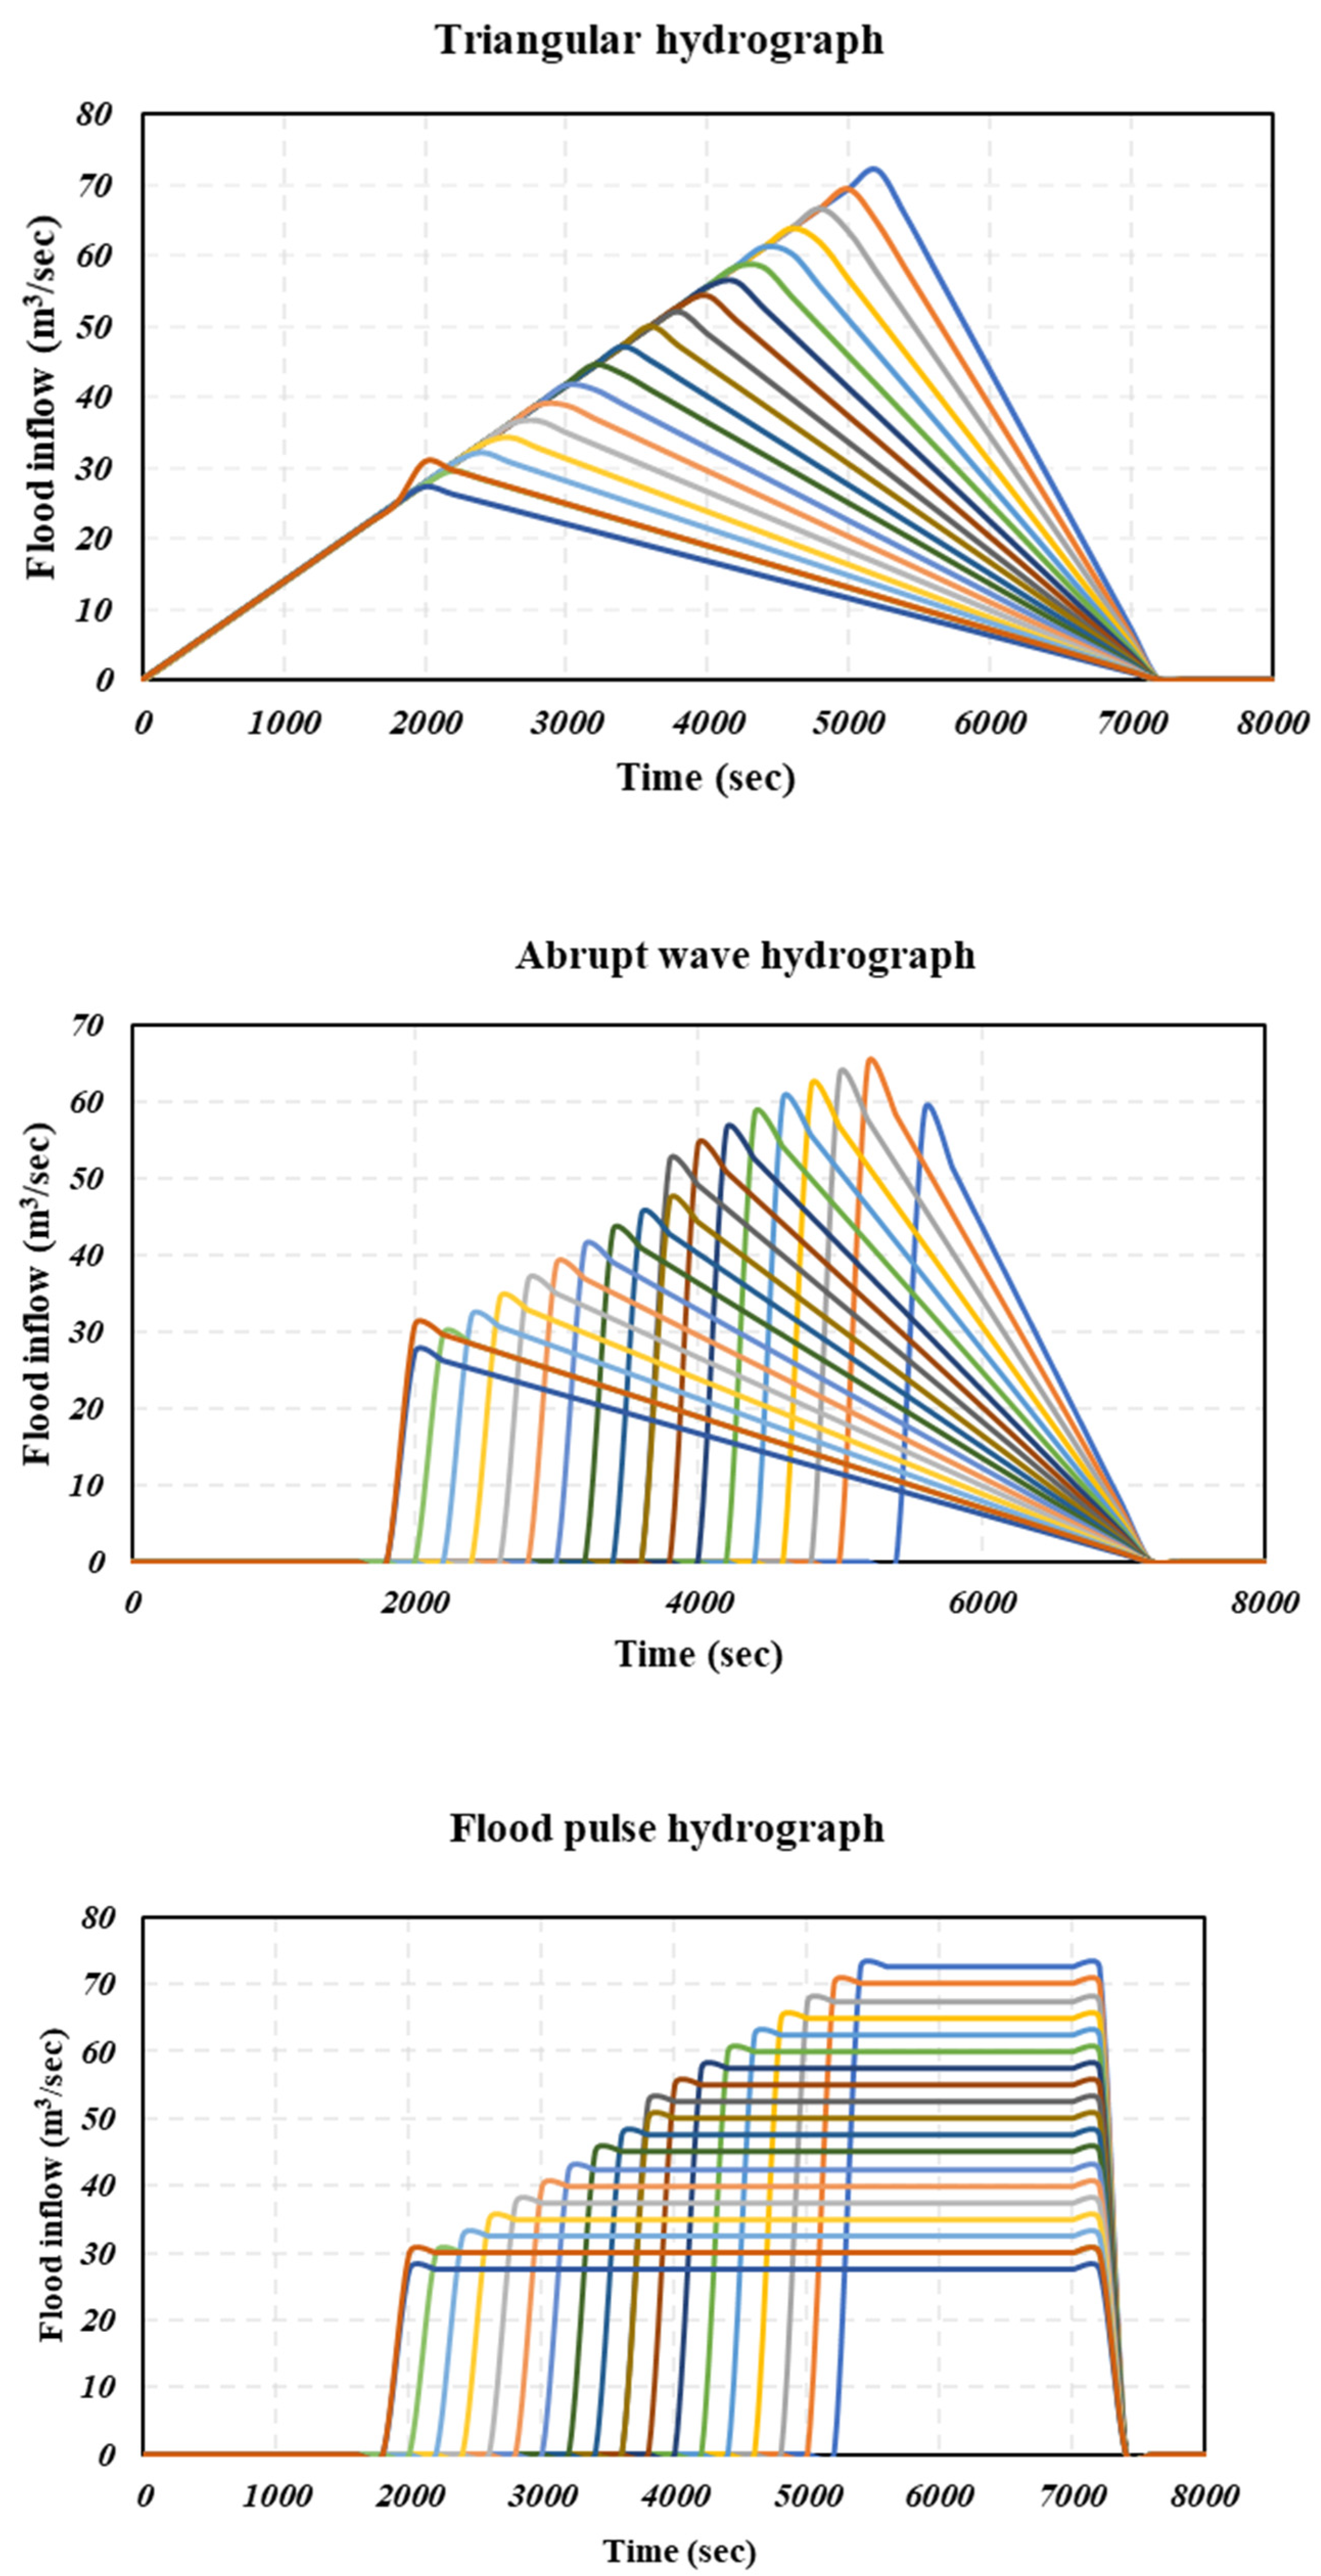
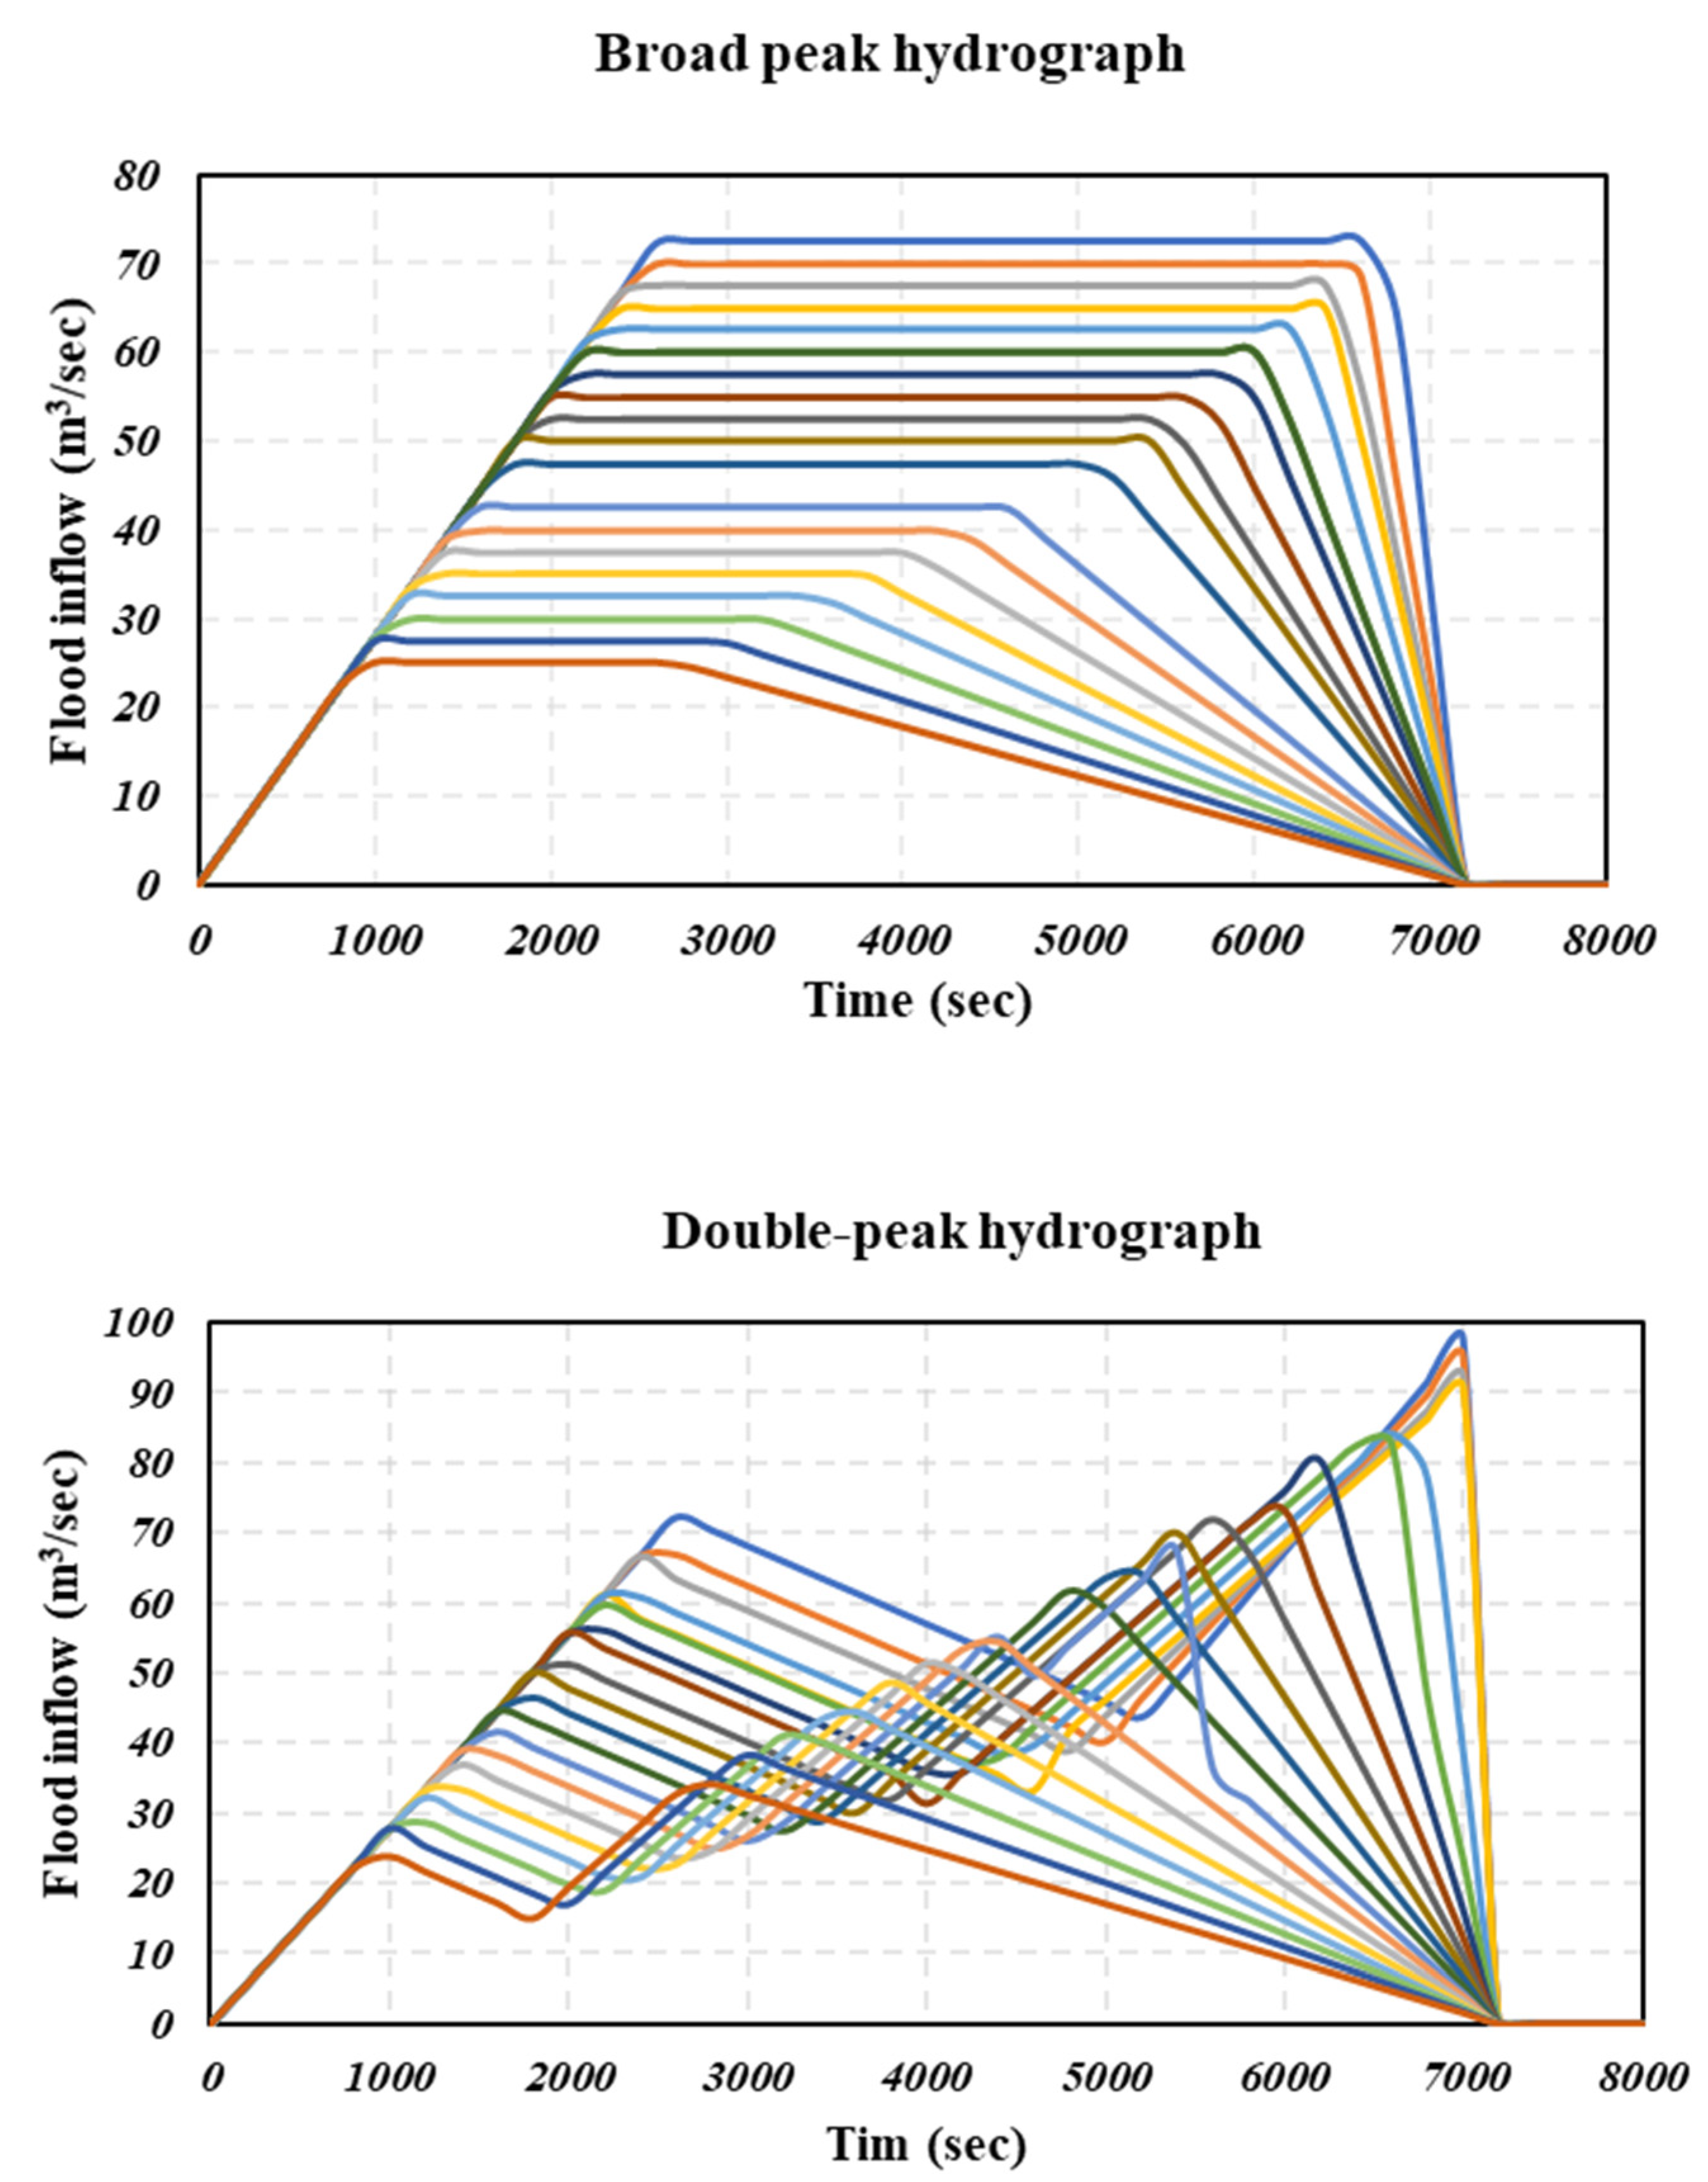
In real-world problems, there are five simplified inflow hydrograph patterns: triangular, abrupt wave, flood pulse, broad peak, and double-peak hydrograph [
55]. In more detail, four general hydrograph patterns, namely triangular, abrupt wave, flood pulse, and broad peak, were adopted based on a published thesis [
56], in which the triangular pattern has a more straightforward shape, with a linear rise and recession [
57], the abrupt wave is followed by a linear recession, the flood pulse hydrograph is a rectangular pulse, and the broad peak hygrograph is a more general trapezoid, including a broad peak with a linear rise and recession. Furthermore, to include almost all flood inflows in simplified general forms, a double-peak flood inflow is also considered the most generalized pattern adopted from [
58].
In this study, one hundred inflow hydrographs, 20 of each type, were generated by variations in peak inflows and flood durations to improve the model’s reliability in field conditions (
Figure 2). First, the base inflow peaks and flood durations for these inflow hydrographs were adopted from a study by Paik (2008) [
59]. Then, the developed inflow hydrographs were used as inputs in the hybrid interval-stochastic optimization model.
2.2. Solutions of Flood Routing Formulas
The numerical solutions for flood routing equations were determined by applying 16 variants of the Runge-Kutta schemes [
60,
61,
62]. The accuracy of these numerical analyses was assessed by comparing them to the analytical solutions provided by Paik (2008) and Nematollahi et al. (2021) as benchmark solutions [
55,
59]. Detailed explanations for the utilized analytical solutions were provided in [
55]. For this purpose, two conventional statistical indices, namely the root mean square error (RMSE) and mean absolute relative error (MARE), were used (Equations (1) and (2)). These statistical assessments indicated that 6 of the 16 Runge-Kutta methods produced reliable values for flood heights and outflows from the flood routing equations considering the five types of inflow hydrographs (
Supplementary Materials, Section S1). As mentioned above, the numerical solutions using six desired variants of Runge-Kutta schemes were simultaneously applied within the optimization framework to mitigate deviations.
where
denotes the results of the analytical solutions [
55],
denotes the results of the numerical solutions,
denotes the total number of data points, and
denotes the number of data.
2.3. Stochastic Optimization Framework
2.3.1. Outlet Characterization
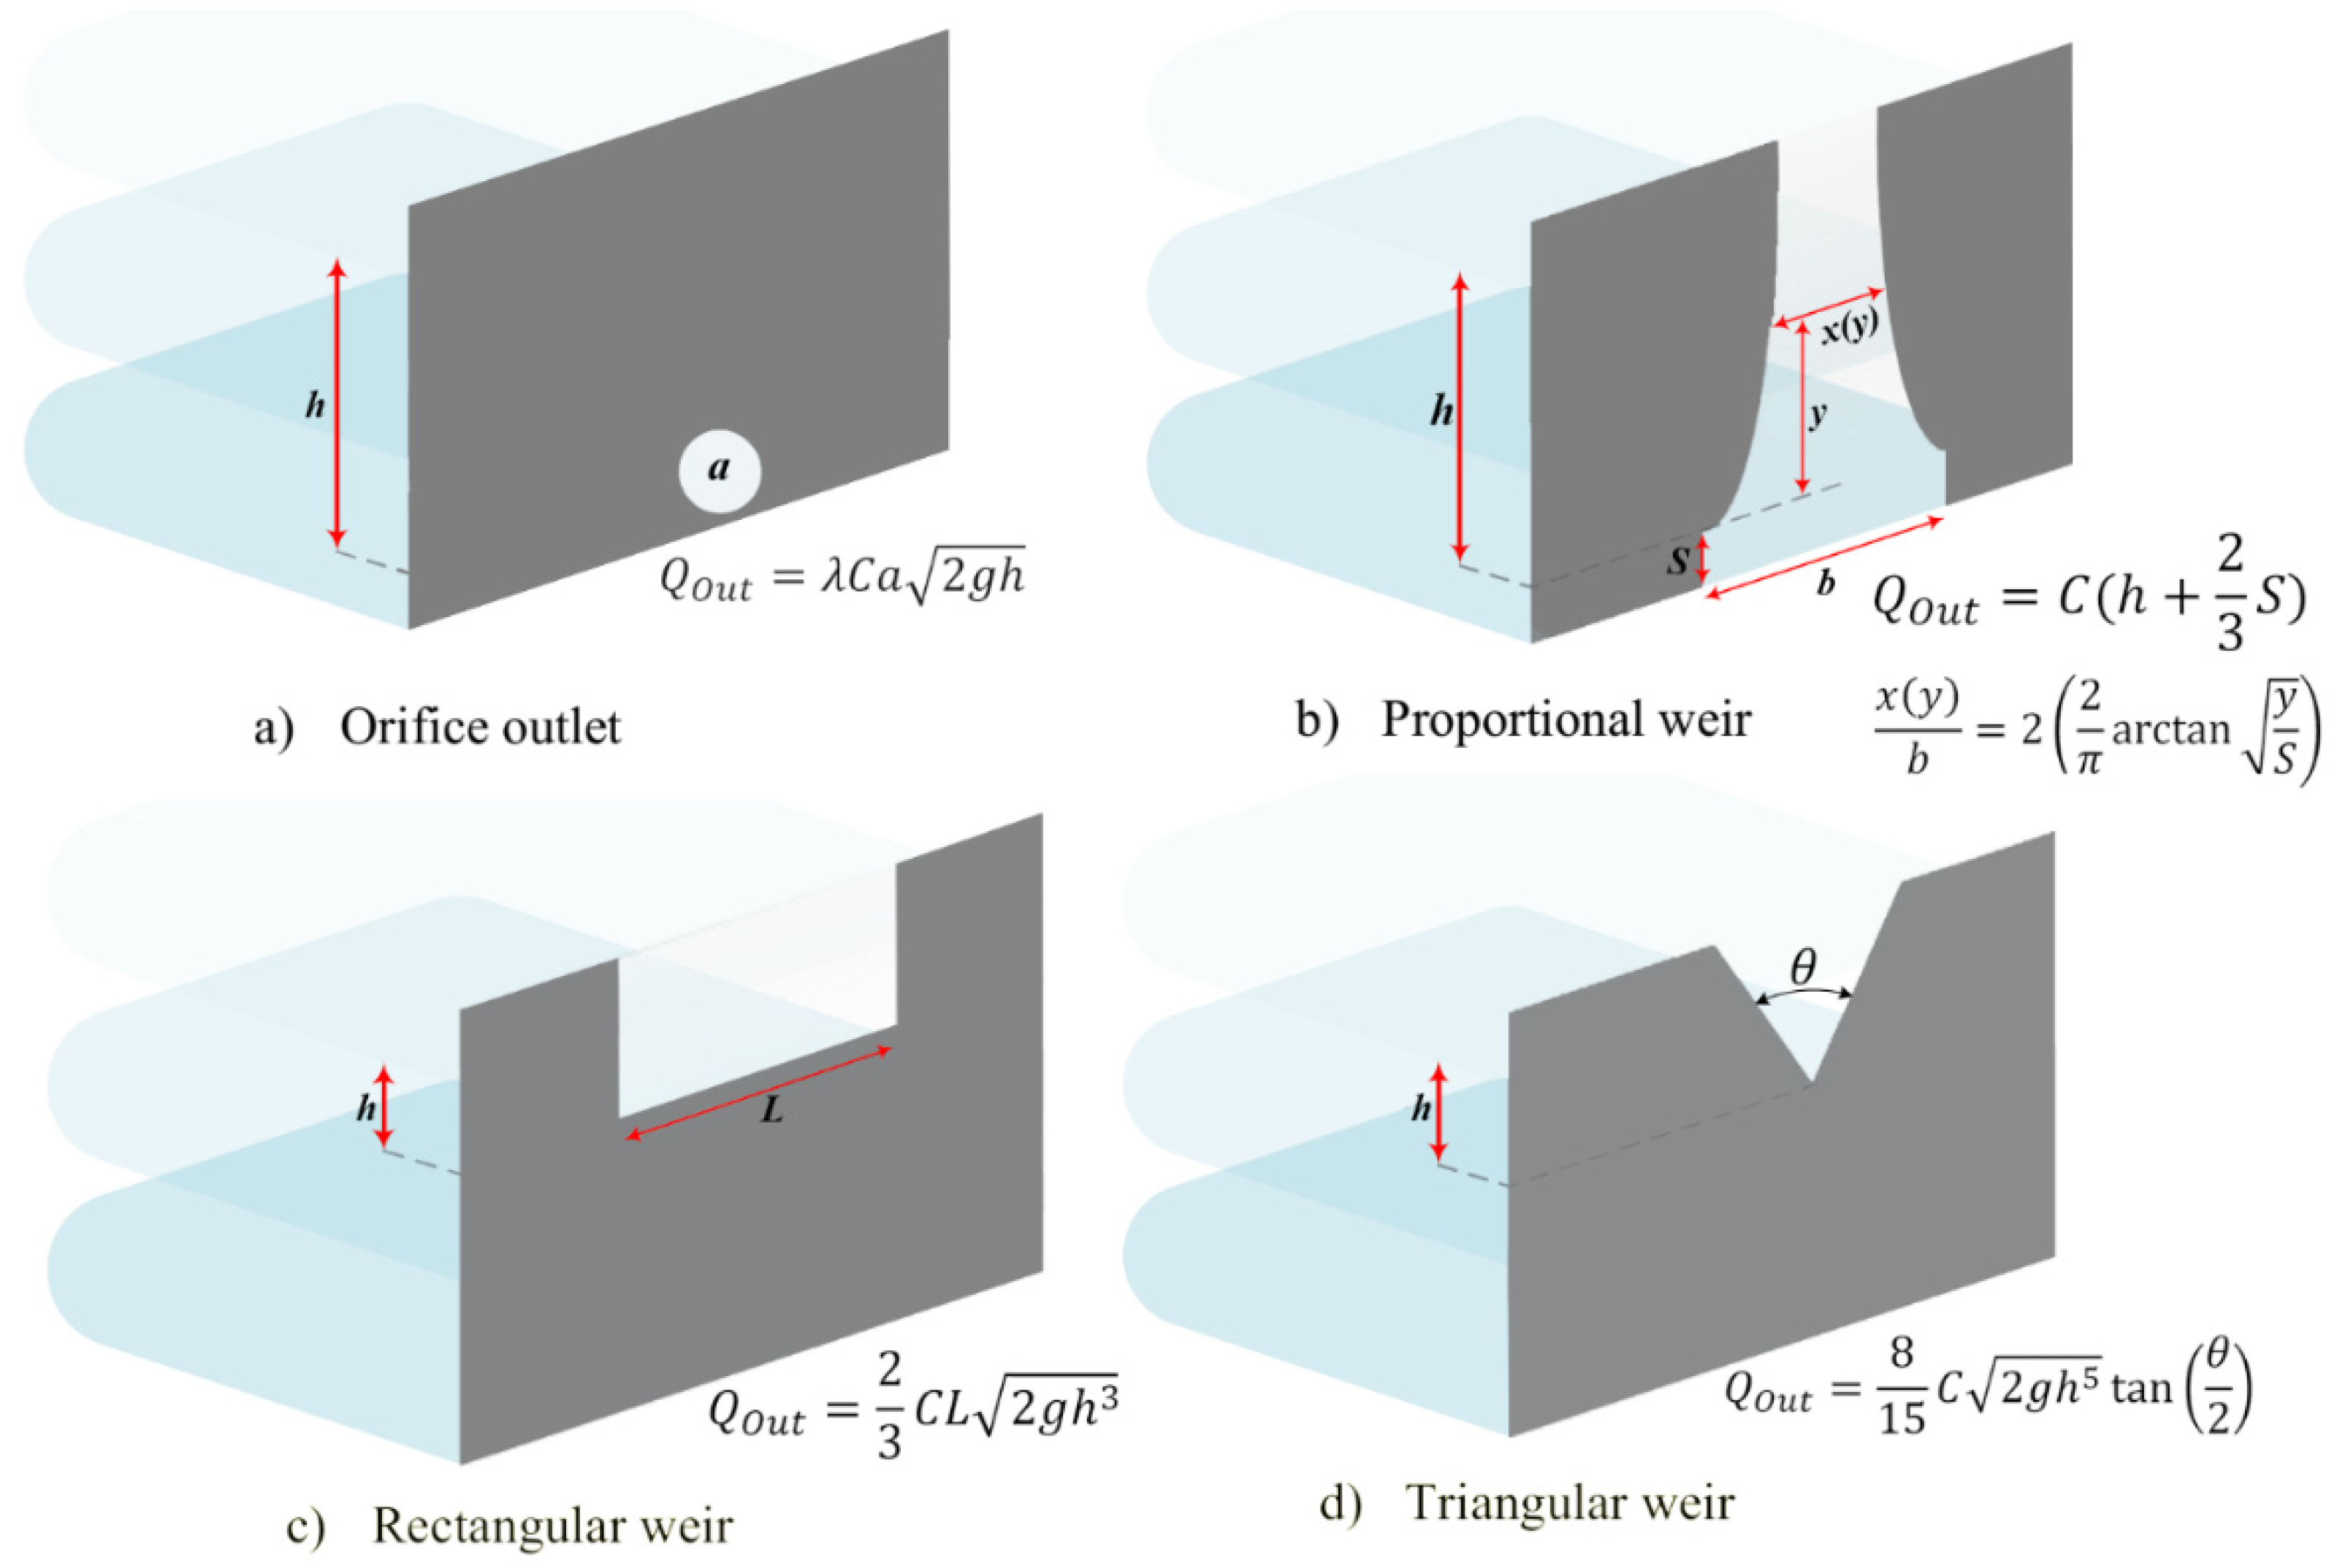
Four different standard outlet types, including an orifice and a proportional, rectangular, and triangular weir, were examined in this study. The orifice outlet is a simple discharge vessel typically used when the backwater effect is not considerable. The proportional weir is a beneficial outlet type that maintains a reasonable discharge exiting the detention basins even during inflow fluctuations. The rectangular weir is a standard form of a weir, generally ideal for detaining floods. Finally, the triangular weir is well suited for computing discharge for small flows with a significant accuracy [
63]. For this purpose, reasonable cross-sectional areas of the basins were initially taken from Paik (2008), while assuming they were empty under normal conditions [
59]. Then, the optimal outlets’ characteristics were determined through the stochastic optimization model based on solutions of the flood routing equations using the equations in
Figure 3 for the outflows.
The proposed stochastic optimization model aimed to acquire optimal geometrical properties of these outlet controls. For the orifice, the characteristics to be optimized were the orifice correction factor, , its discharge coefficient, , and its cross-sectional area, . For the proportional weir, the stochastic optimization model’s decision variables were the proportionality constant, , and the base height, . For the rectangular weir, the optimization model’s decision variables were the outlet’s discharge coefficient, , and length, . Finally, for the triangular weir, the outlet’s characterization to be optimized were its discharge coefficient, , and its tip angle, .
The above parameters were chosen as decision variables corresponding to the optimum solutions. They were outlet parameters that could be changed during construction. On the other hand, geometrical parameters for each outlet type were also optimized. These parameters were the cross-sectional area, , for the orifice, the base height, , for the proportional weir, the weir length, , for the rectangular weir, and the weir’s tip angle, , for the triangular weir. Minimizing these parameters was chosen as optimization models’ objectives customized to different outlet types. They directly affected the outlets’ construction costs. In more detail, optimizing the outlets’ geometrical features resulted in cost-efficient designs while preventing flood overtopping, downstream flood damage, and meeting water demand requirements. Therefore, one may conclude that outlets’ geometrical characteristics were chosen as objective functions to limit their construction cost, which conflicted with other objectives to provide cost-effective, practical designs for the orifice and the proportional, rectangular, and triangular weirs.
2.3.2. Uncertainty Assessments by Conditional Value-at-Risk (CVaR) Approach
The CVaR risk assessment technique has been explained thoroughly [
64,
65]. It has obtained a high status of being used in water and environmental regulations. Furthermore, this technique is widely utilized in optimization modeling since it has superior features in many respects, expressed by a minimization formula. These formulations incorporate decision variables designed to minimize risk within bounds for the optimization problems [
66]. Therefore, such important shortcuts are obtained while preserving the crucial problem properties.
To consider hydrological uncertainties in the stochastic optimization algorithm, flash flood scenarios were generated by applying a hundred inflow hydrographs using the verified six flood routing numerical solutions, resulting in flash flood scenarios. These scenarios were input to the stochastic optimization model through computing objective functions for all scenarios considering each set of decision variables. In more detail, the objective functions for this stochastic optimization model were calculated for the earlier mentioned 600 flash flood scenarios through the conditional value-at-risk (CVaR) approach (
Supplementary Materials, Section S2), which is a reputable coherent risk measurement tool [
67,
68].
2.3.3. Analyses of Uncertainty Deviations by Non-Linear Interval Number Programming (NINP) Method
The influence of hydrological uncertainties on the stochastic optimization model’s objective functions may be significantly mitigated by minimizing the deviations of objective values among different flash flood scenarios. To this extent, the deviations of objective values were determined using non-linear interval number programming (NINP) and information theory. The NINP technique effectively tackles non-linear optimization problems. In this technique, an order relation for interval numbers is utilized to convert the uncertain optimization problem into a deterministic optimization problem, considering a radius and a midpoint for the uncertain objective. The general form of non-linear interval number programming was defined by Jiang et al. (2008) as [
69]:
In the realm of non-linear interval programming, the objective function,
, was minimized using defined decision variables,
, based on an assumed uncertain vector,
. Equation (4) shows that the uncertain vector is limited to an interval number’s lower and upper bounds. This theory can be practically applied by converting the general equation to a two-objective problem (Equation (5)) based on order relations [
69].
where:
, mean of the uncertainty interval;
, radius of the uncertainty interval;
, maximum value (upper bound) of the uncertainty interval;
, minimum value (lower bound) of the uncertainty interval.
2.3.4. Non-Dominated Sorting Genetic Algorithm-III (NSGA-III)
NSGA-III algorithm initiates an initial population size of
randomly with a distribution
considering hyper reference points
on the plane using a normal vector covering the entire region,
[
70,
71]. In this algorithm, the whole population,
, converts in the same manner as in the non-dominated sorting genetic algorithm-II (NSGA-II). Then,
creates a new offspring population,
, using mutations and recombination operations. After that, a combined population,
is developed, and a non-dominated solution,
, is created where all solutions are not from the entire fronts. Then, each member is associated with a particular reference point after obtaining
FL by performing niching and normalized mechanism based on the shortest perpendicular distance of each population element. Finally, the
FL member related to the minimum reference point in the
Pt+1 is selected using the niching mechanism to find a population member associated with each reference point near the Pareto-optimal front using crossover, mutation, and recombination operations. Therefore, the application of the NSGA-III algorithm leads to a well-distributed reference point resulting in a well-spread trade-off point [
72].
The advantage of using NSGA-III is that no additional parameter is required than the traditional version, non-dominated sorting genetic algorithm- II (NSGA-II). Furthermore, applying NSGA-III to an optimization problem leads to better coverage of Pareto solutions using a reference point mechanism. Moreover, NSGA-III utilizes the pre-allocate reference set mechanism to select appropriate diverse solutions concerning the population size in free space. Therefore, the NSGA-III algorithm can generate the first solution quickly and solve multi-objective optimization problems, mainly when the number of objectives is more than four [
70,
71,
72].
2.3.5. Objectives and Constraints of the Stochastic Optimization Model
The stochastic optimization model developed in this study served to determine optimal detention basins and their outlet features with minimized risk of flood overtopping, risk of downstream flood damage, deficit risk of downstream water demand, and deviation of hydrologic uncertainties influencing the flood overtopping and downstream flood damage, and outlet characteristics. Minimizing the deviation of hydrologic uncertainties reduced the variation ranges of objective values, achieving more robust results. This optimization framework reduced the identified risks by minimizing their corresponding CVaRs (Equations (8)–(10)). In addition, the variations were minimized by implementing the deterministic form of the NINP method and information theory [
73], as follows:
where, Equations (14)–(17) are used to determine the risk of flood overtopping.
Subjected to:
where:
, the flooding scenario and as a combination of developed inflow hydrographs and selected flood routing equations;
, radius of the uncertainty interval;
, the total number of flooding scenarios.
Furthermore,
represented CVaR of the hydraulic water head at the confidence level of α, which was derived as the weighted average of losses beyond the corresponding value-at-risk (
) cutoff point, where
is the probability of flood overtopping under the
scth flooding scenario. In Equation (16),
refers to the hazardous water hydraulic head in the
scth flooding scenario, which is defined by maximizing the
(hydraulic water head at the
nth flood routing time-step of the
scth flooding scenario):
where
is a function of the flood routing time-step (
), the flood inflow at the
nth flood routing time-step obtained from inflow hydrograph
w (
), and the selected type of outlet/weir (
):
Then, the risk of downstream flood damage was determined by Equations (18)–(21). In more detail, CVaR of the downstream flood outflow at a confidence level of α (
, Equation (18)) is similarly determined as a function of
(value-at-risk (VaR) of the downstream flood at a confidence level of α).
Subjected to:
where
represents the probability of downstream flood damage under the
scth flooding scenario and
is the maximum of the calculated flood outflows at the
nth flood routing time-step of the
scth flooding scenario (
) over the total time-steps (Equation (20)).
where
is equal to the total number of flood routing time-steps. Then,
(flood outflow) is calculated using another iterative equation as follows:
Simultaneously, the risk of downstream deficient demand is calculated using the following equations:
where:
, the CVaR of downstream deficit demand at a confidence level of
α;
, the VaR of the downstream deficit demand at a confidence level of α;
, the relative downstream deficit demand in the
scth flooding scenario;
, the probability of downstream deficit demand under the
scth flooding scenario;
, the total water demand during the flood incident;
, the flood outflow at the
nth flood routing time-step of the
scth flooding scenario.
Subsequently, the variations of corresponding uncertainties were determined as follows, based on Equation (7):
where
is the deviation of water hydraulic head uncertainty and
represents the deviation of flood outflow uncertainty.
Finally, the outlet characteristics () were obtained from the developed stochastic optimization framework.
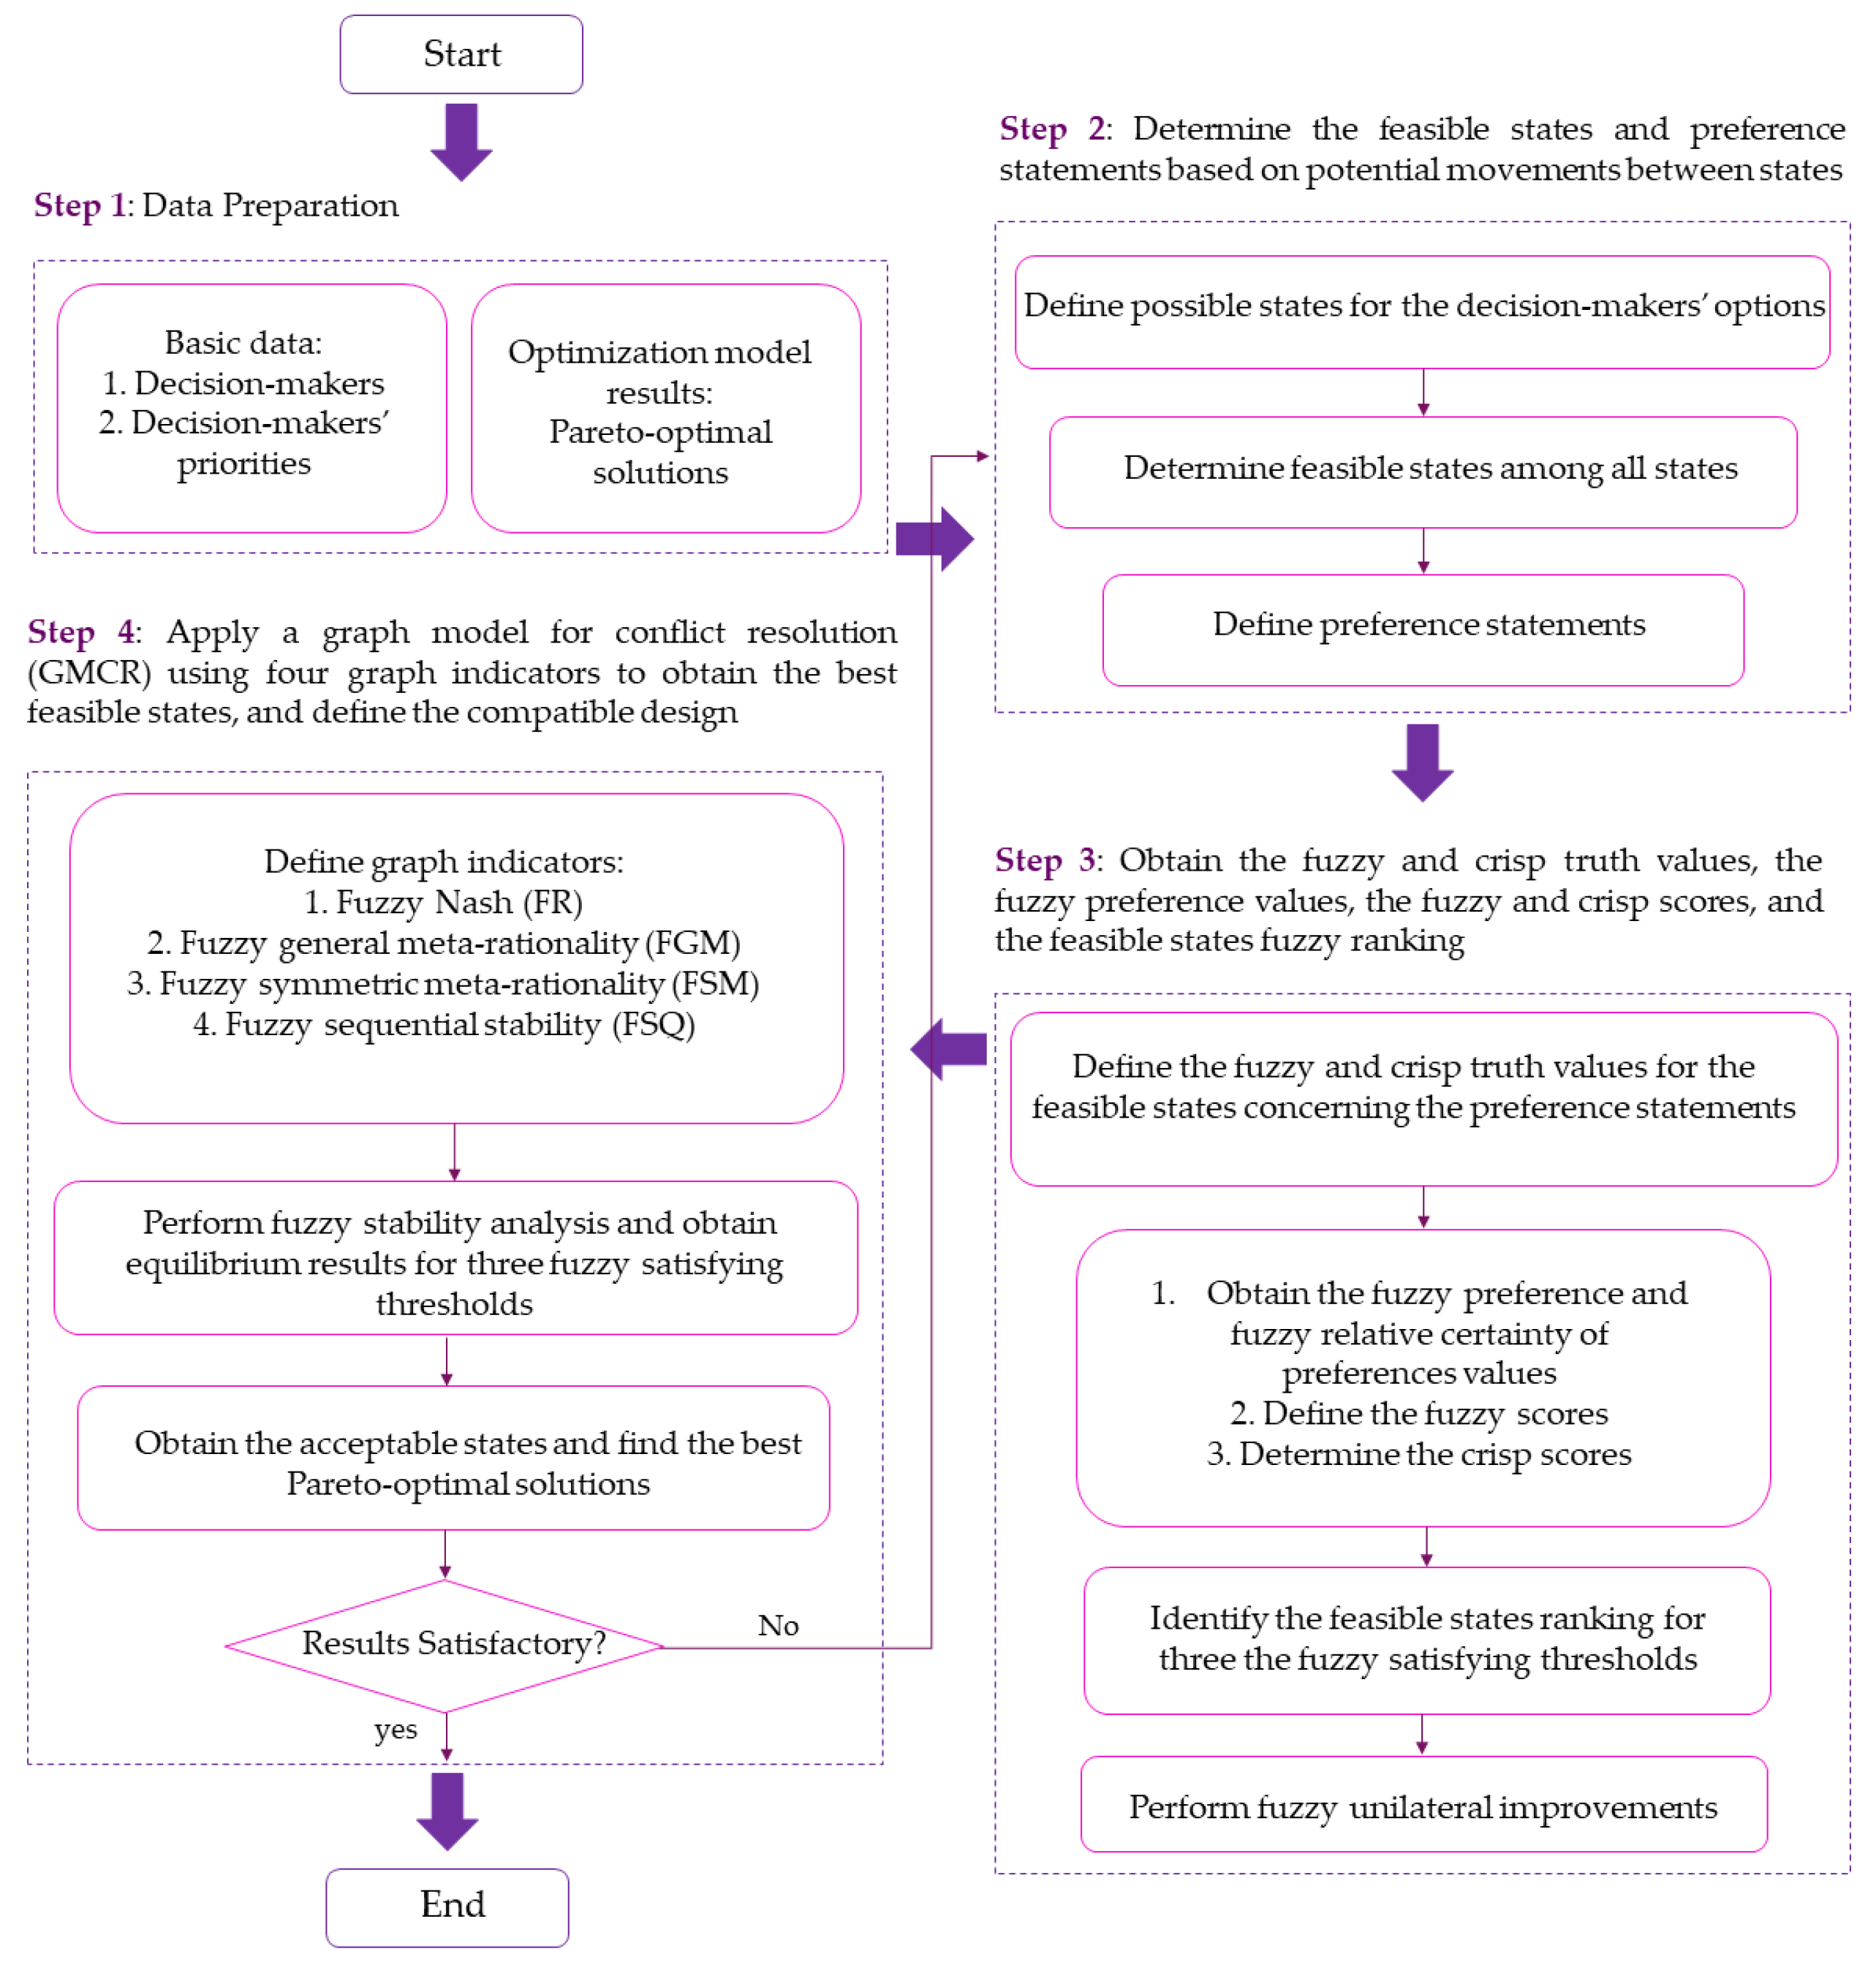
2.4. Compatible Design by Fuzzy Graph Model for Conflict Resolution (GMCR)
After obtaining the Pareto fronts, the desired solution should be selected among optimal ones considering the regional conflicts (
Figure 4). The Pareto fronts were the Pareto-optimal solutions obtained from the optimization model containing different optimal values for detention basins designs. To select the best appropriate Pareto-optimal solution, the decision-makers involved in the problem and their priorities were identified first. Then, all possible states were obtained based on the decision-makers’ options to determine the feasible states. After that, preference statements were defined based on the potential movements between the states and the decision-makers. The fuzzy and truth score values were introduced in the next step based on a rational selection for different preference statements to find the fuzzy and crisp scores and fuzzy preference values. Fuzzy preference values were quantitative values representing both certain and uncertain preferences between two states. These values were utilized to rank the feasible states concerning three specific thresholds. Then, suitable fuzzy stabilities and equilibrium results were achieved by applying four schemes of graph model for conflict resolution (GMCR) method to obtain the appropriate states. Finally, the best Pareto-optimal solutions were acquired, which meet the requirements for the obtained superior states.
The GMCR methodology formulated by Fang et al. (1993) is a valuable tool to resolve disputes/conflicts in various fields of interest [
74]. The GMCR method has the capability to model both common and irreversible moves through a flexible framework for adopting different stability concepts, with the benefit of being easy to apply in real-world problems. General graph models for conflict resolutions include the following steps for modeling and analysis: (i) specify the decision-makers/stakeholders; (ii) identify their relative action options; (iii) determine feasible states of the disputes; (iv) Assign possible movements among states; and (v) Assess the stability of states employing four stability definitions, namely Nash stability or rationality (R), general meta-rationality (GMR), symmetric meta-rationality (SMR), and sequential stability (SEQ) [
75,
76,
77,
78]. The stability indicators R, GMR, SMR, and SEQ were used to account for decision style diversities and determine stable states resulting from an equilibrium state, which all decision-makers prefer not to move away from. Adopting these stability analysis indicators, each state can be evaluated for not only how it is preferred for an individual decision-maker, but also how appropriate it is for the decision-maker as a possible coalition member. In addition, the GMCR can be enhanced and applied successfully by using fuzzy preference relations to incorporate the decision-makers’ uncertainties [
79]. The fuzzy stability analyses are used to establish a natural description for human behavior as the decision-makers in the face of high uncertainty levels to reach a fuzzy equilibrium among different states.
The fuzzy option prioritization was substituted for the crisp form by calculating the fuzzy truth values of preference statements at feasible states. The fuzzy truth values of the considered preference statements were in the range of 0 to 1, where the truth degree of 1 indicates a TRUE preference statement (entirely desirable), while a truth degree of 0 implies a FALSE statement (obvious undesirability). After identifying the fuzzy truth values of preference statements for each state, the fuzzy preference values can be calculated using Equation (27) [
80]:
where
is a matrix of
denoting the fuzzy preference relation of states
i and
j (i.e., the desirability of the state
i comparing the state of
j) over the set of feasible states,
s. The required values of
and
can be calculated as follows:
where
represents the fuzzy score of a state
, which is a function of
, the fuzzy incremental score of state s. The fuzzy incremental score combines the fuzzy truth value of a preference statement
at a given state
and the preference statement order of priority. On the other hand,
is a function of
, the crisp incremental score, in which
can be identified as TRUE or FALSE only. Finally, a matrix of
was developed for all decision-makers to rank the states considering their relative order of preferences under existing uncertainties.
Then, appropriate fuzzy stabilities for the fuzzy graph model, including fuzzy Nash, fuzzy GMR, fuzzy SMR, and fuzzy SEQ were utilized to determine stable states via analysis. To define the fuzzy stabilities, the fuzzy preference relation (values between 0 and 1) was first converted into a fuzzy relative certainty of preference, , which varied between −1 and 1. Then, the fuzzy satisfying threshold of decision-makers was specified by describing their criteria to consider the states’ desirability. The fuzzy satisfying threshold, , is a number that determines the level of the fuzzy relative certainty of preference, . Therefore, stability analysis in a graph model with fuzzy preference depends on the fuzzy satisfying threshold adopted by the decision-makers.
3. Results
The presented novel framework can determine the optimal compatible geometrical features of detention basins and four outlets, including an orifice and proportional, rectangular, and triangular weirs, based on five inflow hydrographs: triangular, abrupt wave, flood pulse, broad peak, and double-peak patterns. Through this framework, a stochastic conflict resolution optimization model was developed using an NSGA-III multi-objective optimization algorithm, which attempted to reduce the risk of flood overtopping, risk of downstream flood damage, and deficit risk of downstream water demand. Simultaneously the model aimed to minimize the deviation of hydrologic uncertainties influencing the flood overtopping and downstream flood damage and the outlet characteristics while resolving conflicts between different stakeholders.
3.1. Optimal Geometrical Features for Detention Basins
The proposed stochastic optimization model was utilized to determine optimal geometrical features for the detention basins with varying outlet types by assessing 600 different flooding scenarios. As a result, 12 Pareto-front solutions were determined for all outlet types produced by NSGA-III for a population size of 50 after reaching the specified maximum number of generations (400), as shown in
Figure 5.
3.2. Conflict Resolution to Select the Superior Optimal Solution
To obtain compatible solutions for the optimum basins designs, the existing dispute between Ministry of Energy involved in the construction of detention basins, National Disaster Management Organization responsible for managing disasters such as flash floods, and Department of Environment interested in satisfying the environmental downstream water rights, should be investigated. These authorities may follow one of the options illustrated in
Table 1 to accomplish their principal objectives.
The disputes mentioned above were investigated by modeling the options within the GMCR+ decision support system. First, GMCR+ was used to select the most appropriate compromise solution by examining the strategic conflicts among the ministries. Then, different states were obtained to choose or refuse any option. For this purpose, the decision-makers’ options and preferences were first modeled to obtain the viable options for the multi-ministry conflict over reservoir pollution control (
Table 1). Then, from these 64 states, 47 unfeasible conditions were eliminated (
Table S5, Supplementary Materials, Section S4), and 17 states remained feasible for further analyses (
Table 2).
Then, feasible states were ranked considering the decision-makers’ fuzzy relative preferences since the results of the GMCR model were significantly affected by the provided preferences, which may arise considerable uncertainties. To this extent, the fuzzy preference framework was utilized to include both certain and uncertain information [
79]. In the fuzzy framework, the state’s fuzzy and crisp scores (
Tables S7 and S8, Supplementary Materials, Section S4) and fuzzy preferences (
Table S9, Supplementary Materials, Section S4) were calculated to determine the fuzzy stable states, preference statements (
Table 3), and values of fuzzy and crisp truth values (
Table 4 and
Table S6, Supplementary Materials, Section S4).
Finally, the impact level of the fuzzy relative certainty of preferences and the state rankings on the given feasible states were assessed considering three fuzzy satisfying threshold sets of
,
, and
.
Table 5 and
Table 6, as well as
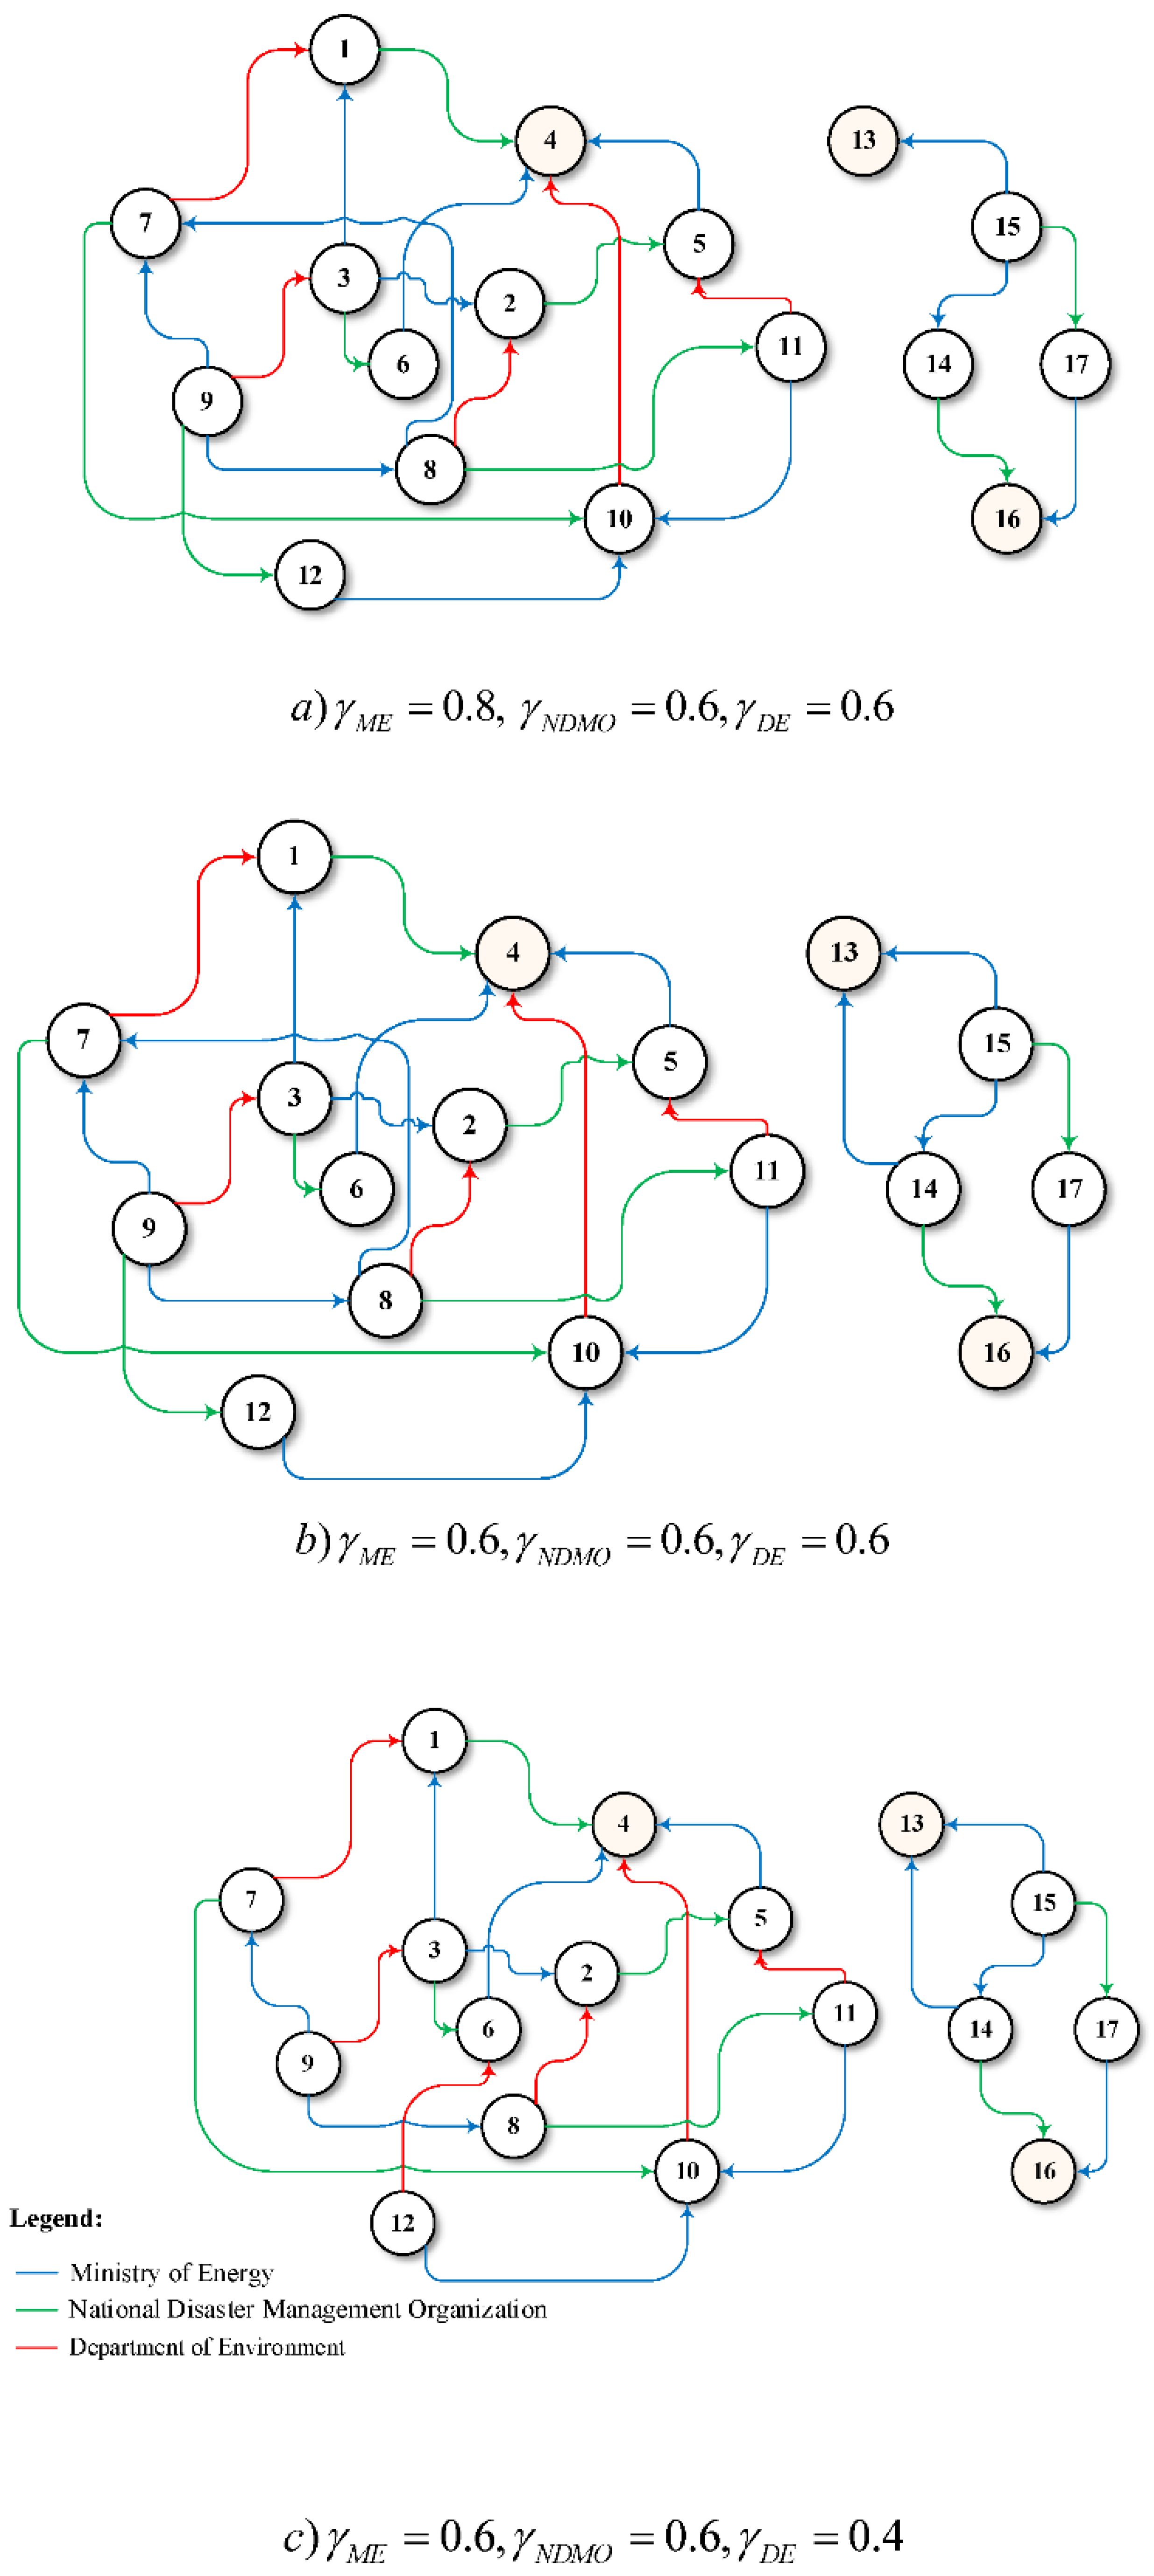
Figure 6, presented the determined state rankings, unilateral improvements, and stable states of the fuzzy GMCR models, respectively. As shown in
Table 6,
Table S10, and S11 (Supplementary Materials, Section S4), state numbers 4, 13, and 16 were chosen as stable states.
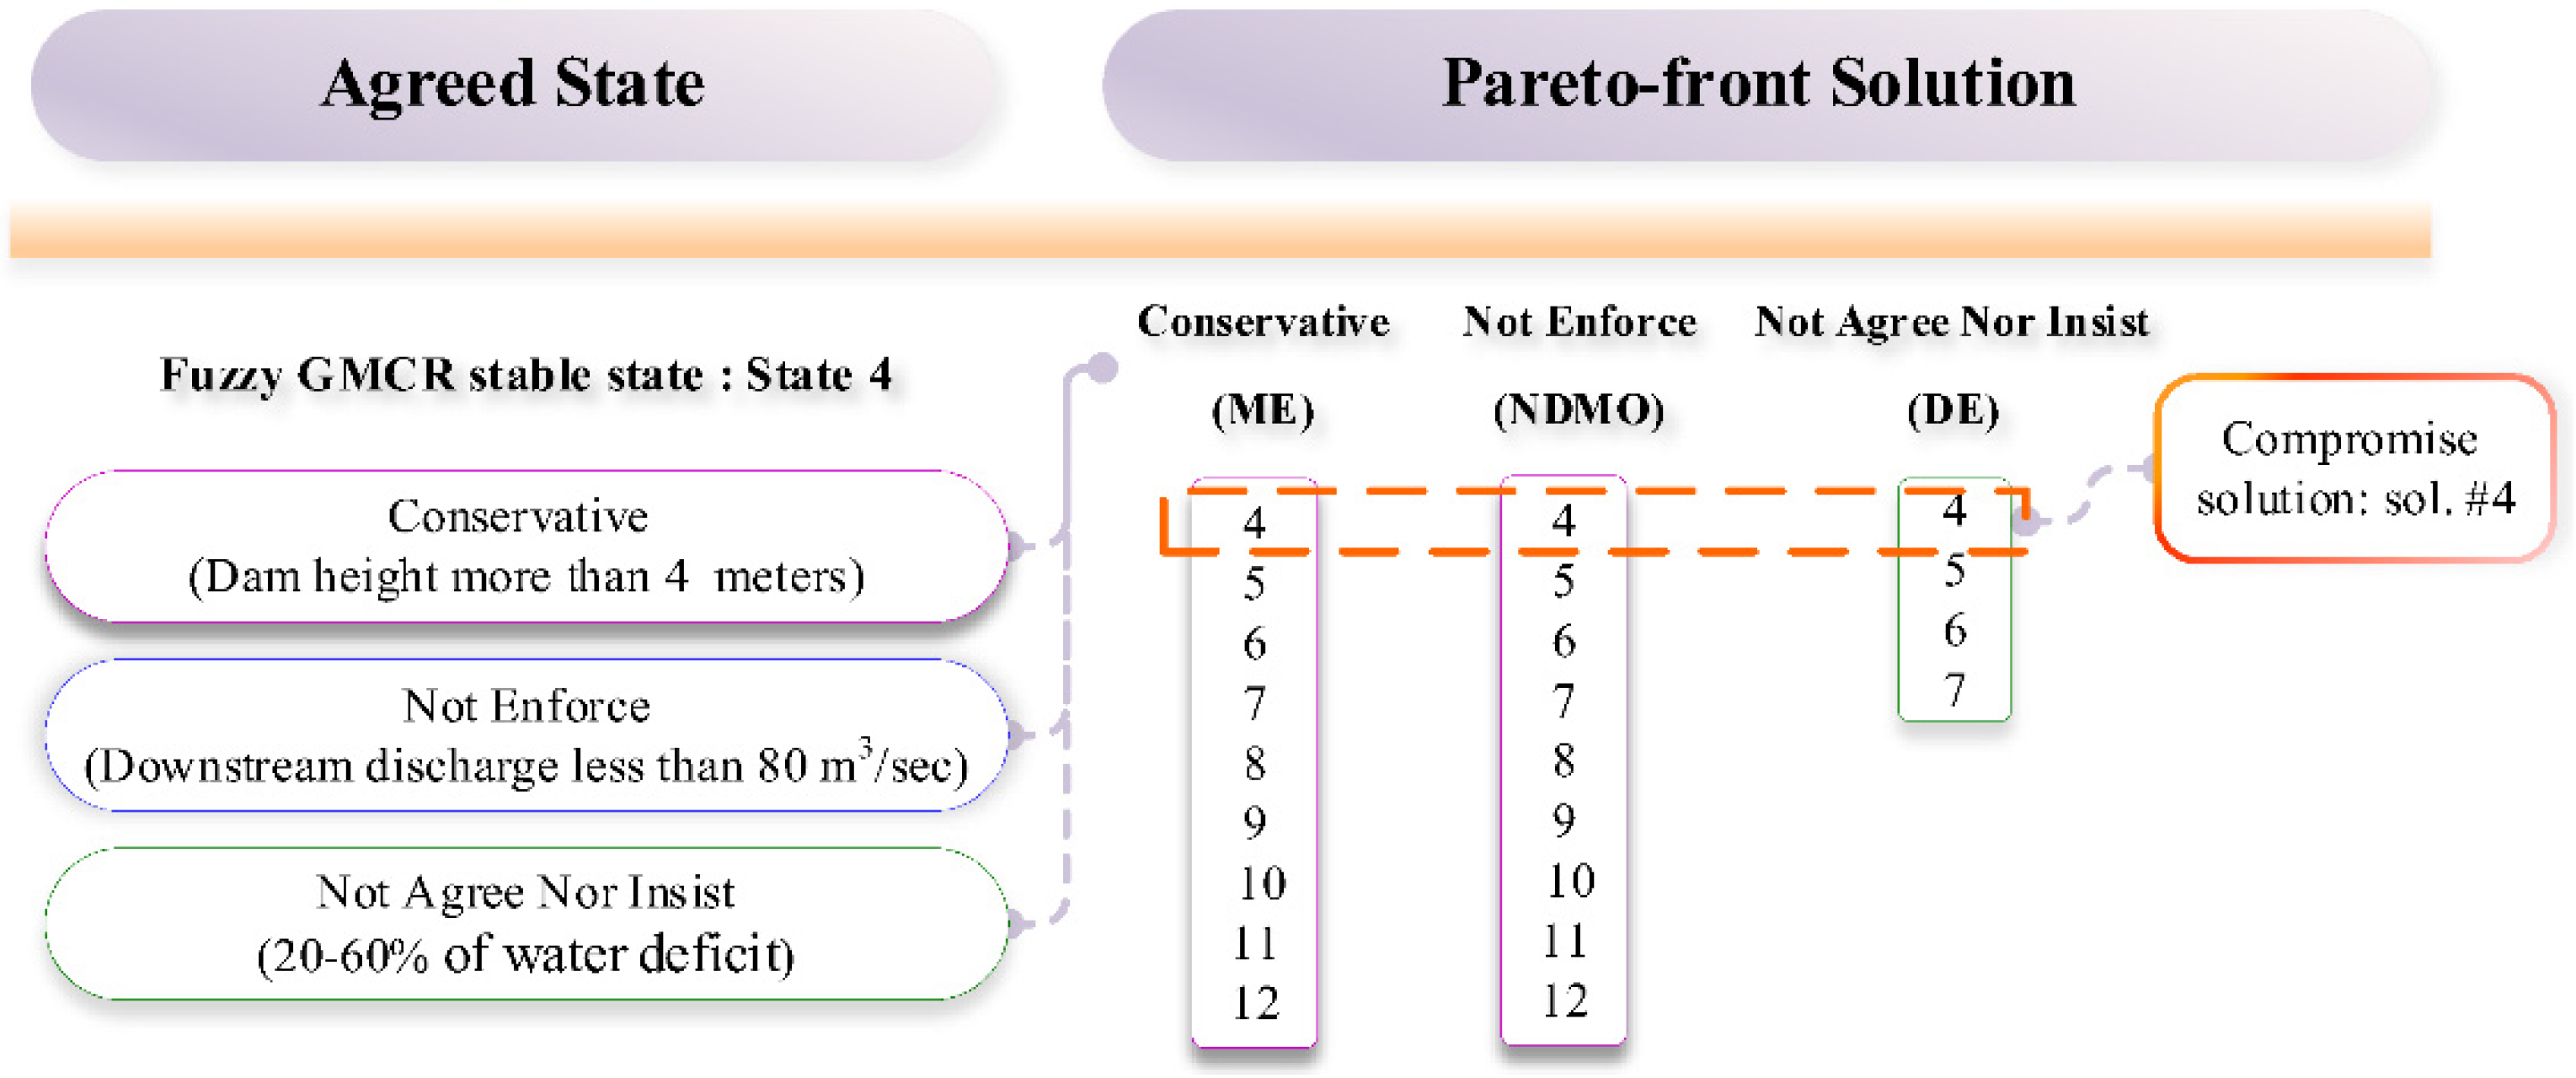
3.3. Regional Compatible Optimal Design
In
Figure 7, the optimal solutions for the basin with a rectangular weir as an example were categorized based on the identified dispute options (
Table 1).
4. Discussion
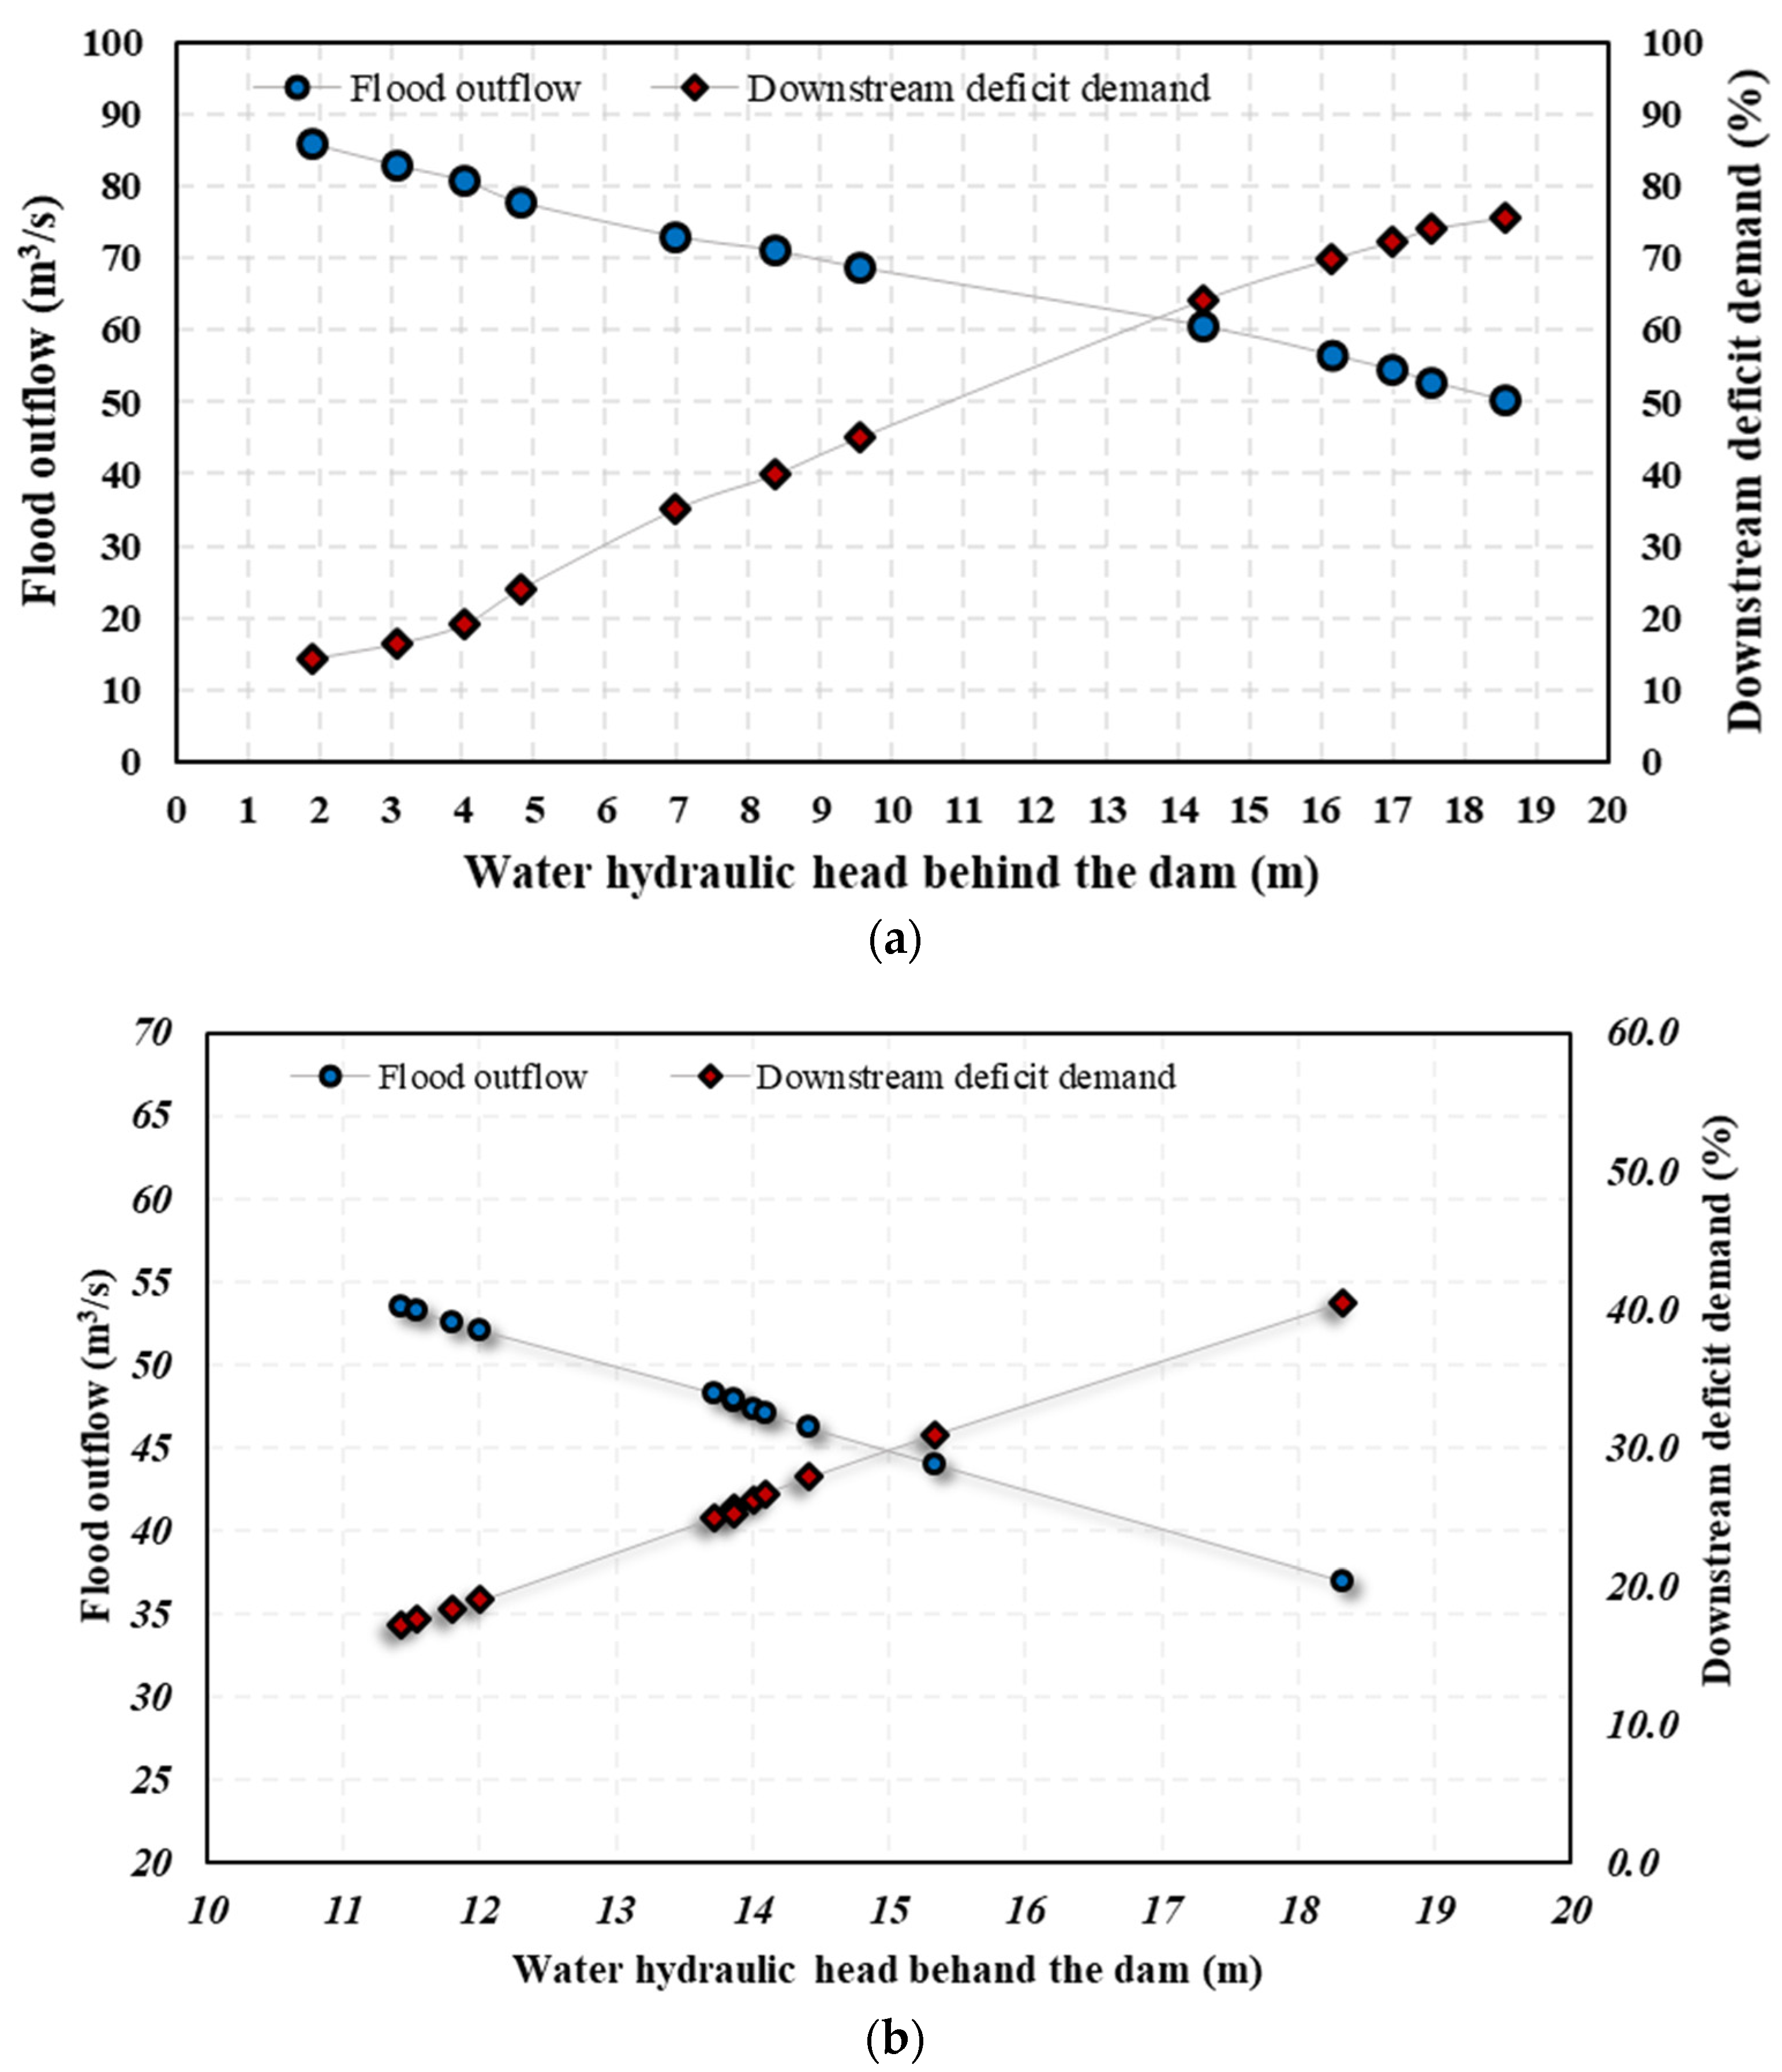
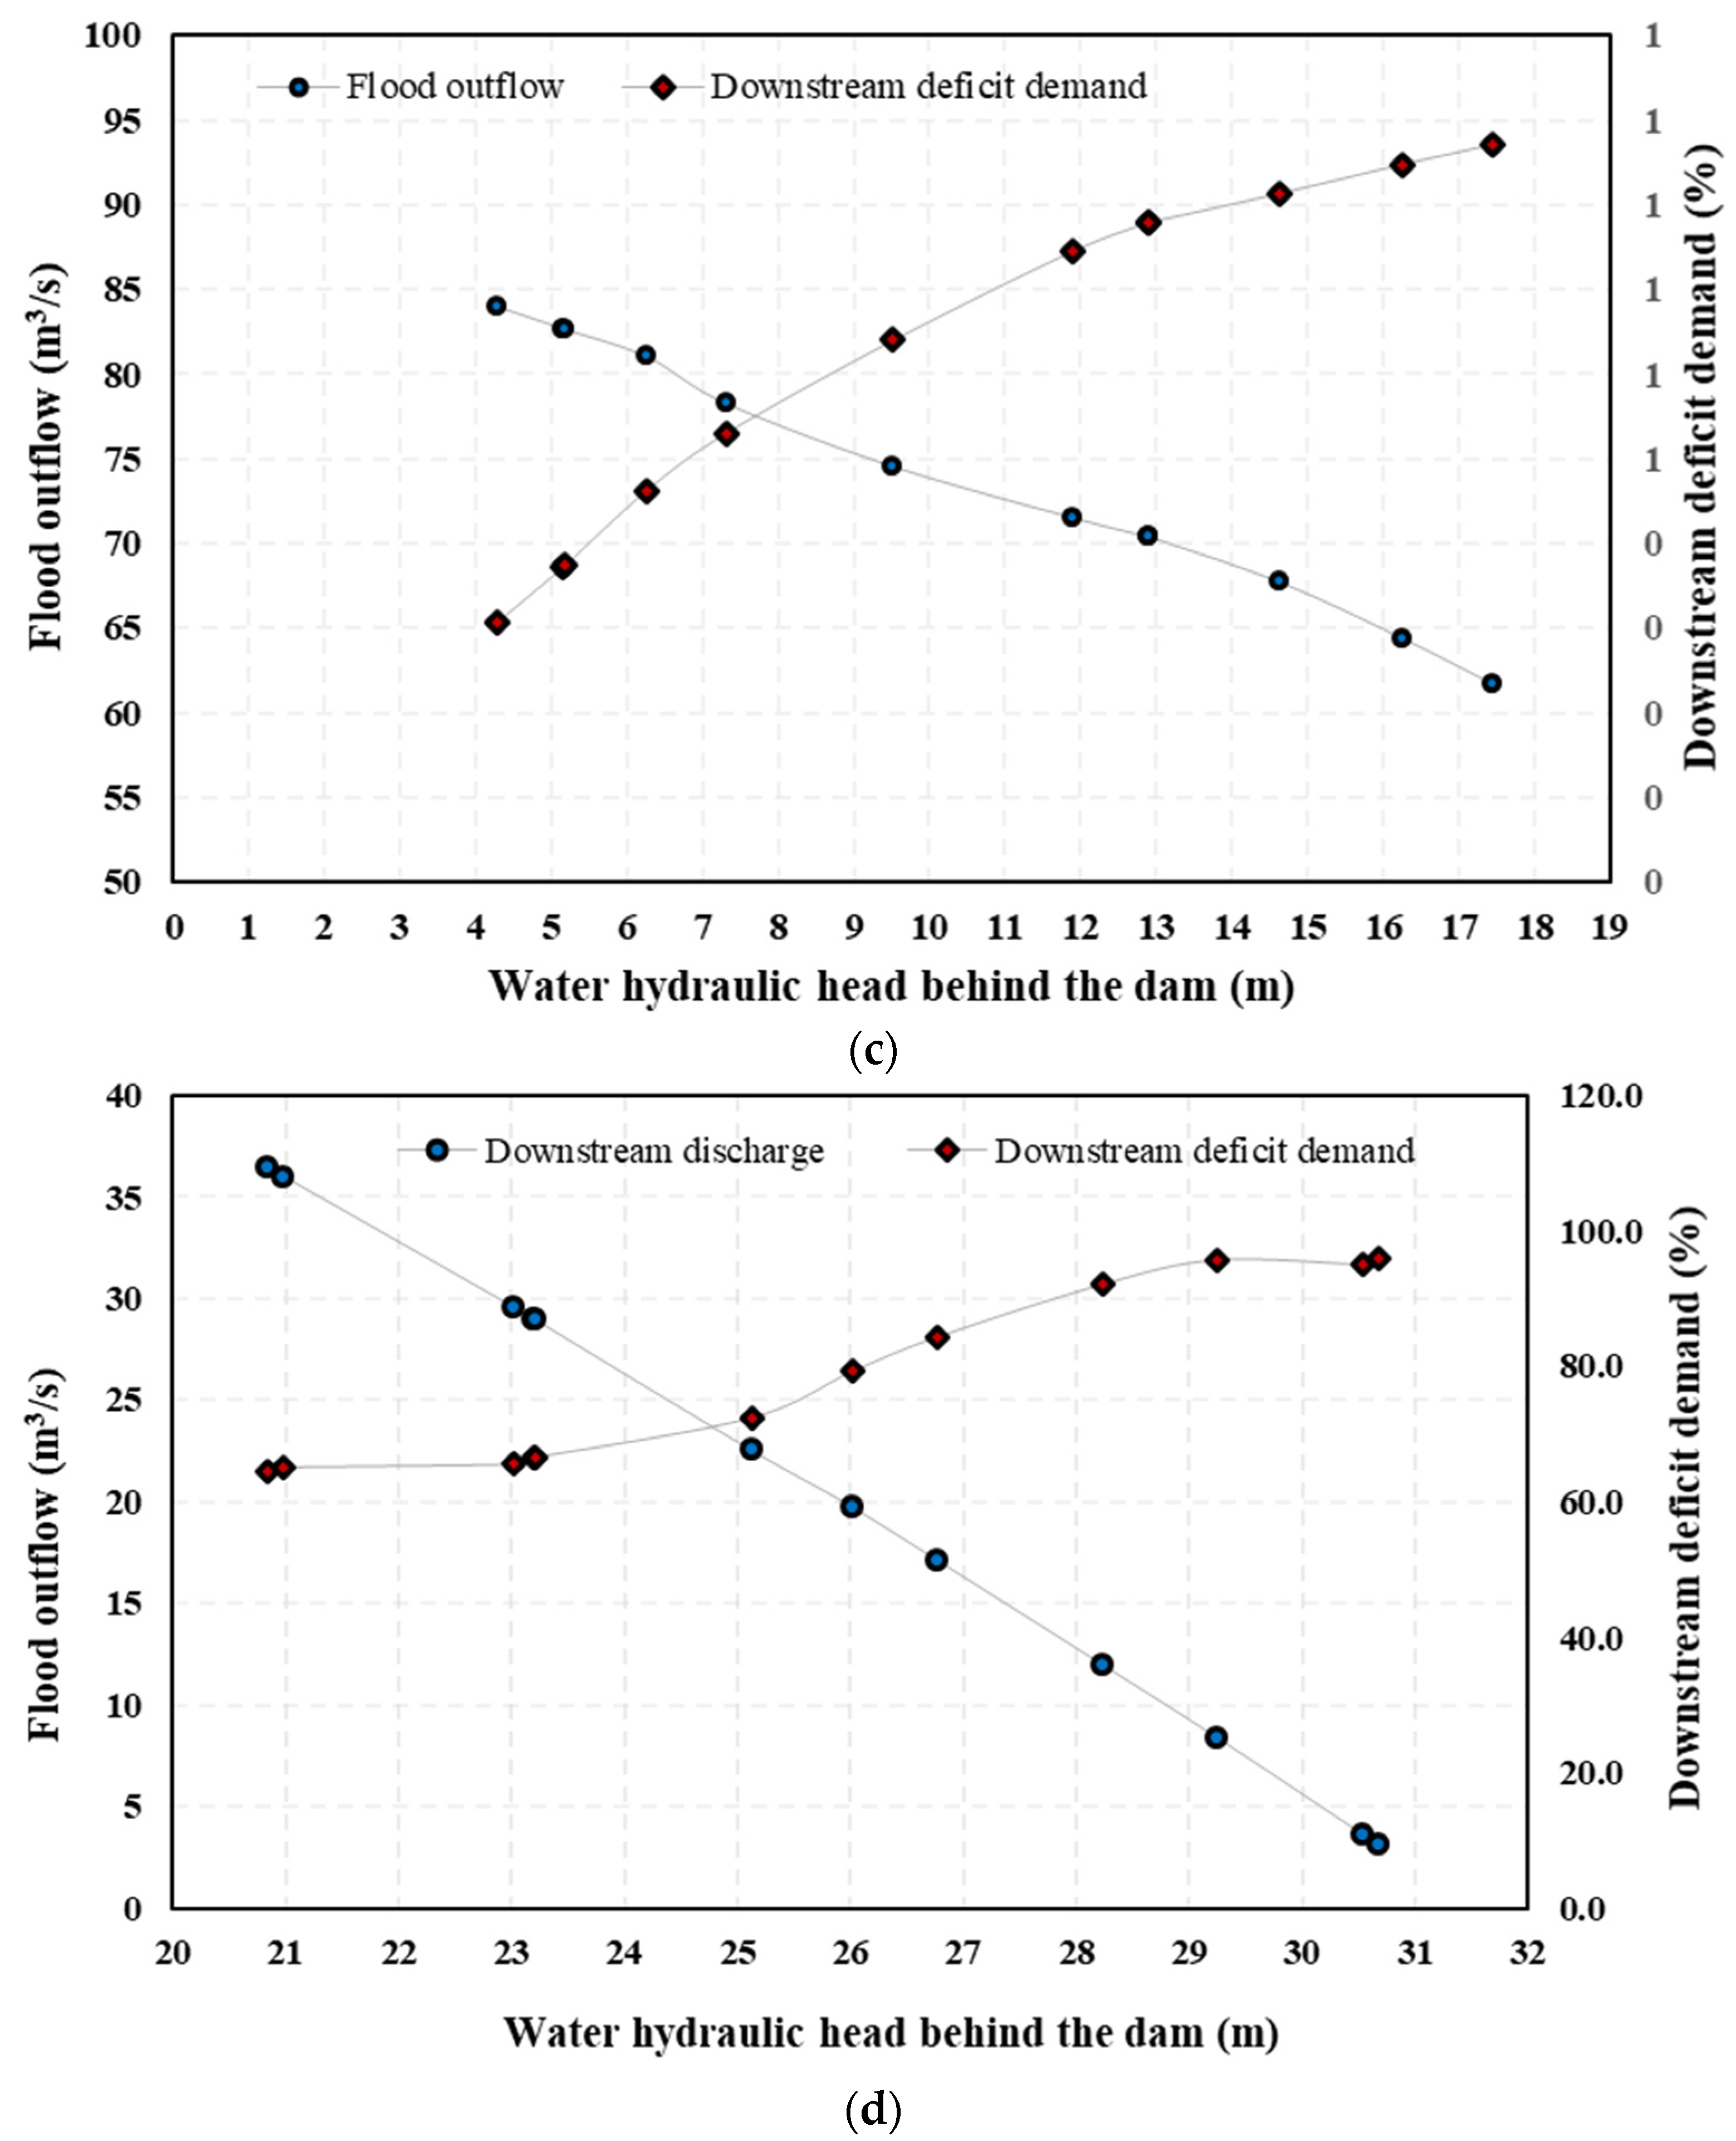
4.1. Optimal Detention Basins Designs
Figure 5 illustrated the obtained values for flood outflow, downstream water demand, and hydraulic water head behind the dam. Clear inverse relationships can be observed between the downstream flood and hydraulic water head and between the downstream flood and downstream deficit demand. Moreover, the deviation of hydrologic uncertainties influencing the flood overtopping and downstream flood damage were minimized through the optimization process, while the model sought to reach the minimal outlet characteristics.
Tables S1–S4 in Supplementary Materials provided the corresponding values of the hydraulic water head, flood outflow variations, and characteristics of the outlet and weirs.
The optimization model results showed various downstream demand deficits. In more detail, the water demand deficit was in the range of 14.4% to 75.8% for the rectangular weir, 17.2% to 40.5% for the orifice, 64.4% to 95.8% for the proportional weir, and 0.31% to 0.87% for the triangular weir. Taking this into account, different outlet types may be selected based on their water demand deficits. In other words, the triangular weir was the best outlet, meeting almost all water demand requirements, while the orifice outlet was the worst outlet type in terms of fulfilling water demands. The other two outlet types (the proportional and rectangular weirs) were moderate, considering downstream water demands. Therefore, one may conclude that the triangular weir was appropriate when downstream water demand requirements were the primary concern.
In addition, the optimization model indicated that flood outflows released from different outlet types were different. In particular, flood outflows ranged from 50.1 m3/s to 85.9 m3/s, 37 m3/s to 53.5 m3/s, 3.12 m3/s to 36.4 m3/s, and 61.8 m3/s to 84 m3/s for the rectangular weir, orifice outlet, proportional weir, and triangular weir, respectively. This showed that the triangular weir was the riskiest outlet in terms of downstream flood damage, while the proportional weir was the safest one, and the other two remaining types, the rectangular weir and the orifice were moderate concerning downstream flood damage risks.
Finally, the proposed optimization model showed that the hydraulic water head in the detention basins would be different using different outlet types. In particular, the hydraulic water head in the detention basin was 1.9 m to 18.6 m for the rectangular weir, 11.4 m to 18.3 m for the orifice outlet, 20.8 m to 30.7 m for the proportional weir, and 4.29 m to 17.4 m for the triangular weir. This illustrated that the rectangular and triangular weirs could flexibly detain water so that the hydraulic water heads in the detention basins varied over a wide range. However, the orifice and the proportional weir typically detain more water than other outlets during the flood, and may be considered more reliable flood regulators.
4.2. Conflict Resolution Model
As demonstrated in
Table 1, the main interest of Ministry of Energy was to achieve the most profitable design features, and, accordingly, the most cost-efficient detention basin construction project. However, National Disaster Management Organization reserved the right to review the proposed design specifications and may force Ministry of Energy to provide downstream safety by strict regulations. However, these extra charges were undesirable for Ministry of Energy, and forced them to provide more conservative plans to eliminate further downstream investigations. Moreover, Department of Environment desired to take advantage of the flood outflow and secure the downstream water rights in negotiations with the Ministry of Energy. Therefore, Ministry of Energy selected only one option from “Low budget”, “Safe budget”, and “Conservative”. National Disaster Management Organization had the only option of “Enforce”, and Department of Environment chose an option from “Agree” or “Insist”. As a result, the total number of states would be 2
6 = 64 states.
After that, 47 unfeasible states were removed from 64 states, which resulted in 17 feasible states, shown in
Table 2. This table indicated how three ministries’ options might be selected based on the existing regulations and rules. For instance, the first feasible state happened when Ministry of Energy (ME) accepted the “Low budget” option, meaning that the detention basins would be built with a limited budget. Consequently, the “Enforce” alternative was not chosen by National Disaster Management Organization (NDMO), since the downstream safety was not provided. Therefore, Department of Environment (DE) selected neither “Agree” nor “Insist” options since the downstream water demands were not met even at 40% of their requirement. The same descriptions can be defined for other feasible states to obtain their rationale.
Then, the preference statements considering three ministries’ priorities were defined in
Table 3. In this Table, the rational resolutions when the earlier mentioned ministries conflicted were determined. Besides the fuzzy network formulations, these preference statements were used to obtain the fuzzy and crisp truth values, fuzzy and crisp scores, and fuzzy preferences for the disputes among ministries. For instance, for the first feasible state in which ME selected the “Low budget” option, the crisp truth values for the “Y-Low budget”, “N-Enforce”, and “Y-Insist IF N-Conservative” preference statements for ME, “Y-Insist” preference statement for NDMO, and “Y-Agree IF Y-Conservative” preference statement for DE were one, while the crisp values for other preference statements related to three ministries are zero. In other words, when ME adopted the “Low budget” policy, NDMO did not select the “Enforce” option, and DE did not choose neither “Agree” nor “Insist” options. Therefore, ME constructed the detention basin with a low budget (“Y-Low budget”) without any obligation from NDMO (“N-Enforce”) to accept water right limits in the case of conservative design (“Y-Insist IF N-Conservative”), NDMO insisted on providing downstream water rights (“Y-Insist”), and DE agreed with low amounts of released water in the case of conservative design (“Y-Agree IF Y-Conservative”). The same procedure may be followed to define the crisp truth values of other feasible states. These crisp truth values and Fuzzy truth values were calculated for the feasible states, as shown in
Table 4.
After that, the states were ranked based on three satisfying fuzzy thresholds.
Table 5 indicated the feasible states fuzzy ranking using
Table 4 and satisfying fuzzy thresholds. For instance, in the case of
, the states of 1, 2, 7, 13, and 14 were equal in ranking for ME, since the fuzzy truth values of all preference statements for these feasible states were more than 0.8. The same procedure was followed to rank all other states. Finally,
Table 6 was dedicated to stability analysis of the states using four GMCR methods as fuzzy Nash (FR), fuzzy general meta-rationality (FGM), fuzzy symmetric meta-rationality (FSM), and fuzzy sequential stability (FSQ) for all sets of thresholds. These analyses revealed that for all threshold series,
,
and
the states of 4, 13, and 16 were stable states among all 17 feasible states.
4.3. Regional Compatible Optimum Design
As shown in
Figure 7, Pareto-front solution #4 (
Table S1, Supplementary Materials, Section S3) was taken as the compromise solution for the rectangular weir. The rationale for this selection was that the Pareto-optimal solution #4 for the rectangular weir met the requirement for state #4, in which Ministry of Energy should accept to provide a conservative design while National Disaster Management Organization would request no downstream investments. In addition, this design specification offered about 24% of downstream water rights. Therefore, the compatible solutions for the orifice outlet, triangular weir, and proportional weir were Pareto-front solution #1, #5, and #1, respectively.
In addition,
Table 7 and
Table 8 showed the optimal compatible design for the detention basins for all outlet types. These tables illustrated that the water demand deficits in the superior optimum designs were about 24%, 17%, 64%, and 0.53% for the rectangular weir, orifice, triangular weir, and proportional weir, respectively. Furthermore, the outflow discharges for the compromised solutions were 77.7 m
3/s for the rectangular weir, 53 m
3/s for the orifice, 36 m
3/s for the proportional weir, and 78 m
3/s for the triangular weir.
5. Conclusions
This study presented a novel stochastic conflict resolution optimization model to determine the optimal compatible features for detention basins with four outlet/weir types as orifice and proportional, rectangular, and triangular weirs by minimizing the risk of overtopping failure, the risk of flood damage, the deficit risk of downstream water demand, the deviation of hydrologic uncertainties related to overtopping and flood damage, and minimum outlet dimensions, while resolving conflicts between substantial stakeholders. The developed framework may be used as a reliable guide by local/regional water resources managers to determine the characteristics of detention basins based on specific environmental conditions. Pertinently, this framework addressed hydrologic uncertainties by simulating roughly one hundred inflow hydrographs with various peak inflows and flood durations based on five well-known inflow patterns, namely triangular, abrupt wave, flood pulse, broad peak, and double-peak hydrographs. Besides, flood routing equations were solved within this optimization framework by assessing the accuracy of 16 schemes of the Runge-Kutta numerical method. A series of Pareto-optimal solutions were obtained by applying all the modeled inflow hydrographs and chosen numerical methods within the non-dominated sorting genetic algorithm- III (NSGA-III) optimization model based on conditional value-at-risk (CVaR) and non-linear interval number programming (NINP) methods. Finally, the superior optimal compatible features for the detention basins and their outlets were chosen among Pareto-optimal solutions generated by the stochastic optimization model utilizing graph theory for conflict resolution (GMCR) enhanced by fuzzy preferences. The application of fuzzy GMCR in this study led to resolving existing disputes among three foremost authorities: Ministry of Energy, National Disaster Management Organization, and Department of Environment. These conflict resolutions led to finding the best appropriate state among different feasible states based on the earlier-mentioned options within the disputes and their related movements. Finally, the Pareto-optimal solutions associated with the best applicable state were chosen to obtain the final compatible optimal design for the detention basins and their outlets. Results showed that the optimum compatible design for the detention basin (once the conflict among three involving ministries is resolved) is an 8.04 m2 cross-sectional area for the orifice, a 2.6 m weir width for the rectangular weir, a 133° tip angle for the triangular weir, and a 0.6 for the proportional weir coefficient while preserving the hydraulic water head behind the dam at 11.4 m, 4.8 m, 7.32 m, and 20.8 m for the orifice, rectangular weir, triangular weir, and proportional weir, respectively. The results of the selected compatible geometric features indicated that the rectangular weir provided the shortest water head. In contrast, the proportional weir hampered up to 20 m of water behind the detention basin. Furthermore, results depicted that the presented framework can efficiently and successfully provide compatible, reliable, and optimum designs of other detention basins complying with the regional standards while meeting the water demands. Therefore, the presented framework may be applied to other case studies for future studies using non-prismatic detention basins with different outlet types. Furthermore, since the flood management in the detention basins is a multi-criterion decision-making (MCDM) problem, robust MCDM tools based on different weight systems can be coupled with several optimization models such as multi-objective particle swarm optimization (MOPSO) to obtain the superior optimum designs for the detention basins while meeting the downstream water demands.
Supplementary Materials
The following supporting information can be downloaded at:
https://www.mdpi.com/article/10.3390/w14050774/s1, Section S1: Different variants of Runge-Kutta schemes, Section S2: Conditional value-at-risk (CVaR), Section S3: Optimal geometrical features of detention basins, Table S1: Corresponding values of the Pareto-optimal solutions for the rectangular weir, Table S2: Corresponding values of the Pareto-optimal solutions for the orifice outlet, Table S3: Corresponding values of the Pareto-optimal solutions for the proportional weir, Table S4: Corresponding values of the Pareto-optimal solutions for the triangular weir, Section S4: Conflict resolution to select the superior optimal solution, Table S5: The unfeasible states of the dispute between Ministry of Energy, National Disaster Management Organization, and Department of Environment, Table S6: Crisp truth values of the preference statements of the dispute between Ministry of Energy, National Disaster Management Organization, and Department of Environment, Table S7. The fuzzy score of the states of the dispute between Ministry of Energy, National Disaster Management Organization, and Department of Environment, Table S8: The crisp score of the states of the dispute between the Ministry of Energy, the National Disaster Management Organization, and the Department of Environment, Table S9: Fuzzy relative certainty of preference for the dispute between Ministry of Energy, National Disaster Management Organization, and Department of Environment, Table S10. Fuzzy stability analysis and equilibrium results for the fuzzy satisfying threshold of
.
Author Contributions
B.N.: Methodology, Software, Investigation, Writing—Original Draft, Writing—Review & Editing, Visualization, Resources. P.H.B.: Conceptualization, Methodology, Validation, Writing—Review & Editing. N.T.: Resources, Review & Editing, Supervision. G.R.R.: Resources, Review & Editing, Supervision. M.R.N.: Project Administration, Conceptualization, Investigations, Software, Writing—Review & Editing, Resources, Supervision. A.H.G.: Resources, Conceptualization, Validation, Writing—Review & Editing. All authors have read and agreed to the published version of the manuscript.
Funding
This research received no external funding.
Institutional Review Board Statement
Not applicable.
Informed Consent Statement
Not applicable.
Data Availability Statement
Not applicable.
Conflicts of Interest
The authors declare no conflict of interest.
References
- Ahmad, D.; Afzal, M.; Rauf, A. Analysis of wheat farmers’ risk perceptions and attitudes: Evidence from Punjab, Pakistan. Nat. Hazards 2019, 95, 845–861. [Google Scholar] [CrossRef]
- Ahmad, D.; Afzal, M. Flood hazards and factors influencing household flood perception and mitigation strategies in Pakistan. Environ. Sci. Pollut. Res. 2020, 27, 15375–15387. [Google Scholar] [CrossRef] [PubMed]
- Shah, A.A.; Gong, Z.; Khan, N.A.; Khan, I.; Ali, M.; Naqvi, S.A.A. Livelihood diversification in managing catastrophic risks: Evidence from flood-disaster regions of Khyber Pakhtunkhwa Province of Pakistan. Environ. Sci. Pollut. Res. 2021, 28, 40844–40857. [Google Scholar] [CrossRef] [PubMed]
- Mosavi, A.; Ozturk, P.; Chau, K.-W. Flood prediction using machine learning models: Literature Review. Water 2018, 10, 1536. [Google Scholar] [CrossRef] [Green Version]
- Allamano, P.; Claps, P.; Laio, F. Global warming increases flood risk in mountainous areas. Geophys. Res. Lett. 2009, 36. [Google Scholar] [CrossRef] [Green Version]
- Schiermeier, Q. Increased flood risk linked to global warming. Nature 2011, 470, 316. [Google Scholar] [CrossRef] [PubMed] [Green Version]
- Alfieri, L.; Dottori, F.; Betts, R.; Salamon, P.; Feyen, L. Multi-model projections of river flood risk in Europe under global warming. Climate 2018, 6, 6. [Google Scholar] [CrossRef] [Green Version]
- Jacob, A.C.P.; Rezende, O.M.; de Sousa, M.M.; de França Ribeiro, L.B.; de Oliveira, A.K.B.; Arrais, C.M.; Miguez, M.G. Use of detention basin for flood mitigation and urban requalification in Mesquita, Brazil. Water Sci. Technol. 2019, 79, 2135–2144. [Google Scholar] [CrossRef]
- Khayyam, U.; Noureen, S. Assessing the adverse effects of flooding for the livelihood of the poor and the level of external response: A case study of Hazara Division, Pakistan. Environ. Sci. Pollut. Res. 2020, 27, 19638–19649. [Google Scholar] [CrossRef]
- Sajedi Hosseini, F.; Khalighi Sigaroodi, S.; Salajegheh, A.; Moghaddamnia, A.; Choubin, B. Towards a flood vulnerability assessment of watershed using integration of decision-making trial and evaluation laboratory, analytical network process, and fuzzy theories. Environ. Sci. Pollut. Res. 2021, 28, 62487–62498. [Google Scholar] [CrossRef]
- Kaya, C.M.; Tayfur, G.; Gungor, P. Predicting flood plain inundation for natural channels having no upstream gauged stations. J. Water Clim. Chang. 2019, 10, 360–372. [Google Scholar] [CrossRef]
- Wortmann, M.; Krysanova, V.; Kundzewicz, Z.W.; Su, B.; Li, X. Assessing the influence of the Merzbacher Lake outburst floods on discharge using the hydrological model SWIM in the Aksu headwaters, Kyrgyzstan/NW China. Hydrol. Process 2014, 28, 6337–6350. [Google Scholar] [CrossRef]
- Wang, W.C.; Chau, K.W.; Xu, D.M.; Qiu, L.; Liu, C.C. The annual maximum flood peak discharge forecasting using hermite projection pursuit regression with SSO and LS method. Water Resour. Manag. 2017, 31, 461–467. [Google Scholar] [CrossRef]
- Meesuk, V.; Vojinovic, Z.; Mynett, A.E.; Abdullah, A.F. Urban flood modelling combining top-view LiDAR data with ground-view SfM observations. Adv. Water Resour. 2015, 75, 105–117. [Google Scholar] [CrossRef]
- Tam, T. Development of flood risk mapping in Kota Tinggi, Malaysia. IOP Conf. Ser. Earth Environ. Sci. 2014, 18, 12192–12196. [Google Scholar] [CrossRef] [Green Version]
- Eli, R.N.; Wiggert, J.M.; Contractor, D.N. Reverse flow routing by the implicit method. Water Resour. Res. 1974, 10, 597–600. [Google Scholar] [CrossRef]
- Zucco, G.; Tayfur, G.; Moramarco, T. Reverse flood routing in natural channels using genetic algorithm. Water Resour. Manag. 2015, 29, 4241–4267. [Google Scholar] [CrossRef] [Green Version]
- Montz, B.E.; Gruntfest, E. Flash flood mitigation: Recommendations for research and applications. Glob. Environ. Chang. Part B Environ. Hazards 2002, 4, 15–22. [Google Scholar] [CrossRef]
- Machac, J.; Hartmann, T.; Jilkova, J. Negotiating land for flood risk management: Upstream-downstream in the light of economic game theory. J. Flood Risk Manag. 2018, 11, 66–75. [Google Scholar] [CrossRef] [Green Version]
- Hu, M.; Zhang, X.; Li, Y.; Yang, H.; Tanaka, K. Flood mitigation performance of low impact development technologies under different storms for retrofitting an urbanized area. J. Clean. Prod. 2019, 222, 373–380. [Google Scholar] [CrossRef]
- Brody, S.D.; Kang, J.E.; Bernhardt, S. Identifying factors influencing flood mitigation at the local level in Texas and Florida: The role of organizational capacity. Nat. Hazards 2010, 52, 167–184. [Google Scholar] [CrossRef]
- Bubeck, P.; Botzen, W.J.W.; Aerts, J.C. A review of risk perceptions and other factors that influence flood mitigation behavior. Risk Anal. Int. J. 2012, 32, 1481–1495. [Google Scholar] [CrossRef] [PubMed] [Green Version]
- Alves, A.; Vojinovic, Z.; Kapelan, Z.; Sanchez, A.; Gersonius, B. Exploring trade-offs among the multiple benefits of green-blue-grey infrastructure for urban flood mitigation. Sci. Total Environ. 2020, 703, 134980. [Google Scholar] [CrossRef] [PubMed]
- Abdel-Fattah, M.; Kantoush, S.A.; Saber, M.; Sumi, T. Evaluation of Structural Measures for Flash Flood Mitigation in Wadi Abadi Region of Egypt. J. Hydrol. Eng. 2021, 26, 04020062. [Google Scholar] [CrossRef]
- Heidari, A. Structural master plan of flood mitigation measures. Nat. Hazards Earth Syst. Sci. 2009, 9, 61–75. [Google Scholar] [CrossRef]
- Bodda, S.S. Multi-Hazard Risk Assessment of a Flood Defense Structure. Master’s Thesis, North Carolina State University, Raleigh, NC, USA, 2017. [Google Scholar]
- Wing, O.E.; Bates, P.D.; Neal, J.C.; Sampson, C.C.; Smith, A.M.; Quinn, N.; Shustikova, I.; Domeneghetti, A.; Gilles, D.W.; Goska, R.; et al. A new automated method for improved flood defense representation in large-scale hydraulic models. Water Resour. Res. 2019, 55, 11007–11034. [Google Scholar] [CrossRef] [Green Version]
- Vorogushyn, S.; Lindenschmidt, K.E.; Kreibich, H.; Apel, H.; Merz, B. Analysis of a detention basin impact on dike failure probabilities and flood risk for a channel-dike-floodplain system along the river Elbe, Germany. J. Hydrol. 2012, 436–437, 120–131. [Google Scholar] [CrossRef] [Green Version]
- Bellu, A.; Fernandes, L.F.S.; Cortes, R.M.; Pacheco, F.A. A framework model for the dimensioning and allocation of a detention basin system: The case of a flood-prone mountainous watershed. J. Hydrol. 2016, 533, 567–580. [Google Scholar] [CrossRef]
- Wiest, L.; Baudot, R.; Lafay, F.; Bonjour, E.; Becouze-Lareure, C.; Aubin, J.B.; Jame, P.; Barraud, S.; Kouyi, G.L.; Sébastian, C.; et al. Priority substances in accumulated sediments in a stormwater detention basin from an industrial area. Environ. Pollut. 2018, 243, 1669–1678. [Google Scholar] [CrossRef] [PubMed]
- Sharior, S.; McDonald, W.; Parolari, A.J. Improved reliability of stormwater detention basin performance through water quality data-informed real-time control. J. Hydrol. 2019, 573, 422–431. [Google Scholar] [CrossRef] [Green Version]
- Gang, X.; Guangwen, M.; Wuhu, L.; Jianchun, C.; Shiyong, W. Application of ant colony algorithm to reservoir optimal operation. Adv. Water Sci. 2005, 25, 108–112. [Google Scholar]
- Chen, H.; Wang, W.; Chen, X.; Qiu, L. Multi-objective reservoir operation using particle swarm optimization with adaptive random inertia weights. Water Sci. Eng. 2020, 13, 136–144. [Google Scholar] [CrossRef]
- Jothiprakash, V.; Arunkumar, R. Optimization of hydropower reservoir using evolutionary algorithms coupled with chaos. Water Resour. Manag. 2013, 27, 1963–1979. [Google Scholar] [CrossRef]
- Qiuyi, X.; Xiaoping, X.; Qiang, H.; Yimin, W.; Han, L. Study on flood zoom model based on genetic algorithm and parallel recombination simulated annealing algorithm. J. Hydroelectr. 2006, 25, 108–112. [Google Scholar]
- Fu, M.; Fan, T.; Ding, Z.; Salih, S.Q.; Al-Ansari, N.; Yaseen, A.Z.M. Deep learning data-intelligence model based on adjusted forecasting window scale: Application in daily streamflow simulation. IEEE Access 2020, 8, 32632–32651. [Google Scholar] [CrossRef]
- Yazdi, J. Optimal operation of urban storm detention ponds for flood management. Water Resour. Manag. 2019, 33, 2109–2121. [Google Scholar] [CrossRef]
- Su, H.T.; Cheung, S.H.; Lo, E.Y.M. Multi-objective optimal design for flood risk management with resilience objectives. Stoch. Environ. Res. Risk Assess. 2018, 32, 1147–1162. [Google Scholar] [CrossRef]
- Leon, A.S.; Verma, V. Towards Smart and Green Flood Control: Remote and Optimal Operation of Control Structures in a Network of Storage Systems for Mitigating Floods. In Proceedings of the World Environmental and Water Resources Congress 2019: Watershed Management, Irrigation and Drainage, and Water Resources Planning and Management, Pittsburgh, PA, USA, 19–23 May 2019; American Society of Civil Engineers: Reston, VA, USA, 2019; pp. 177–189. [Google Scholar]
- Klerk, W.J.; Kanning, W.; Kok, M.; Wolfert, R. Optimal planning of flood defence system reinforcements using a greedy search algorithm. Reliab. Eng. Syst. Saf. 2021, 207, 107344. [Google Scholar] [CrossRef]
- Tabbussum, R.; Qayoom Dar, A. Performance evaluation of artificial intelligence paradigms—Artificial neural networks, fuzzy logic, and adaptive neuro-fuzzy inference system for flood prediction. Environ. Sci. Pollut. Res. 2021, 28, 25265–25282. [Google Scholar] [CrossRef]
- Feng, M.; Liu, P.; Guo, S.; Gui, Z.; Zhang, X.; Zhang, W.; Xiong, L. Identifying changing patterns of reservoir operating rules under various inflow alteration scenarios. Adv. Water Resour. 2017, 104, 23–36. [Google Scholar] [CrossRef]
- Ronalds, R.; Zhang, H. An alternative method for on-site stormwater detention design. J. Hydrol. 2017, 56, 137–153. [Google Scholar]
- Gao, S.; Liu, P.; Pan, Z.; Ming, B.; Guo, S.; Cheng, L.; Wang, J. Incorporating reservoir impacts into flood frequency distribution functions. J. Hydrol. 2019, 568, 234–246. [Google Scholar] [CrossRef]
- Ghasemzadeh, F.; Kouchakzadeh, S.; Belaud, G. Unsteady stage-discharge relationships for sharp-crested weirs. J. Irrig. Drain. Eng. 2020, 146, 04020009. [Google Scholar] [CrossRef]
- Sordo-Ward, A.; Garrote, L.; Bejarano, M.D.; Castillo, L.G. Extreme flood abatement in large dams with gate-controlled spillways. J. Hydrol. 2013, 498, 113–123. [Google Scholar] [CrossRef]
- Janík, A.; Šoltész, A. Flash flood mitigation modeling—Case study small Carpathians. Pollack Period. 2017, 12, 103–116. [Google Scholar] [CrossRef]
- Khaddor, I.; Achab, M.; Soumali, M.R.; Benjbara, A.; Alaoui, A.H. The Impact of the Construction of a Dam on Flood Management. Civ. Eng. J. 2021, 7, 343–356. [Google Scholar] [CrossRef]
- Costabile, P.; Macchione, F. Enhancing river model set-up for 2-D dynamic flood modelling. Environ. Model. Softw. 2015, 67, 89–107. [Google Scholar] [CrossRef]
- Lee, T.H.; Georgakakos, K.P. Operational rainfall prediction on meso-γ scales for hydrologic applications. Water Resour. Res. 1996, 32, 987–1003. [Google Scholar] [CrossRef]
- Bellos, V.; Tsakiris, G. A hybrid method for flood simulation in small catchments combining hydrodynamic and hydrological techniques. J. Hydrol. 2016, 540, 331–339. [Google Scholar] [CrossRef]
- Zanjanian, H.; Abdolabadi, H.; Niksokhan, M.H.; Sarang, A. Influential third party on water right conflict: A Game Theory approach to achieve the desired equilibrium (case study: Ilam dam, Iran). J. Environ. Manag. 2018, 214, 283–294. [Google Scholar] [CrossRef]
- Aljefri, Y.M.; Fang, L.; Hipel, K.W.; Madani, K. Strategic analyses of the hydropolitical conflicts surrounding the grand Ethiopian renaissance dam. Group Decis. Negot. 2019, 28, 305–340. [Google Scholar] [CrossRef]
- Yang, M.; Yang, K.; Che, Y.; Lu, S.; Sun, F.; Chen, Y.; Li, M. Resolving Transboundary Water Conflicts: Dynamic Evolutionary Analysis Using an Improved GMCR Model. Water Resour. Manag. 2021, 35, 3321–3338. [Google Scholar] [CrossRef]
- Nematollahi, B.; Niazkar, M.; Talebbeydokhti, N. Analytical and numerical solutions to level pool routing equations for simplified shapes of inflow hydrographs. Iran. J. Sci. Technol. Trans. Civ. Eng. 2021. [Google Scholar] [CrossRef]
- Hui, R. Flood Storage Allocation Rules for Parallel Reservoirs. Master’s Thesis, University of California, Davis, CA, USA, 2013. [Google Scholar]
- Basha, H.A. Non-linear reservoir routing: Particular analytical solution. J. Hydraul. Eng. 1994, 120, 624–632. [Google Scholar] [CrossRef]
- Gioia, A. Reservoir routing on double peak design flood. Water 2016, 8, 553. [Google Scholar] [CrossRef] [Green Version]
- Paik, K. Analytical derivation of reservoir routing and hydrological risk evaluation of detention basins. J. Hydrol. 2008, 352, 191–201. [Google Scholar] [CrossRef]
- D’Oria, M.; Mignosa, P.; Tanda, M.G. Reverse level pool routing: Comparison between a deterministic and a stochastic approach. J. Hydrol. 2012, 470, 28–35. [Google Scholar] [CrossRef]
- Bozorg-Haddad, O.; Hamedi, F.; Fallah-Mehdipour, E.; Loáiciga, H.A. Upstream flood pattern recognition based on downstream events. Environ. Monit. Assess. 2018, 190, 306. [Google Scholar] [CrossRef]
- Badfar, M.; Barati, R.; Dogan, E.; Tayfur, G. Reverse Flood Routing in Rivers Using Linear and Nonlinear Muskingum Models. J. Hydrol. Eng. 2021, 26, 04021018. [Google Scholar] [CrossRef]
- MacKenzie, K.A. Detention Basin Alternative Outlet Design Study. Report No. CDOT-2016-04 for Colorado Department of Transportation: Denver, CO, USA, 2016. [Google Scholar]
- Rockafellar, R.T.; Uryasev, S.P. Optimization of conditional value-at-risk. J. Risk 2000, 2, 21–42. [Google Scholar] [CrossRef] [Green Version]
- Uryasev, S. Conditional value-at-risk: Optimization algorithms and applications. Financ. Eng. News 2000, 14, 1–5. [Google Scholar]
- Serraino, G.; Uryasev, S. Conditional value-at-risk (CVaR). In Encyclopedia of Operations Research and Management Science; Gass, S.I., Fu, M.C., Eds.; Springer: Boston, MA, USA, 2013. [Google Scholar] [CrossRef]
- Bakhtiari, P.H.; Nikoo, M.R.; Izady, A.; Talebbeydokhti, N. A coupled agent-based risk-based optimization model for integrated urban water management. Sustain. Cities Soc. 2020, 53, 101922. [Google Scholar] [CrossRef]
- Izady, A.; Nikoo, M.R.; Bakhtiari, P.H.; Baawain, M.S.; Al-Mamari, H.; Msagati, T.A.; Nkambule, T.T.; Al-Maktoumi, A.; Chen, M.; Prigent, S. Risk-based Stochastic Optimization of Evaporation Ponds as a Cost-Effective and Environmentally-Friendly Solution for the Disposal of Oil-Produced Water. J. Water Process Eng. 2020, 38, 101607. [Google Scholar] [CrossRef]
- Jiang, C.; Han, X.; Liu, G.R.; Liu, G.P. A non-linear interval number programming method for uncertain optimization problems. Eur. J. Oper. Res. 2008, 188, 1–13. [Google Scholar] [CrossRef]
- Deb, K.; Jain, H. An evolutionary many-objective optimization algorithm using reference-point-based nondominated sorting approach, part I: Solving problems with box constraints. IEEE Trans. Evol. Comput. 2014, 18, 577–601. [Google Scholar] [CrossRef]
- Jain, H.; Deb, K. An Evolutionary many-objective optimization algorithm using reference-point based nondominated sorting approach, part II: Handling constraints and extending to an adaptive approach. IEEE Trans. Evol. Comput. 2014, 18, 602–622. [Google Scholar] [CrossRef]
- Bhesdadiya, R.H.; Trivedi, I.N.; Jangir, P.; Jangir, N.; Kumar, A. An NSGA-III algorithm for solving multi-objective economic/environmental dispatch problem. Cogent Eng. 2016, 3, 1269383. [Google Scholar] [CrossRef]
- Pourshahabi, S.; Rakhshandehroo, G.; Talebbeydokhti, N.; Nikoo, M.R.; Masoumi, F. Handling uncertainty in optimal design of reservoir water quality monitoring systems. Environ. Pollut. 2020, 266, 115211. [Google Scholar] [CrossRef]
- Fang, L.; Hipel, K.W.; Kilgour, D.M. Interactive Decision Making: The Graph Model for Conflict Resolution; Wiley: New York, NY, USA, 1993. [Google Scholar]
- Nash, J.F. Equilibrium points in n-person games. Proc. Natl. Acad. Sci. USA 1950, 36, 48–49. [Google Scholar] [CrossRef] [Green Version]
- Nash, J.F. Non-cooperative games. Ann. Math. 1951, 54, 286–295. [Google Scholar] [CrossRef]
- Howard, N. Paradoxes of Rationality: Theory of Metagames and Political Behavior; MIT Press: Cambridge, MA, USA, 1971. [Google Scholar]
- Fraser, N.M.; Hipel, K.W. Conflict Analysis: Models and Resolutions; NorthHolland: New York, NY, USA, 1984. [Google Scholar]
- Bashar, M.A.; Hipel, K.W.; Kilgour, D.M.; Obeidi, A. Interval fuzzy preferences in the graph model for conflict resolution. Fuzzy Optim. Decis. Mak. 2018, 17, 287–315. [Google Scholar] [CrossRef]
- Gupta, S.K. Numerical methods for engineers; New Age International: New Delhi, India, 1995. [Google Scholar]
Figure 1.
The general framework of the presented stochastic conflict resolution optimization model to determine the optimal, compatible design of detention basins.
Figure 1.
The general framework of the presented stochastic conflict resolution optimization model to determine the optimal, compatible design of detention basins.
Figure 2.
The developed synthetic inflow hydrograph scenarios for five general inflow patterns.
Figure 2.
The developed synthetic inflow hydrograph scenarios for five general inflow patterns.
Figure 3.
The schematic view and outflow equations for the four selected outlet types: (a) Orifice; (b) Proportional weir; (c) Rectangular weir; (d) Triangular weir. Qout, outflow from the outlets/weirs; h, hydraulic head of stored water; λ, formula error correction factor; C, outlet coefficient; a, total cross-sectional area of the orifice outlet; b, weir constants; S, weir base distance; x(y), weir width at water surface; y, water depth; L, weir width; θ, weir tip angle; g, gravitational acceleration constant.
Figure 4.
The general framework of the conflict resolution model to define compatible designs of detention basins.
Figure 4.
The general framework of the conflict resolution model to define compatible designs of detention basins.
Figure 5.
Pareto-optimal solutions for developed stochastic optimization model for (a) Rectangular weir; (b) Orifice; (c) Proportional weir; (d) Triangular weir.
Figure 5.
Pareto-optimal solutions for developed stochastic optimization model for (a) Rectangular weir; (b) Orifice; (c) Proportional weir; (d) Triangular weir.
Figure 6.
The unilateral improvements of feasible states over the set of fuzzy satisfying thresholds.
Figure 6.
The unilateral improvements of feasible states over the set of fuzzy satisfying thresholds.
Figure 7.
The compromise solution for the basin with rectangular weir design produced by the fuzzy GMCR model.
Figure 7.
The compromise solution for the basin with rectangular weir design produced by the fuzzy GMCR model.
Table 1.
Options for the dispute resolution among Ministry of Energy, National Disaster Management Organization, and Department of Environment.
Table 1.
Options for the dispute resolution among Ministry of Energy, National Disaster Management Organization, and Department of Environment.
| Authority | Options |
|---|
| Ministry of Energy | - (1)
Insist on constructing the detention basins with a limited budget (Low budget). - (2)
Increase acceptable construction budget to alleviate the safety concerns (Safe budget). - (3)
Come up with the most conservative design emphasizing safety factors (Conservative).
|
| National Disaster Management Organization | - (1)
Force Ministry of Energy to provide downstream safety following the regulations of the National Disaster Management Organization (Enforce).
|
| Department of Environment | - (1)
Agree to provide up to 40% of downstream water rights (deficit more than 60%) (Agree). - (2)
Insist on securing at least 80% of downstream water rights (deficit less than 20%) (Insist).
|
Table 2.
Feasible states for the disputes among the Ministry of Energy, the National Disaster Management Organization, and the Department of Environment.
Table 2.
Feasible states for the disputes among the Ministry of Energy, the National Disaster Management Organization, and the Department of Environment.
| Authority | Options | State Number |
|---|
| 1 | 2 | 3 | 4 | 5 | 6 | 7 | 8 | 9 | 10 | 11 | 12 | 13 | 14 | 15 | 16 | 17 |
|---|
Ministry of
Energy | Low budget | Y | N | N | N | N | N | Y | N | N | N | N | N | Y | N | N | N | N |
| Safe budget | N | Y | N | N | Y | N | N | Y | N | N | Y | N | N | Y | N | Y | N |
| Conservative | N | N | Y | Y | N | Y | N | N | Y | Y | N | Y | N | N | Y | N | Y |
National
Disaster
Management
Organization | Enforce | N | N | N | N | Y | Y | N | N | N | N | Y | Y | N | N | N | Y | Y |
Department of
Environment | Agree | N | N | N | N | N | N | Y | Y | N | Y | Y | Y | N | N | N | N | N |
| Insist | N | N | N | N | N | N | N | N | N | N | N | N | Y | Y | Y | Y | Y |
Table 3.
The preference statements in their order of priority of the dispute between Ministry of Energy, National Disaster Management Organization, and Department of Environment.
Table 3.
The preference statements in their order of priority of the dispute between Ministry of Energy, National Disaster Management Organization, and Department of Environment.
| Authority | Preference Statement | Explanation |
|---|
Ministry of
Energy (ME) | Y-Low budget | The ME preferred to construct the detention basin with a limited budget. |
| N-Enforce | The ME preferred no mandatory from NDMO to pay for providing the downstream safety. |
| Y-Insist IF N-Conservative | The ME did not accept the water rights limits in the case of conservative design. |
National
Disaster
Management Organization (NDMO) | Y-Conservative | The NDMO preferred a conservative design for detention basins. |
| Y-Enforce IF Y-Low budget | The NDMO enforced ME to provide downstream safety if they insisted on Low budget design. |
| N-Enforce | The NDMO was against the drastic changes in downstream conditions. |
| Y-Insist | The NDMO preferred the downstream water rights to be provided. |
| Department of Environment (DE) | Y-Insist | The DE preferred the downstream water rights to be provided. |
| Y-Agree IF Y-Conservative | The DE agreed by low amounts of released water only if a conservative design is accepted. |
Table 4.
Fuzzy truth values for the preference statements of the dispute among Ministry of Energy, National Disaster Management Organization, and Department of Environment.
Table 4.
Fuzzy truth values for the preference statements of the dispute among Ministry of Energy, National Disaster Management Organization, and Department of Environment.
| Authority | Preference Statement | State Number |
|---|
| 1 | 2 | 3 | 4 | 5 | 6 | 7 | 8 | 9 | 10 | 11 | 12 | 13 | 14 | 15 | 16 | 17 |
|---|
Ministry of
Energy | Y-Low budget | 1 | 0.8 | 0.1 | 0.7 | 0 | 0 | 1 | 0.6 | 0.1 | 0.7 | 0 | 0 | 1 | 0.8 | 0 | 0 | 0 |
| N-Enforce | 1 | 1 | 1 | 0.1 | 0 | 0 | 1 | 1 | 1 | 0.1 | 0 | 0 | 1 | 1 | 1 | 0 | 0 |
| Y-Insist IF N-Conservative | 1 | 1 | 1 | 1 | 1 | 1 | 1 | 1 | 1 | 1 | 1 | 1 | 1 | 1 | 0 | 1 | 0 |
National
Disaster
Management Organization | Y-Conservative | 0 | 0 | 1 | 0 | 0.3 | 1 | 0 | 0 | 1 | 0 | 0.3 | 1 | 0 | 0 | 1 | 0.3 | 1 |
| Y-Enforce IF Y-Low budget | 0 | 0.2 | 0.5 | 1 | 1 | 1 | 0 | 0.2 | 0.5 | 1 | 1 | 1 | 0 | 0.2 | 0.5 | 1 | 1 |
| N-Enforce | 0 | 0 | 0.3 | 0 | 0 | 0.3 | 0 | 0 | 0.1 | 0 | 0 | 0.1 | 1 | 1 | 1 | 1 | 1 |
| Y-Insist | 0.6 | 1 | 1 | 0 | 0 | 0 | 0.6 | 1 | 1 | 0 | 0 | 0 | 0.6 | 1 | 1 | 0 | 0 |
| Department of Environment | Y-Insist | 0 | 0 | 0.2 | 0 | 0 | 0.2 | 0 | 0 | 0 | 0 | 0 | 0 | 0.8 | 1 | 1 | 1 | 1 |
| Y-Agree IF Y-Conservative | 0.8 | 1 | 1 | 0.8 | 1 | 1 | 0 | 0 | 1 | 0 | 0 | 1 | 0.9 | 1 | 1 | 1 | 1 |
Table 5.
The feasible states’ fuzzy rankings, considering the fuzzy satisfying thresholds.
Table 5.
The feasible states’ fuzzy rankings, considering the fuzzy satisfying thresholds.
| Authority | Fuzzy Satisfying Threshold | State Ranking |
|---|
| Ministry of Energy | | 1 2 7 13 14 4 8 3 9 10 15 5 6 11 12 16 17 |
| 1 2 7 8 13 14 3 4 9 10 5 6 11 12 15 16 17 |
| 1 2 7 8 13 14 3 4 9 10 5 6 11 12 15 16 17 |
National Disaster Management
Organization | | 6 12 17 3 9 15 5 11 16 4 10 2 8 14 1 7 13 |
| 6 12 17 3 9 15 5 11 16 4 10 2 8 14 1 7 13 |
| 6 12 17 3 9 15 5 11 16 4 10 2 8 14 1 7 13 |
| Department of Environment | | 3 13 14 15 16 17 2 5 6 12 1 4 9 7 8 10 11 |
| 3 13 14 15 16 17 2 5 6 12 1 4 9 7 8 10 11 |
| 14 15 16 17 13 3 6 2 5 12 1 4 9 7 8 10 11 |
Table 6.
Fuzzy stability analysis and equilibrium results for the fuzzy satisfying threshold of .
Table 6.
Fuzzy stability analysis and equilibrium results for the fuzzy satisfying threshold of .
| Authority | Fuzzy Graph Indicator | State Number |
|---|
| 1 | 2 | 3 | 4 | 5 | 6 | 7 | 8 | 9 | 10 | 11 | 12 | 13 | 14 | 15 | 16 | 17 |
|---|
Ministry of Energy
(ME) | FR | ✓ | ✓ | | ✓ | | | ✓ | | | ✓ | | | ✓ | ✓ | | ✓ | |
| FGM | ✓ | ✓ | ✓ | ✓ | | | ✓ | ✓ | ✓ | ✓ | ✓ | | ✓ | ✓ | | ✓ | |
| FSM | ✓ | ✓ | ✓ | ✓ | | | ✓ | ✓ | ✓ | ✓ | ✓ | | ✓ | ✓ | | ✓ | |
| FSQ | ✓ | ✓ | | ✓ | | | ✓ | ✓ | ✓ | ✓ | ✓ | | ✓ | ✓ | | ✓ | |
| National Disaster Management Organization (NDMO) | FR | | | | ✓ | | ✓ | | | | ✓ | ✓ | ✓ | ✓ | | | ✓ | ✓ |
| FGM | | | ✓ | ✓ | | ✓ | | | ✓ | ✓ | ✓ | ✓ | ✓ | | ✓ | ✓ | ✓ |
| FSM | | | ✓ | ✓ | | ✓ | | | ✓ | ✓ | ✓ | ✓ | ✓ | | ✓ | ✓ | ✓ |
| FSQ | | | ✓ | ✓ | | ✓ | | | ✓ | ✓ | ✓ | ✓ | ✓ | | ✓ | ✓ | ✓ |
| Department of Environment (DE) | FR | ✓ | ✓ | ✓ | ✓ | | ✓ | | | | | | ✓ | ✓ | ✓ | ✓ | ✓ | ✓ |
| FGM | ✓ | ✓ | ✓ | ✓ | ✓ | ✓ | | | ✓ | | | ✓ | ✓ | ✓ | ✓ | ✓ | ✓ |
| FSM | ✓ | ✓ | ✓ | ✓ | ✓ | ✓ | | | ✓ | | | ✓ | ✓ | ✓ | ✓ | ✓ | ✓ |
| FSQ | ✓ | ✓ | ✓ | ✓ | ✓ | ✓ | | | ✓ | | | ✓ | ✓ | ✓ | ✓ | ✓ | ✓ |
| Equilibrium | FR | N | N | N | Y | N | N | N | N | N | N | N | N | Y | N | N | Y | N |
| FGM | N | N | Y | Y | N | N | N | N | Y | N | N | N | Y | N | N | Y | N |
| FSM | N | N | Y | Y | N | N | N | N | Y | N | N | N | Y | N | N | Y | N |
| FSQ | N | N | N | Y | N | N | N | N | Y | N | N | N | Y | N | N | Y | N |
Table 7.
Compatible optimal geometric features for the detention basins.
Table 7.
Compatible optimal geometric features for the detention basins.
| Outlet/Weir Type | Water Hydraulic Head behind the Dam (m) | Outlet/Weir Characteristics |
|---|
| Orifice outlet | 11.4 | orifice area: | 8.04 m2 |
| Rectangular weir | 4.80 | weir width: | 2.60 m |
| Triangular weir | 7.32 | weir angle: | 133° |
| Proportional weir | 20.8 | weir coefficient: | 0.60 |
Table 8.
The optimum discharge coefficients and correction factor for the detention basins.
Table 8.
The optimum discharge coefficients and correction factor for the detention basins.
| Outlet/Weir Type | Coefficient |
|---|
| Orifice outlet | Correction factor: 0.61
Discharge coefficient: 0.73 |
| Rectangular weir | Discharge coefficient: 0.96 |
| Triangular weir | Discharge coefficient: 0.21 |
| Proportional weir | Discharge coefficient: 0.6 |
| Publisher’s Note: MDPI stays neutral with regard to jurisdictional claims in published maps and institutional affiliations. |
© 2022 by the authors. Licensee MDPI, Basel, Switzerland. This article is an open access article distributed under the terms and conditions of the Creative Commons Attribution (CC BY) license (https://creativecommons.org/licenses/by/4.0/).


 ,
, 


