Article

Biodegradable and Seasonal Variation of Organic Carbon Affected by Anthropogenic Activity: A Case in Xuan Thuy Mangrove Forest, North Vietnam

1
Institute of Natural Product Chemistry, Vietnam Academy of Science and Technology, 18 Hoang Quoc Viet Road, Cau Giay, Hanoi 11354, Vietnam
2
VNU Institute of Microbiology and Biotechnology, Vietnam National University, 144 Xuan Thuy Road, Cau Giay, Hanoi 11400, Vietnam
3
WEO, University of Science and Technology of Hanoi, 18 Hoang Quoc Viet Road, Cau Giay, Hanoi 10089, Vietnam
*
Author to whom correspondence should be addressed.
Water 2022, 14(5), 773; https://doi.org/10.3390/w14050773
Submission received: 25 January 2022 / Revised: 21 February 2022 / Accepted: 24 February 2022 / Published: 28 February 2022
(This article belongs to the Section Wastewater Treatment and Reuse)

Abstract

:
The samples were collected from different areas (from natural, planted, and deforested mangrove forests) to study the impact of anthropogenic activity on biodegradable and seasonal variation of organic carbon (OC) in Xuan Thuy mangrove forest, North Vietnam. We observed a positive relationship between TSS and both POC and DOC (r2 = 0.993; p < 0.0001 và r2 = 0.942; p < 0.0001, respectively), suggesting that erosion and resuspension increase OC delivery at the mangroves. Mean DOC and POC concentrations in the rainy season (4.8 ± 3.0 mgCL−1 and 6.9 ± 1.6 mgCL−1, respectively) were significantly higher than those in the dry season (3.1 ± 0.9 mgCL−1 and 2.9 ± 0.4 mgCL−1, respectively). The mean percentage of biodegradable for 40 days was about 47 ± 15% of BTOC, 45 ± 17% of BDOC, and 48 ± 18% of BPOC. The rainy season indicated that there was more biodegradable OM in the mangroves compared to the dry season. The molar ratio of OC and total nitrogen was from 0.4 to 25.9, showing a hybrid of terrestrial organic matter and aquatic. Lower C/N and great variation of POC/Chla in the deforested mangroves was due to augmented OM input from aquaculture activities in this area. The results of this study indicate that deforested mangrove and an increase in aquaculture activities will contribute to anthropogenic OM reaching the sea.

1. Introduction

One of the most important issues of concern today is the deforestation of mangroves and their degradation, more than 35% of mangroves around the world have already been lost [1,2]. In general, anthropogenic activities including human settlements, coastal defense, harbor, tourism, agricultural and aquacultural practices, contribute greatly to the degradation of mangrove ecological systems [2,3,4,5,6]. This is of special interest due to mangrove forests playing an active role in reducing sea-level rise and climate change [1,7,8,9,10,11], by reducing coastal erosion and enhancing the rate of organic carbon deposition [12,13].
According to quantitative estimates, a significant portion of the net carbon from global mangrove forests was exported as DOC to coastal waters. For example, DOC export from a mangrove area in northern Brazil was significantly high, at 12 mol C m−2 year−1 [5]. Biodegradable and photodegradation experiments showed that a substantial fraction in mangroves was DOC refractory (50%) on a time scale of weeks to years. More than 10% of the DOC derived from terrestrial sources was transported to the ocean via mangroves [5]. Many invertebrate species have used mangrove-derived POM as the main source of food (84% of the diet of juvenile prawns) [6]. Thus, in mangrove ecosystems, the whole food web was likely to be affected by the dynamics of POM [6].
Mangrove forests are considered as a large carbon pool in coastal regions [9]. Geraei et al. [14] reported that carbon pools are more susceptible to habitat change. Indeed, Kauffman et al. [15] discovered that the conversion of mangroves to shrimp ponds has resulted in a 54% loss of underground C pools. On the contrary, in deserted ponds, mangrove carbon pools can rebuild over time. For example, in deserted ponds, high C stocks were over 15 years (835 ± 144.72 t C ha−1) [16].
Recently, research has mainly focused on the degree and degeneracy of organic carbon (OC) in mangrove ecosystems [17,18,19,20], the impact of anthropogenic inputs on OC [21,22], and there remains a limited understanding of the combination of these two factors. This is especially the case for the mangrove ecosystems of Vietnam, where very little data are available. The biodegradation of OC will vary, depending on the composition and origin of the organic matter (OM) [23], and thus, dynamics and its other components are interacting in ecosystems [24]. Therefore, the study on the human activity factors influencing organic carbon dynamics and biodegradation with different settings in mangrove forests may help to better understand the ecological function of mangroves and the fate of OC, proposing useful options for the climate change reduction process [25].
This study presents: surveyed for water composition, TOC and biodegradable, C/N ratio in the Xuan Thuy mangrove. The work reported herein had two objectives: (1) to estimate the organic carbon dynamics and biodegradable in water collected from different mangroves (a natural mangrove forest, a deforested mangrove, and a planted mangroves), (2) to describe the characteristics of OC sources in mangrove ecosystems. The outcomes in this study could be the basis for understanding the functioning of mangrove ecosystems while understanding their ability to respond to negative anthropogenic impacts (e.g., deforestation).

2. Experimental Design

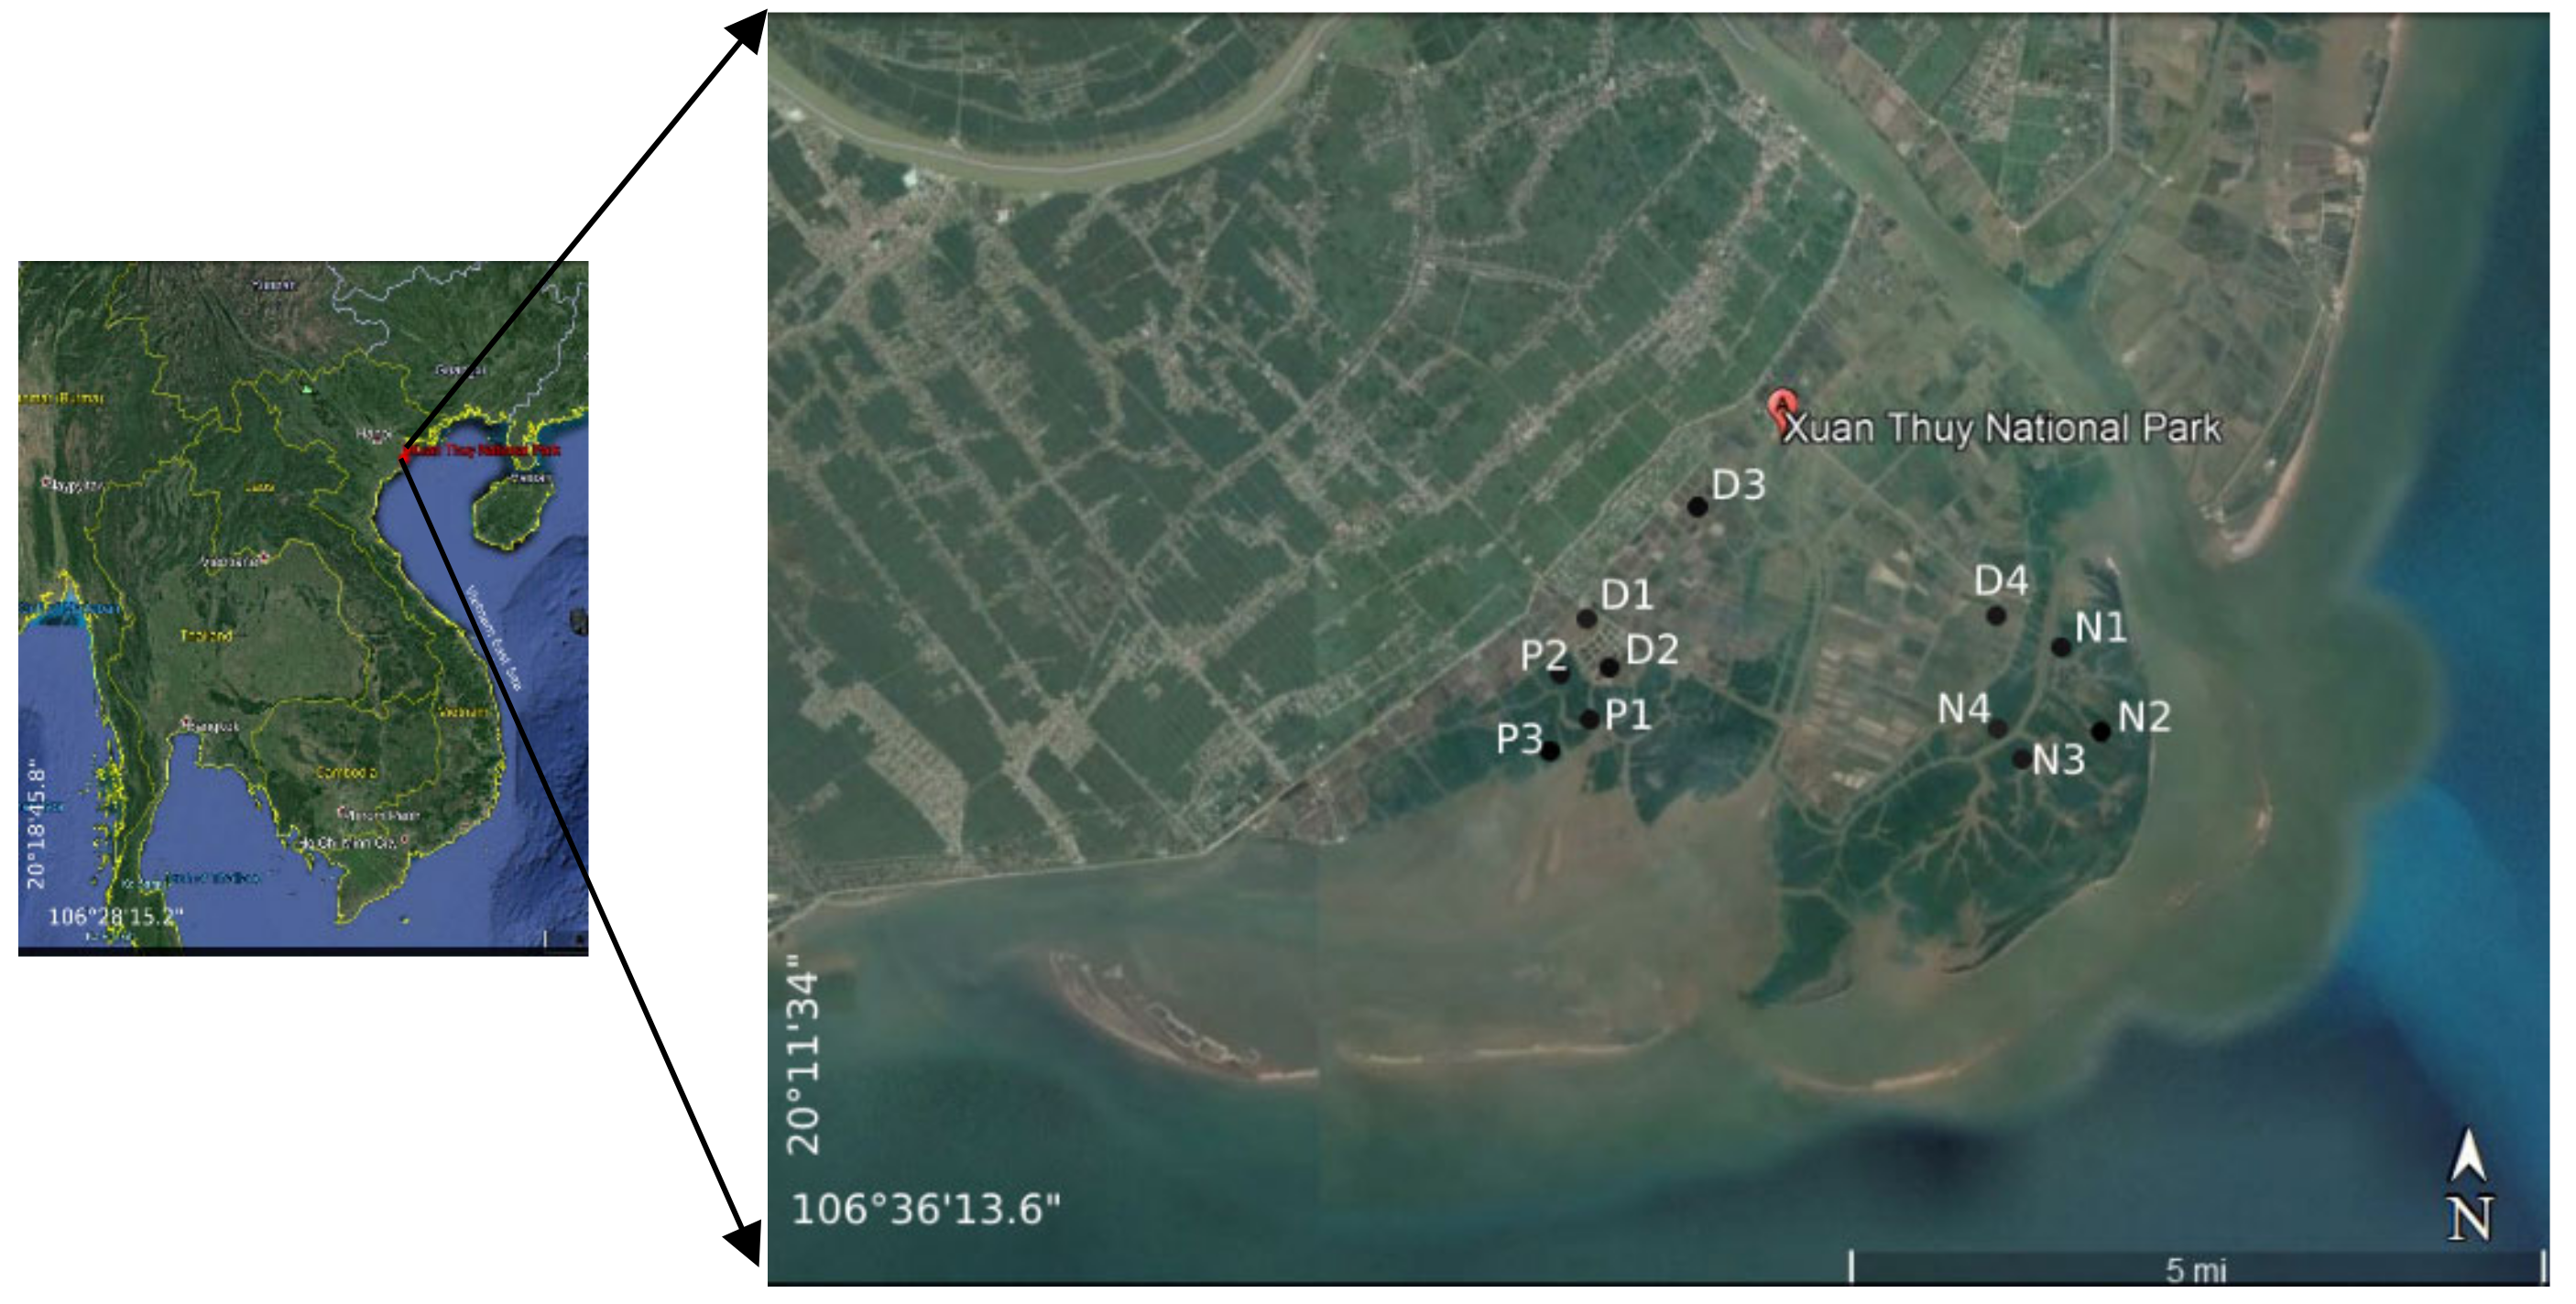
2.1. Selection of Study Site

Xuan Thuy mangrove is located in the Red River Basin, Northeast Vietnam, and is a UNESCO biosphere reserve, typical of coastal ecosystems. It was the first place in Southeast Asia to be recognized as a Ramsar site in 1989 and was designed as a national park in 2003. The site is located at an estuary location—where the sedimentation rate and rate of an alluvial annual average of the intertidal flats are about several 10s of meters. The coastal estuary mudflats are also a source of valuable seafood such as shrimp, crabs, fish, clams and other species, as well as migrations for some birds, including several species that are endangered (black-faced spoonbill) have been recorded in the IUCN Red Book. Xuan Thuy mangrove buffer zone is used for aquaculture and agricultural production, providing high income for local people. The natural region is characterized by plants such as A. corniculatum, S. caseolaris, and the planted area is dominated by K. obovata and K. candel [26].
The Xuan Thuy mangrove is an estuarine wetland affected by tides, water quality upstream of the Red River and several sources of pollution in neighboring localities. The Red River is an important source of water for the population in the north of Vietnam but also a large reservoir for sewage flows into from some localities, in which agricultural cultivation, urban wastewater, etc., degrade the amount of water, especially in the delta, including the mangrove forest Xuan Thuy. In addition, human activities in the buffer zone, such as agricultural cultivation, aquaculture and fishing, etc., have been causing significant impacts on natural ecological balance, as well as the quality of soil environment and regional water. Changing land-use patterns in the basin also leads to increased emissions of pollutants into the coastal environment [25]. In the region, increased aquaculture activities have led to deforestation as well as accelerated mangrove degradation. For example, regional reports show that aquaculture ponds have increased in recent times by 660.9% [27], a major type of extensive and semi-natural pond.
Field sampling was conducted in Xuan Thuy mangrove (Figure 1). The sampling frequency was twice per year during the dry and wet seasons in 2017 and 2018. A total of 11 sampling sites were selected in different locations in the three mangrove areas of the National Park: (1) natural mangroves: sampling sites N1–N4 were chosen within the most developed and far from anthropogenic activity; (2) deforested mangroves have been destroyed sites 5 years ago: sampling sites D1–D4 were characterized by aquaculture and rice farming activities; planted mangroves 3- and 7-year-old: sampling sites P1–P3. Water samples were collected at 20 cm below the surface with a Van Dorn bottle (2.5 L) to assess DOC and POC concentrations, and nutrient abundance. Sediments (20 cm) were collected to estimate total C and N. Samples were immediately put in the plastic bags (for sediment samples) or in the amber glass bottles (for water samples), kept in an icebox and transported to the laboratory.

2.2. Analytical Methods

We use TOA WQC-22A (Japan) to measure total suspended solids (TSS); and conductivity meter (Hach, USA) to determine the conductivity (Cond) in the field. In the laboratory, the total nitrogen (% N) in samples was analyzed by Kjeldahl and total phosphorus (% P) was determined by vanadomolybdate method. We use spectrophotometric methods on a Drell 2800 (HACH, USA) to determine the nutrients (N, P) [28].
To estimate the particulate organic carbon (POC) content, we used a Whatman GF/F fiberglass filter (dried at 550 °C for 4 h) [29]. Dissolved organic carbon (DOC) was determined on the filtrate using a Shimadzu TOC-VE analyzer after acidification of 30 mL with 35 µL 85% H3PO4. Chlorophyll a (Chla) concentration was measured in 90% of acetone extract using Jasco V-630 spectrophotometer (JASCO Corporation, Tokyo, Japan), then Jeffrey and Humphrey’s concentration formula was applied [30].
The electric oven was used to dry (at 60 °C) the sediment and particulate organic matter (POM) samples for 48 h. CHN analyzer was used to measure total C and N [31].

2.3. Biodegradability

The evaluation of the biodegradation process of OC was evaluated by in situ incubations at the sampling points: natural mangrove forest, mangrove planted, and mangrove deforested overtime during the dry and wet seasons in 2017 and 2018. At each sampling point, we collected 1000 mL of samples in an amber glass bottle. The experiment was carried out in the dark and lasted for 40 days (960 h). Sample bottles were placed at a constant, and initial in situ temperature. To determine the biodegradability of organic carbon, incubation samples were collected at different times (0 h, 18 h, 32 h, 120 h and 960 h). The calculation method was based on procedures by Garnier et al. [29] and Servais et al. [32]. All experiments were carried out in three multiple repetitions with subsequent statistical.

2.4. Statistical Analyses

In this study, we used XLSTAT software (Addinsoft™, Paris, France, 2014) for statistical analysis (Pearson’s, Wilcoxon’s, and the Kruskal–Wallace test). Significance has been defined as p < 0.05.

3. Results and Discussion

3.1. Chemical and Physical Parameters

The mean values of the chemical and physical characteristics and nutrient concentration in the sampled locations were shown in Table 1. At deforested mangrove, temperature, the pH and Chla were 23.8–30.9 °C, 7.1–7.9, and 0.13–1.23 µgL−1, respectively. At planted mangroves, the seawater temperature, pH and Chla ranged from 14.0 to 30.7 °C, 7.0 to 7.7, and 0.5 to 4.75 µgL−1, respectively. At natural mangroves, the seawater temperature, pH and Chla ranged from 13.6 to 30.7 °C, 7.0 to 8.1, and 1.04 to 8.6 µgL−1, respectively. We observed no significant seasonal differences for these parameters, however, the sampling sites were significantly different (Kruskal–Wallis test, p < 0.05). For example, the pH value in the deforested mangrove area (7.6 ± 0.1) is higher than in the natural mangrove forest (7.0 ± 0.2), which is clearly the effect of deforestation that has been reported [33]. The dynamics of pH in the surface water might be affected by fertilization, flooding regime, climatic scenarios (e.g., temperature and CO2), and other metabolic processes. The deforested mangrove forest is characterized by aquaculture and rice farming activities. In this region, pH rises might be because utilizing the inorganic fertilizer in aquaculture (whereby some of the nutrients are removed by alum, and pH increased quickly). Besides, it may be attributed to this region receiving bright sunshine and having warm water temperatures, conditions strongly favor the development of a biological community that produces a high pH (whereby the photosynthetic activities consume dissolved carbon dioxide).
The deforested site recorded significantly higher temperatures (26.8 °C ± 5.5) than the natural and planted mangroves sites (23.6 °C ± 5.7 and 23.3 °C ± 5.8, respectively). Due to lack of or reduced canopy cover in the degraded sites explains why the temperature in this area is always higher because of the high evaporation. In contrast, in natural and planted mangroves with high canopy cover, favorable conditions are found for the growth of phytoplankton and microorganisms in sediment, which leads to high chlorophyll has been observed (Table 1). Measurement nutrients (nitrate, nitrite, and phosphate) in the water surface from all the three sampling stations revealed a differential pattern for these nutrient species. In planted mangroves, the highest amount of NO3 was detected (0.13 ± 0.08 mgL−1) whereas a comparatively lower concentration of NO3 was estimated both in natural and deforested mangroves (0.10 ± 0.07 mgL−1 and 0.07 ± 0.05 mgL−1, respectively) (Table 1). In contrast, NO2- concentration was found highest in deforested mangrove whereas a comparatively low concentration was detected in natural and planted mangroves (0.02 ± 0.02 mgL−1 and 0.03 ± 0.03 mgL−1, respectively) (Table 1). The PO42− concentration ranged from 0.002 mgL−1 in deforested mangrove during the dry season to 0.23 mgL−1 in planted mangroves during the rainy season. The highest mean of PO42− amount was detected (0.06 ± 0.07 mgL−1) in planted mangroves. This is consistent with an estimate of large nutrients that have been related to anthropogenic activities including aquaculture and agricultural wastes [34,35,36]. In addition, nutrient fluxes will be supplemented from layers of degrading leaf litter in the reforestation areas [33].

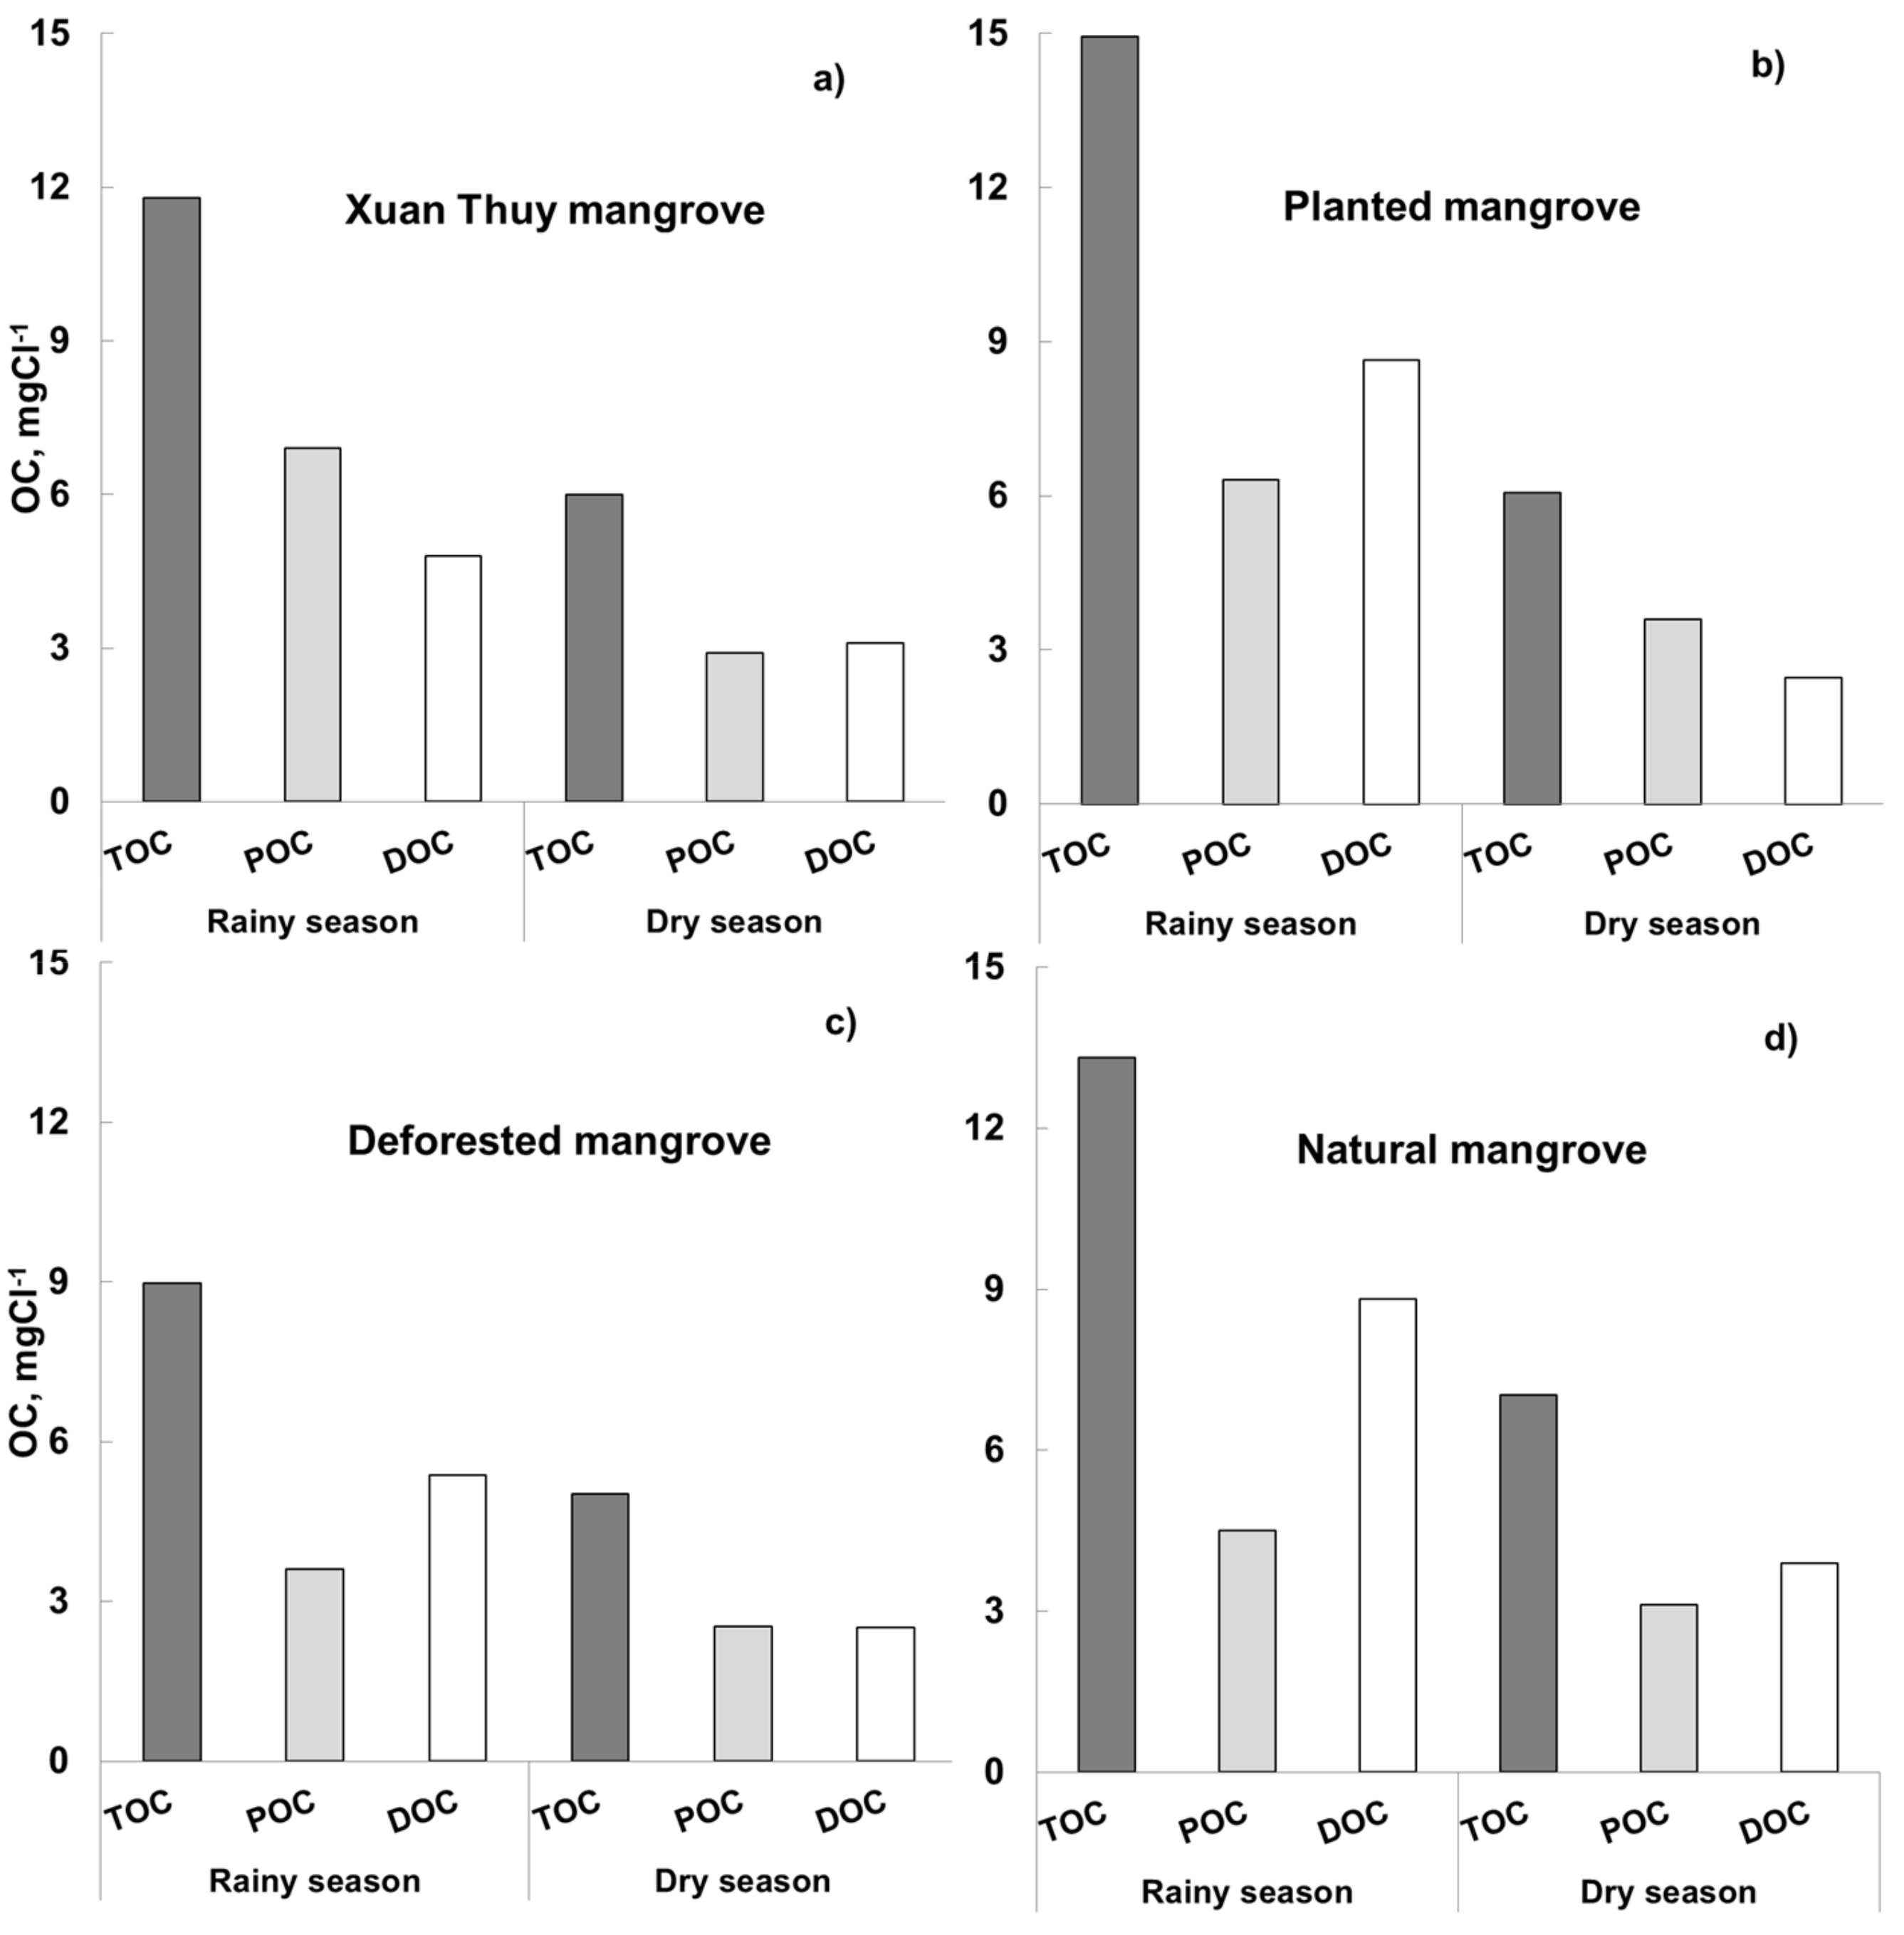
3.2. Organic Carbon Concentrations

The concentration of DOC in the deforested, planted and natural mangroves varied from 2.2 to 8.1; 2.3 to 10.8 and 1.8 to 13.2 mgCL−1, respectively, during the sampling period (Table 2) was higher than observed by Wang et al. [37] in the Gulf of Mexico (0.72–1.20 mgCL−1), similar to DOC values in the Florida Everglades mangrove (about 1.7 to 17.9 mgCL−1; [38]), but still within the lower value range in the southeast China mangrove (between 6.7 and 110.5 mgCL−1; [39]). The highest DOC concentration (13.2 mgCL−1) in natural mangroves reflects the fact that mangrove litter plays an important role in controlling DOC concentrations [40]. Mean DOC concentration of the entire Xuan Thuy mangrove in the rainy season (4.8 ± 3.0 mgCL−1) was significantly higher than those in the dry season (3.1 ± 0.9 mgCL−1) (Figure 2a), similar to the high discharge during the rainy season and indicates that mangrove inclusion has a significant effect on the distribution of DOC [41]. For example, significant increases in DOC concentration were observed in Ishigaki Island following heavy rain with typhoons [42]. However, the magnitude of DOC variation differs with the region. For example, the mean DOC concentration in surface waters increases from 3.9 ± 1.4 mgCL−1 in dry season to 8.8 ± 6.2 mgCL−1 in the rainy season in the natural mangroves (Figure 2d). In contrast, in deforested mangroves with lower value increases from 2.5 ± 1.0 mgCL−1 in dry season to 5.4 ± 2.5 mgCL−1 in the rainy season (Figure 2c). This spatial variation may be affected by high fresh nutrients inputs during each region.
Mean POC concentrations have significant seasonal variations (rainy season: 6.9 ± 1.6 mgCL−1; dry season: 2.9 ± 0.4 mgCL−1, Figure 2a). This pattern was similar in all regions. Indeed, mean POC was higher during the rainy season (3.6 ± 2.3; 6.3 ± 5.2; 4.5 ± 3.1 mgCL−1 in the deforested, planted and natural mangroves, respectively) compared to the dry season (2.5 ± 1.4; 3.6 ± 2.5; 3.1 ± 2.8 mgCL−1 in the deforested, planted and natural mangroves, respectively) (Figure 2b–d). POC showed the highest mean concentration in planted mangroves (7.9 ± 12.9 mgCL−1, Table 2). In the Xuan Thuy mangrove, we observed a positive relationship between TSS and both POC (r2 was 0.993; p < 0.0001) and DOC (r2 was 0.942; p < 0.0001), suggesting that erosion and resuspension increase the delivery of organic carbon at the mangroves [12,43]. Total Organic Carbon (TOC) concentrations ranged from 4.1 to 55.2 mgCL−1, with a mean value of 9.9 mgCL−1. The highest mean TOC concentration peak corresponded to the rainy season in planted mangroves (Table 2, Figure 2b).
During the rainy season, natural mangroves had the highest DOC/POC ratio of 3.0, whereas planted mangroves showed the lowest DOC/POC ratio of 0.24 during the dry season. The average DOC/POC ratio in the Xuan Thuy mangrove for the entire dataset over the three stations were 1.14 ± 0.06, which is highest than in the natural mangroves (3.0), but similar to the Gautami Godavari mangrove (Andhra Pradesh, India) (1.9 ± 0.7) [44]. The means for the dry season and rainy season were 1.06 ± 0.30 and 1.19 ± 0.69, respectively. DOC/POC in the present study (from 0.24 to 3.0) are relatively low compared to those reported for mangrove in French Guiana (South America) (range 4.5 to 37, [45]), in Gazi Bay (Kenya) (range 1.8 to 14.2, [46]). Therefore, compared to other mangrove forests, Xuan Thuy mangrove forest seems to receive less DOC input. However, in some other mangrove systems, the authors also report that the DOC/POC ratio was very high indicates that DOC dominance [40,47,48,49]. In our study, mean DOC comprised 58 ± 9% and 55 ± 8% of TOC in deforested and natural mangroves, respectively, with mean DOC/POC ratios were 1.3 ± 0.7 and 1.2 ± 0.6.
In the Xuan Thuy mangrove, the total organic carbon content (% TOC) of the suspended matter ranged from 0.24 to 6.40 %, the average was 1.90 ± 1.60%, less than the earlier reports in the mangroves of Gazi Bay, Kenya (ranging from 0.6 to 14.6%, the average was 5.6 ± 4.5%, [50]). Our results were similar to those observed in the Xuan Thuy mangrove (mean 1.45 ± 0.45%, [25]). In addition, this result is similar to the characteristics of sediments from mangrove in French Guiana (South America) (1.05 ± 0.4%, [46]). The TOC content also varied significantly among forest types (Table 3), consistent with previous studies [25,37]. This difference could be due to vegetation characteristics and tidal flushing on the erosion [18].

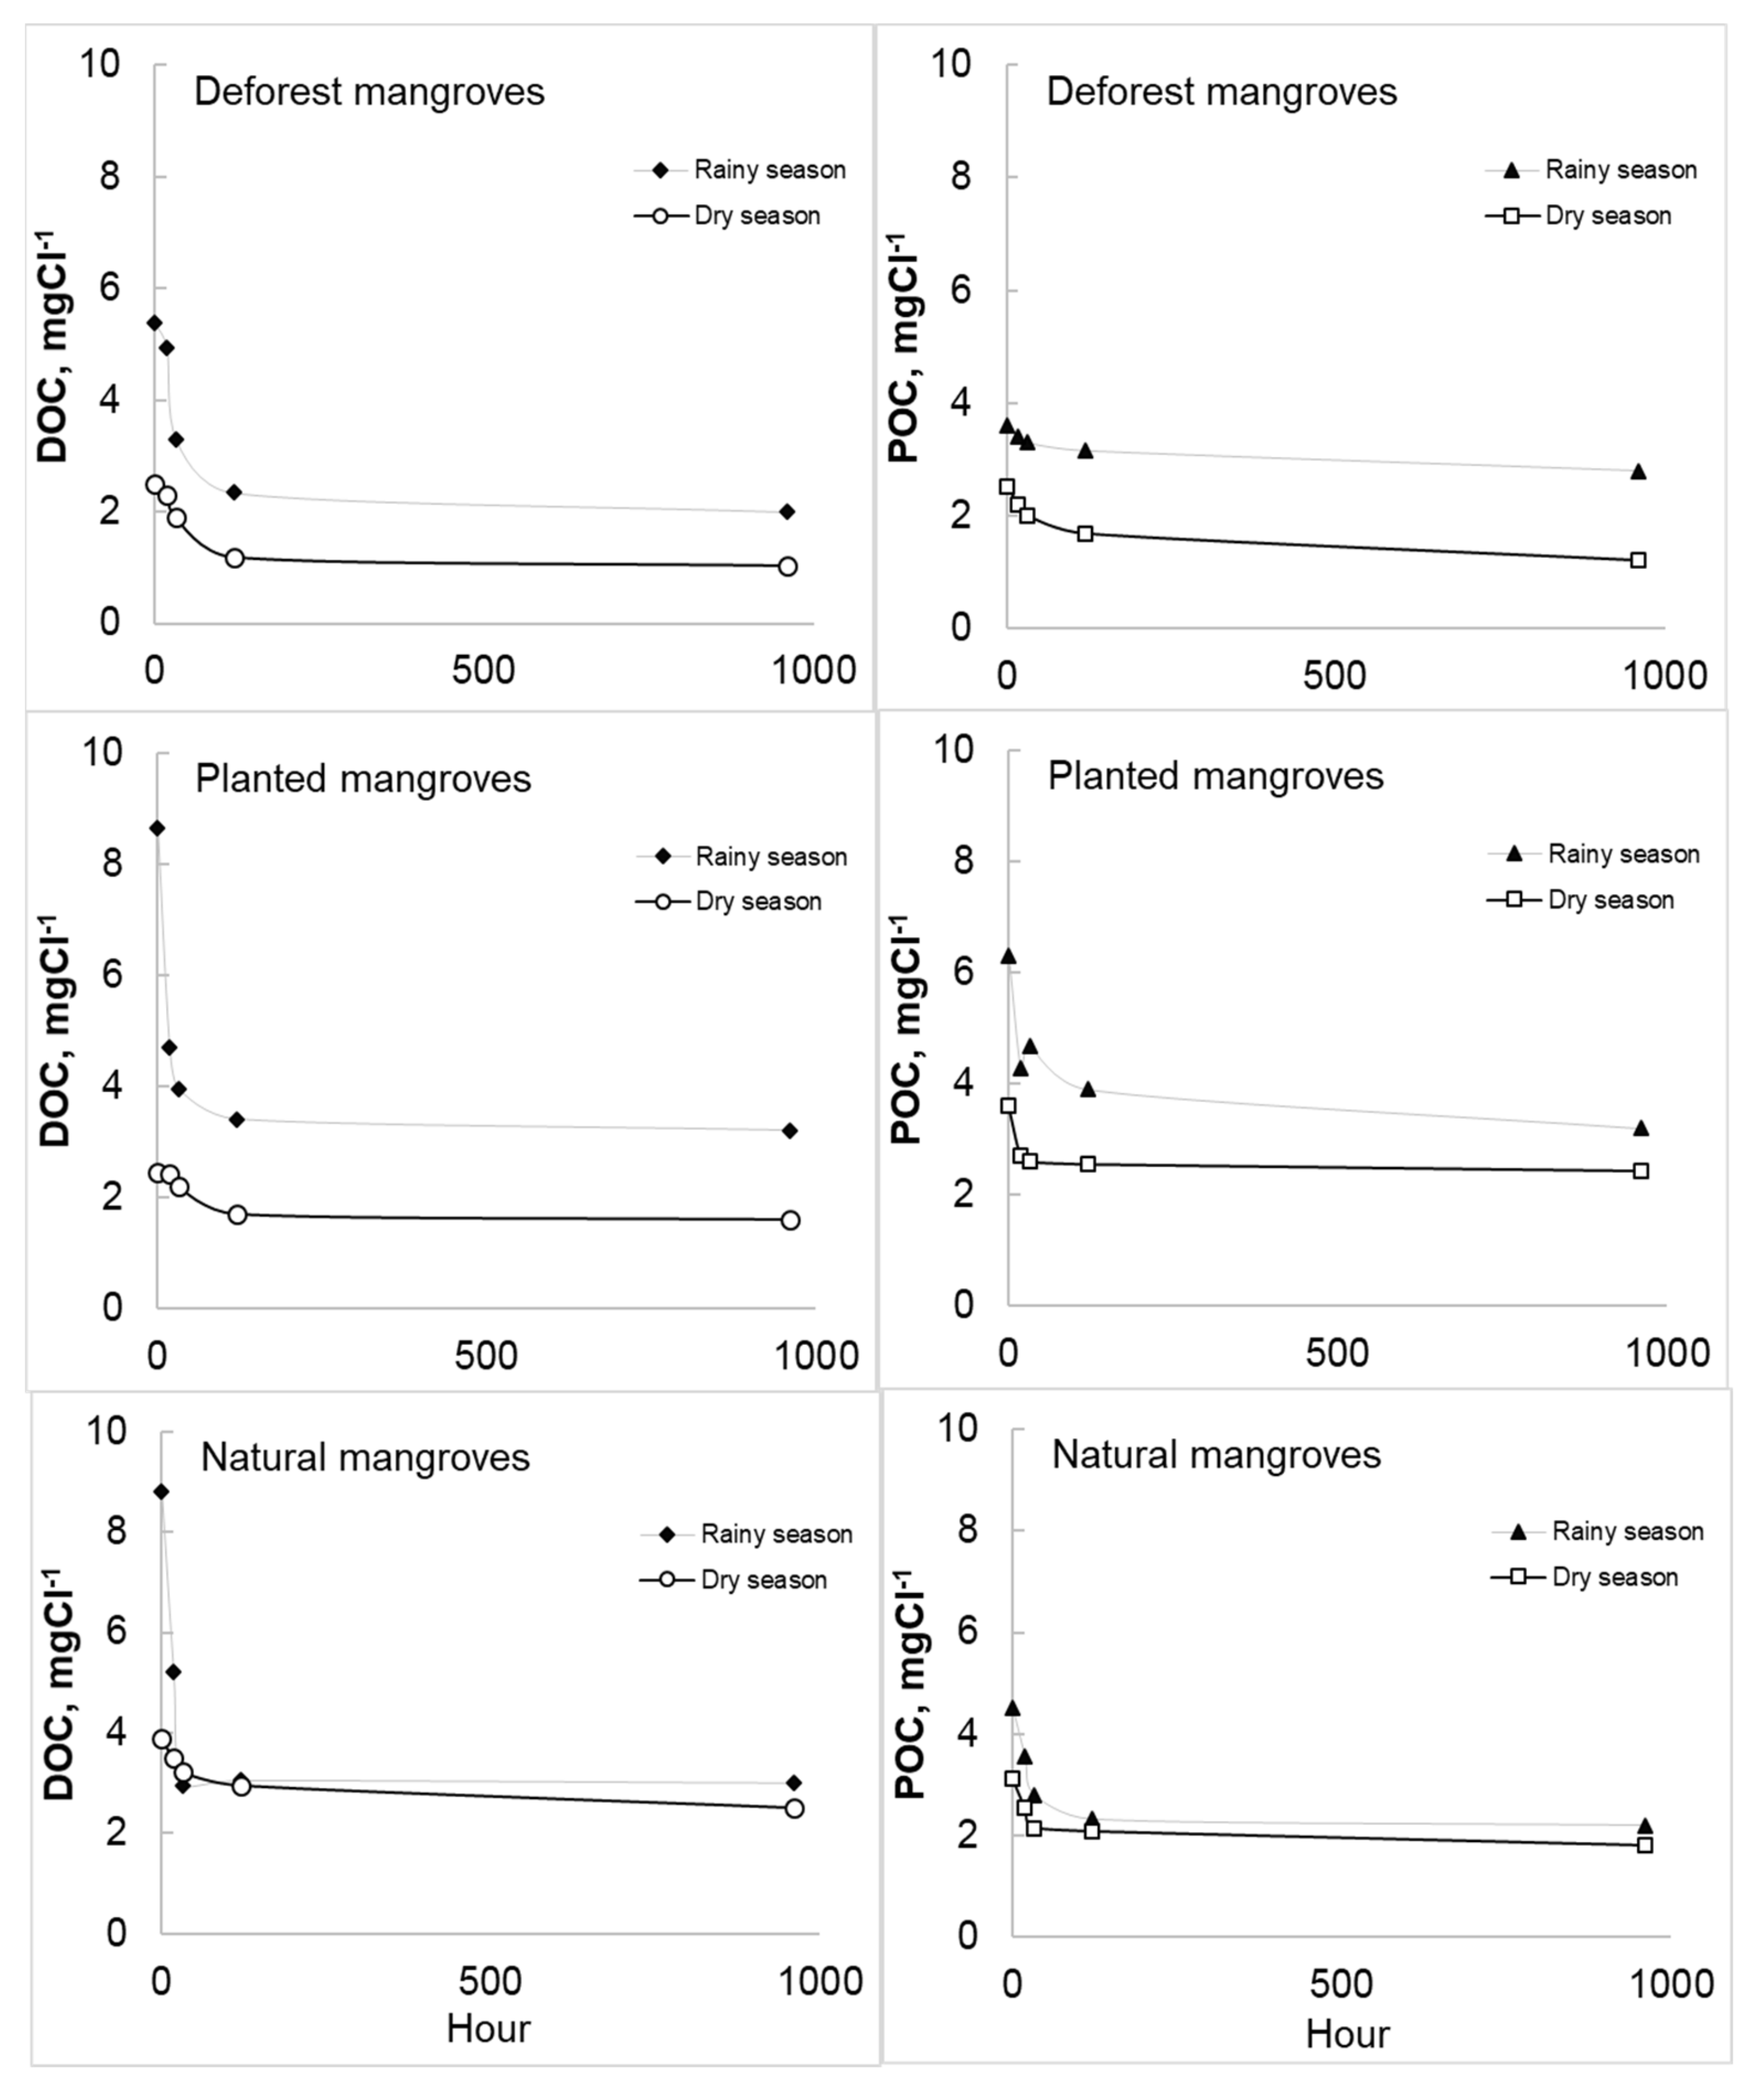
3.3. Biodegradable OC

Figure 3 shows the results of the initial concentrations of DOC and POC decreased over the 960 h incubation period at different sampling locations. In the rainy season (July), the mean concentration of DOC showed rapidly decreased from 5.38 to 2.00 mgCL−1; from 8.65 to 3.20 mgCL−1; from 8.81 to 3.00 mgCL−1 during 960 h in the deforested, planted and natural mangroves, respectively. Similarly, there was a rapidly decrease in the mean POC concentration during 960 h, from 3.60 to 2.80 mgCL−1; from 6.30 to 3.20 mgCL−1; from 4.50 to 2.20 mgCL−1 in the deforested, planted and natural mangroves, respectively (Figure 3). In contrast, there was a slower decrease in concentrations for both DOC and POC in the dry season (January) during 960 h. For example, the values have been decreased from 2.50 to 1.04 mgCL−1; from 2.461 to 1.60 mgCL−1; from 3.90 to 2.50 mgCL−1 for DOC concentrations; and from 2.52 to 1.20 mgCL−1; from 3.60 to 2.44 mgCL−1; from 3.12 to 1.80 mgCL−1 for POC concentrations in the deforested, planted and natural mangroves, respectively (Figure 3). The results show that, in Xuan Thuy mangrove forest, OM is biodegraded more in the rainy season than in the dry season. Similar seasonal patterns were observed in the wetlands [51,52,53].
The mean BTOC and BDOC concentrations were higher in the rainy season than the dry season at all sampling locations. Indeed, the mean values of BDOC showed in the deforested, planted and natural mangroves in rainy season were 3.16 ± 1.21 mgCL−1, 2.94 ± 3.06 mgCL−1, 3.19 ± 3.64 mgCL−1, respectively, and, while during dry season, the average was about 1.44 ± 0.02 mgCL−1, 1.93 ± 1.51 mgCL−1, 2.61 ± 1.06 mgCL−1, respectively. For the mean biodegradable TOC, differences between two seasons for the deforested, planted and natural mangroves 5.37 ± 3.24 mgCL−1, 10.60 ± 15.54 mgCL−1, 9.46 ± 15.04 mgCL−1, respectively, rainy season; 2.89 ± 1.03 mgCL−1, 3.29 ± 1.12 mgCL−1, 1.91 ± 0.63 mgCL−1, respectively, in dry season.
The organic carbon concentration and respective percentage of biodegradables are presented in Table 2, during the 40 days in the Xuan Thuy mangrove ecosystem. The mean percentage of biodegradable for 40 days was about 47 ± 15% of BTOC, 45 ± 17% of BDOC, and 48 ± 18% of BPOC. Our estimates are within the range of other incubation studies. For example, Satoh and Abe [54] observed a value of 40% considering an average initial DOC in wetland Japanese. Mann and Wetzel [55] found in freshwater marshes an average value of about 45%, but higher than seawater (values of 20 to 35%, [56]). In our study, a rapid OM concentration decrease to biodegradation suggests in mangrove creeks most of the labile and easily degradable proteins are typical for OM materials [39] in the Xuan Thuy mangrove. The highest mean BTOC concentration in the planted mangrove (Table 2) could be due to mangrove litter having been found to leach a significant fraction of organic matter during the initial stages of degradation [18,57,58].

3.4. Origin of Mangrove Organic Carbon

As partly reported in previous studies, several authors use the POC/Chla ratio [59,60] and C/N ratio [29,61] to distinguish the sources of OM in coastal or open ocean waters. In our study, the average TN content was 0.30 ± 0.44%, 0.51 ± 0.61%, 0.30 ± 0.37% in deforested, planted, and natural mangroves, respectively (Table 2). The lower average TP contents for deforested, planted, and natural mangroves were 0.12 ± 0.04%, 0.13 ± 0.04%, 0.14 ± 0.04%, respectively, no significant differences among forest types (Table 3). The C/N ranged from 0.4 to 25.9, with an average of 10.2 ± 8.4. The mean C/N ratios were drastically different depends on the types of mangroves; the highest in natural mangroves (16.9 ± 8.1), then in planted mangrove (14.3 ± 9.5), and the lowest in deforested mangroves (8.4 ± 5.5) (Table 3). This may be caused by the contribution of mangrove litter in natural and planted mangroves was the main cause that controls the formation of organic carbon [57,62]. This result is also shown to be consistent by Tue et al. [25], where more than 80% of organic carbon has contributed to their sediments in these areas. In contrast, the C/N ratio is considered to be close to phytoplankton [63]) due to increased aquaculture activities [64] leading to mangrove degradation.
Furthermore, in this study, the high POC/Chla ratio at most of the sites (data not show) confirms that terrestrial plants were the major contributor to the mangrove OM, which is confirmed by the high C/N ratios in natural and planted mangroves. However, across the monitoring period at deforested mangroves, the samples did not show significant correlations (Spearman’s) in POC and Chla contents, suggesting that POC in this site was from various sources. Indeed, the lowest C/N ratios and great variation of POC/Chla suggested that a hybrid of phytoplankton and terrestrial organic matter were organic carbon sources [65,66].

4. Conclusions

Biodegradable and seasonal variation of organic carbon in different mangroves were studied in Xuan Thuy mangrove. The results show that OC concentrations in the rainy season were significantly higher than those in the dry season, as well as OM is biodegraded more in the rainy season than in the dry season. In our study, a rapid OM concentration decrease to biodegradation suggests most of the labile and easily degradable proteins are typical for OM materials in the Xuan Thuy mangrove creeks. The distribution of organic carbon indicated the DOC predominance is more than POC in deforested and natural mangroves, respectively, with mean DOC/POC ratios of 1.3 ± 0.7 and 1.2 ± 0.6. High POC/Chl and low C/N ratios are indicative that a hybrid of phytoplankton and terrestrial organic matter were organic carbon sources in natural and planted mangroves. In contrast, an increase in aquaculture activities and degradation of mangroves resulted in an average C/N ratio of 8.4 ± 5.5, indicating that in this site the main sedimentary organic carbon source was from phytoplankton. The results of the article clearly show signs of human impact (for example, deforestation) affecting the mangrove ecosystem.
We admit our explanations for the biodegradable organic carbon described above only partially reflected the total degradation potential, including both biodegradation and photodegradation. Thus, our future studies look forward to complementing photodegradation experiments on the types of mangrove forests and different seasons.

Author Contributions

T.M.H.N.—Data curation; Project administration; Writing—original draft; Writing—review and editing; T.P.Q.L.—Data curation, Writing—Original Draft; V.V.H.—Software; Supervision; C.T.V.—Writing—Original Draft. All authors have read and agreed to the published version of the manuscript.

Funding

The authors would like to thank the financial supports of the Vietnam’s National Foundation for Science and Technology Development (NAFOSTED-Vietnam), 105.99-2016.10 project, The World Academy of Sciences (TWAS), for the advancement of science in developing countries (16-096 RG/CHE/AS_I project).

Institutional Review Board Statement

Not applicable.

Informed Consent Statement

Not applicable.

Data Availability Statement

Data available upon request from corresponding author.

Conflicts of Interest

The authors declare no conflict of interest.

References

  1. Hamilton, S.E.; Casey, D. Creation of a high spatio-temporal resolution global database of continuous mangrove forest cover for the 21st century (CGMFC-21). Glob. Ecol. Biogeogr. 2016, 25, 729–738. [Google Scholar] [CrossRef]
  2. Bouillon, S.; Connolly, R.; Lee, S.Y. Organic matter exchange and cycling in mangrove ecosystems: Recent insights from stable isotope studies. J. Sea Res. 2008, 59, 44–58. [Google Scholar] [CrossRef] [Green Version]
  3. Worthington, T.; Spalding, M. Mangrove Restoration Potential A global map highlighting a critical opportunity. Geol. Surv. 2018, pp36. [Google Scholar] [CrossRef]
  4. Grellier, S.; Janeau, J.L.; Nhon, D.H.; Cuc, N.T.K.; Quynh, L.T.P.; Thao, P.T.T.; Trang, T.T.N.; Marchand, C. Changes in soil characteristics and C dynamics after mangrove clearing (Vietnam). Sci. Total Environ. 2017, 593, 654–663. [Google Scholar] [CrossRef]
  5. Dittmar, T.; Hertkorn, N.; Kattner, G.; Lara, R.J. Mangroves, a major source of dissolved organic carbon to the oceans. Glob. Biogeochem. Cycles 2006, 20, GB1012. [Google Scholar] [CrossRef]
  6. Chong, V.C.; Low, C.B.; Ichikawa, T. Contribution of mangrove detritus to juvenile prawn nutrition: A dual stable isotope study in a Malaysian mangrove forest. Mar. Biol. 2001, 138, 77–86. [Google Scholar] [CrossRef]
  7. Sidik, F.; Lovelock, C.E. CO2 efflux from shrimp ponds in Indonesia. PLoS ONE 2013, 8, e66329. [Google Scholar] [CrossRef] [Green Version]
  8. Ellison, A.M. Mangrove restoration: Do we know enough? Restor. Ecol. 2000, 8, 219–229. [Google Scholar] [CrossRef]
  9. Donato, D.C.; Kauffman, J.B.; Murdiyarso, D.; Kurnianto, S.; Stidham, M.; Kanninen, M. Mangroves among the most carbon-rich forests in the tropics. Nat. Geosci. 2011, 4, 293–297. [Google Scholar] [CrossRef]
  10. Mcleod, E.; Chmura, G.L.; Bouillon, S.; Salm, R.; Björk, M.; Duarte, C.M. A blueprint for blue carbon: Towards an improved understanding of the role of vegetated coastal habitats in sequestering CO2. Front. Ecol. Environ. 2011, 9, 552–560. [Google Scholar] [CrossRef] [Green Version]
  11. Lee, H.-M.; Henze, D.K.; Alexander, B.; Murray, L.T. Investigating the sensitivity of surface-level nitrate seasonality in Antarctica to primary sources using a global model. Atmos. Environ. 2014, 89, 757–767. [Google Scholar] [CrossRef]
  12. Sánchez-Núñez, D.A.; Bernal, G.; Pineda, J.E.M. The relative role of mangroves on wave erosion mitigation and sediment properties. Estuaries Coasts 2019, 42, 2124–2138. [Google Scholar] [CrossRef]
  13. Breithaupt, J.L.; Smoak, J.M.; Smith, T.J.; Sanders, C.J. Temporal variability of carbon and nutrient burial, sediment accretion, and mass accumulation over the past century in a carbonate platform mangrove forest of the Florida Everglades. J. Geophys. Res. Biogeosci. 2014, 119, 2032–2048. [Google Scholar] [CrossRef] [Green Version]
  14. Geraei, D.S.; Hojati, S.; Landi, A.; Cano, A.F. Total and labile forms of soil organic carbon as affected by land use change in southwestern Iran. Geoderma Reg. 2016, 7, 29–37. [Google Scholar] [CrossRef]
  15. Boone Kauffman, J.; Arifanti, V.B.; Hernandez Trejo, H.; del Carmen Jesús García, M.; Norfolk, J.; Cifuentes, M.; Hadriyanto, D.; Murdiyarso, D. The jumbo carbon footprint of a shrimp: Carbon losses from mangrove deforestation. Front. Ecol. Environ. 2017, 15, 183–188. [Google Scholar] [CrossRef]
  16. Elwin, A.; Bukoski, J.J.; Jintana, V.; Robinson, E.J.Z.; Clark, J.M. Preservation and recovery of mangrove ecosystem carbon stocks in abandoned shrimp ponds. Sci. Rep. 2019, 9, 18275. [Google Scholar] [CrossRef] [Green Version]
  17. Bhomia, R.K.; Kauffman, J.B.; McFadden, T.N. Ecosystem carbon stocks of mangrove forests along the Pacific and Caribbean coasts of Honduras. Wetl. Ecol. Manag. 2016, 24, 187–201. [Google Scholar] [CrossRef]
  18. Marchand, C.; Lallier-Verges, E.; Baltzer, F. The composition of sedimentary organic matter in relation to the dynamic features of a mangrove-fringed coast in French Guiana. Estuar. Coast. Shelf Sci. 2003, 56, 119–130. [Google Scholar] [CrossRef] [Green Version]
  19. Lønborg, C.; Álvarez-Salgado, X.A.; Davidson, K.; Miller, A.E.J. Production of bioavailable and refractory dissolved organic matter by coastal heterotrophic microbial populations. Estuar. Coast. Shelf Sci. 2009, 82, 682–688. [Google Scholar] [CrossRef] [Green Version]
  20. Kusumaningtyas, M.A.; Hutahaean, A.A.; Fischer, H.W.; Pérez-Mayo, M.; Ransby, D.; Jennerjahn, T.C. Variability in the organic carbon stocks, sources, and accumulation rates of indonesian mangrove ecosystems. Estuar. Coast. Shelf Sci. 2019, 218, 310–323. [Google Scholar] [CrossRef]
  21. Pendleton, L.; Donato, D.C.; Murray, B.C.; Crooks, S.; Jenkins, W.A.; Sifleet, S.; Craft, C.; Fourqurean, J.W.; Kauffman, J.B.; Marba, N.; et al. Estimating global “blue carbon” emissions from conversion and degradation of vegetated coastal ecosystems. PLoS ONE 2012, 7, e43542. [Google Scholar] [CrossRef] [PubMed] [Green Version]
  22. Sharma, S.K.; Maeng, S.K.; Nam, S.N. Characterization Tools for Differentiating Natural Organic Matter from Effluent Organic Matter. In Treatise on Water Science; Elsevier: Amsterdam, The Netherlands, 2011; pp. 417–427. [Google Scholar] [CrossRef]
  23. Munster, U. Concentrations and fluxes of organic substrates in the aquatic environment. J. Gen. Mol. Microbiol. 1993, 63, 243–274. [Google Scholar]
  24. Alongi, D.M. Carbon payments for mangrove conservation: Ecosystem constraints and uncertainties of sequestration potential. Environ. Sci. Policy 2011, 14, 462–470. [Google Scholar] [CrossRef]
  25. Tue, N.T.; Ngoc, N.T.; Quy, T.D.; Hamaoka, H.; Nhuan, M.T.; Omori, K. A cross-system analysis of sedimentary organic carbon in the mangrove ecosystems of Xuan Thuy National Park, Vietnam. J. Sea Res. 2012, 67, 69–76. [Google Scholar] [CrossRef]
  26. Hong, P.N.; Tan, D.V.; Hien, V.T.; Thuy, T.V. Characteristics of Mangrove Vegetation in Giao Thuy District. In Mangrove Ecosystems in the Red River Coastal Zone: Biodiversity, Ecology, Socio-Economics, Management, and Education; Hong, P.N., Ed.; Agricultural Publishing House: Hanoi, China, 2004; pp. 75–85. [Google Scholar]
  27. Dao, M.S.; Nguyen, D.T.; Nguyen, Q.H.; Nguyen, V.Q. The environmental impact assessment of shrimp farming development in the core zone of Xuan Thuy National Park (Nam Dinh, Vietnam). 2008, p. 80. Available online: https://www.researchgate.net/publication/274712790_The_environmental_impact_assessment_of_shrimp_farming_development_in_the_core_zone_of_Xuan_Thuy_National_Park_Nam_Dinh_Vietnam?channel=doi&linkId=552740a20cf229e6d636142a&showFulltext=true (accessed on 24 January 2022).
  28. APHA. Standard Methods for the Examination of Water and Waste Water, 22nd ed.; American Public Health Association, American Water Works Association, Water Environment Federation: Washington, DC, USA, 2012. [Google Scholar]
  29. Garnier, J.; Beusen, A.; Thieu, V.; Billen, G.; Bouwman, L. N:P:Si nutrient export ratios and ecological consequences in coastal seas evaluated by the ICEP approach. Glob. Biogeochem. Cycles 2010, 24, GB0A05. [Google Scholar] [CrossRef]
  30. Jeffrey, S.W.; Humphrey, G.F. New spectrophotometric equations for determining chlorophylls a, b, c and c2 in higher plants, algae and natural phytoplankton. Biochem. Physiol. Pflanz. 1975, 167, 191–194. [Google Scholar] [CrossRef]
  31. Middelburg, J.J.; Barranguet, C.; Boschker, H.T.S.; Herman, P.M.J.; Moens, T.; Heip, C.H.R. The fate of inter-tidal microphytobenthos carbon: An in situ 13C-labeling study. Limnol. Oceanogr. 2000, 45, 1224–1234. [Google Scholar] [CrossRef] [Green Version]
  32. Servais, P.; Laurent, P.; Billen, G.; Gatel, D. Development of a model of BDOC and bacterial biomass fluctuations in distribution systems. Rev. Sci. Eau 1995, 8, 427–462. [Google Scholar]
  33. Bosire, J.O.; Dahdouh-Guebas, F.; Kairo, J.G.; Koedam, N. Colonization of non-planted mangrove species into restored mangrove stands in Gazi Bay, Kenya. Aquat. Bot. 2003, 76, 267–279. [Google Scholar] [CrossRef]
  34. Szuster, B.W.; Flaherty, M. Cumulative environmental effects of low salinity shrimp farming in Thailand. Impact Assess. Proj. Apprais. 2002, 20, 189–200. [Google Scholar] [CrossRef]
  35. Costanzo, S.D.; O’Donohue, M.J.; Dennison, W.C. Assessing the influence and distribution of shrimp pond effluent in a tidal mangrove creek in north-east Australia. Mar. Pollut. Bull. 2004, 48, 514–525. [Google Scholar] [CrossRef]
  36. Lin, D.T.; Fong, P. Macroalgal bioindicators (growth, tissue N, δ15 43 N) detect nutrient enrichment from shrimp farm effluent entering Opunohu Bay, French Polynesia. Mar. Pollut. Bull. 2008, 56, 245–249. [Google Scholar] [CrossRef]
  37. Wang, X.; Cai, Y.; Guo, L. Preferential removal of dissolved carbohydrates during estuarine mixing in the Bay of St Louis in the northern Gulf of Mexico. Mar. Chem. 2010, 119, 130–138. [Google Scholar] [CrossRef]
  38. Romigh, M.M.; Davis, S.E.; Rivera-Monroy, V.H.; Twilley, R.R. Flux of organic carbon in a riverine mangrove wetland in the Florida Coastal Everglades. Hydrobiologia 2006, 569, 505–516. [Google Scholar] [CrossRef] [Green Version]
  39. Wua, S.S.; Hong, H.; Qian, L.; Xiong, J.; You, Y.; Wu, Z.; Liu, J.; Liu, J.; Yan, C.; Lu, H. The fate of dissolved organic matter along the mangrove creek-to-estuary continuum. Estuar. Coast. Shelf Sci. 2021, 260, 107496. [Google Scholar] [CrossRef]
  40. Kristensen, E.; Suraswadi, P. Carbon, nitrogen and phosphorus dynamics in creek water of asoutheast Asian mangrove forest. Hydrobiologia 2002, 474, 197–211. [Google Scholar] [CrossRef]
  41. Miller, A.E.J. Seasonal investigations of dissolved organic carbon dynamics in the Tamar Estuary, U.K. Estuar. Coast. Shelf Sci. 1999, 49, 891–908. [Google Scholar] [CrossRef]
  42. Kida, M.; Tanabe, M.; Tomotsune, M.; Yoshitake, S.; Kinjo, K.; Ohtsuka, T.; Fujitake, N. Changes in dissolved organic matter composition and dynamics in a subtropical mangrove river driven by rainfall. Estuar. Coast. Shelf Sci. 2019, 223, 6–17. [Google Scholar] [CrossRef]
  43. Krauss, K.W.; McKee, K.L.; Lovelock, C.E.; Cahoon, D.R.; Saintilan, N.; Reef, R.; Chen, L. How mangrove forests adjust to rising sea level. New Phytol. 2014, 202, 19–34. [Google Scholar] [CrossRef] [Green Version]
  44. Bouillon, S.; Frankignoulle, M.; Dehairs, F.; Velimirov, B.; Eiler, A.; Etcheber, H.; Abril, G.; Borges, A.V. Inorganic and organic carbon biogeochemistry in the Gautami Godavari estuary (Andhra Pradesh, India) during pre-monsoon: The local impact of extensive mangrove forests. Glob. Biogeochem. Cycles 2003, 17, 1114. [Google Scholar] [CrossRef] [Green Version]
  45. Ray, R.E.; Michaud, R.C.; Aller, V.; Vantrepotte, G.; Gleixner, R.; Walcker, J.; Devesa, M.; le Goff, S.; Morvan, G.; Thouzeau, G. The sources and distribution of carbon (DOC, POC, DIC) in a mangrove dominated estuary (French Guiana, South America). Biogeochemistry 2018, 138, 297–321. [Google Scholar] [CrossRef]
  46. Bouillon, S.; Dehairs, F.; Velimirov, B.; Abril, G.; Borges, A.V. Dynamics of organic and inorganic carbon across contiguous mangrove and seagrass systems (Gazi Bay, Kenya). J. Geophys. Res. 2007, 112, G02018. [Google Scholar] [CrossRef]
  47. Dittmar, T.; Lara, R.J.; Kattner, G. River or mangrove? Tracing major organic matter sources in tropical Brazilian coastal waters. Mar. Chem. 2001, 73, 253–271. [Google Scholar] [CrossRef]
  48. Davis, S.; Childers, D.; Day, J., Jr.; Rudnick, D.; Sklar, F. Nutrient dynamics in vegetated and unvegetated areas of a Southern Everglades mangrove creek. Estuar. Coast. Shelf Sci. 2001, 52, 753–768. [Google Scholar] [CrossRef]
  49. Sutula, M.; Perez, B.; Reyes, E.; Childers, D.; Davis, S.; Day, J., Jr.; Rudnick, D.; Sklar, F. Factors affecting spatial and temporal variability in material exchange between the Southern Everglades wetlands and Florida Bay (USA). Estuar. Coast. Shelf Sci. 2003, 57, 757–781. [Google Scholar] [CrossRef]
  50. Bouillon, S.; Moens, T.; Dehairs, F. Carbon sources sustaining benthic mineralization in mangrove and adjacent seagrass sediments (Gazi Bay Kenya). Biogeosciences 2004, 1, 71–78. [Google Scholar] [CrossRef] [Green Version]
  51. Qualls, R.G.; Haines, B.L. Biodegradability of dissolved organic matter in forest throughfall, soil solution, and stream water. Soil Sci. Soc. Am. J. 1992, 56, 578–586. [Google Scholar] [CrossRef] [Green Version]
  52. Yano, Y.; Mcdowell, W.H.; Aber, J.D. Biodegradable dissolved organic carbon in forest soil solution and effects of chronic nitrogen deposition. Soil Biol. Biochem. 2000, 32, 1743–1751. [Google Scholar] [CrossRef]
  53. Wiegner, T.N.; Seitzinger, S.P. Bioavailability of dissolved organic carbon and nitrogen from pristine and polluted freshwater wetlands. Limnol. Oceanogr. 2004, 49, 1703–1712. [Google Scholar] [CrossRef] [Green Version]
  54. Satoh, Y.; Abe, H. Dissolved organic matter in colored water from mountain bog pools in Japan II. Biological decomposability. Arch. Hydrobiol. 1987, 111, 25–35. [Google Scholar]
  55. Mann, C.J.; Wetzel, R.G. Dissolved organic carbon and its utilization in a riverine wetland ecosystem. Biogeochemistry 1995, 31, 99–120. [Google Scholar] [CrossRef]
  56. Servais, P.; Billen, G.; Hascoët, M.C. Determination of the biodegradable fraction of dissolved organic matter in waters. Wat. Res. 1987, 21, 445–450. [Google Scholar] [CrossRef]
  57. Wooller, M.; Smallwood, B.; Jacobson, M.; Fogel, M. Carbon and nitrogen stable isotopic variation in Laguncularia racemosa (L.) (white mangrove) from Florida and Belize: Implications for trophic level studies. Hydrobiologia 2003, 499, 13–23. [Google Scholar] [CrossRef]
  58. Trulleyová, Š.; Rulík, M. Determination of biodegradable dissolved organic carbon in waters: Comparison of batch methods. Sci. Total Environ. 2004, 332, 253–260. [Google Scholar] [CrossRef]
  59. Sun, X.G.; Yang, Z.S.; Chen, Z.R. Estimate and character of accretion and erosion in modern Huanghe River. Acta Oceanol. Sin. 1993, 15, 129–136. (In Chinese) [Google Scholar]
  60. Zhou, J.; Wu, Y.; Zhang, J.; Kang, Q.; Liu, Z. Carbon and nitrogen composition and stable isotope as potential indicators of source and fate of organic matter in the salt marsh of the Changjiang Estuary, China. Chemosphere 2006, 65, 310–317. [Google Scholar] [CrossRef]
  61. Andrews, J.E.; Greenway, A.M.; Dennis, P.F. Combined carbon isotope and C/N ratios as indicators of source and fate of organic matter in a poorly flushed, tropical estuary: Hunts Bay, Kingston Harbour, Jamaica. Estuar. Coast. Shelf Sci. 1998, 46, 743–756. [Google Scholar] [CrossRef]
  62. Mfilinge, P.L.; Atta, N.; Tsuchiya, M. Nutrient dynamics and leaf litter decomposition in a subtropical mangrove forest at Oura Bay, Okinawa, Japan. Trees 2002, 16, 172–180. [Google Scholar] [CrossRef]
  63. Jackson, C.; Preston, N.; Thompson, P.J.; Burford, M. Nitrogen budget and effluent nitrogen components at an intensive shrimp farm. Aquaculture 2003, 218, 397–411. [Google Scholar] [CrossRef]
  64. Herbeck, L.S. Ecological Impact of Land-Derived Anthropogenic Nutrients and Organic Matter on Tropical Estuarine and Coastal Systems of Hainan, China. Ph.D. Thesis, Faculty of Biology/Chemistry, University of Bremen, Bremen, Germany, 2012; p. 298. [Google Scholar]
  65. Tue, N.T.; Hamaoka, H.; Sogabe, A.; Quy, T.D.; Nhuan, M.T.; Omori, K. Sources of Sedimentary Organic Carbon in Mangrove Ecosystems from Ba Lat Estuary, Red River, Vietnam. In Modeling and Analysis of Marine Environmental Problems; Omori, K., Guo, N.X., Yoshie, N., Fujii, I.C., Handoh, A.I., Tanabe, S., Eds.; Terrapub: Tokyo, Japan, 2011; pp. 151–157. [Google Scholar]
  66. Wilson, G.P.; Lamb, A.L.; Leng, M.J.; Gonzalez, S.; Huddart, D. Variability of organic δ13C and C/N in the Mersey Estuary, U.K. and its implications for sea-level reconstruction studies. Estuar. Coast. Shelf Sci. 2005, 64, 685–698. [Google Scholar] [CrossRef]
Figure 1. Location of the mangroves study area. The monitoring sites N: natural; D: Deforested; P: planted.
Water 14 00773 g001
Figure 2. Spatial variation of OC in different locations: (a) the entire Xuan Thuy mangroves; (b) Planted mangroves; (c) Deforested mangroves; (d) Natural mangroves.
Water 14 00773 g002
Figure 3. Degradation of DOC (black symbol) and POC (white symbol) (mgCL−1), in dry season and rainy season (January and July, respectively) at different sampling areas.
Water 14 00773 g003
Table 1. The values of physicochemical variables.
SitepH
Mean ± SD
(Min–Max)
Temp (°C)
Mean ± SD
(Min–Max)
NO3 (mgL−1)
Mean ± SD
(Min–Max)
NO2 (mgL−1)
Mean ± SD
(Min–Max)
PO42− (mgL−1)
Mean ± SD
(Min–Max)
Chla (µgL−1)
Mean ± SD
(Min–Max)
Deforested mangrove7.6 ± 0.1
(7.1–7.9)
26.8 ± 5.5
(15.6–30.9)
0.07 ± 0.05
(0.01–0.11)
0.07 ± 0.07
(0.01–0.24)
0.03 ± 0.04
(0.002–0.12)
0.47 ± 0.43
(0.04–1.23)
Planted mangroves7.3 ± 0.3
(7.0–7.7)
23.6 ± 5.7
(14.6–28.9)
0.13 ± 0.08
(0.02–0.28)
0.03 ± 0.03
(0.01–0.10)
0.06 ± 0.07
(0.02–0.23)
1.26 ± 1.45
(0.10–4.75)
Natural mangroves7.0 ± 0.2
(7.0–8.1)
23.3 ± 5.8
(13.6–29.3)
0.10 ± 0.07
(0.06–0.24)
0.02 ± 0.02
(0.01–0.18)
0.04 ± 0.05
(0.01–0.15)
1.43 ± 2.48
(0.50–8.60)
Table 2. The range of organic carbon (± standard error), the respective concentration and percentage of biodegradable. The time that has been set for the experiment is 40 days.
Site Deforested MangrovePlanted MangrovesNatural Mangroves
Mean ± SD
(Min–Max)
Mean ± SD
(Min–Max)
Mean ± SD
(Min–Max)
DissolvedDOC (mgCL−1)4.2 ± 1.9
(2.2–8.1)
4.4 ± 3.0
(2.3–10.8)
4.3 ± 3.1
(1.8–13.2)
BDOC (mgCL−1)2.7 ± 1.3
(1.4–5.0)
2.7 ± 2.7
(0.9–8.0)
2.3 ± 2.9
(0.6–9.4)
BDOC (%)49 ± 13
(30–63)
48 ± 17
(28–74)
38 ± 18
(19–71)
ParticulatePOC (mgCL−1)3.7 ± 2.5
(1.8–10.4)
7.9 ± 12.9
(2.8–14.4)
5.7 ± 10.5
(1.7–12.2)
BPOC (mgCL−1)1.9 ± 1.8
(0.7–6.1)
6.1 ± 11.3
(1.1–13.9)
4.1 ± 9.2
(0.5–10.3)
BPOC (%)47 ± 17
(22–73)
52 ± 16
(32–76)
43 ± 18
(18–72)
TotalTOC (mgCL−1)7.9 ± 3.9
(2.5–8.1)
12.3 ± 15.4
(2.3–10.8)
10.0 ± 13.3
(1.7–12.2)
BTOC (mgCL−1)4.7 ± 2.9
(2.2–11.1)
8.8 ± 13.6
(1.9–11.9)
6.4 ± 11.9
(1.10–19.7)
BTOC (%)48 ± 12
(33–66)
52 ± 13
(37–76)
41 ± 17
(19–72)
Table 3. Characteristics of sediments in different mangroves.
CharacteristicsDeforested Mangrove
Mean ± SD
(Min–Max)
Planted Mangroves
Mean ± SD
(Min–Max)
Natural Mangroves
Mean ± SD
(Min–Max)
N (%)0.30 ± 0.44
(0.02–1.03)
0.51 ± 0.61
(0.07–1.60)
0.30 ± 0.37
(0.03–1.41)
P (%)0.12 ± 0.04
(0.05–0.18)
0.13 ± 0.04
(0.06–0.19)
0.14 ± 0.04
(0.07–0.19)
C (%)0.45 ± 0.28
(0.18–1.26)
2.49 ± 1.09
(0.77–3.94)
3.04 ± 1.83
(0.39–6.40)
C/N8.4 ± 5.5
(0.3–15.0)
14.3 ± 9.5
(1.0–22.9)
16.9 ± 8.1
(1.6–25)
Publisher’s Note: MDPI stays neutral with regard to jurisdictional claims in published maps and institutional affiliations.

