
Agricultural Water Security under Climate Change in the Iberian Peninsula


1
Centre for the Research and Technology of Agro-Environmental and Biological Sciences, CITAB, Inov4Agro—Institute for Innovation, Capacity Building, and Sustainability of Agri-Food Production, Universidade de Trás-os-Montes e Alto Douro, UTAD, 5000-801 Vila Real, Portugal
2
Natural Hazards Research Center (NHRC.ipt), Instituto Politécnico de Tomar, Quinta do Contador, Estrada da Serra, 2300-313 Tomar, Portugal
*
Author to whom correspondence should be addressed.
Water 2022, 14(5), 768; https://doi.org/10.3390/w14050768
Submission received: 2 February 2022
/
Revised: 23 February 2022
/
Accepted: 24 February 2022
/
Published: 28 February 2022
(This article belongs to the Special Issue How Does Agricultural Water Resources Management Adapt to Climate Change?)
Abstract
:As civilization advances, water resources are increasingly being consumed for domestic, industrial, and agricultural purposes, reducing the ability to find an equilibrium of water security and growing demands. This study presents an analysis and discussion of climate change impacts on water and agricultural sectors in the Iberian Peninsula (IP) and their implications for potential future water scarcity regarding food security. The analysis reveals an overall increase in annual mean temperatures, ranging from 1.4 to 5.5 °C, a decrease in precipitation between 0.10 and 0.55 mm × day−1, strengthening of aridity across the whole IP, as well as a reduction in water content in the soil, for the periods 2041–2060 and 2081–2100, respectively. These effects are generally more noticeable at lower latitudes for temperature and higher latitudes for precipitation. It also shows that the water demand is increasing in the IP, due to the increase in agricultural areas or intensive farming since water and food security are intricately connected. An increase of approximately 34% in the agricultural area was observed from 1990 to 2020. Furthermore, the Normalized Difference Vegetation Index (NDVI) values increased during this period, hinting at the increased need for water in the IP. Consequently, actions are needed to enhance food security by adopting strategies to preserve and conserve water, such as improved irrigation systems, the creation of retention basins, or the selection of new crops or varieties, more suitable to warm and dry climates, thus enhancing climate resilience in the IP.
1. Introduction
Climate change is closely related to human development, consumption, and growth patterns [1]. It affects all regions around the world, with the most significant impact in certain regions, such as the Mediterranean [2]. In one recent Intergovernmental Panel on Climate Change (IPCC) report [3], it is stated that many semi-arid regions (i.e., Mediterranean), will face a substantial decline in water availability due to climate change.
The continuous increase in world population has threatened human health, natural systems, and agricultural production [4]. The increasing demand for food supply leads to intensive agriculture practices, thus escalating the need for more fertilizers and water demand [5], exerting pressure on land and water resources, resulting in soil erosion and pollution [6]. As the world’s population continues to grow, maintaining food security is an increasingly pertinent development goal.
Agriculture is the global primary water stakeholder in terms of withdrawals (70% of withdrawals and 92% of global freshwater consumption) [7] as water is considered to be an input endowment favoring agriculture vis à vis industry [8] while contributing to approximately 20% of the global emissions of greenhouse gases [9], contributing to strengthening climate change effects, with impacts on plant productivity growth cycle and damage to crops, namely due to extreme climate conditions [10]. Further, climate change effects are being manifested by shifts in previously observed patterns (e.g., extreme events, frequency and intensity of precipitation, hail, and hot and cold days) [11]. Thus, seasonal patterns of temperature, soil radiation, precipitation, atmospheric CO2 concentration, and soil conditions are the key factors for agriculture [12]. Responding to the effects of climate change, agriculture has been adapting to reduce such negative effects by resorting to irrigation across prone arid areas and moving heat/cold-tolerant crops to lower/higher latitudes [13,14].
Across the European Union (EU), agricultural land makes up 39% of Europe’s land cover [15], and although the number of farms is decreasing, due to continuous growth in urbanization, the average farm size is increasing. This may be partly due to the EU common agricultural policy (CAP), which tends to favor large farms over small farms [16,17,18], which can be a concern in terms of resilience of food security. Notably, the supply and demand of water for irrigation will be influenced not only by the constant change in hydrological regimes (climate change) but also by industries and populations (economic and population growth) [19]. The question remains: how sustainable can intensive agriculture practices become in respect to water availability?
This study provides a comprehensive analysis and discussion of the impacts of climate change on the water and agriculture sectors in the Iberian Peninsula (IP). For this purpose, the relationships between water-dependent land use categories and climate change trends between 1981 and 2100 are assessed by describing the trends in two categories: climate variables and total agricultural area in use. Geographic Information Systems (GIS) and other spatial analysis tools are used to assess the feasibility of sustainable crop development regarding water resources within the five main river catchments in the IP. Section 3 will present the results of the study and Section 4 the discussion of the main findings. Section 5 will provide final thoughts and conclusions.
2. Materials and Methods
2.1. Study Area
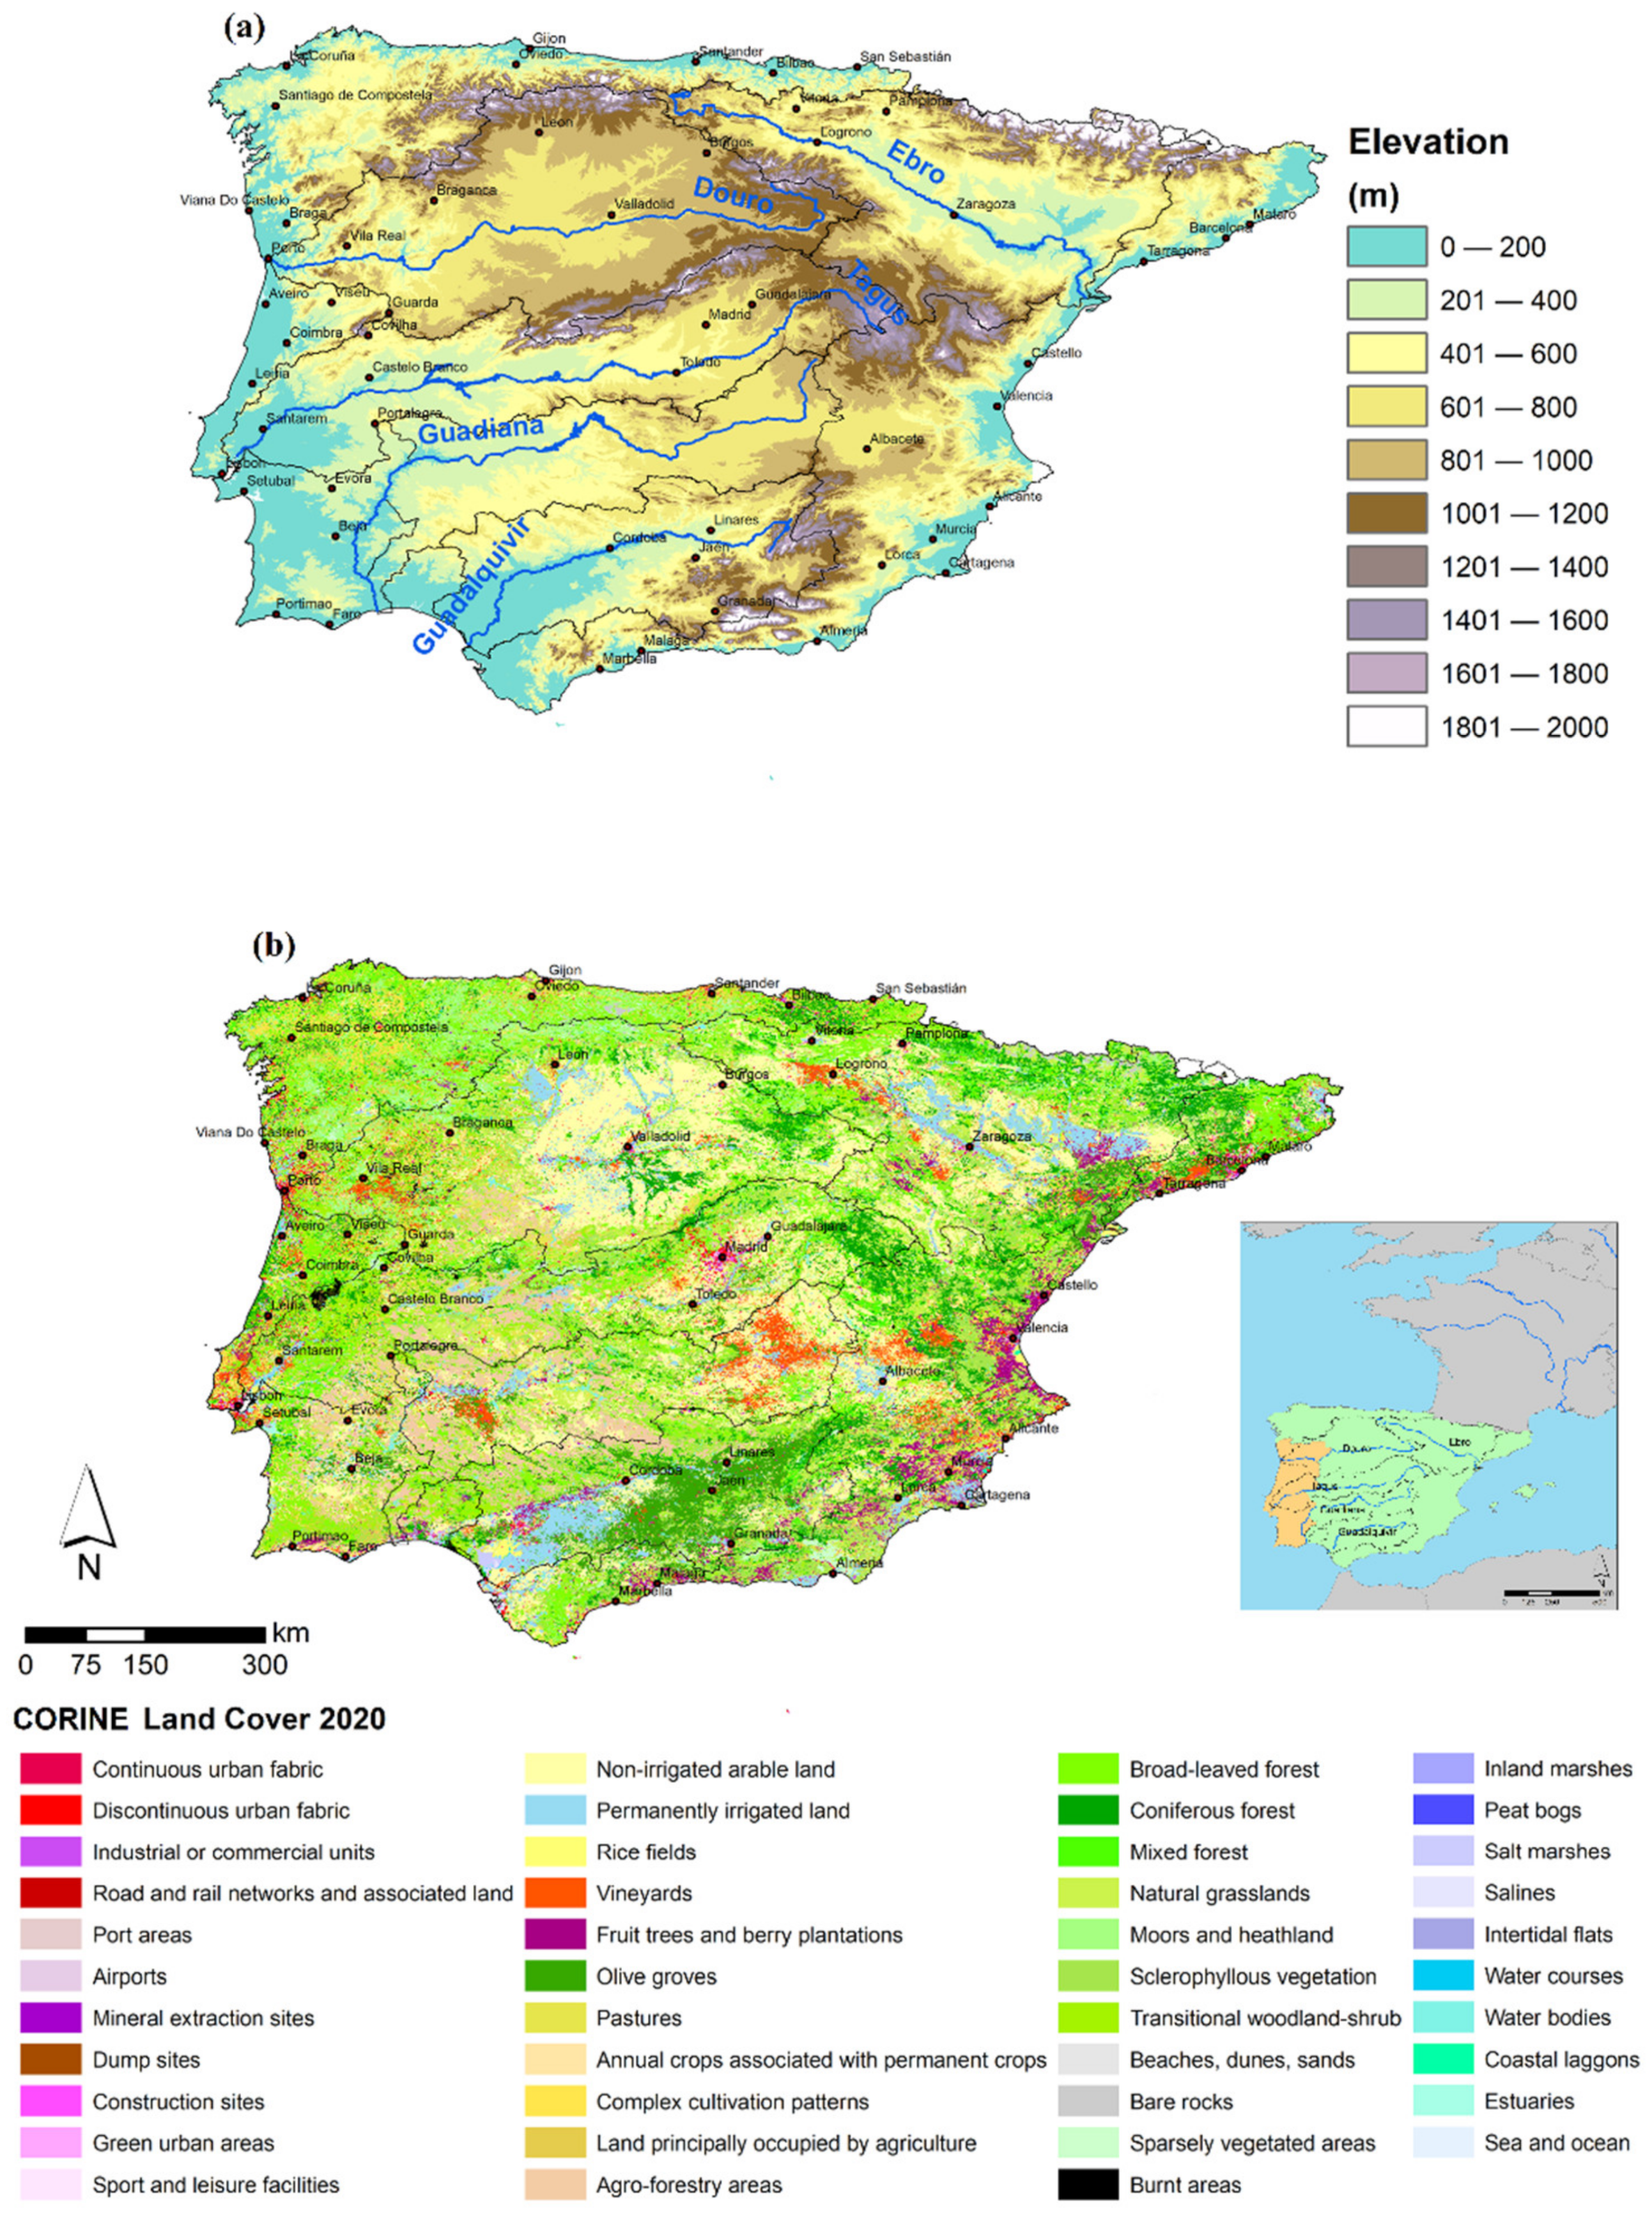
The IP has an area of approximately 582,480 km2 of which ca. 52% is forest land, where five major river catchments can be distinguished: Douro, Tagus, Guadiana, Ebro, and Guadalquivir (Figure 1). The landmass is surrounded by the Bay of Biscay (Atlantic Ocean) in the north, the Mediterranean Sea in the south and east, and the North Atlantic Ocean in the west. It is separated from the rest of Europe by the Pyrenees Mountain Range (highest elevation of approximately 3400 m). The center of the IP is dominated by an extensive high plateau, with elevations ranging from 600 to 800 m, which slopes slightly to the west. Climates are predominantly Mediterranean type, with mild to cold winters and relatively dry and warm summers. Due to the heterogeneity of the orography, two distinctive bioclimatic zones are present: Mediterranean pluviseasonal oceanic and temperate oceanic [18]. The precipitation regime is mainly dry in the south-eastern area of the IP and sub-humid to humid (>700 mm) in the north and west regions of the IP, with the highest observed precipitation in the north-western area [20,21].
The study will focus on the five main river catchments mentioned above and on selected land cover areas within the catchments, which are described in the next section.
2.2. Copernicus Datasets
Downscaled bioclimatic indicators, derived from the Coupled Model Intercomparison Project—Phase 5 (CMIP5) climate projections [22], available at 1 km latitude × 1 km longitude regular grid over Europe and from 1950 to 2100, under the Representative Concentration Pathway 8.5—RCP8.5 [23], were extracted for a sector covering the IP. Data were provided by the Copernicus Climate Change Service [24]. A total of six variables were selected: annual mean temperature (BIO01), temperature seasonality (BIO04), annual precipitation (BIO12), precipitation seasonality (BIO15), annual mean aridity, and annual mean volumetric soil water layer 1. The bioclimatic indicators are calculated as follows: the annual mean temperature (°C) is calculated based on the monthly mean temperature (°C) at 2 m above the surface and temperature seasonality (°C) is the standard deviation of the monthly mean temperature (°C) multiplied by 100. The annual precipitation (mm) is calculated by the annual mean of the monthly mean precipitation rate (mm/day), while the precipitation seasonality (mm) is the annual coefficient of variation of the monthly precipitation (mm). The drought indicator annual mean aridity (mm/mm) is the monthly potential evaporation (mm) divided by the monthly mean precipitation (mm) averaged over the year. The soil indicator annual mean volumetric soil water layer 1 (mm3/mm3) is the volume of water (mm3) in volume of soil layer 1 (mm3) (0–7 cm) averaged over the year.
The indicators analyzed in this study have the greatest impact on water resources, specifically related to the chosen land cover categories, such as trends, seasonality, and extreme factors. The bioclimatic indicators are calculated based on daily CMIP5 climate projections from 10 Global Circulation Models (GCM) and further downscaled to 1 km grid resolution, considering the relationship between the orography and each climate state variable. They were also subject to bias-adjusted correction against ERA5 reanalysis data [25]. Ensemble means of the models (Supplementary Materials Table S1) available for each variable were computed within three different periods: 1981–2000, 2041–2060, and 2081–2100. Furthermore, anomalies were also calculated for future periods under RCP8.5.
Land cover maps (LC—100 m resolution), from 1990 and 2020, and Normalized Difference Vegetation Index (NDVI—1 km resolution) [26], from 2000 and 2019, were retrieved from the Copernicus Land Monitoring Service and extracted afterward for the IP sector. The land cover map for 2020 is the most recent map available for the study area, while the 1990 map was used to be representative of the period 1981–2000. The land cover evolution between these two maps reflects a consistent and gradual evolution observed over the 30-year period considered in this study (1990–2020). In fact, an analysis of the evolution from 1981 to 2020 showed a consistent trend throughout the period. For the NDVI data, an ensemble mean of the monthly datasets was carried out for each corresponding year.
To assess the evolution of land cover maps, NDVI, and the selected bioclimatic indices, the following five main categories of the land cover within the five river catchments were targeted herein: permanently irrigated areas, rice fields, vineyards, olive groves, and fruit trees and berry plantations. Thus, all datasets were clipped for these five LC areas and catchments. The selected land cover categories are those more susceptible to water scarcity or water demand.
3. Results
3.1. Land Cover and Normalized Difference Vegetation Index Change
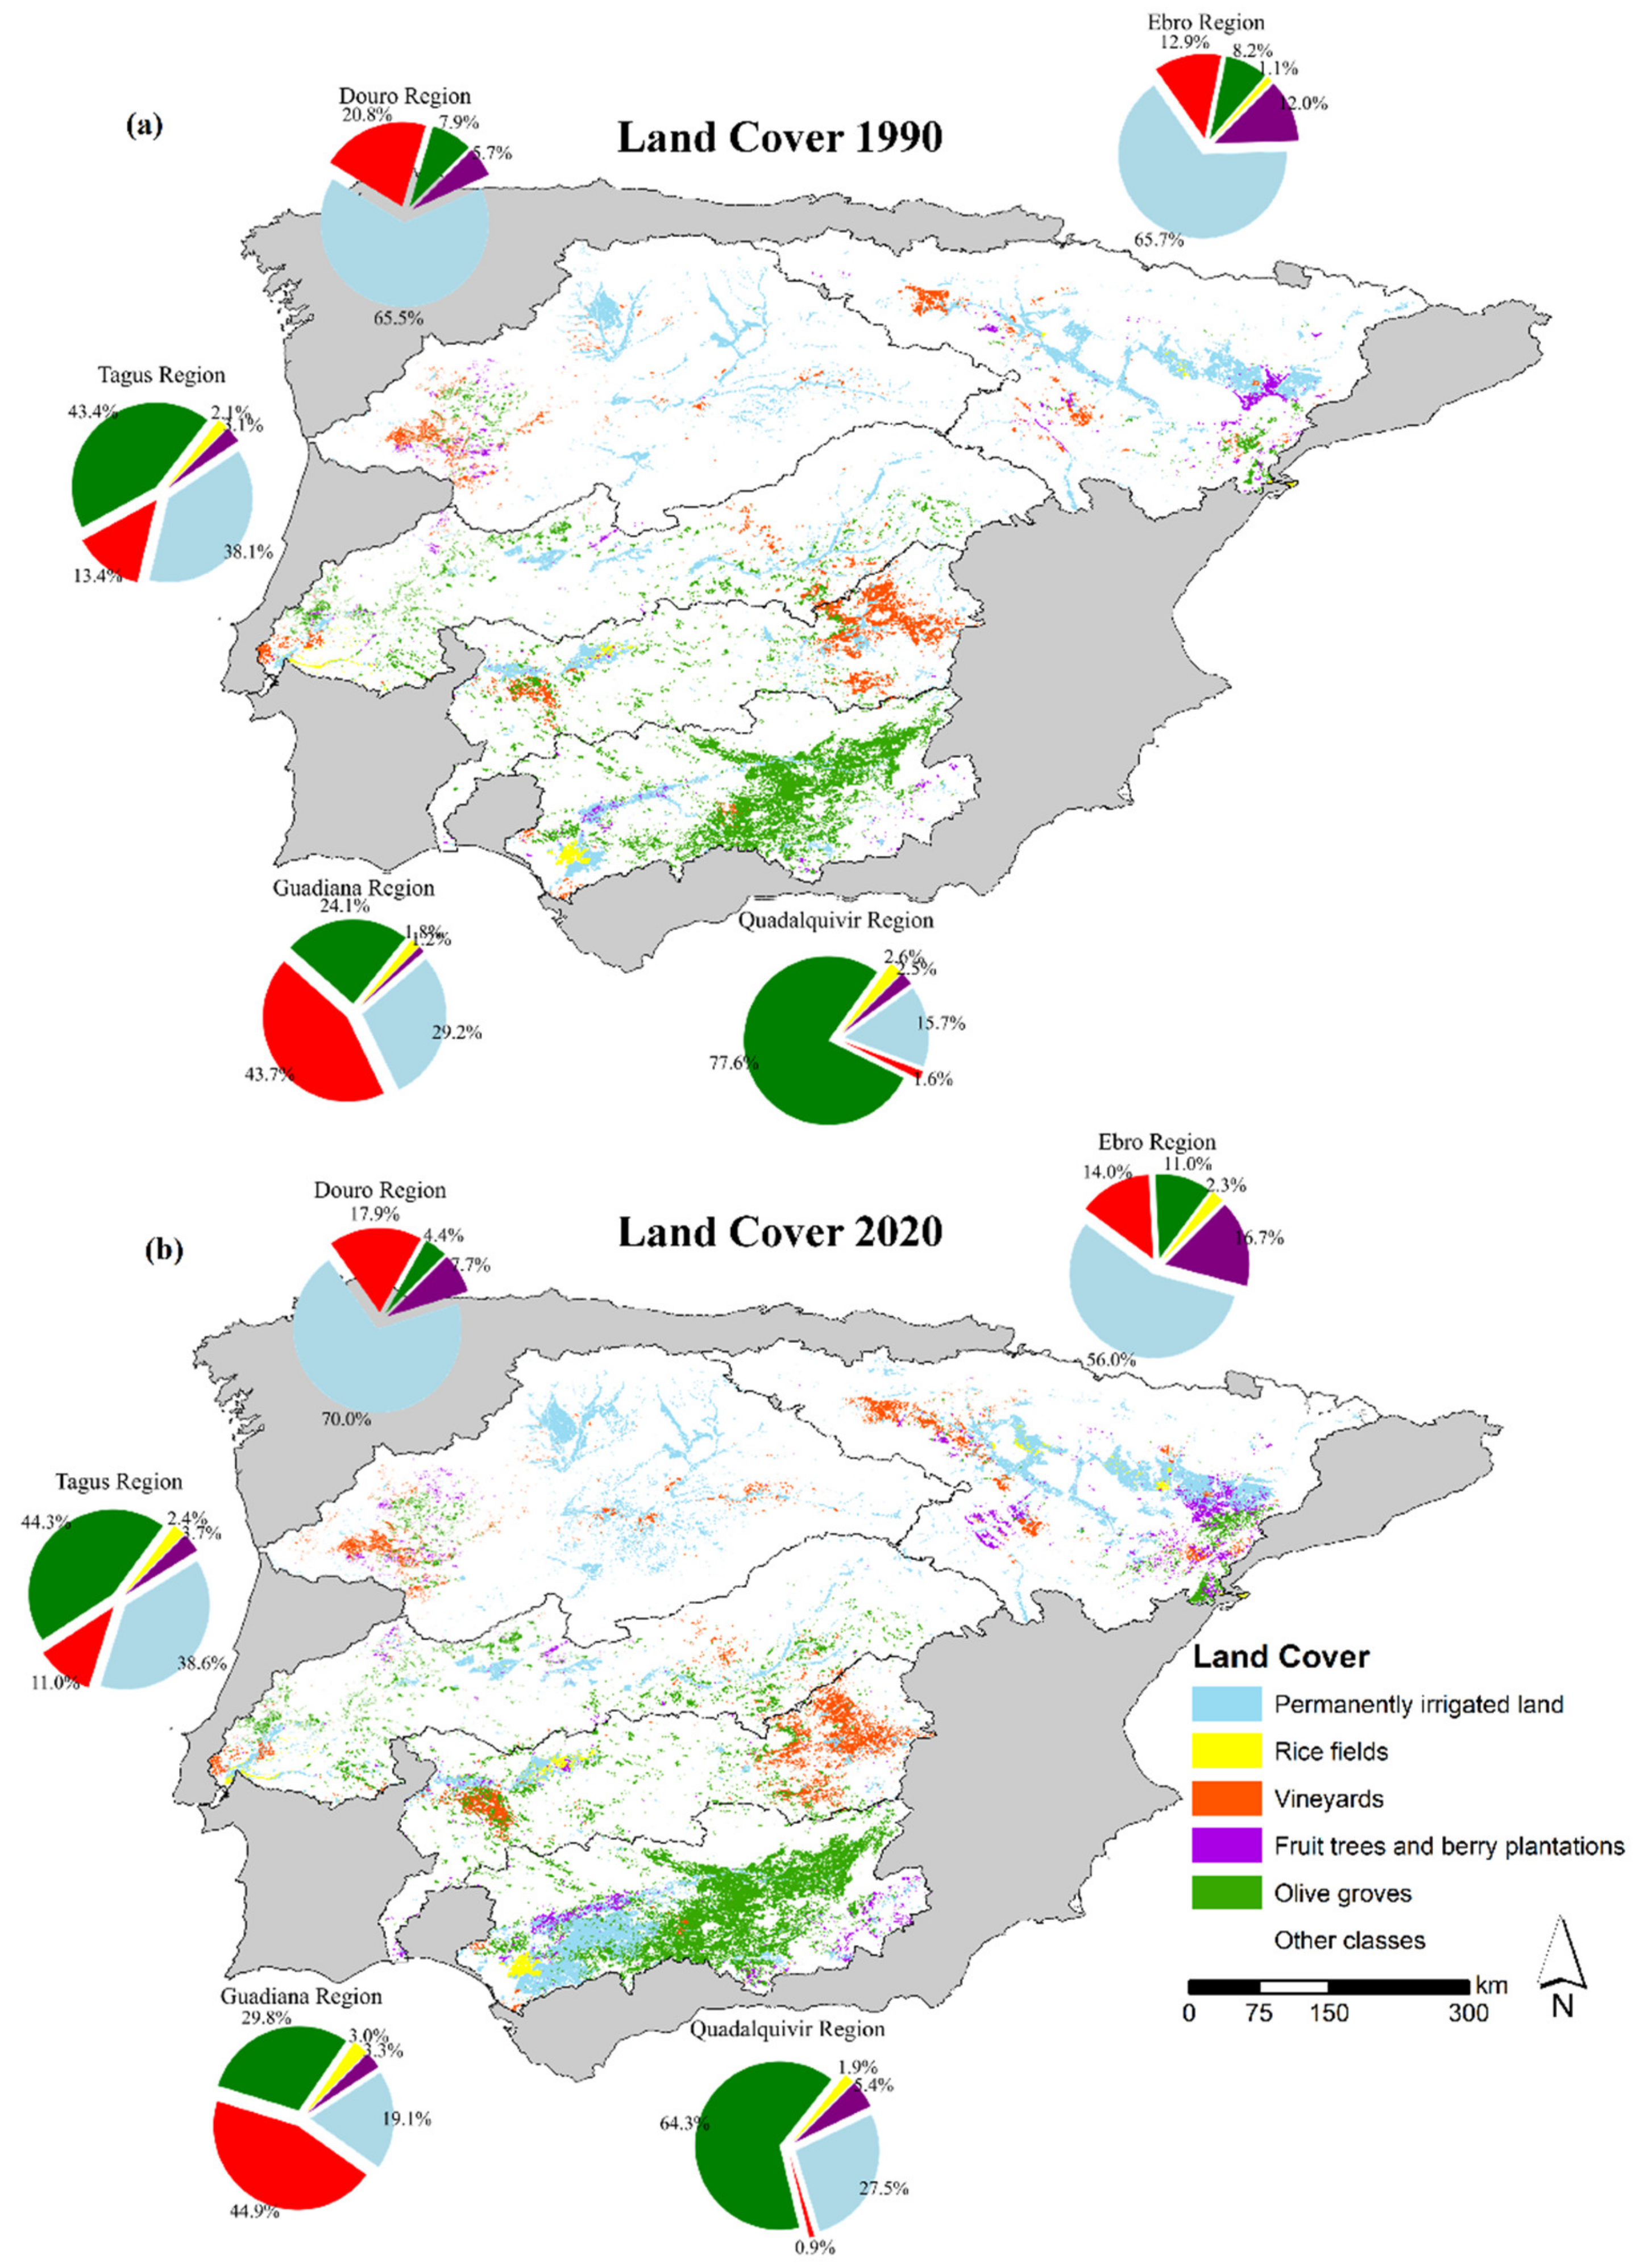
Figure 2 shows the spatial distribution of the land cover maps for the years 1990 and 2020 for the abovementioned selected land cover categories. The areas and percentage of the land cover types for each river catchment during the two different periods are given in Table 1.
There is an observed increase in the total area potentially dependent on water for all river catchments. This is also valid for each land cover category targeted in this study, except for permanently irrigated land in the Guadiana River catchment. While changes are nearly insignificant for the Tagus River catchment (3% increase), considerable changes are observed in the Douro, Guadiana, Ebro, and Guadalquivir catchments, with an increased area of 27%, 21%, 40%, and 53%, respectively. The most noticeable changes for each category are observed in the Guadiana, Ebro, and Guadalquivir catchments. In Guadiana, the rice field area has increased by 198%, whereas fruit trees and berry plantations underwent an impressive increase of ca. 337%, accompanied by a decrease of 21% in the area of permanently irrigated land. The Ebro catchment shows an increase of 300% in rice fields, 197% in fruit trees and berry plantations, and 190% in olive groves. Regarding the Guadalquivir catchment, an increase of 331% in fruit trees and berry plantations, and 273% in permanently irrigated land are observed.
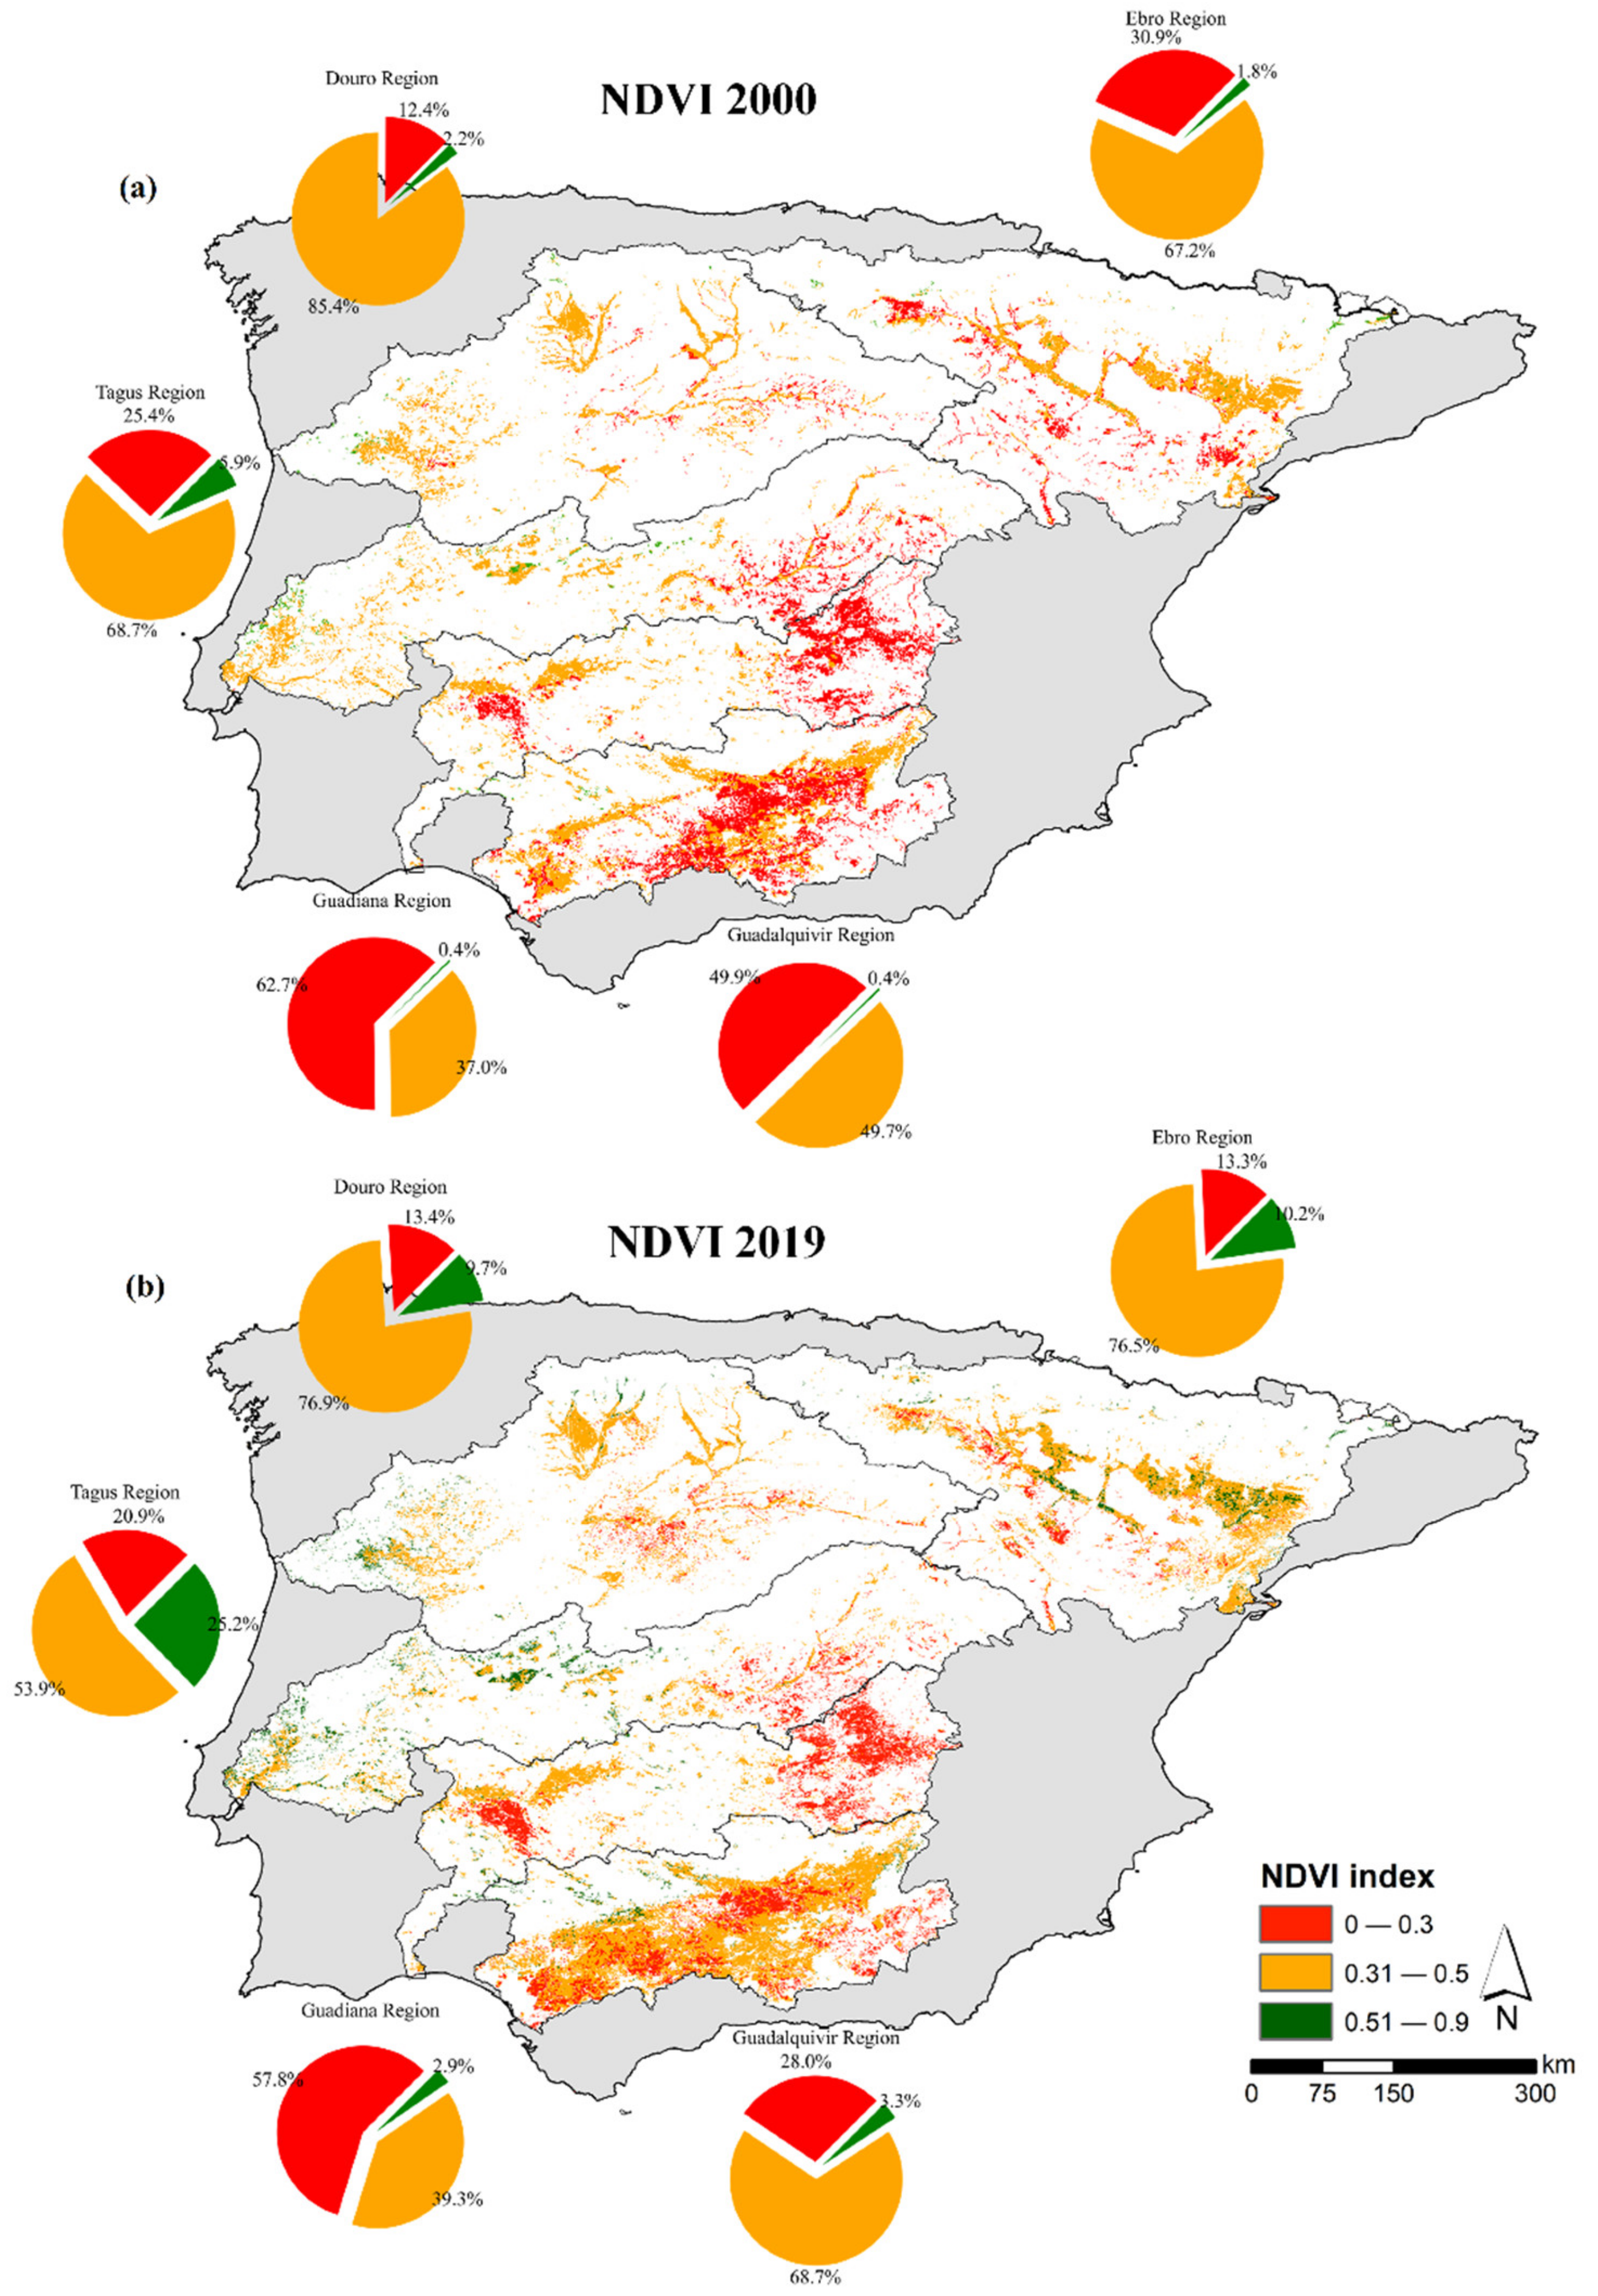
The NDVI for the years 2000 and 2019 (Figure 3) depicts the changes in patterns of green vegetation within the study area. The index was divided into three categories: red (0–0.30), for sparse vegetation; orange (0.31–0.50), for moderate vegetation; and green (0.51–0.90), for dense vegetation. In all catchments, there is an increase in the NDVI values, which reflects the increased water reliant land cover area. The relative increase (in %) for each land cover category per catchment for NDVI values above 0.51 (dense vegetation) is shown in Table 2.
3.2. Bioclimatic Indicators
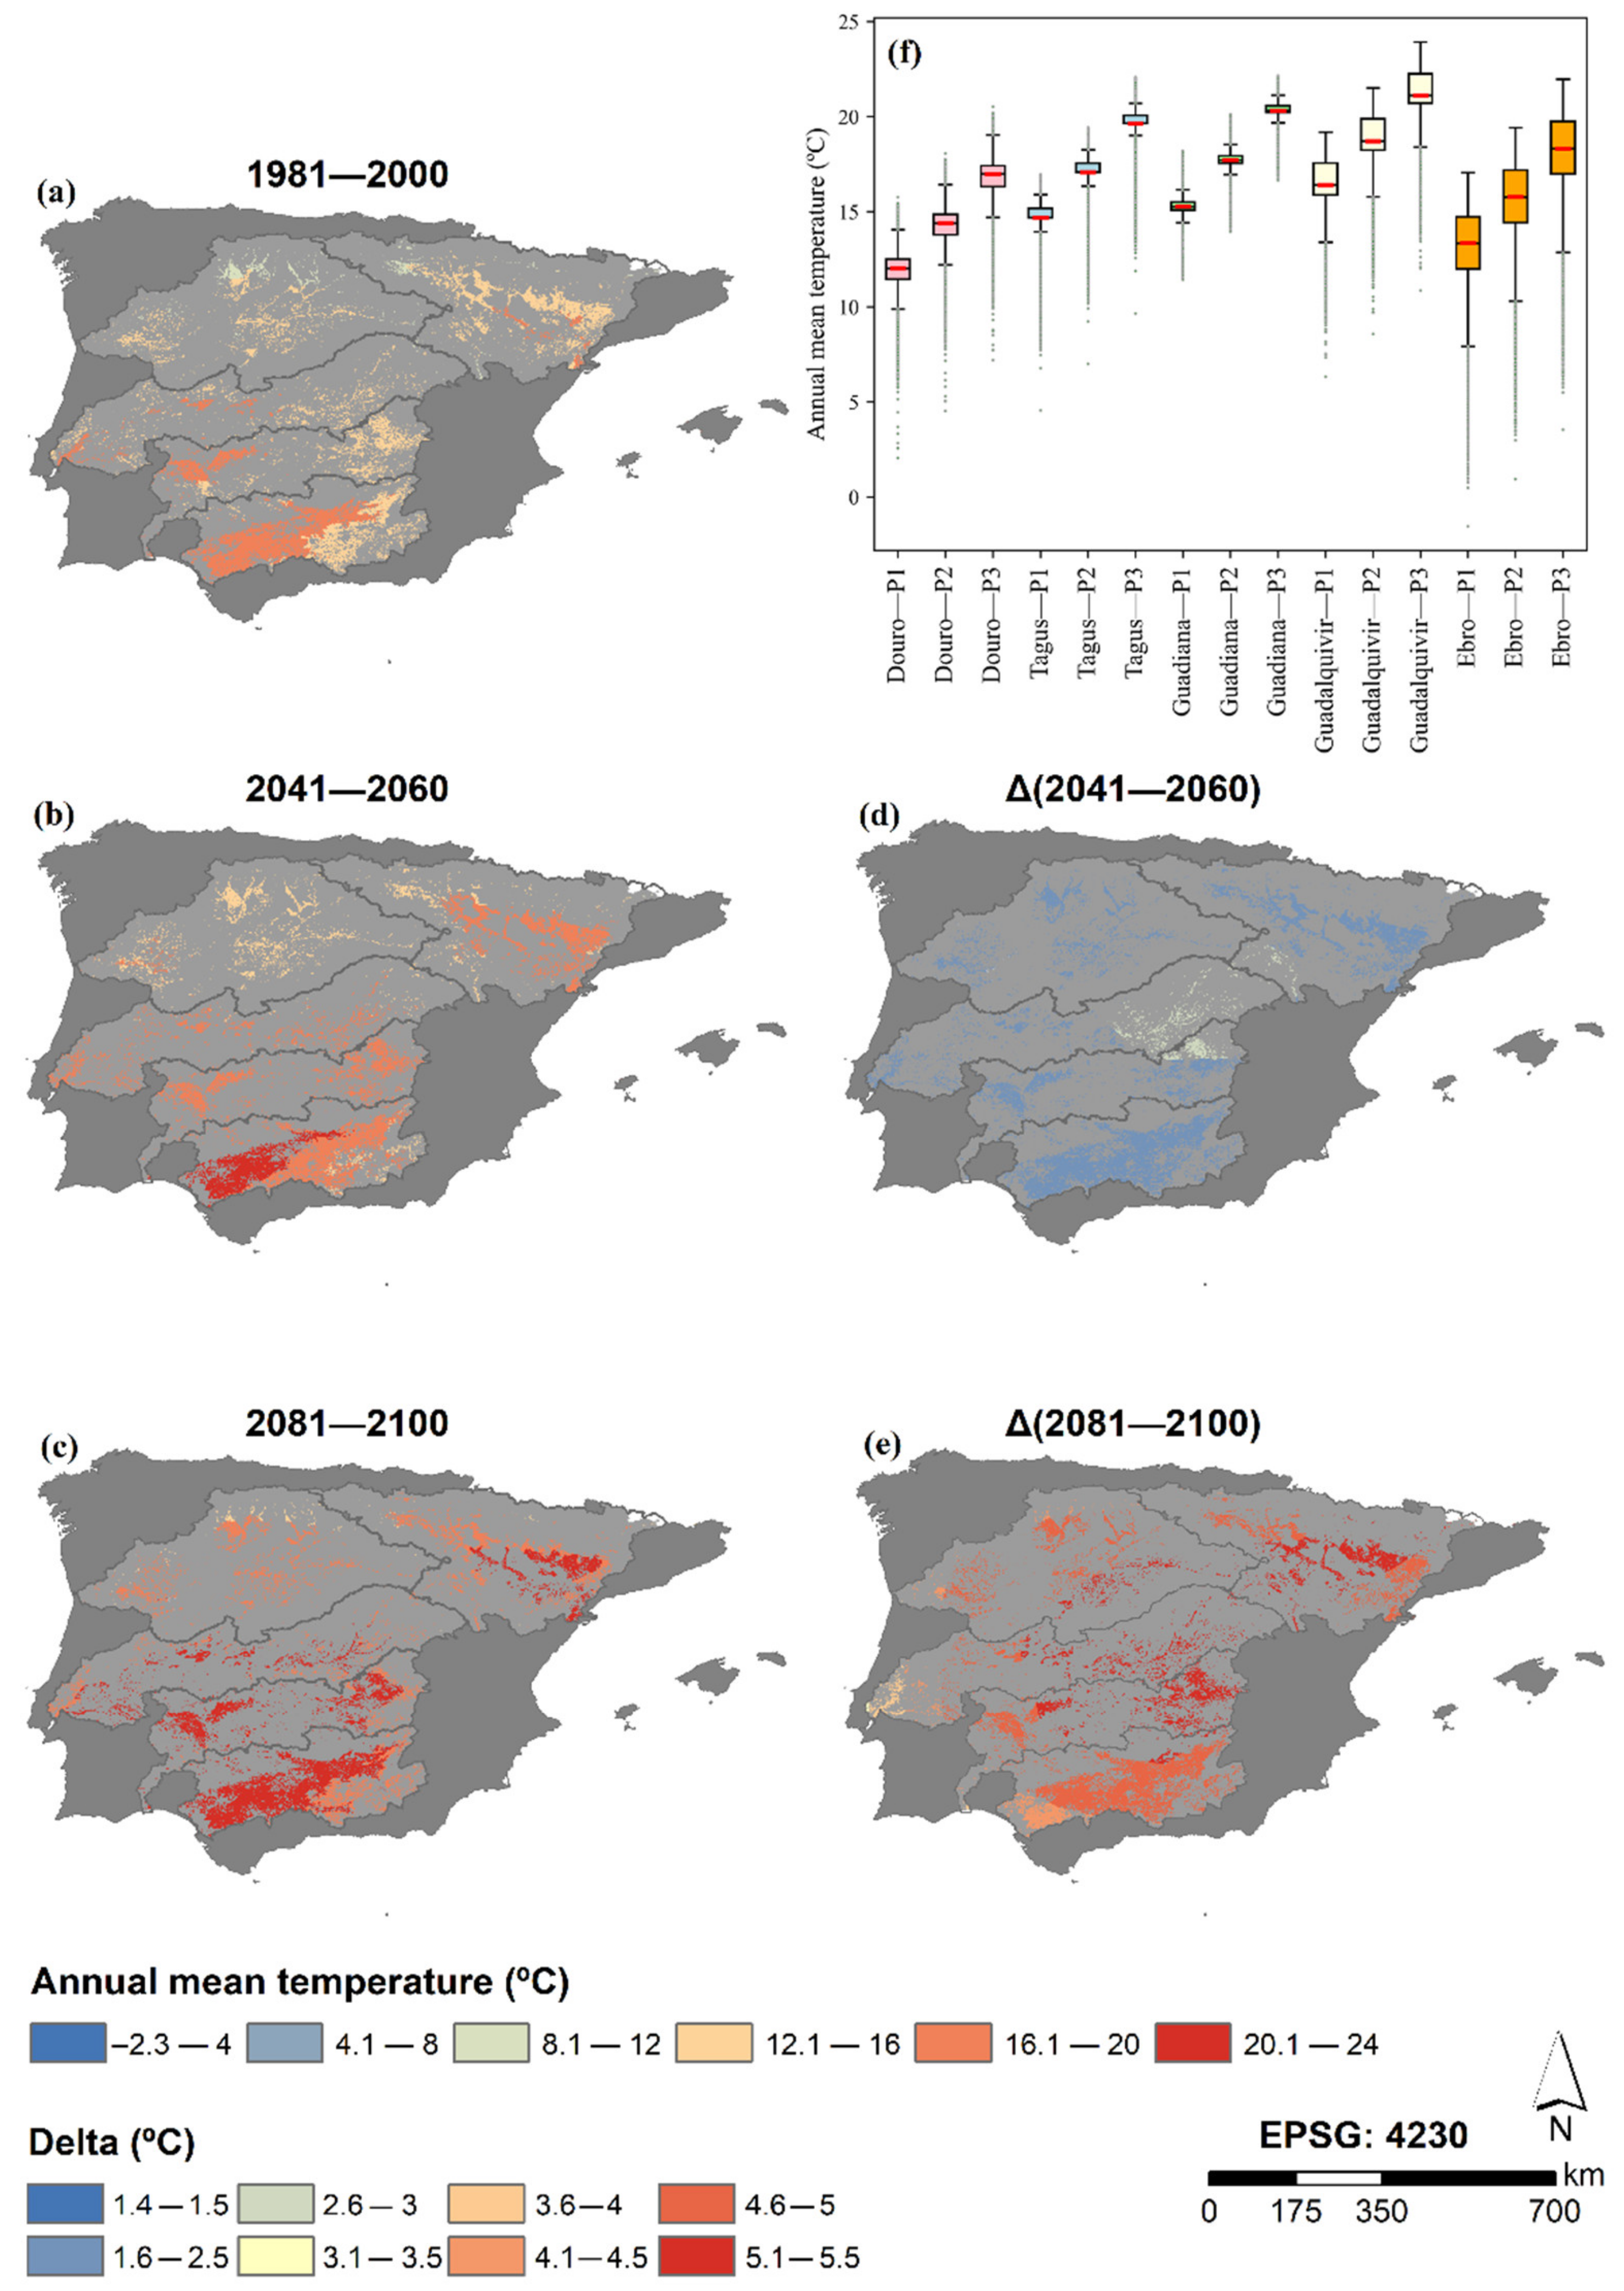
The spatial distribution of the annual mean temperature and its trends for the periods 1981–2000 (P1), 2041–2060 (P2), and 2081–2100 (P3) over the study area are shown in Figure 4. For all periods, there is an increasing gradient from the north to the south, and an increase from P1 to P3 (as shown in the boxplots). There is an expected increase in the annual mean temperature of 2.4 °C for P2 and 4.9 °C for P3 (Supplementary Materials Table S2). The highest change in the median temperature is observed in the Guadiana catchment, with an increase of nearly 2.4 °C and 5.1 °C for P2 and P3, respectively, while the highest range is observed in the Ebro region (7.7 °C).
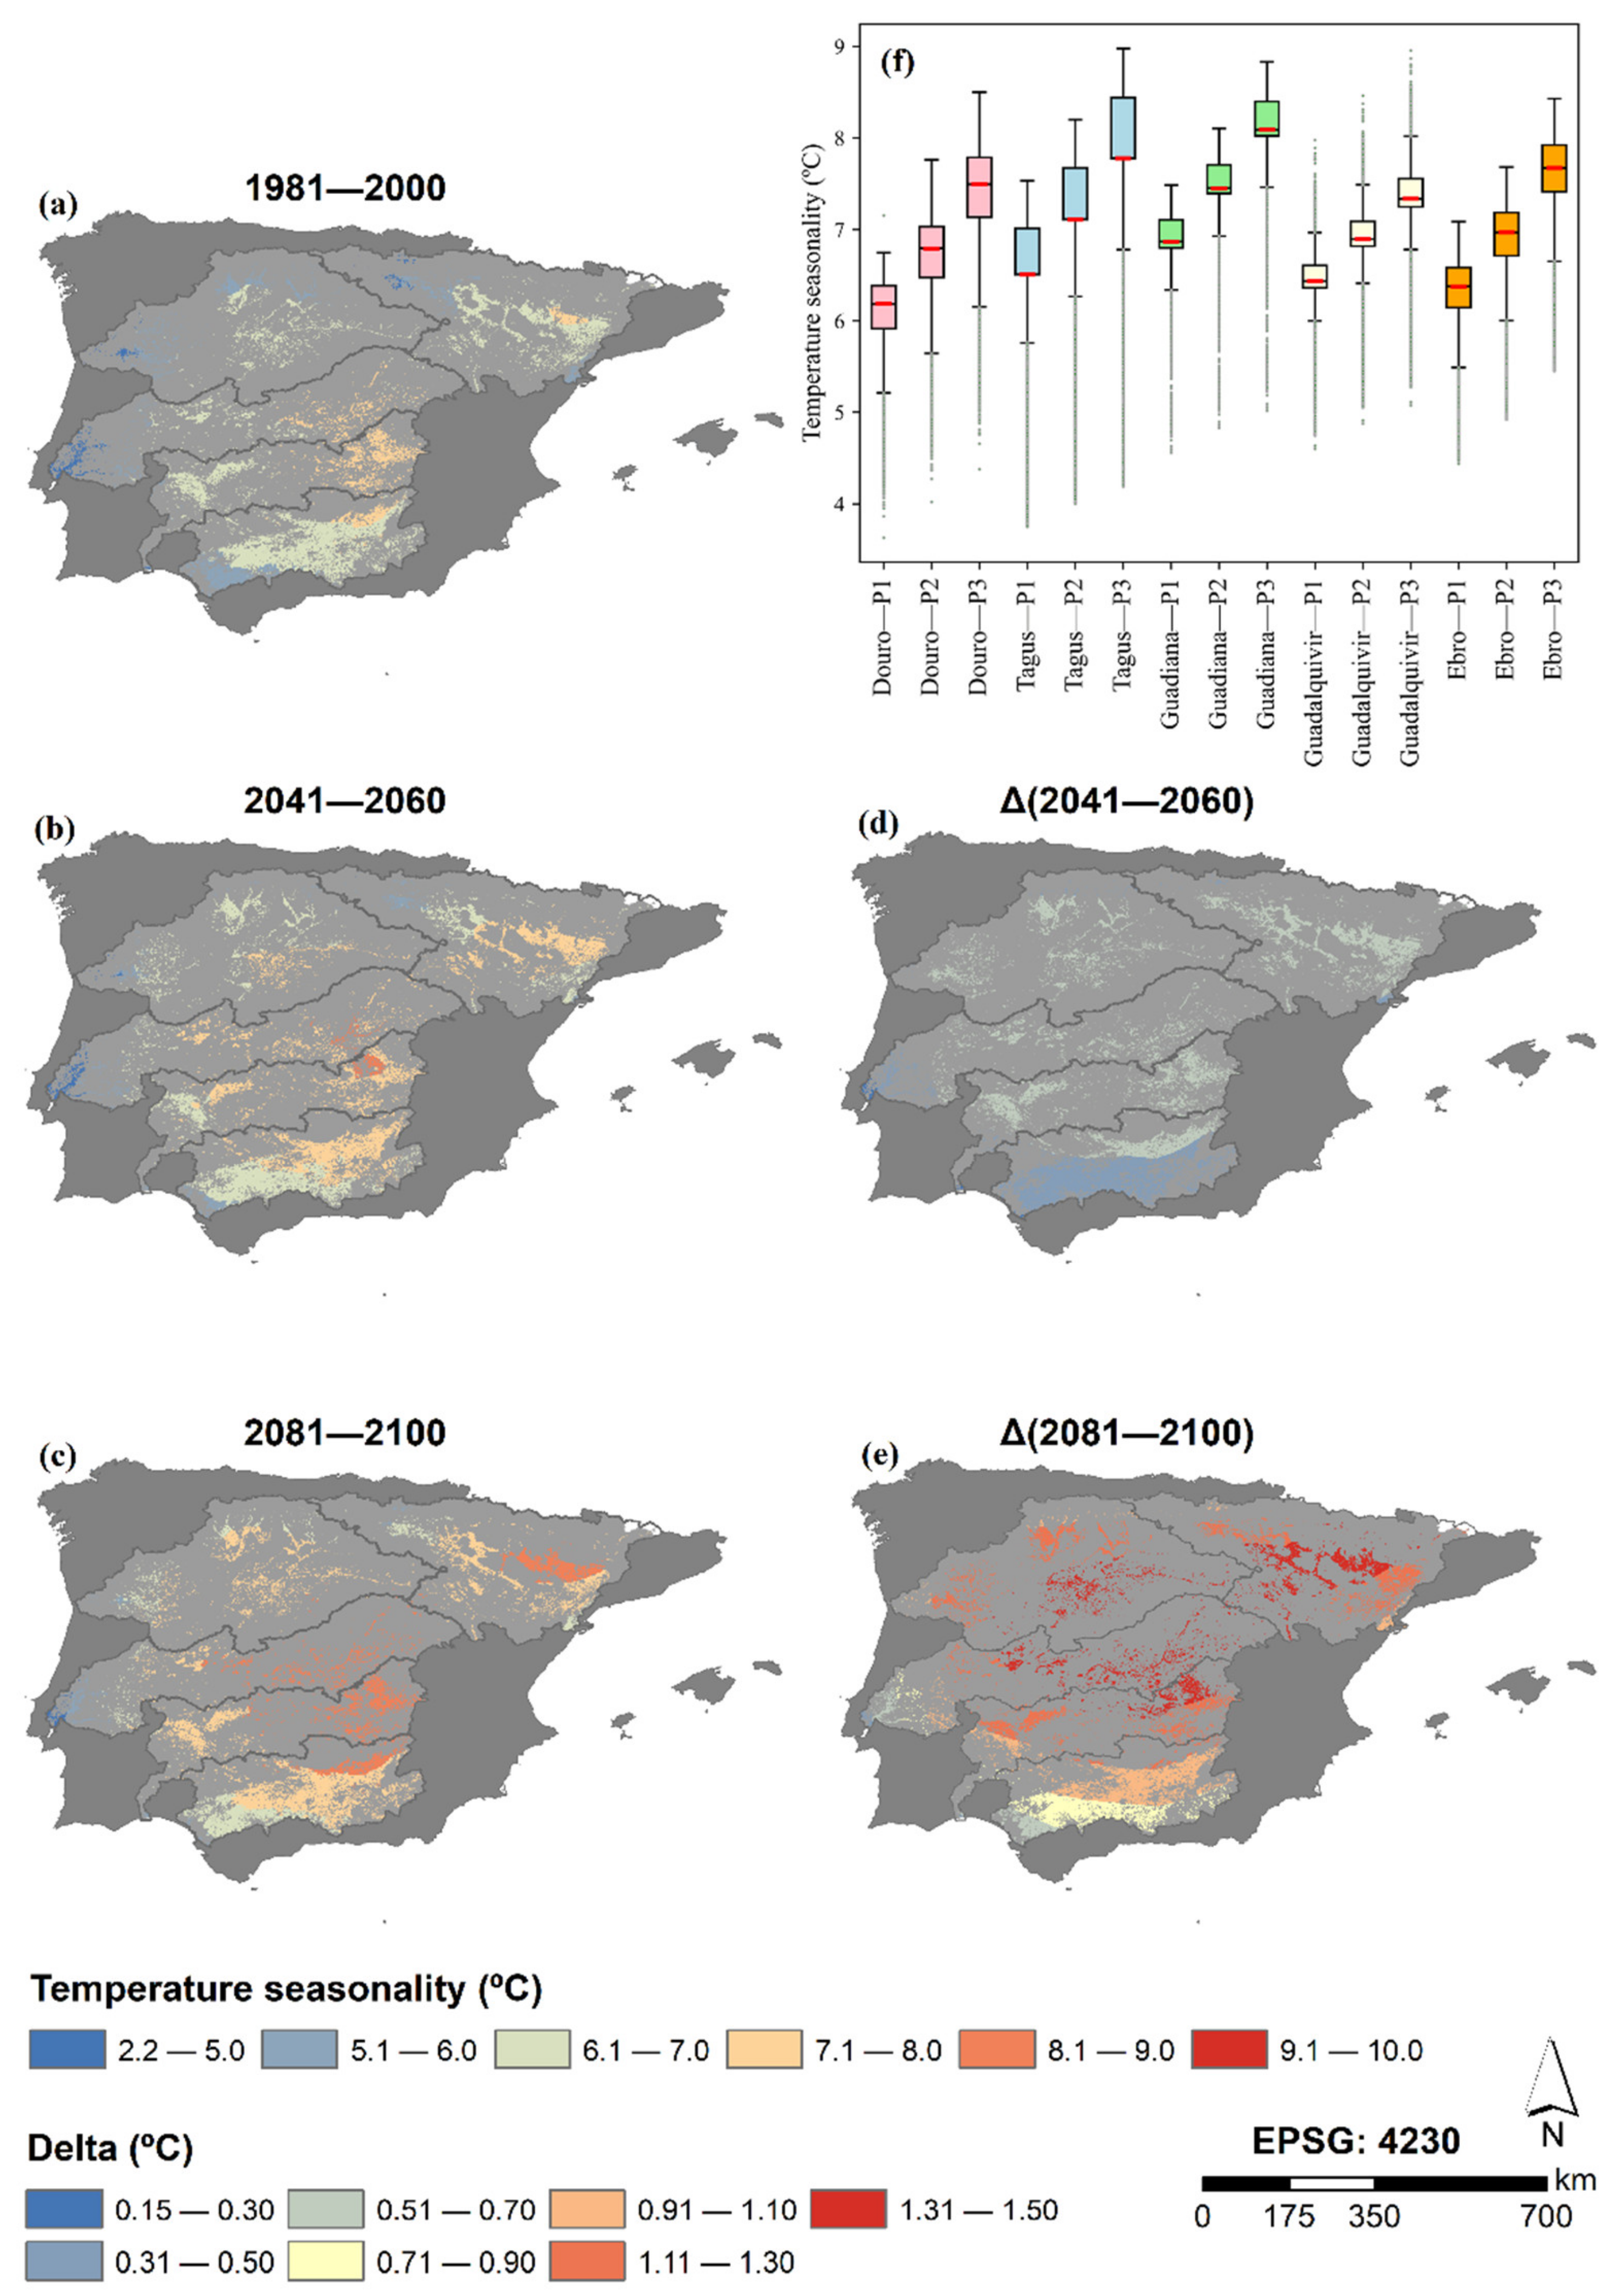
Unlike annual mean temperature, the spatial distribution of temperature seasonality is stronger in inner Iberia (Figure 5), with lower values in temperature seasonality observed in the IP coastal areas. The increase in temperature seasonality is also observed for both periods P2 (~+0.6 °C) and P3 (~+1.2 °C). The Guadalquivir catchment shows the smallest increase due to its proximity to the Mediterranean Sea (0.5 °C and 0.9 °C, for P2 and P3, respectively), and the smallest range (1.2 °C). Conversely, the Tagus catchment shows the highest range in temperature seasonality (1.9 °C).
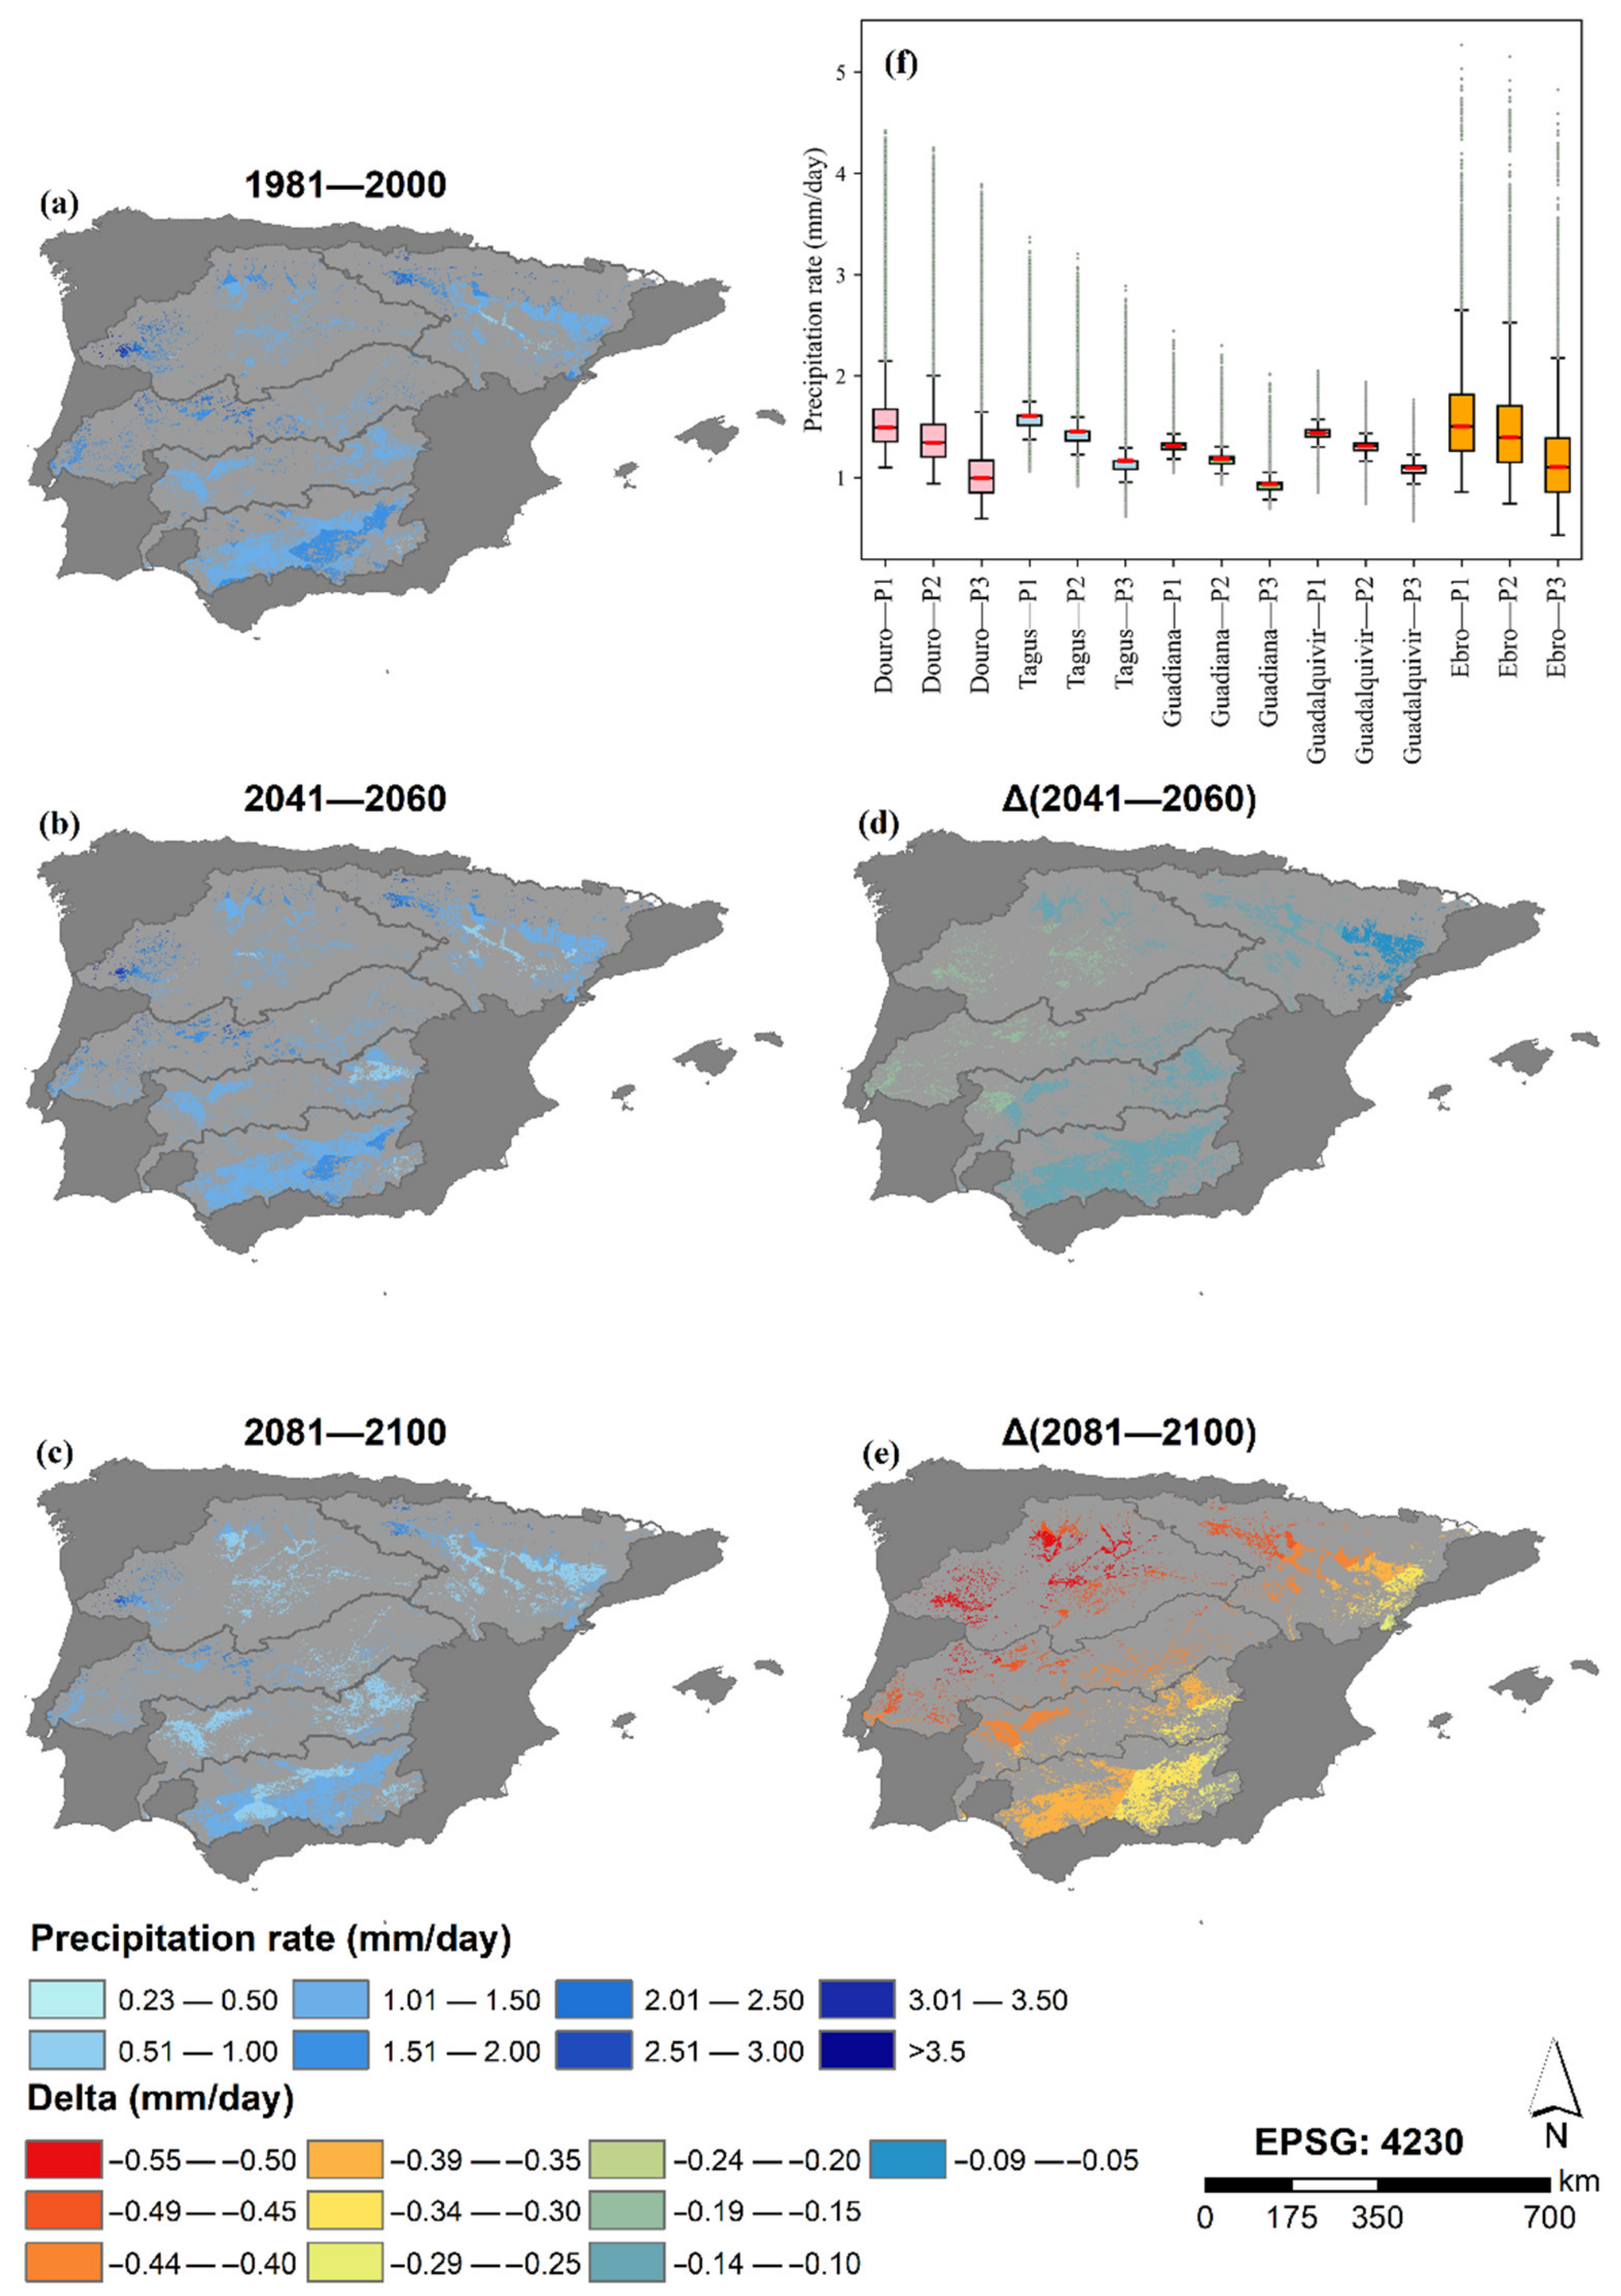
The spatial distribution of the precipitation rate (Figure 6) shows a general north to south decreasing gradient in the Iberian Peninsula, with values ranging from 3.5 to 0.2 mm × day−1, though the Guadiana catchment has the lowest observed values. The predicted values for both future periods show a decrease in precipitation rate for the entire area, with an average decrease of −0.1 mm × day−1 and −0.4 mm × day−1 for P2 and P3, respectively, where a northwest-southeast pattern is observed, with the Douro catchment showing the highest reduction in precipitation rate (−0.6 mm × day−1).
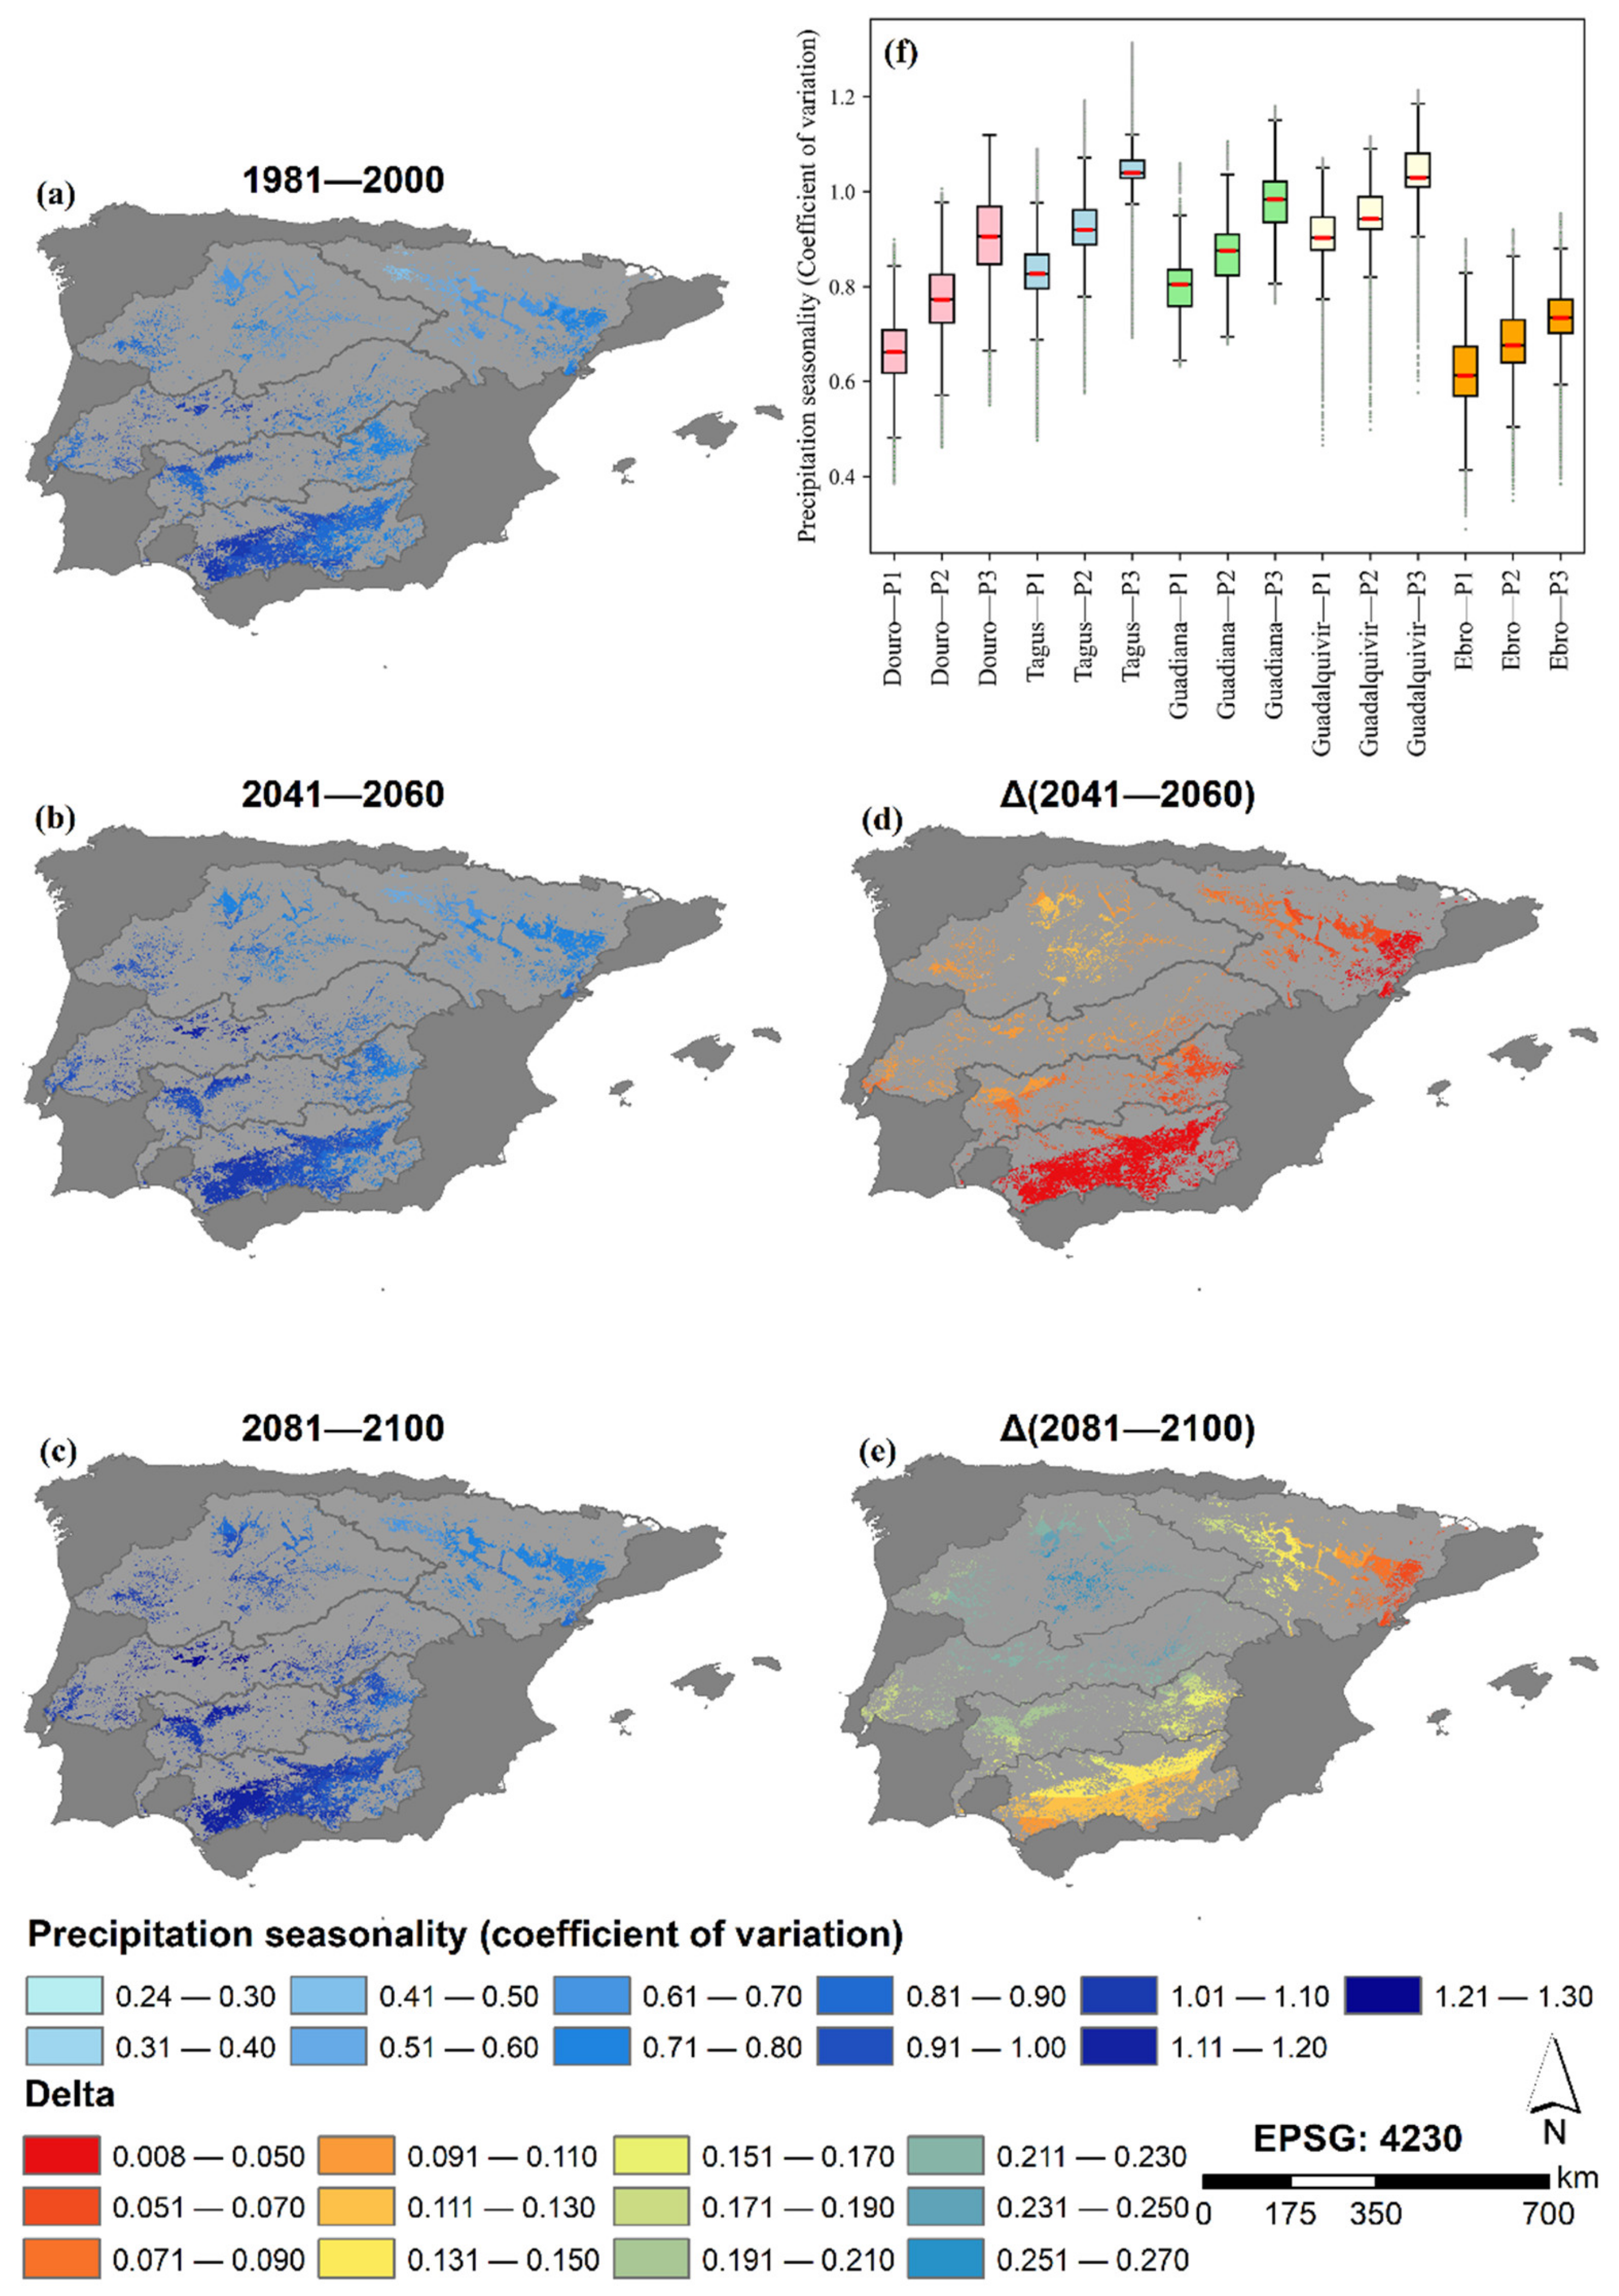
The spatial distribution of the precipitation seasonality (Figure 7) reveals an inverse pattern of the precipitation rate, and it is predicted to increase in future periods. This indicates that the areas with less precipitation will most likely have more extreme events, though these events tend to increase more in the north-western region of the IP.
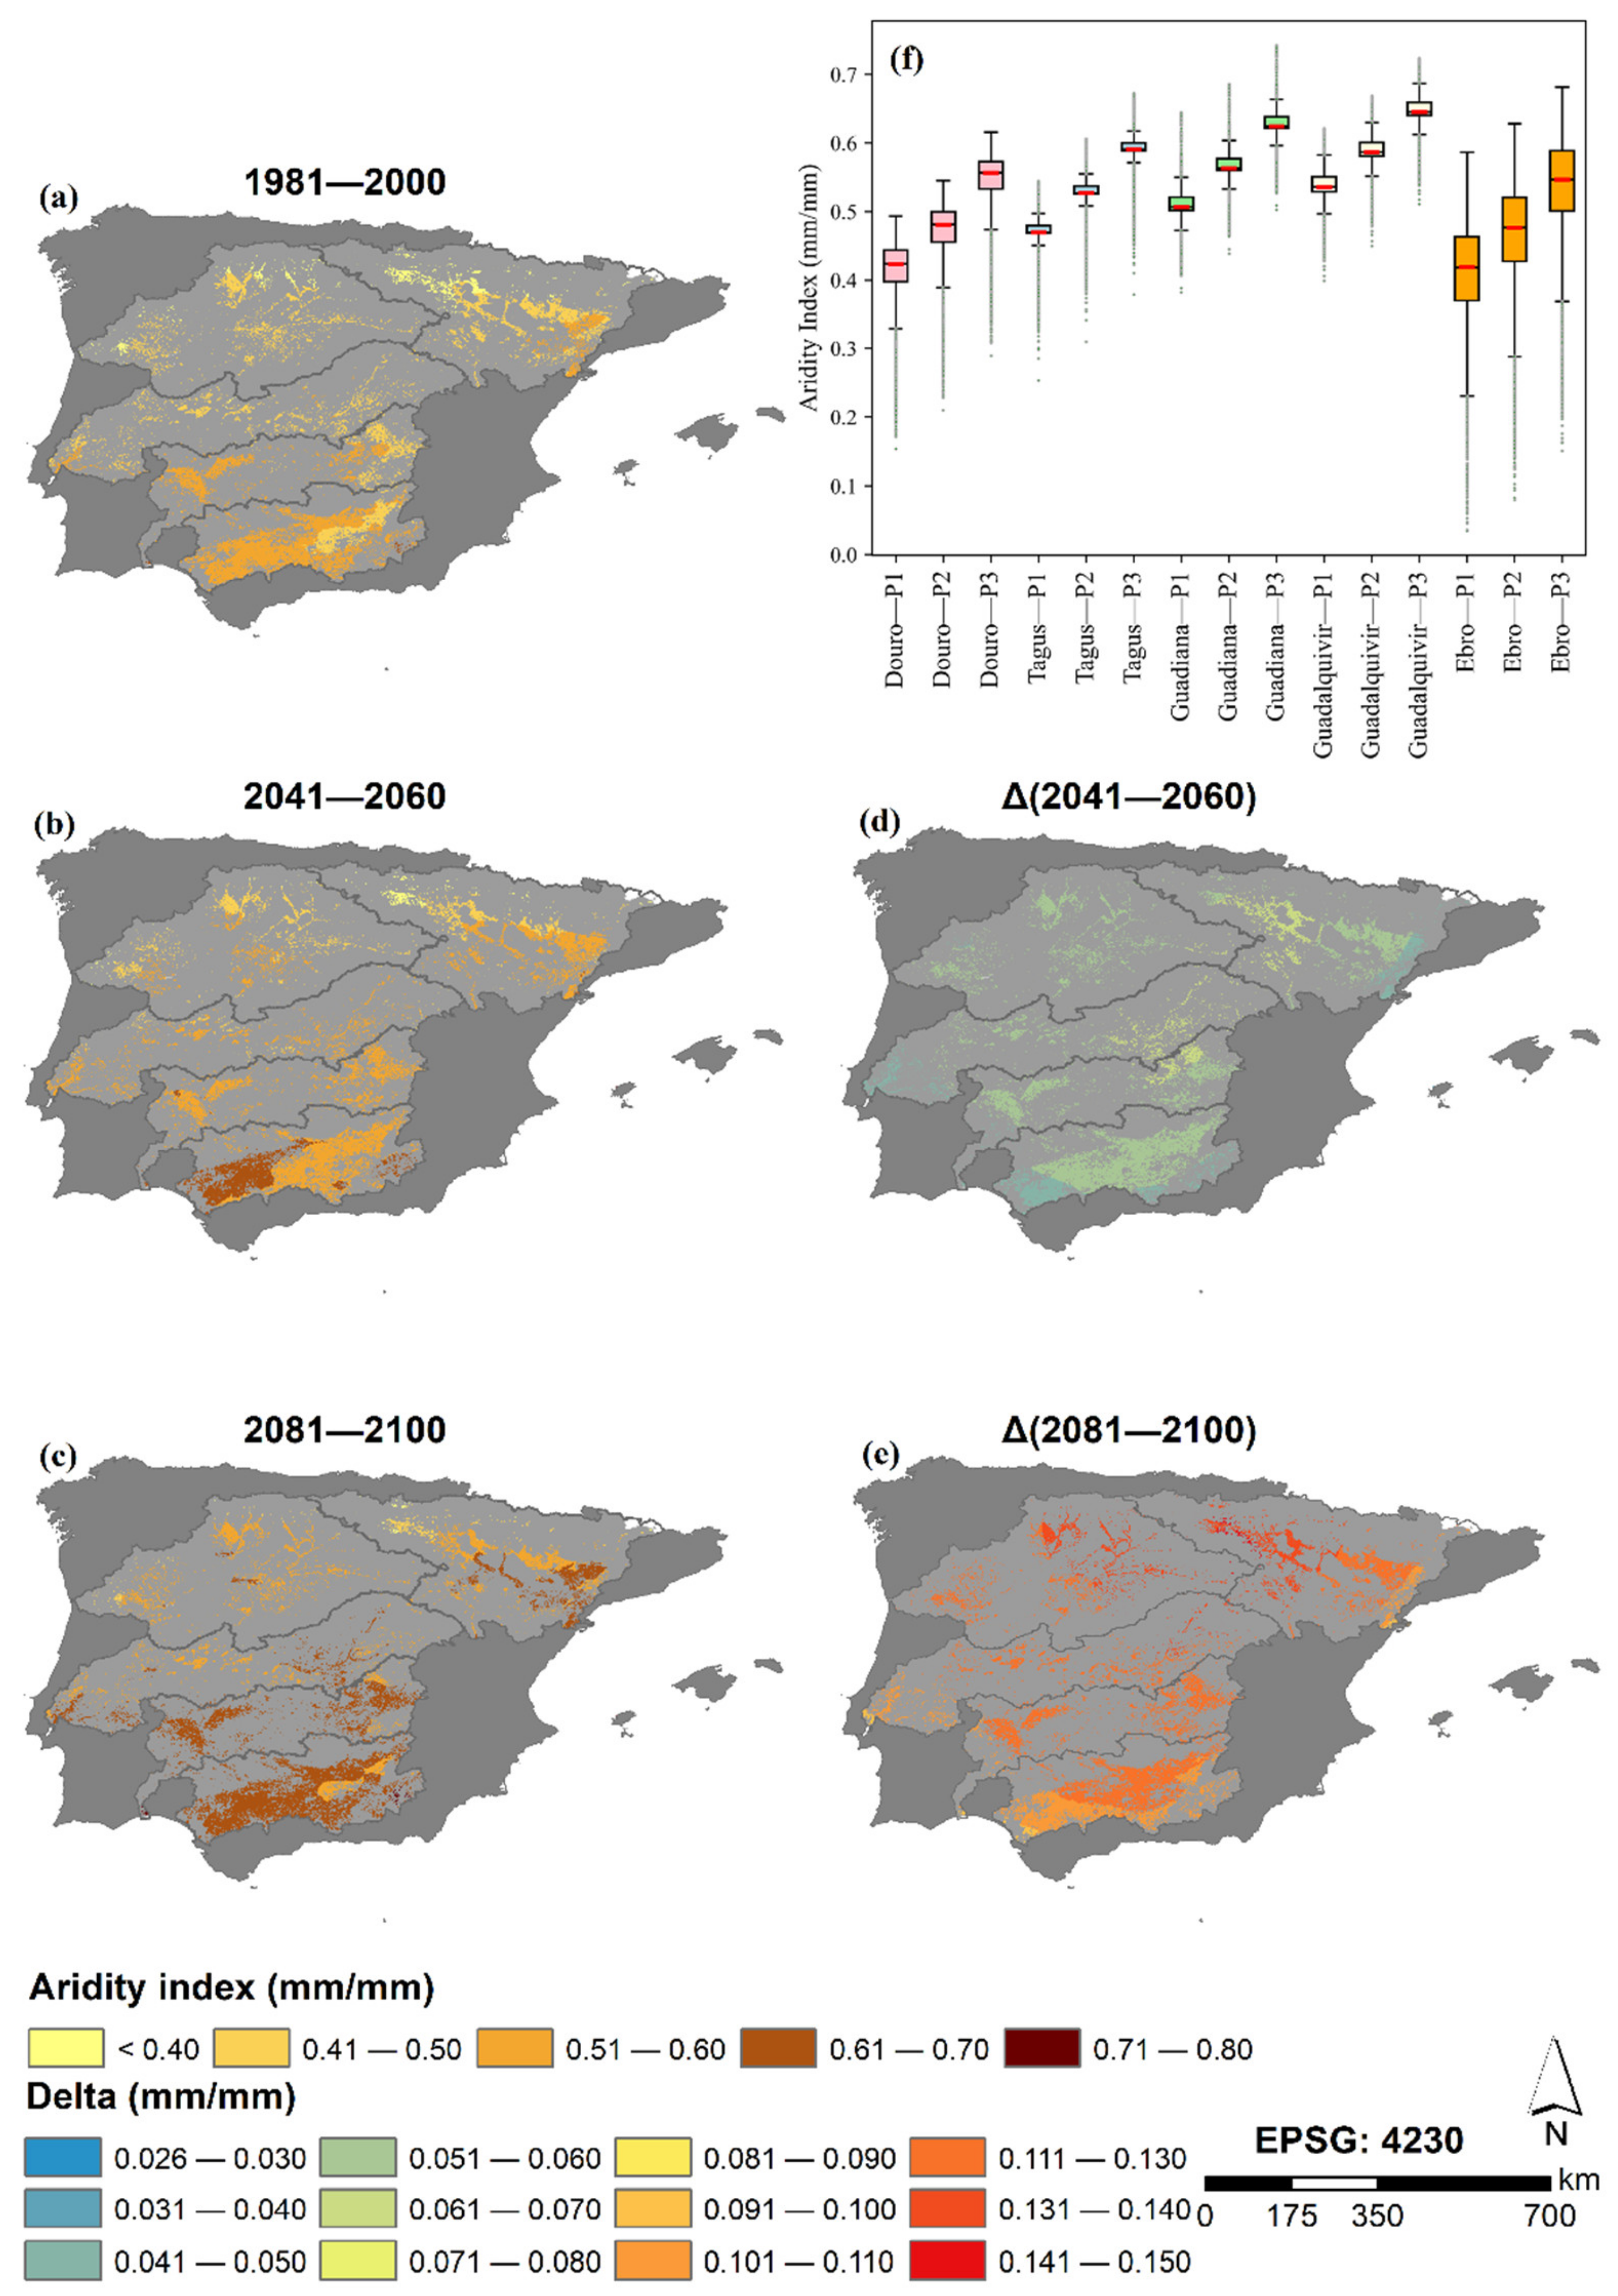
As for the annual mean temperature, the spatial distribution of the aridity index (Figure 8) shows a north to south increasing gradient, with average values ranging from 0.42 (the Douro and Ebro Region) to 0.54 (Guadalquivir region) in the historical period (1981–2000). This index value is predicted to increase very similarly in terms of spatial distribution, at 0.06 and 0.12 for both P2 and P3, respectively.
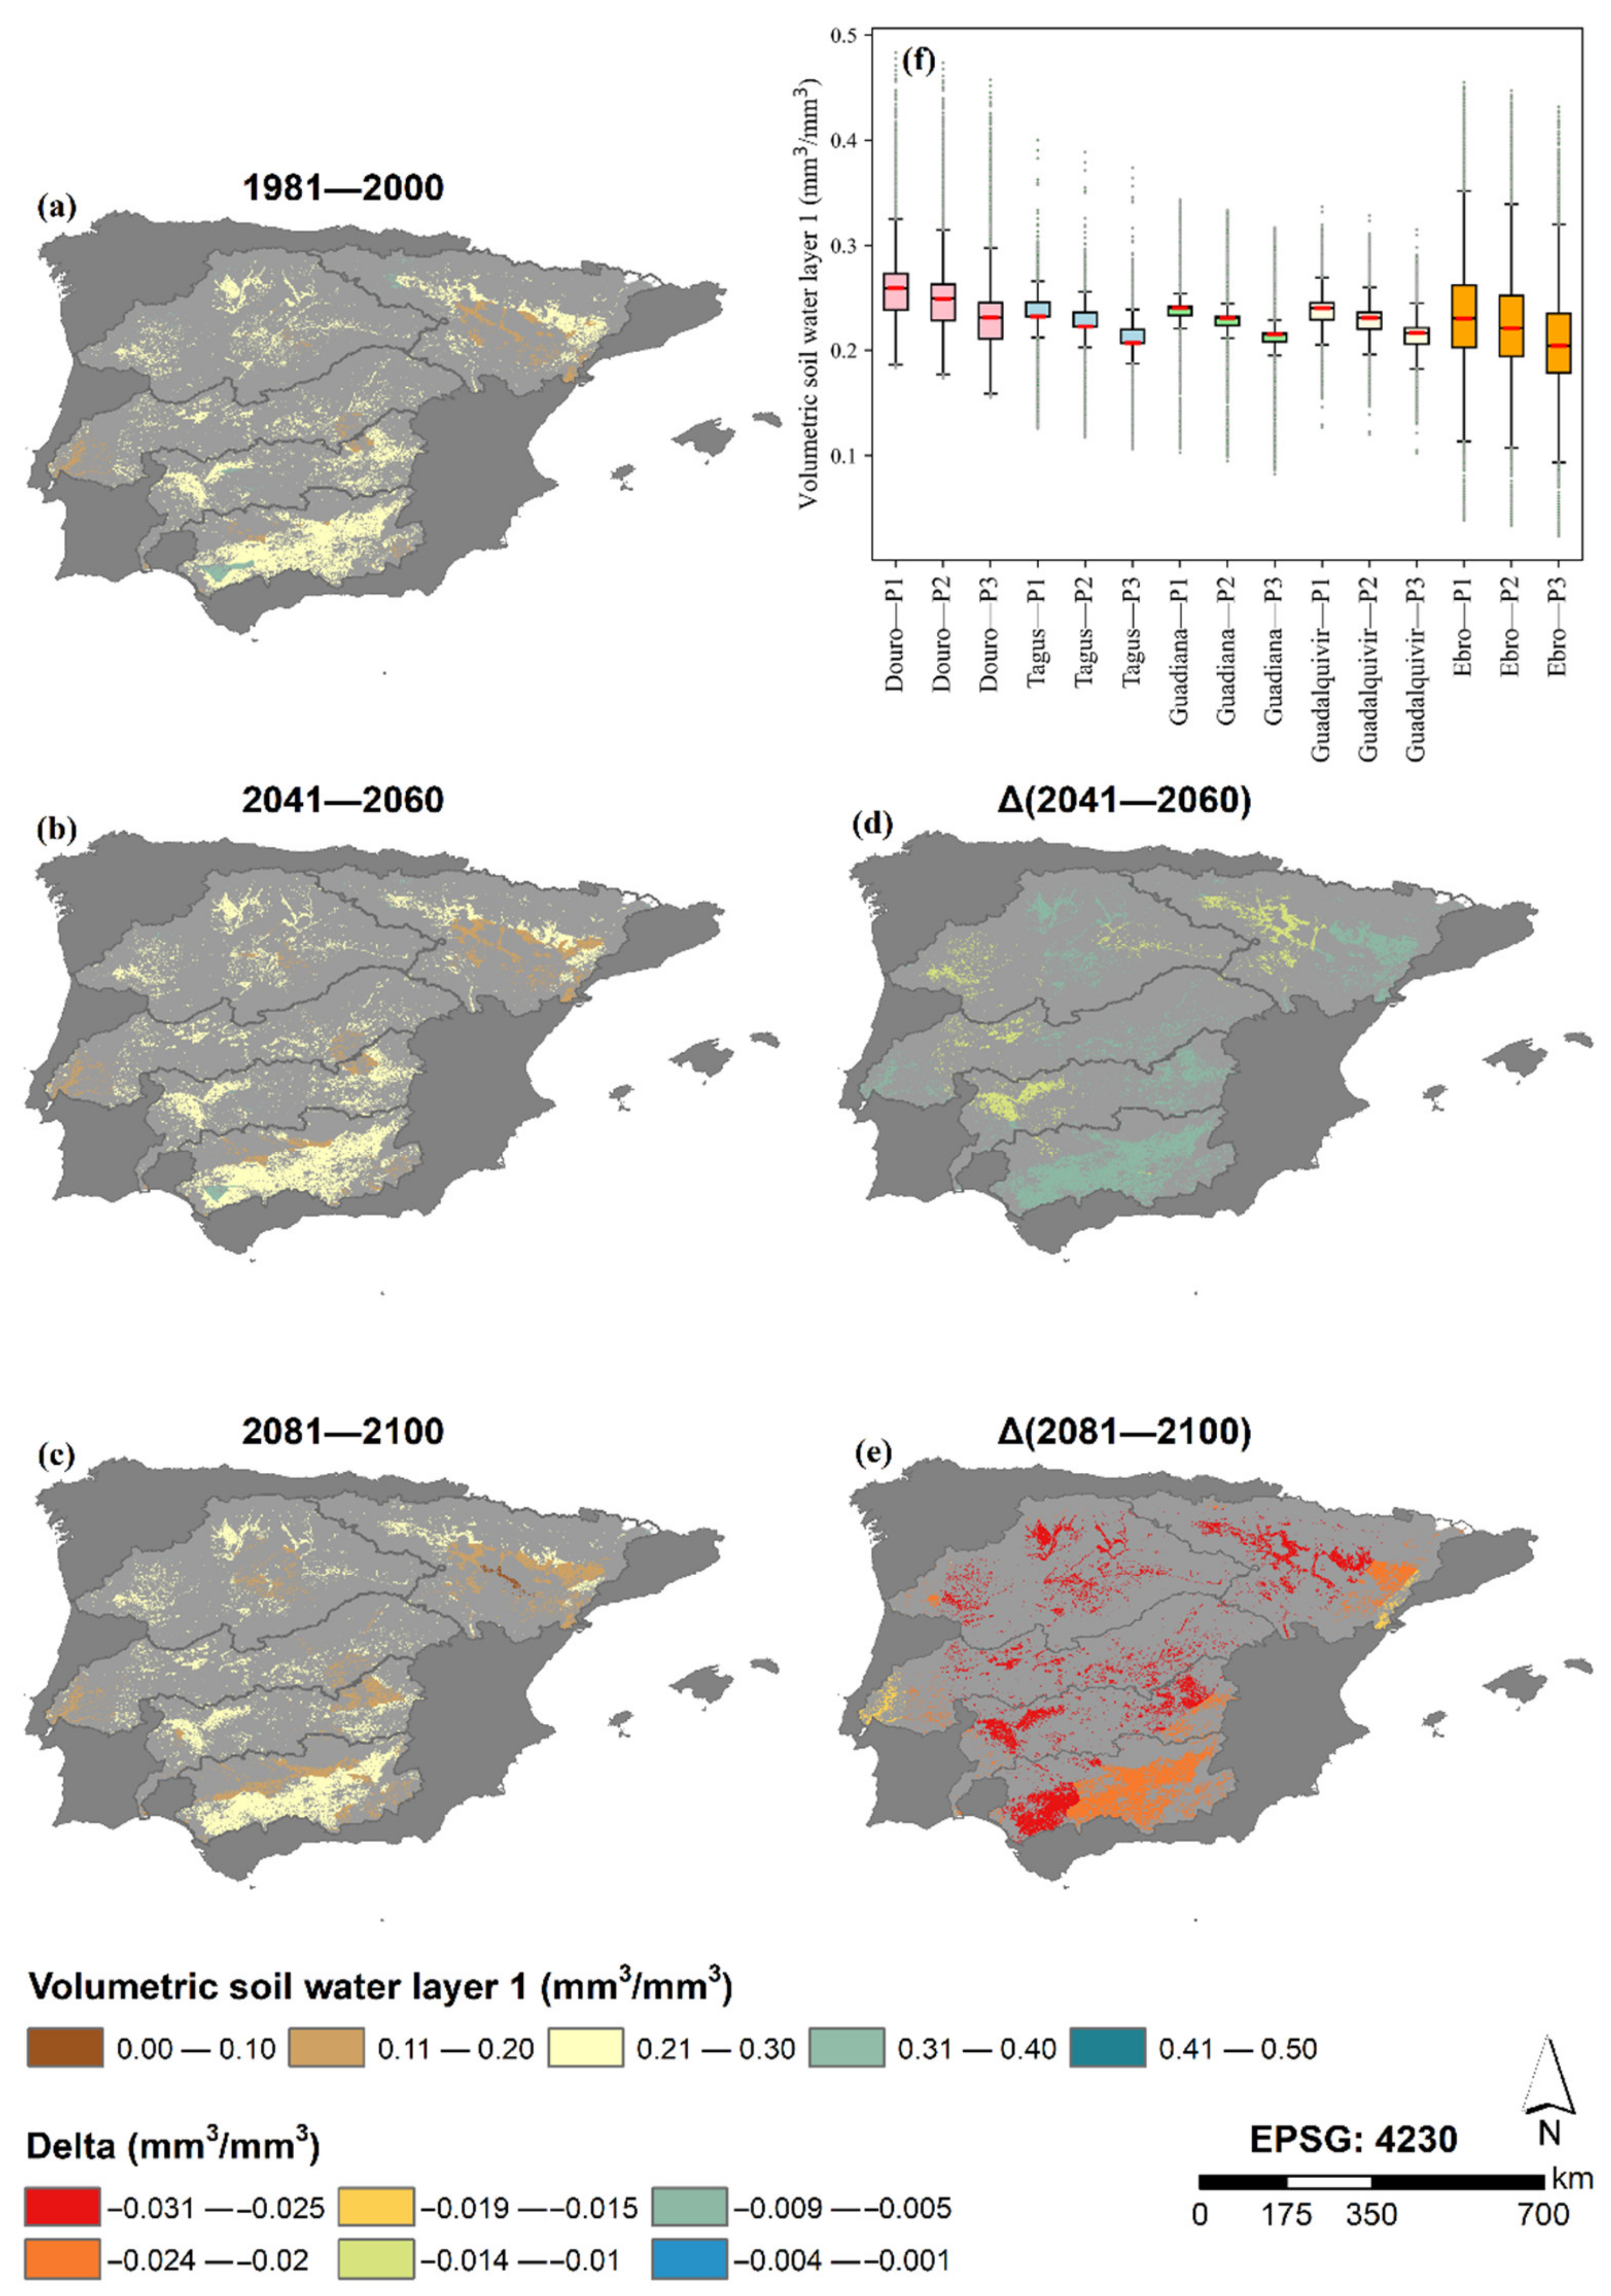
The volumetric soil water (Figure 9) is very constant in the IP (0.21–0.30), with a few sparse areas with a lower content of water (0.11–0.20) and small areas in the Ebro, Guadiana, and Guadalquivir regions with a higher content of water (0.31–0.40). The predicted variation for the future periods shows a generalized decrease in soil water content in the IP, with a higher impact in the northernmost area. The expected index tends to decrease by 0.01 and 0.03 mm3 × mm−3 for P2 and P3, respectively.
4. Discussion
The changes in the bioclimatic indices addressed here will most likely have major influences on regional economic and food sector production in the IP. The scenarios hint at a combination of an increase in air temperature with a decrease in precipitation, which leads to an increase in aridity and a decrease in water availability in the soil. These changes coupled with an expansion of agricultural areas and highly water-demanding crops may exacerbate the water deficits in the upcoming decades in the IP. This may lead to both environmentally and economically unsustainable productions that may compromise food security [27]. According to Olesen et al. [28,29], low precipitation and temperature extremes (e.g., heatwaves) are the main concern regarding crop productivity in southern Europe (and in the IP), namely by affecting the reproductive phase of plant growth. The increase in temperature can potentially increase the duration of the growing seasons and earlier phenological timings [12]. However, it can also disrupt the reproductive phase of plant growth, and even cause sterility in cereals [30]. Moreover, warmer climates may lead to more suitable conditions for triggering diseases and insect pests on crops, by enhancing their adaptability to survive to milder winter temperatures, while intensifying their outbreaks in the spring [27].
Considering our findings, it is predicted that a reduction in fruit yield across the entire study area is very likely. In the case of rice, it was found that drought stress impacts the process of fertilization, reducing the harvest index by 40% and decreasing the grain set [31]. Similarly, for every 1 °C rise in temperature, the yield decreased by 2.6% [32]. In traditional rainfed vineyards and olive grove systems, water is a key environmental factor for fruit production, even for drought-tolerant species [33]. In many studies regarding olive production in the Mediterranean countries, several showed a negative correlation between yield and the increase in temperature and the decrease in precipitation [34,35,36,37]. Furthermore, yield is also affected by long water deficit events [38], which are projected to be more frequent in the IP as a compound effect of higher temperatures, aridity increase (Figure 8) and water availability decrease in the soil (Figure 9). This is particularly apparent in the southern IP regions, where the highest change is observed, and olive grove areas are expanding. Furthermore, a reduction in olives tree cover of approximately 30% is expected [39,40,41] as a response to the annual temperature rise. Lionello et al. [37] stated that the climate trends observed in the Mediterranean area (drier and hotter conditions), will harm harvested olive (−19–−8%) and wine production (−26–−20%). These outcomes can be, to some extent, extrapolated for fruits and vegetables, particularly those from temperate climates and more reliant on water, as changes in temperature and precipitation will generally affect plant growth and response to pathogens [42]. Higher temperatures may cause a displacement of the potential areas for cultivation, maybe even increasing the potential distribution area for some crops [43,44,45]. For the proper development of the fruits, some crops need dormancy periods [46]. However, with the expected decrease in chilling hours, the yield is expected to decrease for these crops [47,48]. Moreover, the combined effects of increasing temperature and decreasing precipitation will significantly strengthen evapotranspiration, increasing even further the water requirement of the plants to maintain their yield [49]. Additionally, as seen in Figure 7, the precipitation seasonality is expected to strengthen in central and southern areas of the IP. This commonly translates into the concentration of precipitation in the form of storms, increasing the erosion potential in trees and fruit plantations, also affecting productivity [29,50]. Conversely, the increase in CO2 concentrations in the atmosphere can positively stimulate photosynthesis, boosting plant growth and yield in most crops, increasing water use efficiency [51,52]. Several studies considering the carbon fertilization effect [53,54,55,56,57,58] reported that plant evapotranspiration could be reduced by 4% for dry crops and 6–8% for irrigated crops, increasing water efficiency up to 51% [41].
Controversy regarding global water scarcity and food security has been increasingly discussed in the literature [59,60,61,62,63], and this debate will endure as climate change awareness is growing. Estimates of future water and food demand are also vague, whilst climate change is only adding up to the problem [64]. As previously observed in Figure 2, there is a considerable increase in water-dependent areas in the past decades in the IP, increasing the vulnerability of these systems and water security for the future decades. Although intensive agriculture can ensure food security, increasing yields, the available natural resources (mainly water) can be negatively affected (in both quantity and quality) and threatened by a changing climate. As mentioned, the increase in temperature (Figure 4 and Figure 5) may lead to longer crop growing seasons and advancements in phenology, though the decrease in water availability (Figure 9) may significantly constrain crop growth and development, overcoming tolerable plant water stress thresholds. On the other hand, the use of agrochemicals may accelerate fruit development and ripening to fit the growth period, but will also contribute to soil and water contamination, as well as to the emission of greenhouse gases [65]. The projected climate change scenarios imply that many crops may either require (more) irrigation to maintain their current cultivation areas or shift to more suitable areas. Therefore, a thorough assessment of the impacts of climate change on water security to respond to food demand is key for the regional and global economy [64]. Improved water management (e.g., water retention basins) and infrastructures (e.g., smart irrigation systems, with deficit irrigation based on plant water status) can reduce the impact of water shortages and partially meet water demand for food production [66].
5. Conclusions
While a variety of caveats and open issues remain unaddressed, this study highlights that areas that have an intrinsic strong connection to water availability (mainly agricultural areas with high water demand) are expanding or shifting towards new regions that will be most affected by climate change, thereby compromising the sustainability of the whole sector in the medium to long term. Despite the inherent difficulty in predicting the potential impacts and effects of climate change with high confidence, given the uncertainties associated with it (e.g., uncertainties in the pathways of anthropogenic radiative forcing, climate model uncertainties) and the complexity and non-linearity of crop–climate interactions, climate change is already ongoing. Although the agricultural sector may be able to adapt to such changes, this adaptation potential is strongly tied to the timescale of the changes and to whether some critical thresholds (no-return points) are surpassed or not. Overall, the agricultural systems in the IP must adapt to much warmer, drier/arid, and more irregular and extreme climates, while simultaneously promoting carbon-neutrality through the implementation of mitigation strategies. This tough agricultural transition is possible and critical to maintaining food security, though it will require the adoption of more sustainable and climate-resilient agricultural practices, which have not been entirely pursued in recent decades, as is demonstrated in the present study.
Supplementary Materials
The following supporting information can be downloaded at: https://www.mdpi.com/article/10.3390/w14050768/s1, Table S1: Models used for the ensemble of each climate variable retrieved from the Copernicus Climate Change Service information; Table S2: Medians, first and third quartile for each climate variable, and river catchment for the historical period (P1), 2041–2060 (P2), and 2081–2100 (P3).
Author Contributions
Conceptualization, A.F. and J.A.S.; methodology, A.F., C.A. and J.A.S.; data curation, A.F.; writing—original draft preparation, A.F.; writing—review and editing, A.F., C.A. and J.A.S. All authors have read and agreed to the published version of the manuscript.
Funding
This work is supported by National Funds by FCT—Portuguese Foundation for Science and Technology, under the project UIDB/04033/2020.
Institutional Review Board Statement
Not applicable.
Informed Consent Statement
Not applicable.
Data Availability Statement
Not applicable.
Acknowledgments
We acknowledge the ESA CCI Land Cover and the EC C3S Land Cover project and the Copernicus Climate Change Service.
Conflicts of Interest
The authors declare no conflict of interest.
References
- Ludwig, F.; van Scheltinga, C.T.; Verhagen, J.; Kruijt, B.; van Ierland, E.C.; Dellink, R.B.; de Bruin, K.; de Bruin, K.C.; Kabat, P. Climate Change Impacts on Developing Countries-EU Accountability; Environmental Economics and Natural Resources, WIMEK, Wageningen Environmental Research; European Parliament: Brussls, Belgium, 2007; p. 53. Available online: http://www.europarl.europa.eu/activities/committees/studies/download.do?file=18331#search=%20climate%20change%20 (accessed on 1 November 2021).
- Vargas-Amelin, E.; Pindado, P. The Challenge of Climate Change in Spain: Water Resources, Agriculture and Land. J. Hydrol. 2014, 518, 243–249. [Google Scholar] [CrossRef]
- IPCC. Impacts, Adaptation and Vulnerability. Contribution of Working Group II to the Fourth Assessment Report of the Intergovernmental Panel on Climate Change; IPCC: Geneva, Switzerland, 2007; Volume 976. [Google Scholar]
- Tilman, D.; Clark, M. Global Diets Link Environmental Sustainability and Human Health. Nature 2014, 515, 518–522. [Google Scholar] [CrossRef] [PubMed]
- Noya, I.; González-García, S.; Bacenetti, J.; Fiala, M.; Moreira, M.T. Environmental Impacts of the Cultivation-Phase Associated with Agricultural Crops for Feed Production. J. Clean. Prod. 2018, 172, 3721–3733. [Google Scholar] [CrossRef]
- Kirchmann, H.; Thorvaldsson, G. Challenging Targets for Future Agriculture. Eur. J. Agron. 2000, 12, 145–161. [Google Scholar] [CrossRef]
- Zisopoulou, K.; Zisopoulos, D.; Panagoulia, D. Water Economics: An In-Depth Analysis of the Connection of Blue Water with Some Primary Level Aspects of Economic Theory I. Water 2022, 14, 103. [Google Scholar] [CrossRef]
- FAO. The State of Food and Agriculture: Climate Change, Agriculture and Food Security; Food and Agriculture Organization of the United Nations: Rome, Italy, 2016. [Google Scholar]
- Schwalm, C.R.; Glendon, S.; Duffy, P.B. RCP8.5 tracks cumulative CO2 emissions. Proc. Natl. Acad. Sci. USA 2020, 117, 19656–19657. [Google Scholar] [CrossRef]
- UNICEF; World Health Organization. The State of Food Security and Nutrition in the World 2017: Building Resilience for Peace and Food Security; FAO: Rome, Italy, 2017. [Google Scholar]
- IPCC. Climate Change 2014-Impacts, Adaptation, and Vulnerability: Summary for Policymakers; Intergovernmental Panel on Climate Change; Cambridge University Press: Cambridge, UK, 2014; p. 32. ISBN 9781107058071. Available online: http://www.cambridge.org/gb/academic/subjects/earth-and-environmental-science/climatology-and-climate-change/climate-change-2014-impacts-adaptation-and-vulnerability-part-global-and-sectoral-aspects-working-group-ii-contribution-ipcc-fifth-assessment-report-volume-1?format=PB (accessed on 1 November 2021).
- Rötter, R.; van de Geijn, S.C. Climate Change Effects on Plant Growth, Crop Yield and Livestock. Clim. Chang. 1999, 43, 651–681. [Google Scholar] [CrossRef]
- Attavanich, W.; McCarl, B.A.; Fuller Regents Professor, S.W.; Ahmedov Candidate, Z. The Effect of Climate Change on Transportation Flows and Inland Waterways Due to Climate-Induced Shifts in Crop Production Patterns; European Parliament: Strasbourg, France, 2011; Available online: https://mpra.ub.uni-muenchen.de/84005/ (accessed on 1 November 2021).
- Cho, S.J.; Woodward, R.T.; Wu, X.; Gan, J. Three Essays on Climate Change Adaptation and Impacts: Econometric Investigations, a Dissertation; Syracuse University: Syracuse, NY, USA, 2015; Available online: https://surface.syr.edu/etd/1326 (accessed on 15 November 2021).
- Meiner, A. Landscapes in Transition an Account of 25 Years of Land Cover Change in Europe; European Environmental Agency (EEA): Copenhagen, Denmark, 2017; p. 84. [Google Scholar] [CrossRef]
- Hill, B. Understanding the Common Agricultural Policy; Routledge: London, UK, 2012; ISBN 1849775613. [Google Scholar]
- Ambros, P.; Granvik, M. Trends in Agricultural Land in EU Countries of the Baltic Sea Region from the Perspective of Resilience and Food Security. Sustainability 2020, 12, 5851. [Google Scholar] [CrossRef]
- Burkitbayeva, S.; Swinnen, J. Smallholder Agriculture in Transition Economies. J. Agrar. Chang. 2018, 18, 882–892. [Google Scholar] [CrossRef]
- Rosenzweig, C.; Strzepek, K.M.; Major, D.C.; Iglesias, A.; Yates, D.N.; McCluskey, A.; Hillel, D. Water Resources for Agriculture in a Changing Climate: International Case Studies. Glob. Environ. Chang. 2004, 14, 345–360. [Google Scholar] [CrossRef]
- Andrade, C.; Contente, J. Climate Change Projections for the Worldwide Bioclimatic Classification System in the Iberian Peninsula until 2070. Int. J. Climatol. 2020, 40, 5863–5886. [Google Scholar] [CrossRef]
- Andrade, C.; Corte-Real, J. Assessment of the Spatial Distribution of Continental-Oceanic Climate Indices in the Iberian Peninsula. Int. J. Climatol. 2017, 37, 36–45. [Google Scholar] [CrossRef]
- WCRP. Coupled Model Intercomparison Project---Phase 5---CMIP5. CLIVAR Exchanges Special Issue (World Clim. Res. Programme 2011); WCRP: Geneva, Switzerland, 2011; Volume 16, Available online: https://www.clivar.org/sites/default/files/documents/Exchanges56.pdf (accessed on 1 November 2021).
- Van Vuuren, D.P.; Edmonds, J.; Kainuma, M.; Riahi, K.; Thomson, A.; Hibbard, K.; Hurtt, G.C.; Kram, T.; Krey, V.; Lamarque, J.F.; et al. The Representative Concentration Pathways: An Overview. Clim. Chang. 2011, 109, 5–31. [Google Scholar] [CrossRef]
- Copernicus Climate Change Service. Downscaled Bioclimatic Indicators for Selected Regions from 1950 to 2100 Derived from Climate Projections. Available online: https://cds.climate.copernicus.eu/cdsapp#!/dataset/sis-biodiversity-cmip5-regional?tab=overview (accessed on 1 November 2021).
- Hersbach, H.; Bell, B.; Berrisford, P.; Hirahara, S.; Horányi, A.; Muñoz-Sabater, J.; Nicolas, J.; Peubey, C.; Radu, R.; Schepers, D.; et al. The ERA5 Global Reanalysis. Q. J. R. Meteorol. Soc. 2020, 146, 1999–2049. [Google Scholar] [CrossRef]
- Swinnen, E.; Tote, C.; Tavares, J.L.; Lacaze, R. Copernicus Global Land Service NDVI Continuity with Sentinel-3 Data. In Proceedings of the 2021 IEEE International Geoscience and Remote Sensing Symposium IGARSS, Brussels, Belgium, 11–16 July 2021; Institute of Electrical and Electronics Engineers (IEEE): Manhattan, NY, USA, 2021; pp. 6731–6734. [Google Scholar]
- Raza, A.; Razzaq, A.; Mehmood, S.S.; Zou, X.; Zhang, X.; Lv, Y.; Xu, J. Impact of Climate Change on Crops Adaptation and Strategies to Tackle Its Outcome: A Review. Plants 2019, 8, 34. [Google Scholar] [CrossRef] [Green Version]
- Olesen, J.E.; Bindi, M. Consequences of Climate Change for European Agricultural Productivity, Land Use and Policy. Eur. J. Agron. 2002, 16, 239–262. [Google Scholar] [CrossRef]
- Olesen, J.E.; Trnka, M.; Kersebaum, K.C.; Skjelvåg, A.O.; Seguin, B.; Peltonen-Sainio, P.; Rossi, F.; Kozyra, J.; Micale, F. Impacts and Adaptation of European Crop Production Systems to Climate Change. Eur. J. Agron. 2011, 34, 96–112. [Google Scholar] [CrossRef]
- Winkel, T.; Renno, J.-F.; Payne, W.A. Effect of the Timing of Water Deficit on Growth, Phenology and Yield of Pearl Millet (Pennisetum glaucum (L.) R. Br.) Grown in Sahelian Conditions. J. Exp. Bot. 1997, 48, 1001–1009. [Google Scholar] [CrossRef] [Green Version]
- Garrity, D.P.; O’Toole, J.C. Screening Rice for Drought Resistance at the Reproductive Phase. Field Crops Res. 1994, 39, 99–110. [Google Scholar] [CrossRef]
- Zhao, C.; Liu, B.; Piao, S.; Wang, X.; Lobell, D.B.; Huang, Y.; Huang, M.; Yao, Y.; Bassu, S.; Ciais, P.; et al. Temperature Increase Reduces Global Yields of Major Crops in Four Independent Estimates. Proc. Natl. Acad. Sci. USA 2017, 114, 9326–9331. [Google Scholar] [CrossRef] [PubMed] [Green Version]
- Orlandi, F.; Rojo, J.; Picornell, A.; Oteros, J.; Pérez-Badia, R.; Fornaciari, M. Impact of Climate Change on Olive Crop Production in Italy. Atmosphere 2020, 11, 595. [Google Scholar] [CrossRef]
- Oteros, J.; Orlandi, F.; García-Mozo, H.; Aguilera, F.; ben Dhiab, A.; Bonofiglio, T.; Abichou, M.; Ruiz-Valenzuela, L.; del Trigo, M.M.; Díaz De La Guardia, C.; et al. Better Prediction of Mediterranean Olive Production Using Pollen-Based Models. Agron. Sustain. Dev. 2014, 34, 685–694. [Google Scholar] [CrossRef] [Green Version]
- Ribeiro, H.; Cunha, M.; Abreu, I. Quantitative Forecasting of Olive Yield in Northern Portugal Using a Bioclimatic Model. Aerobiologia 2008, 24, 141. [Google Scholar] [CrossRef]
- Ben Dhiab, A.; ben Mimoun, M.; Oteros, J.; Garcia-Mozo, H.; Domínguez-Vilches, E.; Galán, C.; Abichou, M.; Msallem, M. Modeling Olive-Crop Forecasting in Tunisia. Theor. Appl. Climatol. 2017, 128, 541–549. [Google Scholar] [CrossRef]
- Lionello, P.; Congedi, L.; Reale, M.; Scarascia, L.; Tanzarella, A. Sensitivity of Typical Mediterranean Crops to Past and Future Evolution of Seasonal Temperature and Precipitation in Apulia. Reg. Environ. Chang. 2014, 14, 2025–2038. [Google Scholar] [CrossRef]
- Giorio, P.; Sorrentino, G.; D’andria, R. Stomatal Behaviour, Leaf Water Status and Photosynthetic Response in Field-Grown Olive Trees under Water Deficit. Environ. Exp. Bot. 1999, 42, 95–104. [Google Scholar] [CrossRef]
- Ropero, R.F.; Rumí, R.; Aguilera, P.A. Bayesian Networks for Evaluating Climate Change Influence in Olive Crops in Andalusia, Spain. Nat. Resour. Modeling 2019, 32, e12169. [Google Scholar] [CrossRef]
- Benyei, P.; Cohen, M.; Gresillon, E.; Angles, S.; Araque-Jiménez, E.; Alonso-Roldán, M.; Espadas-Tormo, I. Pruning Waste Management and Climate Change in Sierra Mágina’s Olive Groves (Andalusia, Spain). Reg. Environ. Chang. 2018, 18, 595–605. [Google Scholar] [CrossRef] [Green Version]
- Sousa, A.A.R.; Barandica, J.M.; Aguilera, P.A.; Rescia, A.J. Examining Potential Environmental Consequences of Climate Change and Other Driving Forces on the Sustainability of Spanish Olive Groves under a Socio-Ecological Approach. Agriculture 2020, 10, 509. [Google Scholar] [CrossRef]
- Finnan, J.M.; Donnelly, A.; Burke, J.I.; Jones, M.B. The Effects of Elevated Concentrations of Carbon Dioxide and Ozone on Potato (Solanum tuberosum L.) Yield. Agric. Ecosyst. Environ. 2002, 88, 11–22. [Google Scholar] [CrossRef]
- Foguesatto, C.R.; Artuzo, F.D.; Talamini, E.; Machado, J.A.D. Understanding the Divergences between Farmer’s Perception and Meteorological Records Regarding Climate Change: A Review. Environ. Dev. Sustain. 2020, 22, 1–16. [Google Scholar] [CrossRef]
- McCarl, B.A.; Thayer, A.W.; Jones, J.P.H. The Challenge of Climate Change Adaptation for Agriculture: An Economically Oriented Overview. J. Agric. Appl. Econ. 2016, 48, 321–344. [Google Scholar] [CrossRef] [Green Version]
- Galán, C.; García-Mozo, H.; Vázquez, L.; Ruiz, L.; de La Guardia, C.D.; Trigo, M.M. Heat Requirement for the Onset of the Olea europaea L. Pollen Season in Several Sites in Andalusia and the Effect of the Expected Future Climate Change. Int. J. Biometeorol. 2005, 49, 184–188. [Google Scholar] [CrossRef] [PubMed]
- Moriondo, M.; Leolini, L.; Brilli, L.; Dibari, C.; Tognetti, R.; Giovannelli, A.; Rapi, B.; Battista, P.; Caruso, G.; Gucci, R.; et al. A Simple Model Simulating Development and Growth of an Olive Grove. Eur. J. Agron. 2019, 105, 129–145. [Google Scholar] [CrossRef]
- Orlandi, F.; Garcia-Mozo, H.; Vazquez Ezquerra, L.; Romano, B.; Dominguez, E.; Galan, C.; Fornaciari, M. Phenological Olive Chilling Requirements in Umbria (Italy) and Andalusia (Spain). Plant Biosyst. 2004, 138, 111–116. [Google Scholar] [CrossRef]
- Orlandi, F.; Garcia-Mozo, H.; ben Dhiab, A.; Galán, C.; Msallem, M.; Fornaciari, M. Olive Tree Phenology and Climate Variations in the Mediterranean Area over the Last Two Decades. Theor. Appl. Climatol. 2014, 115, 207–218. [Google Scholar] [CrossRef]
- Vogel, J.; Paton, E.; Aich, V.; Bronstert, A. Increasing Compound Warm Spells and Droughts in the Mediterranean Basin. Weather Clim. Extrem. 2021, 32, 100312. [Google Scholar] [CrossRef]
- Gómez, J.; Infante-Amate, J.; de Molina, M.; Vanwalleghem, T.; Taguas, E.; Lorite, I. Olive Cultivation, Its Impact on Soil Erosion and Its Progression into Yield Impacts in Southern Spain in the Past as a Key to a Future of Increasing Climate Uncertainty. Agriculture 2014, 4, 170–198. [Google Scholar] [CrossRef] [Green Version]
- Field, C.B.; Jackson, R.B.; Mooney, H.A. Stomatal Responses to Increased CO2: Implications from the Plant to the Global Scale. Plant Cell Environ. 1995, 18, 1214–1225. [Google Scholar] [CrossRef]
- Hatfield, J.L.; Boote, K.J.; Kimball, B.A.; Ziska, L.H.; Izaurralde, R.C.; Ort, D.; Thomson, A.M.; Wolfe, D. Climate Impacts on Agriculture: Implications for Crop Production. Agron. J. 2011, 103, 351–370. [Google Scholar] [CrossRef] [Green Version]
- Prasad, P.V.V.; Boote, K.J.; Allen, L.H., Jr.; Thomas, J.M.G. Effects of Elevated Temperature and Carbon Dioxide on Seed-set and Yield of Kidney Bean (Phaseolus vulgaris L.). Glob. Chang. Biol. 2002, 8, 710–721. [Google Scholar] [CrossRef]
- Allen, L.H.; Pan, D.; Boote, K.J.; Pickering, N.B.; Jones, J.W. Carbon Dioxide and Temperature Effects on Evapotranspiration and Water Use Efficiency of Soybean. Agron. J. 2003, 95, 1071–1081. [Google Scholar] [CrossRef]
- André, M.; du Cloux, H. Interaction of CO2 Enrichment and Water Limitations on Photosynthesis and Water Efficiency in Wheat. Plant Physiol. Biochem. 1993, 31, 103–112. [Google Scholar]
- Reddy, K.; Hodges, H. Climate Change and Global Crop Productivity; CABI: Wallingford, UK, 2000. [Google Scholar] [CrossRef]
- Bernacchi, C.J.; Kimball, B.A.; Quarles, D.R.; Long, S.P.; Ort, D.R. Decreases in Stomatal Conductance of Soybean under Open-Air Elevation of [CO2] Are Closely Coupled with Decreases in Ecosystem Evapotranspiration. Plant Physiol. 2007, 143, 134–144. [Google Scholar] [CrossRef] [Green Version]
- Prasad, P.V.V.; Boote, K.J.; Allen, L.H. Adverse High Temperature Effects on Pollen Viability, Seed-Set, Seed Yield and Harvest Index of Grain-Sorghum Sorghum bicolor (L.) Moench] Are More Severe at Elevated Carbon Dioxide Due to Higher Tissue Temperatures. Agric. For. Meteorol. 2006, 139, 237–251. [Google Scholar] [CrossRef]
- Rosa, L.; Chiarelli, D.D.; Rulli, M.C.; Dell’angelo, J.; Odorico, P.D. Environmental Sciences Global Agricultural Economic Water Scarcity. Sci. Adv. 2020, 6. [Google Scholar] [CrossRef]
- Dell’Angelo, J.; Rulli, M.C.; D’Odorico, P. The Global Water Grabbing Syndrome. Ecol. Econ. 2018, 143, 276–285. [Google Scholar] [CrossRef]
- Xu, Z.; Chen, X.; Wu, S.R.; Gong, M.; Du, Y.; Wang, J.; Li, Y.; Liu, J. Spatial-Temporal Assessment of Water Footprint, Water Scarcity and Crop Water Productivity in a Major Crop Production Region. J. Clean. Prod. 2019, 224, 375–383. [Google Scholar] [CrossRef]
- Barrett, C.B. Overcoming Global Food Security Challenges through Science and Solidarity. Am. J. Agric. Econ. 2021, 103, 422–447. [Google Scholar] [CrossRef]
- Turral, H.; Svendsen, M.; Faures, J.M. Investing in Irrigation: Reviewing the Past and Looking to the Future. Agric. Water Manag. 2010, 97, 551–560. [Google Scholar] [CrossRef]
- Hanjra, M.A.; Qureshi, M.E. Global Water Crisis and Future Food Security in an Era of Climate Change. Food Policy 2010, 35, 365–377. [Google Scholar] [CrossRef]
- Gervois, S.; Ciais, P.; de Noblet-Ducoudré, N.; Brisson, N.; Vuichard, N.; Viovy, N. Carbon and Water Balance of European Croplands throughout the 20th Century. Glob. Biogeochem. Cycles 2008, 22. [Google Scholar] [CrossRef] [Green Version]
- Falkenmark, M.; Molden, D. Wake up to Realities of River Basin Closure. Int. J. Water Resour. Dev. 2008, 24, 201–215. [Google Scholar] [CrossRef]
Figure 1.
Iberian Peninsula; (a) elevation (in m) and (b) CORINE land cover for the year 2020.

Figure 2.
Land cover for water-dependent areas in the Iberian Peninsula, for the years (a) 1990 and (b) 2020. Pie charts show the percentage of area evolution from one period to another.
Figure 2.
Land cover for water-dependent areas in the Iberian Peninsula, for the years (a) 1990 and (b) 2020. Pie charts show the percentage of area evolution from one period to another.

Figure 3.
Normalized difference vegetation index (NDVI) in water-dependent areas in the Iberian Peninsula, for the years (a) 1990 and (b) 2020. Pie charts show the percentage of area evolution from one period to another.
Figure 3.
Normalized difference vegetation index (NDVI) in water-dependent areas in the Iberian Peninsula, for the years (a) 1990 and (b) 2020. Pie charts show the percentage of area evolution from one period to another.

Figure 4.
Annual mean temperature (in °C) in water-dependent areas in the Iberian Peninsula for: (a) historical period 1981–2000 (P1), (b) 2041–2060 (P2), and (c) 2081–2100 (P3), (d) P2–P1, (e) P3–P1, and (f) locality, spread, and skewness for each period and river catchment.
Figure 4.
Annual mean temperature (in °C) in water-dependent areas in the Iberian Peninsula for: (a) historical period 1981–2000 (P1), (b) 2041–2060 (P2), and (c) 2081–2100 (P3), (d) P2–P1, (e) P3–P1, and (f) locality, spread, and skewness for each period and river catchment.

Figure 5.
Temperature seasonality (in °C) in water-dependent areas in the Iberian Peninsula for: (a) historical period 1981–2000 (P1), (b) 2041–2060 (P2), and (c) 2081–2100 (P3), (d) P2–P1, (e) P3–P1, and (f) locality, spread, and skewness for each period and river catchment.
Figure 5.
Temperature seasonality (in °C) in water-dependent areas in the Iberian Peninsula for: (a) historical period 1981–2000 (P1), (b) 2041–2060 (P2), and (c) 2081–2100 (P3), (d) P2–P1, (e) P3–P1, and (f) locality, spread, and skewness for each period and river catchment.

Figure 6.
Precipitation rate (in mm/day) in water-dependent areas in the Iberian Peninsula for: (a) historical period 1981–2000 (P1), (b) 2041–2060 (P2), and (c) 2081–2100 (P3), (d) P2–P1, (e) P3–P1, and (f) locality, spread, and skewness for each period and river catchment.
Figure 6.
Precipitation rate (in mm/day) in water-dependent areas in the Iberian Peninsula for: (a) historical period 1981–2000 (P1), (b) 2041–2060 (P2), and (c) 2081–2100 (P3), (d) P2–P1, (e) P3–P1, and (f) locality, spread, and skewness for each period and river catchment.

Figure 7.
Precipitation seasonality in water-dependent areas in the Iberian Peninsula for: (a) historical period 1981–2000 (P1), (b) 2041–2060 (P2), and (c) 2081–2100 (P3), (d) P2–P1, (e) P3–P1, and (f) locality, spread, and skewness for each period and river catchment.
Figure 7.
Precipitation seasonality in water-dependent areas in the Iberian Peninsula for: (a) historical period 1981–2000 (P1), (b) 2041–2060 (P2), and (c) 2081–2100 (P3), (d) P2–P1, (e) P3–P1, and (f) locality, spread, and skewness for each period and river catchment.

Figure 8.
Aridity index (in mm/mm) in water-dependent areas in the Iberian Peninsula for: (a) historical period 1981–2000 (P1), (b) 2041–2060 (P2), and (c) 2081–2100 (P3), (d) P2–P1, (e) P3–P1, and (f) locality, spread, and skewness for each period and river catchment.
Figure 8.
Aridity index (in mm/mm) in water-dependent areas in the Iberian Peninsula for: (a) historical period 1981–2000 (P1), (b) 2041–2060 (P2), and (c) 2081–2100 (P3), (d) P2–P1, (e) P3–P1, and (f) locality, spread, and skewness for each period and river catchment.

Figure 9.
Volumetric soil water in layer 1 (in mm3/mm3) in water-dependent areas in the Iberian Peninsula for: (a) historical period 1981–2000 (P1), (b) 2041–2060 (P2), and (c) 2081–2100 (P3), (d) P2–P1, (e) P3–P1, and (f) locality, spread, and skewness for each period and river catchment.
Figure 9.
Volumetric soil water in layer 1 (in mm3/mm3) in water-dependent areas in the Iberian Peninsula for: (a) historical period 1981–2000 (P1), (b) 2041–2060 (P2), and (c) 2081–2100 (P3), (d) P2–P1, (e) P3–P1, and (f) locality, spread, and skewness for each period and river catchment.


Table 1.
Land cover categories area (in km2) for the five main rivers in the Iberian Peninsula for the years 1990 and 2020.
Table 1.
Land cover categories area (in km2) for the five main rivers in the Iberian Peninsula for the years 1990 and 2020.
| Douro | Tagus | Guadiana | Ebro | Guadalquivir | ||||||
|---|---|---|---|---|---|---|---|---|---|---|
| Land Cover | 1990 | 2020 | 1990 | 2020 | 1990 | 2020 | 1990 | 2020 | 1990 | 2020 |
| Permanently irrigated land | 4011.1 (4.1%) | 5626.4 (5.8%) | 2572.7 (3.3%) | 2718.1 (3.5%) | 2324.8 (4.2%) | 1843.1 (3.3%) | 5458.1 (6.4%) | 6531.6 (7.7%) | 2285.6 (4.0%) | 6133.7 (10.7%) |
| Rice fields | - | - | 193.8 (0.2%) | 170.1 (0.2%) | 145.5 (0.3%) | 287.4 (0.5%) | 91.5 (0.1%) | 271.6 (0.3%) | 377.5 (0.7%) | 421.5 (0.7%) |
| Vineyards | 1275.4 (1.3%) | 1441.9 (1.5%) | 903.8 (1.2%) | 772.4 (1.0%) | 3482.5 (6.3%) | 4336.8 (7.8%) | 1073.1 (1.3%) | 1636.1 (1.9%) | 234.5 (0.4%) | 210.9 (0.4%) |
| Fruit trees and berry plantations | 351.2 (0.4%) | 350.5 (0.4%) | 208.5 (0.3%) | 259.7 (0.3%) | 93.9 (0.2%) | 315.9 (0.6%) | 995.3 (1.2%) | 1946.3 (2.3%) | 369.3 (0.6%) | 1199.4 (2.1%) |
| Olive groves | 485.6 (0.5%) | 619.2 (0.6%) | 2928.8 (3.8%) | 3115.5 (4.0%) | 1921.1 (3.5%) | 2877.4 (5.2%) | 684.5 (0.8%) | 1284.1 (1.5%) | 11,336.7 (19.9%) | 14,370.1 (25.2%) |
| Total (5 categories) | 6123.30 | 8038.00 | 6807.60 | 7035.80 | 7967.80 | 9660.60 | 8302.50 | 11,669.70 | 14,603.60 | 22,335.60 |
Table 2.
Percentage of area change per river catchment between 1990 and 2020 for NDVI values above 0.51.
Table 2.
Percentage of area change per river catchment between 1990 and 2020 for NDVI values above 0.51.
| Catchment | Area 1990 | Area 2020 | (Percentage Difference) |
|---|---|---|---|
| Douro | |||
| Permanently irrigated land | 0.0050 | 0.0265 | 534% |
| Rice fields | - | - | - |
| Vineyards | 0.0040 | 0.0248 | 617% |
| Fruit trees and berry plantations | 0.0009 | 0.0111 | 1287% |
| Olive groves | 0.0002 | 0.0075 | 3103% |
| Total | 0.0101 | 0.0699 | |
| Tagus | |||
| Permanently irrigated land | 0.0088 | 0.0644 | 731% |
| Rice fields | 0.0005 | 0.0038 | 768% |
| Vineyards | 0.0023 | 0.0133 | 570% |
| Fruit trees and berry plantations | 0.0028 | 0.0166 | 602% |
| Olive groves | 0.0201 | 0.0804 | 299% |
| Total | 0.0345 | 0.1785 | |
| Guadiana | |||
| Permanently irrigated land | 0.0003 | 0.0028 | 1038% |
| Rice fields | - | - | - |
| Vineyards | - | 0.0008 | - |
| Fruit trees and berry plantations | 0.0001 | 0.0029 | 2409% |
| Olive groves | 0.0014 | 0.0184 | 1356% |
| Total | 0.0018 | 0.0249 | |
| Guadalquivir | |||
| Permanently irrigated land | 0.0002 | 0.0029 | 1322% |
| Rice fields | - | - | - |
| Vineyards | - | - | - |
| Fruit trees and berry plantations | 0.000006 | 0.0116 | 193,917% |
| Olive groves | 0.0042 | 0.0438 | 1053% |
| Total | 0.004406 | 0.0583 | |
| Ebro | |||
| Permanently irrigated land | 0.0103 | 0.0921 | 897% |
| Rice fields | - | 0.0013 | - |
| Vineyards | - | 0.0028 | 7551% |
| Fruit trees and berry plantations | 0.0016 | 0.0229 | 1424% |
| Olive groves | - | 0.0029 | 9627% |
| Total | 0.0119 | 0.1220 |
Publisher’s Note: MDPI stays neutral with regard to jurisdictional claims in published maps and institutional affiliations. |
© 2022 by the authors. Licensee MDPI, Basel, Switzerland. This article is an open access article distributed under the terms and conditions of the Creative Commons Attribution (CC BY) license (https://creativecommons.org/licenses/by/4.0/).
Share and Cite
MDPI and ACS Style
Fonseca, A.; Andrade, C.; Santos, J.A. Agricultural Water Security under Climate Change in the Iberian Peninsula. Water 2022, 14, 768. https://doi.org/10.3390/w14050768
AMA Style
Fonseca A, Andrade C, Santos JA. Agricultural Water Security under Climate Change in the Iberian Peninsula. Water. 2022; 14(5):768. https://doi.org/10.3390/w14050768
Chicago/Turabian StyleFonseca, André, Cristina Andrade, and João A. Santos. 2022. "Agricultural Water Security under Climate Change in the Iberian Peninsula" Water 14, no. 5: 768. https://doi.org/10.3390/w14050768
Note that from the first issue of 2016, this journal uses article numbers instead of page numbers. See further details here.