
Occurrence of Antibiotic-Resistant Genes and Bacteria in Household Greywater Treated in Constructed Wetlands
by
 , and
, and
Michelle Henderson
1, 
Sarina J. Ergas
1,
Kebreab Ghebremichael
2,
Amit Gross
3 and
Zeev Ronen
3,*
1
Department of Civil & Environmental Engineering, University of South Florida, Tampa, FL 33620, USA
2
Patel College of Global Sustainability, University of South Florida, Tampa, FL 33620, USA
3
Zuckerberg Institute for Water Research, The Jacob Blaustein Institutes for Desert Research, Ben Gurion University of the Negev, Beersheba 8499000, Israel
*
Author to whom correspondence should be addressed.
Water 2022, 14(5), 758; https://doi.org/10.3390/w14050758
Submission received: 24 January 2022
/
Revised: 24 February 2022
/
Accepted: 25 February 2022
/
Published: 27 February 2022
(This article belongs to the Special Issue The Use of Greywater and Wastewater for Irrigation)
Abstract
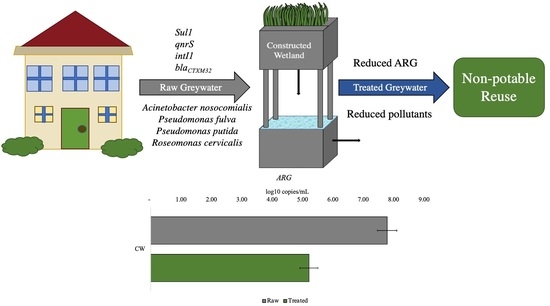
:There is a growing body of knowledge on the persistence of antibiotic-resistant genes (ARGs) and antibiotic-resistant bacteria (ARB) in greywater and greywater treatment systems such as constructed wetlands (CWs). Our research quantified ARGs (sul1, qnrS, and blaCTXM32), class one integron (intI1), and bacterial marker (16S) in four recirculating vertical flow CWs in a small community in the Negev desert, Israel, using quantitative polymerase chain reaction (qPCR). The greywater microbial community was characterized using 16S rRNA amplicon sequencing. Results show that CWs can reduce ARG in greywater by 1–3 log, depending on the gene and the quality of the raw greywater. Community sequencing results showed that the bacterial community composition was not significantly altered after treatment and that Proteobacteria, Epsilonbacteraeota, and Bacteroidetes were the most dominant phyla before and after treatment. Pseudomonas, Citrobacter, Enterobacter, and Aeromonas were the most commonly identified genera of the extended spectrum beta lactamase (ESBL) colonies. Some of the ESBL bacteria identified have been linked to clinical infections (Acinetobacter nosocomialis, Pseudomonas fulva, Pseudomonas putida, Pseudomonas monteilii, and Roseomonas cervicalis). It is important to monitor intI1 for the potential transfer of ARGs to pathogenic bacteria.
1. Introduction
Household greywater is commonly reused in remote and water-stressed regions because it has a lower content of fecal matter than sanitary sewage, reducing the risks associated with microbial contaminants. Although greywater has lower risks and is widely used for non-potable purposes, there are potential biological health risk concerns due to bacteria shed from skin, and small amounts of fecal matter and urine released during bathing [1]. Greywater typically consists of effluent from laundries, sinks, baths, and showers. It may also include water from kitchen sinks but does not include water from toilets. Greywater is reused to irrigate edible and non-edible crops, dust suppression, and toilet flushing [1,2]. While raw greywater is typically not suitable for direct reuse, simple onsite greywater treatment technologies can be operated and maintained by homeowners. Thus, the reuse of treated greywater can address the combined challenges of water scarcity and water quality while conserving freshwater resources.
Constructed wetlands (CWs) are a practical and effective technology for onsite greywater treatment and reuse with low maintenance requirements. These systems typically function as extensive biofilters that incorporate wetland vegetation and natural biofilm carrier materials, such as gravel. Without using constructed wetlands or other wastewater treatment systems, irrigation with raw greywater can lead to temporary soil hydrophobicity, disrupt soil microbiome communities, and persist in groundwater [3,4,5]. However, a review found that treated greywater does not seem to negatively affect soil microbiomes [6].
Effluents from CWs are typically reused onsite, without the need for extensive reclaim water conveyance systems [1,7,8,9]. Recirculating vertical flow CWs (RVFCWs) are a type of CW design that have been shown to treat greywater economically [10]. RVFCWs also reduce water losses by evapotranspiration, which is important in arid regions [10].
Although not yet regulated worldwide, there are still unknown health risks associated with greywater reuse due to the potential release of antibiotics, antibiotic-resistant bacteria (ARB), and antibiotic-resistant genes (ARG) [1]. ARG and ARB are worldwide concerns within public health and engineering [11,12]. It is projected that by 2050, the number of deaths from ARB-related infectious diseases will outnumber all current causes of death [13]. The World Health Organization has developed a plan to mitigate the spread of ARG-related infectious diseases by reducing consumption of antibiotics and increasing research related to antimicrobial resistance surveillance. Although only a limited number of household scale RVFCWs were studied, this research adds to the growing body of work related to ARG and ARB surveillance worldwide.
Wastewater generally contains low levels of antibiotics; however, these low levels can trigger a resistance response from bacteria [14,15,16]. There are a few possibilities for the emergence of ARB and ARG in greywater, from human excretions, food, or the evolution of resistance in greywater due to exposure of microbes to micropollutants, such as biocides and antibiotics present in the untreated greywater [17]. Contaminants such as heavy metals and disinfectants can also promote antibiotic resistance in bacteria [18,19,20]. For example, exposure of greywater bacteria to the biocide triclosan increased ARB in irrigated soil [21]. Triclosan, among other micropollutants, was detected in greywater at a significant level in Israel [17]. Additionally, antibiotics such as ciprofloxacin and sulfamethoxazole were detected at concentrations ranging from 1.3 to 1593 ng/L in greywater used for irrigation in the West Bank, Palestinian Territories [22].
Although it has previously been demonstrated that CWs effectively remove conventional pollutants (TOC, COD, TSS, among others) and pathogenic bacteria from greywater [23,24], there is limited information on the efficacy of CWs for ARG and ARB removal. We hypothesized that raw greywater contains diverse ARGs that are removed during treatment and that microbial diversity is modified within CWs concurrently with chemical and microbial pollutants. In this study, changes in the raw and treated greywater microbial community were evaluated in parallel with the overall performance of onsite CWs for the treatment of conventional pollutants. Concentrations of specific ARGs (sul1, intI1, blaCTXM32), corresponding to resistance to sulfonamides, beta-lactams, and fluoroquinolone antibiotics, were enumerated in raw and CW-treated greywater. The presence of extended-spectrum beta-lactam (ESBL) resistant bacteria was examined, and their phylogenetic distribution in raw and treated greywater was analyzed. The results have implications for arid regions where greywater is treated in CWs before reclamation for irrigation and other reuse applications. Thus, the overall goal of this study was to investigate the presence of ARB and ARG in greywater and their fate in CWs.
2. Materials and Methods
2.1. System Description and Sampling
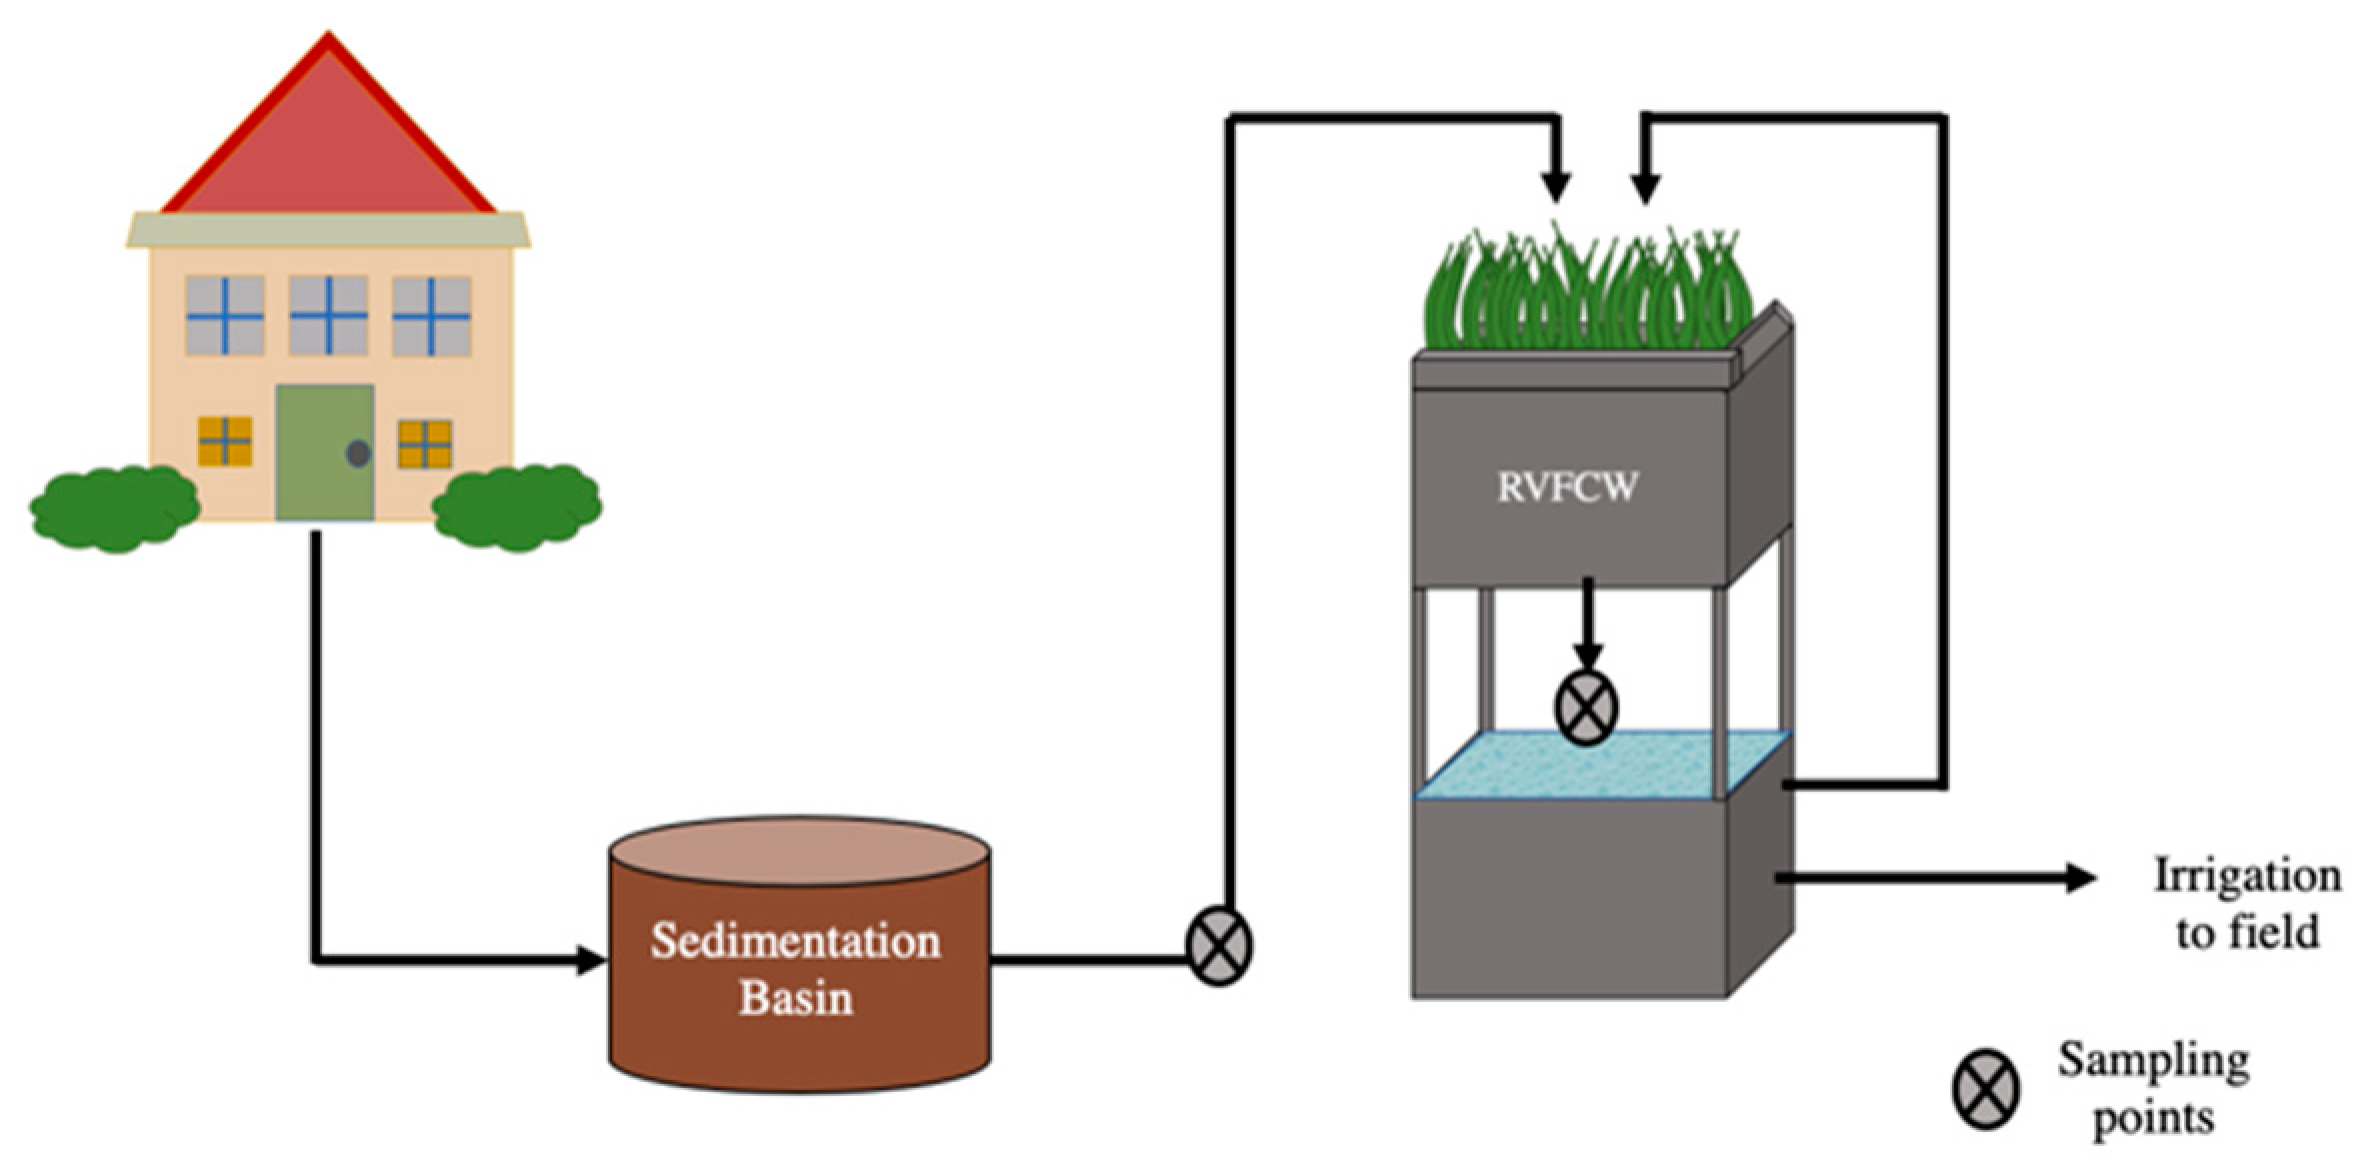
Four RVFCWs were examined in this study (CW1, CW2, CW3, CW4). The systems were located at single-family households inhabited by 4–6 people (parent and adolescents) in Israel’s central Negev desert. Greywater from each household was first collected in a 400 L sedimentation basin (raw greywater) from which it was pumped into the RVFCW two times per day to achieve a maximal hydraulic retention time of 12 h. Each RVFCW was composed of two containers with an upper and lower portion composed of two 500 L plastic containers (1.0 m × 1.0 m × 0.5 m) placed atop each other (Figure 1). The upper perforated container contained a planted three-layer bed, a 5 cm top layer of woodchips, followed by a 35 cm middle layer of tuff gravel and a 10 cm lower layer of limestone pebbles. The lower container served as a reservoir with a hydraulic retention time of 8 h. Greywater trickled from the upper container through the biofilter medium to the lower container and was recirculated back to the upper container. The recirculation rate in the RVFCW was 300 L/h [25]. After 15 or more recirculation cycles, the effluent was discharged for landscape irrigation reuse. Greywater from these households consisted of effluents from laundries, showers, and bathroom sinks. Detailed descriptions of the RVFCWs have been published previously [10,25,26]. Samples were collected monthly over three months between August and October (overall 12 samples of raw greywater and 12 of treated greywater) and brought to the laboratory for analysis within 30 min of collection. A total of 1 L of raw and 1–2 L of treated greywater were collected from each household during each sampling campaign.
2.2. Water Quality Analysis
Standard methods [27] were used to measure 5-day biochemical oxygen demand (BOD5) (5210), total suspended solids (TSS) (2540), pH (4500-H+), and conductivity (2510). Turbidity was measured using a Sper Scientific Turbidity Meter-860040 (Scottsdale, Arizona, AZ, USA). Total organic Carbon (TOC) and total nitrogen (TN) were measured using an Analytik Jena TN/TOC analyzer [28,29].
2.3. Microbial Enumeration
HiCrome agar media (HiMedia, Mumbai, India) was used to enumerate E. coli using the spread plate method (9215C) [27]. After spreading decimal dilutions, the plates were first incubated at 30 °C for 4 h, then incubated at 44 °C for 20 h. CHROMagar™ ESBL plates (Hylabs®, Rehovot, Israel) were used to enumerate ESBL producing bacteria. ESBL agar comprised Digalski and MacConkey agar containing cefotaxime and ceftazidime, respectively. The spread plate method was used to spread 100 µL of decimal dilutions of raw and treated greywater on the plates. Plates were incubated for 20–24 h at 37 °C. Colonies were identified based on their color and morphology and were then purified on LB plates and identified based on their 16S rRNA gene sequences [30].
2.4. DNA Extraction and ARG Analysis
DNA was extracted from untreated and treated greywater samples using Qiagen DNeasy PowerWater Kit (Qiagen, Hilden, Germany) according to the manufacturer’s instructions. All extracted DNA quantity and quality were measured using a Nanodrop Spectrophotometer ND-1000 (Wilmington, DE, USA). Polymerase chain reaction (PCR) and quantitative PCR (qPCR) were used to determine the presence and number of genes in the raw and treated greywater. ARGs quantified in this study were qnrS, blaCTXM32, and sul1 (Table 1). These genes were selected because they correspond to commonly prescribed antibiotics and their frequent detection in wastewater samples [31,32,33]. Other genes used in the analysis were 16S rRNA and class 1 integrase (intI1) (Table 1). A list of primers and sequences is shown in Table 1. The Bioline master mix was SYBR No-ROX mix. qPCR was run on CFX96 Real-Time System C1000 Thermal Cycler from Biorad (Hercules, CA, USA). All efficiency values were between 90 and 110%. All samples and standards were run in duplicate or triplicate. Standards were diluted from plasmid pNORM1 ranging from 2.11 × 10²–2.11 × 10⁷ gene copies/µL DNA [31]. Negative controls were an enzyme, primers, and DNA-free water. DNA from PCR and qPCR runs were examined in 2% agarose gel electrophoresis using Bio-Rad PowerPac Basic (Hercules, CA, USA). Gels were viewed and photographed using Bio-Rad Gel Doc XR+ Documentation System/Universal Hood II (Hercules, CA, USA) with software Quantity One Version 4.6.9 (Basic, Hercules, CA, USA).
2.5. Raw and Treated Greywater Microbial Community Analysis
The microbial community in the raw and treated greywater was analyzed using 16S rRNA gene amplicon sequencing [34]. DNA from the raw and treated greywater was amplified by PCR before sequencing. The reaction was performed in a Life ECO PCR System (Bio-Rad Laboratories); each 20 μL PCR reaction contained 10 μL Bio-Ready-Mix (Bio-lab, Jerusalem, Israel) primers (200 nM) CS1-341F ACACTGACGACATGGTTCTACACCTACGGGAGGCAGCAG and CS2-806R TACGGTAGCAGAGACTTGGTCTGGACTACHVGGGTWTCTAAT [35] and an average of 11 ng templet DNA. PCR thermocycler conditions were 5 min at 95 °C, followed by 26 cycles of 95 °C (30 s) → 55 °C (45 s) → 68 °C (30 s), and finalizing the reaction with 68 °C (7 min).
2.6. Sequencing and Statistical Analysis
Sequencing and primary processing of the raw data were performed by the University of Illinois at Chicago Core for Research Informatics (UICCRI). Sequencing of 16S rRNA was done using the Illumina MiSeq platform, with CS1-341F-CS2-806R primers for bacteria [34,35]; forward and reverse reads were merged using PEAR [36], and chimeric sequences were identified using the USEARCH algorithm as compared with a reference database silva_132_16S.973 [37]. Annotated sequences with taxonomic information were generated using USEARCH2 with silva_132_16S.973 as reference database; the resulting data set was analyzed with MicrobiomeAnalyst using the default settings and normalized by rarefaction to the minimum library size [38]. A Pearson’s correlation analysis was conducted for the water quality parameters (p < 0.05). Raw reads were deposited in the NCBI sequence read archives (SAR) under Bio Project accession number PRJNA725961.

Table 1.
Target genes, primers, amplicon size, and partial sequences used for PCR and qPCR detection of ARG.
Table 1.
Target genes, primers, amplicon size, and partial sequences used for PCR and qPCR detection of ARG.
| Target Gene | Primer | Amplicon Size | Sequence | Associated Antibiotic or Other Conditions | Resistant to | References |
|---|---|---|---|---|---|---|
| 16s rDNA | 331 | 195 bp | TCCTACGGGAGGCAGCAGT | N/A | N/A | [31,39,40] |
| 518 | ATTACCGCGGCTGCTGG | |||||
| intI1 | intILC5_fw | 196 bp | GATCGGTCGAATGCGTGT | Wastewater treatment, clinical settings, food, groundwater, and other anthropogenic sources | N/A | [31,41] |
| intILC1_rv | GCCTTGATGTTACCCGAGAG | |||||
| qnrS | qnrSrtF11 | 118 bp | GACGTGCTAACTTGCGTG | Fluoroquinolones | Fluoroquinolones | [31,42] |
| qnrSrtR11 | TGGCATTGTTGGAAACTT | |||||
| sul1 | sul1-FW | 162 bp | CGCACCGGAAACATCGCTGCAC | Sulfonamides | Sulfonamides | [31,33,43] |
| sul1-RV | TGAAGTTCCGCCGCAAGGCTCG | |||||
| blaCTXM32 | CTX-M32-Fw | 156 bp | CGTCACGCTGTTGTTAGGAA | Beta-Lactams | Amoxicillin, Cefotaxime, Ceftazidime, Cefepime, Piperacillin, Cephalothin, Cefoxitin, Cefuroxime | [31,33] |
| CTX-M32-Rv | CGCTCATCAGCACGATAAAG |
3. Results and Discussion
3.1. Water Quality Results
All tested CWs had excellent performance in removing solids and organic matter (Table 2). Average effluent turbidity and TSS levels in the treated greywater were low, with average concentrations of 14 NTU and 10.8 mg/L, respectively. Similarly, average effluent TOC and BOD5 concentrations were low, at 5.76 mg/L and 3.9 mg/L, respectively. The results were similar to the previously documented performance of the CWs investigated in this study demonstrating the longevity of the CWs [22,26,30]. Conductivity and pH slightly changed after treatment, while TN was reduced 33% from 9.46 ± 5.31 mg/L to 5.76 ± 3.25 mg/L. Some TN in the effluent is advantageous as the water is reused for irrigation as the remaining nitrogen can reduce the need for fertilizers. Since the greywater in the system is well aerated, nitrogen removal is mainly related to solids removal and plant and microbial assimilation. Removal of E. coli was 2 log10 reduction of magnitude, suggesting that disinfection is required for safe reuse. For Israeli reuse standards for unrestricted irrigation, the final effluent concentration is 10 fecal coliform units per 100 mL or less [44]. To reach a concentration of 10 fecal coliform units or less, a further 4 log reduction would be required.
3.2. Overall ARG Results
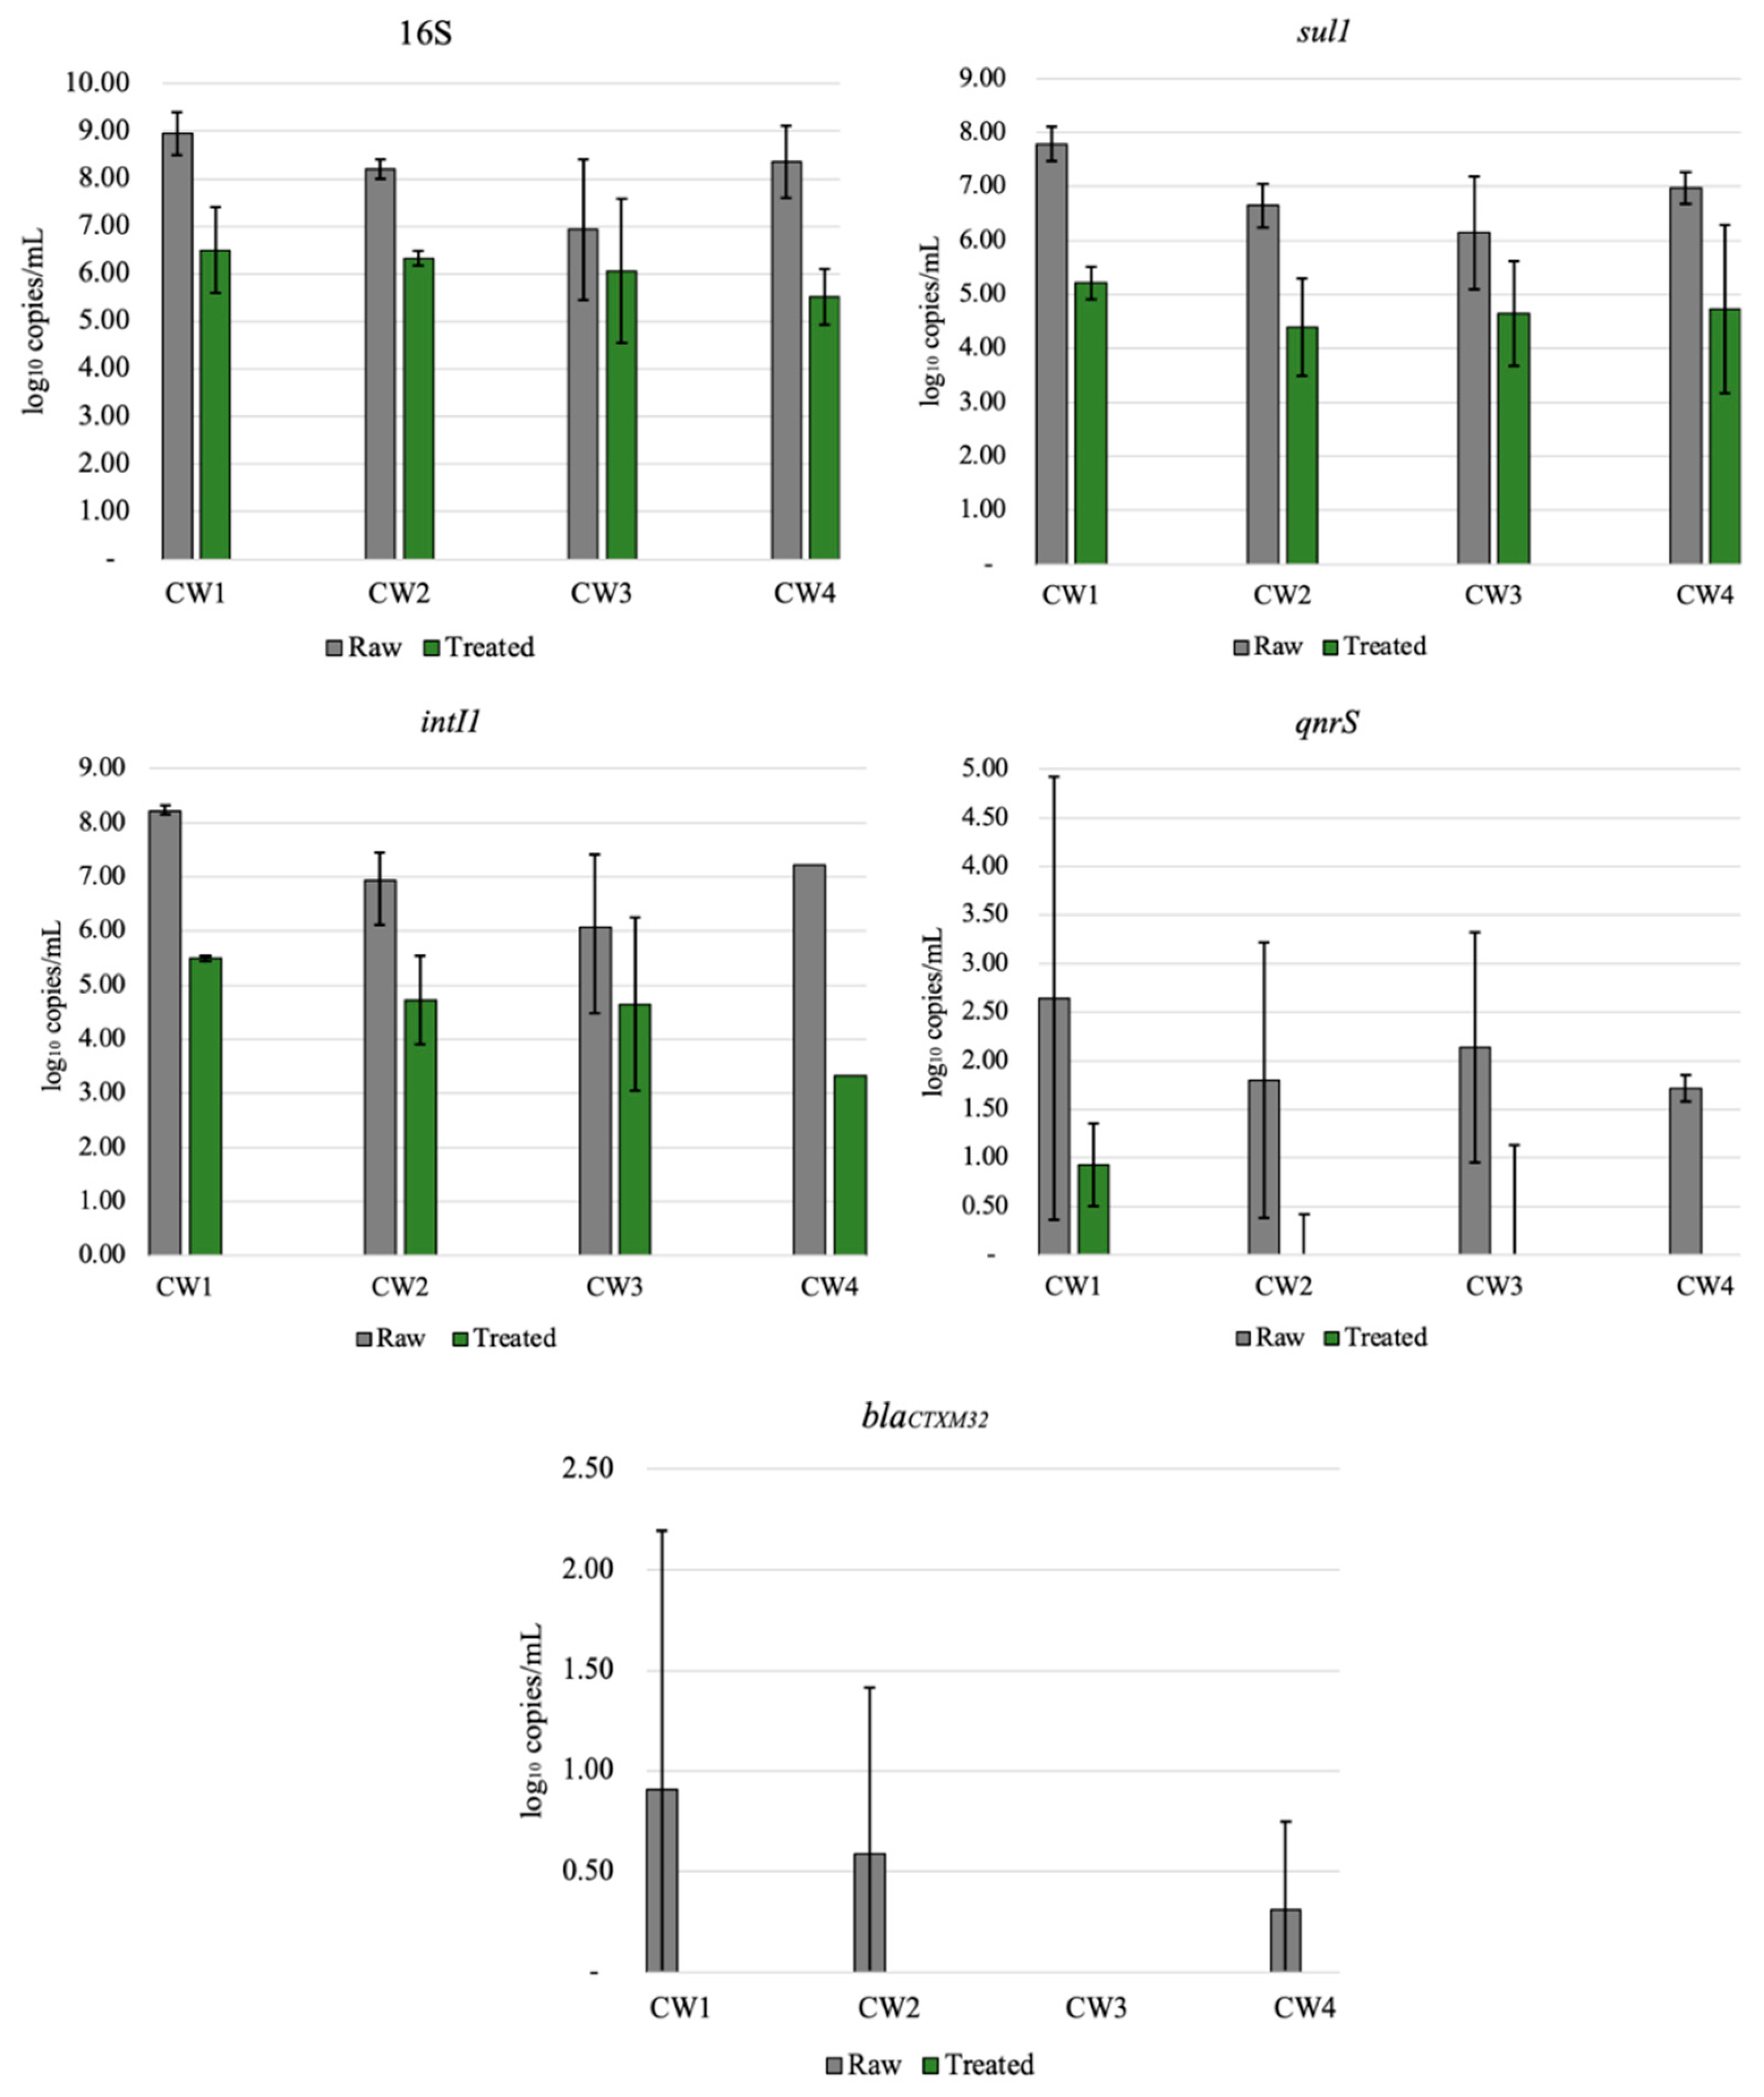
All ARGs investigated in this study were detected in both raw and treated greywater (Figure 2). Genes were not completely removed from the final effluent (treated GW), which was expected since wastewater treatment systems typically do not completely remove all ARGs [45]. The abundance of genes in decreasing order was: 16S, intI1, sul1, qnrS, and blaCTXM32, with log removals ranging from approximately 1 to 4 logs, apart from blaCTXM32 (1.45 log reduction). Results from this study are similar to those of other studies [31,46], where intI1 and sul1 were more abundant in wastewater than qnrS and blaCTXM32, which were below the limit of detection. This relatively high reduction of ARG may be attributed to multiple factors, such as the removal of solids or biomass [47], long recirculation time of the treated water (6–12 h), and the combination of aerobic and anaerobic processes within the CW [48]. Even with significant ARG reductions, the ARG concentration in the final effluent should be considered for the end-user. Various studies have shown that ARG or other bacterial genes are not completely removed in centralized or onsite wastewater treatment processes [30,32,46,49]. CW3 had lower reductions than the other CWs for the most abundant gene detected (16S, intI1, sul1), ranging from 1–1.5.log reduction (Figure 2). However, statistically, this system was not an outlier (p = 0.05). Although ARG abundance does not reflect viable ARBs, lower ARG reduction could be attributed to lower influent ARG concentrations. Even when bacteria or other pathogens are not completely removed, the greywater can be reused for non-potable applications depending on the end-use [50].
3.3. Sul1, blaCTXM32, and qnrS
Results from qPCR (Figure 2) showed that ARG removal varied by household and gene type. ARG removal may be dependent on the specific gene studied [32]. The sul1 gene was abundant in raw greywater for all households, with an average 2.58 log reduction and effluent concentrations ranging from 4.24 × 10⁴ to 4.64 × 10⁵ gene copies mL (Figure 2). The sul1 gene has been found in relatively high concentrations in effluents from other CWs and wastewater treatment plants [51,52,53,54]. The final concentrations of sul1 genes were relatively high, but the overall reduction in the CWs was comparable to a wastewater treatment plant. In comparison with our results, various studies of wastewater treatment plants with primary sedimentation, biological treatment, filtration, and disinfection have reported similar sul1 reductions (approximately 1–3 logs) [55]. Gao et al. [55] found a strong positive correlation between sulfonamide resistant genes (sul1 and sul2) and sulfonamide drug abundance at a wastewater treatment plant, while [56] found no correlation with sul genes and sulfonamides. Since the CWs in this study each treated greywater from a single household, it is possible that variations in antibiotic use in the household were related to ARG abundance.
Relatively low counts of blaCTXM32 genes were detected in raw and CW-treated greywater, indicating that beta-lactam antibiotics are probably not commonly prescribed in the community studied. Alternatively, we may have underestimated beta-lactam resistance because there are numerous beta-lactamases. In earlier studies on ARB in these systems, some of the ARB isolates that were resistant to tetracycline were also harboring genes such as blaTEM, blaSHV, blaOXA-2, and blaOXA-10 [30]. Therefore, single-gene screening does not provide a broad view of resistance. QnrS encoded for resistance to fluoroquinolones and was detected in raw and treated greywater in all CWs, with an average 2.20 log reduction with the initial concentrations varying for all households. In all of the treated GW, abundances of this gene were low and ranging between zero and 3.9 × 101 gene copies per mL. CW4 was able to altogether remove qnrS from the final effluent after treatment in the CW; however, the initial concentrations were relatively low (5.3 × 101 gene copies/mL).
3.4. 16S and IntI1
The 16S gene was used as a general bacterial marker gene and was abundant in raw and treated greywater, as shown in Figure 2. The observed 2.11 log reduction is similar to values reported for decentralized wastewater treatment systems for total bacteria removal [56]. The lowest removal of 16S was observed in CW3, with less than 1 log reduction. The presence of intI1 in wastewater is significant because it represents the potential for horizontal transfer of ARGs among microorganisms [57,58]. IntI1 was very abundant in both raw and CW-treated greywater, with an average of 2.40 log reduction, similar to sul1. Although intI1 was reduced to 2–3 logs, the final concentrations ranged from 2.1 × 10⁴ to 8.3 × 10⁶ gene copies/mL. IntI1 is generally associated with anthropogenic environmental pollution; it is persistent in wastewater after treatment and is often present in pathogenic infections [59,60]. A study of three rivers by Makowska et al. [32] observed that intI1 abundance increased almost 2-fold in all of the rivers after wastewater effluent was mixed with receiving waters, signifying anthropogenic influences. Benami et al. [26] examined gene reduction of fecal indicator and pathogenic bacteria in greywater using qPCR analysis; gene copies were reduced by less than 1 log except for one bacteria type, which was reduced by more than 1 log. The reduction found was less than the log reduction observed in our study (2.2–3 log) [26]. As previously mentioned, all genes do not behave the same way in a single system. Still, a more significant gene reduction of ARG than pathogenic bacteria draws attention to the differences between the types of genes studied in the CWs.
A correlation analysis was performed on the water quality parameters for raw and treated greywater and ARG (Table 3). TOC was positively correlated with TSS, 16S, intI1, sul1, and qnrS, while TSS was positively correlated with blaCTXM32. The positive correlations with TOC could signify the relationship between organic carbon and ARG. The positive relationship between TSS and blaCTXM32 may be an artifact, considering the low concentrations of blaCTXM32 in both raw and treated greywater. 16S was positively correlated with intI1, sul1, and qnrS, as expected, since 16S is a bacterial marker. The positive correlation between intI1 and sul1 has been identified in previous studies [32], and this correlation is significant because sul1 can possibly be transferred to commensal or pathogenic bacteria via horizontal gene transfer.
3.5. Community Structure in Raw and Treated Greywater
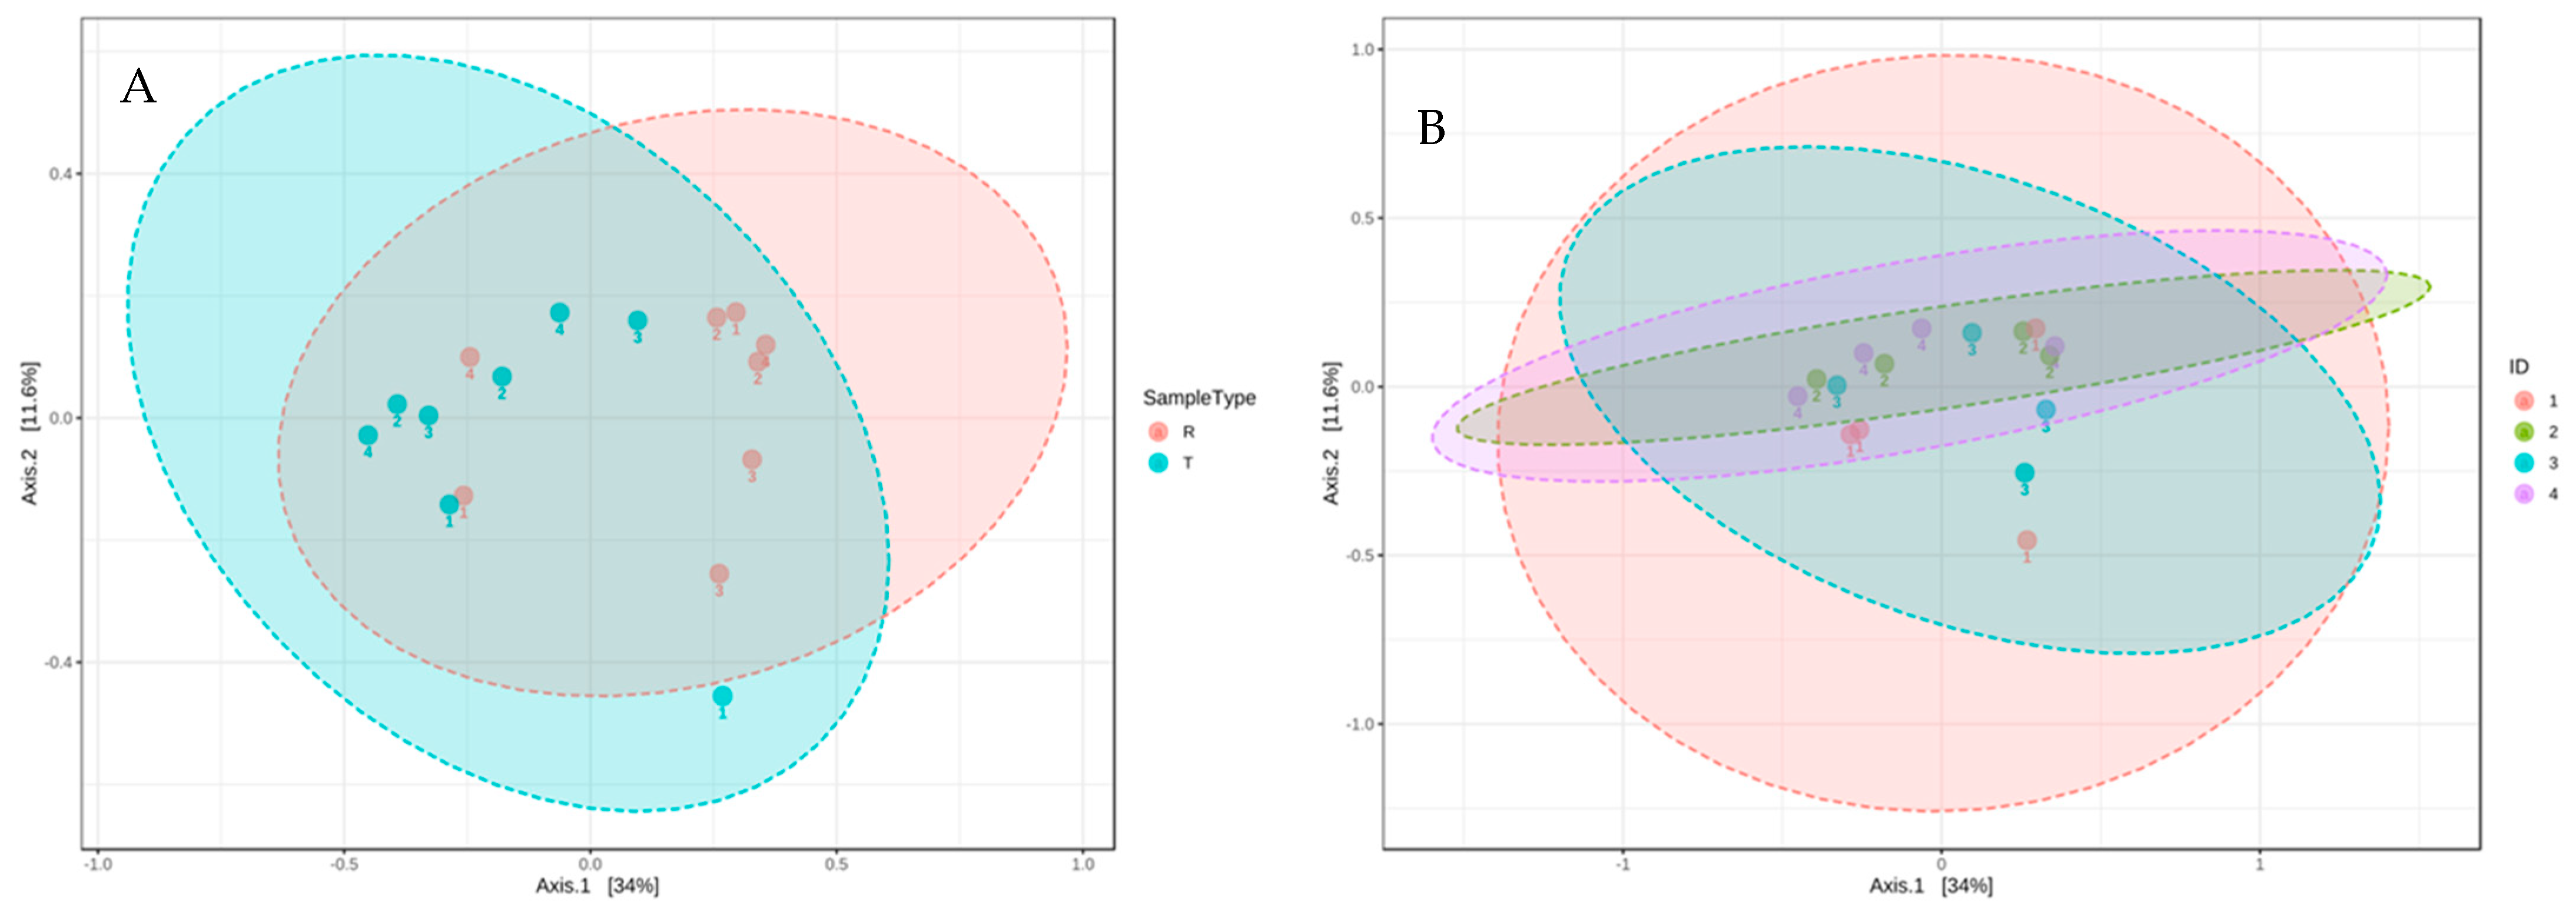
DNA was extracted from the microbial community of the raw and treated greywater, and the 16S rRNA genes were sequenced to establish the community structure before and after treatment in the CWs. Using bray distance analysis shows that the community composition did not change after treatment for all households (Figure 3).
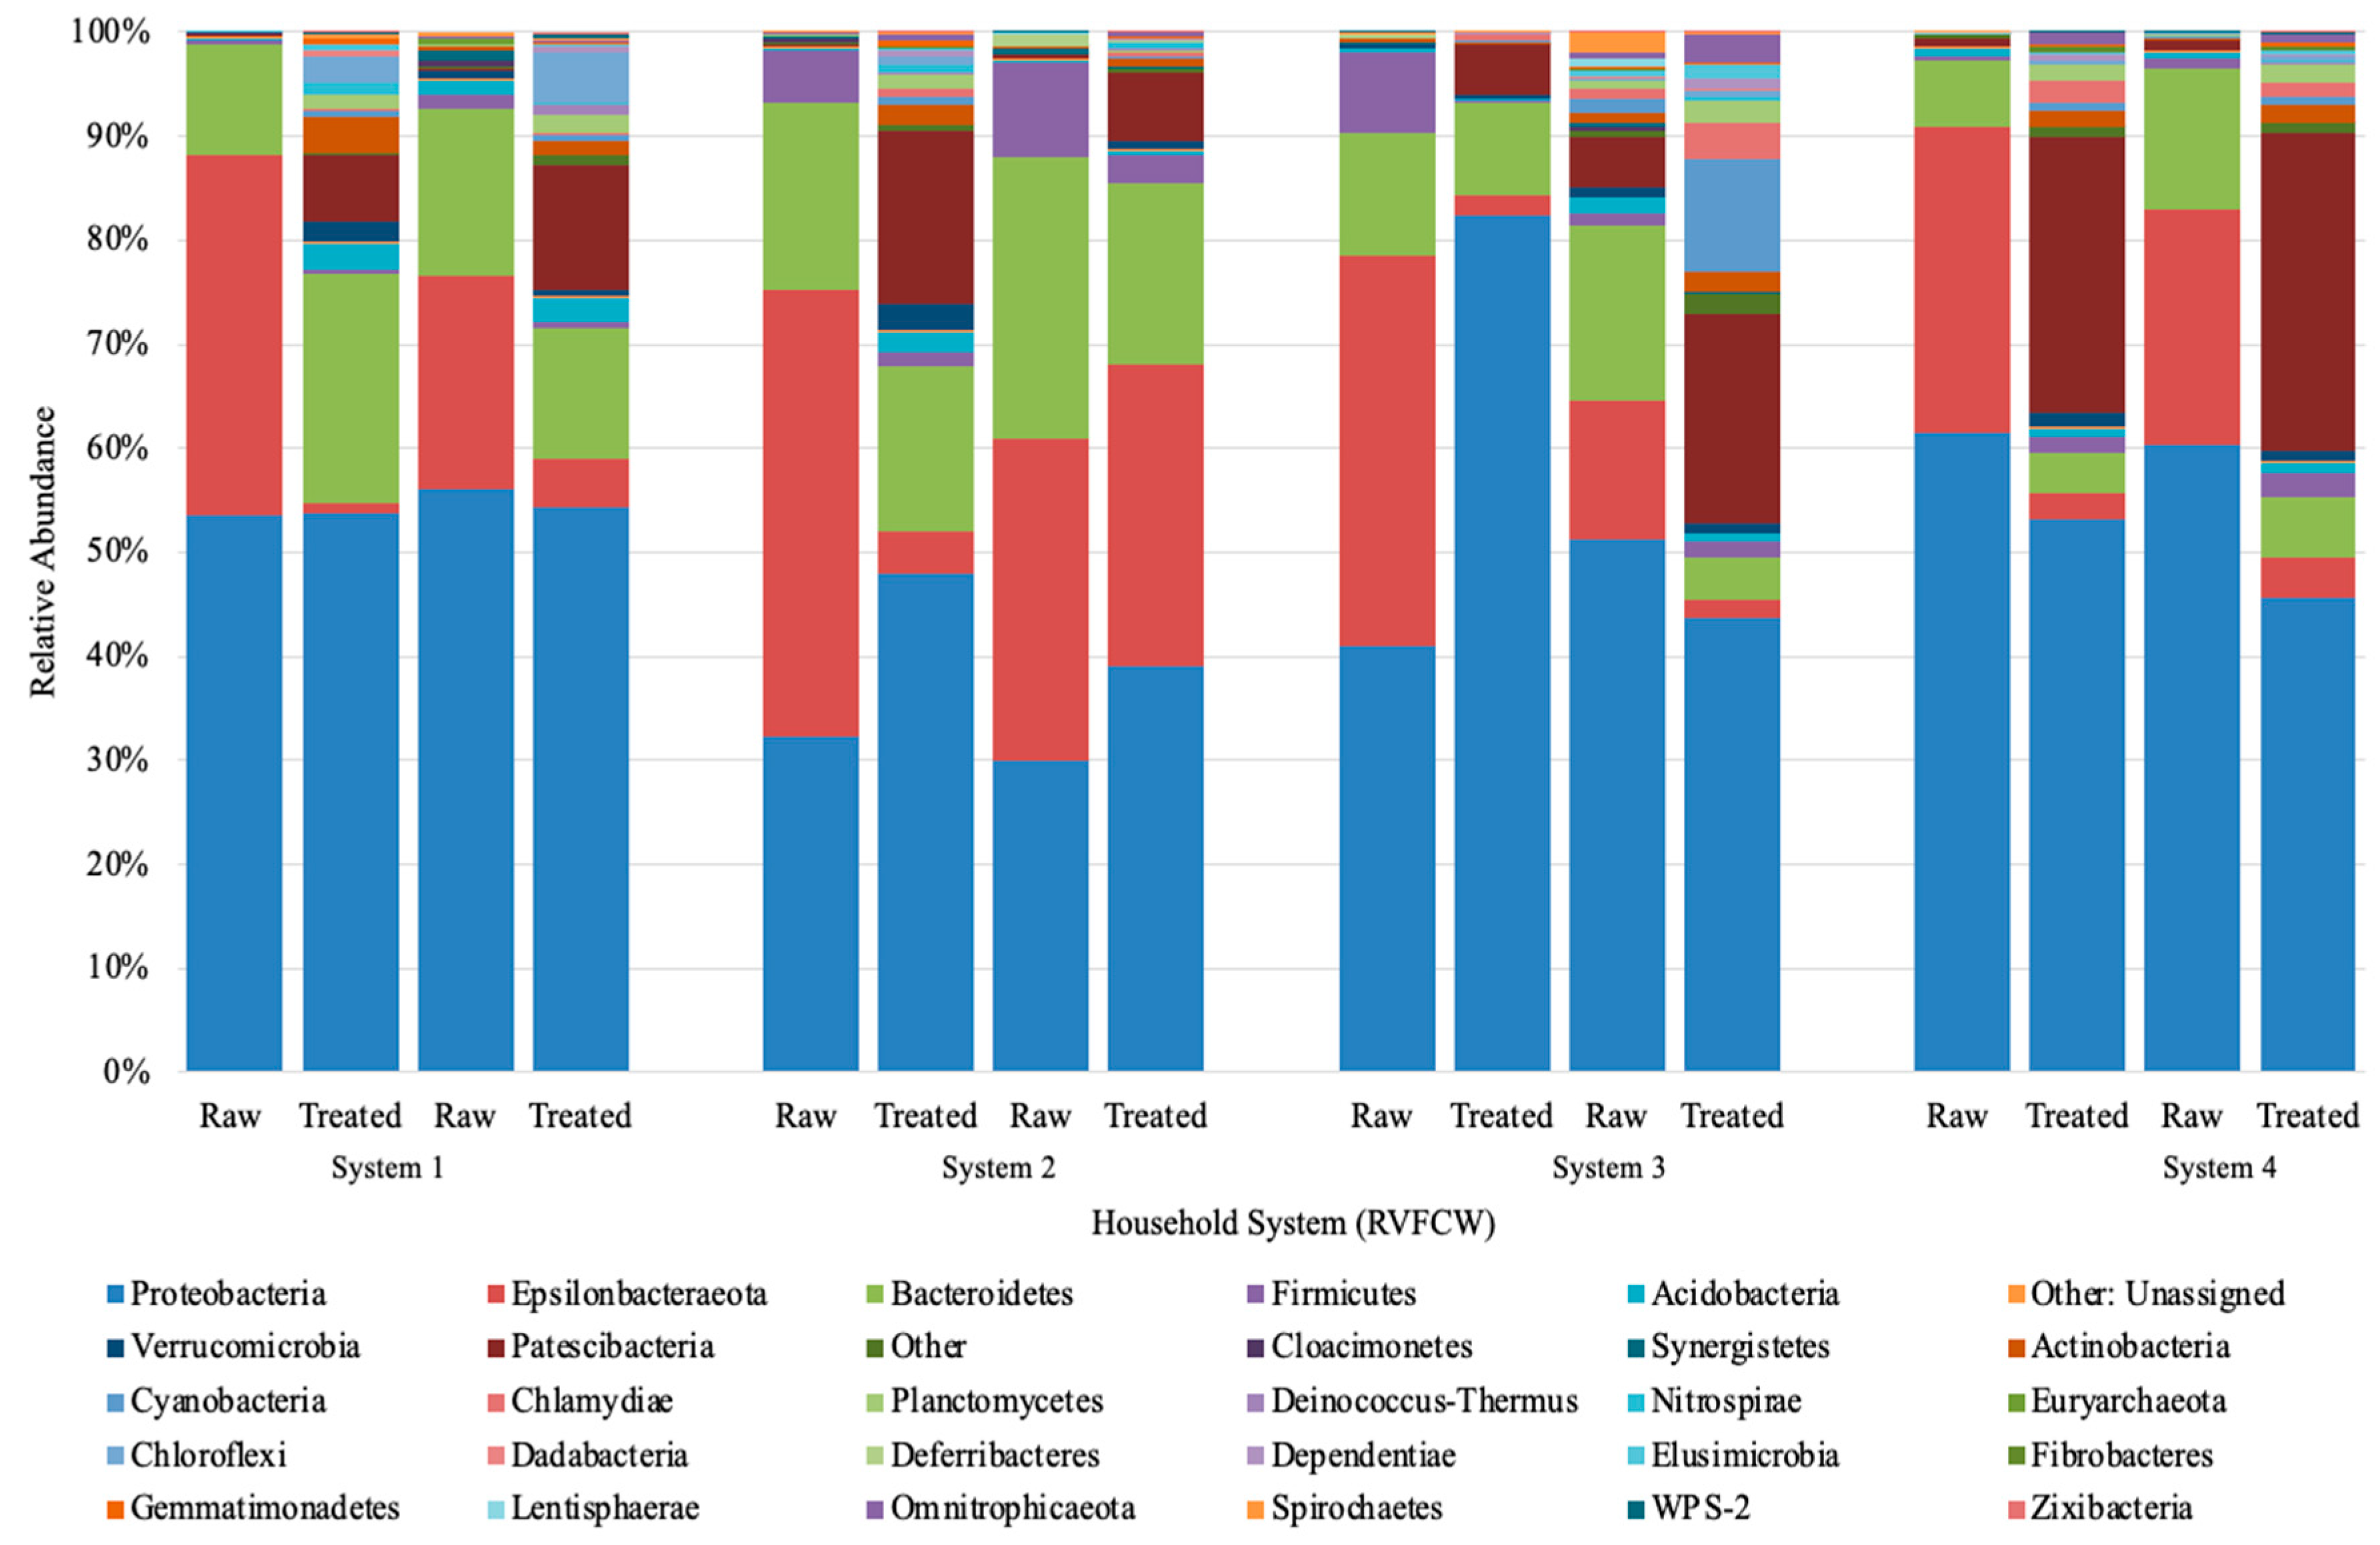
Proteobacteria, Epsilonbacteraeota, and Bacteroidetes phyla dominated the raw and treated greywater (Figure 3). Other phyla with a lower relative abundance that increased in treated greywater were Patescibateria, Acidobacteria, and Verrucomicrobia, while Firmicutes varied slightly. Although treated samples were more biodiverse, the abundance of more minor bacterial phyla (e.g., Firmicutes, Acidobacteria, Cyanobacteria) were generally below 2% (Figure 3). This increase in biodiversity could be due to several factors, including physical, chemical, and biological treatment processes in the CW, such as filtration, aerobic and anaerobic biodegradation, competition, predation, and plant uptake [61].
The relatively high abundance of Proteobacteria was expected and only increased slightly after treatment in CW1 and CW2, while in CW4, Proteobacteria decreased, and CW3 showed varying trends on different sampling days. Of the Proteobacteria classes identified, Gammaproteobacteria was the most abundant (85.3%). In addition, most of the colonies isolated on the ESBL plates belonged to this class (Table 4). There were relatively small changes in the class percentages as Pseudomonodaceae decreased ~1 log and Aeromonadaceae decreased ~0.5 log in the final effluent, and Enterobacteriaceae increased ~1 log (Figure 3). In prior studies, a ~1 log decrease in Pseudomonas and E. coli, which come from the Gammaproteobacteria class, was also observed in CW using both qPCR and culturable methods [26]. These combined results indicate that the performance of the CWs is steady for bacterial reduction; however, in our study, we observed a greater log reduction, approximately 2–3 logs. Overall, a greater log reduction is more advantageous as it ultimately reduces the ARGs introduced into the environment and the public.
The second most identified phylum in our study was Epsilonbacteraeota, which was more abundant in raw greywater (Figure 3). Nitrifying bacteria, such as Nitrosomonas, belong to the phylum Epsilonbacteraeota, accounting for nitrification or denitrification [62]. Epsilonbacteraeota decreased from 25% to 14% in the final effluent of all household systems (Figure 3). Although Epsilonbacteraeota was detected for sequencing, none were isolated on the cultured ESBL plates. Bacteroidetes was the third most identified phylum. Based on the community sequencing results, the relative abundance of Bacteroidetes varied for each CW; however, variations were minor. The relative abundance of Bacteroidetes did not change significantly after treatment in the CWs, decreasing from 13% to 11% (Figure 3). Based on the results from the PCoA plot using bray distance analysis, the community composition from raw to treated greywater did not change considerably after treatment in the CWs (Figure 4). However, the results demonstrate that the overall distribution of bacteria was reduced after treatment.
3.6. ESBL Isolates
Bacteria in raw greywater were isolated from the ESBL plates and were identified using 16S rDNA sequencing (Table 4). Pseudomonas was the most prevalent genus and was identified in all households. Other commonly identified bacteria were Citrobacter and Aeromonas. A few bacteria identified from the ESBL isolates have been identified in hospital environments, have caused clinical infections, and have been detected in immunocompromised individuals (Acinetobacter nosocomial, Pseudomonas fulva, Pseudomonas putida, Pseudomonas monteilii, and Roseomonas cervicalis) [63,64,65,66,67].
Pseudomonas putida was identified in two households and has been reported to cause clinical resistance to carbapenems and cephems (Table 4) [68]. In the same study, Pseudomonas putida transferred resistance genes to Pseudomonas aeruginosa via conjugation and transformation, which conferred resistance to amikacin and beta-lactams. Although Pseudomonas aeruginosa was not isolated on ESBL agar in this study, it was identified in the same CWs from a previous study [69]. Benami et al. [69] reported that opportunistic pathogens (Enterococcus faecalis and Pseudomonas aeruginosa) were detected in treated greywater. Although these pathogens were isolated our study, that does not negate their presence in raw or treated greywater as indicated by proteobacteria in the water microbiome. Other ESBL bacteria (Aeromonas hydrophila, Pseudomonas guariconensis, and Pseudomonas viridiflava) have been identified in outdoor, zoonotic, and greywater-impacted environments [22,70,71,72,73].
When considering the larger narrative of ARG and pathogens, it is pertinent to consider the transfer of resistant genes from pathogenic to non-pathogenic organisms and the health risks associated with gene transfer [74]. Combining previous knowledge of pathogenic microorganisms with this current research on intI1, sul1, and qnrS, there is a potential for these ARGs or other ARGs to be transferred to pathogenic or non-pathogenic bacteria. This research was conducted in a relatively well-resourced desert community of primarily single-family households with greywater treatment and reuse systems. However, greywater is often not treated before reuse in many other water-stressed communities in Israel and globally [22].
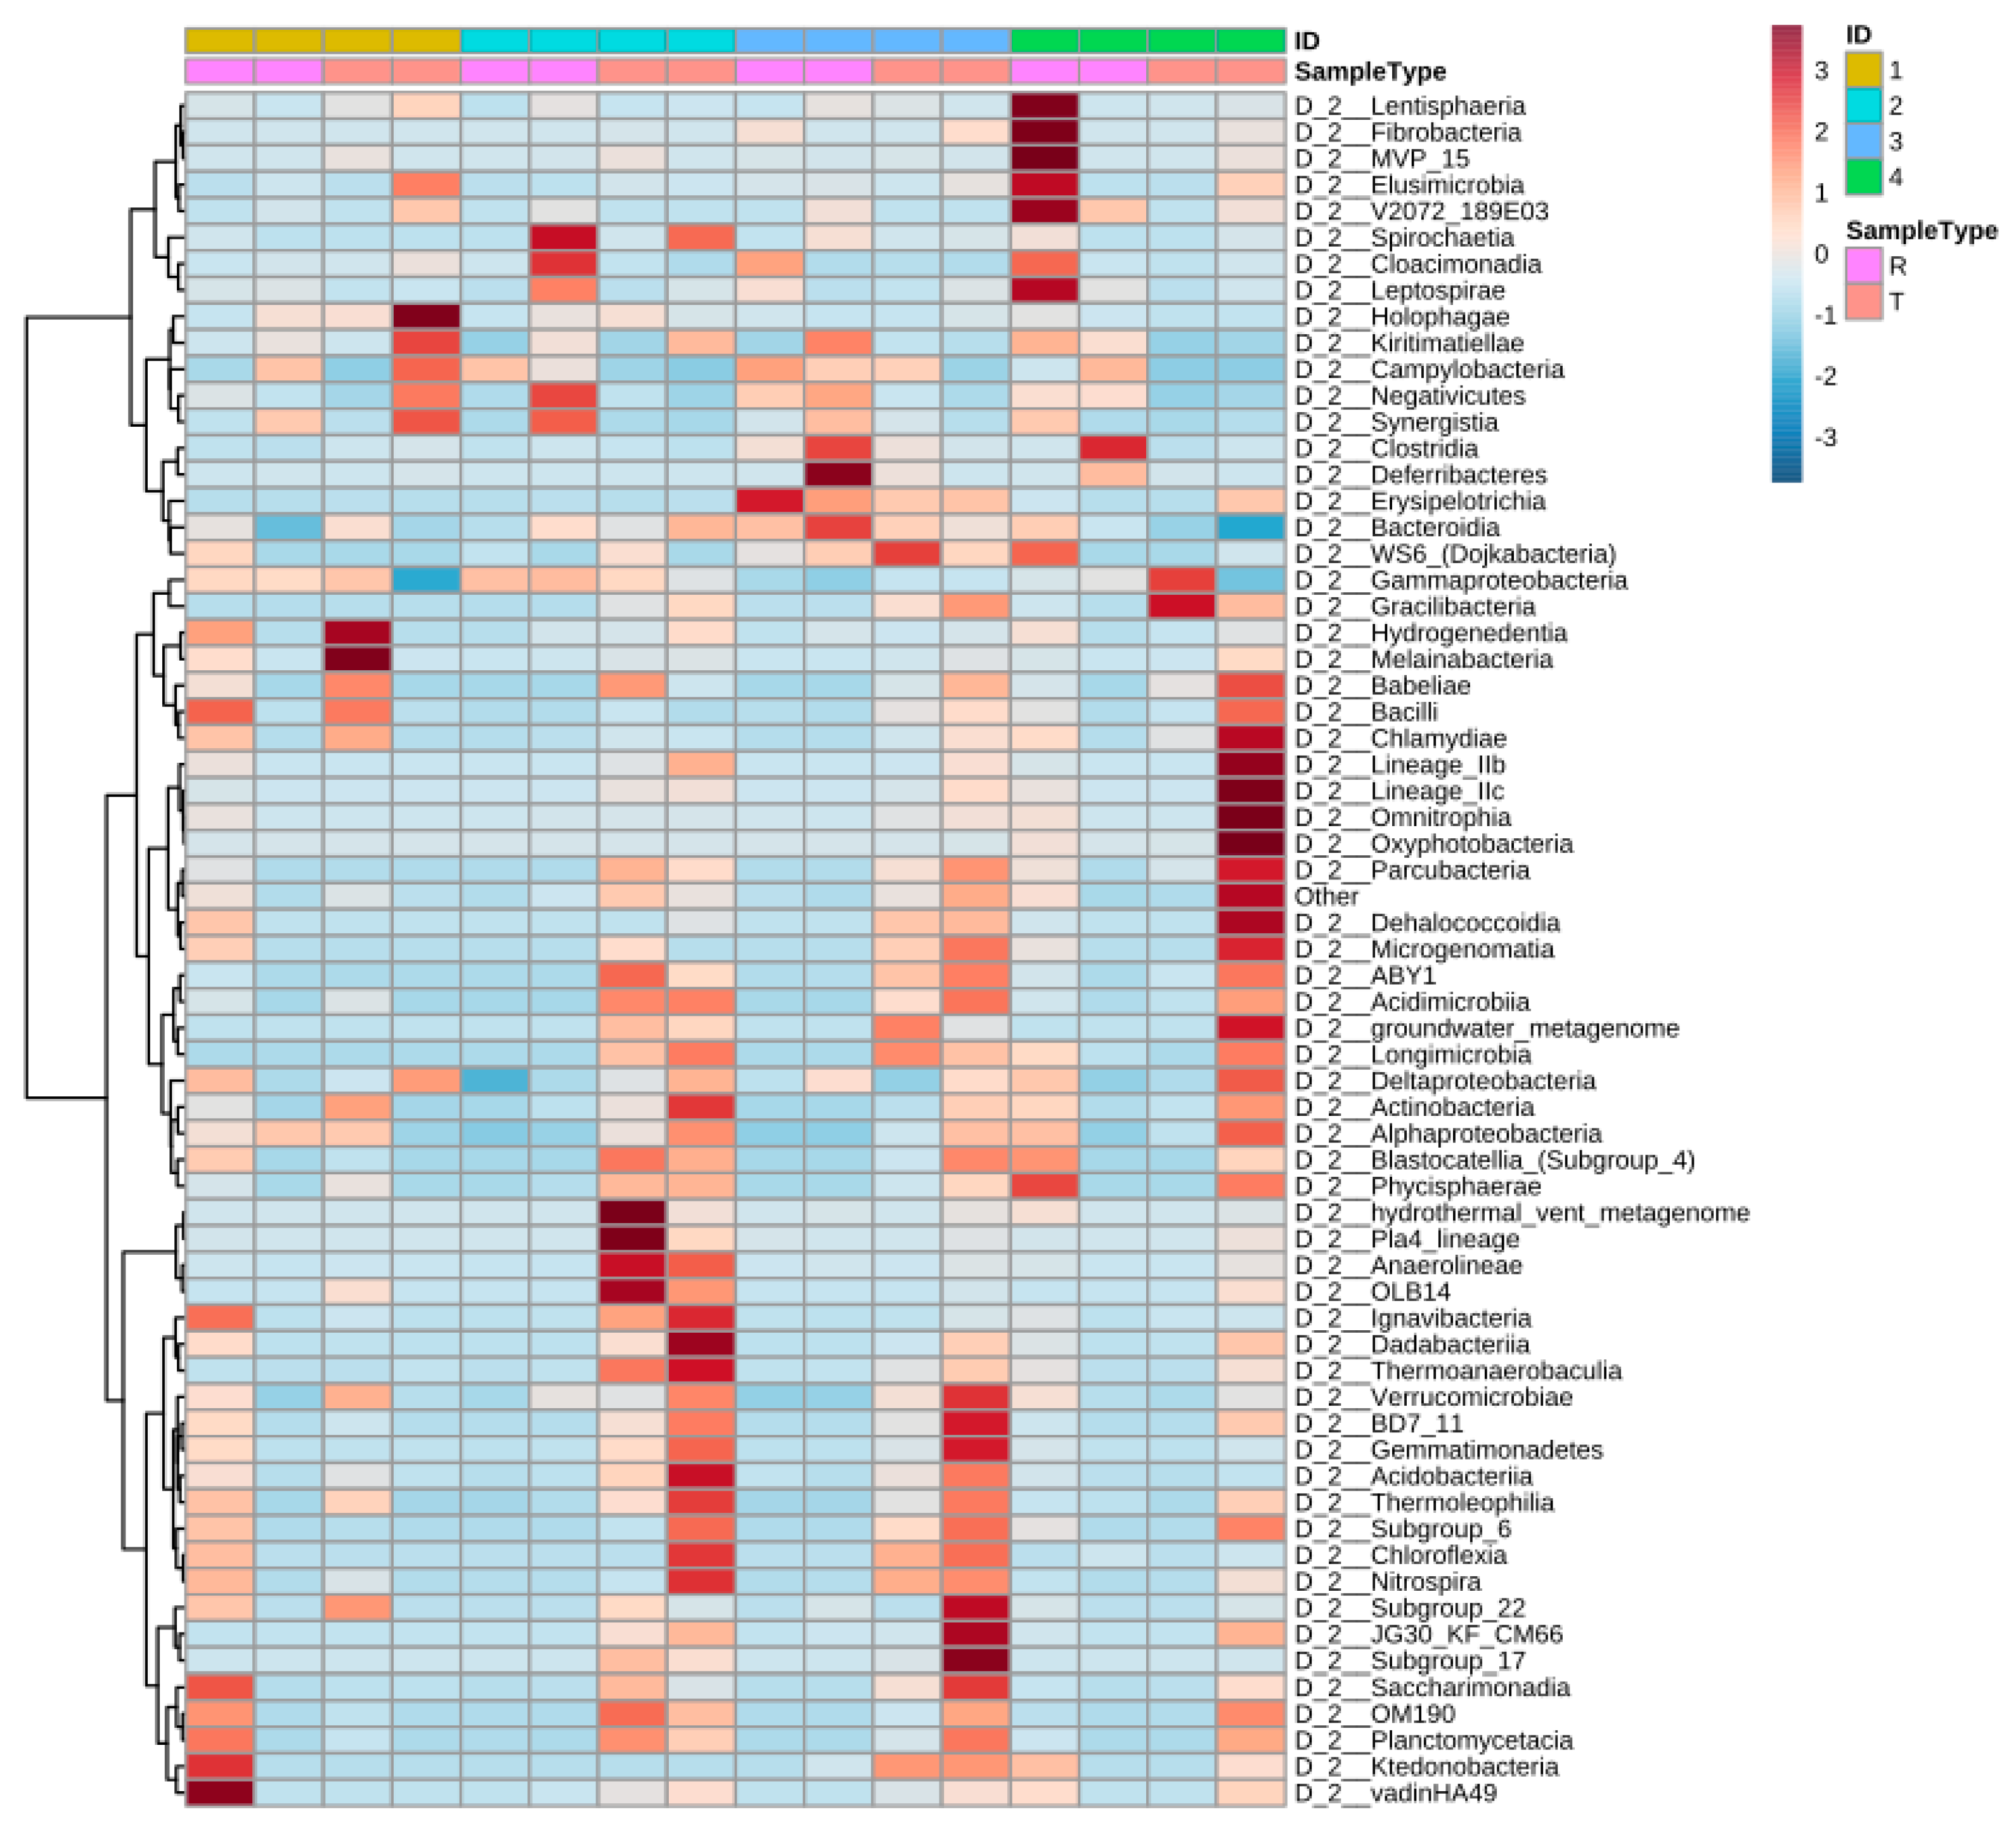
Figure 5 shows the distribution of the most identified phylum in the constructed wetlands. Results from the heat map show that the abundance of specific bacteria varies from raw to treated greywater and the distribution changes considerably. The synchronicity between the CWs is also relatively low as well with varied bacteria populations. Before treatment in CW4, Lentisphaeria and Fibrobacteria were abundant; however, after treatment, they were scarcely detected and vice versa for Chlamydiae and oxyphotobacteria (cyanobacteria) (Figure 5).
4. Conclusions
This work demonstrates that it is advantageous to treat greywater before reuse and provides insights into the fate of ARB and ARG in household greywater treatment systems. There is a chance that these genes could interact in wastewater treatment systems or other aquatic environments and be transferred to potentially pathogenic bacteria via natural transformation or conjugation. This is important if homeowners reuse treated effluent for irrigation because ARG may persist in these systems. Although the effluent microbial community was not significantly altered, the CWs studied substantially reduced the amount of ARG, ARB, bacteria, E. coli, solids, and organic matter in greywater. A primary concern with abundant ARG in wastewater is the presence of intI1. In this research, we found that intI1 was correlated with ARG sul1. When ARGs are in abundance, intI1 can increase the transfer rate of ARGs to nonresistant bacteria. The presence of intI1 and other ARGs could confer the transfer of ARG into bacteria and increase the overall amount of ARB present in wastewater and natural waters. This raises concerns when considering public health.
Author Contributions
Conceptualization, Z.R., A.G. and S.J.E.; methodology, M.H., Z.R. and A.G.; software, Z.R. and M.H.; validation, Z.R. and M.H.; formal analysis, M.H. and Z.R.; investigation, M.H. and Z.R.; resources, A.G.; data curation, A.G. and Z.R.; writing—original draft preparation, M.H.; writing—review and editing, M.H., S.J.E., K.G. and Z.R.; visualization, Z.R. and M.H.; supervision, S.J.E., K.G., Z.R. and A.G.; project administration, Z.R.; funding acquisition, Z.R. and S.J.E. All authors have read and agreed to the published version of the manuscript.
Funding
This research was funded by the NSF PIRE: Context-Sensitive Implementation of Synergistic Water-Energy Systems Award Number 1243510. The Zuck Macabi Foundation also supported this research. This project was also funded by the Alfred P. Sloan Foundation University Center for Exemplary Mentoring (UCEM) Award #2013-5-13MPHDT to USF and the Florida Education Fund’s McKnight Doctoral Fellowship Program.
Institutional Review Board Statement
Not applicable.
Informed Consent Statement
Not applicable.
Data Availability Statement
Raw microbiome reads were deposited in the NCBI sequence read archives (SAR) under Bio Project accession number PRJNA725961. Raw chemical, microbiological and qPCR data can be requested from the first author (M.H.)
Acknowledgments
The authors would like to acknowledgement the lab management team and lab-mates at the Ben Gurion University of the Negev, especially Damiana Diaz-Reck, Lusine Ghazaryan, and Seema Porob.
Conflicts of Interest
The authors declare no conflict of interest. The sponsors had no role in the design, execution, interpretation, or writing of the study.
References
- WHO. WHO Guidelines for the Safe Use of Wastewater, Excreta and Greywater: Volume I–IV Policy and Regulatory Aspects; World Health Organization (WHO): Geneva, Switzerland, 2006. [Google Scholar]
- Gross, A.; Alfiya, Y.; Sklarz, M.; Maimon, A.; Friedler, E. Environmental Impact of Irrigation with Greywater Treated by Recirculating Vertical Flow Constructed Wetlands in Two Climatic Regions. Water Sci. Technol. 2014, 69, 2452–2459. [Google Scholar] [CrossRef] [PubMed]
- Siggins, A.; Burton, V.; Ross, C.; Lowe, H.; Horswell, J. Effects of Long-Term Greywater Disposal on Soil: A Case Study. Sci. Total Environ. 2016, 557–558, 627–635. [Google Scholar] [CrossRef]
- Maimon, A.; Gross, A.; Arye, G. Greywater-Induced Soil Hydrophobicity. Chemosphere 2017, 184, 1012–1019. [Google Scholar] [CrossRef]
- Zainab, S.M.; Junaid, M.; Xu, N.; Malik, R.N. Antibiotics and Antibiotic Resistant Genes (ARGs) in Groundwater: A Global Review on Dissemination, Sources, Interactions, Environmental and Human Health Risks. Water Res. 2020, 187, 116455. [Google Scholar] [CrossRef] [PubMed]
- Gatica, J.; Cytryn, E. Impact of Treated Wastewater Irrigation on Antibiotic Resistance in the Soil Microbiome. Environ. Sci. Pollut. Res. 2013, 20, 3529–3538. [Google Scholar] [CrossRef] [Green Version]
- Vymazal, J. The Use of Hybrid Constructed Wetlands for Wastewater Treatment with Special Attention to Nitrogen Removal: A Review of a Recent Development. Water Res. 2013, 47, 4795–4811. [Google Scholar] [CrossRef]
- Busgang, A.; Friedler, E.; Gilboa, Y.; Gross, A. Quantitative Microbial Risk Analysis for Various Bacterial Exposure Scenarios Involving Greywater Reuse for Irrigation. Water 2018, 10, 413. [Google Scholar] [CrossRef] [Green Version]
- Vymazal, J.; Zhao, Y.; Mander, Ü. Recent Research Challenges in Constructed Wetlands for Wastewater Treatment: A Review. Ecol. Eng. 2021, 169, 106318. [Google Scholar] [CrossRef]
- Gross, A.; Shmueli, O.; Ronen, Z.; Raveh, E. Recycled Vertical Flow Constructed Wetland (RVFCW)-a Novel Method of Recycling Greywater for Irrigation in Small Communities and Households. Chemosphere 2007, 66, 916–923. [Google Scholar] [CrossRef]
- Pruden, A.; Alcalde, R.E.; Alvarez, P.J.J.; Ashbolt, N.; Bischel, H.; Capiro, N.L.; Crossette, E.; Frigon, D.; Grimes, K.; Haas, C.N.; et al. An Environmental Science and Engineering Framework for Combating Antimicrobial Resistance. Environ. Eng. Sci. 2018, 35, 1005–1011. [Google Scholar] [CrossRef] [Green Version]
- Garner, E.; Organiscak, M.; Dieter, L.; Shingleton, C.; Haddix, M.; Joshi, S.; Pruden, A.; Ashbolt, N.J.; Medema, G.; Hamilton, K.A. Towards Risk Assessment for Antibiotic Resistant Pathogens in Recycled Water: A Systematic Review and Summary of Research Needs. Environ. Microbiol. 2021, 23, 7355–7372. [Google Scholar] [CrossRef] [PubMed]
- O’Neill, J. Tackling Drug-Resistant Infections Globally: Final Report and Recommendations the Review on Antimicrobial Resistance; Review on Antimicrobial Resistance: London, UK, 2016. [Google Scholar]
- Davies, J.; Spiegelman, G.B.; Yim, G. The World of Subinhibitory Antibiotic Concentrations. Curr. Opin. Microbiol. 2006, 9, 445–453. [Google Scholar] [CrossRef]
- Gullberg, E.; Cao, S.; Berg, O.G.; Ilbäck, C.; Sandegren, L.; Hughes, D.; Andersson, D.I. Selection of Resistant Bacteria at Very Low Antibiotic Concentrations. PLoS Pathog. 2011, 7, e1002158. [Google Scholar] [CrossRef] [PubMed] [Green Version]
- Kohanski, M.A.; DePristo, M.A.; Collins, J.J. Sublethal Antibiotic Treatment Leads to Multidrug Resistance via Radical-Induced Mutagenesis. Mol. Cell 2010, 37, 311–320. [Google Scholar] [CrossRef] [Green Version]
- Alfiya, Y.; Dubowski, Y.; Friedler, E. Diurnal Patterns of Micropollutants Concentrations in Domestic Greywater. Urban Water J. 2018, 15, 399–406. [Google Scholar] [CrossRef]
- Varela, A.R.; Manaia, C.M. Human Health Implications of Clinically Relevant Bacteria in Wastewater Habitats. Environ. Sci. Pollut. Res. 2013, 20, 3550–3569. [Google Scholar] [CrossRef] [PubMed]
- Vaz-Moreira, I.; Varela, A.R.; Pereira, T.V.; Fochat, R.C.; Manaia, C.M. Multidrug Resistance in Quinolone-Resistant Gram-Negative Bacteria Isolated from Hospital Effluent and the Municipal Wastewater Treatment Plant. Microb. Drug Resist. 2016, 22, 155–163. [Google Scholar] [CrossRef]
- Usman, M.; Farooq, M.; Hanna, K. Environmental Side Effects of the Injudicious Use of Antimicrobials in the Era of COVID-19. Sci. Total Environ. 2020, 745, 141053. [Google Scholar] [CrossRef]
- Harrow, D.I.; Felker, J.M.; Baker, K.H. Impacts of Triclosan in Greywater on Soil Microorganisms. Appl. Environ. Soil Sci. 2011, 2011, 646750. [Google Scholar] [CrossRef] [Green Version]
- Porob, S.; Craddock, H.A.; Motro, Y.; Sagi, O.; Gdalevich, M.; Ezery, Z.; Davidovitch, N.; Ronen, Z.; Moran-Gilad, J. Quantification and Characterization of Antimicrobial Resistance in Greywater Discharged to the Environment. Water 2020, 12, 1460. [Google Scholar] [CrossRef]
- Arden, S.; Ma, X. Constructed Wetlands for Greywater Recycle and Reuse: A Review. Sci. Total Environ. 2018, 630, 587–599. [Google Scholar] [CrossRef] [PubMed]
- Ghaitidak, D.M.; Yadav, K.D. Characteristics and Treatment of Greywater-a Review. Environ. Sci. Pollut. Res. 2013, 20, 2795–2809. [Google Scholar] [CrossRef] [PubMed]
- Alfiya, Y.; Gross, A.; Sklarz, M.; Friedler, E. Reliability of On-Site Greywater Treatment Systems in Mediterranean and Arid Environments—A Case Study. Water Sci. Technol. 2013, 67, 1389–1395. [Google Scholar] [CrossRef] [PubMed]
- Benami, M.; Gillor, O.; Gross, A. The Question of Pathogen Quantification in Disinfected Graywater. Sci. Total Environ. 2015, 506-507, 496–504. [Google Scholar] [CrossRef]
- APHA; AWWA; WEF. Standard Methods for the Examination of Water & Wastewater, 23rd ed.; American Public Health Association (APHA); American Water Works Association (AWWA); Water Environment Federation (WEF): Denver, CO, USA, 2017. [Google Scholar]
- Potter, B.B.; Wimsatt, J.C. Determination of Total Organic Carbon and Specific Uv Absorbance at 254 nm in Source Water and Drinking Water; US EPA Method 415.3; U.S. Environmental Protection Agency: Washington, DC, USA, 2005.
- Mau, V.; Neumann, J.; Wehrli, B.; Gross, A. Nutrient Behavior in Hydrothermal Carbonization Aqueous Phase Following Recirculation and Reuse. Environ. Sci. Technol. 2019, 53, 10426–10434. [Google Scholar] [CrossRef]
- Troiano, E.; Beneduce, L.; Gross, A.; Ronen, Z. Antibiotic-Resistant Bacteria in Greywater and Greywater-Irrigated Soils. Front. Microbiol. 2018, 9, 2666. [Google Scholar] [CrossRef]
- Rocha, J.; Cacace, D.; Kampouris, I.; Guilloteau, H.; Jäger, T.; Marano, R.B.M.; Karaolia, P.; Manaia, C.M.; Merlin, C.; Fatta-Kassinos, D.; et al. Inter-Laboratory Calibration of Quantitative Analyses of Antibiotic Resistance Genes. J. Environ. Chem. Eng. 2020, 8, 102214. [Google Scholar] [CrossRef]
- Makowska, N.; Koczura, R.; Mokracka, J. Class 1 Integrase, Sulfonamide and Tetracycline Resistance Genes in Wastewater Treatment Plant and Surface Water. Chemosphere 2016, 144, 1665–1673. [Google Scholar] [CrossRef]
- Szczepanowski, R.; Linke, B.; Krahn, I.; Gartemann, K.H.; Gützkow, T.; Eichler, W.; Pühler, A.; Schlüter, A. Detection of 140 Clinically Relevant Antibiotic-Resistance Genes in the Plasmid Metagenome of Wastewater Treatment Plant Bacteria Showing Reduced Susceptibility to Selected Antibiotics. Microbiology 2009, 155, 2306–2319. [Google Scholar] [CrossRef] [Green Version]
- Ionescu, D.; Overholt, W.A.; Lynch, M.D.J.; Neufeld, J.D.; Naqib, A.; Green, S.J. Microbial Community Analysis Using High-Throughput Amplicon Sequencing. In Manual of Environmental Microbiology; ASM Press: Washington, DC, USA, 2015. [Google Scholar]
- Takahashi, S.; Tomita, J.; Nishioka, K.; Hisada, T.; Nishijima, M. Development of a Prokaryotic Universal Primer for Simultaneous Analysis of Bacteria and Archaea Using Next-Generation Sequencing. PLoS ONE 2014, 9, e105592. [Google Scholar] [CrossRef] [Green Version]
- Zhang, J.; Kobert, K.; Flouri, T.; Stamatakis, A. PEAR: A Fast and Accurate Illumina Paired-End ReAd MergeR. Bioinformatics 2014, 30, 614–620. [Google Scholar] [CrossRef] [Green Version]
- Edgar, R.C. Search and Clustering Orders of Magnitude Faster than BLAST. Bioinformatics 2010, 26, 2460–2461. [Google Scholar] [CrossRef] [Green Version]
- Dhariwal, A.; Chong, J.; Habib, S.; King, I.L.; Agellon, L.B.; Xia, J. MicrobiomeAnalyst: A Web-Based Tool for Comprehensive Statistical, Visual and Meta-Analysis of Microbiome Data. Nucleic Acids Res. 2017, 45, W180–W188. [Google Scholar] [CrossRef] [PubMed]
- Nadkarni, M.A.; Martin, F.E.; Jacques, N.A.; Hunter, N. Determination of Bacterial Load by Real-Time PCR Using a Broad-Range (Universal) Probe and Primers Set. Microbiology 2002, 148, 257–266. [Google Scholar] [CrossRef] [PubMed] [Green Version]
- Muyzer, G.; De Waal, E.C.; Uitterlinden, A.G. Profiling of Complex Microbial Populations by Denaturing Gradient Gel Electrophoresis Analysis of Polymerase Chain Reaction-Amplified Genes Coding for 16S rRNA. Appl. Environ. Microbiol. 1993, 59, 695–700. [Google Scholar] [CrossRef] [PubMed] [Green Version]
- Gillings, M.R.; Gaze, W.H.; Pruden, A.; Smalla, K.; Tiedje, J.M.; Zhu, Y.G. Using the Class 1 Integron-Integrase Gene as a Proxy for Anthropogenic Pollution. ISME J. 2015, 9, 1269–1279. [Google Scholar] [CrossRef]
- Kaplan, E.; Ofek, M.; Jurkevitch, E.; Cytryn, E. Characterization of Fluoroquinolone Resistance and Qnr Diversity in Enterobacteriaceae from Municipal Biosolids. Front. Microbiol. 2013, 4, 144. [Google Scholar] [CrossRef] [Green Version]
- Pei, R.; Kim, S.C.; Carlson, K.H.; Pruden, A. Effect of River Landscape on the Sediment Concentrations of Antibiotics and Corresponding Antibiotic Resistance Genes (ARG). Water Res. 2006, 40, 2427–2435. [Google Scholar] [CrossRef]
- Inbar, Y. New Standards for Treated Wastewater Reuse in Israel. In Proceedings of the Wastewater Reuse–Risk Assessment, Decision-Making and Environmental Security; Zaidi, M.K., Ed.; Springer: Dordrecht, The Netherlands, 2007; pp. 291–296. [Google Scholar]
- Wang, J.; Chu, L.; Wojnárovits, L.; Takács, E. Occurrence and Fate of Antibiotics, Antibiotic Resistant Genes (ARGs) and Antibiotic Resistant Bacteria (ARB) in Municipal Wastewater Treatment Plant: An Overview. Sci. Total Environ. 2020, 744, 140997. [Google Scholar] [CrossRef]
- Shamsizadeh, Z.; Ehrampoush, M.H.; Nikaeen, M.; Farzaneh, mohammadi; Mokhtari, M.; Gwenzi, W.; Khanahmad, H. Antibiotic Resistance and Class 1 Integron Genes Distribution in Irrigation Water-Soil-Crop Continuum as a Function of Irrigation Water Sources. Environ. Pollut. 2021, 289, 117930. [Google Scholar] [CrossRef]
- Ma, Y.; Wilson, C.A.; Novak, J.T.; Riffat, R.; Aynur, S.; Murthy, S.; Pruden, A. Effect of Various Sludge Digestion Conditions on Sulfonamide, Macrolide, and Tetracycline Resistance Genes and Class 1 Integrons. Environ. Sci. Technol. 2011, 45, 7855–7861. [Google Scholar] [CrossRef]
- Liu, X.; Guo, X.; Liu, Y.; Lu, S.; Xi, B.; Zhang, J.; Wang, Z.; Bi, B. A Review on Removing Antibiotics and Antibiotic Resistance Genes from Wastewater by Constructed Wetlands: Performance and Microbial Response. Environ. Pollut. 2019, 254, 112996. [Google Scholar] [CrossRef] [PubMed]
- Krzeminski, P.; Tomei, M.C.; Karaolia, P.; Langenhoff, A.; Almeida, C.M.R.; Felis, E.; Gritten, F.; Andersen, H.R.; Fernandes, T.; Manaia, C.M.; et al. Performance of Secondary Wastewater Treatment Methods for the Removal of Contaminants of Emerging Concern Implicated in Crop Uptake and Antibiotic Resistance Spread: A Review. Sci. Total Environ. 2018, 648, 1052–1081. [Google Scholar] [CrossRef] [PubMed] [Green Version]
- Gross, A.; Maimon, A.; Alfiya, Y.; Friedler, E. Greywater Reuse; CRC Press: Boca Raton, FL, USA, 2015. [Google Scholar]
- Christgen, B.; Yang, Y.; Ahammad, S.Z.; Li, B.; Rodriquez, D.C.; Zhang, T.; Graham, D.W. Metagenomics Shows That Low-Energy Anaerobic-Aerobic Treatment Reactors Reduce Antibiotic Resistance Gene Levels from Domestic Wastewater. Environ. Sci. Technol. 2015, 49, 2577–2584. [Google Scholar] [CrossRef] [PubMed]
- Chen, J.; Ying, G.G.; Wei, X.D.; Liu, Y.S.; Liu, S.S.; Hu, L.X.; He, L.Y.; Chen, Z.F.; Chen, F.R.; Yang, Y.Q. Removal of Antibiotics and Antibiotic Resistance Genes from Domestic Sewage by Constructed Wetlands: Effect of Flow Configuration and Plant Species. Sci. Total Environ. 2016, 571, 974–982. [Google Scholar] [CrossRef]
- Nõlvak, H.; Truu, M.; Tiirik, K.; Oopkaup, K.; Sildvee, T.; Kaasik, A.; Mander, Ü.; Truu, J. Dynamics of Antibiotic Resistance Genes and Their Relationships with System Treatment Efficiency in a Horizontal Subsurface Flow Constructed Wetland. Sci. Total Environ. 2013, 461, 636–644. [Google Scholar] [CrossRef]
- Cacace, D.; Fatta-Kassinos, D.; Manaia, C.M.; Cytryn, E.; Kreuzinger, N.; Rizzo, L.; Karaolia, P.; Schwartz, T.; Alexander, J.; Merlin, C.; et al. Antibiotic Resistance Genes in Treated Wastewater and in the Receiving Water Bodies: A Pan-European Survey of Urban Settings. Water Res. 2019, 162, 320–330. [Google Scholar] [CrossRef]
- Gao, P.; Munir, M.; Xagoraraki, I. Correlation of Tetracycline and Sulfonamide Antibiotics with Corresponding Resistance Genes and Resistant Bacteria in a Conventional Municipal Wastewater Treatment Plant. Sci. Total Environ. 2012, 421–422, 173–183. [Google Scholar] [CrossRef]
- Xu, J.; Xu, Y.; Wang, H.; Guo, C.; Qiu, H.; He, Y.; Zhang, Y.; Li, X.; Meng, W. Occurrence of Antibiotics and Antibiotic Resistance Genes in a Sewage Treatment Plant and Its Effluent-Receiving River. Chemosphere 2015, 119, 1379–1385. [Google Scholar] [CrossRef]
- Balcázar, J.L.; Subirats, J.; Borrego, C.M. The Role of Biofilms as Environmental Reservoirs of Antibiotic Resistance. Front. Microbiol. 2015, 6, 1216. [Google Scholar] [CrossRef] [Green Version]
- Liao, J.; Chen, Y. Removal of Intl1 and Associated Antibiotics Resistant Genes in Water, Sewage Sludge and Livestock Manure Treatments. Rev. Environ. Sci. Biotechnol. 2018, 17, 471–500. [Google Scholar] [CrossRef]
- Koczura, R.; Mokracka, J.; Taraszewska, A.; Łopacinska, N. Abundance of Class 1 Integron-Integrase and Sulfonamide Resistance Genes in River Water and Sediment Is Affected by Anthropogenic Pressure and Environmental Factors. Microb. Ecol. 2016, 72, 909–916. [Google Scholar] [CrossRef] [Green Version]
- Gillings, M.; Boucher, Y.; Labbate, M.; Holmes, A.; Krishnan, S.; Holley, M.; Stokes, H.W. The Evolution of Class 1 Integrons and the Rise of Antibiotic Resistance. J. Bacteriol. 2008, 190, 5095–5100. [Google Scholar] [CrossRef] [PubMed] [Green Version]
- Verduzo Garibay, M.; Fernández del Castillo, A.; de Anda, J.; Senés-Guerrero, C.; Gradilla-Hernández, M.S. Structure and Activity of Microbial Communities in Response to Environmental, Operational, and Design Factors in Constructed Wetlands. Int. J. Environ. Sci. Technol. 2021, 2021, 1–26. [Google Scholar] [CrossRef]
- Waite, D.W.; Vanwonterghem, I.; Rinke, C.; Parks, D.H.; Zhang, Y.; Takai, K.; Sievert, S.M.; Simon, J.; Campbell, B.J.; Hanson, T.E.; et al. Comparative Genomic Analysis of the Class Epsilonproteobacteria and Proposed Reclassification to Epsilonbacteraeota (Phyl. Nov.). Front. Microbiol. 2017, 8, 682. [Google Scholar] [CrossRef] [PubMed]
- Wisplinghoff, H.; Paulus, T.; Lugenheim, M.; Stefanik, D.; Higgins, P.G.; Edmond, M.B.; Wenzel, R.P.; Seifert, H. Nosocomial Bloodstream Infections Due to Acinetobacter baumannii, Acinetobacter fittii and Acinetobacter nosocomialis in the United States. J. Infect. 2012, 64, 282–290. [Google Scholar] [CrossRef]
- Almuzara, M.N.; Vazquez, M.; Tanaka, N.; Turco, M.; Ramirez, M.S.; Lopez, E.L.; Pasteran, F.; Rapoport, M.; Procopio, A.; Vay, C.A. First Case of Human Infection Due to Pseudomonas fulva, an Environmental Bacterium Isolated from Cerebrospinal Fluid. J. Clin. Microbiol. 2010, 48, 660–664. [Google Scholar] [CrossRef] [Green Version]
- Dé, I.; Rolston, K.; Han, X. Clinical Significance of Roseomonas Species Isolated from Catheter and Blood Samples: Analysis of 36 Cases in Patients with Cancer. Clin. Infect. Dis. 2004, 38, 1579–1584. [Google Scholar] [CrossRef]
- Cobo, F.; Jiménez, G.; Rodríguez-Granger, J.; Sampedro, A. Posttraumatic Skin and Soft-Tissue Infection Due to Pseudomonas fulva. Case Rep. Infect. Dis. 2016, 2016, 8716068. [Google Scholar] [CrossRef] [Green Version]
- Shariff, M.; Beri, K. Exacerbation of Bronchiectasis by Pseudomonas monteilii: A Case Report. BMC Infect. Dis. 2017, 17, 511. [Google Scholar] [CrossRef]
- Yomoda, S.; Okubo, T.; Takahashi, A.; Murakami, M.; Iyobe, S. Presence of Pseudomonas putida Strains Harboring Plasmids Bearing the Metallo-β-Lactamase Gene BlaIMP in a Hospital in Japan. J. Clin. Microbiol. 2003, 41, 4246–4251. [Google Scholar] [CrossRef] [Green Version]
- Benami, M.; Gross, A.; Herzberg, M.; Orlofsky, E.; Vonshak, A.; Gillor, O. Assessment of Pathogenic Bacteria in Treated Graywater and Irrigated Soils. Sci. Total Environ. 2013, 458–460, 298–302. [Google Scholar] [CrossRef] [PubMed]
- Toro, M.; Ramírez-Bahena, M.H.; José Cuesta, M.; Velázquez, E.; Peix, A. Pseudomonas guariconensis Sp. Nov., Isolated from Rhizospheric Soil. Int. J. Syst. Evol. Microbiol. 2013, 63, 4413–4420. [Google Scholar] [CrossRef] [PubMed]
- Rasmussen-Ivey, C.R.; Figueras, M.J.; McGarey, D.; Liles, M.R. Virulence Factors of Aeromonas hydrophila: In the Wake of Reclassification. Front. Microbiol. 2016, 7, 1337. [Google Scholar] [CrossRef]
- Ugarte-Torres, A.; Perry, S.; Franko, A.; Church, D.L. Multidrug-Resistant Aeromonas hydrophila Causing Fatal Bilateral Necrotizing Fasciitis in an Immunocompromised Patient: A Case Report. J. Med Case Rep. 2018, 12, 326. [Google Scholar] [CrossRef] [PubMed]
- Lipps, S.M.; Samac, D.A.; Cir, B. Pseudomonas viridiflava: An Internal Outsider of the Pseudomonas syringae Species Complex. Mol. Plant Pathol. 2022, 23, 3–15. [Google Scholar] [CrossRef]
- Hong, P.Y.; Julian, T.R.; Pype, M.L.; Jiang, S.C.; Nelson, K.L.; Graham, D.; Pruden, A.; Manaia, C.M. Reusing Treated Wastewater: Consideration of the Safety Aspects Associated with Antibiotic-Resistant Bacteria and Antibiotic Resistance Genes. Water 2018, 10, 244. [Google Scholar] [CrossRef] [Green Version]
Figure 1.
Recirculating vertical flow constructed wetland schematic.

Figure 2.
Relative abundance of 16S, sul1, qnrS, intI1, and blaCTXM32 before (untreated) and after (treated) treatment in all four recirculating vertical flow constructed wetlands. The results are average of triplicates ± standard deviation.
Figure 2.
Relative abundance of 16S, sul1, qnrS, intI1, and blaCTXM32 before (untreated) and after (treated) treatment in all four recirculating vertical flow constructed wetlands. The results are average of triplicates ± standard deviation.

Figure 3.
Next-generation Illumina Miseq amplification phylum results for raw and treated greywater. The abundances presented are of duplicates samples sequenced independently from the same system. Phyla with less than 100 OTU were omitted. System 1–4” refers to “CW1–4”.
Figure 3.
Next-generation Illumina Miseq amplification phylum results for raw and treated greywater. The abundances presented are of duplicates samples sequenced independently from the same system. Phyla with less than 100 OTU were omitted. System 1–4” refers to “CW1–4”.

Figure 4.
PCoA 2-D plot using bray distance and the explained variances are shown in brackets. R indicates raw greywater and T indicates treated greywater. ID 1,2,3,4 corresponds to CW1, CW2, CW3, CW4, respectively. (A) Community analysis of raw and treated samples. (B) Community analysis by household.

Figure 5.
Heat map presenting changes (abundances) of the different classes of bacteria across systems and water type (raw or treated). ID 1,2,3,4 corresponds to CW1, CW2, CW3, CW4, respectively, and R represent raw greywater and T represents treated greywater.
Figure 5.
Heat map presenting changes (abundances) of the different classes of bacteria across systems and water type (raw or treated). ID 1,2,3,4 corresponds to CW1, CW2, CW3, CW4, respectively, and R represent raw greywater and T represents treated greywater.

Table 2.
Water quality parameters for raw and treated greywater in the CWs with the corresponding percent reduction.
Table 2.
Water quality parameters for raw and treated greywater in the CWs with the corresponding percent reduction.
| Parameter | Average and Standard Deviation of Raw Greywater and Treated Greywater | Percent Reduction | |
|---|---|---|---|
| Raw Greywater | Treated Greywater | ||
| BOD5 (mg/L) | 89.3 ± 102.8 | 3.9 ± 3.0 | 95.7 |
| pH | 7.31 ± 0.41 | 7.54 ± 0.29 | N/A |
| TSS (mg/L) | 150.7 ± 194.1 | 10.8 ± 16.7 | 92.9 |
| Conductivity (µS/cm) | 776.5 ± 286.5 | 742.9 ± 205.5 | 4.3 |
| Turbidity (NTU) | 228.6 ± 205.1 | 14.1 ± 16.4 | 93.8 |
| TOC (mg/L) | 31.9 ± 30.8 | 5.76 ± 3.25 | 81.9 |
| TN (mg/L) | 9.46 ± 5.31 | 5.76 ± 3.25 | 35.6 |
| E. coli | 1.15 × 10⁷ | 2.61 × 10⁵ | 97.7 |
Table 3.
Pearson’s correlation analysis of raw and treated water quality parameters and ARG in the CWs.
Table 3.
Pearson’s correlation analysis of raw and treated water quality parameters and ARG in the CWs.
| TOC | TN | BOD | TSS | 16S | blaCTXM32 | IntI1 | Sul1 | qnrS | |
|---|---|---|---|---|---|---|---|---|---|
| TOC | 1.000 | ||||||||
| TN | 0.263 | 1.000 | |||||||
| BOD | 0.190 | 0.116 | 1.000 | ||||||
| TSS | 0.780 | 0.338 | 0.334 | 1.000 | |||||
| 16S | 0.891 | 0.196 | 0.238 | 0.349 | 1.000 | ||||
| blaCTXM32 | −0.028 | 0.211 | 0.335 | 0.780 | 0.091 | 1.000 | |||
| IntI1 | 0.924 | 0.171 | 0.322 | 0.687 | 0.849 | 0.498 | 1.000 | ||
| sul1 | 0.929 | 0.189 | 0.223 | 0.502 | 0.951 | 0.219 | 0.951 | 1.000 | |
| qnrS | 0.904 | 0.183 | 0.102 | 0.247 | 0.901 | −0.105 | 0.799 | 0.935 | 1.000 |
Table 4.
16S rRNA bacterial identification sequencing results from ESBL isolates for all raw greywater treatment systems with corresponding ascension numbers. The ID is based on the system (CW1–CW4) and the isolate running number.
Table 4.
16S rRNA bacterial identification sequencing results from ESBL isolates for all raw greywater treatment systems with corresponding ascension numbers. The ID is based on the system (CW1–CW4) and the isolate running number.
| Isolate ID | Isolate Identification | Ascension Number |
|---|---|---|
| CW1_1 | Aeromonas sp. | MT322960.1 |
| CW1_2 | Aeromonas caviae | MK301540.1 |
| CW1_3 | Pseudomonas sp. | MT512028.1 |
| CW1_4 | Pseudomonas sp. | EF442068.1 |
| CW1_5 | Aeromonas sp. | MF148425.1 |
| CW1_6 | Pseudomonas nitroreducens | MT472129.1 |
| CW1_7 | Acinetobacter nosocomialis | MT540255.1 |
| CW1_8 | Pseudomonas sp. | MF372961.1 |
| CW2_1 | Pseudomonas fulva | MT634251.1 |
| CW2_2 | Pseudomonas putida | MT641244.1 |
| CW2_3 | Citrobacter sp. | MH341951.1 |
| CW2_4 | Pseudomonas guariconensis | MT436398.1 |
| CW2_5 | Pseudomonas sp. | MT376777.1 |
| CW2_6 | Pseudomonas sp. G | MT256213.1 |
| CW2_7 | Pseudomonas sp. | MT507070.1 |
| CW2_8 | Pseudomonas guariconensis | MT436398.1 |
| CW2_9 | Elizabethkingia sp. | MN540122.1 |
| CW3_1 | Pseudomonas sp. | LC549486.1 |
| CW3_2 | Pseudomonas nitroreducens | MT472129.1 |
| CW3_3 | Pseudomonas viridiflava | MT386110.1 |
| CW3_4 | Aeromonas caviae | MN582971.1 |
| CW3_5 | Aeromonas caviae | MN582971.1 |
| CW3_6 | Pseudomonas sp. | GQ456130.1 |
| CW3_7 | Aeromonas hydrophila | MT605959.1 |
| CW3_8 | Roseomonas cervicalis | MF372961.1 |
| CW4_1 | Pseudomonas putida | MT641244.1 |
| CW4_2 | Pseudomonas putida | CP045551.1 |
| CW4_3 | Stenotrophomonas sp. | MT649753.1 |
| CW4_4 | Pseudomonas sp. | CP045553.1 |
| CW4_5 | Pseudomonas monteilii | MW245841.1 |
| CW4_6 | Aeromonas sp. | MK834723.1 |
Publisher’s Note: MDPI stays neutral with regard to jurisdictional claims in published maps and institutional affiliations. |
© 2022 by the authors. Licensee MDPI, Basel, Switzerland. This article is an open access article distributed under the terms and conditions of the Creative Commons Attribution (CC BY) license (https://creativecommons.org/licenses/by/4.0/).
Share and Cite
MDPI and ACS Style
Henderson, M.; Ergas, S.J.; Ghebremichael, K.; Gross, A.; Ronen, Z. Occurrence of Antibiotic-Resistant Genes and Bacteria in Household Greywater Treated in Constructed Wetlands. Water 2022, 14, 758. https://doi.org/10.3390/w14050758
AMA Style
Henderson M, Ergas SJ, Ghebremichael K, Gross A, Ronen Z. Occurrence of Antibiotic-Resistant Genes and Bacteria in Household Greywater Treated in Constructed Wetlands. Water. 2022; 14(5):758. https://doi.org/10.3390/w14050758
Chicago/Turabian StyleHenderson, Michelle, Sarina J. Ergas, Kebreab Ghebremichael, Amit Gross, and Zeev Ronen. 2022. "Occurrence of Antibiotic-Resistant Genes and Bacteria in Household Greywater Treated in Constructed Wetlands" Water 14, no. 5: 758. https://doi.org/10.3390/w14050758
Note that from the first issue of 2016, this journal uses article numbers instead of page numbers. See further details here.