
A New Evolutionary Hybrid Random Forest Model for SPEI Forecasting
by
 , , and
Ali Danandeh Mehr
1,2,* ,
,
Ali Torabi Haghighi
1,
Masood Jabarnejad
3,
Mir Jafar Sadegh Safari
4 and
and
Vahid Nourani
5,6 1
Water Energy and Environmental Engineering Research Unit, University of Oulu, 90570 Oulu, Finland
2
Civil Engineering Department, Antalya Bilim University, Antalya 07070, Turkey
3
Industrial Engineering Department, Dogus University, Istanbul 34775, Turkey
4
Department of Civil Engineering, Yasar University, Izmir 35100, Turkey
5
Center of Excellence in Hydroinformatics, Faculty of Civil Engineering, University of Tabriz, Tabriz 51666, Iran
6
Faculty of Civil and Environmental Engineering, Near East University, Nicosia 99010, North Cyprus
*
Author to whom correspondence should be addressed.
Water 2022, 14(5), 755; https://doi.org/10.3390/w14050755
Submission received: 27 January 2022
/
Revised: 20 February 2022
/
Accepted: 24 February 2022
/
Published: 27 February 2022
(This article belongs to the Special Issue Application of Data Pre-post Processing Methods for Modeling Hydro-Climatologic Processes)
Abstract
:State-of-the-art random forest (RF) models have been documented as versatile tools to solve regression and classification problems in hydrology. They can model stochastic time series by bagging different decision trees. This article introduces a new hybrid RF model that increases the forecasting accuracy of RF-based models. The new model, called GARF, is attained by integrating genetic algorithm (GA) and hybrid random forest (RF), in which different decision trees are bagged. We applied GARF to model and forecast a multitemporal drought index (SPEI-3 and SPEI-6) at two meteorology stations (Beypazari and Nallihan) in Ankara, Turkey. We compared the associated results with classic RF, standalone extreme learning machine (ELM), and a hybrid ELM model optimized by Bat algorithm (Bat-ELM) to verify the new model accuracy. The performance assessment was performed using graphical and statistical analysis. The forecasting results demonstrated that the GARF outperformed the benchmark models. GARF achieved the least error in a quantitative assessment for the prediction of both SPEI-3 and SPEI-6, particularly in the testing period. The results of this study showed that the new model can improve the forecasting accuracy of the classic RF technique up to 30% and 40% at Beypazari and Nallihan stations, respectively.
1. Introduction
Drought is an extreme weather event characterized by a long duration of precipitation deficit and elevated evapotranspiration. Compared with aridity, which is a permanent feature of a region, drought refers to the moisture balance that occurs on a month-to-month (or more frequent) basis. A global drought hazard map that assessed precipitation deficit or surplus for the 21-year period from 1980 to 2000 has shown that about 38% of the world suffered from some level of drought exposure. However, most of the countries lack the infrastructure capacity to cope with drought disasters [1]. In developing countries where rainfed agriculture is the main source of livelihood for most of the population and the backbone of its economy, recurrent drought is a primary challenge in their economy [2]. Similar to other Mediterranean countries, drought has become a recurrent phenomenon in Turkey in the last few decades [2,3], and the probabilities of being extremely dry indicate maximum values on the coast of the Mediterranean Sea and over the border zone between Turkey and Syria with the highest probability [4,5].
A reliable drought prediction model is fundamental to sustainable watershed development, establishing a drought early warning system, and providing information for policymakers, authorities, and other stakeholders to respond to the pressing issues caused by this environmental hazard. Extensive disagreement exists about the concept of drought, and it is difficult to give a single definition [6]. Regarding the extent of the precipitation period, drought is classified into four categories—namely, meteorological, agricultural, hydrological, and socioeconomic classes. More recent studies consider another class called ecological drought when a natural ecosystem is affected by the drought [7]. Each category needs some detecting variables—namely, evapotranspiration and precipitation for meteorological drought, evaporation stress and soil water content for agricultural drought, runoff scarcity and groundwater supplies fraction for hydrologic drought, and information on inflow-demand reliability and water storage resilience for socioeconomic drought [8,9,10]. Meteorological variables such as air temperature and precipitation are frequently used for meteorological drought monitoring and forecasting [11]. The widely used meteorological drought indices include Standardized Precipitation Evapotranspiration Index (SPEI) [12], Drought Area Index (DAI) [13], Standardized Precipitation Index (SPI) [14], Rainfall Anomaly Index (RAI), Precipitation Concentration Index (PCI), and Palmer Drought Severity Index (PDSI) [11]. To calculate SPI and DAI, long-term precipitation observations are merely required. However, the historical temperature is also necessary to compute PDSI and SPEI series.
Thus far, many research papers have focused on the use of machine learning (ML) techniques to model and predict drought indices [15,16,17,18,19,20,21,22]. For example, artificial neural networks (ANNs) were used to forecast both SPI and Effective Drought Index with lead times of 1 to 12 months for Tehran Province, Iran [23]. In another study [15], the authors applied an adaptive neuro-fuzzy inference system (ANFIS) and feed-forward ANNs for SPI prediction at different time scales. The ANN technique was also used by [24] for Nonlinear Aggregated Drought Index forecasting. The SPI series at a single meteorology station was forecasted using ANN, ANFIS, and support vector machine (SVM) by [25]. The authors demonstrated that the SVM provides a more accurate forecast than ANFIS and ANN. In [17], the authors showed the ability of M5-Tree, multivariate adaptive regression splines (MARSs), and least-square SVM models for SPI prediction in Australia. A combined model comprising decision trees and association rules was suggested by [20] to predict local SPI based on various sea surface temperatures. An extreme learning machine (ELM) model was applied by [26] for SPEI forecasting in Ankara, Turkey. They showed that ELM forecasts are more accurate than ANN. The authors of [27] recommended the use of state-of-the-art random forest (RF) and satellite data to predict severe drought in Korea. A recent study used the ELM technique with RF, and support vector regression (SVR) approaches for SPEI prediction in the Colorado, Danube, Orange, and Pearl River basins [28]. In line with [20], the study proved that sea surface temperature could be used as a meteorological drought predictor.
Due to the trapping at local optimum issues by traditional ML models, researchers have been exploring ways to improve the ability of traditional ML models by using some new robust hybrid soft computing techniques [26]. For example, a Dragonfly optimization algorithm coupled with SVM was suggested for agriculture drought modeling in Iran [29]. The new hybrid model’s performance was compared with those of standalone SVM, autoregressive moving average, and ANN models. The results showed the optimization algorithm could improve the ability of ML models for drought forecasting. Reconnaissance Drought Index was modeled and forecasted via two nature-inspired optimization algorithms coupled with SVR in Iran. The results proved the employed optimization algorithms’ ability to enhance the performance of SVR in drought forecasting [30]. Wavelet-based models such as wavelet-ANN, wavelet-ANFIS, or Wavelet-GP are other kinds of hybrid ML models suggested for meteorological drought forecasting [16,31]. Recently, the authors of [32] showed that a hybrid fuzzy-random forest method could satisfactorily be used for drought classification and prediction in ungauged catchments. Our review indicated that SPEI forecasting using hybrid RF models is rarely explored. Therefore, the main goal of this study is to introduce a new hybrid RF method, called GARF, in which the capabilities of the genetic algorithm (GA) and RF are combined to increase the forecasting accuracy of RF. To this end, a database comprising 46 years of SPEI series at 2 synoptic stations in Turkey was used. We compared the efficiency of GARF with those of ELM, and state-of-the-art, hybrid Bat-ELM models available in the relevant literature [26].
2. Materials and Methods
SPEI is a multivariate meteorological drought index, which is suggested as a suitable index for drought monitoring and forecasting under changing climates [12,33]. To calculate SPEI, climatic water balance, also known as water deficit, is first calculated by subtracting potential evapotranspiration from precipitation in each month, and then, a probability distribution is fitted to the monthly deficit. Any month having negative SPEI values is considered a dry month. When a log-logistic function is selected as the desired distribution model, SPEI values in the range [−1.1 to −1.42], [−1.43 to −1.23], and less than −1.83, respectively, represent the moderate, severe, and extreme drought events [31]. For details of SPEI calculation, the reader is referred to [12].
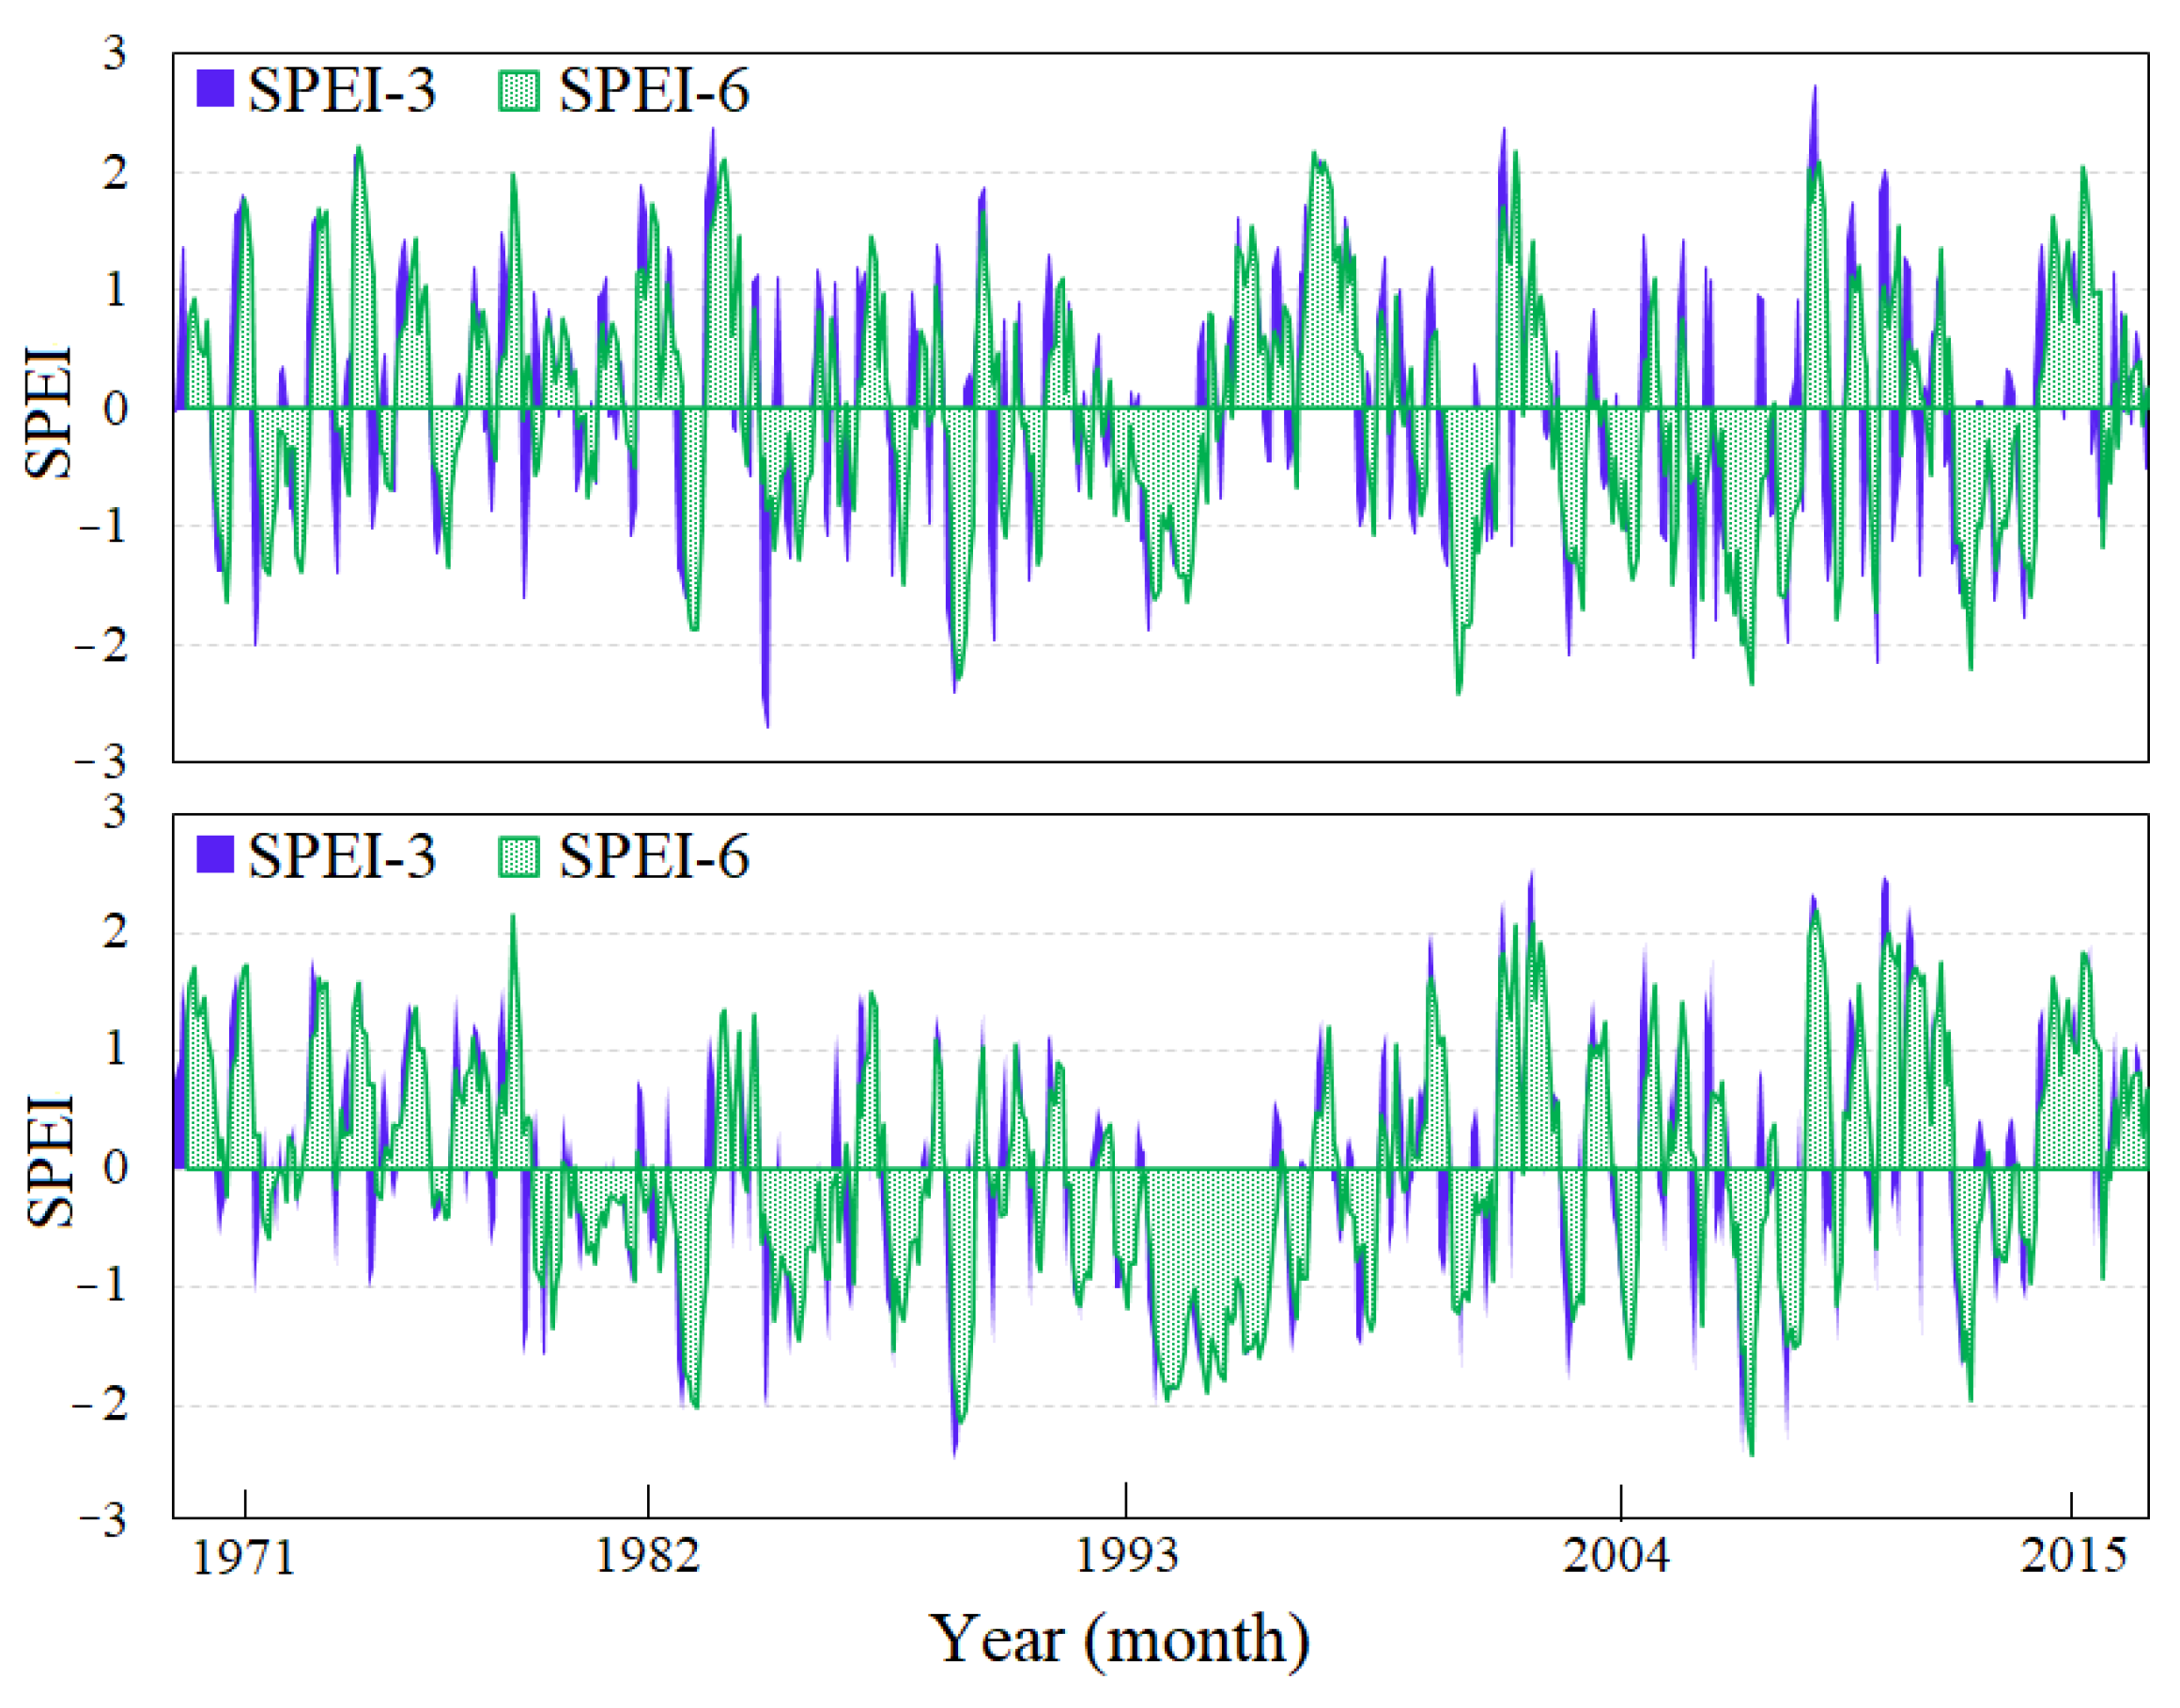
In this study, we used the SPEI time series at two accumulation times of three months (SPEI-3) and six months (SPEI-6) (Figure 1) calculated for two meteorological stations, Beypazari and Nallihan, in Ankara, Turkey. To calculate SPEI-3 and SPEI-6, mean monthly temperature and total monthly precipitation records at Beypazari and Nallihan stations, both located in Ankara, for the period of 1972 to 2016, were used. The relevant calculations were carried out using the SPEI package available in R. In this package, the Thornthwaite equation was used to estimate PET as suggested in the original SPEI methodology [12]. However, it is important to note that different PET estimation methods could result in different SPEI values. Details on the temperature and precipitation datasets are available in [10,26]. The SPEI-3 and SPEI-6 were aimed to forecast over the lead time of one month in this study. As already mentioned, the data were used to train RF and GARF models. We compared the new models’ performance with a classic ELM and a hybrid Bat-ELM as counterparts. Therefore, an overview of RF, ELM, and Bat-ELM, followed by the fundamentals of the proposed hybrid GARF model, is presented in the following subsections.
2.1. The Baseline Standalone Models: RF and ELM
RF is a classification and regression method that uses an ensemble of decision trees (DT) that have been trained individually, with the conclusion calculated by taking into consideration the findings acquired by each decision tree [34]. Each tree is built using a special kind of bagging method. Without the need for any pruning, RF models can generalize and reduce the risk of overfitting the DT. The essential element of the forest is the difference in the trees used therein. The RF, instead of considering one tree, evaluates all of them together and averages the different probabilities. Thus, based on the idea that a combination of predictions is more accurate than using only one prediction, it seems to give better results than DT.
Despite several successful applications of feed-forward, backpropagation-based ANNs, they have some drawbacks dealing with their learning speed. They are criticized for the long time required for parameter tuning [35]. In some cases of complex target series, either an external optimization or a data processing technique might be used to find the best network structure or improve ANN forecasts [36]. To address such drawbacks, a new learning technique, called ELM, was suggested by [35]. The ELM is a single hidden layer ANN model with a higher speed and more generalization capabilities than feed-forward ANN. The fast-learning process in ELM is because the mapping parameters between its input and hidden layers (hidden nodes) are set randomly at the outset of the training. In other words, the hidden nodes are never updated or can be inherited from their ancestors without being changed. According to [35], ELMs are faster than ANNs. Recent studies have also proved the higher accuracy of ELMs to ANNs (e.g., [26]). Therefore, ELM was considered the baseline prediction model in the current study. In [26], the most straightforward ELM training algorithm (single hidden layer sigmoid neural networks) was trained to formulate the SPEI process as follows:
where W1 and W2 are the weight matrices of input-to-hidden-layer and hidden-to-output-layer, respectively. σ denotes a sigmoidal activation function.
Y = W2 σ(W1·x)
2.2. The Benchmark Hybrid Model: Bat-ELM
A Bat-inspired ELM, Bat-ELM, was also developed in [26] to optimize the matrix of W2 and, therefore, improve the ELM accuracy for SPEI prediction in our case study area. The Bat algorithm [37] exploits the echolocation of bats. Different kinds of bat algorithms are available in the literature that result from different behaviors of biological, physical, and ecological systems of bats, e.g., [38,39]. The main parameters in any bat algorithm are the position, velocity, and frequency of each bat . The classic bat algorithm includes six stages as follows:
- Initialize the algorithm parameters, with as the size of bats (typically 10 to 25). Here, we selected 20 bats, with a frequency range of ,).where is selected randomly and ranges from 0 to D, for which D is the number of hidden neurons multiplied by plus one number of input neurons.
- Iteratively update of the bats and discretize as follows:where is the best result of comparison between all possible solutions between n bats.
- Generate a new candidate position as follows:where (−1, +1) is a random number, and is the mean loudness of the population. The initial loudness is selected as 1.6.
- Update the loudness and pulse emission values as the bats find prey ().where and χ are constants.
- Run the model from steps 2 to 4 until the necessary number of iterations is reached.
- End the training and output the optimized bats and fitness. Otherwise, return to step 3 to continue the optimization of parameters.
2.3. The Proposed Hybrid GARF Model for Drought Forecasting
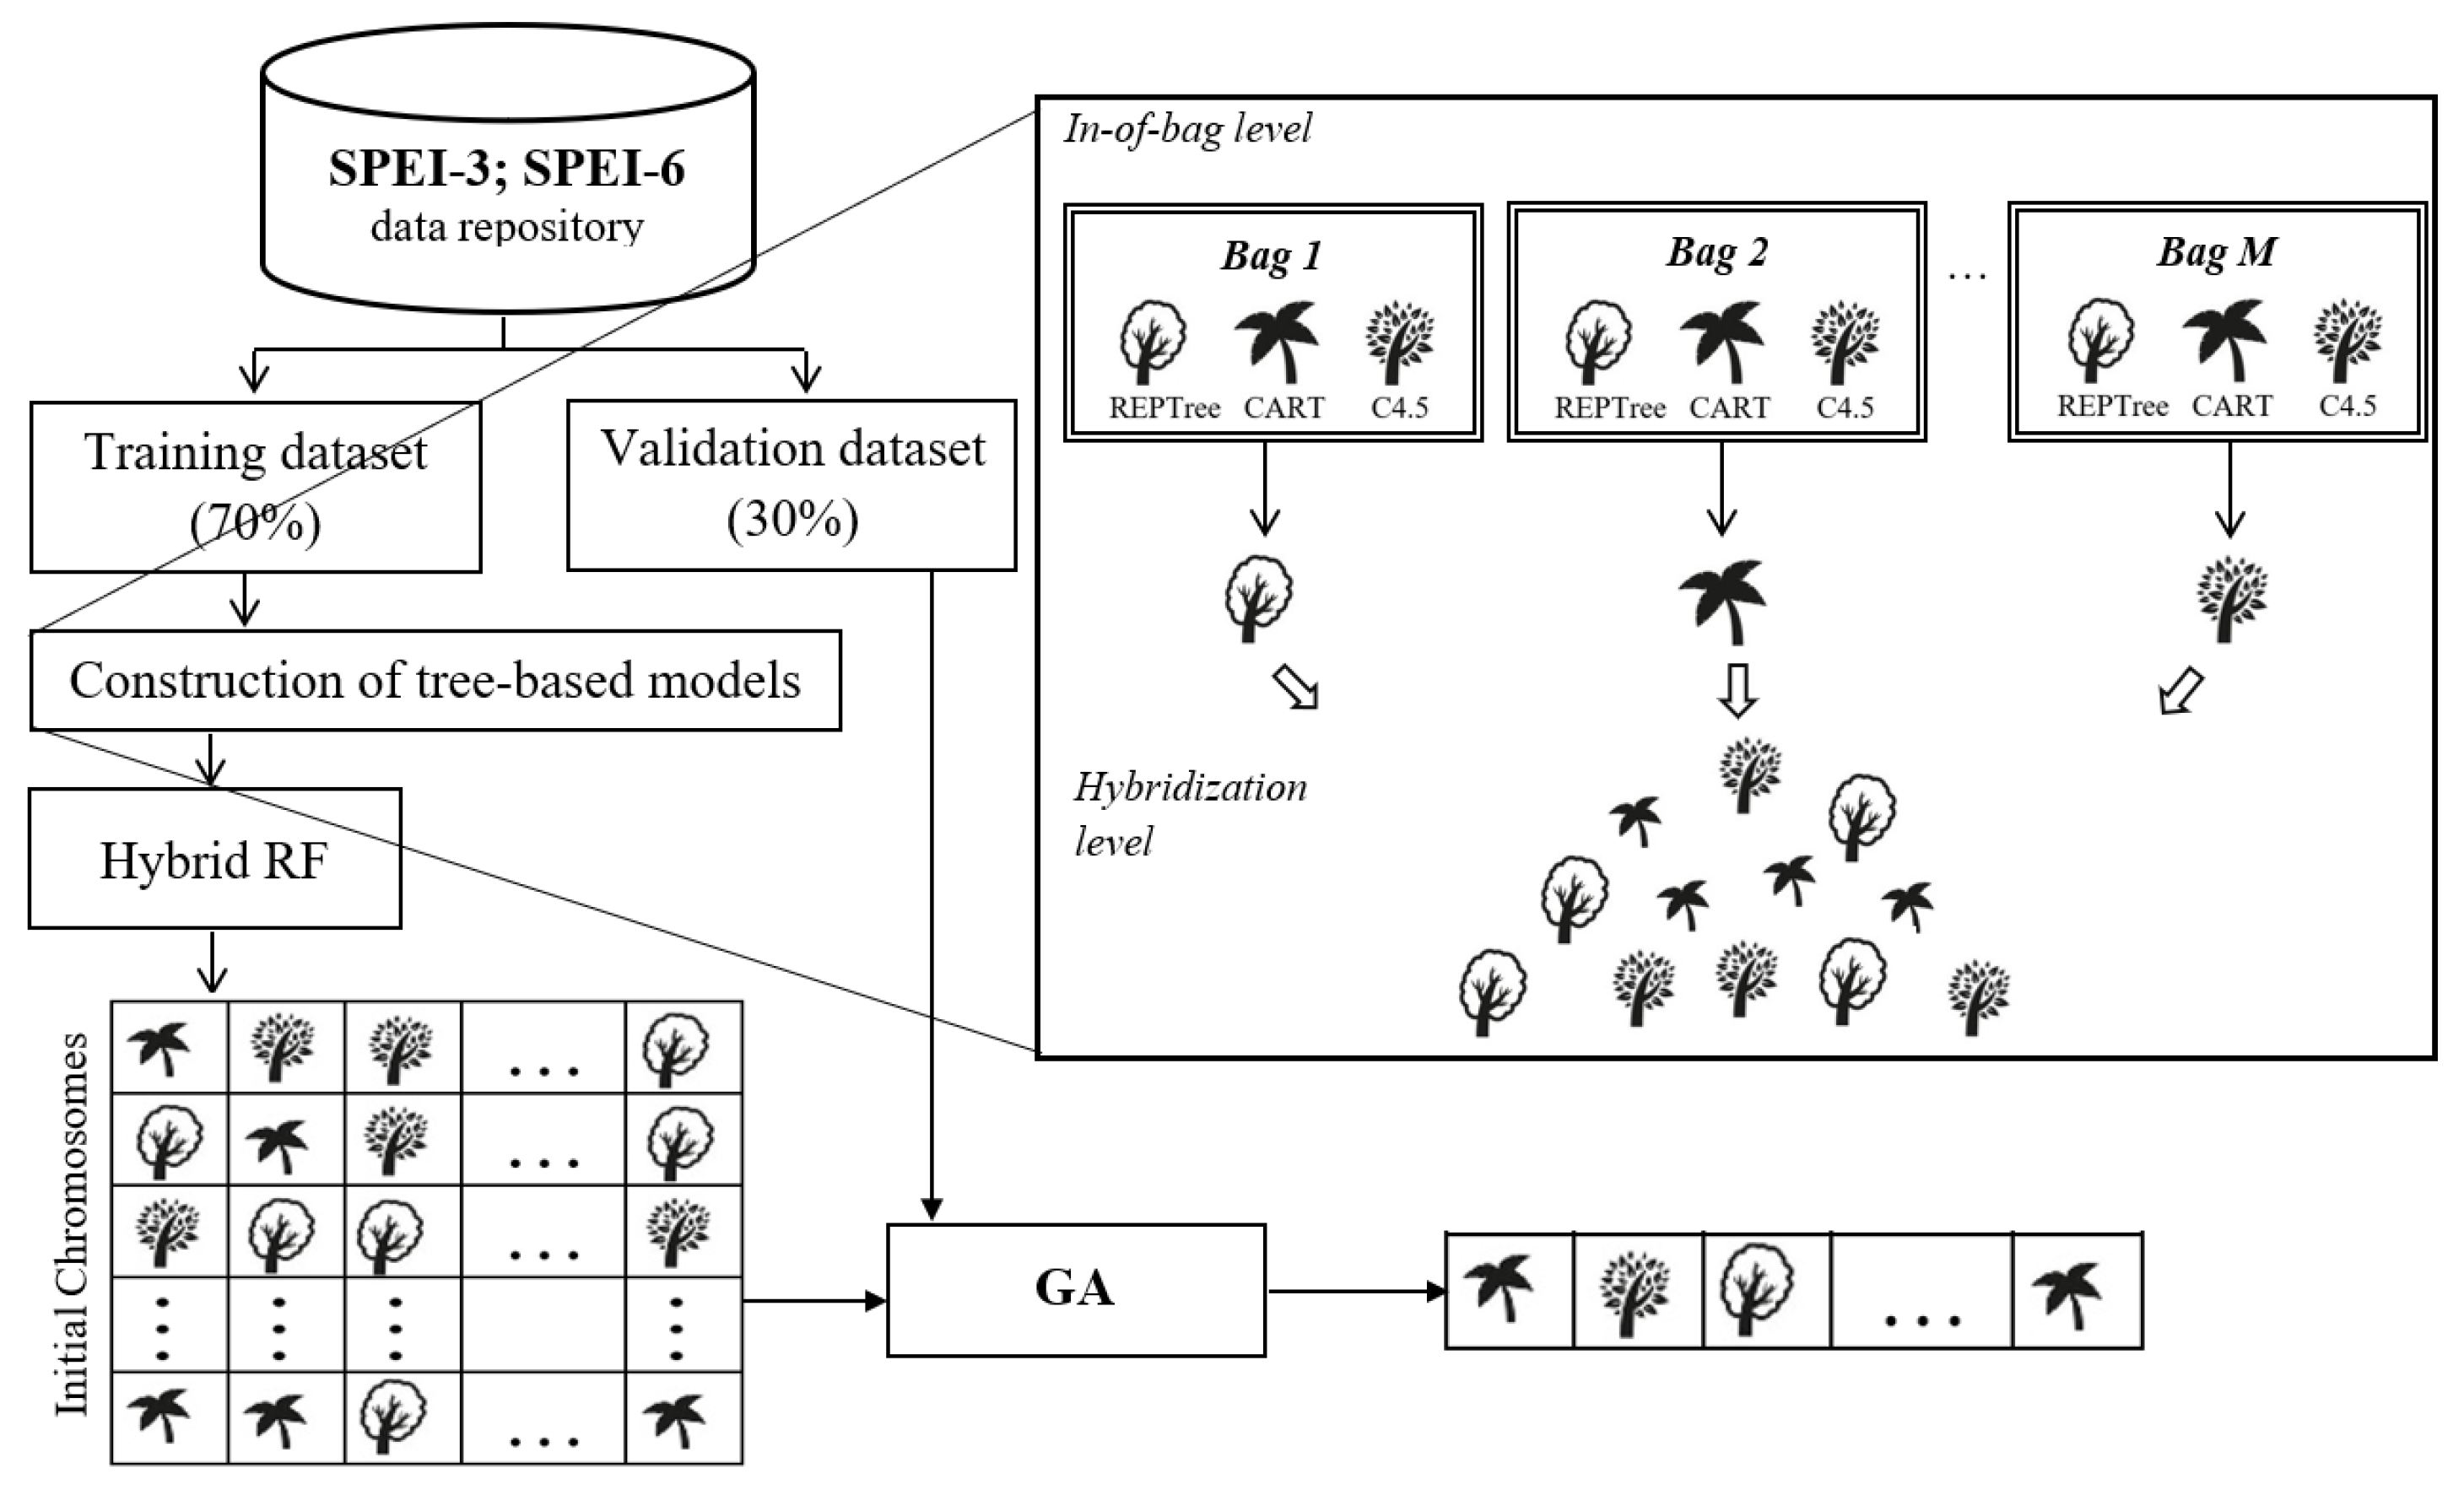
Despite the high performance of RF to solve classification problems, it has difficulties modeling highly nonlinear hydrological processes [32]. In addition, many trees can make the algorithm too slow and ineffective for real-time predictions. To tackle these drawbacks, a hybrid RF model improved by GA, called GARF, was suggested in this study. Inspired by the study of [40], GARF uses a hybrid RF in which three different types of DT, including C4.5, classification, and regression tree (CART), and REPTree are used for random tree generation (Figure 2). These DT types use specific feature splitting criteria—namely, normalized information gain, attributed value test, and plain information gain. The out-of-bag technique is used to minimize the regression error at each bootstrap. The best tree at each bag is selected to be combined as the forest member. The solution is a hybrid RF that is considered a pool of effective trees (inputs) to be optimized by GA. To this end, the initial population of genes (trees) is randomly selected to create random chromosomes (forest). Thus, a chromosome may encompass repeated genes. GA operations (mutation, one-point crossover, and reproduction) are then implemented using initial chromosomes, and then the chromosome with utmost fitness at the validation dataset is considered the best forest. It is worth mentioning that RFs and GA are trained and validated with different inputs and target series but have identical fitness functions (i.e., root mean square error (RMSE)). While RFs are trained and tested using historical SPEI series (the first 70% of observations), GA is trained by hybrid RF chromosomes and validated by the last 30% of the SPEI series. As a result, GARF ascertains optimal solutions and guarantees a generalization capability model. If several chromosomes exhibit identical performance, the one with a lower number of genes deserves to be selected for the parsimony concept.
2.4. Performance Evaluation
To assess the models’ efficiency and compare their accuracy, RMSE and Nash–Sutcliffe goodness of fit measure (NSE) and Taylor diagram were used in this study.
where n denotes the number of months (samples) used for exists in the training or testing periods. , , and denote the observed, predicted, and mean values of observed SPEI.
3. Results
Mutual information (MI) criterion as the input selection criterion for the same SPEI series was used by [26]. The study showed that the following scenarios could be structured via nonlinear ML models for one-step-ahead SPEI-3 and SPEI-6 forecasting in our study area.
Considering the abovementioned scenarios, the RF and GARF structures were calibrated for minimizing the RMSE between the outputs from the model and the targets SPEI at each station. To evaluate the models’ effectiveness for SPEI forecasting at each station, their RMSE and NSE values are tabulated in Table 1 for both the training (the first 70%) and testing (the last 30%) periods. The statistical performance revealed the advantage of GARF over its counterparts. For example, the least RMSE and highest NSE in the training period at Beypazari and Nallihan stations for SPEI-3 forecasting were achieved by GARF (0.59 and 0.62; 0.55 and 0.66). Considering the testing period at both stations, the GARF method showed the lowest RMSE and greatest NSE (0.74 and 0.50, and 0.67 and 0.61). Despite a slightly higher accuracy of Bat-ELM over GARF during the training period, the results indicate that the former has better performance for unseen datasets. This reflects more generalization ability of GARF, compared with Bat-ELM. The authors believe that such advantage of GARF originates from the diversity of trees and potential mutational exchange in the GA component that made it more suitable in predicting unseen datasets. The table also indicates that the standalone RF has the lowest accuracy in general. Therefore, it can be concluded that the GARF provides appropriate forecasts at both stations. All models exhibited higher predictive accuracy for SPEI-6 prediction in comparison with SPEI-3. The reason behind this might be attributable to the higher accumulation months in SPEI-6 calculation that yields in smoother time series with lower standard deviation.
It is important to remind the predictive accuracy improvement between the proposed GARF and the benchmark RF models. With respect to the achieved RMSE for SPEI-3 forecasting, the GARF provided an enhancement of prediction accuracy by 11% (18%) at Beypazari (Nallihan) station in the testing period. Likewise, regarding the NSE index, the GARF showed an augmentation of accuracy by 30% (41%). Overall, the new model exhibited a strong predictive model capable of capturing the fluctuating feature of both SPEI-3 and SPEI-6 series merely using their predecessor values. Thus, it is valuable for meteorological drought prediction and agricultural drought management. The suggestion of such a predictive model can markedly promote the forecasting accuracy of hydro-climatological RF-based models.
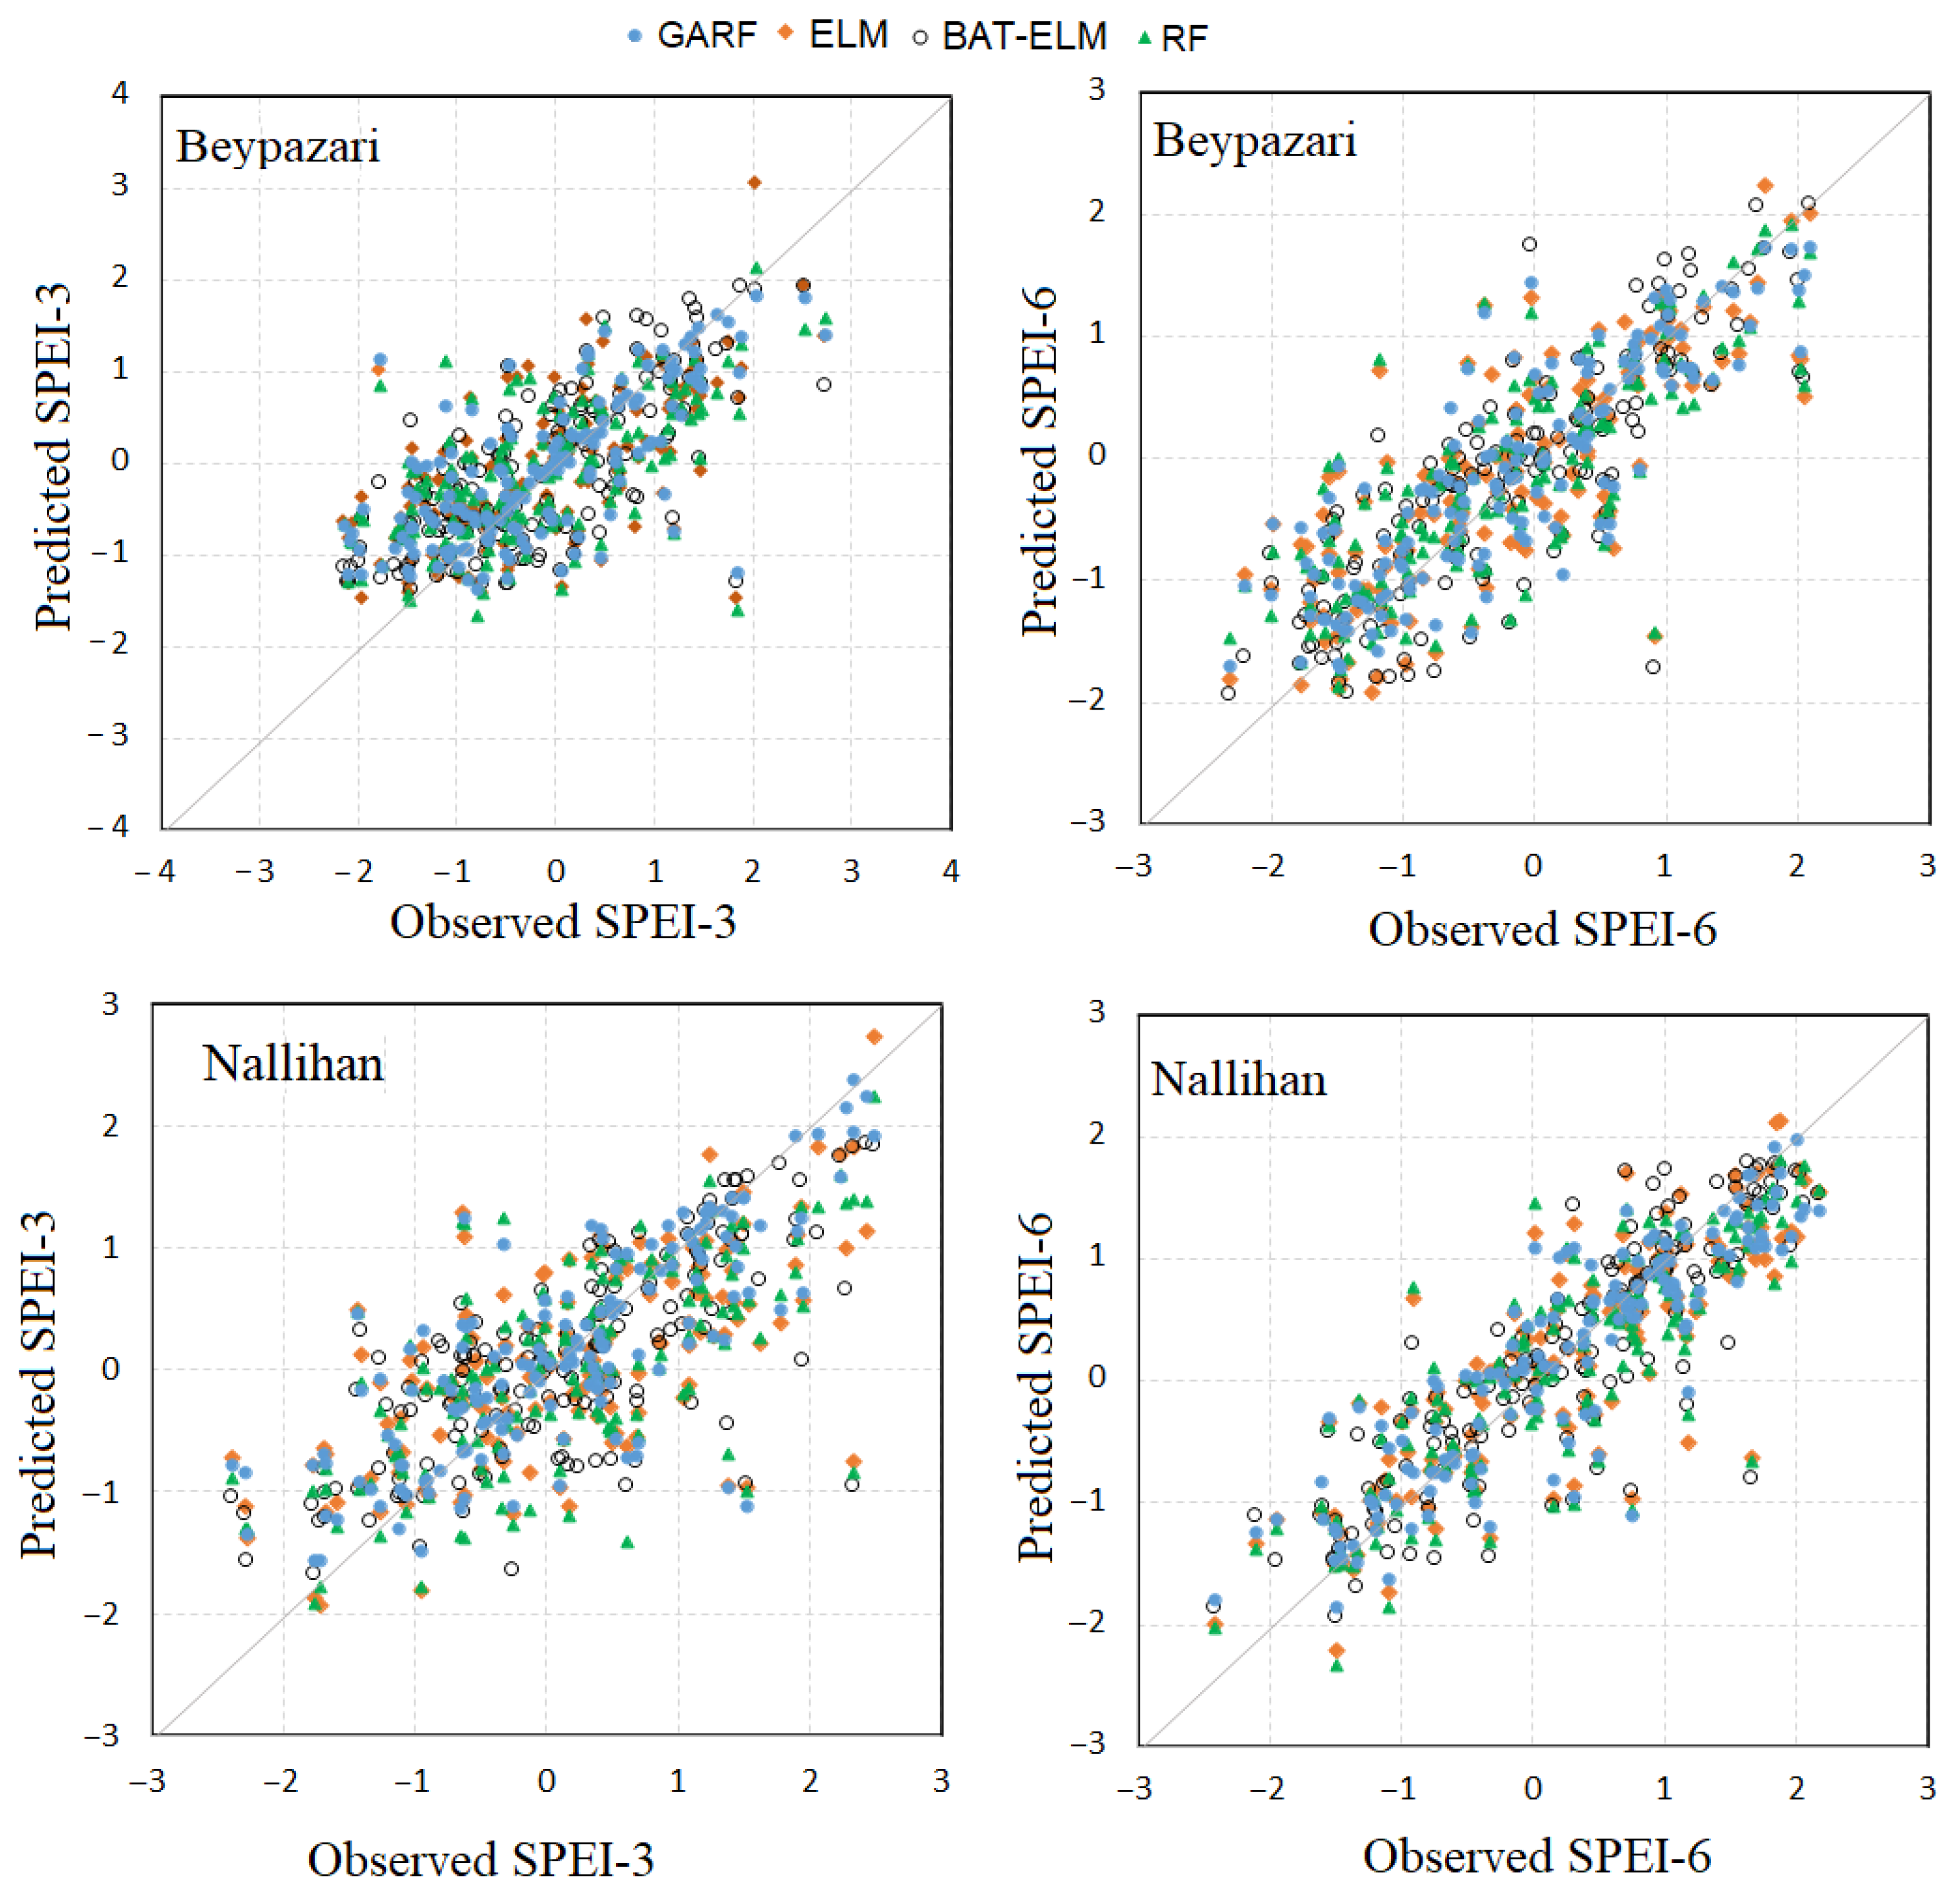
Figure 3 illustrates the scatter plots of the forecasted SPEI-3 and SPEI-6 at both meteorological stations and compares them with ELM and Bat-ELM forecasts over the testing period. For both stations, the GARF model revealed the closest distribution to the 1:1 line and, therefore, is superior to the other models. This is the best explanation due to the incorporation of the hybridization using different tree algorithms and chromosome optimization via GA used in GARF. On the other hand, the model’s performance of SPEI-6 forecasting demonstrated the highest determination coefficient for the GARF model (R2 = 0.84 and 0.89) at Beypazari and Nallihan stations, respectively. The determination coefficient values can elucidate that the GARF performance could be considered acceptable in terms of hydrological concepts. Considering the density of the results at each scatter plot, we concluded that all of the models underestimated peaks and toughs, albeit GARF followed by Bat-ELM can better capture these extreme events than RF and ELM.
Overall, Figure 3 shows the GARF model as a promising model for SPEI forecasting with a one-month lead time. Despite superior results over the standalone models, the attained accuracy was not perfect in the case of SPEI-3 forecasting. This might be because of the high-level stochasticity of the observed SPEI-3 series. More efficient inputs or a powerful preprocessing tool might be able to increase the accuracy of SPEI-3 forecasting using GARF. This task could be investigated in future studies.
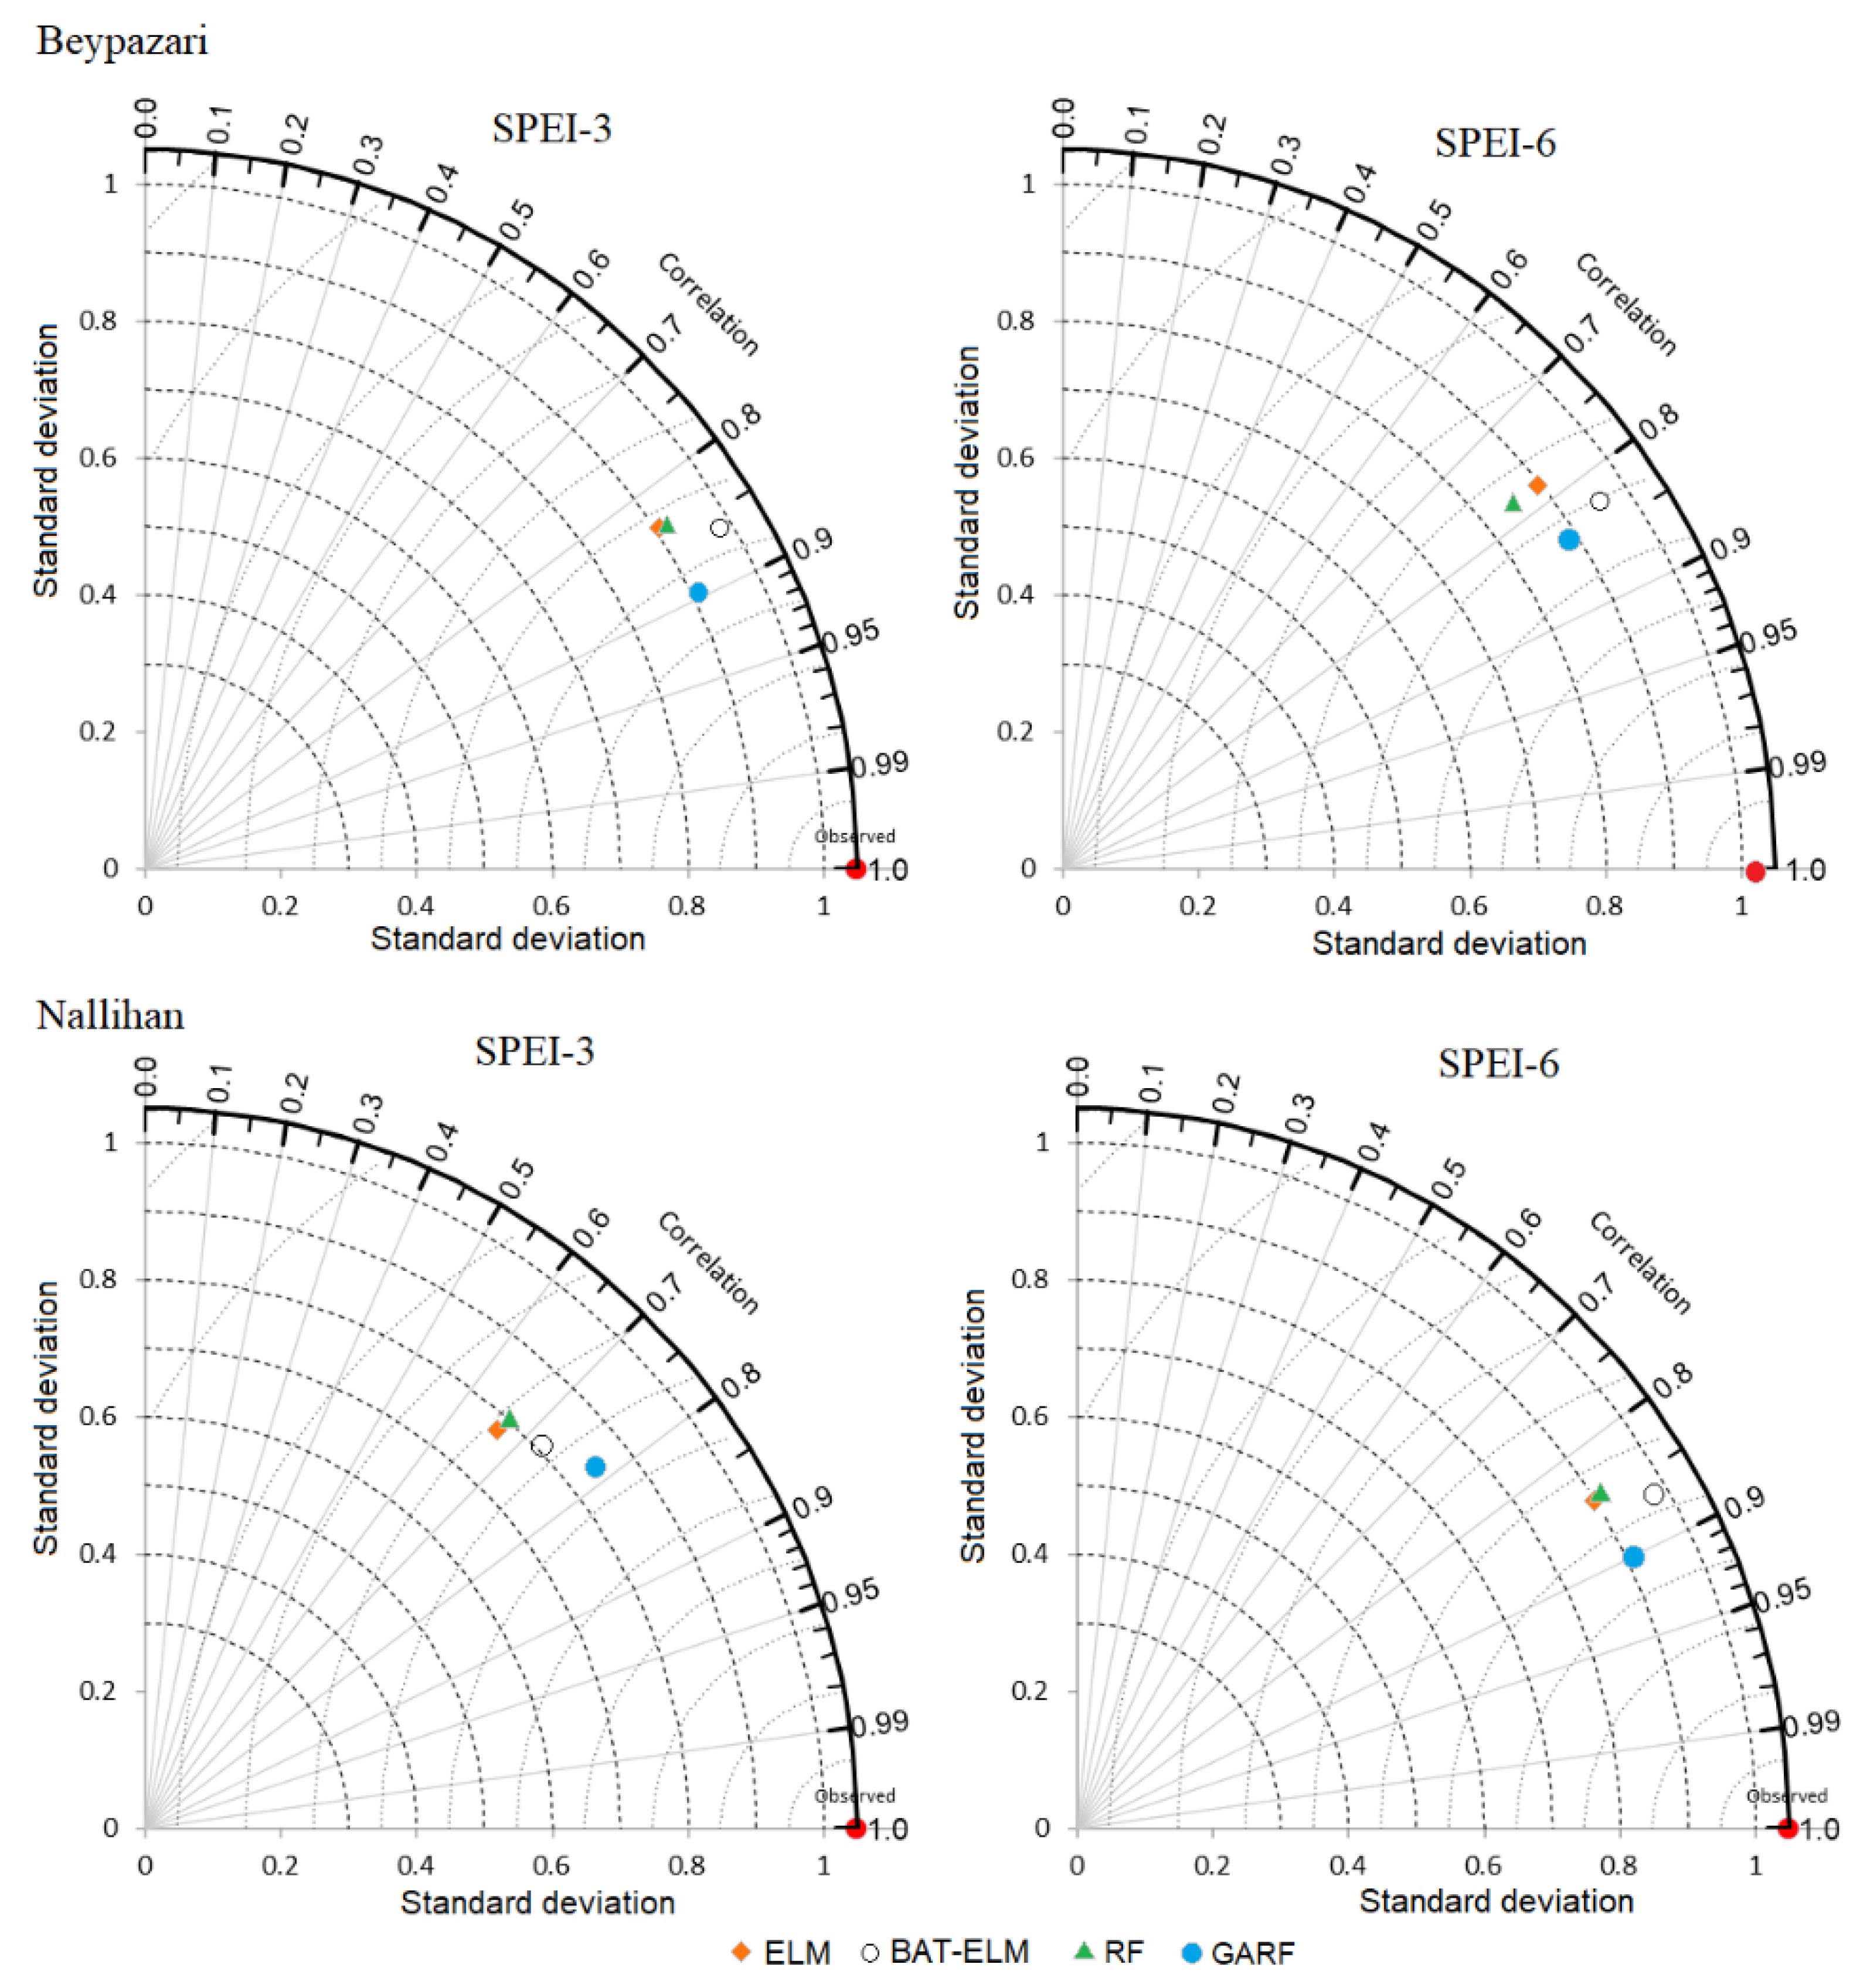
The results of drought prediction were also analyzed by the Taylor diagram in both stations (Figure 4). Generally, all models provided better ability in SPEI-6 prediction in the Nallihan station, as the models’ performance ranged between the correlation of 0.8 to 0.91. Although the weakest SPEI prediction is related to SPEI-3 in the Nallihan station, as shown in Figure 4, all predictor models are far from observed drought (red point) and are located between the correlation range of 0.65 to 0.79. In all cases, GARF (blue point), followed by Bat-ELM (black ring), is the closest model to the observations (red point) and, therefore, superior to the standalone ELM and RF. In addition, the results of ELM and RF models are closer to each other in almost all models, implying that they have the same accuracy in our case studies. Distance of the proposed GARF model from its counterparts proves its ability as a new hybrid model for enhancing the potential of classic RF models for meteorological drought prediction.
4. Discussion
The performance of the proposed model and three other ML-based models were assessed for the drought modeling and forecasting at two meteorology stations located in Ankara province, Turkey. The results (Table 1) revealed that hybrid algorithms, with reference to the hybrid GARF, could be more reliable for one-month ahead meteorological drought forecasting. In particular, for GARF, the Taylor plots of the SPEI series at both stations (Figure 4) exhibited that the GARF model (blue dots) located at the closest position to the observed SPEI (red dots). In contrast, the major divergences were attained between the ELM-based and observed series, which proves the ELM as the weakest algorithm in this study.
A further evaluation metric, i.e., NSE, was used to represent the predictive skill of the developed models via comparing the relative magnitude of the residual variance to the variance of the observed SPEI. The difficulties in achieving high NSE values, particularly at three months running average, have also been mentioned in the recent meteorological drought forecasting studies [5,16,18]. However, as shown in Table 1 for both stations, the hybrid GARF model led to a satisfactory predictive skill with NSE higher than 70%. It should be noted that previous studies highlighted that this is a satisfactory range for SPEI forecasting [10,41]. A comparison between the predictive accuracy of classic RF and genetic programming for SPEI forecasting at the same stations was also performed in the relevant literature [42]. For SPEI-3 forecasting, the authors reported the highest NSE values of RF equal to 0.36 and 0.41 during the testing period at Beypazari and Nallihan stations, respectively. Although genetic programming was found slightly superior to the classic RF, our modeling results indicated that the proposed GARF is superior to RF, Hybrid RF, and ELM, and also outperformed genetic programming, leading to a significant improvement in the forecasting accuracy. The main advantage of GARF over GP is the combination of both entropy and evolutionary theories in GARF that support the model to avoid getting trapped in local optima. However, it is still a forest having several trees, which makes it less interpretable than a single tree genetic programming model.
5. Conclusions
Short- and long-term forecasting of different types of droughts is vital for watershed management, agricultural development, and water resources planning. However, in the hydrology and geoscience community, drought forecasting is known as a difficult task due to the nonlinear feature of water cycle components and the inherent complexity of extreme climate triggers. Hybrid ML techniques with altering efficiency were suggested in the germane literature to tackle these problems. This article presented the concepts and implementation requirements of a new hybrid ML method, called GARF, developed for a one-month ahead forecast of drought index. The GARF was applied for SPEI-3 and SPEI-6 forecasting at two meteorology stations in Ankara. The predictive accuracy of the GARF was compared with those of conventional RF, ELM, and bat-ELM. The performance appraisal process was accomplished using two error metrics and a graphical presentation. The results indicated that the GARF generates more accurate predictions at both meteorology stations. Regarding the attained RMSE values, the proposed GARF model showed an 11–18% enhancement in prediction accuracy over the RF models at Beypazari and Nallihan stations. Similarly, considering NSE, the model proved an augmentation of accuracy up to 41% at the Nallihan station. Nevertheless, the forecasting accuracy was found to be limited in the cases of SPEI-3 modeling. The influence of data preprocessing techniques such as wavelet transform could be investigated to enhance predictive accuracy.
Regarding the evolution of RF-based models, identification of the optimum number of trees and bagging techniques are, respectively, important tasks for classic RF and hybrid RF modeling. The GA algorithm was successfully tuned by these parameters in our case studies. The current literature showed that GA can successfully be used for parameter tuning of other ML techniques, e.g., [43,44]. However, to the best of the authors’ knowledge, this study was the first in the use of GA for hybrid RF optimization in drought studies. Regarding the possible implementations for the GARF, it is underlined that the model could be employed for the prediction of other environmental events. Here, we focused on meteorological drought forecasting, and therefore, exploring agricultural and hydrological drought predictability using GARF is suggested for future studies. To increase prediction accuracy, one may attempt to use some other optimization techniques or apply a decomposition technique before RF training.
Author Contributions
Conceptualization, A.D.M. and M.J.; methodology, A.D.M., A.T.H. and M.J.S.S.; software, A.D.M. and M.J.; validation, A.D.M., A.T.H., M.J., V.N. and M.J.S.S.; formal analysis, A.D.M. and M.J.; investigation, A.D.M., A.T.H. and M.J.S.S.; resources, A.D.M., A.T.H., M.J., V.N. and M.J.S.S.; data curation, A.D.M., A.T.H., M.J., V.N. and M.J.S.S.; writing—original draft preparation, A.D.M., M.J. and M.J.S.S.; writing—review and editing, A.D.M., A.T.H., M.J., V.N. and M.J.S.S.; visualization, A.D.M., M.J. and M.J.S.S.; supervision, A.T.H. and V.N.; project administration, A.T.H.; funding acquisition, A.T.H. All authors have read and agreed to the published version of the manuscript.
Funding
This research was supported by the Maa-ja vesitekniikan tuki r.y. (MVTT) with project number 41878.
Institutional Review Board Statement
Not applicable.
Informed Consent Statement
Not applicable.
Data Availability Statement
The data supporting the findings of this paper are available from the corresponding author upon reasonable request.
Acknowledgments
This research was supported by the Maa-ja vesitekniikan tuki r.y. (MVTT) with project number 41878, to which the authors would like to express their deep gratitude.
Conflicts of Interest
The authors declare no conflict of interest.
References
- Carrão, H.; Naumann, G.; Barbosa, P. Mapping global patterns of drought risk: An empirical framework based on sub-national estimates of hazard, exposure and vulnerability. Glob. Environ. Chang. 2016, 39, 108–124. [Google Scholar] [CrossRef]
- Sönmez, F.K.; Koemuescue, A.U.; Erkan, A.; Turgu, E. An analysis of spatial and temporal dimension of drought vulnerability in Turkey using the standardized precipitation index. Nat. Hazards 2005, 35, 243–264. [Google Scholar] [CrossRef]
- Torabi Haghighi, A.; Abou Zaki, N.; Rossi, P.M.; Noori, R.; Hekmatzadeh, A.A.; Saremi, H.; Kløve, B. Unsustainability syndrome—from meteorological to agricultural drought in arid and semi-arid regions. Water 2020, 12, 838. [Google Scholar] [CrossRef] [Green Version]
- Turkes, M. Climate and drought in Turkey. In Water Resources of Turkey; Springer: Cham, Switzerland, 2020; pp. 85–125. [Google Scholar]
- Danandeh Mehr, A. Drought classification using gradient boosting decision tree. Acta Geophys. 2021, 69, 909–918. [Google Scholar] [CrossRef]
- Wilhite, D.A.; Glantz, M.H. Understanding the Drought Phenomenon: The role of definitions. Drought Mitig. Cent. Fac. Publ. 1985, 20, 11–27. [Google Scholar] [CrossRef] [Green Version]
- Crausbay, S.D.; Ramirez, A.R.; Carter, S.L.; Cross, M.S.; Hall, K.R.; Bathke, D.J.; Sanford, T. Defining ecological drought for the twenty-first century. Bull. Am. Meteorol. Soc. 2017, 98, 2543–2550. [Google Scholar] [CrossRef]
- Zargar, A.; Sadiq, R.; Naser, B.; Khan, F.I. A review of drought indices. Environ. Rev. 2011, 19, 333–349. [Google Scholar] [CrossRef]
- Tirivarombo, S.; Osupile, D.; Eliasson, P. Drought monitoring and analysis: Standardised Precipitation Evapotranspiration Index (SPEI) and Standardised Precipitation Index (SPI). Phys. Chem. Earth 2018, 106, 1–10. [Google Scholar] [CrossRef]
- Danandeh Mehr, A.; Rikhtehgar Ghiasi, A.; Yaseen, Z.M.; Sorman, A.U.; Abualigah, L. A novel intelligent deep learning predictive model for meteorological drought forecasting. J. Ambient. Intell. Humaniz. Comput. 2022, 1–15. [Google Scholar] [CrossRef]
- Palmer, W.C. Meteorological Drought; U.S. Weather Bureau: Washington, DC, USA, 1965.
- Vicente-Serrano, S.M.; Beguería, S.; López-Moreno, J.I. A Multiscalar Drought Index Sensitive to Global Warming: The Standardized Precipitation Evapotranspiration Index. J. Clim. 2010, 23, 1696–1718. [Google Scholar] [CrossRef] [Green Version]
- Bhalme, H.N.; Mooley, D.A. Large-scale droughts/floods and monsoon circulation. Mon. Weather. Rev. 1980, 108, 1197–1211. [Google Scholar] [CrossRef] [Green Version]
- Mckee, T.B.; Doesken, N.J.; Kleist, J. The relationship of drought frequency and duration to time scales. In Proceedings of the AMS 8th Conference on Applied Climatology, Anaheim, CA, USA, 17–22 January 1993; pp. 179–184. [Google Scholar]
- Bacanli, U.G.; Firat, M.; Dikbas, F. Adaptive Neuro-Fuzzy inference system for drought forecasting. Stoch. Environ. Res. Risk Assess. 2009, 23, 1143–1154. [Google Scholar] [CrossRef]
- Danandeh Mehr, A.; Kahya, E.; Özger, M. A gene-wavelet model for long lead time drought forecasting. J. Hydrol. 2014, 517, 691–699. [Google Scholar] [CrossRef]
- Deo, R.C.; Tiwari, M.K.; Adamowski, J.F.; Quilty, J.M. Forecasting effective drought index using a wavelet extreme learning machine (W-ELM) model. Stoch. Environ. Res. Risk Assess. 2016, 31, 1–30. [Google Scholar] [CrossRef]
- Durdu, Ö.F. Application of linear stochastic models for drought forecasting in the Büyük Menderes river basin, western Turkey. Stoch. Environ. Res. Risk Assess. 2010, 24, 1145–1162. [Google Scholar] [CrossRef]
- Keskin, M.E.; Terzi, Ö.; Taylan, E.D.; Küçükyaman, D. Meteorological drought analysis using data-driven models for the Lakes District, Turkey. Hydrol. Sci. J. 2009, 54, 1114–1124. [Google Scholar] [CrossRef] [Green Version]
- Nourani, V.; Molajou, A. Application of a hybrid association rules/decision tree model for drought monitoring. Glob. Planet. Chang. 2017, 159, 37–45. [Google Scholar] [CrossRef]
- Özger, M.; Mishra, A.K.; Singh, V.P. Long Lead Time Drought Forecasting Using a Wavelet and Fuzzy Logic Combination Model: A Case Study in Texas. J. Hydrometeorol. 2011, 13, 284–297. [Google Scholar] [CrossRef]
- Yaseen, Z.M.; Ali, M.; Sharafati, A.; Al-Ansari, N.; Shahid, S. Forecasting standardized precipitation index using data intelligence models: Regional investigation of Bangladesh. Sci. Rep. 2011, 11, 1–25. [Google Scholar] [CrossRef]
- Morid, S.; Smakhtin, V.; Bagherzadeh, K. Drought forecasting using artificial neural networks and time series of drought indices. Int. J. Climatol. 2007, 27, 2103–2111. [Google Scholar] [CrossRef]
- Barua, S.; Ng, A.W.M.; Perera, B.J.C. Artificial Neural Network–Based Drought Forecasting Using a Nonlinear Aggregated Drought Index. J. Hydrol. Eng. 2012, 17, 1408–1413. [Google Scholar] [CrossRef]
- Mokhtarzad, M.; Eskandari, F.; Jamshidi Vanjani, N.; Arabasadi, A. Drought forecasting by ANN, ANFIS, and SVM and comparison of the models. Environ. Earth Sci. 2017, 76, 729. [Google Scholar] [CrossRef]
- Gholizadeh, R.; Yilmaz, H.; Mehr, A.D. Multitemporal meteorological drought forecasting using Bat-ELM. Acta Geophys. 2022. [Google Scholar] [CrossRef]
- Park, H.; Kim, K.; Lee, D. Prediction of severe drought area based on random forest: Using satellite image and topography data. Water 2019, 11, 705. [Google Scholar] [CrossRef] [Green Version]
- Li, J.; Wang, Z.; Wu, X.; Xu, C.Y.; Guo, S.; Chen, X.; Zhang, Z. Robust meteorological drought prediction using antecedent SST fluctuations and machine learning. Water Resour. Res. 2021, 57, e2020WR029413. [Google Scholar] [CrossRef]
- Aghelpour, P.; Mohammadi, B.; Mehdizadeh, S.; Bahrami-Pichaghchi, H.; Duan, Z. A novel hybrid dragonfly optimization algorithm for agricultural drought prediction. Stoch. Environ. Res. Risk Assess. 2021, 35, 2459–2477. [Google Scholar] [CrossRef]
- Ahmadi, F.; Mehdizadeh, S.; Mohammadi, B. Development of Bio-Inspired-and Wavelet-Based Hybrid Models for Reconnaissance Drought Index Modeling. Water Resour. Manag. 2021, 35, 4127–4147. [Google Scholar] [CrossRef]
- Khan, M.M.H.; Muhammad, N.S.; El-Shafie, A. Wavelet based hybrid ANN-ARIMA models for meteorological drought forecasting. J. Hydrol. 2020, 590, 125380. [Google Scholar] [CrossRef]
- Mehr, A.D.; Tur, R.; Çalışkan, C.; Tas, E. A novel fuzzy random forest model for meteorological drought classification and prediction in ungauged catchments. Pure Appl. Geophys. 2020, 177, 5993–6006. [Google Scholar] [CrossRef]
- Dikici, M. Drought analysis with different indices for the Asi Basin (Turkey). Sci. Rep. 2020, 10, 1–12. [Google Scholar] [CrossRef]
- Breiman, L. Random forests. Mach. Learn. 2001, 45, 5–32. [Google Scholar] [CrossRef] [Green Version]
- Huang, G.B.; Zhu, Q.Y.; Siew, C.K. Extreme learning machine: Theory and applications. Neurocomputing 2006, 70, 489–501. [Google Scholar] [CrossRef]
- Yang, X.S.; Gandomi, A.H. Bat algorithm: A novel approach for global engineering optimization. Eng. Comput. 2012, 29, 464–483. [Google Scholar] [CrossRef] [Green Version]
- Danandeh Mehr, A.; Vaheddoost, B. Identification of the trends associated with the SPI and SPEI indices across Ankara, Turkey. Theor. Appl. Climatol. 2020, 139, 1531–1542. [Google Scholar] [CrossRef]
- Alizamir, M.; Heddam, S.; Kim, S.; Mehr, A.D. On the implementation of a novel data-intelligence model based on extreme learning machine optimized by bat algorithm for estimating daily chlorophyll-a concentration: Case studies of river and lake in USA. J. Clean. Prod. 2021, 285, 124868. [Google Scholar] [CrossRef]
- Dong, L.; Zeng, W.; Wu, L.; Lei, G.; Chen, H.; Srivastava, A.K.; Gaiser, T. Estimating the Pan Evaporation in Northwest China by Coupling CatBoost with Bat Algorithm. Water 2021, 13, 256. [Google Scholar] [CrossRef]
- Xu, B.; Huang, J.Z.; Williams, G.; Li, M.J.; Ye, Y. Hybrid Random Forests: Advantages of Mixed Trees in Classifying Text Data. In Lecture Notes in Computer Science (Including Subseries Lecture Notes in Artificial Intelligence and Lecture Notes in Bioinformatics); Springer: Berlin/Heidelberg, Germany, 2012; pp. 147–158. [Google Scholar]
- Yang, X.; Li, Y.P.; Liu, Y.R.; Gao, P.P. A MCMC-based maximum entropy copula method for bivariate drought risk analysis of the Amu Darya River Basin. J. Hydrol. 2020, 590, 125502. [Google Scholar] [CrossRef]
- Danandeh Mehr, A.D.; Safari, M.J.S.; Nourani, V. Wavelet packet-genetic programming: A new model for meteorological drought hindcasting. Tek. Dergi 2021, 32, 11029–11050. [Google Scholar] [CrossRef]
- Kisi, O.; Gorgij, A.D.; Zounemat-Kermani, M.; Mahdavi-Meymand, A.; Kim, S. Drought forecasting using novel heuristic methods in a semi-arid environment. J. Hydrol. 2019, 578, 124053. [Google Scholar] [CrossRef]
- Mustafa, N.B.; Abdüsselam, A. The impacts of climate change on the runoff volume of Melen and Munzur Rivers in Turkey based on calibration of WASMOD model with multiobjective genetic algorithm. Meteorol. Atmos. Phys. 2020, 132, 85–98. [Google Scholar]
Figure 1.
The observed SPEI series at Beypazari (upper panel) and Nallihan stations (lower panel).

Figure 2.
Methodology flowchart for the evolution of hybrid GARF model.

Figure 3.
The scatter plots of evolved ML models for SPEI-3 and SPEI-6 forecasting at the meteorology stations.
Figure 3.
The scatter plots of evolved ML models for SPEI-3 and SPEI-6 forecasting at the meteorology stations.

Figure 4.
The Taylor diagram of the evolved and benchmark models for SPEI-3 and SPEI-6 forecasting at Beypazari (upper panels) and Nallihan (lower panels) stations.
Figure 4.
The Taylor diagram of the evolved and benchmark models for SPEI-3 and SPEI-6 forecasting at Beypazari (upper panels) and Nallihan (lower panels) stations.


Table 1.
Comparison of the ML models’ performance for SPEI-3 and SPEI-6 forecasting.
| Model | Beypazari | Nallihan | ||
|---|---|---|---|---|
| RMSE | NSE | RMSE | NSE | |
| Training phase for SPEI-3 | ||||
| RF | 0.671 | 0.512 | 0.628 | 0.547 |
| ELM | 0.650 | 0.540 | 0.597 | 0.590 |
| Bat-ELM | 0.580 | 0.634 | 0.531 | 0.676 |
| GARF | 0.592 | 0.619 | 0.547 | 0.656 |
| Testing phase for SPEI-3 | ||||
| RF | 0.833 | 0.381 | 0.810 | 0.430 |
| ELM | 0.825 | 0.381 | 0.801 | 0.438 |
| Bat-ELM | 0.748 | 0.491 | 0.727 | 0.536 |
| GARF | 0.744 | 0.497 | 0.667 | 0.608 |
| Training phase for SPEI-6 | ||||
| RF | 0.530 | 0.700 | 0.450 | 0.763 |
| ELM | 0.494 | 0.736 | 0.434 | 0.780 |
| Bat-ELM | 0.434 | 0.796 | 0.375 | 0.835 |
| GARF | 0.488 | 0.742 | 0.413 | 0.800 |
| Testing phase for SPEI-6 | ||||
| RF | 0.639 | 0.610 | 0.576 | 0.700 |
| ELM | 0.642 | 0.604 | 0.564 | 0.712 |
| Bat-ELM | 0.580 | 0.676 | 0.526 | 0.750 |
| GARF | 0.550 | 0.709 | 0.481 | 0.791 |
Publisher’s Note: MDPI stays neutral with regard to jurisdictional claims in published maps and institutional affiliations. |
© 2022 by the authors. Licensee MDPI, Basel, Switzerland. This article is an open access article distributed under the terms and conditions of the Creative Commons Attribution (CC BY) license (https://creativecommons.org/licenses/by/4.0/).
Share and Cite
MDPI and ACS Style
Danandeh Mehr, A.; Torabi Haghighi, A.; Jabarnejad, M.; Safari, M.J.S.; Nourani, V. A New Evolutionary Hybrid Random Forest Model for SPEI Forecasting. Water 2022, 14, 755. https://doi.org/10.3390/w14050755
AMA Style
Danandeh Mehr A, Torabi Haghighi A, Jabarnejad M, Safari MJS, Nourani V. A New Evolutionary Hybrid Random Forest Model for SPEI Forecasting. Water. 2022; 14(5):755. https://doi.org/10.3390/w14050755
Chicago/Turabian StyleDanandeh Mehr, Ali, Ali Torabi Haghighi, Masood Jabarnejad, Mir Jafar Sadegh Safari, and Vahid Nourani. 2022. "A New Evolutionary Hybrid Random Forest Model for SPEI Forecasting" Water 14, no. 5: 755. https://doi.org/10.3390/w14050755
Note that from the first issue of 2016, this journal uses article numbers instead of page numbers. See further details here.