
Characteristics of Infrastructure and Surrounding Geo-Environmental Circumstances Involved in Fatal Incidents Caused by Flash Flooding: Evidence from Greece


Faculty of Geology and Geoenvironment, National and Kapodistrian University of Athens, Panepistimioupoli, GR15784 Zografou, Greece
Water 2022, 14(5), 746; https://doi.org/10.3390/w14050746
Submission received: 25 January 2022
/
Revised: 15 February 2022
/
Accepted: 24 February 2022
/
Published: 26 February 2022
(This article belongs to the Special Issue Flood and Other Hydrogeomorphological Risk Management and Analysis)
Abstract
:Recent studies have shown that a large portion of flood-associated fatalities are related to the use of vehicles. However, there is limited research on the role of infrastructure and geo-environmental conditions surrounding such incidents. This work exploits a dataset of 40 fatal vehicle-related events caused by flooding in Greece to explore the circumstances, the characteristics of infrastructure and of the surrounding environment and their possible influence in the studied incidents. The results showed that the majority of cases occurred in road segments and river crossings with a variety of design deficiencies related to safety and protection from flooding, including poor signage and lighting as well as the absence of road closures, road barriers and other crucial safety features. In high percentages incidents occurred in isolated/remote sites in rural areas, relatively narrow roads and low quality infrastructure (e.g., ford crossings) with a lack of easy alternate routes and absence of other individuals. In the vast majority of cases, the accidents occurred in small arid catchments drained by ephemeral torrents when experiencing extreme flows. The findings have practical implications as they provide a better understanding of dangerous circumstances and define the high-risk segments of the road, which is helpful in prioritizing and shaping appropriate interventions.
1. Introduction
Floods are one of the most catastrophic and lethal natural hazards [1], causing numerous fatalities on a yearly basis. Despite the significant improvements in flood mitigation measures and technologies [2,3,4,5], floods continue to pose a significant threat to human life. Recent disasters have shown that flood events can be very deadly even in areas of the world with sophisticated flood prevention policies and high quality infrastructure [6,7,8,9].
Around the world, a large portion of flood mortality is associated with the use of motor vehicles and accidents that occur as people drive through flooded waterways. In fact, a high percentage of these types of deaths in comparison to the total is recorded in the United States [10,11], in Australia [12,13] as well as in Europe [14,15,16]. In some cases, there is even evidence of a rise in vehicle-related flood fatalities [17], indicating that they are becoming a gradually more important part of the overall mortality.
Previous works examined different aspects of vehicle-related fatal incidents, including human behavior and possible interventions [18,19,20,21], activity and demographics of the victims [22,23], vehicle characteristics [21] driving under influence [24], different environmental settings [25], vehicle stability issues [26], time of the day [27] and environmental cues [28]. In addition, a part of the literature has explored the risks of extreme weather by examining the susceptibility of road segments/links [29,30,31,32] or assessed commuter exposure to the elements [33,34] as well as changes and perceptions of travel routes [35].
Although, previous works highlighted the importance of infrastructure, there is limited research on the particular infrastructure or elements of it that contribute or are associated with flood deaths [36]. In Greece, vehicle-related fatalities accounted for over 30% of the total flood fatalities in the period 1960–2010, presenting a rising trend [17], indicating that the problem will be a more persistent issue in the following decades.
This work exploits a dataset of 40 fatal flood incidents in the country associated with the use of motor vehicles aiming to provide a better understanding on the role of infrastructure, circumstances and surroundings on flood mortality and explore possible practical implications. To this end, the present study examines certain elements of the infrastructure used by the victims, as well as characteristics of the surrounding environment and of the situation at the time of these 40 fatal incidents collected by various sources.
2. Materials and Methods
The present study exploits a flood fatality database developed for Greece for the period 1960–2010 by Diakakis and Deligiannakis [16] and extended and enriched to 2020 [25]. Each entry of the database denotes a separate fatality case, containing different variables to describe the conditions, the circumstances, the surroundings and the characteristics of the victims.
In the present study, 40 outdoor vehicle-related incidents that led to fatalities were selected out of this dataset, based on the availability of data, and examined in relation to their surroundings and the characteristics of the infrastructure involved (Figure 1). Existing variables of the database were used; however, two new modules (modules 2 and 3 in Figure 1) describing the incident and characteristics of infrastructure were added.
The dataset was enriched by collecting information through field surveys and imagery provided in accident reports and press articles illustrating the attributes of the infrastructure involved and associated elements (i.e., signage, road closures and lighting installations) that have been related to road user safety in flood-related incidents in previous works [21,24,26,37]. In addition, the details of the circumstances and the surrounding environment were examined. The database was founded on various sources of information displayed in Table 1 and explained in detail in Diakakis and Deligiannakis [16].
Module 2 contains information on the vehicle type, presence of road closure due to the flood, the presence of other cars or bystanders, reported problems in the communication of vehicle occupants (e.g., no signal reception), presence of structural damage caused by the flood to the infrastructure (e.g., partial collapse), obstructions, such as vegetation to the drivers’ field of view, the lighting conditions and the length of any alternate routes. This last parameter was calculated for the cases for which there was information on the destination of the victims and the conditions of other routes.
In these cases, Google Maps was used to calculate the shortest safe alternative route. Module 2 contains also information on the length of the inundated roadway for each incident. This variable designates the length of the road surface that was under water, measured along the main axis of the road that the victims used at the time of the incident. Due to a lack of accuracy in estimations, the lengths were grouped into three categories, namely: (a) <20 m, (b) 20–100 m and (c) >100 m.
These categories were created to explore how far from their vehicle was the end of the inundated area as a proxy indicator of whether the drivers could appreciate the conditions ahead. For this parameter, we assumed that the shorter the length of the inundated area, the easier it would be for the drivers to assess the capabilities of themselves and of their vehicle to travel across floodwaters. With respect to road closures, both automatic and manually-placed barriers and road blocks were considered.
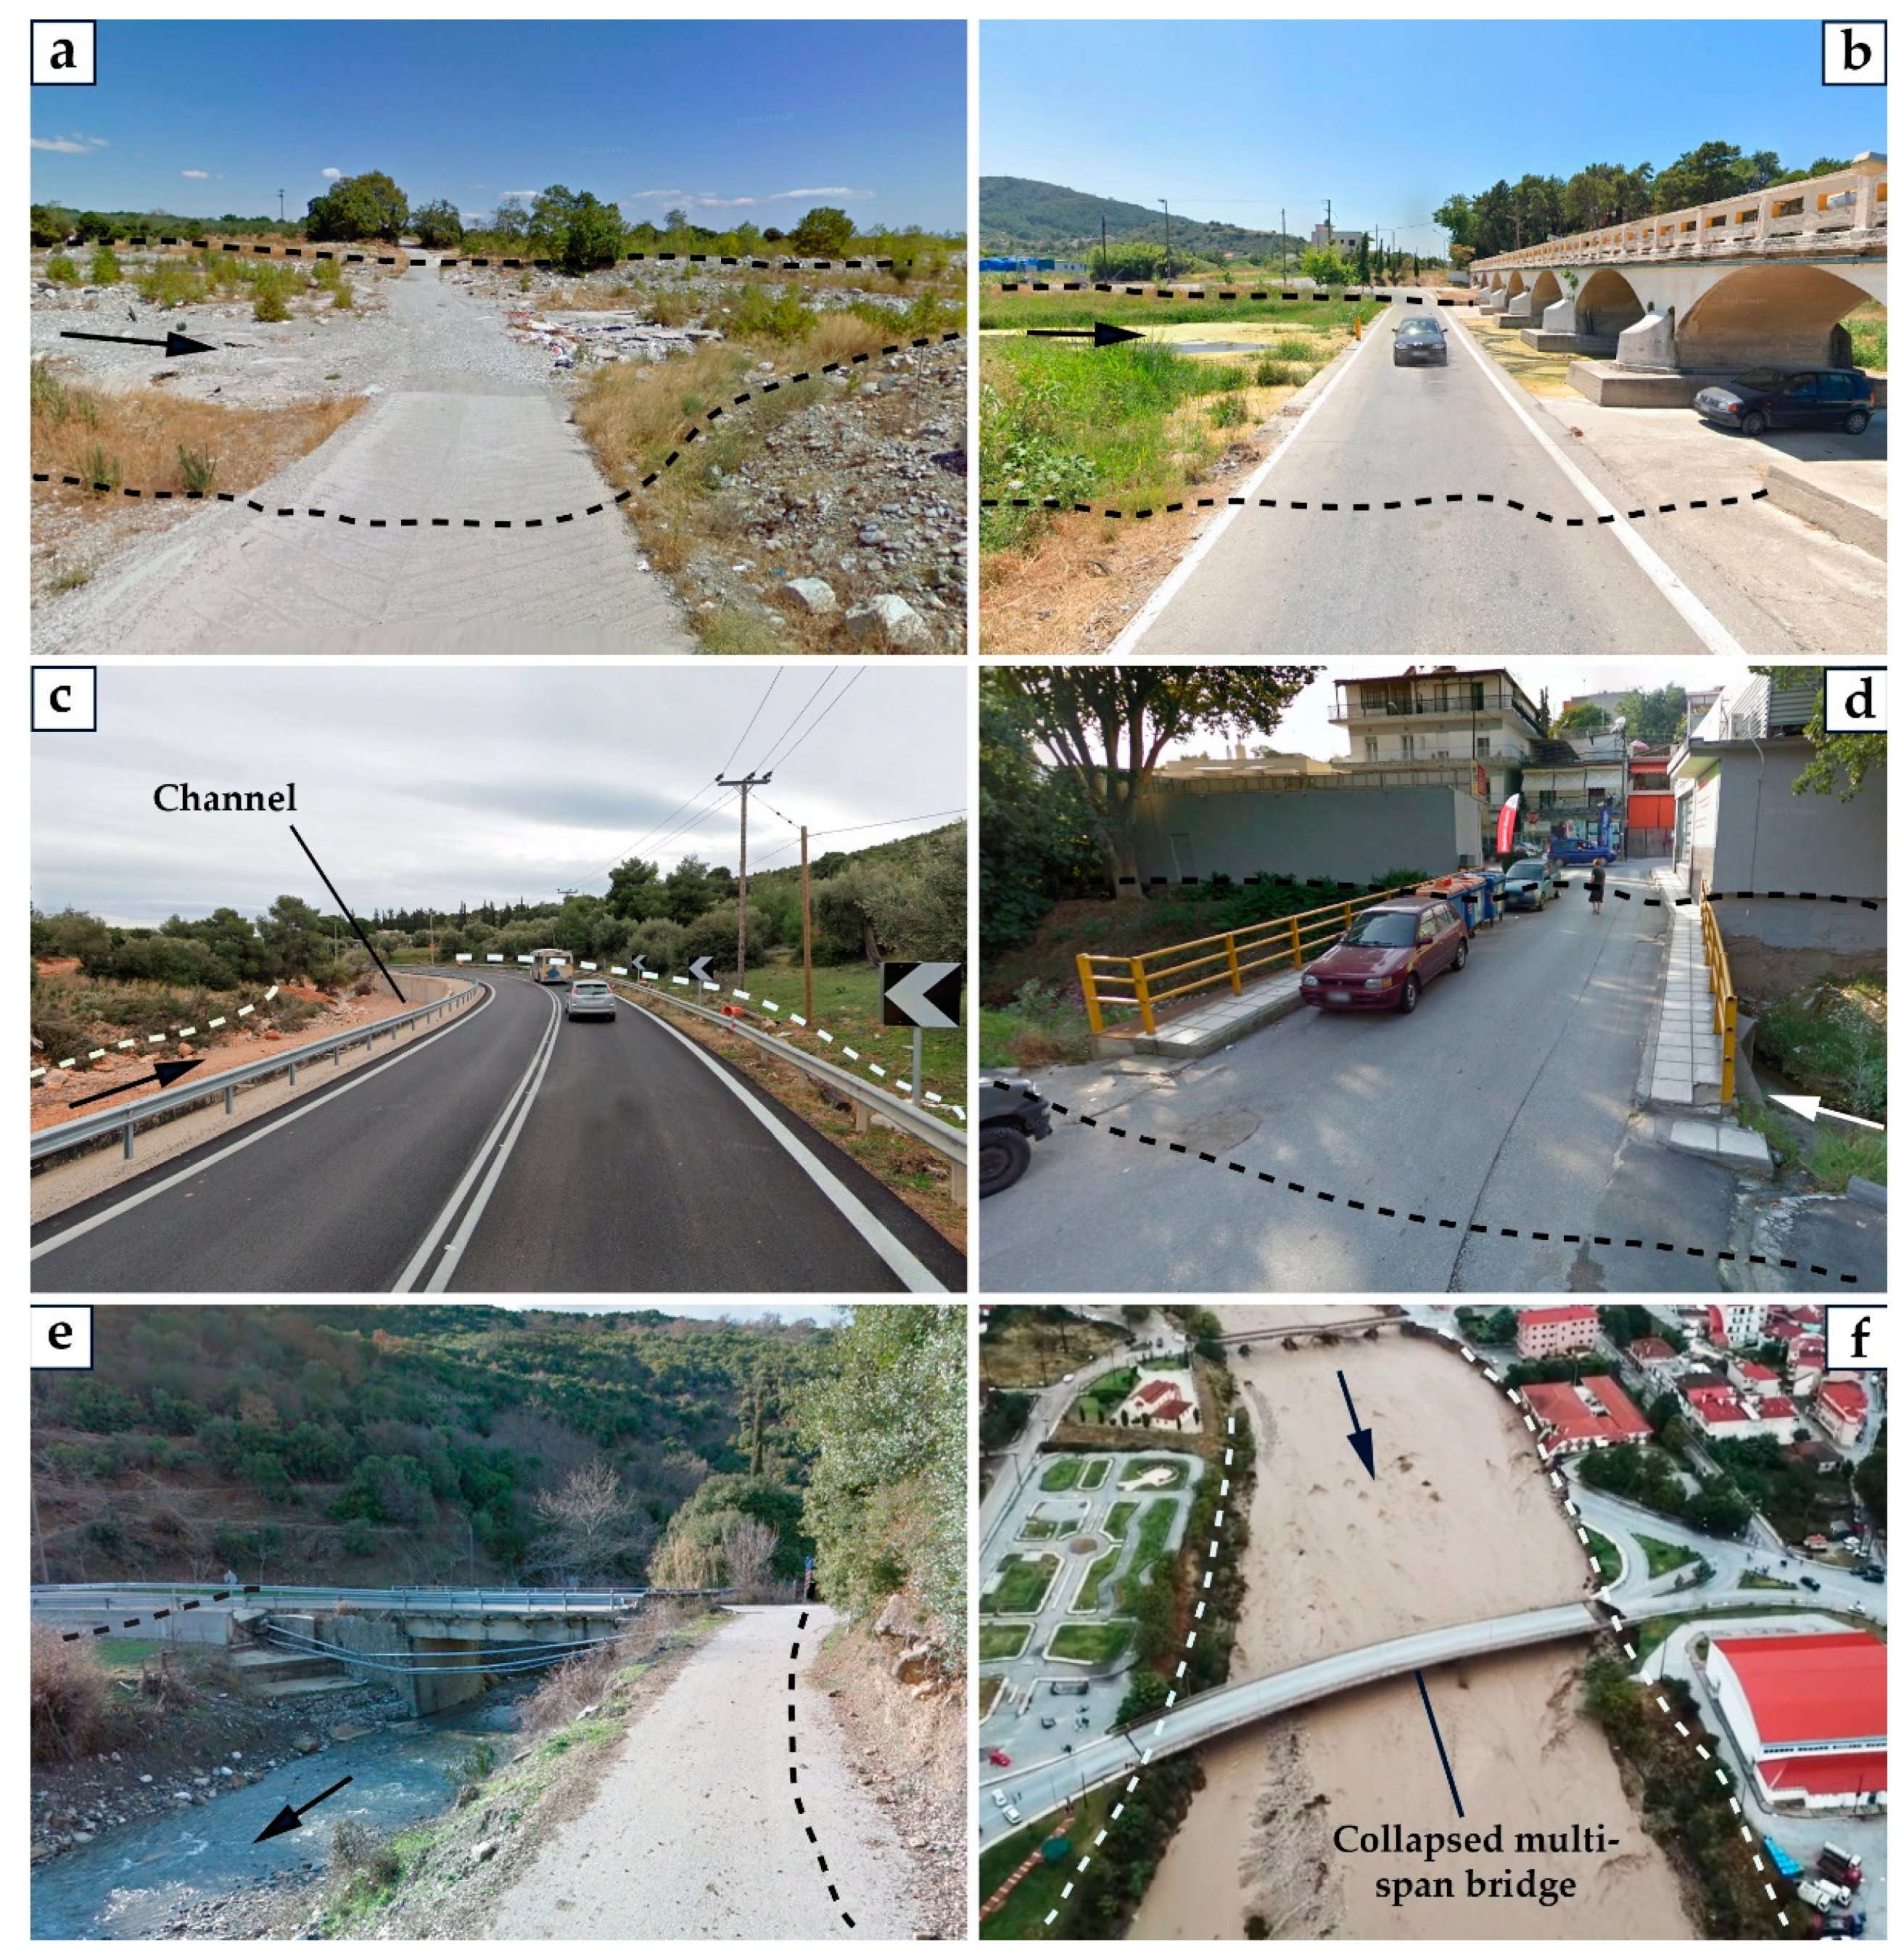
Module 3 contains information on the presence of a set of elements on the actual infrastructure at the location of the fatal incidents, including flood warning signs, lighting installations, other warning signs, signs regulating driving (e.g., speed limit signs), road-limit markers (i.e., road delimitation poles), road side barriers (guardrails), concrete curbs, sewerage and guttering. In addition, it contains information on the road segment, its function (e.g., rural road or motorway) and its geometry, including its width, possible high inclination or curvature around the location and the type of infrastructure used by the vehicle occupants involved in the incident (e.g., bridge, ford crossing etc.). Typical examples of different types of infrastructure at locations where individuals lost their lives are presented in Figure 2.
3. Results
3.1. Victim Details and Environmental Surroundings
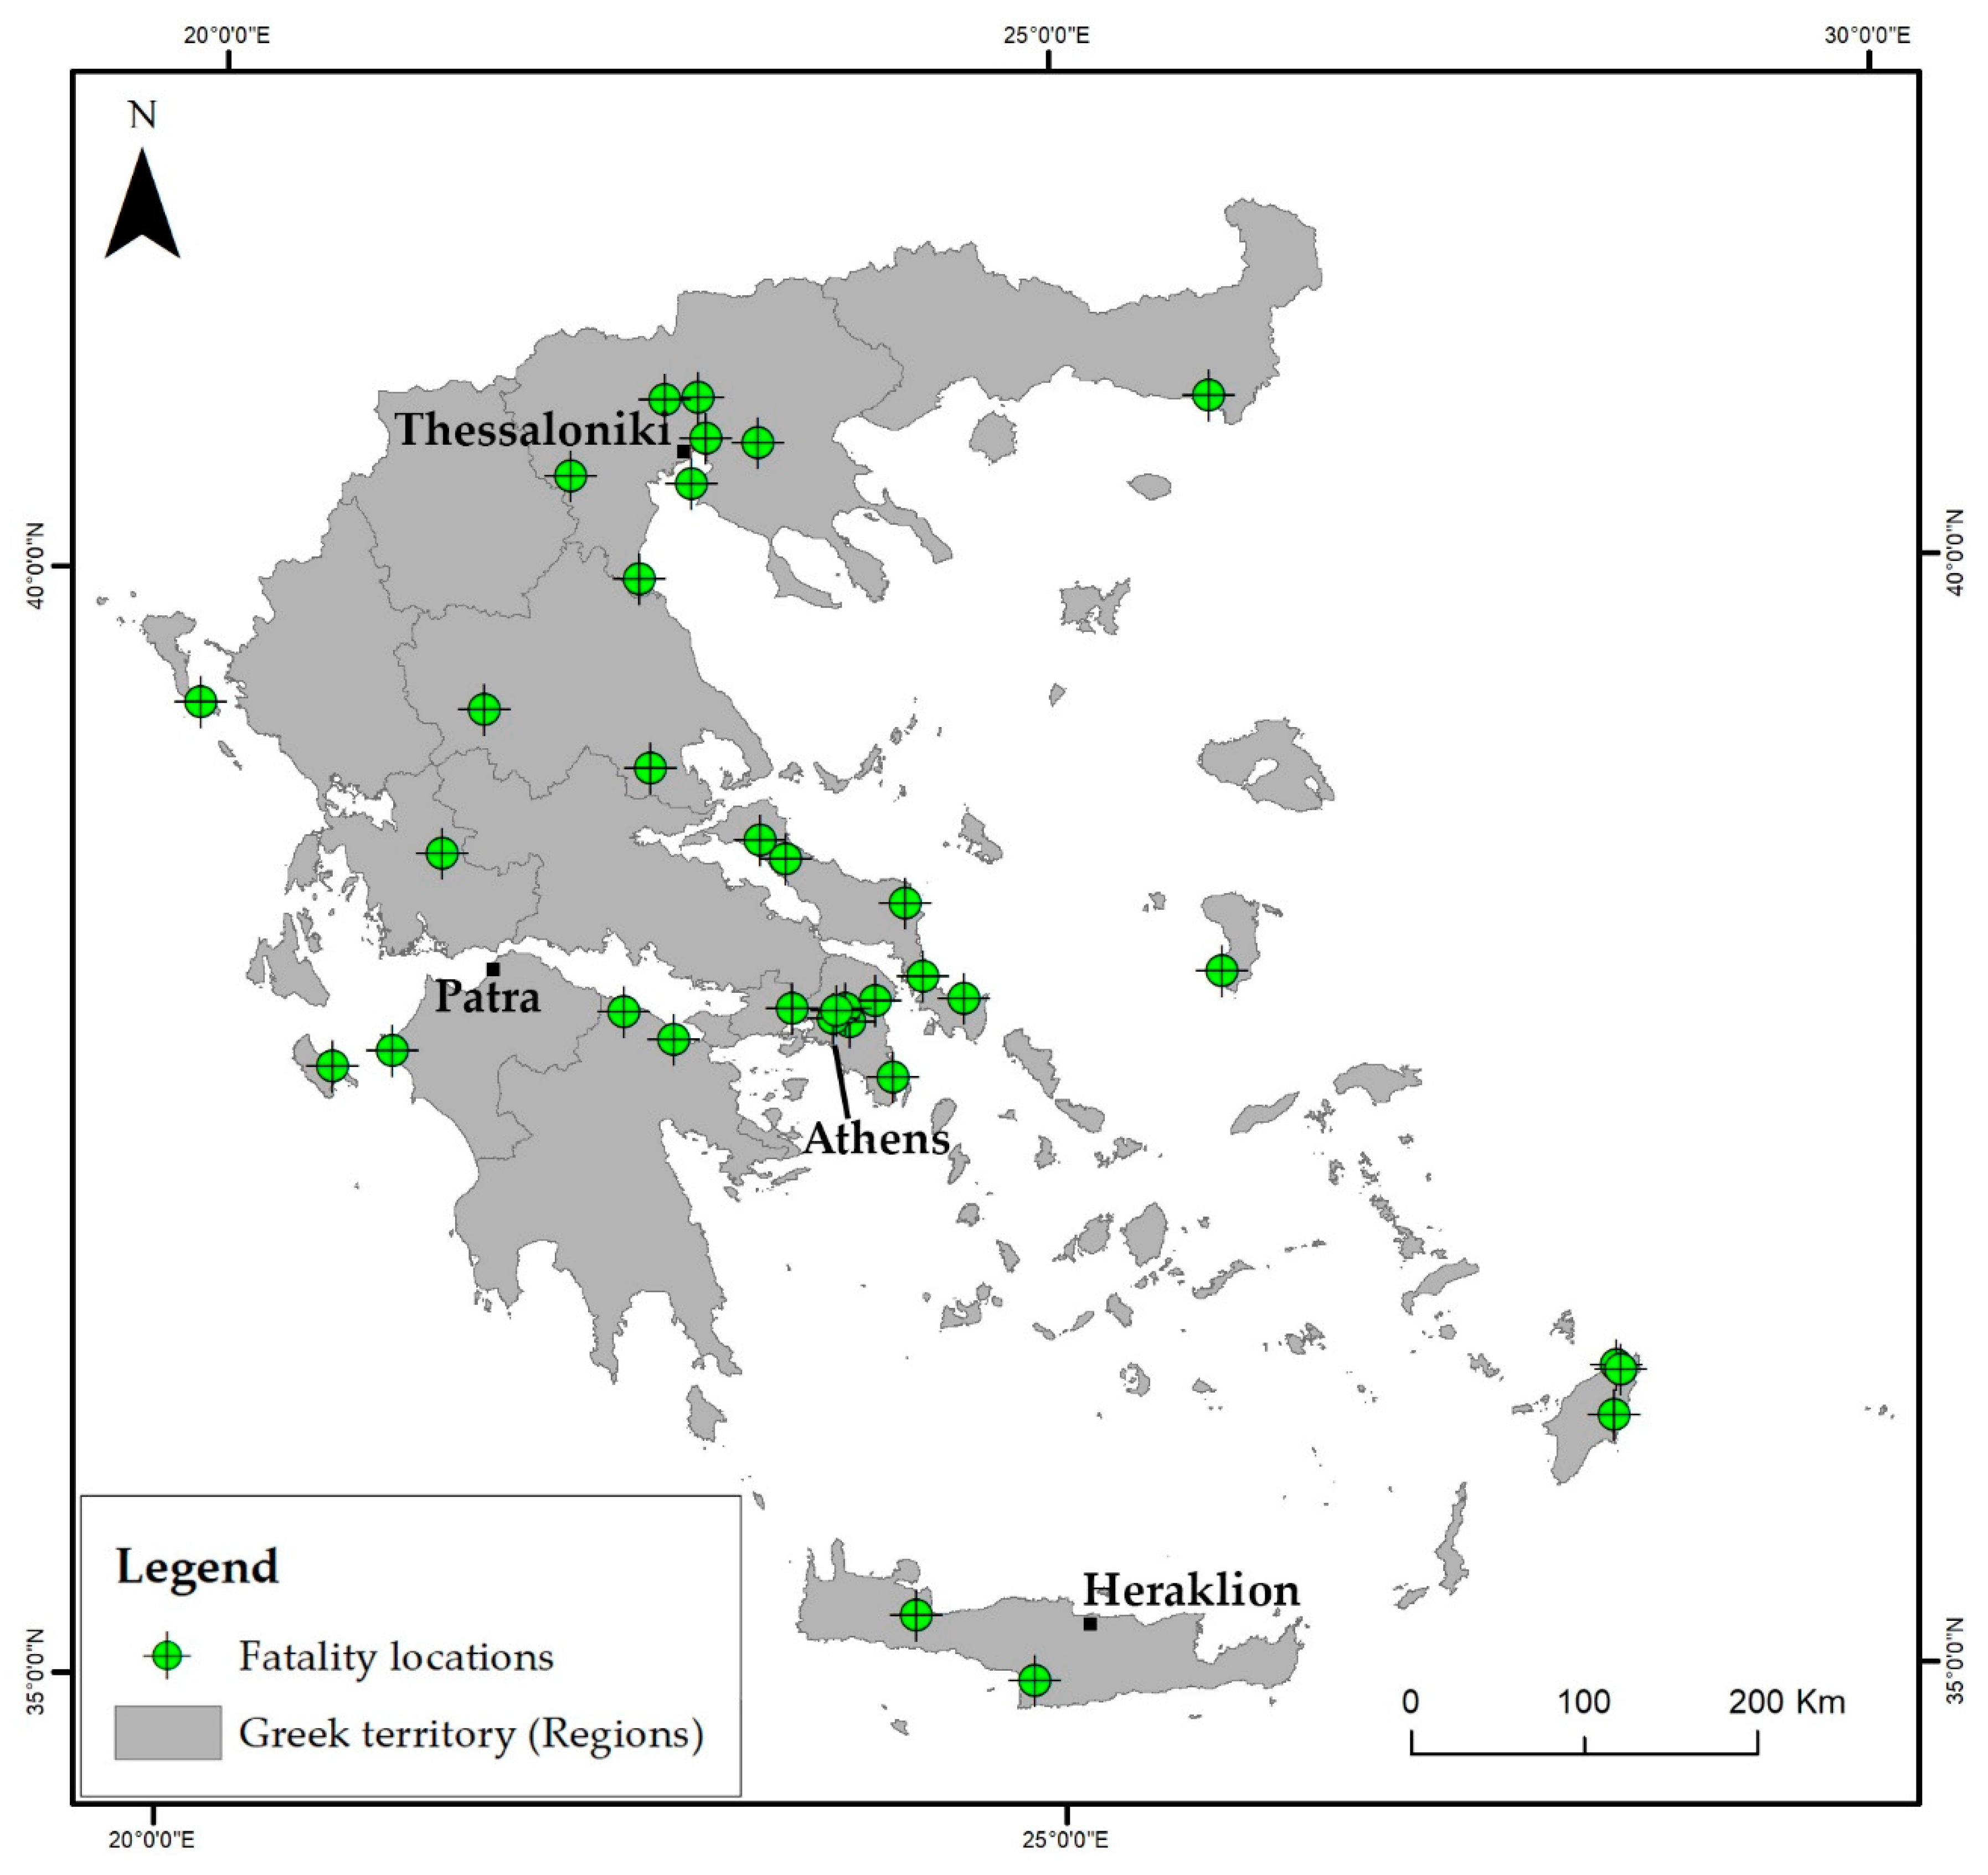
Overall, this study identified 52 vehicle-related deaths (35 males and 17 females), caused by flooding across Greece in the period 1960–2021 (Figure 3). The victims died in 40 incidents with an average age of 48.4 years old with more than half of the victims over 50 years old (24% in the 50–59 age group and 28% in the 60 to 69 age group). The majority of these individuals (36 out of 52) were drivers of the vehicles, whereas the rest were passengers (16 out of 52). In 27 out of the 40 incidents, the victims were the only vehicle occupants, whereas in 13 cases, there was more than one person in the vehicles.
In 33 cases, there were no survivors, while in seven incidents, individuals (nine in total) managed to escape. Out of these seven incidents, only in one was the person who survived the passenger; whereas, in the rest (6), the drivers were the ones who managed to escape. With regard to the size of catchments we found that the upstream area of the catchments at the location where the victims were killed ranged from 1.3 to 658.8 km2 with an average of 62.2 km2 and a median of 15.9 km2. Overall, the incidents occurred in fairly small catchments, as 26 out of 40 catchments (or 65%) were less than 30 km2 in area, indicating a rapid onset of floodwaters.
Only four (10%) of the flooded watercourses examined had permanent flow throughout the year whereas 34 (85%) were ephemeral or seasonal (2% or 5%). With regard to catchment morphology, the upstream areas presented diverse values of average inclination ranging from 4% to 39.7%, with an average of 16.7%. Most of these catchments are characterized by fairly high slopes, as 30 out of 40 record an average inclination of over 10%, while 15 out of 40 record an average value of more than 20%, making them (together with their small size) liable to flash floods.
Thirty-two (32) out of 40 cases (or 80.0%) occurred in rural or suburban areas, whereas 8 (or 20.0%) occurred within urban areas.
3.2. Conditions
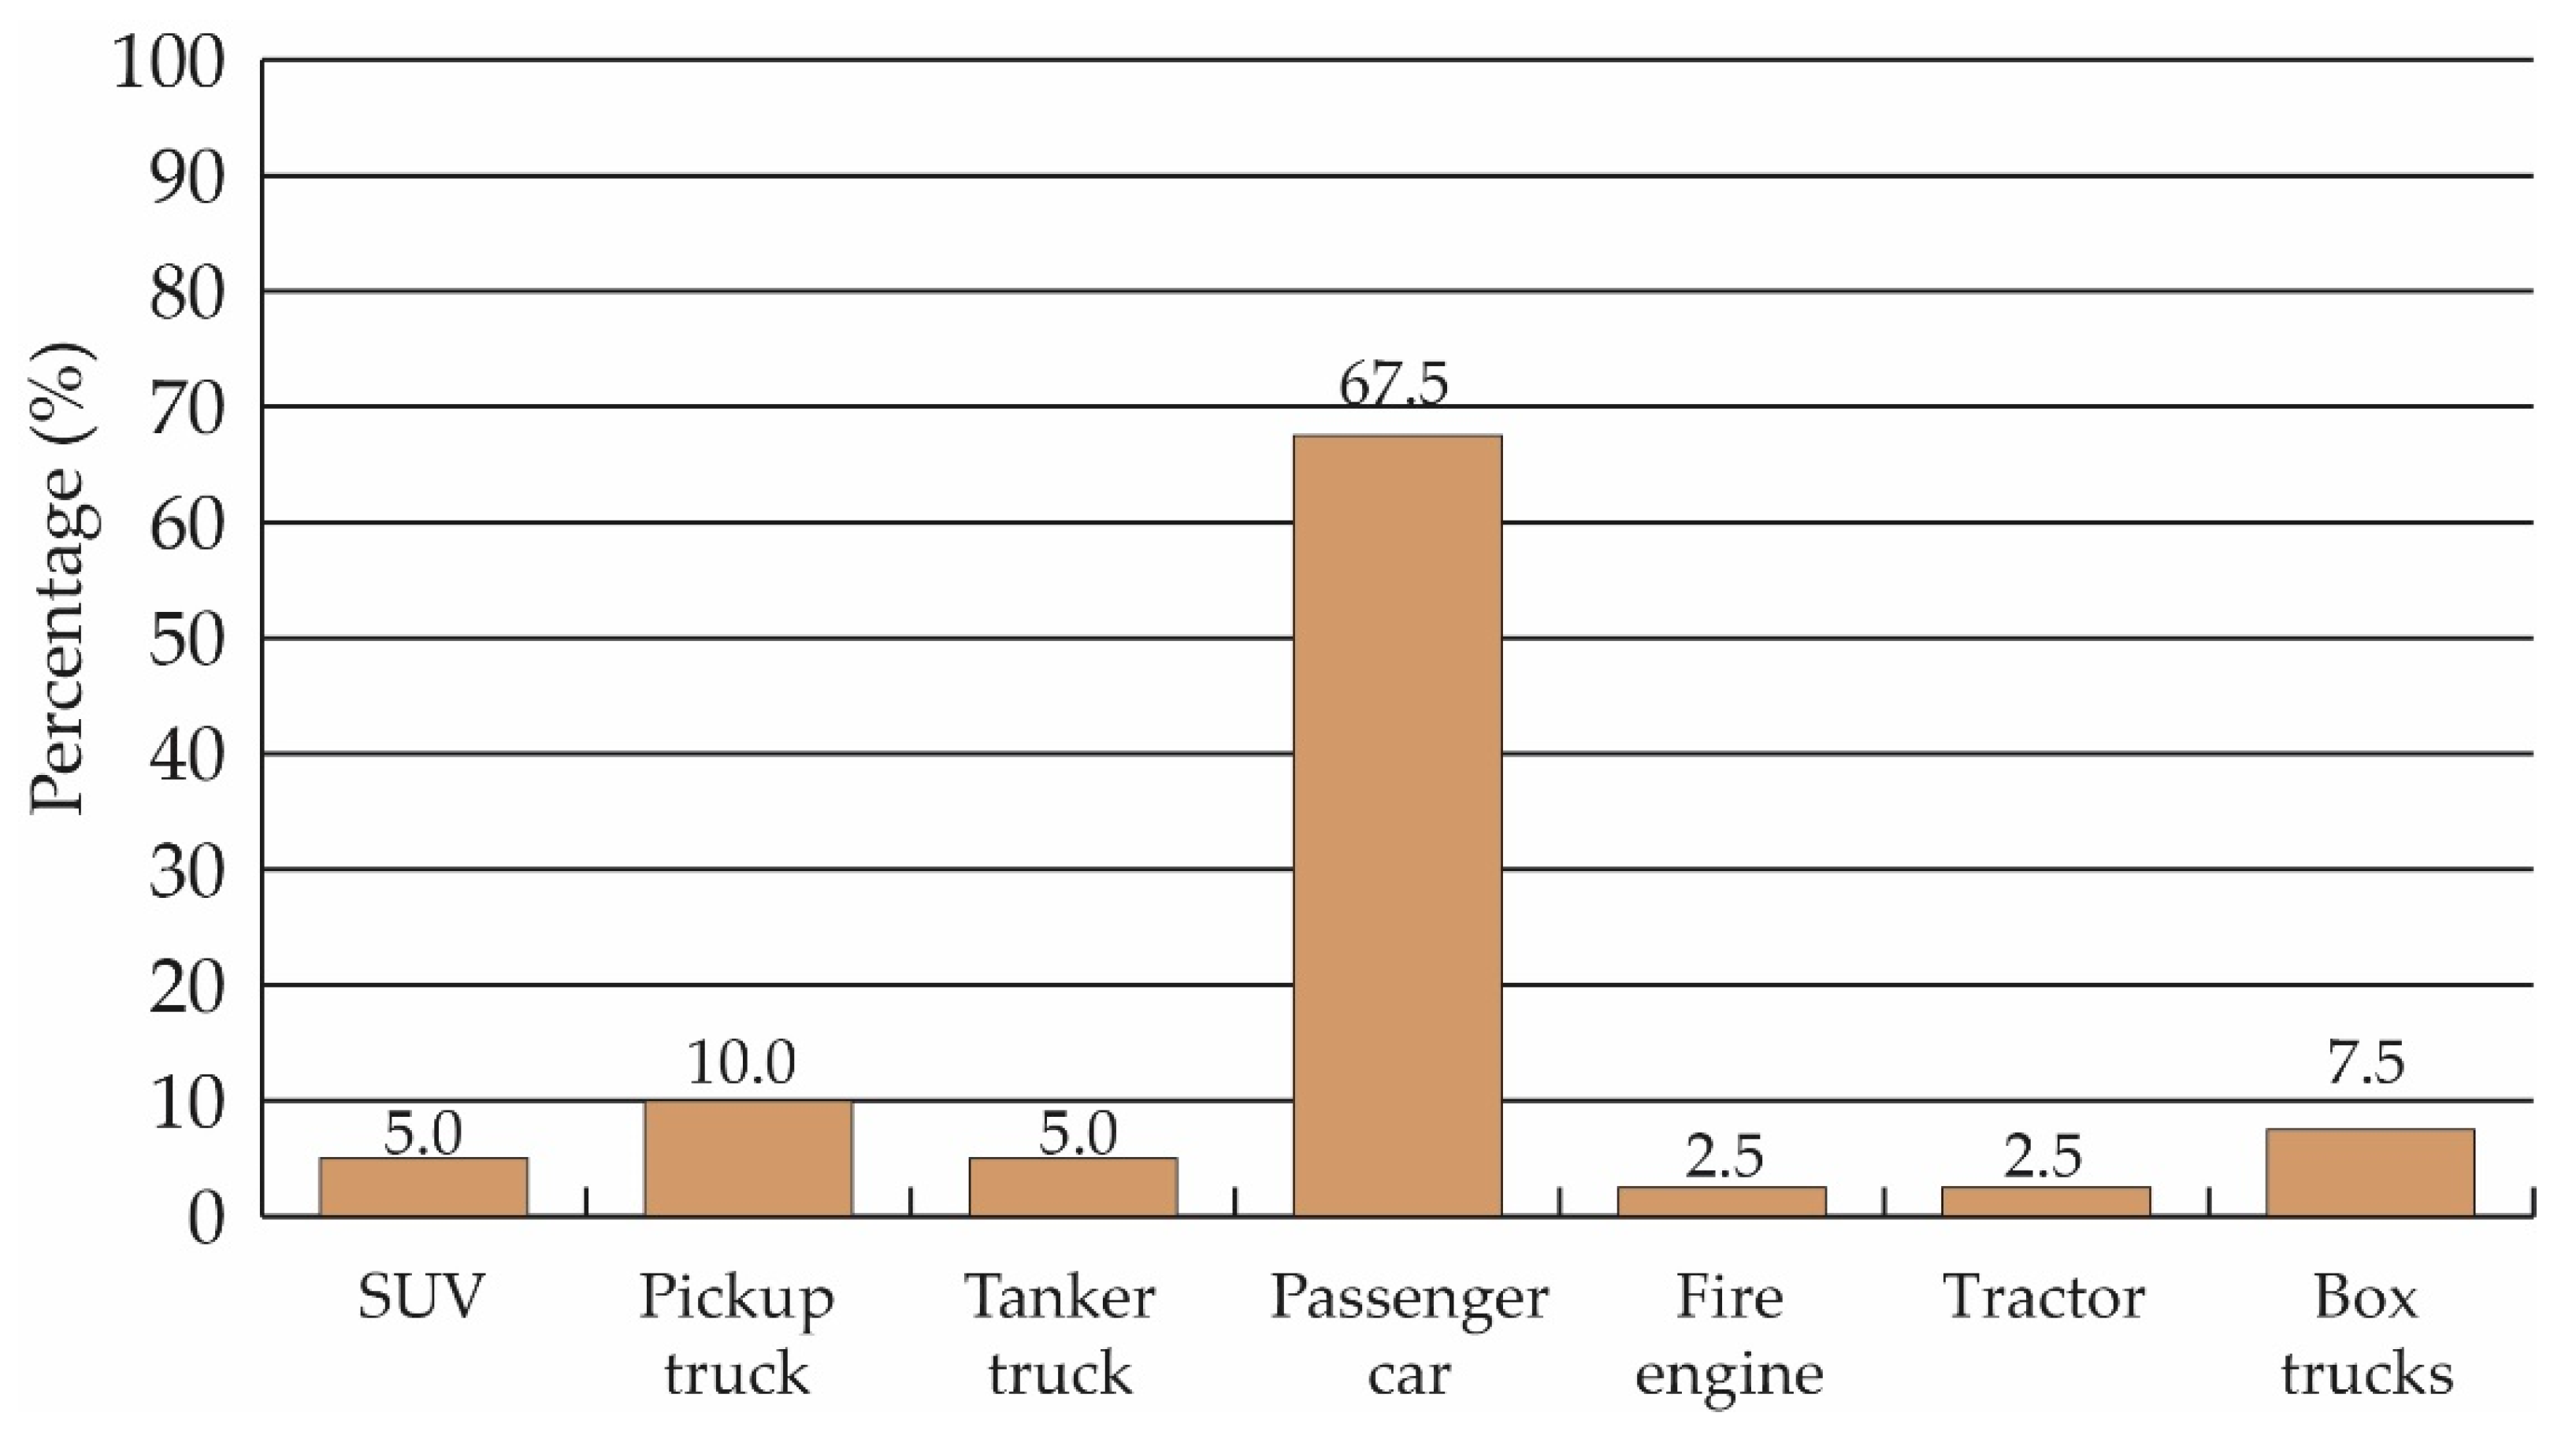
With regard to the vehicles involved in the incidents, out of the 40 cases, 27 (or 67.5%) involved passenger cars and SUVs (5%) (Figure 4), while other vehicle types appeared in smaller percentages. Larger vehicles (i.e., trucks) recorded a percentage of 25% which indicates a slight overrepresentation, as this type averages a percentage of 21.18% in the period 2000–2020 in the country [39].
As far as the driver’s field of vision is concerned, the timing of the event, the extent of the flooded area and the presence of obstacles obscuring part of the crossing were examined. We found that 25 out of 40 incidents (or 62.5%) occurred at night, whereas 14 out of 40 (or 35.0%) were in daylight. For one incident, it was not possible to determine the light conditions. In terms of the roadway length covered with water, in 36 cases where it was possible to obtain an estimation, 17 (or 50%) were less than 20 m. In nine cases (26.5%), the length was between 20 and 100 m, and in 8 cases (23.5%), it was over 100 m. In nine cases (22.5%), vegetation or other obstacles obscured part of the flooded roadway possibly partially concealing important cues from the surrounding environment and the conditions from the driver as they were approaching towards the location of the incident.
With regard to structural damages inflicted by the flood on the infrastructure used by the victims at the time of the incident, we found that only in three cases (or 7.5%), the suffered damage changed its condition drastically (e.g., subsidence and collapse), while in the rest of the cases, there was no change in the geometry or material of the road surface.
In 12 out of 40 cases, communication through mobile phone problems (e.g., signal reception) were reported by the authorities or eyewitnesses, stating that victims tried to call the emergency services and failed. In the rest of the cases, there was no information regarding communication problems or reported communication with relatives or authorities.
With regard to the presence of other drivers or bystanders, we found that, in 24 out of 40 cases (or 60%) there were no other individuals at the scene, while in 14 cases (35%), there was at least one other person. In two of the cases (or 5%), this information was not reported. Furthermore, in 30 out of 40 cases (75%), there were no other vehicles in the same flooded road segment.
With respect to possible deviations, we calculated that in seven cases (17.5%), the vehicle could take an alternate route with an additional distance of less than 1 km. In 12 cases (30%), this additional distance would be 1 to 10 km, whereas in 10 cases (25%), it was more than 10 km. In two cases, there was no other way for the vehicle occupants to reach their destination, while in nine cases, this information was not available.
3.3. Signage and Installations
From the analysis of the studied cases, it is shown that, in terms of signage and lighting, the vast majority of locations were not well equipped (Figure 5). In over 94% of the cases, there was no permanent road sign indicating the danger of flooding in the specific segment of the road nor any other sign calling attention to the driver for some form of danger ahead. In over 92% of the cases, there was no temporary road blockage/closure of any kind, while in 75.8% of the incidents, there was no other informational sign (e.g., speed limit sign) either.
In 92.1% of the cases, there were no signs to indicate the limits of the road, while lighting installations were present only in 16.7% of the locations were fatal incidents occurred. All signs recorded were passive, while no active signs, lights or electronic messages were identified in any of the cases.
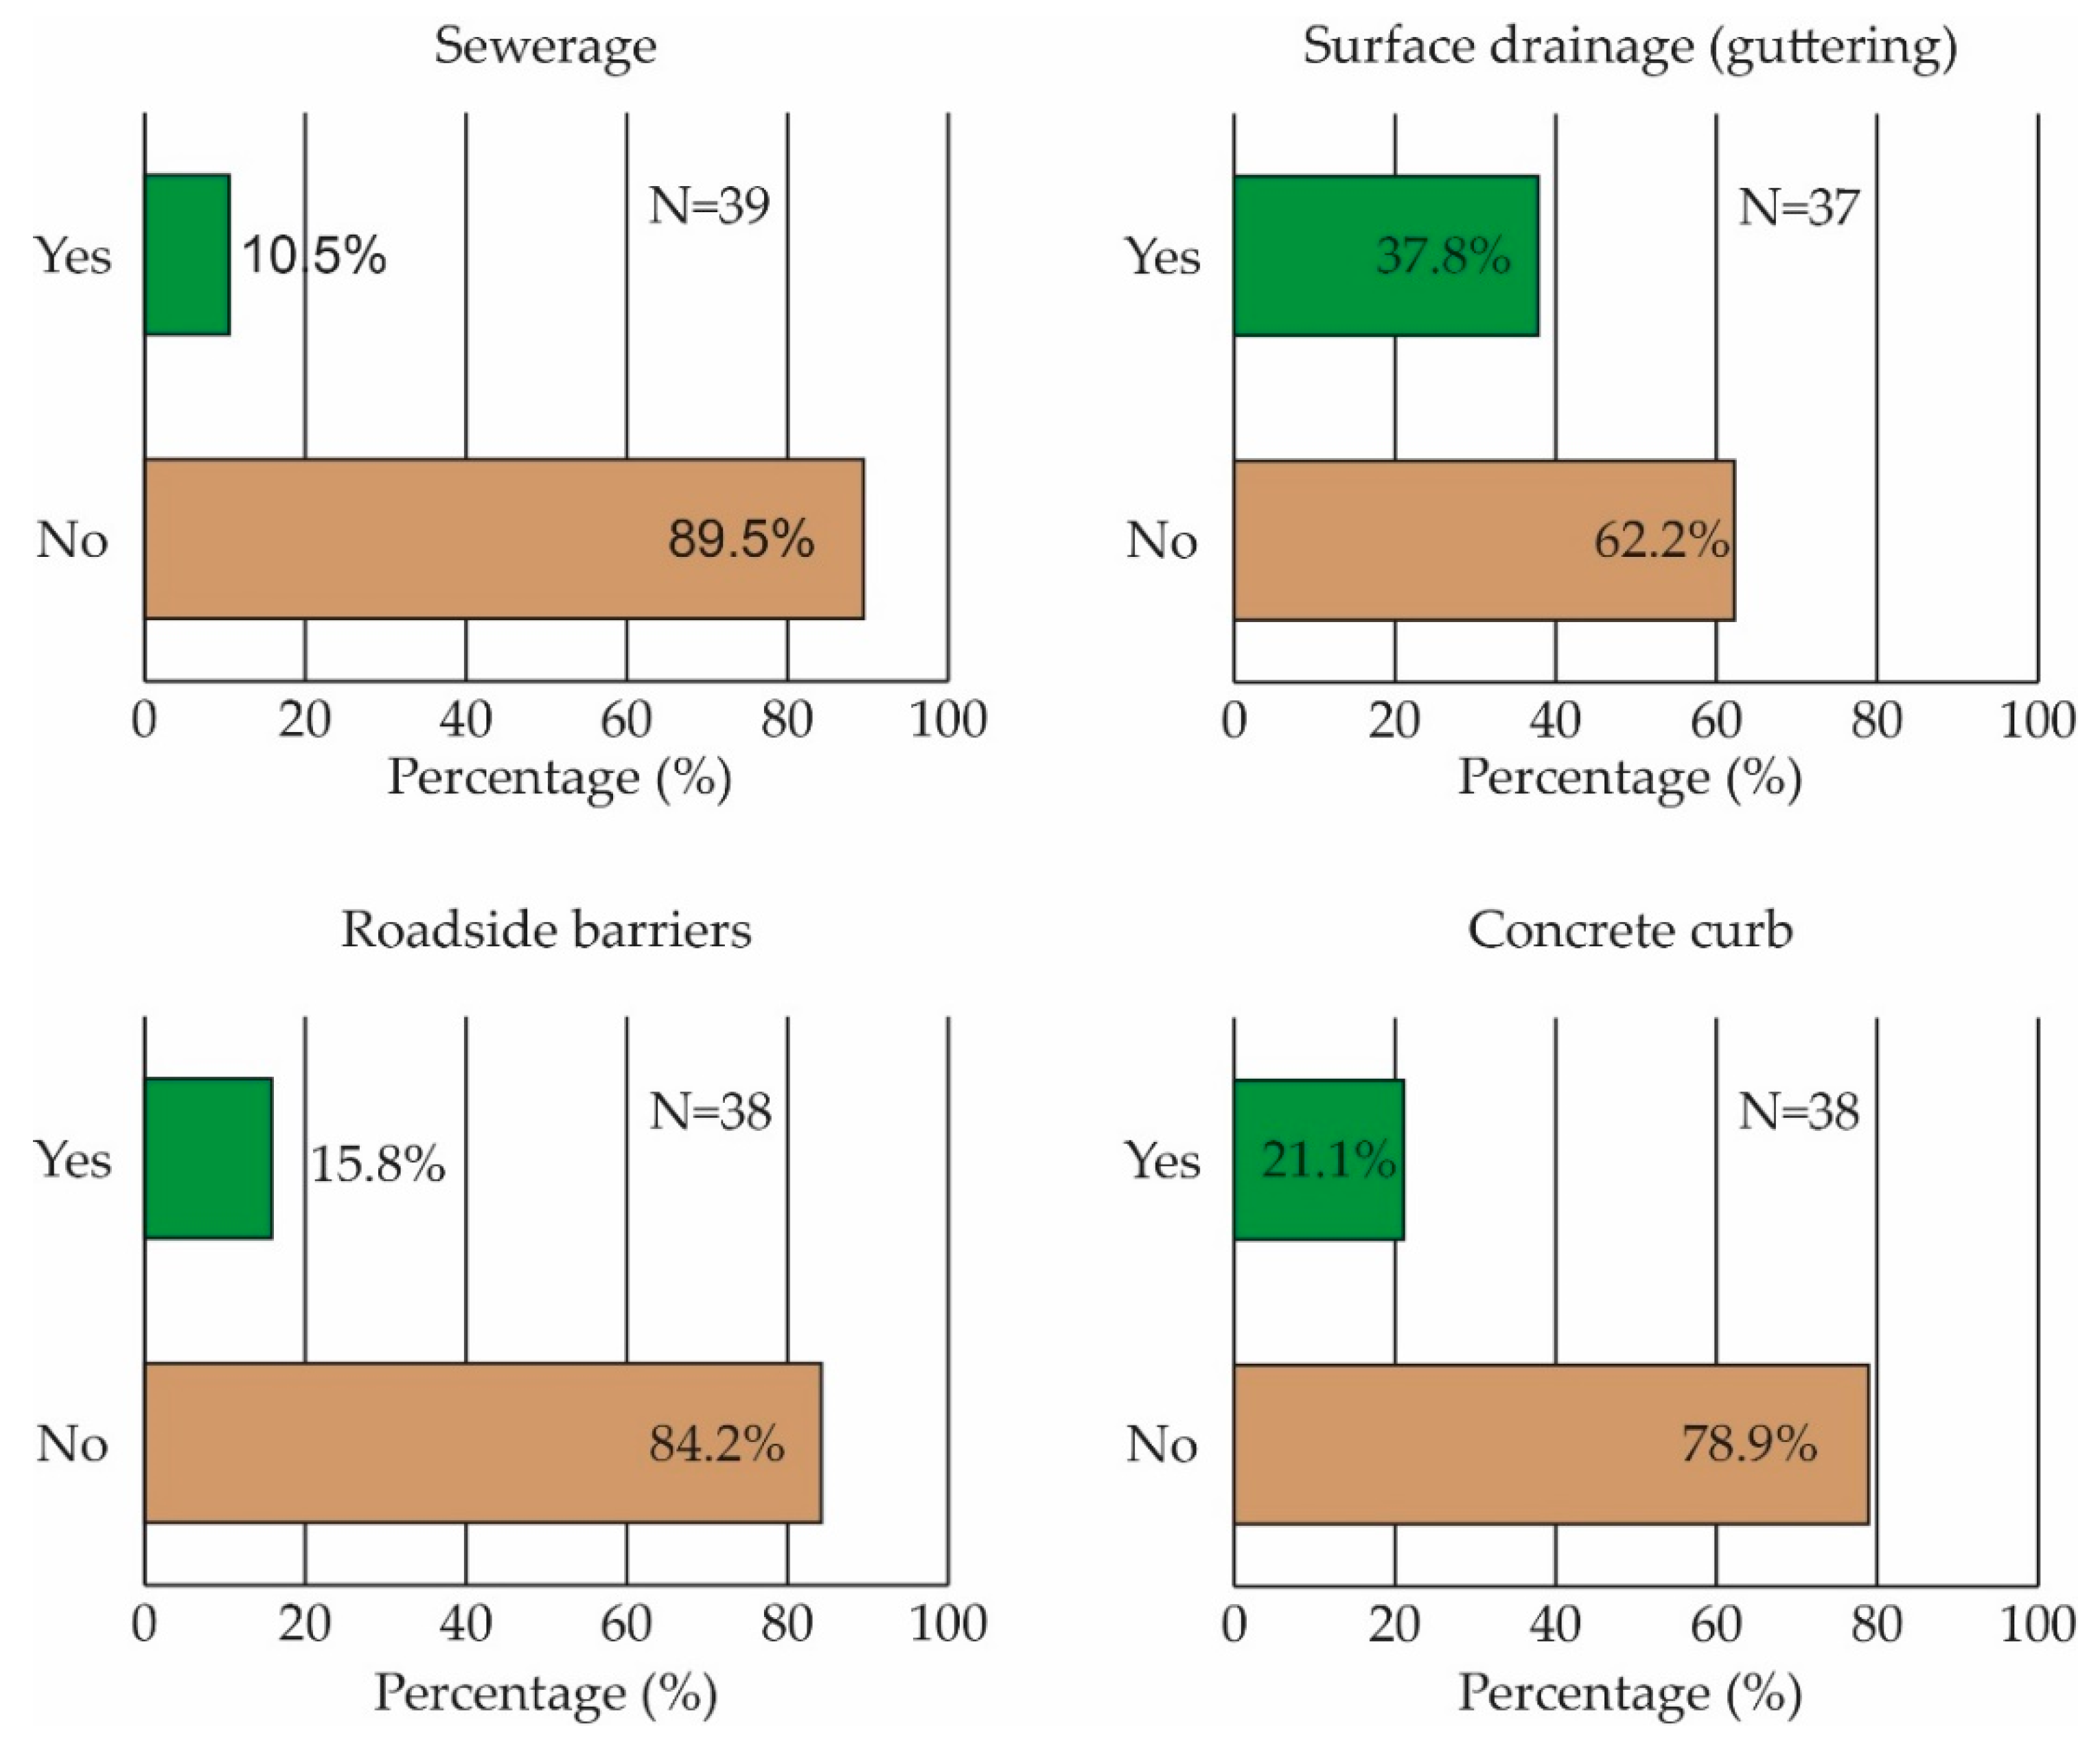
Continuing to road other installations, we found that in the majority of cases there was no sewerage system installed (89.5%) nor surface drainage/guttering (62.2%). In addition, very few cases (15.8%) had roadside barriers or even a concrete curb (21.1%) protecting the vehicles from sliding sideward along with floodwaters (Figure 6).
3.4. Road Characteristics
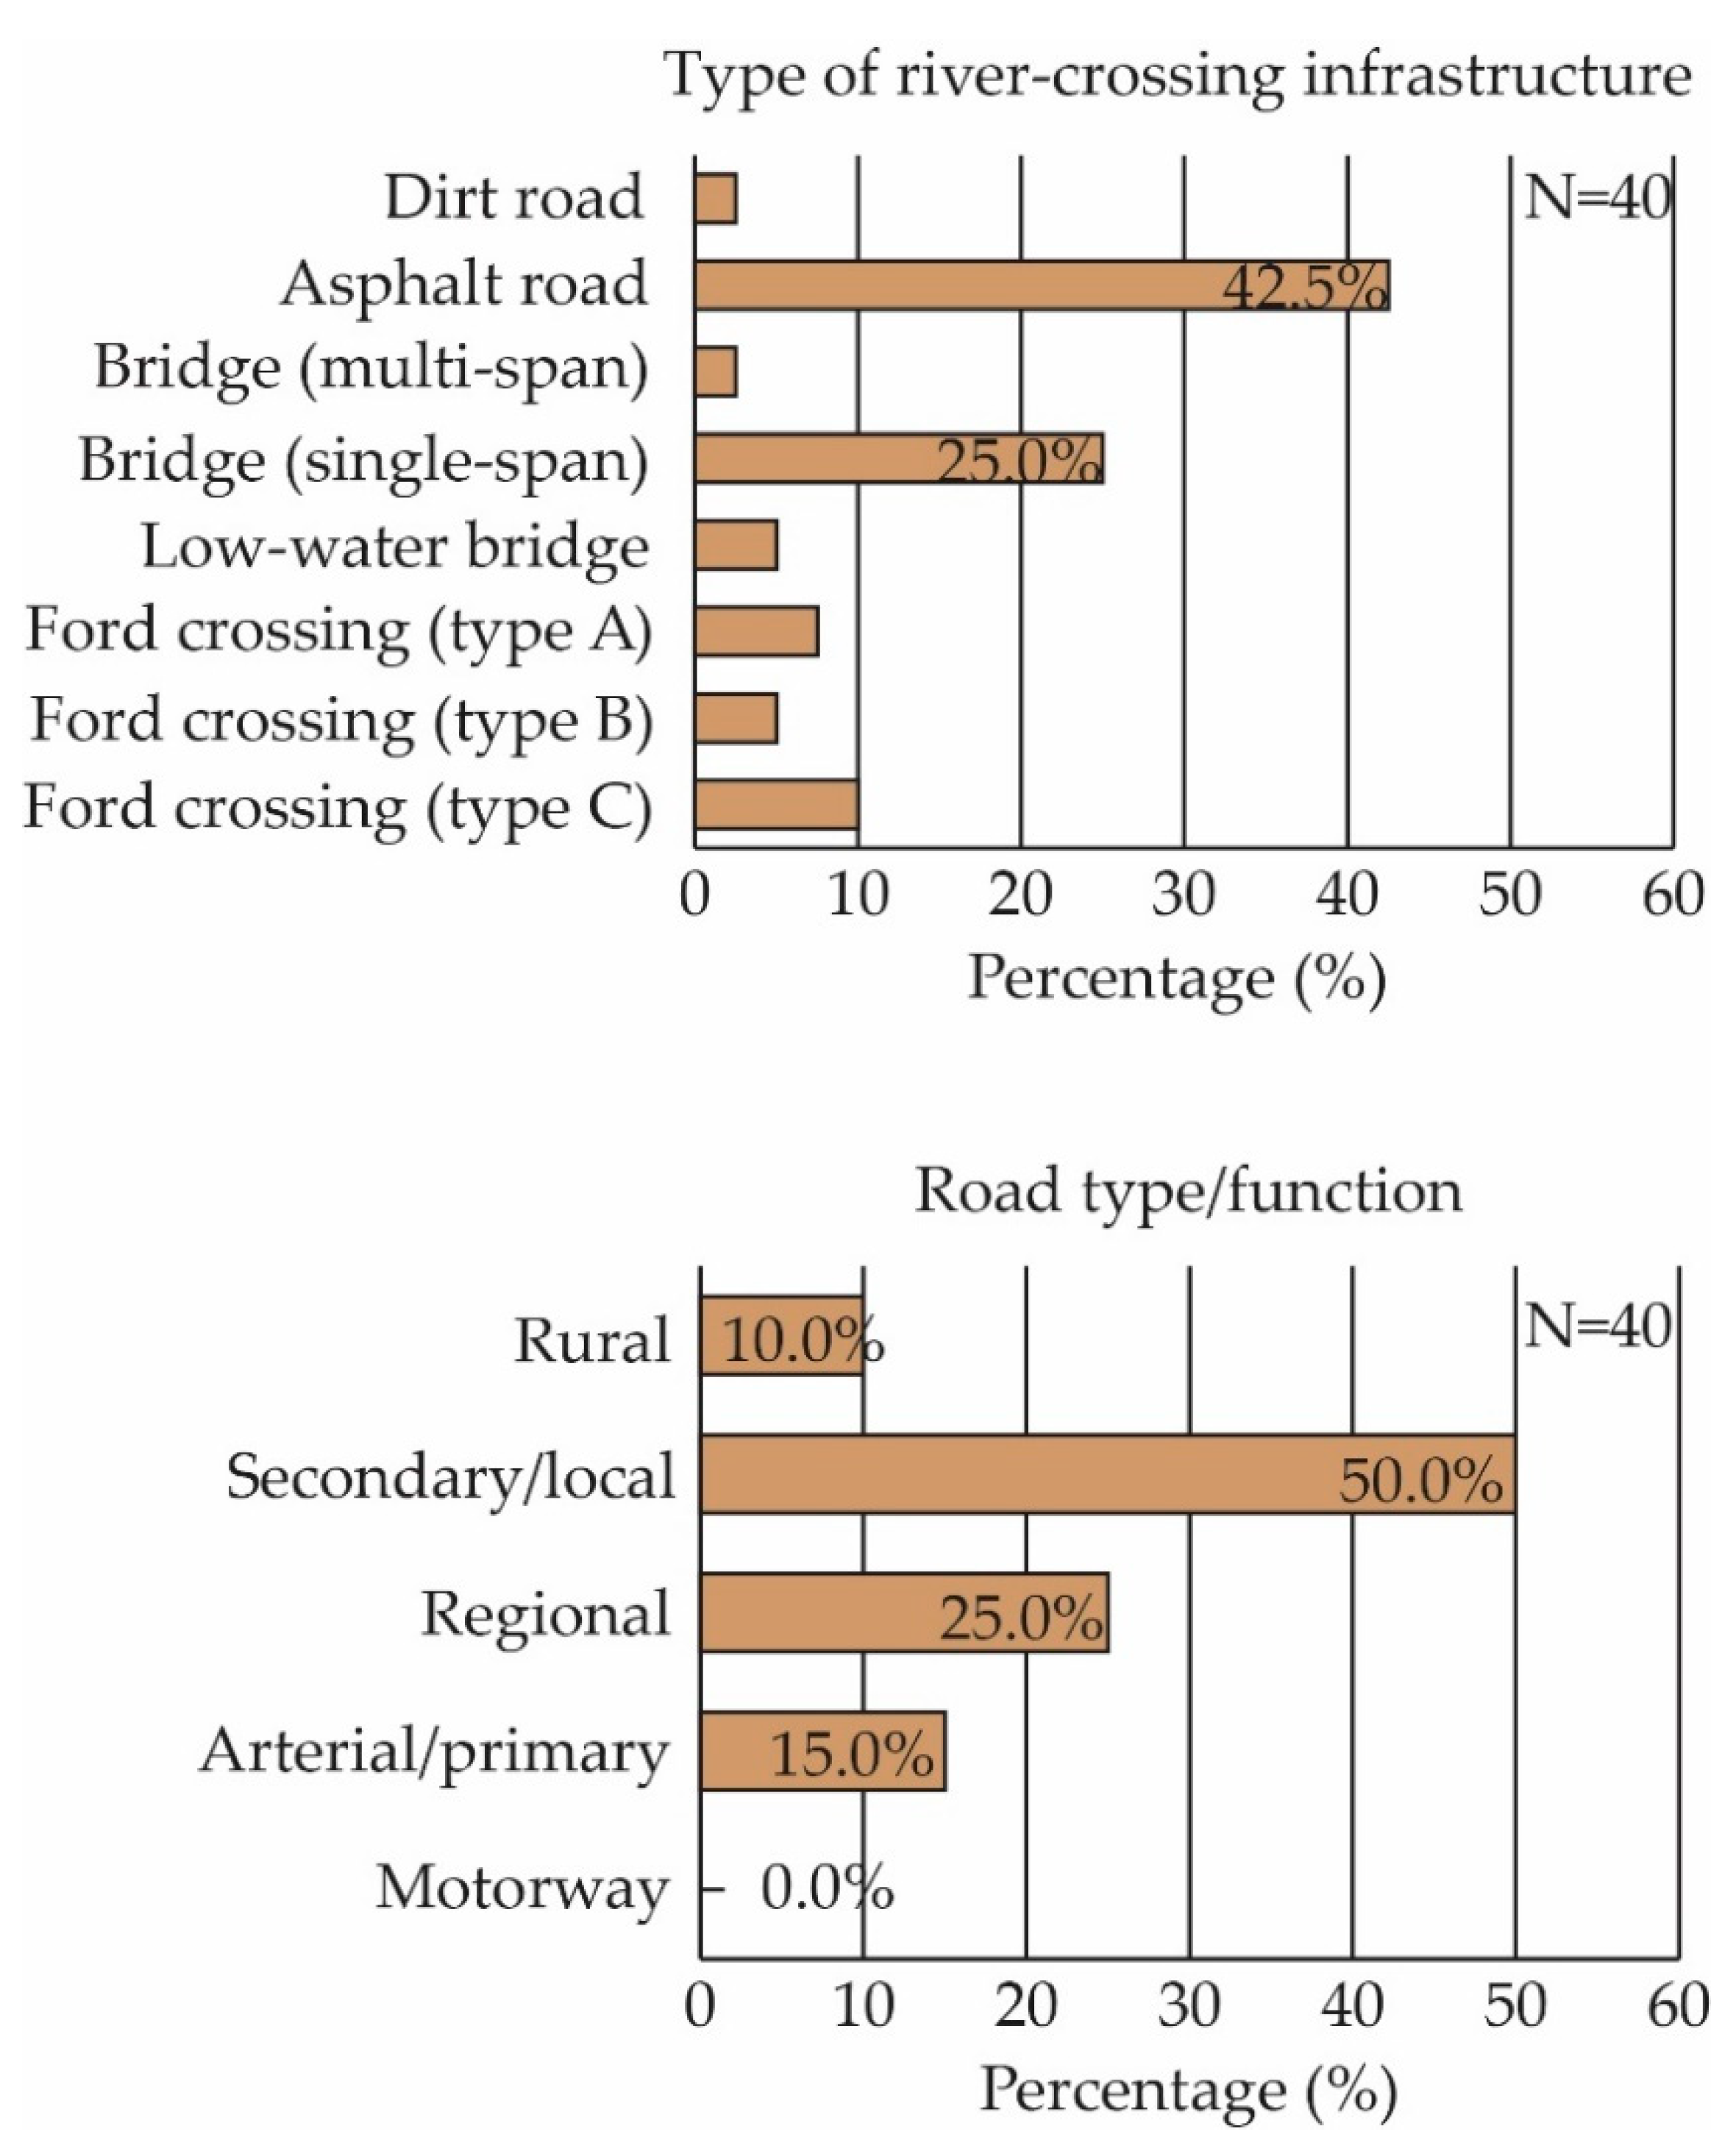
With regard to the road function, we found that the majority of roads cases was on secondary/local roads (50%), followed by regional roads (25%), arterial/primary roads (15%) and rural roads (10%) (Figure 7).
With respect to the type of river-crossing infrastructure used by the vehicle occupants, we found that the higher percentage of incidents occurred in asphalt roads near or next to a watercourse (42.5%), followed by single span bridges (25%), various ford crossings (22.5%) and other types (Figure 7).
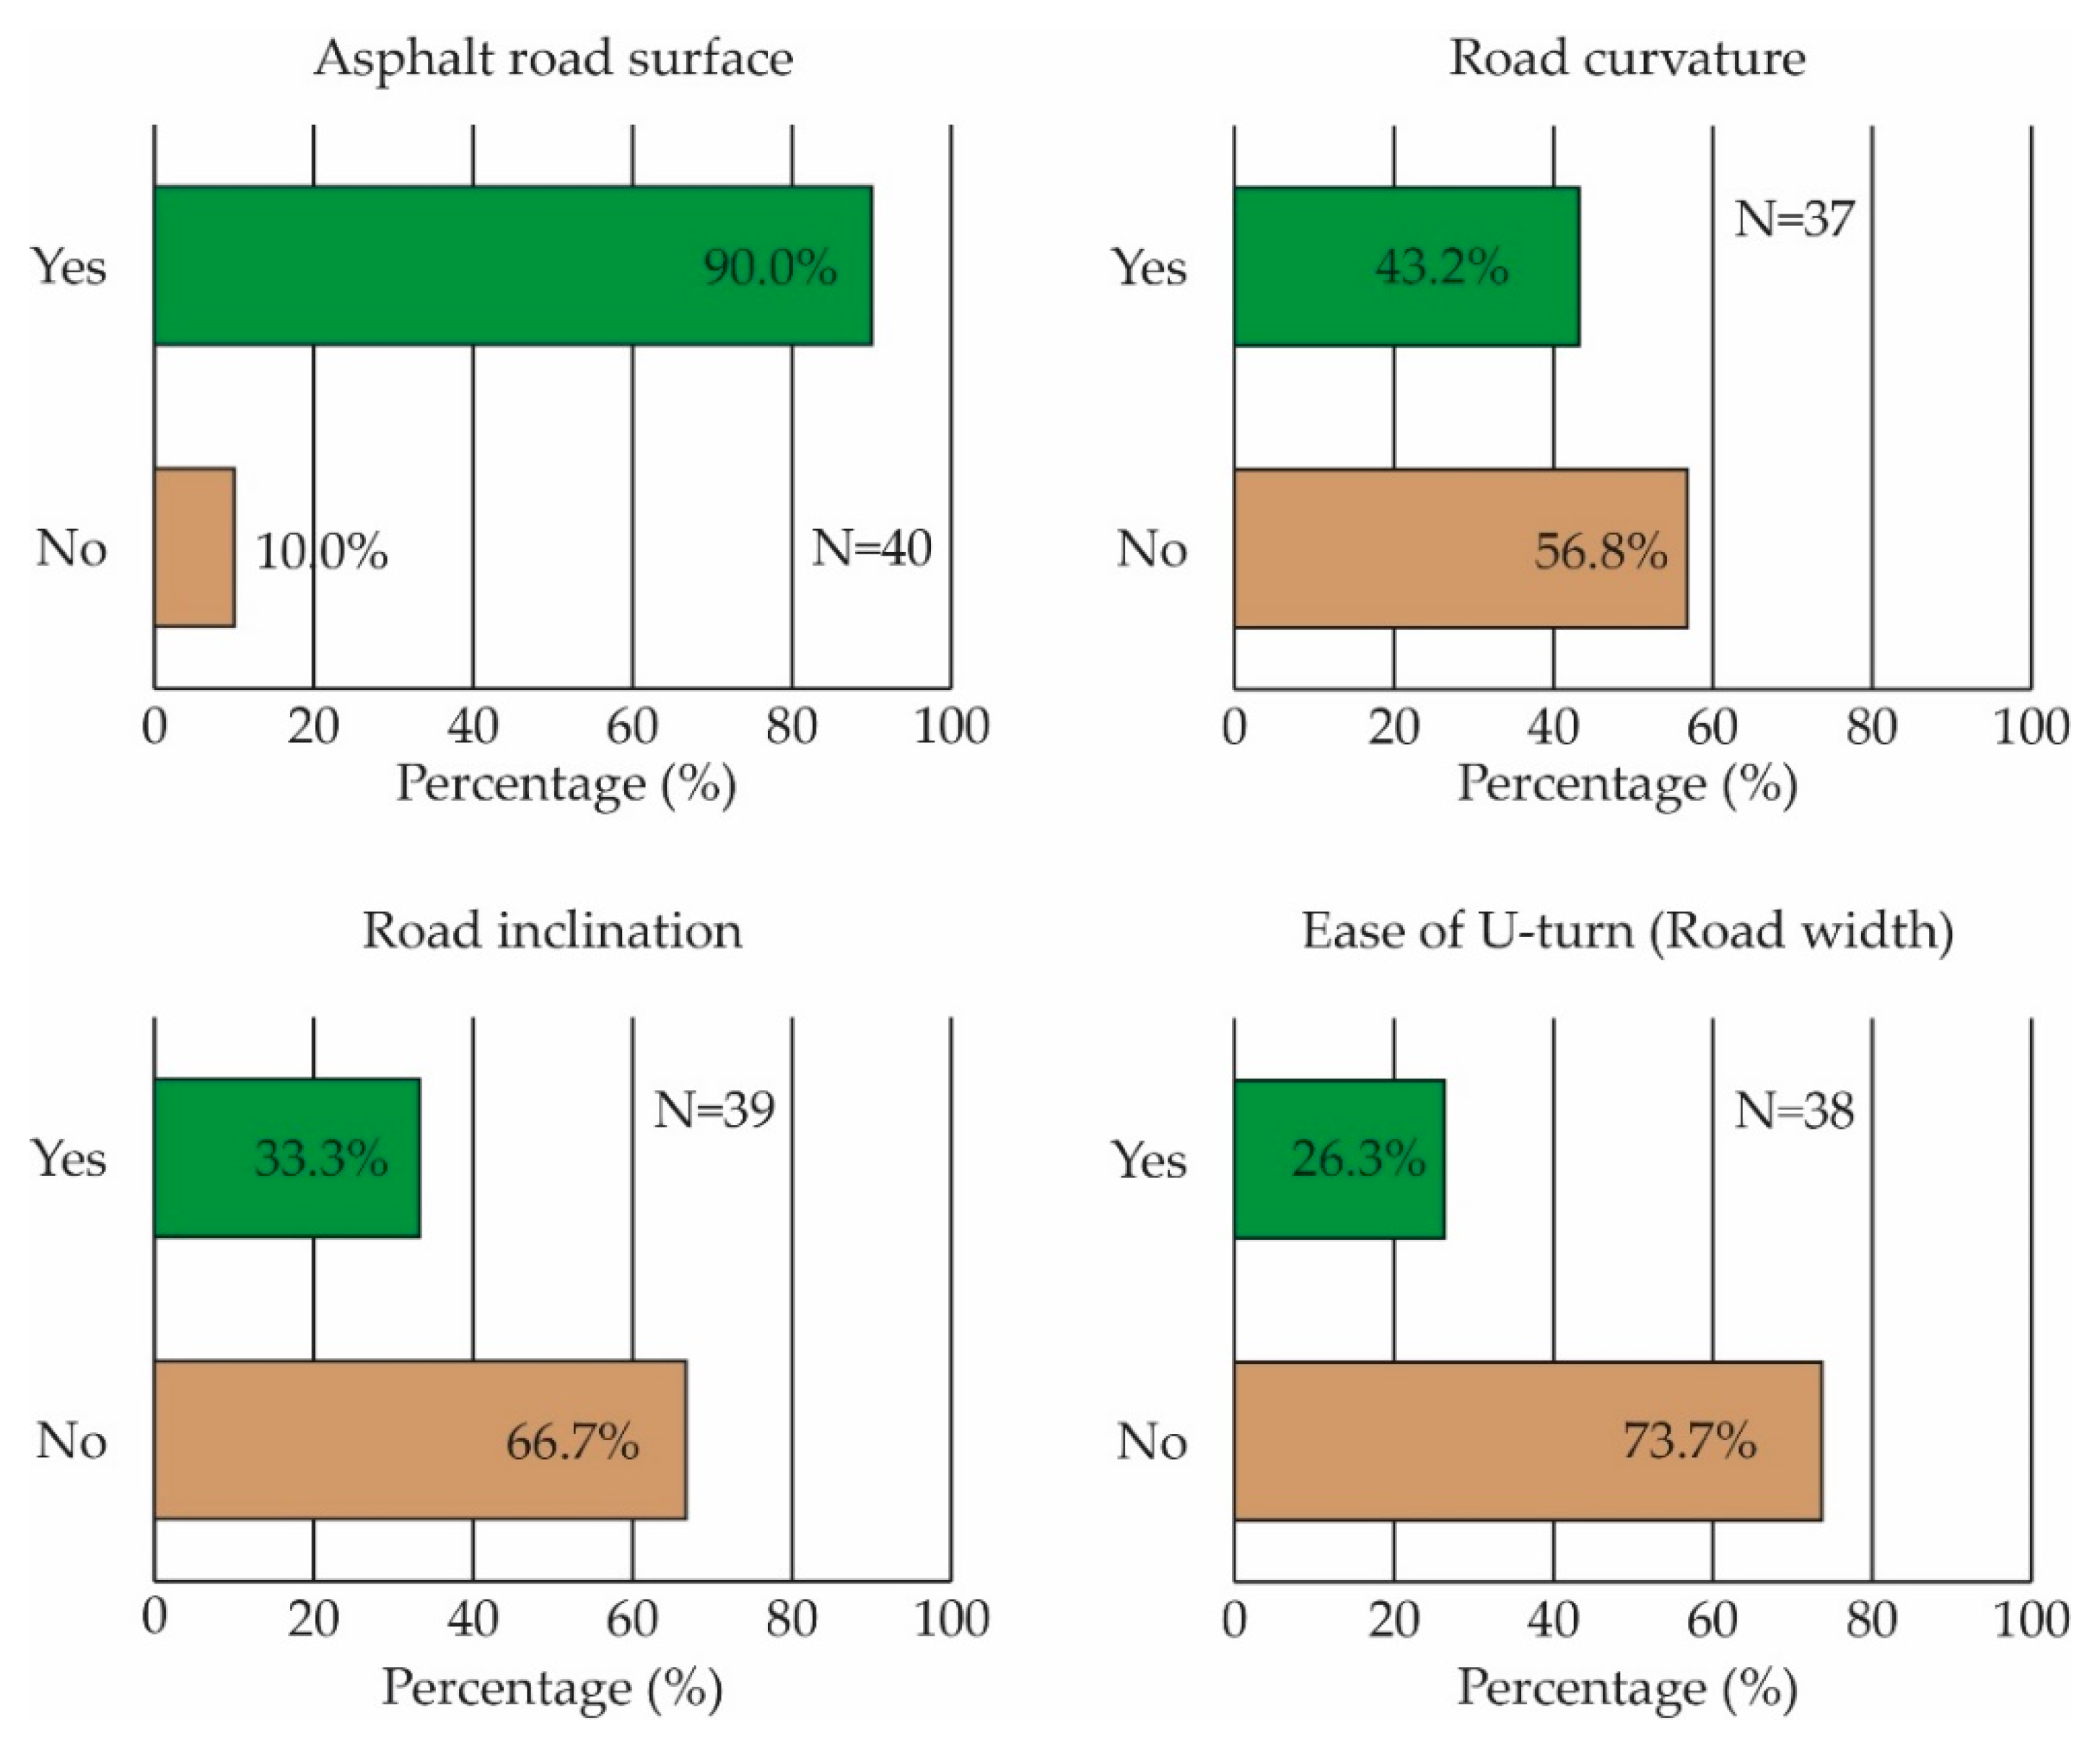
With regard to specific road characteristics, the majority of cases concerned paved road segments, a noteworthy percentage of which had some curvature (43.2%) and some positive or negative inclination (33.3%) immediately before or at the exact incident’s location (Figure 8).
Further, we found that incidents occurred in various road widths, ranging from 3.4 to 14.5 m, with an average value of 7.57 m, with 24 out of 40 cases (or 60.0%) being under 8 m and 32 out of 40 (or 80%) being under 10 m in width. These width figures when examined in comparison to the respective vehicle type and length, they indicated a difficulty in reversing the direction of the vehicle (U-turn) to avoid the flooded roadway. In detail, we assumed that mid-sized passenger cars and SUVs had an average length of 5 m, whereas pickup trucks, tractors and larger trucks had lengths of 7, 8 and >10 m respectively.
Based on this assumption, we estimated that to facilitate a U-turn, the road surface should have a width of at least 8 m for a passenger car or an SUV, 10 m for a pickup truck or a tractor and over 18 m for a larger truck of over 10 m in length. Based on these criteria, we considered fairly easy for drivers in the incidents under study to reverse the direction of travel only in 10 out of 38 cases, while for 28 cases (73.7%), we assessed that it would not be easy (Figure 8). For two cases, the road width was not determined, and thus it was not possible to estimate the ease of U-turn.
4. Discussion
This work studies the conditions of the surrounding environment and the infrastructure characteristics of locations, where flood-related fatal incidents occurred in Greece in an effort to improve our knowledge on their influence in these tragic accidents. The work focuses on 40 incidents for which detailed data and descriptions are available.
The results showed several deficiencies in terms of warning signs, road closures and lighting installations in the locations where the fatal incidents occurred, indicating that the victims did not have adequate warning(s) for the threat in their path, except possibly from the environmental cues (i.e., the inundated road surface). The very high percentage of temporary road closures can be attributed apart from other causes to the short timeframe in which flash floods manifest, which can be challenging for authorities to act, especially in remote areas.
The same pattern appears with respect to structural characteristics of the infrastructure, which could benefit the safety of users. In the majority of cases concrete curbs, sewerage, guttering, road-limit markers and roadside barriers that could hold the vehicle on the road [36] or could help the driver avoid departing from it, were absent. These findings support the conclusions of previous works [24], which identified this absence as a factor of risk. Furthermore, the broader geometry of the road could have also influence the incidents with high inclination, curvature [40] as well as a difficulty in turning around due to the narrow width, which did not help drivers change their course in many instances.
In the majority of cases the road segment in which the incidents occurred were paved with asphalt either situated beside the river within the floodplain or crossing the river through a ford or a bridge. This result supports previous findings in the field [41], highlighting the risky nature of ford crossings and road segments situated next to the watercourse.
With respect to alternate route choices, it should be noted that the majority of incidents occurred in isolated roads, where the driver did not have an easy deviation to follow, even assuming that they knew the area. In only seven cases, the additional route of the shortest deviation calculated was under 1 km of distance and in only 11 within a mile, a distance, which Coles [42] acknowledged as within the drivers’ stated detour tolerance. At least in 50% of incidents (for which there is information on the destination of the victims), this was not the case, as the occupants had to travel more than a mile (10 of them more than 10 km) to reach their destination and in two cases there was no alternate route.
Overall, it can be concluded that, in a large percentage of cases, the drivers had poor choices when it came to alternate routes, even assuming that they knew the area. This finding is possibly connected with the abundance of vehicle-related flood deaths in rural areas, acknowledged by previous works [25,42]. Coles [42] suggests that when available alternate routes add a significant burden of travel time or distance to the planned itinerary, this can be a factor for deciding to drive into floodwaters.
The same theme indicating a remoteness or isolation of the incident location is reflected also in communication problems reported at least in a relatively high percentage of cases (30%) given that Greece has a very high coverage in terms of cellphone network. The lack of bystanders or other cars in the majority of cases (60%) supports also the aforementioned concept. Given the influence exerted by the actions of other individuals in the behavior of the persons under study [21], the absence of other people in the majority of cases could have played multiple roles, including the lack of a helping hand, a lack of warning from another person or an effect of his/her actions in relation to the flood threat.
Collectively, these findings support the conclusions of Vinet [43] and Diakakis et al. [25] who suggested that indoor flood fatalities are more abundant in urban areas, whereas vehicle-related fatalities showed a much lower percentage inside the urban fabric despite the abundance of vehicles. Easy alternative routes, higher quality infrastructure, stronger environmental cues and others may contribute to this pattern based on the findings of the present study.
Taking into account the number of cases that occurred at night (62.5%), the incidents where the inundated area was more than 20 m in length (50%) and the cases in which there was some obstruction (e.g., vegetation) in the driver’s field of vision, it is possible that visibility conditions had an influence in the studied accidents, in terms of hampering the appreciation of circumstances. It is possible that, for a number of cases, the driver could not see the end of the water surface and could not assess the difficulty of crossing the inundated area under these conditions.
The slight overrepresentation of larger vehicles could be attributed to a different perception of the drivers regarding their capabilities in crossing water (evidence of which was presented by Coles and Hirschboeck [21]). Another explanation could be a difficulty of larger vehicles in changing courses. For example, at least one motorist that survived the flood of Mandra 2017 in Greece, stated that it was impossible to make a U-turn with his truck due to the narrow width of the road despite their intention (described by Diakakis et al. [25]—personal communication). However, further research is considered important using a more extensive sample to confirm the statistical significance of this pattern.
Larger roads (e.g., motorways) with large scale crossings (e.g., multi-span bridges) did not record a significant number of flood-related fatal incidents. On the contrary, secondary, rural roads, outside the urban environment with ford crossings (improved or not), with a variety of design flaws or deficiencies were the most typical type of location where these incidents occur. The results support previous findings connecting the road characteristics and condition to extreme weather-related incidents [32].
With respect to geo-environmental surroundings, the incidents tend to occur mostly in dry areas with ephemeral flow and in small, high-inclination liable-to-flash-flood catchments. This lack of permanent flow, together with the remoteness of the sites could be related to the absence of more sophisticated infrastructure.
Overall, collectively, the findings show that fatal vehicle-related flood incidents tend to occur in small roads and remote or isolated sites with neglected or inadequately designed infrastructure (i.e., river crossings), with deficiencies that tend to downgrade safety for vehicle occupants. Deficiencies were found both in signage and in the geometrical attributes of the road, and the lack of easy alternate routes, bystanders and active warnings is noteworthy.
These conclusions lead to certain practical implications deriving from the examined sample. Primarily, this is a strong indication that the actual characteristics of the infrastructure involved have an influence in creating the high-risk situations in which individuals may lose their lives or get injured. Secondly, this indicates that improving certain aspects of the existing infrastructure or building new infrastructure has the potential to lower the level of risk in certain locations. The improved understanding of risk-prone road segments highlighted in the present study allows prioritization when it comes to risk reduction efforts, especially infrastructure amendment plans.
Interventions on improving infrastructure at high-risk locations are an important step towards increasing road safety from flood threats. However, such interventions should be prioritized especially when there are design deficiencies, no easy alternative routes and low quality river crossings (e.g., fords). Although for practical and economic reasons it is not feasible to develop large scale infrastructure everywhere, an important added value lies in setting priorities with respect to improving the safety of road segments against flood risks.
Primarily, the use of warning signs could help vehicle occupants to translate the environmental cues of a real threat and personalize the risk to themselves—an intervention that has the potential to affect their behavior and choices [44]. Although this is considered a positive step [21], it is expected to be more effective if the signs are active, including color coding, lights and electronic messaging [45]. Automatic barriers for road closures are also recommended over manually-placed road blocks to deal with the challenge of short timeframe within which authorities have to act.
With regard to water drainage design, it has to be noted that flood flows often exceed, by a significant amount, the capacity of road dewatering culverts. However, a properly designed drainage has the potential to improve the conditions on the road surface (e.g., reduce inundation depth) and, therefore, is recommended. To this end, establishing and following related construction standards, in all parts of the road (especially the high-risk segments) is also recommended.
Furthermore, it is considered important that apart from negating the access to the drivers, to provide an alternate solution to complete their route. The knowledge of alternate itineraries can be a factor that convinces vehicle occupants to switch routes [42] and it is important to note that normally this information is not included in warning signs [20].
Considering the evidence presenting in previous works, indicating that drivers can ignore and bypass such measures [45], simply negating the access to drivers may not be enough. Information on alternative routes has the potential to be useful addition in these locations [20,21]. Moreover, given the importance of environmental cues on drivers’ perception [28], it is important to highlight them through special depth markers, active sings and color coding, to facilitate drivers fully appreciate the floodwaters characteristics.
In addition, it is important to educate and train drivers in identifying these high-risk locations and situations using cues from the environmental surroundings highlighted in special training programs. Training through simulating real situations has the potential to help drivers mentally retrieve the desired behavior, when they face a real dangerous situation [26,46,47]. Awareness campaigns similar to “Turn around don’t drown” could include elements of identifying a high-risk infrastructure.
With respect to limitations it has to be noted that this study used a limited sample due to data availability, encompassing different locations and terrain. However, it would be beneficial for the continuation of this research to extend the examined incidents outside the borders of Greece for two reasons. First, it would be interesting to examine similar cases outside the Mediterranean region where flash floods are most common type of hazard to assemble a larger data pool of vehicle-related flood incidents. Accidents occurring in flood and extreme weather-related situations in larger basins hit by slower-onset riverine floods could have different characteristics and would be interesting to explore.
Cross-border comparisons between different driver training programs, different traffic and road safety rules and different risk mitigation initiatives or policies would also benefit the understanding of mortality factors. In addition, diverse infrastructure typology would be also a useful addition in this line of research, as it would benefit generalization of the findings. Moreover, assemblage of data from more incidents, as well as data from non-fatal ones may allow future research to proceed further from descriptive statistics into examination of statistical associations between infrastructure characteristics and risk that are currently not feasible.
Furthermore, it has to be noted that additional factors unrelated to infrastructure, such as the drivers’ training, behavior and travel preparation may have affected the outcome of their contact with floodwaters. In particular, behaviors such as checking weather information or preparing alternate routes could be very influential in the cases studied. Although such data were not analyzed in the present study, it would be useful to incorporate them in future research. Furthermore, an additional limitation concerns the fact that floodwater physical attributes, including depth and velocity, were not analyzed in this study despite their importance in vehicle stability due to the lack of data.
5. Conclusions
Vehicle-related fatalities during floods and extreme weather were recorded in the recent decades around the globe and are considered a persistent and likely rising problem. Even though there are numerous studies on flood fatalities, there is very limited research on how the immediate surroundings, the infrastructure used by the vehicles occupants or elements of it contribute or are associated with dangerous situations.
In the present work, we studied 40 incidents of vehicle-related flood deaths to provide a better understanding on the typology of the infrastructure involved in such incidents and its most common characteristics. The assembled data constitute an additional piece of the global pool of knowledge on the subject, which presently remains limited. The findings show that in the majority of cases of fatal incidents occur in rural areas and in small, narrow, paved roads with low circulation. The road segments in question are crossing watercourses or situated near ephemeral streams draining small high-inclination catchments liable to flash floods.
Most of the sites are remote or isolated with no easy alternative routes, a lack of bystanders and other cars as well as difficulties in executing U-turn maneuvers. The vehicle occupants in the majority of cases use infrastructure with design deficiencies, including poor signage and lighting, poor design in terms of drainage, roadside barriers, road-limit and depth markers and others. In terms of geometry, high percentages of high inclination, curvature and narrow width were identified as well.
Overall, the findings presented in this study highlight the profile of risk-prone segments of the road network in areas subject to flash flooding, allowing prioritization of interventions to improve safety, including technical amendments, road closures and driver training initiatives. Interventions based on the present findings should focus on low-quality infrastructure, remote areas with no easy alternate routes and those with a lack of good signage.
Funding
This research received no external funding.
Institutional Review Board Statement
Not applicable.
Informed Consent Statement
Not applicable.
Data Availability Statement
The data presented in this study are available on request.
Conflicts of Interest
The authors declare no conflict of interest.
References
- Munich Re. Risks from Floods, Storm Surges and Flash Floods. Underestimated Natural Hazard; Munich Re: Munich, Germany, 2020. [Google Scholar]
- Hapuarachchi, H.A.P.; Wang, Q.J.; Pagano, T.C. A review of advances in flash flood forecasting. Hydrol. Process. 2011, 25, 2771–2784. [Google Scholar] [CrossRef]
- Emerton, R.E.; Stephens, E.M.; Pappenberger, F.; Pagano, T.C.; Weerts, A.H.; Wood, A.W.; Salamon, P.; Brown, J.D.; Hjerdt, N.; Donnelly, C.; et al. Continental and global scale flood forecasting systems. Wiley Interdiscip. Rev. Water 2016, 3, 391–418. [Google Scholar] [CrossRef] [Green Version]
- Wang, Y. Advances in remote sensing of flooding. Water 2015, 7, 6404–6410. [Google Scholar] [CrossRef]
- Perks, M.T.; Russell, A.J.; Large, A.R.G. Technical note: Advances in flash flood monitoring using unmanned aerial vehicles (UAVs). Hydrol. Earth Syst. Sci. 2016, 20, 4005–4015. [Google Scholar] [CrossRef] [Green Version]
- Cornwall, W. Europe’s deadly floods leave scientists stunned. Science 2021, 373, 372–373. [Google Scholar] [CrossRef] [PubMed]
- Kotlyakov, V.M.; Desinov, L.V.; Dolgov, S.V.; Koronkevich, N.I.; Likhacheva, E.A.; Makkaveev, A.N.; Medvedev, A.A.; Rudakov, V.A. Flooding of July 6–7, 2012, in the town of Krymsk. Reg. Res. Russ. 2013, 3, 32–39. [Google Scholar] [CrossRef]
- Coates, L. Flood fatalities in Australia, 1788–1996. Aust. Geogr. 1999, 30, 391–408. [Google Scholar] [CrossRef]
- Trigo, R.M.; Ramos, C.; Pereira, S.S.; Ramos, A.M.; Zêzere, J.L.; Liberato, M.L.R. The deadliest storm of the 20th century striking Portugal: Flood impacts and atmospheric circulation. J. Hydrol. 2015, 541, 597–610. [Google Scholar] [CrossRef]
- Ashley, S.T.; Ashley, W.S. Flood fatalities in the United States. J. Appl. Meteorol. Climatol. 2008, 47, 805–818. [Google Scholar] [CrossRef]
- Terti, G.; Ruin, I.; Anquetin, S.; Gourley, J.J. A situation-based analysis of flash flood fatalities in the United States. Bull. Am. Meteorol. Soc. 2017, 98, 333–345. [Google Scholar] [CrossRef]
- Fitzgerald, G.; Du, W.; Jamal, A.; Clark, M.; Hou, X. Flood fatalities in contemporary Australia (1997–2008). Emerg. Med. Australas. 2010, 22, 180–186. [Google Scholar] [CrossRef] [PubMed]
- Haynes, K.; Coates, L.; van den Honert, R.; Gissing, A.; Bird, D.; Dimer de Oliveira, F.; D’Arcy, R.; Smith, C.; Radford, D. Exploring the circumstances surrounding flood fatalities in Australia—1900–2015 and the implications for policy and practice. Environ. Sci. Policy 2017, 76, 165–176. [Google Scholar] [CrossRef]
- Salvati, P.; Petrucci, O.; Rossi, M.; Bianchi, C.; Pasqua, A.A.; Guzzetti, F. Science of the Total Environment Gender, age and circumstances analysis of flood and landslide fatalities in Italy. Sci. Total Environ. 2018, 610–611, 867–879. [Google Scholar] [CrossRef] [PubMed]
- Petrucci, O.; Papagiannaki, K.; Aceto, L.; Boissier, L.; Kotroni, V.; Grimalt, M.; Llasat, M.C.; Llasat-Botija, M.; Rosselló, J.; Pasqua, A.A.; et al. MEFF: The database of MEditerranean Flood Fatalities (1980 to 2015). J. Flood Risk Manag. 2019, 12, e12461. [Google Scholar] [CrossRef] [Green Version]
- Diakakis, M.; Deligiannakis, G. Flood fatalities in Greece: 1970–2010. J. Flood Risk Manag. 2017, 10, 115–123. [Google Scholar] [CrossRef]
- Diakakis, M. Have flood mortality qualitative characteristics changed during the last decades? The case study of Greece. Environ. Hazards 2016, 15, 148–159. [Google Scholar] [CrossRef]
- Becker, J.S.; Taylor, H.L.; Doody, B.J.; Wright, K.C.; Gruntfest, E.; Webber, D. A review of people’s behavior in and around floodwater. Weather. Clim. Soc. 2015, 7, 321–332. [Google Scholar] [CrossRef]
- Pearson, M.; Hamilton, K. Investigating driver willingness to drive through flooded waterways. Accid. Anal. Prev. 2014, 72, 382–390. [Google Scholar] [CrossRef] [Green Version]
- Hamilton, K.; Price, S.; Keech, J.J.; Peden, A.E.; Hagger, M.S. Drivers’ experiences during floods: Investigating the psychological influences underpinning decisions to avoid driving through floodwater. Int. J. Disaster Risk Reduct. 2018, 28, 507–518. [Google Scholar] [CrossRef] [Green Version]
- Coles, A.R.; Hirschboeck, K.K. Driving into danger: Perception and communication of flash-flood risk. Weather. Clim. Soc. 2020, 12, 387–404. [Google Scholar] [CrossRef] [Green Version]
- Jonkman, S.N.; Kelman, I.; Road, S.N.J.; Deputy, I.K. An analysis of the causes and circumstances of flood disaster deaths. Disasters 2005, 29, 75–97. [Google Scholar] [CrossRef] [PubMed]
- Brunkard, J.; Namulanda, G.; Ratard, R. Hurricane katrina deaths, Louisiana, 2005. Disaster Med. Public Health Preparedness 2008, 2, 215–223. [Google Scholar] [CrossRef] [Green Version]
- Stjernbrandt, A.; Öström, M.; Eriksson, A.; Björnstig, U. Land motor vehicle-related drownings in Sweden. Traffic Inj. Prev. 2008, 9, 539–543. [Google Scholar] [CrossRef] [PubMed]
- Diakakis, M.; Deligiannakis, G.; Andreadakis, E.; Katsetsiadou, K.N.; Spyrou, N.I.; Gogou, M.E. How different surrounding environments influence the characteristics of flash flood-mortality: The case of the 2017 extreme flood in Mandra, Greece. J. Flood Risk Manag. 2020, 13, 311–323. [Google Scholar] [CrossRef]
- Ahmed, M.A.; Haynes, K.; Tofa, M.; Hope, G.; Taylor, M. Duty or safety? Exploring emergency service personnel’s perceptions of risk and decision- making when driving through floodwater. Prog. Disaster Sci. 2020, 5, 100068. [Google Scholar] [CrossRef]
- Terti, G.; Ruin, I.; Anquetin, S.; Gourley, J.J. Vulnerability Situations Associated with Flash Flood Casualties in the United States. In Proceedings of the American Geophysical Union Fall Meeting, San Fransisco, CA, USA, 14–18 December 2015. [Google Scholar]
- Papagiannaki, K.; Diakakis, M.; Kotroni, V.; Lagouvardos, K.; Papagiannakis, G. The role of water depth perception in shaping car drivers’ intention to enter floodwaters: Experimental evidence. Sustainability 2021, 13, 4451. [Google Scholar] [CrossRef]
- Berdica, K. An introduction to road vulnerability: What has been done, is done and should be done. Transp. Policy 2002, 9, 117–127. [Google Scholar] [CrossRef]
- Jenelius, E.; Petersen, T.; Mattsson, L.G. Importance and exposure in road network vulnerability analysis. Transp. Res. Part A Policy Pract. 2006, 40, 537–560. [Google Scholar] [CrossRef]
- Versini, P.A.; Gaume, E.; Andrieu, H. Assessment of the susceptibility of roads to flooding based on geographical information—Test in a flash flood prone area (the Gard region, France). Nat. Hazards Earth Syst. Sci. 2010, 10, 793–803. [Google Scholar] [CrossRef] [Green Version]
- Koetse, M.J.; Rietveld, P. The impact of climate change and weather on transport: An overview of empirical findings. Transp. Res. Part D Transp. Environ. 2009, 14, 205–221. [Google Scholar] [CrossRef]
- Debionne, S.; Ruin, I.; Shabou, S.; Lutoff, C.; Creutin, J.D. Assessment of commuters’ daily exposure to flash flooding over the roads of the Gard region, France. J. Hydrol. 2016, 541, 636–648. [Google Scholar] [CrossRef]
- Shabou, S.; Ruin, I.; Lutoff, C.; Debionne, S.; Anquetin, S.; Creutin, J.D.; Beaufils, X. MobRISK: A model for assessing the exposure of road users to flash flood events. Nat. Hazards Earth Syst. Sci. 2017, 17, 1631–1651. [Google Scholar] [CrossRef] [Green Version]
- Ruin, I.; Gaillard, J.C.; Lutoff, C. How to get there? Assessing motorists’ flash flood risk perception on daily itineraries. Environ. Hazards 2007, 7, 235–244. [Google Scholar] [CrossRef]
- Gissing, A.; Opper, S.; Tofa, M.; Coates, L.; McAneney, J. Influence of road characteristics on flood fatalities in Australia. Environ. Hazards 2019, 18, 434–445. [Google Scholar] [CrossRef] [Green Version]
- Gissing, A.; Haynes, K.; Coates, L.; Keys, C. Motorist behaviour during the 2015 Shoalhaven floods. Aust. J. Emerg. Manag. 2016, 31, 25–31. [Google Scholar]
- Anguelov, D.; Dulong, C.; Filip, D.; Frueh, C.; Lafon, S.; Lyon, R.; Ogale, A.; Vincent, L.; Weaver, J. Google street view: Capturing the world at street level. Computer Long. Beach. Calif. 2010, 43, 32–38. [Google Scholar] [CrossRef]
- ELSTAT. Motor Vehicles in Operation, by Category and Use: 2000–2020; ELSTAT: Athens, Greece, 2021. [Google Scholar]
- Othman, S.; Thomson, R. Influence Of Road Characteristics On Traffic Safety. In Proceedings of the 21st International Technical Conference on the Enhanced Safety of Vehicles, Stuttgart, Germany, 15–18 June 2009; pp. 1–10. Available online: http://www-nrd.nhtsa.dot.gov/pdf/nrd-01/esv/esv20/07-0064-O.pdf (accessed on 15 January 2022).
- Diakakis, M.; Deligiannakis, G. Vehicle-related flood fatalities in Greece. Environ. Hazards 2013, 12, 278–290. [Google Scholar] [CrossRef]
- Coles, A.R. Identification and evaluation of flood-avoidance routes in Tucson, Arizona. Int. J. Disaster Risk Reduct. 2020, 48, 101597. [Google Scholar] [CrossRef]
- Vinet, F.; Lumbroso, D.; Defossez, S.; Boissier, L. A comparative analysis of the loss of life during two recent floods in France: The sea surge caused by the storm Xynthia and the flash flood in Var. Nat. Hazards 2012, 61, 1179–1201. [Google Scholar] [CrossRef]
- Hamilton, K.; Peden, A.E.; Keech, J.J.; Hagger, M.S. Changing people’s attitudes and beliefs toward driving through floodwaters: Evaluation of a video infographic. Transp. Res. Part F Traffic Psychol. Behav. 2018, 53, 50–60. [Google Scholar] [CrossRef]
- Sharif, H.O.; Hossain, M.; Jackson, T.; Bin-, S. Person-place-time analysis of vehicle fatalities caused by flash floods in Texas. Geomat. Nat. Hazards Risk 2012, 3, 311–323. [Google Scholar] [CrossRef] [Green Version]
- Hagger, M.S.; Lonsdale, A.; Koka, A.; Hein, V.; Pasi, H.; Lintunen, T.; Chatzisarantis, N.L.D. An intervention to reduce alcohol consumption in undergraduate students using implementation intentions and mental simulations: A cross-national study. Int. J. Behav. Med. 2012, 19, 82–96. [Google Scholar] [CrossRef] [PubMed]
- Cook, C.; Munguia, P. Sensory cues associated with host detection in a marine parasitic isopod. Mar. Biol. 2013, 160, 867–875. [Google Scholar] [CrossRef]
Figure 1.
Structure of the database in three modules and the elements included.

Figure 2.
Typical examples of infrastructure in locations where people lost their lives, including (a) an unimproved ford crossing, (b) an improved but unvented ford crossing, (c) an asphalt road beside a river channel, (d) a low water bridge, (e) a single-span bride and (f) a collapsed multi-span bridge. The dashed lines and the arrows denote the approximate maximum extent of the inundated area during the event under study and the direction of flow, respectively. All the locations shown were included in the present study.

Figure 3.
Map of the locations of the studied fatal incidents across Greece.

Figure 4.
Distribution of studied cases per vehicle type.

Figure 5.
Distribution of cases with respect to signage and lighting.

Figure 6.
Distribution of cases with respect to road installations.

Figure 7.
Distribution of cases with respect to road function and road type. Please note that ford crossings are divided in vented with box culverts (Type A), unvented with improved surface (type B) and unvented without an improved surface (type C).
Figure 7.
Distribution of cases with respect to road function and road type. Please note that ford crossings are divided in vented with box culverts (Type A), unvented with improved surface (type B) and unvented without an improved surface (type C).

Figure 8.
Distribution of cases with respect to road geometry characteristics.


Table 1.
Sources of flood fatality information (1960–2020), with details of the type of information provided by each source.
Table 1.
Sources of flood fatality information (1960–2020), with details of the type of information provided by each source.
| Source | Data Form and Details |
|---|---|
| Greek Fire Service | Incident bulletin, incident reports, sketches and press releases that contained an account of the incidents, diagrams and images of the locations |
| Hellenic Police | Incident reports that contained detailed account of the incidents, imagery, sketches, location information, the timeline of the events, eyewitnesses accounts as well as details on the victims and the survivors. |
| Scientific publications | General descriptive incident accounts of the incidents with details on the conditions under which the incidents occurred |
| Articles in the press | More than 250 articles in 12 national newspapers and numerous videos from internet and TV news outlets Detailed accounts of the incidents, containing location information, visual material, sometimes accompanied by eyewitness accounts |
| Field survey | Collection of images from field survey of the locations and infrastructure where the incidents occurred |
| Google Street View [38] | Collection of street-level images of the locations and infrastructure where the incidents occurred |
Publisher’s Note: MDPI stays neutral with regard to jurisdictional claims in published maps and institutional affiliations. |
© 2022 by the author. Licensee MDPI, Basel, Switzerland. This article is an open access article distributed under the terms and conditions of the Creative Commons Attribution (CC BY) license (https://creativecommons.org/licenses/by/4.0/).
Share and Cite
MDPI and ACS Style
Diakakis, M. Characteristics of Infrastructure and Surrounding Geo-Environmental Circumstances Involved in Fatal Incidents Caused by Flash Flooding: Evidence from Greece. Water 2022, 14, 746. https://doi.org/10.3390/w14050746
AMA Style
Diakakis M. Characteristics of Infrastructure and Surrounding Geo-Environmental Circumstances Involved in Fatal Incidents Caused by Flash Flooding: Evidence from Greece. Water. 2022; 14(5):746. https://doi.org/10.3390/w14050746
Chicago/Turabian StyleDiakakis, Michalis. 2022. "Characteristics of Infrastructure and Surrounding Geo-Environmental Circumstances Involved in Fatal Incidents Caused by Flash Flooding: Evidence from Greece" Water 14, no. 5: 746. https://doi.org/10.3390/w14050746
Note that from the first issue of 2016, this journal uses article numbers instead of page numbers. See further details here.