Article

Estimating the Soil Erosion Response to Land-Use Land-Cover Change Using GIS-Based RUSLE and Remote Sensing: A Case Study of Miyun Reservoir, North China

1
Intelligent Forestry Key Laboratory of Haikou City, School of Forestry, Hainan University, Haikou 570228, China
2
Key Laboratory of Genetics and Germplasm Innovation of Tropical Special Forest Trees and Ornamental Plants, Ministry of Education, School of Forestry, Hainan University, Haikou 570228, China
3
Sanya Nanfan Research Institute, Hainan University, Sanya 572022, China
*
Author to whom correspondence should be addressed.
These authors contributed equally to this work.
Water 2022, 14(5), 742; https://doi.org/10.3390/w14050742
Submission received: 10 December 2021 / Revised: 11 February 2022 / Accepted: 23 February 2022 / Published: 25 February 2022
(This article belongs to the Special Issue Remote Sensing Application on Soil Moisture)

Abstract

:
Soil erosion by water is a major cause of land degradation. Agricultural practices and many other ecological environmental problems contribute to land degradation worldwide, especially in arid and semi-arid areas. Miyun County, which is located in a mountainous region of North China, is an important natural ecological zone and surface source of drinking water for Beijing and is very vulnerable to soil erosion due to its thin soil layer and human activities. Landsat images from 2003 and 2013 were used to analyze the land-use and land-cover change (LULCC) over this period. The revised universal soil loss equation (RUSLE) model integrated with Geographic Information System (GIS) was used to quantify soil loss and to map erosion risk. In addition, the response of soil erosion to LULCC was evaluated. The results showed that the areas under cropland, forest, and water bodies increased over the study period by 66.03, 243.44, and 9.01 km2, respectively. The increase in forested land indicated that the improved ground vegetation cover was due to the implementation of active ecological measures. Between 2003 and 2013, light soil erosion increased by 587.46 km2, and extremely severe soil erosion increased by 9.57 km2. The extents of slight, moderate, severe, and very severe soil erosion, however, decreased by 8.02, 445.21, 142.69, and 1.11 km2, respectively. A total of 57.5% of land with moderate soil erosion has been converted to light soil erosion, which could be highly beneficial for the improvement of vegetation control of soil and water losses. In terms of area, forestland exhibited the greatest increase, while moderate soil erosion exhibited the greatest decrease over the study period. Land-use change led to an alteration in the intensity of soil erosion due to changes or loss of vegetation. The conversion from high intensity soil erosion to low intensity was attributed to the implementation of ecological environmental protection. The results generated from this study may be useful for planners and land-use managers to make appropriate decisions for soil conservation.

Graphical Abstract

1. Introduction

Soil erosion is a key problem resulting in the deterioration of the ecological environment and has become a global environmental problem. It leads to soil productivity reduction, flooding, and habitat losses [1], which seriously threaten food security, water resources, biodiversity, and the sustainable development of resources and the environment [2]. Soil erosion is affected by a variety of factors, including LULCC, rainfall, and variations in the catchment surface (terrain, topography, and soil type) [3,4]. However, among those related factors, human activities are the main factors affecting soil erosion [5], primarily through changing the spatial distribution pattern of land-use and land-cover. LULCC, such as land abandonment, deforestation, and afforestation, is one of the most important factors for the occurrence and intensity of soil erosion [6]. It also changes the cover of land use and vegetation, which have very important influences on runoff and soil erosion [2]. It is reported that approximately 75 billion tons of fertile soil are lost from agricultural systems globally each year [7]. Therefore, the impacts of LULCC on soil erosion have attracted considerable attention, and it is very necessary to study soil erosion processes and erosion hazards and define areas with high soil erosion potential as priority areas for conserving the endangered erodible soil [8,9]. Meanwhile, in China, soil erosion is one of the most severe environmental problems, with a total of 3 million km2 eroded by water and wind [4], which equals approximately 32% of the territory of the country [10]. Therefore, monitoring and evaluating soil erosion have become particularly important [2].
Soil erosion risk varies from case to case, depending on the topography of the watershed, soil characteristics, local climatic conditions, land use, and land management practices [11]. Such examples of soil erosion risk assessments are focused on the framework of driving force-pressure-state-impact-response (DPSIR) and ecological-risk-assessment (ERA) [12]. Traditional soil erosion assessments are limited by data quality and model structure [13], especially in predicting soil risks over a large spatial extent (e.g., regional scale) [14], and earlier studies on soil erosion risk heavily focused on current and static soil erosion, paying little attention to future and dynamic losses [15]. On the contrary, the Universal Soil Loss Equation (USLE) and the Revised Universal Soil Loss Equation (RUSLE), as the most popular empirical models, have been developed to estimate soil erosion loss, and they play an important role in the investigation of soil erosion and have been widely applied at watershed and catchment scales [16]. These models estimate the long-term average annual soil loss on hill slopes by multiplying several factors: rainfall-runoff erosivity (R), soil erodibility (K), slope length and steepness (LS), vegetation cover-management (C), and conservation practice (P), usually obtained from filed measurements [17]. Generally, remote sensing (RS) data have been commonly used to develop the vegetation cover-management (C) and conservation practice (P) factors [18], especially for the Landsat TM/ETM/OLI series, with a medium spatial resolution of 30 m. GIS has been used to derive the topographic factor (LS) using data from the digital elevation model (DEM) [19], interpolating data on sample plots, and calculating and mapping soil erosion loss [20]. Many studies have shown that the application of RUSLE model, GIS, and RS has been used to map and assess the regional soil erosion risk at the scale of the watershed level [18]. Therefore, the revised universal soil loss equation (RUSLE) model, combined with remote sensing data and GIS, has been proven to be an effective method to assess and analyze the spatiotemporal distribution of erosion at the scale of the watershed level. However, no study has yet reported at the county scale to analyze the relationships between the LULCC and soil erosion of the Miyun Reservoir.
Many studies have been performed on the impact of land-use changes on hydrology, water quality, and erosion at the watershed scale [21,22]. Other studies have focused on the impact of land-use changes on runoff and sediment connectivity at the watershed scale [23,24]. However, few studies have addressed the combined effects of land use on soil erosion [25,26], especially at the county scale, and the effects of LULCC on soil erosion at the county scale have received little attention. Miyun, a county situated in northeastern Beijing, China, is a very important natural ecological zone as it provides a surface source of drinking water. Moreover, the Miyun Reservoir, which is located in central Miyun County, is the largest reservoir in North China and is the drinking water source for the 14.93 million inhabitants of Beijing. However, the reservoir and its upstream areas are mostly covered by hilly areas that are subject to severe soil erosion [18]. This erosion risk arises from the hilly topography, soil condition that favor water erosion (i.e., fine texture, low organic matter content, and poor plant coverage because of the semi-arid climate), and inappropriate agricultural practices (i.e., excessive soil tillage and cultivation of steep land) [27]. These widespread problems not only affect the safety of Beijing’s drinking water supply, but also threaten the local-scale sustainable management and conservation of agricultural areas [28].
According to Chinese soil taxonomy (the Chinese Soil Taxonomy Research Group, 1995) and research results (the Chinese River Sediment Bulletin, 2006), the Miyun County region suffers from severe soil erosion. It is considered to be a priority area for soil conservation in China in the twenty-first century [18]. Therefore, to improve the quantity and quality of water in the Miyun Reservoir and protect the surface water source of Miyun County, it is necessary to detect the spatiotemporal changes in the LULCC pattern and soil erosion. However, relatively less attention has been paid to this region at the county level in North China.
The objectives of this study were as follows: (1) to develop a methodology that combined remote sensing data and GIS with RUSLE modeling to estimate the spatial distribution of soil erosion and LULCC at the county level, (2) to reveal the significant spatiotemporal change pattern of soil erosion by utilizing the temporal patterns of LULCC of a small watershed (county scale) from 2003 to 2013, and (3) to evaluate the response of soil erosion to the changing pattern of LULCC by applying a transition matrix between LULCC and soil erosion.

2. Materials and Methods
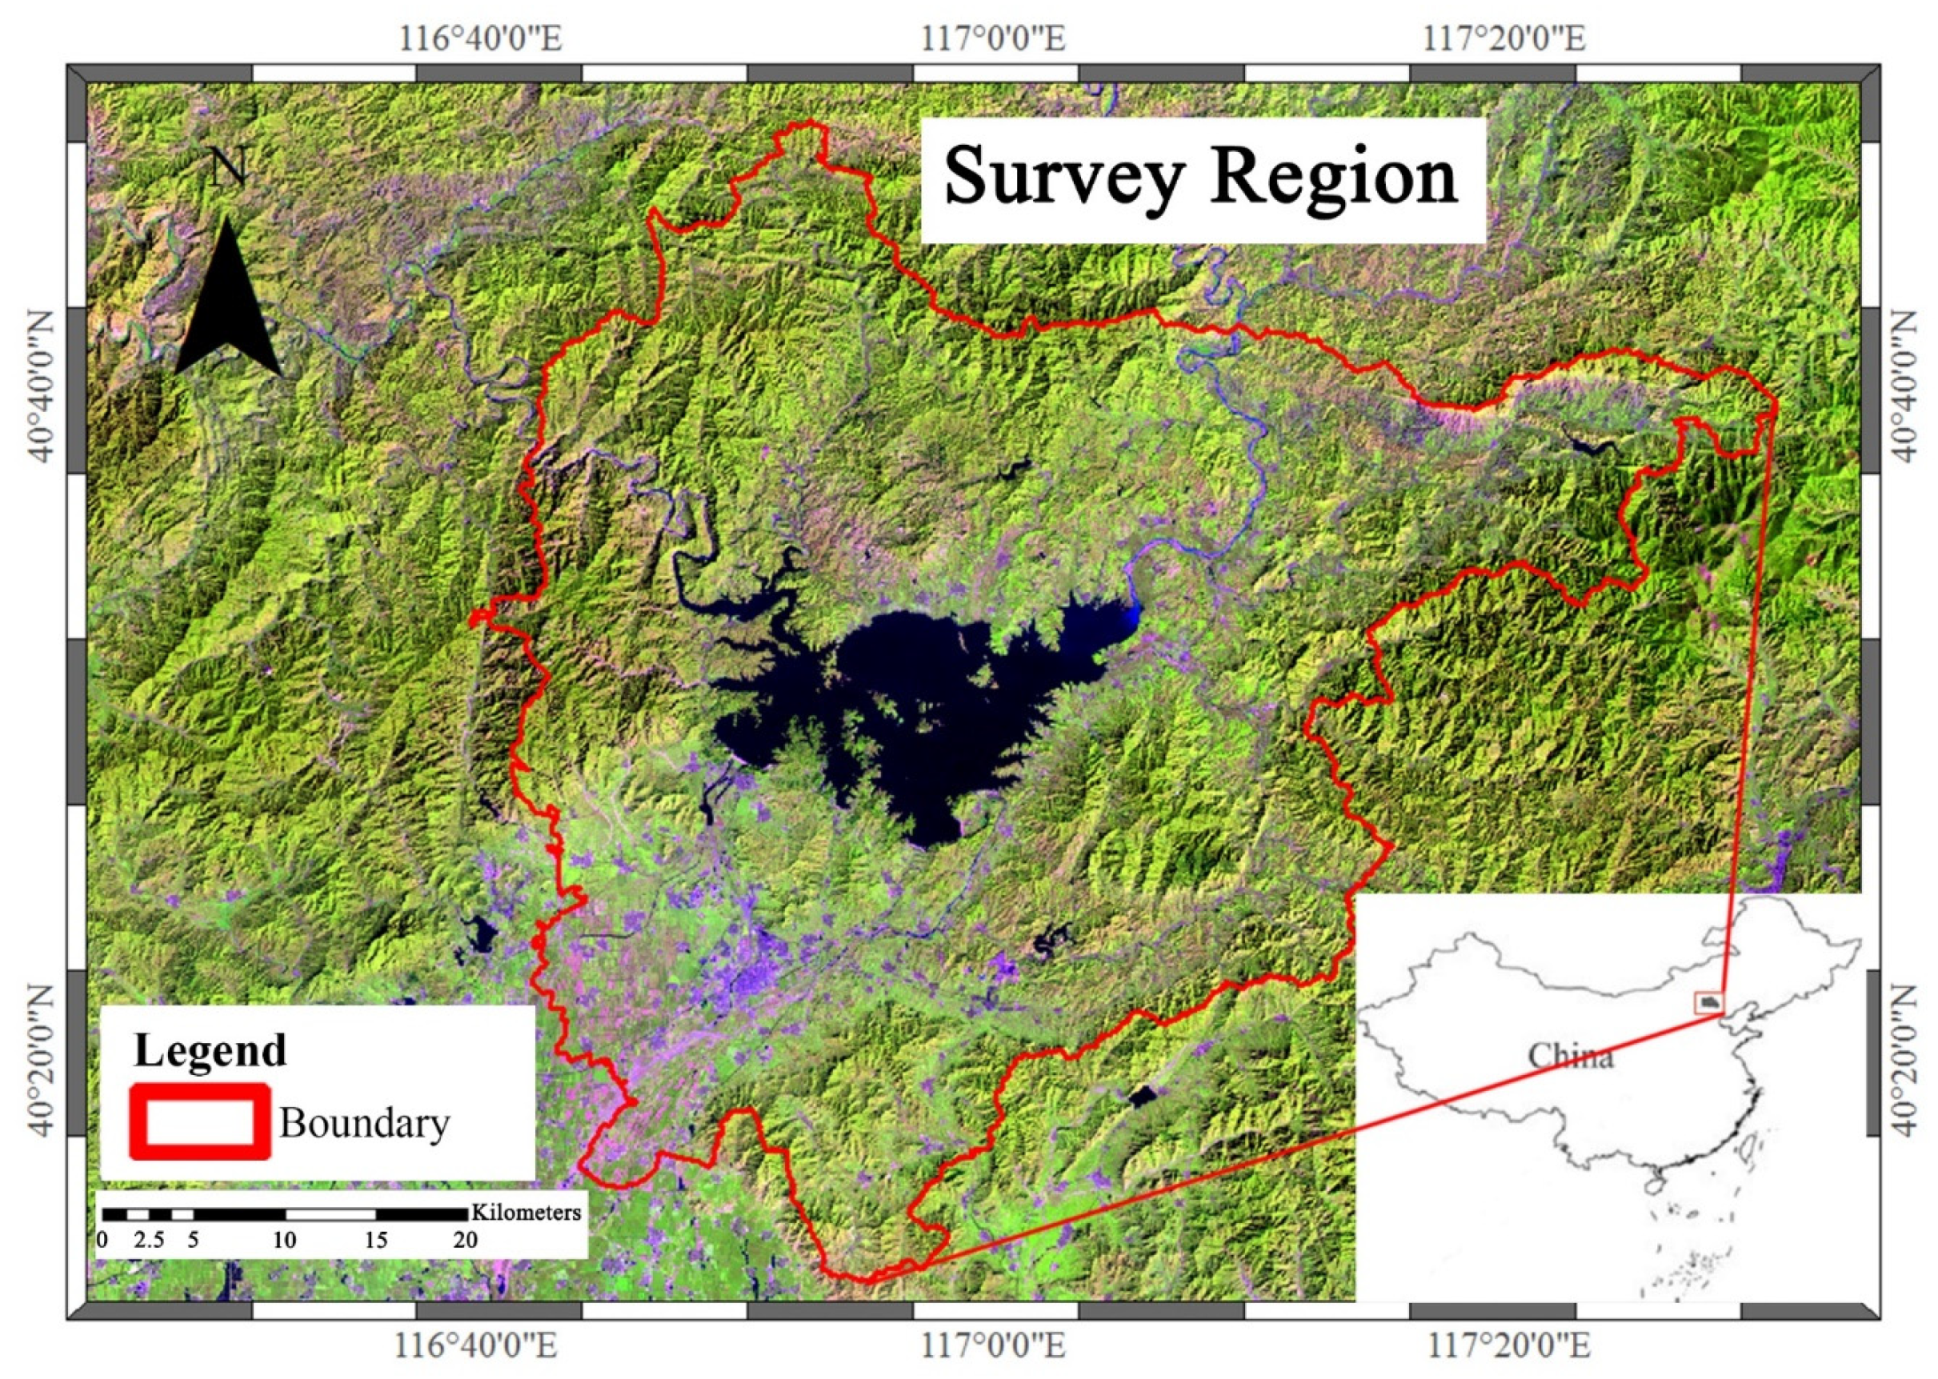
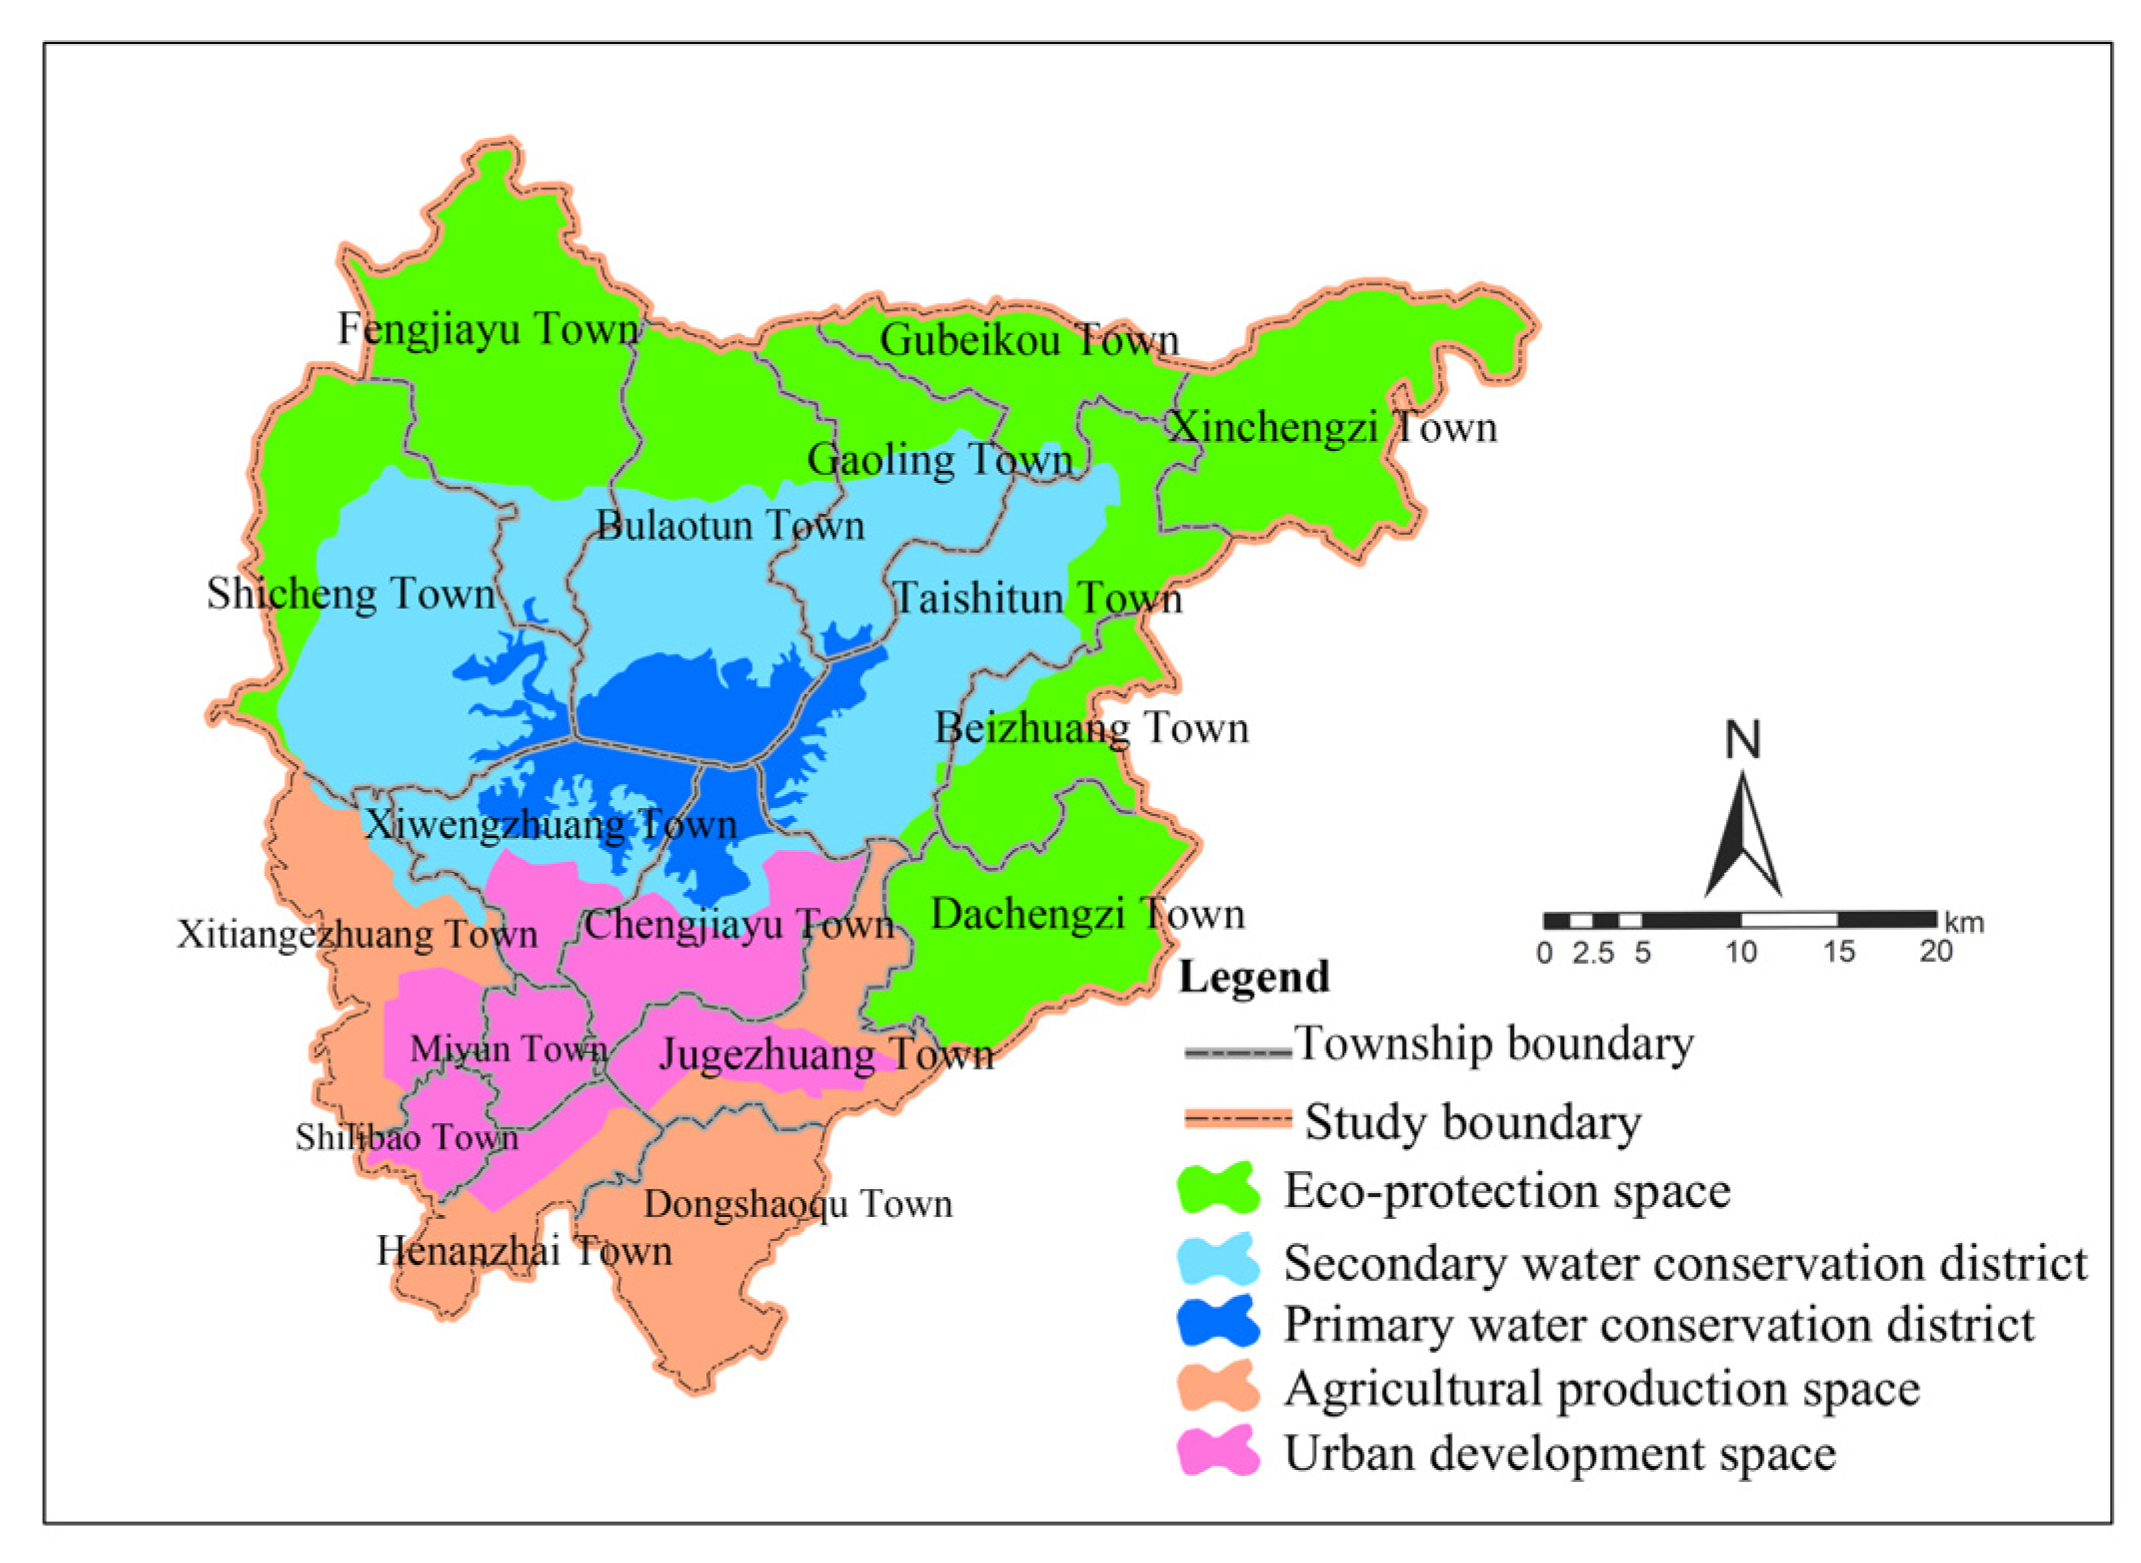
2.1. Study Area

Miyun County (Lat. 40°14′–40°48′ N and Long. 116°41′–117°30′ E), which includes 17 towns, is situated in the mountainous region of Beijing and has an area of approximately 2230 km2, as shown in Figure 1. The local economic structure is composed of farming, forestry, animal husbandry, and fishing. The land in the study area is dominated by forest (73.63% of the land area) and commercial agriculture (cropping, agri-tourism, and characteristic horticulture), which are the major sectors of employment for residents [29]. The population expanded from 423,792 in 2003 to 476,000 in 2013, an increase of 12.26% [30].
The Miyun Reservoir has a surface area of 188 km2 with a watershed area totaling 15,788 km2 and a capacity of 4.375 billion m3. The mountain region accounts for 79.47% of the total area, which is located in the northwest of the study region. The plains are situated in the southeast and account for 11.8% of the total area. The altitude varies between 400 and 1730 m above sea level.
The climate of the region is warm and semi-humid continental monsoon, with an annual rainfall ranging between 407 mm in the northwest zones to 797 mm in the southeast. Precipitation occurs primarily between July and September with an average annual precipitation of 600 mm, and approximately 80% of the rainfall occurs between June and September [31]. The distribution of precipitation generally decreases from southeast to northwest. The annual average temperatures in the upper and lower watersheds are 9 °C and 25 °C, respectively [27].
Based on the Research Group on Chinese Soil Taxonomy (CRGCST) [32], the soil types are mainly argosols, aridosols, and cambosols; namely, luvisols, cambisols, calcisols, and gypsisols [28].

2.2. Data Processing and Acquisition
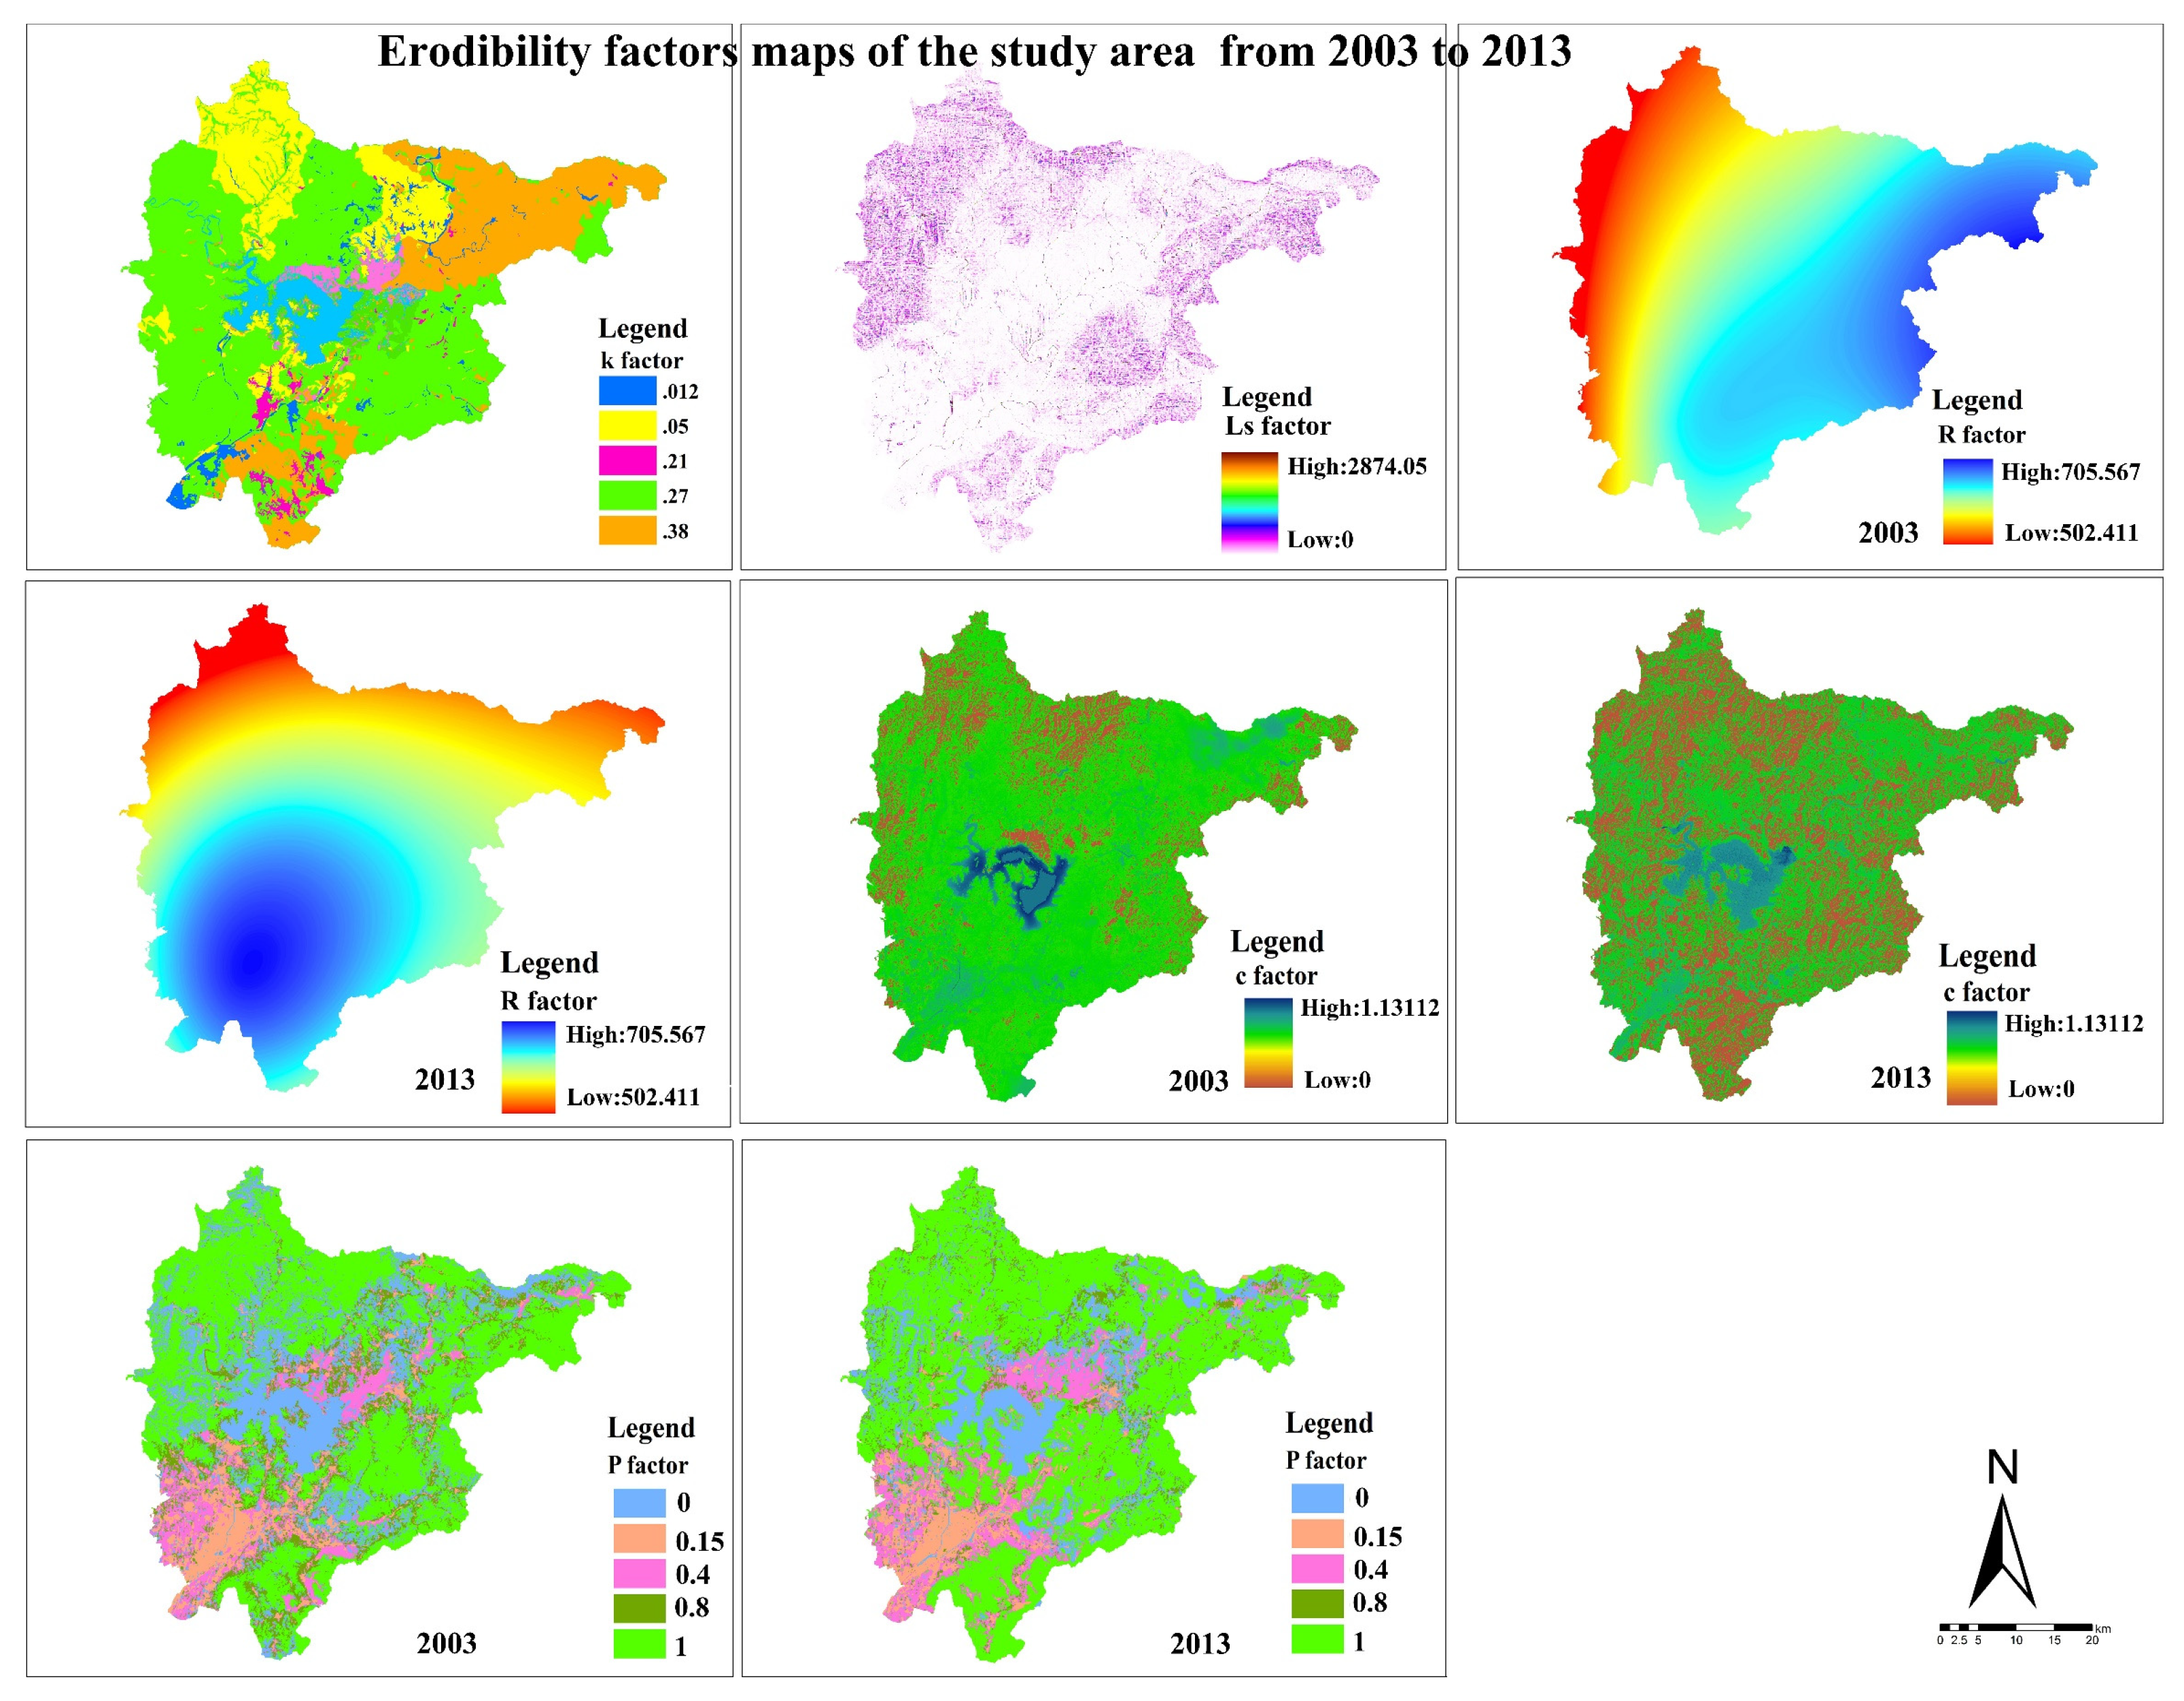
2.2.1. RUSLE Model

The RUSLE model was mainly introduced to improve the estimates for this mountainous area [33,34]. The study area is a part of the mountainous region located in northern Beijing. Therefore, the RUSLE model combined with GIS and RS methods was used to estimate the spatial distribution of soil loss in Miyun County. The equation is as follows:
A = R   ×   K   ×   L S   ×   C   ×   P
where A is the average soil loss (t ha−1 year−1), R is the rainfall erosivity factor (MJ mm ha−1 h−1 year−1), K is the soil erodibility factor (t ha−1 MJ−1 mm−1), LS is the topographic factor, C is the vegetation cover factor, and P is the erosion control practice factor. Taking all factors of the RUSLE model in 2003 and 2013 into account, Equation (1) was analyzed using GIS technology with a resolution of 30 m. The following steps explain the processing of the P, R, K, C, and LS factors, which are shown in Figure 2.

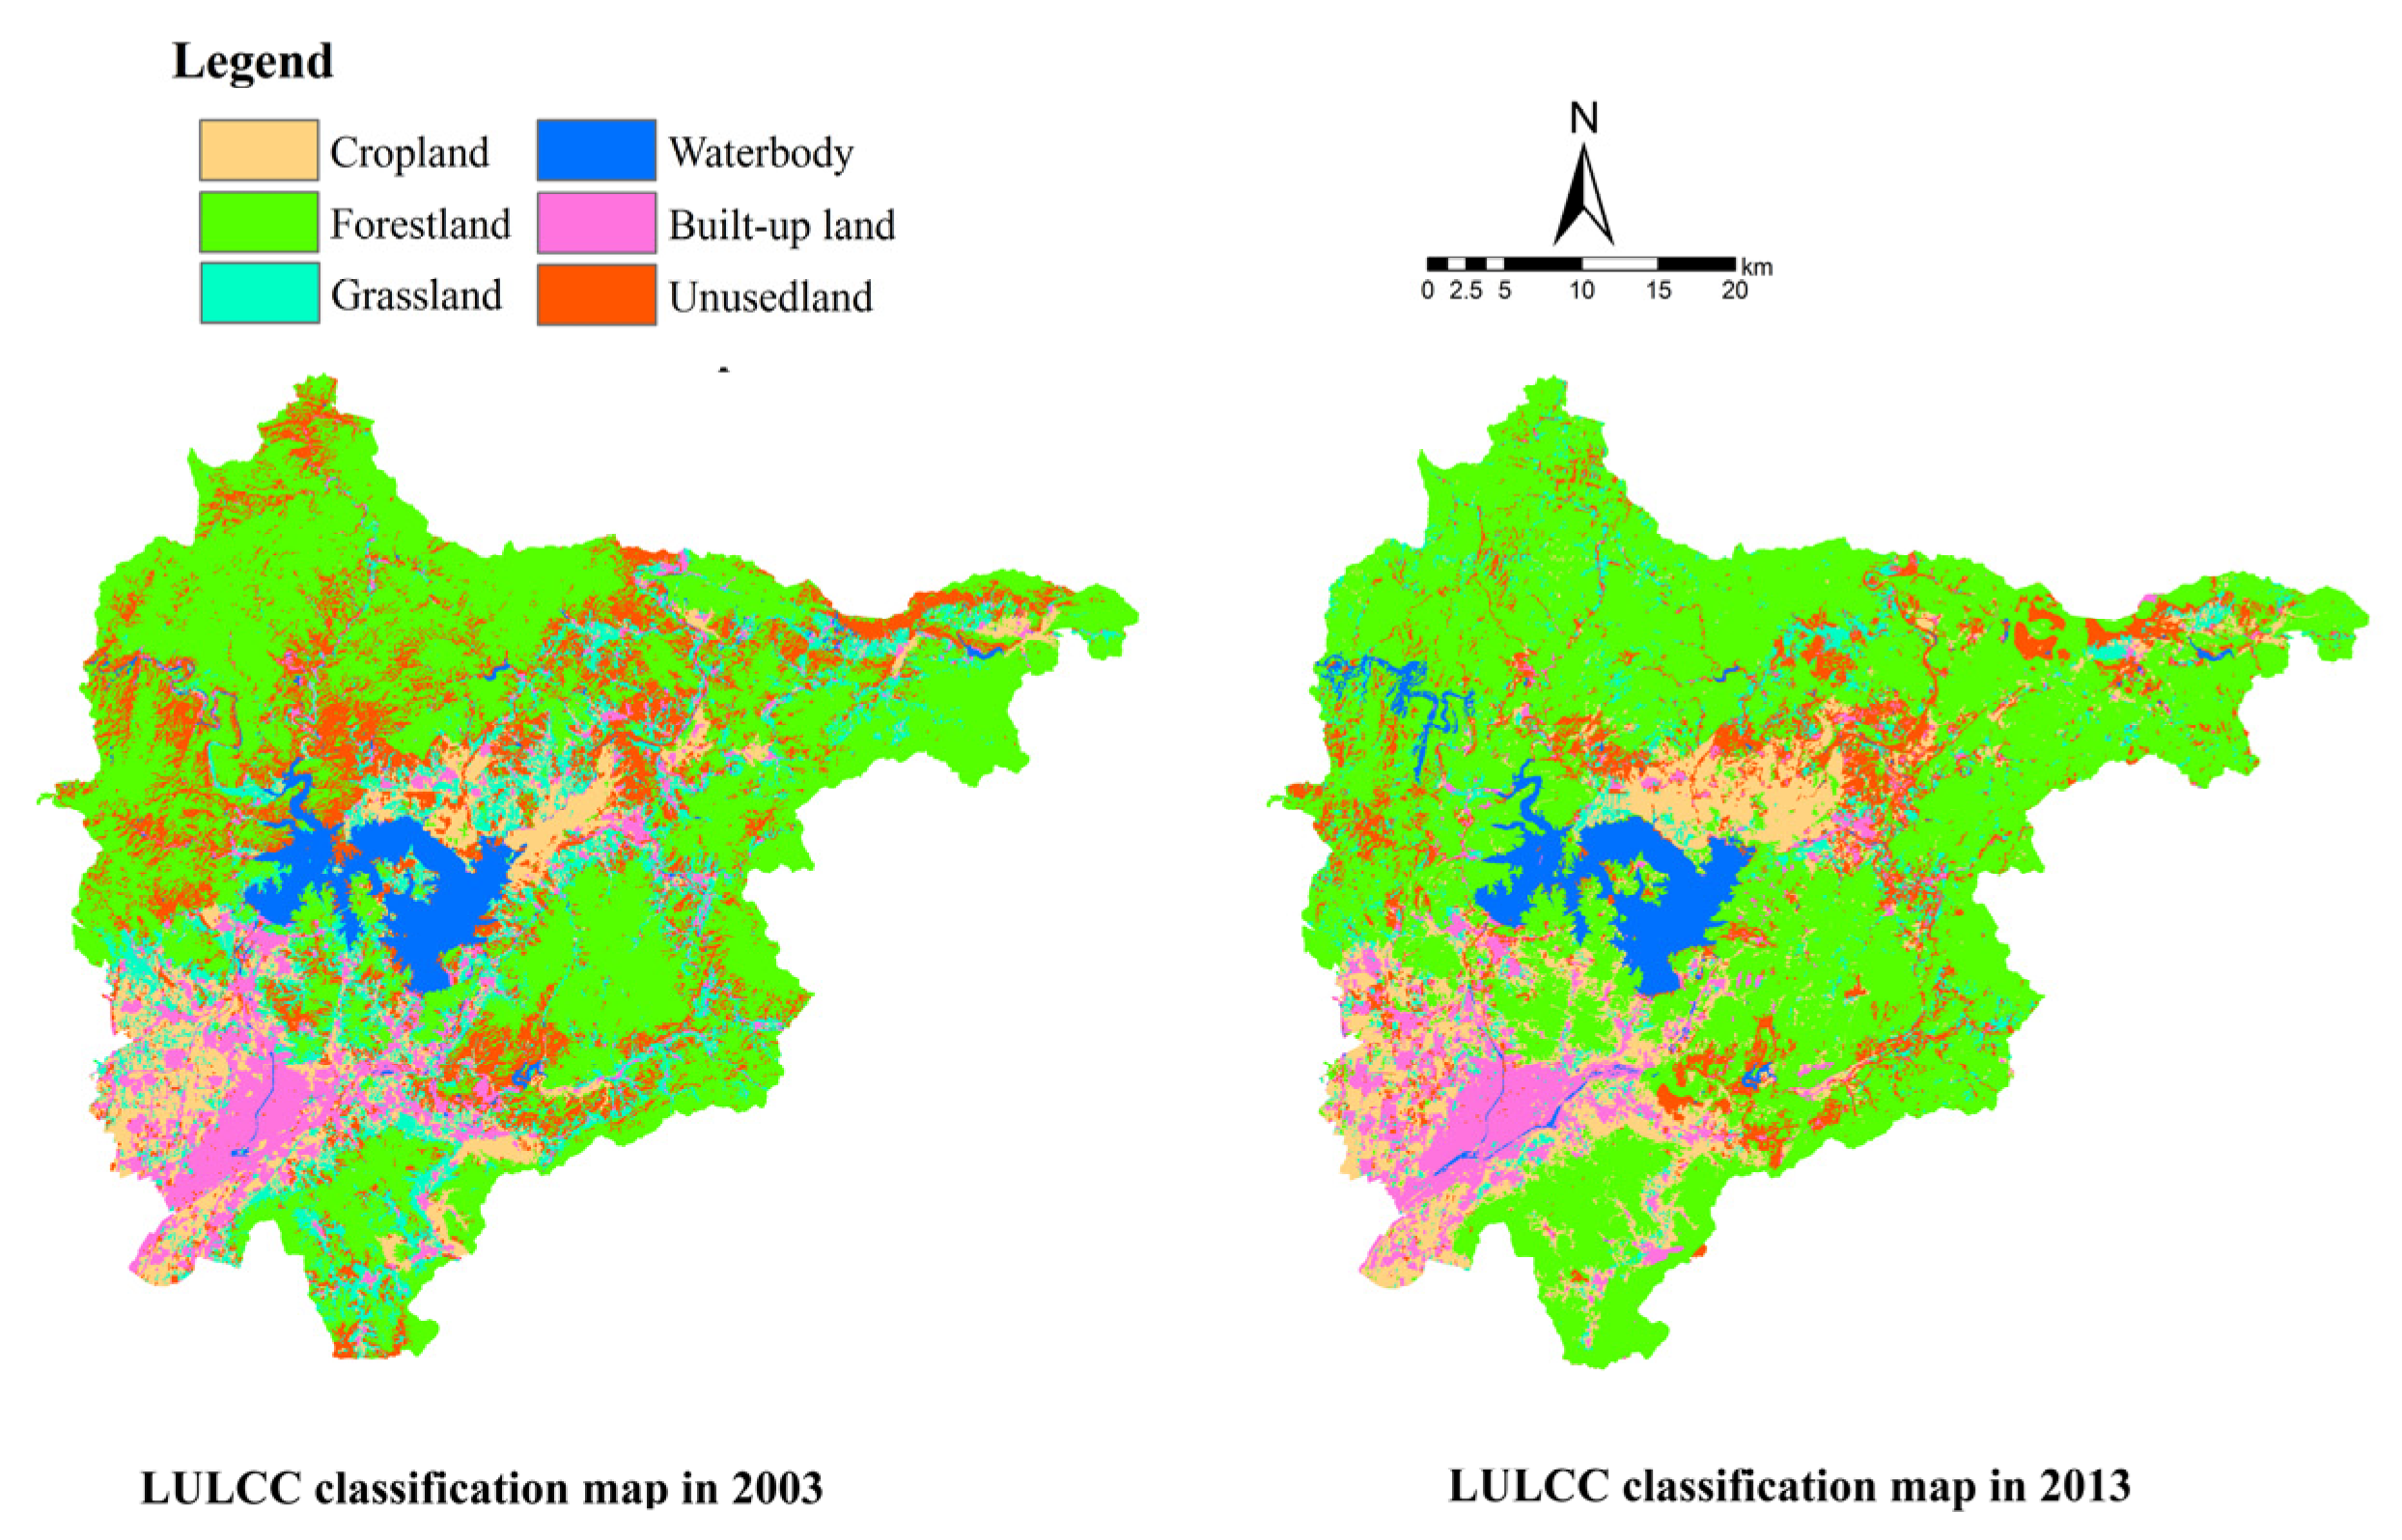
2.2.2. Land Use/Cover Data (P)

The Landsat images (TM and OLI) from 24 August 2003 and 15 September 2013 were georeferenced to the same map projection of the World Geodetic System 1984 Zone 50 N using a first-order polynomial transformation with the nearest-neighbor algorithm and resampled to a 30 m spatial resolution. Second, all satellite images were composed using red-green-blue (RGB) color composition with band 543 (Landsat TM 2003) and band 654 (Landsat OLI 2013). The images were enhanced by the linear contrast stretching and histogram equalization methods [35].
Atmospheric correction is another important processing step [36]; therefore, in this paper, the atmospheric correction was carried out using ENVI 5.3. According to the radiation transfer model, the digital numbers (DN) of each spectral band were converted to the spectral radiance values based on the gain and offset values obtained from the calibration file in Equation (2). The gain and offset values can be obtained from the satellite data header/metadata file of the study image. The FLAASH (Fast Line-of-sight Atmospheric Analysis of Spectral Hypercubes) module in ENVI 5.3 was then employed to correct the atmospheric effects in the reflectance image, as follows:
L s ,   λ = D N   ×   g a i n + o f f s e t
where L s refers to the satellite radiances, λ denotes the band wavelength, D N represents the digital numbers of each spectral band, and gain and offset represent the radiometric calibration for each band.
According to the land cover classification system in Northeast China and the field survey data using a simple GPS instrument, the land use of the study region was categorized into the following six groups: croplands, forest, grasslands, water bodies, built-up areas, and unused lands. First, regions of interest (ROIs) were created by drawing a polygon, and at least 20 pixels were included in each individual training site. The number of sample ROIs (from visual interpretation, field data, and some high-resolution images) for croplands, forest, grasslands, water bodies, built-up areas, and unused lands was 58, 136, 75, 37, 89, and 64, respectively, and a total of 459 training sites were used for classification algorithms. Using support vector machines in ENVI 5.3 software, the classification procedure was performed on the images from 2003 and 2013. Finally, the 3 × 3 majority filter was applied to the classified LULCC data to reduce the “salt and pepper” effect. Then, according to the ground truth data, the generated classified land-use maps for 2003 and 2013 were verified with a simple GPS instrument, topographic maps, and, in some cases, Google Earth. One of the most popular measures of classification accuracy derived from the confusion matrix is the percentage of cases correctly classified [37], including the overall accuracy, kappa statistic, user’s accuracy, and producer’s accuracy. In this paper, the 190 random points for accuracy assessment were chosen using the random stratified method to represent different land cover classes, along with the 164 points from field data with GPS and the 26 points from the referenced data. Accuracy assessments were generated from this reference and classified data and are described in Table 1 and Table 2 for 2003 and 2013, respectively. The kappa indices for 2003 and 2013 were 0.8012 and 0.8524, respectively (Table 1 and Table 2); the land-use and land-cover maps during the two study periods with a spatial resolution of 30 × 30 m were generated in a grid format with ArcGIS10.6. The maps were then used to analyze the spatiotemporal changes and determine P factors in the RUSLE model in the next step.

2.2.3. Rainfall Erosive Factor (R)

The rainfall erosivity index (R) is a potential driving force of rain erosion, which is a major factor used to define the type of erosion caused by rainfall and runoff on the soil surface of a specific location [38]. In this study, rainfall data were collected from the meteorological bureau of the local government from 2003 to 2013 and produced by kriging interpolation in ArcGIS10.6. The data were used to determine the R-factor in the RUSLE model [39]. R was calculated as follows:
R = [ 4.17   × i = 1 12 ( P i 2 P ) ] 152
where Pi is the monthly average rainfall for month i (mm) and P represents the annual average rainfall (mm).

2.2.4. Soil Erodibility Factor (K)

The soil erodibility factor K represents the average long-term soil and soil profile response to the erosive power associated with rainfall and runoff [17]. The soil map was derived from the CRGCST (2001). The soil property data related to the soil types were obtained from the Miyun soil database and used to calculate the K value. An estimate of the K-factor can be obtained based on the following equation:
K = [ 2.1   ×   M 1.14   ×   10 4   ×   ( 12     S O M ) + 3.25 ×   ( s     2 ) + 2.5 ×   ( p     3 ) ] 100 ×   0.1318
where M is the factor calculated as the product of the soil particle size fractions between 0.002 and 0.1 mm, SOM corresponds to the soil organic matter content (%), S represents the soil structure code, and p is the soil permeability code.

2.2.5. Vegetation Cover-Management Factor (C)

Vegetation is the most sensitive factor influencing soil erosion, and soil loss is significantly related to vegetation coverage in a negative exponential relationship, whose turning point is approximately 78.3% [40]. Vegetation coverage (fg) was described by using the normalized difference vegetation index (NDVI) to indicate the seasonal growth of vegetation conditions of the study region. The equation for the C factor is expressed as follows:
C = { 1 0.6508 0.3436 L g f g 0 f g = 0 0   <   f g     0.783 f g   >   0.783
In this equation, the fg data were derived from the NDVI that was calculated from the Landsat image by the following equations:
f g = N D V I     N D V I s o i l N D V I m a x     N D V I s o i l  
N D V I = N I R     R N I R + R
where N D V I m a x represents the NDVI value for pixels completely covered by vegetation, N D V I s o i l is the NDVI value for totally bare soil pixels, NIR represents the reflectance value in the near-infrared band, and R is the reflectance value in the visible red band.

2.2.6. Topographic Factor (LS)

The LS factor describes both slope steepness and slope length and thus reflects the relationship between the slope length and the slope gradient associated with erosion [41]. The LS factor was calculated and obtained from DEM raster data developed using topographic maps with a scale of 1:50,000. The LS factor was computed in the ArcGIS 10.6 raster calculator module. The equation is expressed as follows:
L S = ( ( F l o w a c c u m u l a t i o n ) × ( C e l l s i z e ) 22.13 ) 0.6 × ( sin ( s l o p e ) 0.0896 ) 1.3
The slope (°) was extracted from the DEM with a cell size of 30 × 30 m, and the flow accumulation was also derived from the DEM after conducting fill and flow direction processes in ArcGIS 10.6 with the ArcHydro Tool module.

2.2.7. Classification of Soil Erosion in China

The Chinese national professional standard of SL190-96 Standards for Classification and Gradation of Soil Erosion (the Ministry of Water Resources of China 1997) [27] is shown in Table 3. According to the standards of water and soil erosion density in SL190-96, the soil erosion severity in the study region was classified into the following six levels: slight, light, moderate, severe, very severe, and extremely severe, and the erosion risk map distribution of soil loss in the Miyun reservoir watershed was prepared in ArcGIS 10.6.

3. Results

3.1. Land-Use Change Analysis

The LULCC patterns of the study region from 2003 to 2013 are shown in Figure 3. The land-use structure was mainly characterized by forest, cropland, and grassland, which accounted for more than 69% of the total area in the two study years (Table 4). This result indicates that the land-use structural characteristics comprised forestry, agricultural and animal husbandry production. Moreover, 48.24% and 59.18% of the total area was covered by forest in 2003 and 2013, respectively, and forest coverage was mainly distributed in the western and northwest mountain regions, with only a small amount distributed in the eastern hilly region. This indicates that forest coverage increased by 10.94% during the study period. The study by Li et al. [42] demonstrated that ecological projects such as the Three-North Shelterbelt project and Grain for Green promoted the expansion and development of forests in this region. The increase in forest coverage is due to the construction of Beijing’s ecological environment, including the Beijing-Tianjin sandstorm source control project and the construction of key shelterbelts. During the tenth five-year plan period, the Beijing Ecological Environment Construction Plan was fully implemented, and the goal was to reach 48% of the city’s forest coverage rate, including 25% in plain areas, 70% in mountainous areas, and 40% in urban areas [43]. Furthermore, 54.74% of unused land (224.03 km2) and 37.85% of grassland (97.79 km2) were converted to forest (Table 5). The conversion of unused land to forest indicates the implementation of the Grain for Green project (GGP) by the local government. However, the conversion of grassland reveals certain complications of the change in land use. The transformation from forest to cropland occurred in some slope regions, with an area of 1.93% (20.73 km2), showing that land type shifts are more likely to occur in areas with high human activities. Hu et al. [44] showed that the decrease of cropland is related to urban expansion, especially the expansion of Beijing, at the cost of decreased cropland.
Cropland and grassland were mainly found in the low elevation and flat regions. Furthermore, cropland was distributed along the river in the east and northeast hill regions. Grassland near the Miyun Reservoir showed a gathered-distribution pattern. The cropland area increased by 2.97%, whereas grassland declined by 6.21%. Grassland is the major conversion source for cropland, followed by unused land, accounting for 28.80% or 74.40 km2, and 10.04% or 41.09 km2 of the total cropland, respectively. The conversion of cropland is caused by many factors, the most important of which are population growth and economic development [30]. Niu et al. [45] showed that with socioeconomic development, cropland was displaced by built-up land, and a growing population needed more food. To meet demand, farmers must occupy other green lands to maintain the necessary amount of arable land, which ultimately leads to irrational land use. However, the conversion of cropland to unused land has attributed to overgrazing, which accounts for 20.39 km2. In addition, farmers have been using more pesticides and fertilizers to boost crop production. Huang et al. [46] showed that the loss due to agricultural chemicals and chemical fertilizer accounted for 50–70% of the surface water pollution source, especially nitrogen (N) and phosphorous (P). It was estimated by the local government that the annual N and P losses accounted for 7.84 × 10⁵ kg and 2.57 × 10⁴ kg every year from 1998 [47], respectively. Furthermore, both N and P are mainly transported with sediments, which have become the primary factor impacting the water quality of the Miyun Reservoir and are considered an agricultural nonpoint source pollution [46]. Effective land-use management appears to decrease cropland intensity and reduce fertilizer use per area to control water eutrophication [48].
Built-up land is located in the southern region of Miyun County, which is on a gentle slope, whereas cropland is concentrated in the flat area, but has become one of the pollution sources impacting the water quality of the Miyun Reservoir through rural waste discharge.
The major water body is Miyun Reservoir and its associated river, which is located in the central region of the study area. The unused land, which is mainly composed of bare land and idle land, was distributed along the northern coast of the Miyun Reservoir and scattered on the top of every mountain area, with the total area decreasing by 7.28% (161.88 km2). This area is the major contribution region of soil and water losses.
Over the entire study period, forest was the main land-use type, with scattered patches of other land-use types. The increased area of forest was the largest, followed by cropland, accounting for 243.44 and 66.03 km2, respectively. In contrast, the areas of unused land, grassland, and built-up land declined by 161.88, 138.16, and 18.44 km2, respectively.

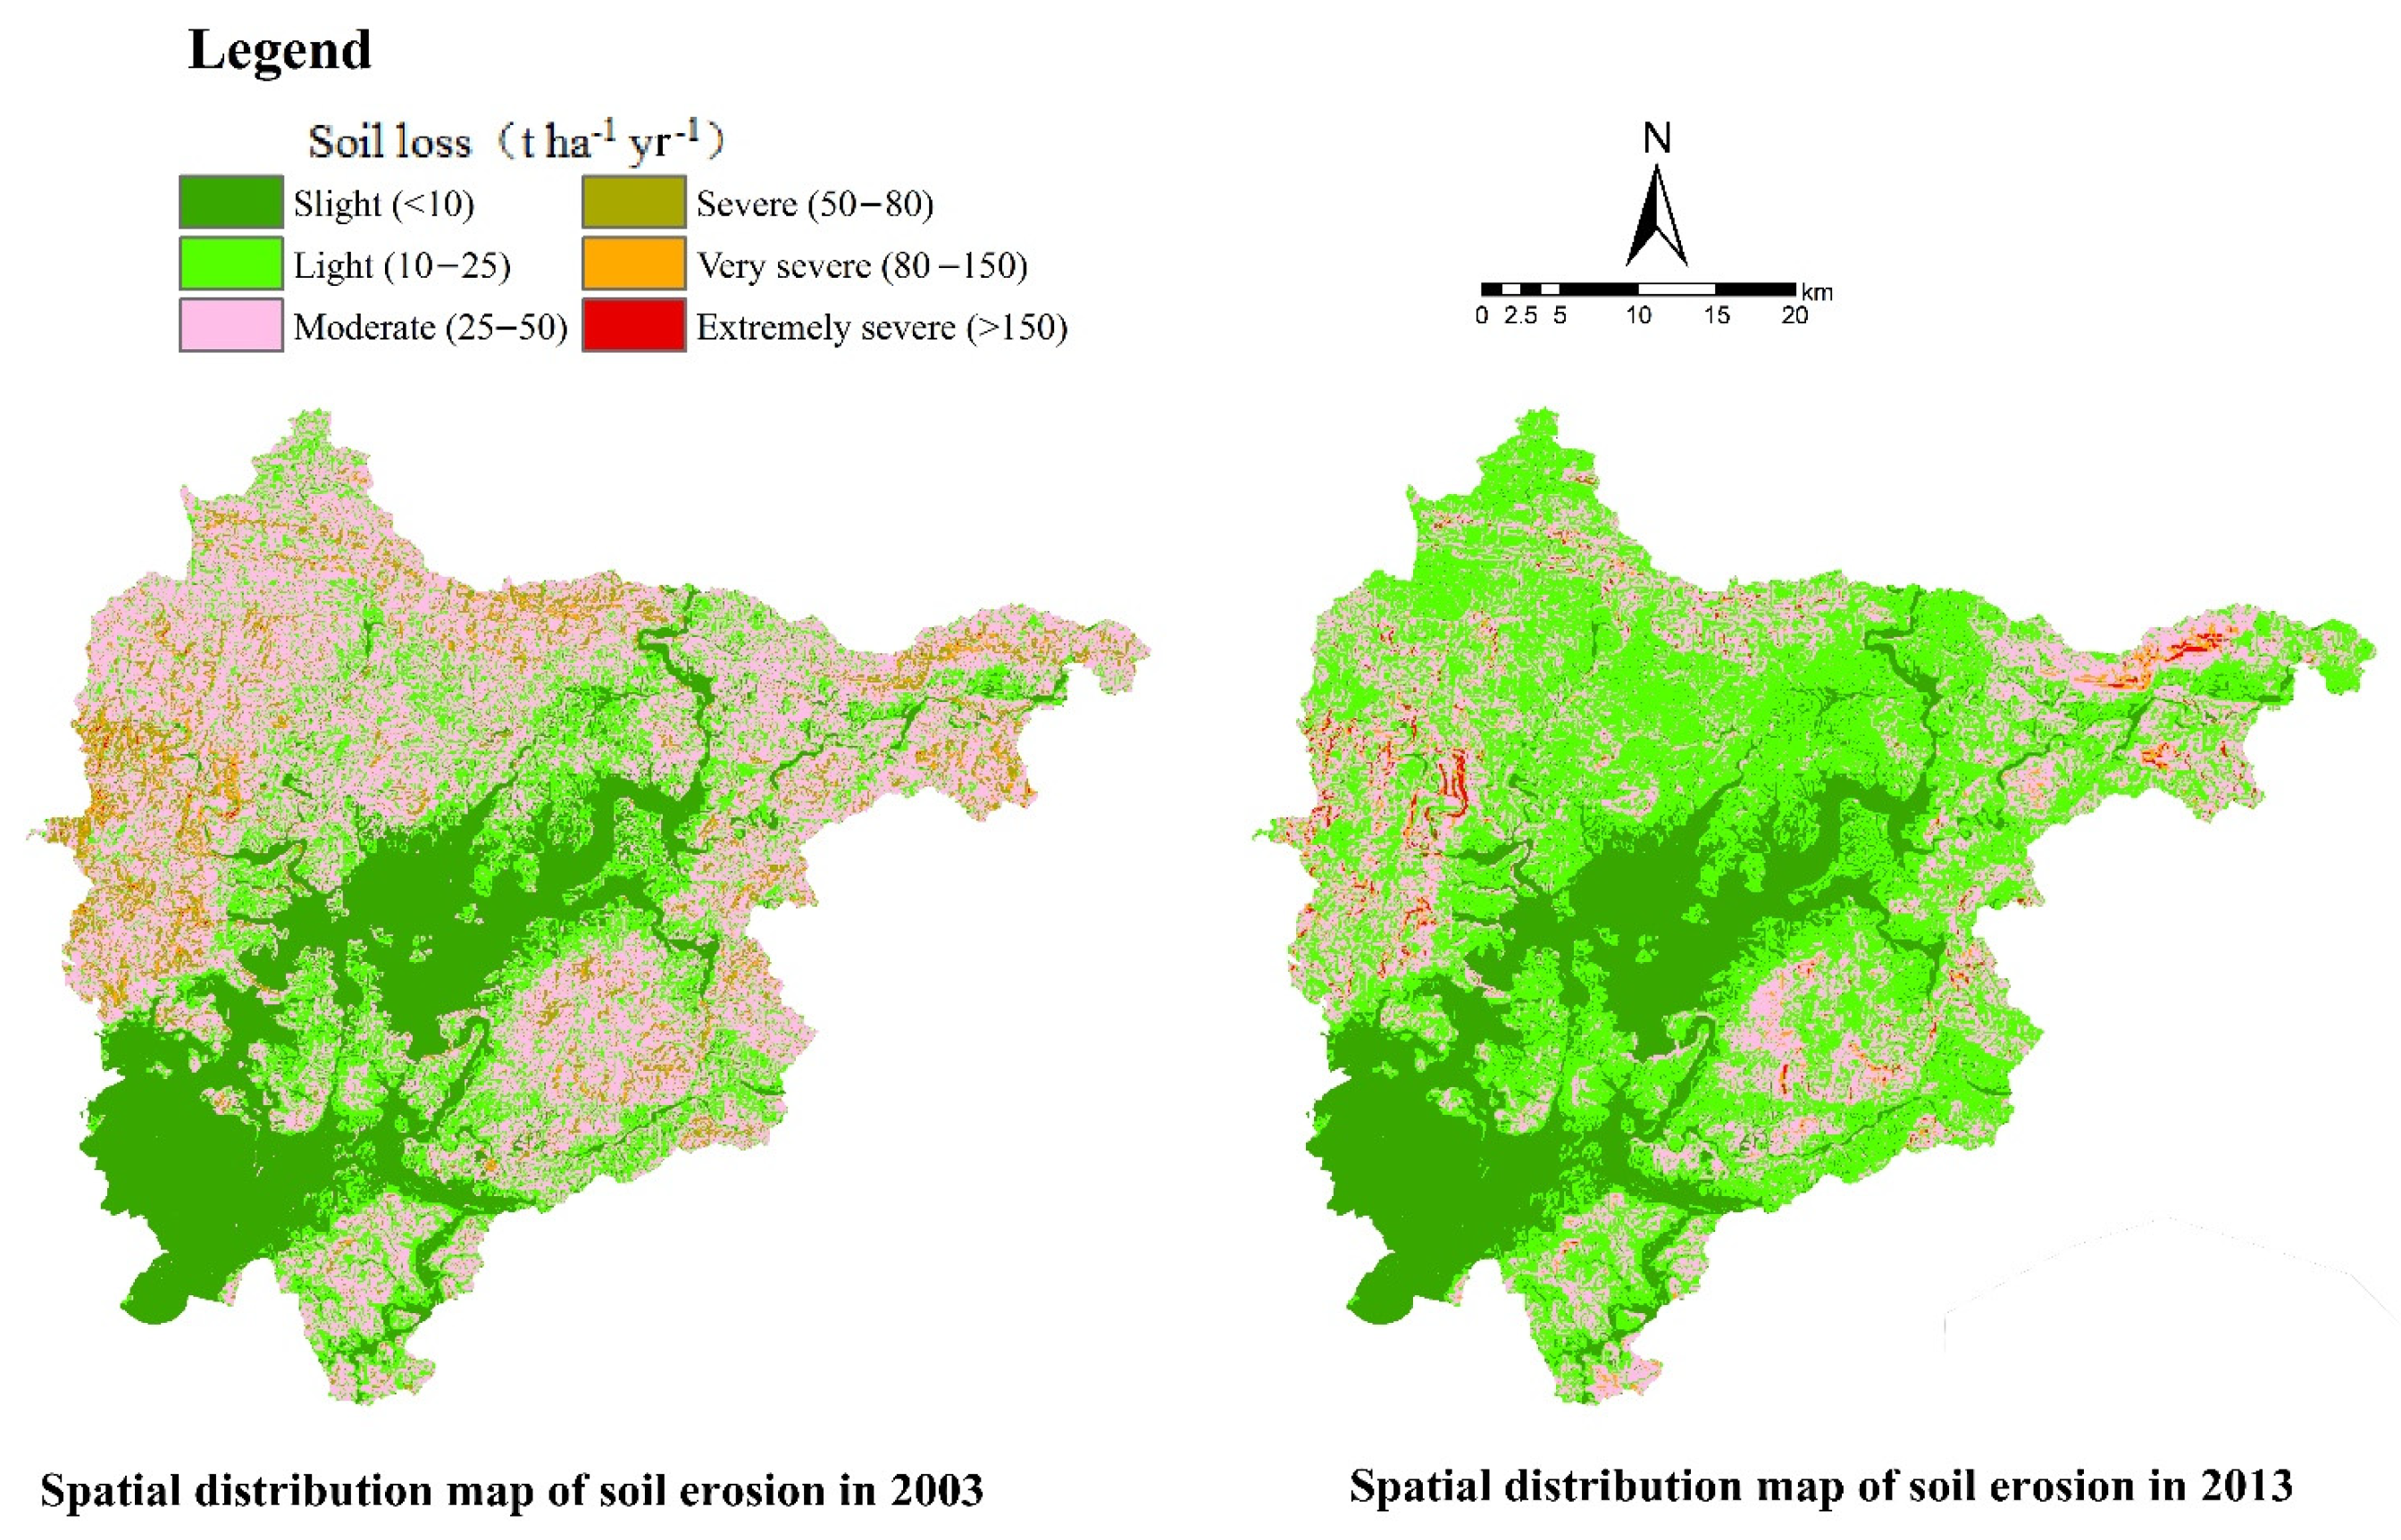
3.2. Soil Erosion Change Analysis

The spatiotemporal distribution of the soil erosion results is presented in Figure 4. The characteristics of soil erosion are shown in Table 6. The total areas of slight, light, and moderate soil erosion were dominant, accounting for 91.59% in 2003 and 97.62% in 2013. In 2003, moderate soil erosion covered the largest area, followed by slight soil erosion, accounting for 45.55% and 24.48%, respectively. Over the period from 2003–2013, light soil erosion dominated, followed by moderate erosion, accounting for 47.95% and 25.55%, respectively. Extremely severe soil erosion accounted for 0.07% and 0.50% of the areas in 2003 and 2013, respectively. The light soil erosion increased to the largest area (587.46 km2), which mostly originated from moderate soil erosion (Table 7). These findings suggest that the situation of soil erosion in Miyun County has markedly improved over the past few decades. The change from high to low soil erosion grades indicates that the eco-environmental quality of the region has gradually improved. The area of high habitat quality in the watershed increased from 58.22% in 2005 to 60.29% in 2015 due to the implementation of the GGP [49]. The increased area of extremely severe soil erosion was 9.57 km2, located in some steeply sloping regions and mostly converted from severe soil erosion. Although the GGP has been carried out since 1999 by the Chinese government, local residents have shifted their financial sources from producing crops. For instance, according to the good ecological natural environment and excellent geographical position, ecological tourism, ecological agriculture, and other ecological activities are carried out to increase the income of the local populace [50]. Driven by economic interests, deforestation and reclamation of cropland still occur, especially in land with slopes of >25°, which restricts the intensity and scope of human activities, especially cultivation. This phenomenon indicates that human activities have accelerated the intensity of regional soil erosion. Moreover, gully erosion has worsened as the vegetation status has changed [51]. From 2003 to 2013, moderate soil erosion covered the largest decreased area, which accounted for 445.21 km2, followed by severe, slight, and very severe soil erosion, which accounted for 142.69, 8.02, and 1.11 km2, respectively.
The areas of severe and very severe soil erosion that were converted to moderate erosion accounted for 78.08% and 33.77%, respectively. The transformation from higher intensities to lower intensities of soil erosion was due to the implementation of ecological environment protection, especially that of the Natural Forest Protection Program (NFPP) [52]. In the tenth five-year plan for ecological environment construction, 2100 square kilometers of soil erosion control area and 200,000 mu of windbreak sand-fixing forest are planned to be added [43]. As a result, the vegetation coverage has improved, and the soil’s physical and chemical properties have improved. These changes altered the water cycle of the region, increased evapotranspiration, and reduced surface runoff. In general, the area of light and extreme soil erosion increased, whereas the others decreased, indicating that the regional eco-environmental quality gradually improved.

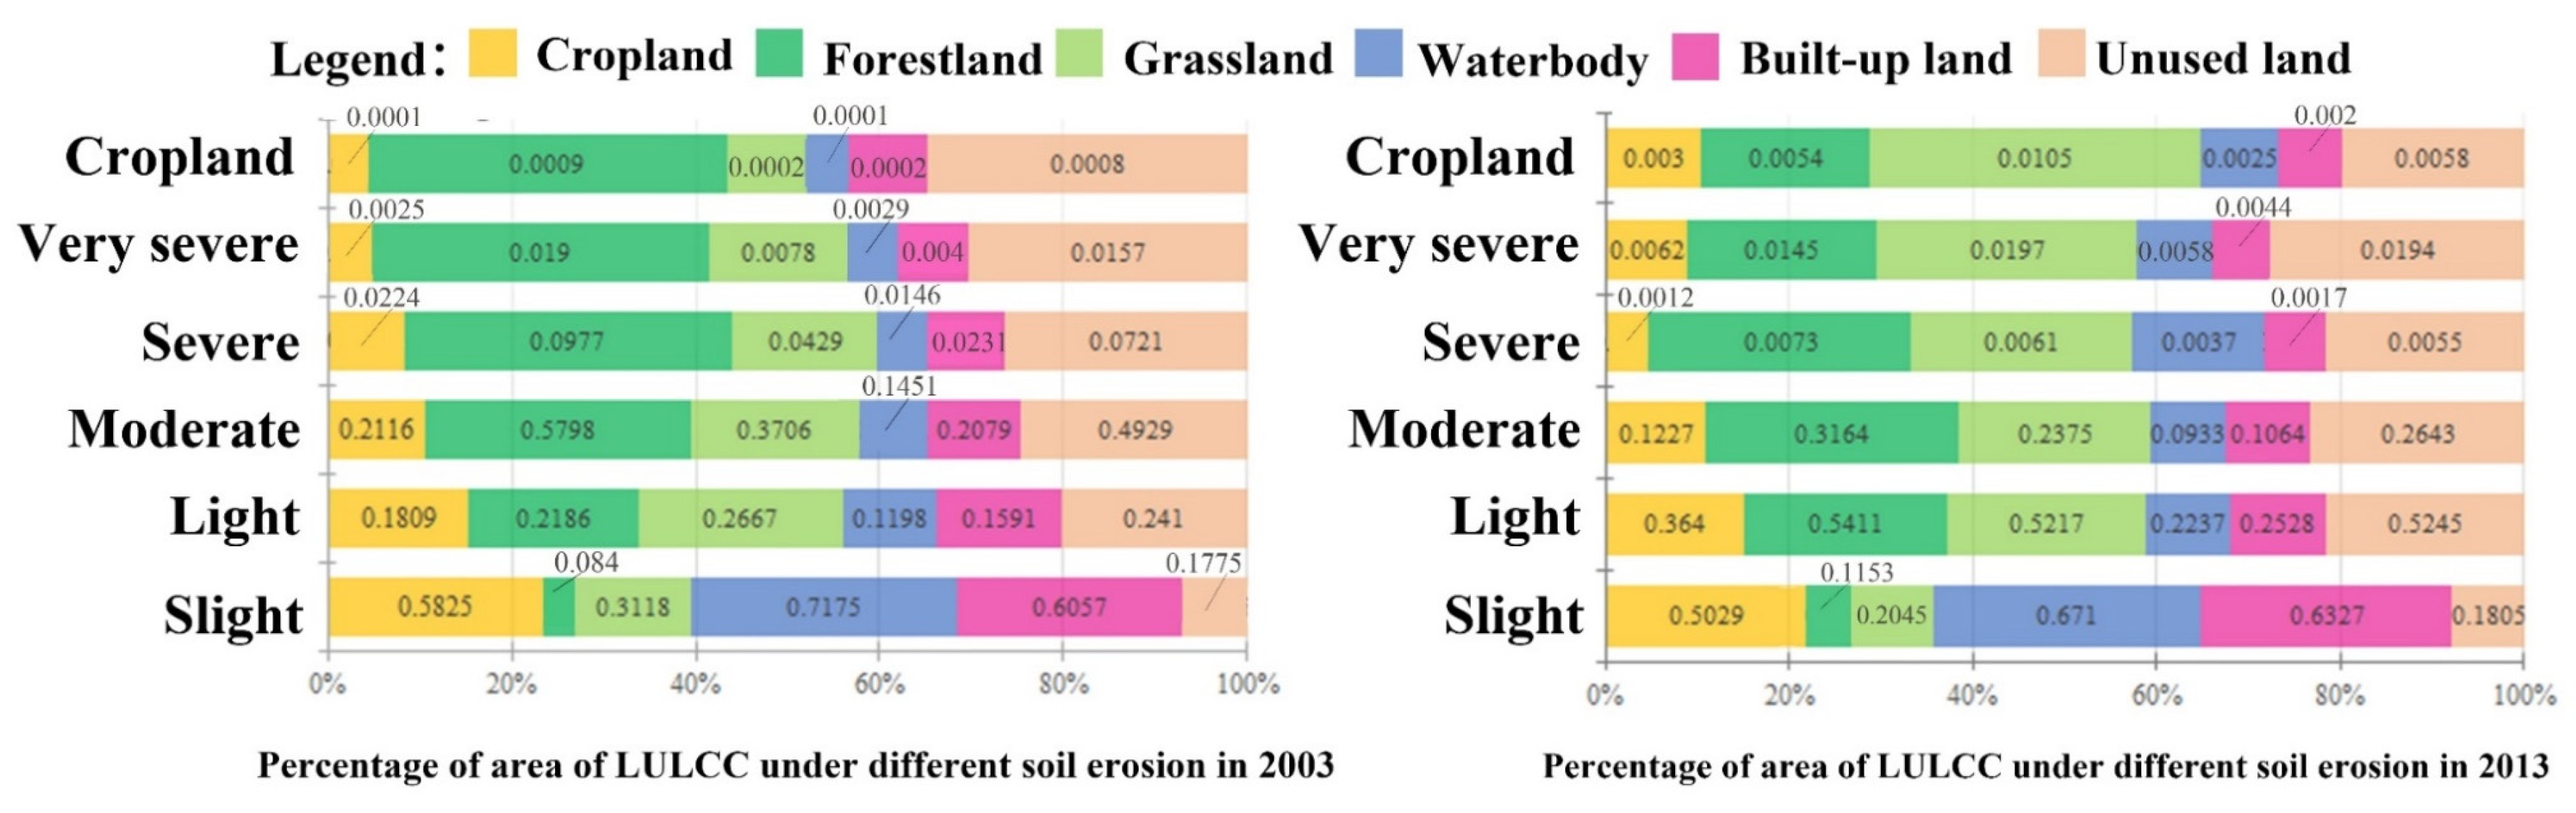
3.3. Soil Erosion and LULCC Overlay Analysis

The transformation of land use is considered the primary cause of the change in soil erosion. To determine the role of each land-use type in the different types of erosion in the study area, the soil erosion maps were overlain by the different LULC maps for 2003 and 2013 by using the spatial analyst module in ArcGIS10.6 and ArcGIS zonal statistics. The statistical values of each land-use type and the soil erosion were specified, and the relationship between LULCC and soil erosion was revealed to estimate the soil erosion response to LULCC. The area percentage of land use under different soil erosion types is presented in Figure 5.
A slight soil erosion level was found for water bodies (approximately 71.75% and 67.10% in 2003 and 2013, respectively), followed by built-up land and cropland. However, cropland and forest occupied the largest areas of 120.31 km2 in 2003 and 151.89 km2 in 2013. Water bodies and grassland covered the smallest areas, accounting for 72.45 km2 in 2003 and 24.58 km2 in 2013.
The forested areas dominate light soil erosion, with a net increase area of 478.07 km2, which mainly comes from the reclamation of cropland in the hill region located in the western and north western parts of the study area. This change led to an increase in the area and density of vegetation cover, which changed the processes of runoff generation and convergence [52]. Soil and water conservation was carried out by reducing surface runoff in intercepting falling raindrops, controlling soil erosion, and improving soil conservation. Hence, the local eco-environmental quality has been gradually improved [53]. This result indicates that the ecological measures of the local region have been working well. Water bodies occupied the smallest area and increased by 12.5 km2 (10.39%) in the light soil erosion level; however, this is generally too minor to affect soil erosion.
In moderate soil erosion regions, forests showed the greatest area and were decreased by 26.34% (205.84 km2). Unused land covered the second-largest area and decreased by 136.34 km2. Therefore, priority must be given to the protection of forests and the afforestation of unused land to reduce the impact of erosivity on soil loss. Furthermore, the moderate soil erosion of the largest area decreased by 445.21 km2, which is the major conversion source to light soil erosion. This transformation could be highly beneficial to improving vegetation and the control of soil and water losses [54].
The proportion of severe soil erosion decreased from 9.77% in 2003 to 0.73% in 2013 because of the major conversion of cropland in steep terrain regions to forest by changing the type, extent, and quantity of land-use cover. These changes not only increased forest area, but also reduced local soil erosion in cropland regions by reducing surface runoff. Lands with good vegetation cover are very susceptible to gullying erosion [55]. This finding indicates that ecological measures have made positive contributions, and the deterioration of soil erosion has been controlled.
In contrast, for very severe and extremely severe soil erosion, forest areas dominated, followed by unused land. The areas of forest and unused land decreased by 1.3 and 1.6 km2 under the very severe soil erosion level. However, these areas increased by 6.14 and 1.1 km2 in the extreme soil erosion level, respectively. The survey data show that the deforestation of cropland occurred in some regions with slope gradients > 25°, where the expansion of cultivated land worsened erosion intensity. Land-use activities, such as the reclamation of cropland, are not only irrational but also reduce vegetation cover, change soil structure, accelerate soil erosion intensity, and deteriorate the local and regional eco-environment quality. Therefore, areas shown to remain at an extremely severe soil erosion level in 2013 should be considered for soil conservation measures.

4. Discussion

There have been many investigations on various aspects of soil erosion either in pilot or the upper Chaobaihe River catchment in this region [31,56] that used the RUSLE re-mote-sensing technique and GIS technology to map the soil erosion risk in Miyun Watershed. These studies found that the annual average soil loss for the upper watershed of the Miyun Reservoir was 9.86 t ha−1 yr−1 in 2005. Li et al. [31] used the UUSLE to assess the spatial distribution and dynamic properties of soil loss with GIS and RS technologies, and the results showed that an average annual soil loss in the upper stream of the Miyun Reservoir of 25.68, 21.04, and 16.80 t ha−1 yr−1 was estimated for 1990, 2000, and 2010, respectively. Using RS, Niu et al. [45] concluded that the changes in fractional vegetation cover and climate regimes were the primary factors for soil erosion in the Miyun Reservoir Basin. Zhou and Wu [56] found that sediment yield decreased in the upper Chaobaihe River catchment of the study region from 2001 to 2002. Compared with previous studies, few studies have focused on the changes in soil erosion caused by LULCC in the study region, and the effects of LULCC on soil erosion in this region have not been further revealed.
Therefore, according to this study, the effects of LULC on soil erosion can be categorized into three types.
The first type is about the transformation from forest and grassland to cropland, as well as orchard land and unused land, which increases the erosion intensity and has a negative impact on soil erosion. The changes of land-use structures and vegetation cover that mostly occurred in the north, northeast, and southeast regions of the Miyun Reservoir and were driven by economic interests were the main influences on soil erosion. According to the pilot and demonstration construction plan of main functional zones in Miyun County, Beijing as shown in Figure 6 [57], this area belongs to ecological protection zone (Gaoling Town, Gubeikou Town, Xinchengzi Town, Taishitun Town, Dachengzi Town, and Beizhuang Town), and is dominated by low and middle high mountains, hills, and valleys with gentle slopes. The main soil types in this area are cinnamon, leached cinnamon, and brown soils, which are in the main fruit-producing areas in Miyun County. Our data showed inappropriate agricultural practices, such as excessive soil tillage and cultivation of steep lands, after 2013 in the northern mountain region of Miyun County, which has increased regional soil erosion. Therefore, to reduce the risk of soil erosion and improve the water quality of the Miyun Reservoir, ecological measures should continue to be taken in this region, followed by strict controls of development intensity, increasing the forestry land area, developing the suitable forest area for fruit industry, and restoring the local vegetation.
Agricultural development areas are mainly concentrated in Xitiangezhuang Town, Henanzhai Town, East Shaoqu Town, and Jugezhuang Town. The major soil types are cinnamon, aquic, and coarse-grained soils. The cropland that is flat and has good soil quality. The deep soil layer is important for grains, vegetables, fruit, and animal husbandry. On the basis of strengthening and upgrading to the first level of windbreak and sand-fixation forest, as well agricultural and forestry shelterbelt in the plain, this area is strictly protected for basic cropland, accelerating the adjustment of agricultural structure and expanding the ecological function of agriculture.
The transformation from cropland and forestland to urban development increases erosion intensity and has a negative impact on soil erosion. The urban development areas mainly include Miyun Town, Shilibao Town, Jugezhuang Town, Xiwengzhuang Town, and Mujiayu Town. Most of the human population and industrial production are concentrated in these areas. The soil types are mostly cinnamon and brown soils. These areas are restricted on disturbance of human activities, optimizing the territorial space development pattern, and building the landscape for urban development.
The second type, including the conversion of cropland and unused land to forest, reduces soil intensity and has a positive impact on soil erosion. This type is mainly situated in the northwest mountain region of the study area that is associated with the ecological protection of the Shichengzi, Fengjiayu, and Bulaotun townships, and belonging to the Yunmeng Mountain region. The land in these areas has steep slopes, narrow valleys, thin soil layers, and bare rock, and shows serious soil erosion. The soil types are mainly brown and cinnamon soil. This area should strictly limit unadjusted human activities, and focus on water source protection of the forest and soil water conservation. The ecological conservation and water source protection should be strengthened in this area. The natural vegetation with water conservation functions such as pine oak forest, poplar, birch forest, or shrub herb should be strictly protected. Over-exploitation, over-grazing, over-reclamation, and other production activities seriously harmful to water source protection should be prohibited. Meanwhile, the natural environmental conditions with elevations above 1000 m and slope gradients > 25°, all of which restrict the intensity and scope of human activities [53].
At the same time, the forest cover of the secondary water source reserve accounts for more than 90% of the area of Yunmeng Mountain National Geopark, Yunfeng Mountain Nature Reserve, Yunmeng Mountain Forest Park, etc. The soil type is mainly brown soil. In this area, interference activities caused by human disturbance should be restricted, and original forest vegetation should be protected.
The third type, including the transitions between water bodies and forest (grassland), is distributed alongside the water body. This occurred under natural conditions and showed no obvious impacts on soil erosion.
However, our current work has some limitations. First, we did not have sufficient information to explore changing intensity and fertilizer use in cropland. In this paper, the nutrient data, such as those on N and P, depended on the local statistical data and previous research, which were available from an existing database [58]. Fertilizer control and management should be implemented in cultivation areas to control water eutrophication. Furthermore, there was a lack of detailed information on other pollution sources, such as the rural waste discharge from built-up land at the countryside scale. Second, due to the field data of the monitoring site, the spatial characteristics of sediment yields were not taken into consideration in this study. A previous study indicated that incorrect land-use activities could accelerate soil erosion and result in large increases in sediment inflow into streams [7], such as deforestation, grazing and unscientific agricultural practices. Therefore, more efforts are needed to consider all aspects of land use and quantify their impacts on water quality [58].

5. Conclusions

This study used remote sensing data from different periods and GIS in combination with empirical RUSLE modeling to analyze the spatiotemporal changes in LULCC and its consequences on regional soil erosion in a mountainous watershed at the county level from 2003 to 2013. In particular, the changing relationships between the transformation of different land uses and soil erosion were revealed.
Forest and light soil erosion showed remarkable increases over areas of 243.44 and 587.46 km2, respectively. This result indicates that the regional eco-environment quality has improved under the implementation of ecological protection measures. The increasing area of forest reflects the development of vegetation cover, the change in land-use structure, reduction in soil erosion, and rehabilitation of degraded land. However, extremely severe soil erosion increased by 8.01 km2 over the study period, particularly in regions with slope gradients of >25° due to the conversion of forest to cropland. The extent of unused land and moderate soil erosion decreased by 161.88 km2 (7.27%) and 445.21 km2 (20.00%), respectively.
These findings suggest that integrating RS, GIS technology, and the RUSLE model is a feasible way to estimate the changing relationship between soil erosion and LULCC at the county level around the Miyun Reservoir. Moreover, since the Miyun Reservoir is the primary drinking water source for Beijing, the local government should carry out rational land-use activities by optimizing the land-use structure, improving the efficiency of land use, and guaranteeing local ecological safety. We should conscientiously continue implementing the GGP and NFPP to restore the ecological environment and make appropriate soil conservation decisions.

Author Contributions

All authors contributed extensively to the work presented in this paper. W.G., T.L. and Z.Q. contributed to the subject of research, analysis of study data, and the writing of the paper. W.G., T.L., Z.Q. and X.D. adjusted the parameters and processed the data. Y.Z., Y.S. and X.T. proofread the data and provided the basics for the optimization of the figures. All authors have read and agreed to the published version of the manuscript.

Funding

This research was supported by the Natural Scientific Foundation of Hainan Province, grant number 621RC507; the National Natural Science Foundation of China, grant number 32160364; the Hainan Provincial Key Research and Development Plan of China, grant number ZDYF2021SHFZ110; the Hainan Provincial Natural Science Foundation of China, grant number 421MS013; the Science and Technology Project of Haikou City, China, grant number 2020-057; and the Natural Science Foundation of Hainan University, grant numbers KYQD (ZR) 20058 and 1863.

Institutional Review Board Statement

Not applicable.

Informed Consent Statement

Not applicable.

Data Availability Statement

Our remote sensing data were supported by GloVis (https://glovis.usgs.gov/ (accessed on 24 August 2003) as part of the database of Geospatial Data Cloud (http://www.gscloud.cn/ (accessed on 15 September 2013) and the local government.

Acknowledgments

We appreciate the staff of the platform for Wuzhishan Ecological Station, the 3S laboratory of Hainan University, the Key Laboratory of Germplasm Resources of Tropical Special Ornamental Plants of Hainan Province, and the Haikou Urban Forestry Engineering Technology Development and Research Center. We thank international English teacher Steve Harding for his assistance in language editing. We also want to express our respect and thanks to the anonymous reviewers and the editors for their helpful comments in improving the quality of this paper.

Conflicts of Interest

The authors declare no conflict of interest.

References

  1. Park, S.; Oh, C.; Jeon, S.; Jung, H.; Choi, C. Soil erosion risk in Korean watersheds, assessed using the revised universal soil loss equation. J. Hydrol. 2011, 399, 263–273. [Google Scholar] [CrossRef]
  2. Wang, X.; Zhao, X.; Zhang, Z.; Yi, L.; Zuo, L.; Wen, Q.; Liu, F.; Xu, J.; Hu, S.; Liu, B. Assessment of soil erosion change and its relationships with land use/cover change in China from the end of the 1980s to 2010. Catena 2016, 137, 256–268. [Google Scholar] [CrossRef]
  3. Ochoa, P.A.; Fries, A.; Mejia, D.; Burneo, J.I.; Ruiz-Sinoga, J.D.; Cerda, A. Effects of climate, land cover and topography on soil erosion risk in a semiarid basin of the Andes. Catena 2016, 140, 31–42. [Google Scholar] [CrossRef]
  4. Wang, Z.-J.; Jiao, J.-Y.; Rayburg, S.; Wang, Q.-L.; Su, Y. Soil erosion resistance of “Grain for Green” vegetation types under extreme rainfall conditions on the Loess Plateau, China. Catena 2016, 141, 109–116. [Google Scholar] [CrossRef]
  5. Wang, N.; Jiao, J.Y.; Bai, L.C.; Zhang, Y.F.; Chen, Y.X.; Tang, B.Z.; Liang, Y.; Zhao, C.J.; Wang, H.L. Magnitude of soil erosion in small catchments with different land use patterns under an extreme rainstorm event over the Northern Loess Plateau, China. Catena 2020, 195, 104780. [Google Scholar] [CrossRef]
  6. Liu, L.C.; Dong, X.F.; Wang, J.H. Dynamic analysis of eco-environmental changes based on remote sensing and geographic information system: An example in Longdong region of the Chinese Loess Plateau. Environ. Geol. 2007, 53, 589–598. [Google Scholar] [CrossRef]
  7. Pimentel, D.; Kounang, N. Ecology of Soil Erosion in Ecosystems. Ecosystems 1998, 1, 416–426. [Google Scholar] [CrossRef]
  8. Lu, X.; Zhang, Y.; Lin, C.; Wu, F. Evolutionary Overview and Prediction of Themes in the Field of Land Degradation. Land 2021, 10, 241. [Google Scholar] [CrossRef]
  9. Gholami, V.; Booij, M.J.; Nikzad Tehrani, E.; Hadian, M.A. Spatial soil erosion estimation using an artificial neural network (ANN) and field plot data. Catena 2018, 163, 210–218. [Google Scholar] [CrossRef]
  10. Ministry of Environmental Protection; National Bureau of Statistics. Bulletin of First National Census for Water; Bulletin of First National Census for Water: Beijing, China, 2013; Available online: http://www.hrcshp.org/shp/en/pdf/2013/2013.pdf (accessed on 26 March 2013).
  11. Zare, M.; Panagopoulos, T.; Loures, L. Simulating the impacts of future land use change on soil erosion in the Kasilian watershed, Iran. Land Use Policy 2017, 67, 558–572. [Google Scholar] [CrossRef]
  12. Schowanek, D.; David, H.; Francaviglia, R.; Hall, J.; Kirchmann, H.; Krogh, P.H.; Schraepen, N.; Smith, S.; Wildemann, T. Probabilistic risk assessment for linear alkylbenzene sulfonate (LAS) in sewage sludge used on agricultural soil. Regul. Toxicol. Pharm. 2007, 49, 245–259. [Google Scholar] [CrossRef] [PubMed]
  13. Rompaey, A.J.J.V.; Govers, G. Data quality and model complexity for regional scale soil erosion prediction. Int. J. Geogr. Inf. Sci. 2002, 16, 663–680. [Google Scholar] [CrossRef]
  14. Huang, W.; Ho, H.C.; Peng, Y.; Li, L. Qualitative risk assessment of soil erosion for karst landforms in Chahe town, Southwest China: A hazard index approach. Catena 2016, 144, 184–193. [Google Scholar] [CrossRef]
  15. Xu, L.F.; Xu, X.G.; Meng, X.W. Risk assessment of soil erosion in different rainfall scenarios by RUSLE model coupled with Information Diffusion Model: A case study of Bohai Rim, China. Catena 2013, 100, 74–82. [Google Scholar] [CrossRef]
  16. Jain, S.K.; Kumar, S.; Varghese, J. Estimation of soil erosion for a Himalayan watershed using GIS technique. Water Resour. Manag. 2001, 15, 41–54. [Google Scholar] [CrossRef]
  17. Nyakatawa, E.Z.; Reddy, K.C.; Lemunyon, J.L. Predicting soil erosion in conservation tillage cotton production systems using the revised universal soil loss equation (RUSLE). Soil Tillage Res. 2001, 57, 213–224. [Google Scholar] [CrossRef]
  18. Chen, T.; Niu, R.Q.; Wang, Y.; Li, P.X.; Zhang, L.P.; Du, B. Assessment of spatial distribution of soil loss over the upper basin of Miyun reservoir in China based on RS and GIS techniques. Environ. Monit. Assess. 2011, 179, 605–617. [Google Scholar] [CrossRef]
  19. Ostovari, Y.; Ghorbani-Dashtaki, S.; Bahrami, H.-A.; Naderi, M.; Dematte, J.A.M. Soil loss estimation using RUSLE model, GIS and remote sensing techniques: A case study from the Dembecha Watershed, Northwestern Ethiopia. Geoderma Reg. 2017, 11, 28–36. [Google Scholar] [CrossRef]
  20. Cerri, C.E.P.; Demattě, J.A.M.; Ballester, M.V.R.; Martinelli, L.A.; Victoria, R.L.; Roose, E. Gis Erosion Risk Assessment of the Piracicaba River Basin, Southeastern Brazil. Mapp. Sci. Remote Sens. 2013, 38, 157–171. [Google Scholar] [CrossRef]
  21. Feng, X.; Wang, Y.; Chen, L.; Fu, B.; Bai, G. Modeling soil erosion and its response to land-use change in hilly catchments of the Chinese Loess Plateau. Geomorphology 2010, 118, 239–248. [Google Scholar] [CrossRef]
  22. Alatorre, L.C.; Beguería, S.; Lana-Renault, N.; Navas, A.; García-Ruiz, J.M. Soil erosion and sediment delivery in a mountain catchment under scenarios of land use change using a spatially distributed numerical model. Hydrol. Earth Syst. Sci. 2012, 16, 1321–1334. [Google Scholar] [CrossRef] [Green Version]
  23. López-Vicente, M.; Poesen, J.; Navas, A.; Gaspar, L. Predicting runoff and sediment connectivity and soil erosion by water for different land use scenarios in the Spanish Pre-Pyrenees. Catena 2013, 102, 62–73. [Google Scholar] [CrossRef]
  24. Lizaga, I.; Quijano, L.; Palazón, L.; Gaspar, L.; Navas, A. Enhancing Connectivity Index to Assess the Effects of Land Use Changes in a Mediterranean Catchment. Land Degrad. Dev. 2018, 29, 663–675. [Google Scholar] [CrossRef] [Green Version]
  25. Jazouli, A.E.; Barakat, A.; Khellouk, R.; Rais, J.; Baghdadi, M.E. Remote sensing and GIS techniques for prediction of land use land cover change effects on soil erosion in the high basin of the Oum Er Rbia River (Morocco). Remote Sens. Appl. Soc. Environ. 2019, 13, 361–374. [Google Scholar] [CrossRef]
  26. Romano, G.; Abdelwahab, O.M.M.; Gentile, F. Modeling land use changes and their impact on sediment load in a Mediterranean watershed. Catena 2018, 163, 342–353. [Google Scholar] [CrossRef]
  27. Chen, T.; Niu, R.-Q.; Li, P.-X.; Zhang, L.-P.; Du, B. Regional soil erosion risk mapping using RUSLE, GIS, and remote sensing: A case study in Miyun Watershed, North China. Environ. Earth Sci. 2010, 63, 533–541. [Google Scholar] [CrossRef]
  28. Luo, W.; Lu, Y.; Zhang, Y.; Fu, W.; Wang, B.; Jiao, W.; Wang, G.; Tong, X.; Giesy, J.P. Watershed-scale assessment of arsenic and metal contamination in the surface soils surrounding Miyun Reservoir, Beijing, China. J. Environ. Manage. 2010, 91, 2599–2607. [Google Scholar] [CrossRef] [PubMed]
  29. Yin, Z.Y.; Liu, Y.; Pan, Y.C. Evaluation and Classification of Rural Multifunction at a Grid Scale: A Case Study of Miyun District, Beijing. Sustainability 2021, 13, 6362. [Google Scholar] [CrossRef]
  30. Miyun District People’s Government of Beijing Municipality, Statistical Yearbook of Miyun District, Beijing. Available online: http://www.bjmy.gov.cn/col/col74/index.html (accessed on 14 January 2014).
  31. Li, X.S.; Wu, B.F.; Zhang, L. Dynamic monitoring of soil erosion for upper stream of Miyun Reservoir in the last 30 years. J. Mt. Sci. 2013, 10, 801–811. [Google Scholar] [CrossRef]
  32. Huang, J.; Ebach, M.C.; Triantafilis, J. Cladistic analysis of Chinese Soil Taxonomy. Geoderma Reg. 2017, 10, 11–20. [Google Scholar] [CrossRef]
  33. Perović, V.; Životić, L.; Kadović, R.; Đorđević, A.; Jaramaz, D.; Mrvić, V.; Todorović, M. Spatial modelling of soil erosion potential in a mountainous watershed of South-eastern Serbia. Environ. Earth Sci. 2012, 68, 115–128. [Google Scholar] [CrossRef]
  34. Tang, Q.; Xu, Y.; Bennett, S.J.; Li, Y. Assessment of soil erosion using RUSLE and GIS: A case study of the Yangou watershed in the Loess Plateau, China. Environ. Earth Sci. 2014, 73, 1715–1724. [Google Scholar] [CrossRef] [Green Version]
  35. Bini, C.; Gemignani, S.; Zilocchi, L. Effect of different land use on soil erosion in the pre-alpine fringe (North-East Italy): Ion budget and sediment yield. Sci. Total Environ. 2006, 369, 433–440. [Google Scholar] [CrossRef]
  36. Islam, K.; Jashimuddin, M.; Nath, B.; Nath, T.K. Land use classification and change detection by using multi-temporal remotely sensed imagery: The case of Chunati wildlife sanctuary, Bangladesh. Egypt. J. Remote Sens. Space Sci. 2018, 21, 37–47. [Google Scholar] [CrossRef]
  37. Foody, G.M. Status of land cover classification accuracy assessment. Remote Sens. Environ. 2002, 80, 185–201. [Google Scholar] [CrossRef]
  38. Abdulkareem, J.H.; Pradhan, B.; Sulaiman, W.N.A.; Jamil, N.R. Prediction of spatial soil loss impacted by long-term land-use/land-cover change in a tropical watershed. Geosci. Front. 2019, 10, 389–403. [Google Scholar] [CrossRef]
  39. Rizeei, H.M.; Saharkhiz, M.A.; Pradhan, B.; Ahmad, N. Soil erosion prediction based on land cover dynamics at the Semenyih watershed in Malaysia using LTM and USLE models. Geocarto Int. 2016, 31, 1158–1177. [Google Scholar] [CrossRef]
  40. Jiao, J.; Zou, H.; Jia, Y.; Wang, N. Research progress on the effects of soil erosion on vegetation. Acta Ecol. Sin. 2009, 29, 85–91. [Google Scholar] [CrossRef]
  41. Lu, Y.; Fu, B.; Feng, X.; Zeng, Y.; Liu, Y.; Chang, R.; Sun, G.; Wu, B. A policy-driven large scale ecological restoration: Quantifying ecosystem services changes in the Loess Plateau of China. PLoS ONE 2012, 7, e31782. [Google Scholar] [CrossRef]
  42. Fu, L.; Zhao, D.; Wu, B.; Xu, Z.; Zeng, Y. Variations in forest aboveground biomass in Miyun Reservoir of Beijing over the past two decades. J. Soils Sediments 2017, 17, 2080–2090. [Google Scholar] [CrossRef]
  43. Beijing Municipal Development and Reform Commission, Ecological Environment Construction Plan of Beijing During the Tenth Five-Year Plan Period. Available online: http://fgw.beijing.gov.cn/fgwzwgk/ghjh/wngh/swsq/202003/t20200331_1751770.htm (accessed on 5 November 2007).
  44. Hu, Y.; Kong, X.; Zheng, J.; Sun, J.; Wang, L.; Min, M. Urban Expansion and Farmland Loss in Beijing during 1980–2015. Sustainability 2018, 10, 3927. [Google Scholar] [CrossRef] [Green Version]
  45. Niu, R.-Q.; Du, B.; Wang, Y.; Zhang, L.-P.; Chen, T. Impact of fractional vegetation cover change on soil erosion in Miyun reservoir basin, China. Environ. Earth Sci. 2014, 72, 2741–2749. [Google Scholar] [CrossRef]
  46. Huang, S.; Ye, Z.; Liu, B. Review on non-point source pollution in Miyun Reservoir. Chin. J. Eco-Agric. 2008, 67, 1311–1316. [Google Scholar] [CrossRef]
  47. Wang, X.; Wang, Y.-X.; Cai, X.; Qian, X.; Ting, L. Investigation of non-point pollution in watershed of Miyun Reservoir. Environ. Sci. Technol. 2002, 25, 1–3. [Google Scholar] [CrossRef]
  48. Tilman, D.; Cassman, K.G.; Matson, P.A.; Naylor, R.; Polasky, S. Agricultural sustainability and intensive production practices. Nature 2002, 418, 671–677. [Google Scholar] [CrossRef]
  49. Yan, S.J.; Wang, X.; Cai, Y.P.; Li, C.H.; Yan, R.; Cui, G.N.; Yang, Z.F. An Integrated Investigation of Spatiotemporal Habitat Quality Dynamics and Driving Forces in the Upper Basin of Miyun Reservoir, North China. Sustainability 2018, 10, 4625. [Google Scholar] [CrossRef] [Green Version]
  50. Zhang, P.; He, L.; Fan, X.; Huo, P.S.; Liu, Y.H.; Zhang, T.; Pan, Y.; Yu, Z.R. Ecosystem Service Value Assessment and Contribution Factor Analysis of Land Use Change in Miyun County, China. Sustainability 2015, 7, 7333–7356. [Google Scholar] [CrossRef] [Green Version]
  51. Gebreslassie, H. Land Use-Land Cover dynamics of Huluka watershed, Central Rift Valley, Ethiopia. Int. Soil Water Conserv. Res. 2014, 2, 25–33. [Google Scholar] [CrossRef] [Green Version]
  52. Yan, R.; Zhang, X.; Yan, S.; Chen, H. Estimating soil erosion response to land use/cover change in a catchment of the Loess Plateau, China. Int. Soil Water Conserv. Res. 2018, 6, 13–22. [Google Scholar] [CrossRef]
  53. Gong, W.; Wang, H.; Wang, X.; Fan, W.; Stott, P. Effect of terrain on landscape patterns and ecological effects by a gradient-based RS and GIS analysis. J. For. Res. 2017, 28, 1061–1072. [Google Scholar] [CrossRef]
  54. Xin, Z.; Yu, X.; Lu, X. Factors controlling sediment yield in China’s Loess Plateau. Earth Surf. Process. Landf. 2011, 36, 816–826. [Google Scholar] [CrossRef]
  55. Lesschen, J.P.; Kok, K.; Verburg, P.H.; Cammeraat, L.H. Identification of vulnerable areas for gully erosion under different scenarios of land abandonment in Southeast Spain. Catena 2007, 71, 110–121. [Google Scholar] [CrossRef]
  56. Zhou, W.; Wu, B. Assessment of soil erosion and sediment delivery ratio using remote sensing and GIS: A case study of upstream Chaobaihe River catchment, north China. Int. J. Sediment. Res. 2008, 23, 167–173. [Google Scholar] [CrossRef]
  57. Miyun District People’s Government of Beijing Municipality, Notice of Miyun County People’s Government on Printing and Distributing the Implementation Plan of Pilot Demonstration Construction of Miyun County Main Function Zone. Available online: http://www.beijing.gov.cn/zhengce/gfxwj/201905/t20190523_69693.html (accessed on 2 July 2015).
  58. Xu, E.; Zhang, H. Aggregating land use quantity and intensity to link water quality in upper catchment of Miyun Reservoir. Ecol. Indic. 2016, 66, 329–339. [Google Scholar] [CrossRef]
Figure 1. Location of the study area in China.
Water 14 00742 g001
Figure 2. Erodibility factor maps of the RUSLE model in different periods.
Water 14 00742 g002
Figure 3. Land use and land cover of the study region in 2003 and 2013.
Water 14 00742 g003
Figure 4. Annual soil loss erosion map of the study area in 2003 and 2013.
Water 14 00742 g004
Figure 5. Overlay analysis map of land-use change and soil erosion for 2003 and 2013.
Water 14 00742 g005
Figure 6. Main function zoning map of Miyun County.
Water 14 00742 g006
Table 1. Error matrix for the classification method in 2003.
Class NameCroplandForestGrasslandWater BodyBuilt-Up LandUnused LandTotalUser’s
Accuracy
Cropland2520021300.8333
Forest1412002460.8913
Grassland5229002380.7632
Water body0011801200.90
Built-up land2100193250.76
Unused land1110127310.871
Total344733182236190
Producer’s accuracy0.73530.87230.87881000.86360.75
Overall classification accuracy = 83.68%; kappa statistics = 0.8012.
Table 2. Error matrix for the classification method in 2013.
Class NameCroplandForestGrasslandWater BodyBuilt-Up LandUnused LandTotalUser’s
Accuracy
Cropland2610120300.8667
Forest0432001460.9348
Grassland2133002380.8684
Water body0001811200.9000
Built-up land1100212250.8400
Unused land0220126310.8387
Total294837192532190
Producer’s accuracy0.89660.89580.89190.94740.84000.8125
Overall classification accuracy = 87.89%; kappa statistics = 0.8524.
Table 3. Soil erosion risk level and intensity.
Erosion Risk LevelIntensitySoil Loss (t ha−1 Year−1)
Very lowSlight<10
LowLight10–25
ModerateModerate25–50
SevereSevere50–80
Very severeVery severe80–150
Extremely severeExtremely severe>150
Table 4. Land-use changes from 2003 to 2013 in the study region.
Land-Use Types20032013Area Change (km2)
Area (km2)Proportion of Total (%)Area (km2)Proportion of Total (%)
Cropland206.569.28272.5912.2566.03
Forest1073.9348.241317.3759.18243.44
Grassland258.3511.61120.195.40−138.16
Water body100.984.53109.994.949.01
Built-up land176.997.95158.557.12−18.44
Unused land409.2718.39247.3911.11−161.88
2226.091002226.09100
Table 5. Transition matrix of different land-use types from 2003 to 2013 (%).
2013CroplandForestGrasslandWater BodyBuilt-Up LandUnused Land
2003
Cropland53.7214.6510.340.5910.839.87
Forest1.9388.562.880.410.395.83
Grassland28.8037.8013.850.963.7114.88
Water body0.444.280.0490.410.814.02
Built-up land13.603.752.202.2961.2616.90
Unused land10.0454.747.141.962.9523.17
Table 6. Soil erosion changes from 2003 to 2013 in the study region.
Soil Erosion Types2003 2013Area Change (km2)
Area (km2)Proportion of Total (%)Area (km2)Proportion of Total (%)
Slight544.9524.48536.9324.12−8.02
Light479.9521.561067.4147.95587.46
Moderate1013.9845.55568.7725.55−445.21
Severe155.386.9812.690.57−142.69
Very severe30.271.3629.161.31−1.11
Extremely severe1.560.0711.130.509.57
Sum2226.091002226.09100
Table 7. Transition matrix of different land-use types from 2003 to 2013 (%).
2013SlightLightModerateSevereVery SevereExtremely Severe
2003
Slight96.313.560.140.000.000.00
Light1.4094.444.150.000.010.00
Moderate0.5657.5641.090.250.460.09
Severe0.036.5178.080.3414.750.30
Very severe0.030.6733.7731.185.3728.98
Extremely severe0.000.001.685.320.4092.60
Publisher’s Note: MDPI stays neutral with regard to jurisdictional claims in published maps and institutional affiliations.

