
Mapping and Visualizing Global Knowledge on Intermittent Water Supply Systems


Department of Civil Engineering & Sustainable Structures, Department of Building Engineering and Environment, Palestine Technical University (Kadoorie), Tulkarem P304, Palestine
Water 2022, 14(5), 738; https://doi.org/10.3390/w14050738
Submission received: 30 December 2021
/
Revised: 11 February 2022
/
Accepted: 21 February 2022
/
Published: 25 February 2022
(This article belongs to the Special Issue Intermittent Water Supply)
Abstract
:Intermittent water supply systems (IWSSs) are prevalent in most developing countries and some developed ones. Their usage is driven by necessity rather than as a principal objective, mostly due to technical and economic deficiencies. Major health risks and socio-economic inequities are associated with such systems. Their impacts are aggravated by climate changes and the COVID-19 crisis. These are likely to have profound implications on progress toward advancing sustainable development goals (SDGs). Motivated by providing a comprehensive overview of global knowledge on IWSSs, the present work proposed to track and analyze research works on IWSSs utilizing bibliometric techniques and visual mapping tools. This includes investigating the trends and growth trajectories of research works on IWSSs and analyzing the various approaches proposed to expand our understanding with respect to the management, modeling, optimization, and impacts of IWSSs. The national and international contributions and collaboration figures are further analyzed at country, institution, author, and source levels. This analysis indicates that research works conducted on IWSSs have certain expectations in terms of productivity (total global productivity; 197 documents). The United States was the best country in terms of productivity (58 documents; 29.4%), while the Water Switzerland journal was the most productive journal (19 documents; 9.6%). The impacts of IWSSs on health and well-being have attracted considerable attention. The outcomes showed deep and justified worries in relation to the transition from intermittent to continuous supply, equity, and mitigating the health risks associated with IWSSs in the foreseen future. The utilization of artificial intelligence techniques and expert systems will drive and shape future IWSS-related research activities. Therefore, investments in this regard are crucial.
1. Introduction
Intermittent water supply systems (IWSSs) are water systems providing water services to their customers for less than 24 h a day or less than a few days a week [1,2]. Such an operation model is counterproductive to the goals of water supply networks which ought to assure a water service providing their customers with sufficient quantities of water at a good quality, as in the case of continuous water supply systems. A continuous water service represents the typical water supply service that considers all issues of water quantity, quality, convenience, price and reliability [3]. As an optimal operating system, the inputs to the networks and the hydraulic capacity in a continuous water supply system are enough to satisfy the needs of customers [4]. It is possible to achieve the first part by relying on the availability of water resources (the network is always full). In terms of hydraulic capacity, the system should have enough pressure (positive pressure) to fulfill the end-users’ demands at any time [5]. The preceding requirements have to be accompanied by sustainable management plans for water systems. Continuous water supply services are prevalent in developed and wealthy countries, where customers are able to acquire their water demands at a full pressure 24 h/day, 7 days/week. This is driven by the availability of water resources, conveyance means, and an appropriate infrastructure of water distribution [6].
IWSSs are common in developing regions and territories across the globe [7,8,9]. Their footprint has started to expand and increase in developed territories [3]. The adoption of intermittent supply services is functional in cases of water scarcity to control the water demand and to distribute the available water to all consumers in a rational and unbiased way. The origin of IWSSs is as an outcome and not a planned approach. Their usage is driven by the inaccessibility of other management plans that may eliminate the risk of water scarcity and other deficiencies. Therefore, their usage is ruled by necessity rather than being a principal purpose [6]. The intensive usage of IWSSs in developing regions is mainly derived from water scarcity and economic and technical deficits [10]. Moreover, the remarkable shifts in population growth, urbanization, and climatic changes [11,12,13,14] pose unfavorable stresses on already rare water resources and on water systems, mainly in developing regions, with limited financial resources. IWSSs are further vulnerable to climatic changes, entailing an urgent need for improvements [15].
It is extensively reported that almost all water supply systems in developing countries are intermittent [4,5,6,16,17,18,19,20,21,22,23,24,25]. In Southeast Asia and India, the proportion of water supply systems that are running in intermittent mode is estimated at 90% and nearly 100%, respectively [26]. One-third, more than half, and almost two-thirds of water systems in Africa, Asia, and Latin America, respectively, are running in intermittent mode [27].
Users of IWSSs are forced to employ ground/roof private storage tanks as a means of collecting water during the unavailable periods of the water supply service [28,29,30], and rely on the presence of sufficient pressure in the system [31] to use water when the service is disconnected [28,32]. In some cases, users are forced to buy their water via tanker trucks from surface bodies or groundwater wells [33,34]. The periodical pattern of filling and emptying each zone in the intermittent systems [35] fails to comply with the principles of continuous supply systems, as mentioned previously, which governed by the assumptions of a steady-state flow [31] and the process of continuously filling with water under pressure [17,36]. The presence of storage tanks forces the network to operate in conditions that are different from the original ones, found in the design assumptions. For low-level portions, the flows are much higher than the ones in the design and continue until the storage tanks are filled, and then the range of supply service can extend to cover disadvantaged areas (far away from the source, or at higher elevations) [6]. In addition, the pressures in the network are controlled by the levels of water in the tanks, and are generally lower than the design values [37].
The intermittent supply practices contribute, in conditions of water scarcity, to reducing background water losses without consuming a high financial potential [30]. The prolonged use of this technique may have adverse impacts; the rates of pipes deterioration could increase due to water hammers being stimulated by the emptying and filling of the network [35]. Moreover, the mechanical stability of the pipes will also be affected by the transient phenomena [16] due to pressure surges and pressure fluctuations [38,39]. This will increase the rate of bursts and leakages [40]. Accordingly, the intermittent water supply mode can only be a legitimate approach if used as an intermediate solution [41,42] and not as a terminal solution.
Another relevant and important aspect is the quality of water [43,44]. The low pressure or even negative pressure due to intermittent feeding and pressure deficits causes stagnation of water in the pipes [26]. This allows the contaminated water and soil particles to enter the pipes through leaks from the surrounding soil [40]. The serious threat, with fatal consequences, arises where defective sewers run in parallel to water pipes [26,39]. Moreover, the length of water residence time in tanks increases the vulnerability to the hazards of water pathogen contamination [26,27,45], especially since most consumers tend to utilize oversized tanks with respect to their real needs [40] to collect as much water as possible during the supply periods.
Following its characterization as being inequitable in terms of water quantity and quality, the hydraulic scheme of IWSSs is different from the demand-driven scheme, as in continuous supply systems, in which the node water demand is dependent on the actual user consumption [35]. In IWSSs, it is dependent on the water heads in the nodes. High load factors caused by extracting relatively large amounts of water in short time periods lead to major head losses and pressure shortfalls [26,39]. Figure 1 demonstrates the major deficiencies associated with IWSSs.
In conclusion, the IWSSs can be considered a dilemma with severe and multiple implications. The IWSSs’ implications encompass public health, economics, politics, geopolitics, and social stability. Such a crisis will have profound implications on progress toward advancing the sustainable development goals (SDGs) adopted by all United Nations member states in 2015 and approved to be achieved by 2030 within The 2030 Agenda for Sustainable Development. While the hardest-hit goal is SDG-6, which ensures reliable access to water and sanitation for all, most SDGs are impacted in some way. This is because the 17 SDGs are linked and integrated, recognizing that non-fulfillment of one goal would impact others. Therefore, there is a strong debate among the water scientific community, water utilities, and policymakers regarding whether it is realistic to expect that the SDGs will be achieved by 2030 without solving IWSS-related issues, mainly in developing countries. In light of the COVID-19 pandemic, the crisis is aggravated as the risks of transmission of COVID-19 are expected to increase via contaminated drinking water sources, as in the case of IWSSs [47]. Moreover, while hand hygiene is crucial in reducing COVID-19 transmission, it is acknowledged that millions of people lack access to continuous water services [48]. This negatively impacts handwashing practices and consequently impacts the endeavors to combat the spread of the pandemic.
Motivated by providing an inclusive overview of endeavors to advance our understanding of the structure and dynamics of global research activities on IWSSs, the present work proposed to track and analyze research works and global knowledge of IWSSs from a bibliometric perspective. The major objectives to be addressed include: investigating the trends and growth trajectories of research works on IWSSs; the topical foci of research activities on this topic. The identification of national and international contributions toward this research topic will be a further objective. This will be examined at the country, institution, author, and source levels. The present status of IWSSs research will be analyzed with the aim of developing new proposals to steer research activities in the future. This will assist in suggesting novel avenues and locating research investments. Such an analysis provides academics, researchers, and policymakers with information regarding research gaps to direct future research activities in the field. It will indicate the extent of national and international preparedness to combat the adverse impacts associated with IWSSs. This can be concluded by examining the endeavors of countries, national institutions, etc., regarding this issue, as countries, institutions, etc., with significant contributions have strong concerns regarding this issue. Furthermore, revealing the prolific actors in the field (authors, institutions, sources, etc.) will facilitate research collaboration teaming global efforts with the aim of reaching potential solutions to IWSS challenges.
Bibliometric methods and visualization mapping tools were used to better achieve the objectives of the present work. These methods offer a wide variety of mathematical and statistical tools to characterize the significant features, structures, and patterns of the underlying science [49]. Such techniques can be applied at various levels, from the micro-level (that is, institutions) to the macro-level (that is, countries and regions). The present work is the first of its style in the literature that addresses IWSS research works. It will act as a source that can help scholars to identify the existing research priorities and other essential bibliometric information.
The current work is formulated as follows: Section 2 is a theoretical background providing an overview of the major causes of intermittent water supply. Section 3 displays the methodological approach used, while Section 4 analyzes and discusses the major findings. The last section, Section 5, draws the major conclusions.
2. Causes of Intermittent Water Supply
2.1. Water Scarcity/Physical Scarcity
This cause is a critical environmental issue [50]. It is associated with the unavailability of enough water from the chosen source to satisfy the desired demands of the customers. In water supply management systems, this issue has been deemed the most complicated [42]. This scarcity could be an output of different natural origins including drought, aridity, anthropogenic activities causing desertification, and overexploitation of surface water and groundwater [51]. The boom in water demands related specifically to urbanization, population growth [52], and socio-economic advancements [53] are foremost contributors to the water shortage and low availability of water that will aggravate the physical scarcity cases in the foreseen future.
The restrictions imposed on the development of additional water sources to meet the needs of consumers in some regions, interregional and international disputes [54] are further contributors to water scarcity cases. These make the introduction of the intermittent model to distribute the available quantities of water an inevitable action. In the short term, this model of operation is a viable solution to water scarcity conditions [55]. It can be considered as a demand management tactic that assures the systematic and well-planned usage of restricted water amounts and supplies [36]. To alleviate water scarcity conditions more efficiently, some major strategies should be followed, in addition to the demand management plans, including the reuse of water, improvements in irrigation efficiency, transboundary water management projects, and water–energy linkages [56].
2.2. Economic Deficiencies/Economic Scarcity
The inefficacy of water utilities in developing water infrastructures and new water sources because of inappropriate planning strategies and/or financial deficits contributes to economic water scarcity. Supply disruptions and the unfair distribution of water will become clear in cases of failure to boost the water supply and distribution infrastructures’ capacities and develop the new water sources that are essential to fulfill the rising demands of population growth, industrial and agricultural activities, etc. [51]. The problem derives from the failure to constantly deliver water to all consumers once the hydraulic capacities of the networks have been exhausted. Subsequently, the source’s ability to meet the required demands is exhausted [42]. This issue could be solved by well-planned and greater investments in the water sector.
2.3. Technical Deficiencies
The technical deficiencies are mainly caused by failures in acquiring complete knowledge with respect to water systems and their future requirements [26]. This includes insufficient planning and failure to consider the overarching water systems notions that are crucial in maintaining the overall stability and functionality of the whole water system. The primary causes that contribute to intermittent supply services include the expansion of distribution, and supply networks neglecting their hydraulic ability to meet the growing demand, failures to build an inclusive framework of integral and precise metering, imperfect collection and charging systems and insufficient tariff, non-revenue water at high rates due to illegal connections, and leakage [3]. Water wastage and ill-structured operation and maintenance actions are additional causes [42]. These practices mainly result from poor and mismanaged conceptions. The exacerbation of the previous symptoms is an inevitable result of deficits in forming a comprehensive framework with an adequate recognition of systems’ concepts, knowledge, and planning [26].
There are instances where all formerly stated deficiencies are synchronized with each other, as in the case of Palestinian water systems. In such a case, there is an incomplete control over water resources [57,58,59], high rates of non-revenue water, poor design, increasing demand, dissimilarities in tariff ranges, and scant financial resources [6]. In other examples, as in the case of Kathmandu, India, the most prevalent deficiencies are technical ones [3]. It is clear that different natural, political, economic, social, and technical aspects interplay and contribute to the development and sustenance of water supply intermittency [60].
3. Materials and Methods
3.1. Data Source
Scopus database, a well-known and inclusive scientific literature database, was the major source of the data required for this analysis. It is possible to source sufficient relevant information regarding the published works (authors, countries, affiliations, references, keywords, citations, date of publication, etc.) [61]. Most bibliometric studies use the Scopus database in addition to the other three well-known scientific literature databases, Google Scholar, Web of Science, and PubMed, to perform the required analyses [62]. Scopus and Web of Science databases are characterized by following very restricted standards and measures with respect to the insertion of different literature sources (journals, proceedings, etc.) [63]. A major characteristic of the Scopus database is its higher flexibility compared to other databases in terms of offering a comprehensive summary of the different fields of research. Moreover, it has robust search tools that facilitate more advanced evaluations of the compiled data.
3.2. Strategy of Search
In the Scopus database, all subjects’ fields were considered during the search phase while gathering the required data and information, including physical, social, health, and life sciences. We used the following terms in the search query, with relevance to IWSS: intermittent, water, supply, and distribution. The final query string was concerned with searching for relevant terms in the titles and abstracts of published works until 1 October 2021. Articles and reviews documents were considered for further analysis, while other types of published works (notes, editorial, conference papers, short communication, etc.) were eliminated. The resultant search query looks like this: TITLE-ABS (“Intermittent”) AND TITLE-ABS (“Water”) AND (TITLE-ABS (“Supply”) OR TITLE-ABS (“distribution”)) AND ((LIMIT-TO (DOCTYPE, ”ar”) OR LIMIT-TO (DOCTYPE, ”re”)).
In search queries within Scopus database, terms and expressions that are restricted by double quotes are regarded as one unity. They ought to appear in the precise arrangement as considered in the search query. The Boolean operators OR and AND can be used to merge the different elements of the search query. In the search query “ar” and “re” refer to articles and reviews, respectively. The process of searching and collecting all required information was carried out within 1 day, 1 October 2021. This is necessary to avert all possible biases as an outcome of the regular updating of the Scopus database. This phase was followed by a manual screening of all collected documents, with the aim of excluding documents that were not related to IWSSs. There were 1805 documents before the screening and 197 related documents after the manual screening.
3.3. Analysis of Data
The compiled data were transferred to Excel files. The data include the following major information: title, authors, abstracts, keywords, type of document, authors, authors’ affiliations, country/territory, year of publication, language of the documents, citation frequency, fields of interests, subject area, model of publication, source type, and funding sponsor. Performance analysis was used to assess the scientific actors’ contribution and impact (countries, institutions, regions, sources, etc.). The number of publications by different scientific actors is used to indicate the quantitative impact. This highlights the research productivity and contributions of the actors regarding the topic under investigation. Different qualitative indexes (i.e., frequency of citations, average, median, and interquartile range) were used to indicate the impact of published works. The aforementioned descriptive statistics were performed using the SPSS programme. A further assessment of the quality of published works was proposed based on the Hirsch index (h-index) [64]. This index is vigorous enough in describing the impact and merit of cumulated research works [65]. This index integrates the productivity (number of published research works as a quantitative index of source, country, author, etc., with the frequency of citation as a qualitative index). Its interpretation can be defined as the number of publications by scientific actors with a citation rate of h or greater [64]. As an example, a journal with an h-index of 30 contains 30 research works, where each work has received at least 30 citations. This index is applicable when evaluating the impact of research works by other scientific research actors (countries, institutions, regions, sources, etc.). The Standard Competition Ranking (SCR) was employed to arrange various scientific research actors with prolific achievements in descending order.
3.4. Science Mapping Techniques
The objective of these mapping techniques is to unveil the structural and dynamic features of various scientific research streams [66]. Different assessments can be used to quantify and visualize scientific research-related works (i.e., co-citation, co-authorship, and co-word analyses) [66]. In this regard, various bibliometric tools were developed, aiming to combine performance analysis techniques and science mapping techniques [67]. This assists in the production of knowledge maps, evaluating research advancements and frontiers, and identifying research trends and hotspots [68]. The co-authorship analyses can be employed to evaluate co-authorship links between countries, authors, etc. This can be used as a valuable tool to stimulate research collaborations among different scientific research actors. While collaboration links among countries are revealed, as an example, it is true to suggest that countries with frequent appearances have strong research linkages compared to others [69]. This helps to recognize potential collaborators in certain areas of science [69]. Co-citation analysis reveals the co-citation links between two published works that are jointly cited by a third work. Such analysis has an advantage in identifying the intellectual principles of a particular subject of science based on the links’ strengths among various research works [69]. Moreover, this analysis can be used to characterize research trends and frontiers, highly valuable researchers, and other pertinent bibliometric data [68].
The VOSviewer software is employed to produce visualization maps of co-authorships (for countries and authors), and co-citation analyses (for sources) [70]. The VOSviewer software employs similarity mapping and clustering techniques to demonstrate the contributions of countries, sources, institutions, etc., based on various bibliometric maps [70]. Regarding countries’ research collaboration, as an example, the VOSviewer is able to generate a bibliometric map of two dimensions. The collaboration strength between any two specific countries can be demonstrated as a distance on the map between these two countries [70]. A closer distance will appear on the map between countries with more joint research works [71]. Objects of interest, such as sources, institutions, countries, etc., are represented by nodes on the map. These objects will be normalized using the formula of association strength. The nodes will later be assigned to distinct clusters using the smart local moving algorithm that connects closely related nodes. Each cluster will have a unique color to differentiate clusters from each other. The links between objects on the bibliometric map, which display the relationships between objects, are represented by lines of positive values (higher values: stronger links; stronger links between two objects: thicker lines). While with respect to co-authorship analysis, the link strength indicates the number of research works that are co-authored by two scholars (van Eck and Waltman, 2010). The distance between any two sources on the map of co-citation shows the relatedness of these sources (the closer two sources are on the map, the stronger the relatedness in terms of co-citation). The lines are also used to present the strong co-citation links between sources [70].
Keyword co-occurrence analysis was carried out, benefiting from the powerful characteristics of VOSviewer software. This assessment is significant as focal keywords display the literature core and research hubs [72]. This helps to recognize the interconnections among the notions of various research works, which accordingly helps in identifying the hot subjects that will continue to be popular in the future. Well-defined thresholds are proposed to properly visualize the bibliometric maps (i.e., minimum occurrences of a term) [73].
An additional assessment was carried out using SciMAT software [66,67,74] to explore the intellectual, social, and conceptual structures of research works on IWSSs based on co-word analysis [75]. This analysis employs advanced text mining tools to investigate the titles, abstracts, and keywords of published documents. The outcomes will be presented using a strategic diagram displaying the leading themes of interest [75]. The approach was followed as outlined by Cobo, López-Herrera, Herrera-Viedma and Herrera [66], as follows:
- Step 1: Raw data collection, and extracting all pertinent details (i.e., co-occurrence of keywords).
- Step 2: Evaluating the rates of similarity between various elements, relying on the co-occurrence frequency of keywords. The equivalent index is used to assess the association strength and to normalize co-occurrence frequencies. This equivalent index will be equal to one when the keywords always appear together and zero when the keywords are by no means associated.
- Step 3: Clustering techniques can be used to reveal relevant themes based on identification of the sub-clusters of correlated keywords. The clustered keywords are in agreement with the core interests and/or research matters that have attracted considerable efforts from researchers. The simple center algorithm was applied to detect these themes.
- Step 4: The output can be mapped to a 2D space known as a strategic diagram. The major themes in the strategic diagram are organized considering two major criteria, centrality and density, as in Figure 2. The centrality evaluates the degree of interconnection between a particular network and other networks (i.e., external ties). The density, on the other hand, evaluates the internal ties amid the keywords. In the strategic diagram, four major zones can be recognized. The driving themes of strong centrality and high density are displayed in the upper right region. Such themes are very well-developed and are significant in shaping the research field structure. The very specialized topics, with robust internal links and less significant external ones, are displayed in the upper left zone. They are of secondary importance. Themes in the lower right zone are fundamental but still under development. These themes can be classified as general topics. Lastly, themes that are characterized by their weak development and marginality are displayed in the lower-left zone [76]. These themes represent emerging and/or disappearing topics [66].
Figure 3 summarizes the methodological approach of the search strategies and the inclusion criteria employed to retrieve research works in relation to IWSSs. This further displays the roadmap that outlines the entire analysis procedure, including data collection, bibliometric analysis, and major outcomes.
4. Results and Discussion
4.1. Analysis of Growth Rates and Evolution of IWSSs’ Scientific Research Publications
The overall research works retrieved from the Scopus database and related to IWSSs comprised 197 documents published in a timeframe of about 147 years (1875–2021). These documents are distributed as follows: articles (186 articles; 94.4%) that represent the largest portion of published works on IWSSs, followed, by a large margin, by reviews (11 reviews; 6.0%). The oldest document found in the Scopus database was a note published in The Lancet journal in 1873 and entitled “Epidemic typhoid resulting from an intermittent water-supply” [77], without available information regarding authors and contents. The oldest article that addressed an issue in relation to IWSSs, a health issue, was published in the British Medical Journal and entitled “The fever at Croydon; and intermittent water-supply as a cause of typhoid” [78].
Research activities on IWSSs were neglected from 1875 to 1979. Then, a very modest and discrete productivity was observed during the 1980s and 1990s. True interest in IWSSs arose in 2002, but had a humble beginning. The breakthrough in the number of publications on IWSSs occurred post-2012, where 82.0% of the overall research works were published (Figure 4). The peak rate of publications on IWSSs was documented in 2020 (34 documents; 17.7%), taking into consideration that the year 2021 is still open for new publications.
4.2. Global Research Output
Figure 5 shows the worldwide perspective of research outcomes. Sixty-four countries have made various contributions, spanning 58 documents (29.4%), as in the case of the United States, to only 1 document/country, as in the case of 25 countries around the world. Different factors contribute to the uneven performance among countries including national wealth, population size, level of development, scientific capacity, and national scientific infrastructures. Another important factor is related to the prevalence of IWSS practices in various regions and countries (such as developing countries).
The top 10 most-prolific countries are presented in Table 1, which displays some key bibliometric indices associated with published works on IWSSs.
The United States showed remarkable achievements regarding most bibliometric performance indicators (e.g., productivity, h-index, citations rates, collaboration, and the number of publications resulting from international collaboration). The dominance of the United States in terms of research productivity and research collaboration is well established and confirmed in most fields of science. According to the nature index 2021, the United States topped all countries in the world in both high-quality research outputs and international research collaboration [79]. Most research works recorded to the benefit of the United States (44 documents; 76.0%) were conducted over case studies of IWSSs in developing countries (mainly India, Jordan, Bolivia, Uganda, Malawi, South Africa, Iran, Panama, Ecuador, China, Peru, Bangladesh, Palestine, Nepal, Nicaragua, Mexico, Rwanda, Sub-Saharan Africa, Kenya, Ghana, and Uzbekistan).
Five countries in the list of top 10 prolific countries are developed countries (United States: 1st position, United Kingdom: 3rd position, Germany: 4th position, The Netherlands: 5th position, and Italy: 6th position). This is a multifold issue that includes the fact that principles and concepts of integrated water resources’ management in developed countries were identified and established in science and research earlier than in other regions; the region’s high growth rate provides the flexibility needed to tackle and solve a variety of environmental problems (e.g., water resources issues), as the financial and technical resources needed to solve such issues are available; developed countries are active in supporting research activities in developing countries; the majority of scholars from developing countries acquire their scientific knowledge from institutions in developed countries and continue research collaboration and research training activities with their counterparts in developed countries. Therefore, it is not surprising that these countries have become world leaders in this regard. The case of Italy, in sixth place, is different from other developed countries. It is characterized by less international collaboration and more focus on local cases. Most publications on IWSSs by Italian scholars (12 documents out of 13 documents; 92.3%) are specific to local case studies in Italy (9 cases are applied to parts of the Palermo water distribution network, 2 cases are tested over a water distribution network located in a small city in northern Italy, and 1 case is applied to Ragalna water distribution network, in the Province of Catania). Many endeavors are devoted to tackling the issue of intermittent supply and solving related impacts in different regions of Italy, where intermittent supply is historically a common practice, particularly during summer [80]. India, in second place, shows distinct achievements in fields of research in relation to IWSSs. This is referred to the prevalence of this issue in India, where no main city provides its citizens access to continuous services at present, resulting in at least 460 million urban-dwelling persons being exposed to an intermittent water supply. Regardless of the successes of various pilot programs of continuous supply in different parts of India, further efforts are required to eliminate the issue of intermittent supply [81]. Other countries in the list are characterized by a high prevalence of intermittent supply practices, with high vulnerability to their impacts.
4.3. Global Research Collaboration on IWSSs
Figure 6 shows the map of collaboration among countries on IWSSs. This is shown using a two-dimensional space considering co-authorship links between countries. This collaboration is beneficial in generating high-impact studies primarily based on complementary practices, experiences, and skills. The conjoining of the endeavors of research institutions and throughout the globe is extremely beneficial in attaining powerful solutions to the challenges caused by IWSSs’ and combating their adverse impacts. Countries with the very best co-authorships links are often near to each other, as shown in the visualization map, Figure 6. Appointing countries with common collaborators to clusters can primarily be achieved based on one particular color/cluster. The volume of each node demonstrates each country’s performance with respect to collaboration and co-authorship links with other countries.
A minimum of five documents/country was set as a threshold in the present analysis. Twelve of the 64 countries met this threshold. A total of 19 collaboration links were identified, with an overall strength of 40. The country with the highest number of collaboration links and the strongest strength was the United States, with 8 collaboration links and an overall strength of 27, followed by the United Kingdom and India, respectively. The United States and the United Kingdom recorded the strongest collaboration links (an overall strength of 6). The same was found between the United States and India. The United Kingdom and India collaborated the most with the United States, followed by the United States and Kenya (an overall strength of 5). The regularly collaborative countries were classified into three clusters. The first cluster of red color comprises 5 countries (the United States in the core). The second cluster of green color comprises 4 countries (the Netherlands in the core). While the last cluster of blue color comprises 3 countries (South Africa in the core).
The coupling between countries based on bibliographical data is displayed in Figure 7. This represents the link between documents from different countries that cite the same publication. Therefore, this can be considered as a combined association between different identities (countries, institutions, etc.). The network visualization map of bibliographical coupling classifies countries into three clusters, with the countries aggregating in each cluster conducting more interconnected research works. Countries with the highest number of publications within their clusters represent the core countries. A minimum of five documents/country was set as a threshold. Fourteen of the 64 met this threshold. Overall, there were 90 collaboration links, with a strength of 9274. The highest link strength (5666) was recorded by the United States. The United States and the United Kingdom recorded the strongest link (1337).
4.4. Leading Journals with Prolific Contributions on IWSSs and Co-Citation Analysis
Research works on IWSSs have been published by scholars around the world in 90 journals. Sixty journals published just 1 document/journal, 9 journals published 2 documents/journals, and 7 journals published 3 documents/journals. Table 2 shows journals that have published four documents or more. Water Switzerland (IF, 2020 = 3.103) published the highest number of research works on IWSSs (n = 19; 9.6%), followed by Water Science and Technology Water Supply (n = 12; 6.1%, IF = 1.275), and Urban Water journal (n = 8; 4.1%, IF = 2.081). The present analysis revealed that most published works on IWSSs have been published in prestigious journals. The Environmental Science and Technology journal was at the forefront with respect to the number of citations (238), followed by Water Switzerland (218), and Water Research (167).
The most prolific sources considering co-citation figures are displayed in Figure 8: Network visualization map. Forty citations were considered the minimum number of citations/sources. Eight sources out of 3623 achieved the set threshold. The overall number of co-citation links between the sources was 22 (the overall strength was 1034). Plos One acquired the strongest strength (349), followed by Water Switzerland (344), and Water Research (322). The strongest link (156) was between Water Research and Plos One, followed by the link between Water Resources Management and Journal of Water Resources Planning and Management (132).
4.5. The Major Institutions with Outstanding Contributions on IWSSs
One-hundred-and-sixty institutions across the globe have collaborated on IWSS research activities. The list of most prolific institutions is displayed in Table 3. The most productive institution was the University of California, Berkeley, United States (16 documents; 8.1%), followed by the IHE Delft Institute for Water Education, The Netherlands (11 documents; 5.6%), and the National Environmental Engineering Research Institute, India (9 documents; 4.6%). Most productive institutions are affiliated with developed countries (9 out of 12 institutions). The largest portion of institutions in the list of the most prolific were in the United States (3 out of 12 institutions).
4.6. The Most Prolific Authors with Outstanding Contributions on IWSSs
One-hundred-and-fifty-five researchers had different contributions to IWSSs’ research activities. The list of the top 10 most-prolific authors is displayed in Table 4. Nelson, K.L. from the University of California, Berkeley, United States, was the most prolific author (11 documents; 5.6%), followed by Kumpel, E. from the University of Massachusetts Amherst, Amherst MA, United States (10 documents; 5.1%). The two authors, Nelson, K.L. and Kumpel, E., are frequent collaborators. Italy and the United States had the highest number of most prolific authors, respectively.
The co-authorship analysis outcomes (network visualization map) are shown in Figure 9. While co-authorship is a kind of research collaboration between scholars in a particular field of science, co-authorship analysis awards a comprehensive view of patterns of cooperation between scholars. The map categorized authors into 1 cluster, with a red color. This cluster includes five authors affiliated with institutions from Italy (four authors, Freni, G.; Fontanazza, C.M.; Notaro, V., and De Marchis, M., are affiliated with Università degli Studi di Enna “Kore”, Enna, Italy, while La Loggia, G. is affiliated with Università degli Studi di Palermo, Palermo, Italy). The most collaborated-with authors further appear in the list of most-productive authors at the global level. The overall links were 10, with a total link strength of 53. Freni, G. acquired the strongest link (24). The strongest links (link strength of 7 between every two authors) were between Freni, G., Fontanazza, C.M., and La Loggia, G. This group of authors is active in examining inequality, water losses, and energy costs in IWSSs, in addition to modeling IWSSs.
4.7. Analysis of Citation Trends and Most Cited Publications on IWSSs
The well-known bibliometric performance indicators include the total citations a specified research work acquires. This is the best indicator to assess the published works in terms of quality. At the time of data-gathering, a total of 2931 citations was recorded. The average was 14.9 and the median (quartile range) was 6 (1–16). The h-index of published works was 29 (of the 197 documents considered for the h-index, 29 were cited at least 29 times). An exponential model in which the dependent variable is the cumulative citation and the independent variable is the period was used to assess the tendency of the citation (Figure 10). The determination coefficient (r2) of the model comprising the year 2021 was 0.994, with new citations still being accepted.
The top 10 most-cited publications on IWSSs (articles and reviews) are shown in Table 5 [27,30,35,36,82,83,84,85,86,87]. The list includes seven articles and three reviews. Despite the marginal presence of reviews within the overall analyzed sample (6.0%), they represent a significant portion of the list of most-cited research works. This is attributed to the fact that reviews, in general, are highly cited, as they are intensively used as major sources in literature reviews. As reviews summarize the status of knowledge in a particular research field, these kinds of publications are cited considerably more than articles.
4.8. Content Analysis
Figure 11 displays the network visualization map of co-occurrence of terms in titles and abstracts. A minimum of 10 occurrences of the term was considered. Of the 5268 terms, 152 met the set threshold. The most pertinent terms were 91 keywords after adopting a relevance score of 60%. The chief occurrence terms were: network, with 153 occurrences; model, with 134 occurrences; household, with 97 occurrences; water quality, with 89 occurrences; source, with 76 occurrences; contamination, with 65 occurrences; tank, with 65 occurrences; sample, with 62 occurrences; drinking water, with 62 occurrences; risk, with 60 occurrences. The map classified terms into three major clusters. The first cluster, with a red color, is concerned with the modelling, design and optimization techniques of IWSSs. The second cluster, with a blue color, is concerned with the transmission from intermittent supply services to continuous supply models. The last cluster, with a green color, is concerned with the health risks associated with IWSSs.
4.8.1. Health Risks Associated with Intermittent Water Supply: Water Contamination
There is an extensive literature that emphasizes the health risks associated with the use of an intermittent supply [88,89,90]. The potential risks primarily stem from the ingress of contaminations through leaks due to a drop in or loss of pressure, and even to backpressure [91,92]. The contaminants’ intrusion into water systems requires the existence of three components: source of contamination, route, and driving force [93]. The sources of contaminants could be a leaking sewer main near the water supply pipes [39,94], while the route contaminants use to invade the network are leaks in drinking water pipes [94]. The intermittent feeding and pressure deficits create low pressures and/or negative pressures, which lead to a high risk of contamination and substantial health hazards [26,95] and represent the driving force. The risks are manifested by the intrusion of contaminants into the distribution system and the regrowth of bacteria and pathogens in pipes and storage tanks due to water stagnation [26].
The presence of integrity problems in intermittent systems mainly occur in developing countries, and include high rates of leakage, technical deficiencies in connections of water mains, inadequate disinfection residuals, and incapable sanitation practices associated with inadequate levels of water pressure [27]. These increase the vulnerability of water supply networks to contamination. Kumpel and Nelson [83] studied the microbial water quality in continuous and intermittent systems by collecting samples of water from the two systems over one year, using three repeated rounds (from reservoirs, taps, and storage containers—Hubli-Dharwad, India). The samples were tested for Physico-chemical parameters, Escherichia coli, and total coliform. The results showed that water quality was the same at reservoirs of service for the two supply schemes, while indicator bacteria were more frequently found, and had higher concentrations, in the intermittent water supply system. Escherichia coli was scarce in the continuous system (0.7%), and found at a level of 31.7% in the intermittent one, and total coliform was found at high concentrations in both intermittent and continuous systems after rainfall [83]. Bivins, Lowry, Wankhede, Hajare, Murphy, Borchardt, Labhasetwar and Brown [81] conducted a cross-sectional sampling study to correlate water quality in intermittent and continuous systems in Nagpur, India, which is switching from an intermittent to continuous supply in phases. The findings showed that the switching from an intermittent to a continuous supply is yielding meaningful improvements in microbial water quality [81]. The same conclusion was reached by Haider et al. [96]. Coelho et al. [97] conducted a study to identify the factors controlling bacterial concentrations in IWSSs and understand the differences in the behavior of bacteria in intermittent and continuous supply systems. They concluded that household storage tanks have a paramount influence on water quality deterioration in IWSSs [97]. Alazzeh et al. [98] concluded that water quality deterioration in roof tanks could be attributed to air temperature in a study assessing water quality in IWSSs of two camps in Palestine.
To study the impact of storage tanks in IWSSs on microbial quality, Tokajian and Hashwa [99] collected samples from a small intermittent system and its roof storage tanks, Beirut, Lebanon, over a period of two years, and counted coliforms and heterotrophic plate count (HPC) bacteria following the standard methods. The results showed high levels of turbidity from the source (artesian well) during rainfall events and a positive correlation between HPC and turbidity. Furthermore, an intermittent flow led to sudden changes in HPC (increase), and the quality of water deteriorated after storage in the roof tanks [99]. The same conclusion was reached by Machdar, van der Steen, Raschid-Sally and Lens [85] in a study assessing the risks of microbial contamination of different drinking water sources by performing a quantitative microbiological risk evaluation in Accra, Ghana.
Gonzalez et al. [100] concluded, in a study assessing the quality of water stored in households in IWSSs, that prolonged supply interruptions result in longer storage periods and lower chlorine residual, which were associated with high concentrations of indicator bacteria. In the same context, Yassin et al. [101] assessed the contamination levels of total and faecal coliforms in different water wells and IWSSs and their associations with the health of humans. They collected data on total and faecal coliform contamination in Gaza Governorate, Palestine for a period extended from 1999 to 2003 from the Ministry of Health records, and designed a questionnaire that included questions related to water supply services and the habit of using water from the network and the roof tanks in the study area. The analysis of data showed that contamination levels were higher than the World Health Organization (WHO) limits (they were higher in the networks than the wells), and intermittent supply and sewage flood seemed to be the main contributors to self-reported diseases (diarrheal) [101].
In a study of seven years of observation (2000–2006), Abu Amr and Yassin [102] studied the microbial contamination of the water systems and their influences on human health, Khan Yunis Governorate, Gaza Strip. Their study was based on records from the Ministry of Health on total and faecal coliform and an interview questionnaire on water-related diseases. They concluded that diseases were in association with intermittent supply, water source, inadequate chlorination, water distribution network age, and sewage flooding [102]. In a cross-sectional study, Shrestha et al. [103] concluded that diarrhoea was positively associated with IWSSs in rural Nepal. Elala et al. [104] confirmed a reduction in the quality of water between the tap and point-of-use, which proves that the contaminants mainly enter post-supply in the intermittent supply network of Nagpur city. The same conclusion was reached by Grube et al. [105] while investigating water quality over a period of 3 years in San Cristobal Island, Galapagos. The results showed that high-quality water is produced by the water treatment plants. The detection of Escherichia coli in 2–30% of post-treatment samples suggests regrowth and/or contamination during storage and distribution [105]. Bain et al. [106], in a review study, examined if the source of water, whether improved or unimproved, will impact the levels of fecal contamination. The results showed that the odds of contamination were lower for improved sources than the unimproved ones, but they are not consistently safe, and high rates of contamination have been reported in IWSSs [106]. Price et al. [107] concluded that water quality and related health risks in IWSSs vary at daily temporal levels more than is reported globally. Adane et al. [108] in a matched case-control study, found a high association between IWSSs and point-of-use E. coli contamination in water stored in households.
To promote strategies to upgrade water quality in IWSSs, there is a need to understand the mechanisms that impact contamination in these systems. In this regard, Kumpel and Nelson [109] conducted an experimental study testing water quality in IWSSs in Hubli-Dharwad, India, based on continuous measurements of pressure and physicochemical parameters. The results showed high levels of turbidity and indicator bacteria concentrations when the supply was first turned on, and all conditions that led to the intrusion of contaminants (source, pathway, and low pressure) were available in this system. They concluded that monitoring water quality in dynamic IWSSs requires special considerations [109]. Van den Berg et al. [110] examined the impacts of variations in operation strategies (i.e., increased supply durations, increased chlorine dosages, and first-flush) on the quality of water in IWSSs. The results showed that increased chlorine dosages improved compliance with the standards of microbial water quality, averting a possible health risk [110]. In a comparative analysis conducted in two Chinese provinces with two intermittent systems and two continuous systems, Li et al. [111] concluded that there were no significant variations in sanitation and water behaviors in intermittent and continuous water supply systems, suggesting that interventions to improve adaptive and conservation behaviors at the household level in an intermittent supply system could improve safe access to water.
To model the intrusion of contaminants through leaks in IWSSs, Fontanazza et al. [112] used a small-scale looped distribution network to perform the tests on two setups (transient pressure and intermittent supply). They added soluble contaminants through cracks and measured the concentrations in two nodes. The outcomes showed that an intermittent supply could permit large amounts of contaminants to enter the pipes [112]. Besner, Prévost and Regli [94] developed a conceptual model to quantify the risks of pathogens entering the distribution systems from different intrusion events. The concepts used in this model comprise the examination of sources, extents, periods and frequencies of low/negative-pressure incidents; contaminant pathways, pathogens, the amount of water that may enter through pathways; pathogen transport; pathogen exposure by humans consuming water; health risk. These risk assessment models could be a useful tool to recognize the risks associated with different events in drinking water systems (low or negative pressures) that have the potential to result in the intrusion of contaminants into water distribution systems [94].
Vairavamoorthy et al. [113] proposed a software tool with the potential to forecast the different risks associated with the intrusion of contaminants into IWSSs. This risk analysis tool integrates three models (contaminant zone model to calculate the contamination zone depending on seepage principles, contaminant transport model to simulate the concentration and loading of contaminant, and pipe condition assessment model to calculate the conditions of the pipes) with a GIS model using a tight coupling method. They applied the tool to the zone of Guntur municipal corporation, India, after collecting the necessary data, and the outcomes were different thematic maps that determined the sections of the water distribution system that were most at risk [113]. Sakomoto et al. [114] suggested that the adoption of an integrated quality-monitoring approach (i.e., identifying potential intrusion hotspots in IWSSs using field measurements) and interventions (i.e., booster chlorination) could improve water quality in IWSSs. Erickson et al. [115] proposed that pressure monitoring and sampling in the first-flush IWSSs can reveal water quality risks that would likely not be revealed based on conventional monitoring programmes.
To study the effects of an intermittent supply on biofilms and water quality in IWSSs Calero Preciado et al. [116] conducted an experimental test utilizing a full-scale chlorinated water distribution network, operated over 60 days to for allow biofilm growth under realistic hydraulic conditions. This was followed by intermittent supply events for different periods of 6, 48, and 144 h and flow resumption. The results showed that by minimizing intermittent supply times, biofilm-associated impacts can be reduced [116].
4.8.2. Modelling, Design, and Optimization Techniques
This approach confirms the necessity to create proper design mechanisms and operation techniques for IWSSs. These techniques must primarily be based on methodologies that are totally unlike the ones considered in continuous water supply systems [42]. The development of proper leak detection techniques and the appropriate selection of valves to ensure that they are in agreement with IWSSs’ flow characteristics are also essential [95,117]. The most-proposed approaches in this regard are dedicated to analyzing and recognizing the behavior of IWSSs from a hydraulic perspective, resolving the inequality [118], and developing mathematical modelling tools for intermittent supply systems [16,95].
In this context, Vairavamoorthy, Akinpelu, Lin and Ali [16] confirmed the need to develop appropriate design tools, with the potential to recognize IWSS features. This need is based on the fact that, at least in the foreseeable future, intermittent supply practices will continue to be prevalent, particularly in developing regions, and the distribution networks’ operating intermittency design is generally based on the principles of continuous systems, resulting in serious pressure troubles and inequities in the distribution of available amounts of water [16]. Accordingly, Vairavamoorthy, Akinpelu, Lin and Ali [16] proposed a modified network analysis programme that merges pressure-dependent outflow functions to simulate the demands in IWSSs. The components of this model comprise a demand model to forecast the end-users’ demand profiles (pressure regime, connection type, supply duration, supply time); a secondary network model in which the primary nodes are assumed to be constant head nodes supplying water to the secondary network (by varying the pressure at the primary nodes, the outflows to the secondary network can be evaluated); a network charging model to simulate the charging of the network; and a modified network analysis method. The tool has been applied in Kerala, South India, and was able to achieve an equitable distribution and a least-cost design [16,36,42,119].
In modelling the hydraulic behavior of IWSSs, Trifunović and Abu-Madi [31] identified water demand patterns and real consumption in IWSSs by monitoring the changes in roof storage tank levels (keeping the connection with the distribution system closed). They built a model with three scenarios: conventional demand modelling (baseline node demand, multiplying by corresponding peak factors for each time step); pressure-related demand (run the model for three baseline pressures); and modelling each cluster of roof tanks by the equivalent tank and connecting it to the node (attach the demand patterns to tanks instead of nodes). The last scenario was better able to model the reality of IWSSs than the first two [31].
Since the use of private roof tanks, which change the demand patterns and cause inequality, is a common practice in IWSSs, different works have been performed in this regard, aiming to understand the dynamic process of network filling. The results of applying different numerical models to analyze the filling process in IWSSs showed high inequality regarding the supply to customers (with some users prolonging the time required to fill the network due to filling their tanks completely) [35,118]. To improve the performance of IWSSs and the equity in distributing the available resources, Fontanazza, Freni and La Loggia [55] developed a numerical model in EPANET 2 [120] and a set of performance indicators to assess equity and identify the disadvantaged and advantaged customers in IWSSs. The developed model was tested on parts of the Palermo City water network, Italy, and the results showed that although an even water supply was able to fulfill the demands, an intermittent scheme will create inequalities due to the reduced supply to high, elevated nodes [55,121]. To reduce the inequalities in IWSSs, depending on the simulation of management plans, a developed model was used that integrates a dynamic mathematical model for intermittent networks with pressure-reducing valves model [80,118]. The results showed that the introduction of pressure management areas reduces inequalities by reducing the differences in pressure [80,118]. Soltanjalili, Haddad and Mariño [87] developed a model of intermittent supply, paying attention to indicators and constraints such as equity and pressure. The aim was to identify the ideal operation of water systems during water-shortage events. They integrated the honey-bee mating optimization (HBMO) algorithm as an optimization tool with EPANET 2, aiming to maximize water supply desirability. The performance criteria were evaluated under different water shortage scenarios. The results showed that the resiliency to intermittent and hedging water supply was more favorable than other methods or scenarios [87].
It is well known that modelling IWSSs with standard hydraulic models is a challenging task. Therefore, there is a need to adjust them to model-pressure-dependent demands. In this regard, Ingeduld et al. [122] adjusted the EPANET engine to deal with low pressure and limited demand availability to simulate the case of IWSSs. The roof tanks were incorporated by developing an automated procedure for the tank generation, and the developed model was a robust, simple, and practical tool to model the IWSSs [122]. In the same context, different research works were devoted to developing powerful tools to simulate water systems with normal, low, or no pressure. The used models comprise demand-driven models, head-driven models, and models of mixed flow in pipelines [5,123]. Mohan and Abhijith [124] proposed an improved pressure-dependent analysis integrating partial-flow characteristics to simulate the hydraulic behavior of IWSSs. Campisano et al. [125] used the EPA Storm Water Management Model (EPA-SWMM) to simulate the filling phase in IWSSs. This approach showed efficiency in simulating the processes that occur in IWSSs. While the use of storage tanks is essential in IWSSs as means of collecting water during supply periods, different research works found negative effects associated with using these private storage tanks in terms of waste, water losses, unaccounted-for water, economic efficiency, management, energy, and water quality [29]. However, Guragai et al. [126] used a pressure-based data logger to observe water level variations in rooftop storage tanks as a non-destructive method, which was easily applicable and more accurate in evaluating overall water consumption compared to other existing methods.
The identification of integrated water resources’ management decisions in IWSSs is essential to cope with water shortages and scarcity in these systems. In this regard, demand management in the long term comprises the installation of water-saving devices, water-conservation laundry machines, low-water-consuming landscape, drip irrigation, etc., while in the short term, the installation of bottles in toilet tanks, repairing leaks, and reducing irrigation to landscape, etc., can greatly improve water availability in IWSSs [18]. Long-term supply-improving actions comprise connections to the network, installing roof/ground tanks or cisterns, rainwater collection, reusing greywater, while, in the short-term, buying water or bottled water/from water stores/private vendors, etc., are essential decisions in IWSSs [18,127,128]. Madanat and Humplick [129] developed a model system of household water supply options, with the objective of developing an understanding of households’ water demand beyond connection decisions, as in the case of IWSSs.
The management of water losses in IWSSs is a crucial task to improve these water systems. The focus on measuring water use and water losses is essential in water conservation programs using flow measurements (e.g., meters or sensors that have been calibrated to be precise under intermittent supply conditions) [130]. AL-Washali et al. [131] investigated the effects of the amount of water supplied in IWSSs on the reported levels of non-revenue water using different normalization approaches (regression analysis and average supply-time adjustment). AL-Washali, Sharma, AL-Nozaily, Haidera and Kennedy [131] employed a minimum night flow analysis to model leakage rates in IWSSs. To better use the water balance developed by the International Water Association (IWA), which is applicable to analysis of water losses in continuous water supply systems, Mastaller and Klingel [132] developed an adaption version of the IWA water balance to construct the balance in IWSSs [132]. Haider et al. [133] proposed a framework to evaluate economic leakage level in IWSSs considering the specific conditions of IWSSs. Zyoud et al. [134] developed a decision-making model to help water utilities in developing countries identify integrated water loss management plans that will guide utility managers in better controlling for water losses in IWSSs. These models allow for the participation of all stakeholders with an interest in upgrading water supply services in IWSSs and help them select the most appropriate water loss management strategies [134,135,136]. Agathokleous and Christodoulou [137] used statistical and survival analyses to investigate the impacts of intermittent supply on the breakage rates by studying the changes in the rates of failures before, during, and after an intermittent supply. They found an increase in the number of failure incidents during and immediately after the periods of intermittent supply [137]. Energy recovery in IWSSs, based on the use pumps as turbines, was also a topic of interest as an option to monitor pressure in the network and generate energy [138,139,140].
Aiming to achieve equity in IWSSs, Gullotta et al. [141] proposed a methodology of installing valves in IWSSs using sequential addition algorithms, with the objective of rearranging flow circulation. With a similar objective of achieving equity, Gullotta, Campisano, Creaco and Modica [141] proposed two optimization models, developed based on the use of NSGA II. The first one aims to maximize equity by installing fully closed valves, while the second one considers the supply levels of the individual nodes, including the optimization of both the position and configuration of control valves [141]. Nyahora et al. [142] proposed a multi-objective optimization model utilizing a genetic algorithm to help with investment decision-making in IWSSs. This model uses multiple cost-effective intervention choices to magnify equity and reliability, while lowering the cost implications [142]. Ilaya-Ayza et al. [143] developed a model that utilizes the hydraulic capacity concept and the soft computing techniques of graph theory and cluster analysis to recognize district metered areas (DMAs) in IWSSs, aiming to achieve an equitable water supply. In a similar manner, Ilaya-Ayza, Martins, Campbell and Izquierdo [143] used integer linear programming and multi-criteria analysis to create an optimal allocation supply schedule for IWSSs. To improve pressure and water safety in IWSSs, Meyer et al. [144] proposed setting up pressure-sustaining valves at consumer connections.
4.8.3. From Intermittent to Continuous Approach
This approach underlines the need to correct the misconception of considering intermittent water supply services to be tolerable practices. This misconception may derive from an unawareness of the risks and costs associated with intermittent water supply services [3]. This tactic further looks at the different measures and interventions used to create major improvements in IWSS functions. This is based on the development of different design and planning tools, which are compatible with the nature of the IWSSs, as interim actions [4]. These interim actions are fundamental measures in the continuous water supply services, providing safe, technically sound, and sustainable options [3,4,41,145,146].
In this context, Dahasahasra [146] proposed a model to transform an intermittent system into a 24 × 7 water supply system. The model is based on an analysis of the present system (water infrastructure mapping, operation mapping), before simulating the behavior of the network by using the collected data, reframing the operational zones, studying the storage capacities, and implementing water auditing. This is followed by a pressure management and leakage reduction campaign, before applying the transformation in phases. Using this approach, it was possible to divide the city (Badlapur city, Mumbai, India) into 10 operational zones. The transformation to a continuous supply was achieved in three zones, and the work continued for the remaining zones [146]. The same approach was adopted by McIntosh [3] and Myers [145]. The knowledge of the technical causes of intermittent supply, in association with a reliable database, are vital factors when successfully introducing the continuous supply [147]. This approach comprised the following: applying a feasibility analysis of continuous supply, data collection and management, and a hydraulic analysis for planning purposes (data collection must be a function of progress or need in execution, which will be useful to shorten the time required to put the approach into effect), using a pilot study to calculate consumption and water loss figures and test the practical feasibility of the continuous supply, restructuring planning (planning for one transmission and distribution network; identifying pressure zones), public awareness to increase acceptance and willingness to pay, restructuring the system (completely or phases), introducing a continuous supply (start with a pilot zone) and updating the system’s database and adapting the restructuring plans [4,147]. This approach has been applied to the Béni Abbès (Algeria) water supply system [4,26,147].
David et al. [148] developed a methodology to analyze hybrid demand patterns for a water system in the transition from an intermittent to a continuous water supply system. The analysis addressed the operating criteria, network behavior, and the demand profiles, aiming to identify the adequate operation criteria in such cases [148]. El Achi and Rouse [149] proposed, in a theoretical study, a hybrid hydraulic model for a gradual transition, zone-by-zone, from an intermittent to a continuous supply considering economic scarcity. The developed model included both types of water supply, intermittent and continuous, and displayed high efficiency regarding both the economic and technical aspects [149]. In a study comparing water quality, practices of water storage, the health of the child, and coping costs in IWSSs and water systems that were upgraded to continuous supply in Hubli–Dharwad, Karnataka, India, Ray et al. [150] conducted a matched-cohort research design study. It was found that the continuous supply improved water quality. The supply did not improve children’s overall health, but reduced serious water-related illnesses in the lowest-income group, reduced waiting times and increased monthly water charges [150]. The same conclusion was reached by the authors of [151].
Successful Case Studies of Transition from Intermittent to Continuous Supply
This section shows a real application of the above approach in Pnomh Penh City, the capital of Cambodia, whose water supply authority is considered a pioneering and outstanding public utility in Asia [152]. The approach comprised some of the general principles that were mentioned in Section 4.8.3. Independence of water utility was one of the key success factors [4], followed by improvements in information systems and revenue performance, expansion of the service coverage in terms of quality and quantity, and increasing tariff in stages. The accomplishments were attained by increasing the coverage from 25% in 1993 to 85% in 2004, ensuring a continuous water supply, reducing non-revenue water to 14%, full cost recovery, a 99% collection ratio and increasing the pressure in the system [153].
Another successive application was demonstrated in the case of Manila Water Company, Philippine. By adopting the private-sector participation models, the continuous water supply service attained a coverage of 91% at the beginning of 2004, instead of 26% in 1997, reducing non-revenue water to 40.7% in 2005 instead of 63% in 1997, increasing the billed volumes and served households, and decreasing the staff [153].
4.9. Analysis of the Strategic Diagram
The strategic diagram, Figure 12 shows the major themes of IWSS research activities at global levels, where the size of each circle is in proportion with the number of documents that incorporated each term. The primary driving themes comprise water distribution networks, human, apparent losses, water supply systems, and distribution systems. The fundamental matters, in the lower right zone display the challenges that IWSSs face in developing countries (the most vulnerable regions across the globe). Declining or emerging topics, such as animals, cities, and leakage, are shown in the lower left zone. Issues that are characterized by their high specialty (i.e., biofilm) are shown in the upper left zone. The major driving themes confirm two major matters associated with IWSSs. The first is in relation to the risks associated with IWSSs and their impacts on human health. The second is concerned with the importance of water loss management (mainly the management of apparent losses) as a potential strategy in coping with the challenges of IWSSs. More accurately simulating the behavior of IWSSs, considering their hydraulic deficiencies and the presence of private water tanks, is a further driving theme. This will be based on the utilization of mathematical models, genetic algorithms, and artificial intelligence techniques. These topics will continue to play a primary role in structuring and shaping IWSS-related research works in the foreseeable future.
5. Conclusions
Analyzing and visualizing global research activities regarding IWSSs was the primary objective of the present work. A global analysis was conducted in this regard, benefiting from bibliometric techniques and visualization mapping. Different quantitative and qualitative bibliometric indicators were revealed and analyzed to demonstrate the contribution and performance of countries, institutions, sources, etc., toward advancing our understanding with respect to the impacts of IWSSs. Collaboration among countries, authors and institutions on this topic was analyzed and assessed based on co-authorship analysis. To identify the intellectual basis of research works, a co-citation analysis was conducted. A keyword co-occurrence analysis was conducted to reveal the core topics and future trends of research activities. As most endeavors were devoted to identifying the health risks associated with IWSSs, aiming to save human lives, substantial research works in this regard were documented compared to other issues in relation to modeling IWSSs and the transition from intermittent to continuous water supply schemes. The present analysis revealed major concerns associated with IWSSs. It was found that an intermittent water supply is a compound matter of multi-causes (i.e., technical, economic and environmental deficiencies) and has multiple impacts (i.e., health, social, economic and technical impacts). Joint work and attention, at regional and international levels, in response to the adverse impacts of IWSSs, is still at immature levels. A clear and dissimilar performance is noted among countries regarding issues related IWSSs. This entails the need to unify global efforts on this issue, aiming to enhance collaboration and establish an effective exchange of knowledge and experience among developed and developing countries. In conclusion, research activities to assess and mitigate the impacts of IWSSs were very modest in terms of productivity. Despite this, increased interest in this topic will be witnessed in the near future. This path is inevitable if the SDGs to be achieved by 2030.
The major lessons and considerations that have emerged are as follows: IWSSs should not constitute a permanent solution as they are not an ideal model of water supply; in some cases, the application of an intermittent supply as an option for dealing with water scarcity and/or water shortage is performed with ease, without earnestly looking into alternative approaches; the transition from an intermittent to a continuous water supply is not an easy job and must be achieved in a cost-effective manner, integrating improved operations, good management practices, modern management systems, sound data and reliable technical modeling tools. Furthermore, a strong integration of the scientific community, policymakers, and water utilities is essential to create well-functioning systems with the capacity, experience, and know-how to operate and more efficiently manage IWSSs. In this regard, advancing knowledge and sharing experiences regarding IWSSs; the development of manuals and guidelines of best practices for managing IWSSs; and mainstreaming knowledge of IWSSs through the organization of workshops, conferences, and training are essential requirements for the successful monitoring and management of IWSSs. Supporting more vulnerable communities, which are utilizing many resources to deal with intermittent supply crises, should be a priority for developed countries and international organizations. This includes investments in better-integrated water resource management plans, improvements in infrastructure, and capacity-building programmes.
Funding
No funding was received for conducting this study.
Institutional Review Board Statement
Not applicable.
Informed Consent Statement
Not applicable.
Data Availability Statement
The datasets used and/or analyzed during the current study are available from the corresponding author on reasonable request.
Acknowledgments
The author would like to express his sincere gratitude to the editors and reviewers for their suggestions and constructive comments to improve the quality of this work. The author would like also to thank Palestine Technical University (Kadoorie) for providing the opportunity to access the most recent information sources.
Conflicts of Interest
The author declares no conflict of interest.
References
- Rawas, F.; Bain, R.; Kumpel, E. Comparing utility-reported hours of piped water supply to households’ experiences. NPJ Clean Water 2020, 3, 6. [Google Scholar] [CrossRef] [Green Version]
- Simukonda, K.; Farmani, R.; Butler, D. Causes of intermittent water supply in Lusaka City, Zambia. Water Pract. Technol. 2018, 13, 335–345. [Google Scholar] [CrossRef]
- McIntosh, A.C. Asian Water Supplies Reaching the Urban Poor; Asian Development Bank: Mandaluyong, Philippines; IWA Publishing: London, UK, 2003. [Google Scholar]
- Klingel, P.; Nestmann, F. From intermittent to continuous water distribution: A proposed conceptual approach and a case study of Béni Abbès (Algeria). Urban Water J. 2014, 11, 240–251. [Google Scholar] [CrossRef]
- Nyende-Byakika, S.; Ndambuki, J.M.; Ngirane-Katashaya, G. Modelling of pressurised water supply networks that may exhibit transient low pressure–open channel flow conditions. Water Pract. Technol. 2013, 8, 3–4. [Google Scholar] [CrossRef]
- Abu-Madi, M.; Trifunovic, N. Impacts of supply duration on the design and performance of intermittent water distribution systems in the West Bank. Water Int. 2013, 38, 263–282. [Google Scholar] [CrossRef] [Green Version]
- Zaman, D.; Gupta, A.K.; Uddameri, V.; Tiwari, M.K.; Ghosal, P.S. Hydraulic performance benchmarking for effective management of water distribution networks: An innovative composite index-based approach. J. Environ. Manag. 2021, 299, 113603. [Google Scholar] [CrossRef]
- Zvobgo, L. Consumer ability and willingness to pay more for continuous municipal water supply in Chitungwiza. Sustain. Water Resour. Manag. 2021, 7, 23. [Google Scholar] [CrossRef]
- Erickson, J.J.; Quintero, Y.C.; Nelson, K.L. Characterizing Supply Variability and Operational Challenges in an Intermittent Water Distribution Network. Water 2020, 12, 2143. [Google Scholar] [CrossRef]
- Farmani, R.; Dalton, J.; Charalambous, B.; Lawson, E.; Bunney, S.; Cotterill, S. Intermittent water supply systems and their resilience to COVID-19: IWA IWS SG survey. J. Water Supply Res. Technol.-AQUA 2021, 70, 507–520. [Google Scholar] [CrossRef]
- Beard, V.A.; Mitlin, D. Water access in global South cities: The challenges of intermittency and affordability. World Dev. 2021, 147, 105625. [Google Scholar] [CrossRef]
- Vinturini, A.R.; Feroni, R.d.C.; Galvão, E.S. Perception of the citizens in the city of São Mateus, Brazil, on water supply and the implications in its use. Water Supply 2020, 21, 859–867. [Google Scholar] [CrossRef]
- Carlo, L.; Suzanne Esther, B.; Heinz Erasmus, J. A conceptual index for benchmarking intermittent water supply in a water distribution system zone. Water SA 2020, 46, 12–21. [Google Scholar]
- Aboelnga, H.; Saidan, M.; Al-Weshah, R.; Sturm, M.; Ribbe, L.; Frechen, F.-B. Component analysis for optimal leakage management in Madaba, Jordan. J. Water Supply Res. Technol.-Aqua 2018, 67, 384–396. [Google Scholar] [CrossRef] [Green Version]
- Mellor, J.; Kumpel, E.; Ercumen, A.; Zimmerman, J. Systems Approach to Climate, Water, and Diarrhea in Hubli-Dharwad, India. Environ. Sci. Technol. 2016, 50, 13042–13051. [Google Scholar] [CrossRef] [PubMed]
- Vairavamoorthy, K.; Akinpelu, E.; Lin, Z.; Ali, M. Design of sustainable water distribution systems in developing countries. In Proceedings of the World Water and Environmental Resources Congress, Orlando, FL, USA, 20–24 May 2001; pp. 378–379. [Google Scholar]
- Vairavamoorthy, K.; Gorantiwar, S.D.; Mohan, S. Intermittent Water Supply under Water Scarcity Situations. Water Int. 2007, 32, 121–132. [Google Scholar] [CrossRef]
- Rosenberg, D.E.; Talozi, S.; Lund, J.R. Intermittent water supplies: Challenges and opportunities for residential water users in Jordan. Water Int. 2008, 33, 488–504. [Google Scholar] [CrossRef] [Green Version]
- Gottipati, P.V.K.S.V.; Nanduri, U.V. Equity in water supply in intermittent water distribution networks. Water Environ. J. 2014, 28, 509–515. [Google Scholar] [CrossRef]
- Mohammadi, A.; Jalili-Ghazizadeh, M.; Moslehi, I.; Yousefi-Khoshqalb, E. Survival analysis of water distribution network under intermittent water supply conditions. Water Supply 2020, 20, 3531–3541. [Google Scholar] [CrossRef]
- De Stercke, S.; Chaturvedi, V.; Buytaert, W.; Mijic, A. Water-energy nexus-based scenario analysis for sustainable development of Mumbai. Environ. Model. Softw. 2020, 134, 104854. [Google Scholar] [CrossRef]
- Chaudhuri, S.; Roy, M.; McDonald, L.M.; Emendack, Y. Water for All (Har Ghar Jal): Rural Water Supply Services (RWSS) in India (2013–2018), Challenges and Opportunities. Int. J. Rural Manag. 2020, 16, 254–284. [Google Scholar] [CrossRef]
- Chen, Y.J.; Chindarkar, N.; Zhao, J. Water and time use: Evidence from Kathmandu, Nepal. Water Policy 2019, 21 (Suppl. S1), 76–100. [Google Scholar] [CrossRef]
- Reyes, M.F.; Trifunović, N.; Sharma, S.; Kennedy, M.D. Assessment of domestic consumption in intermittent water supply networks: Case study of Puerto Ayora (Galápagos Islands). J. Water Supply Res. Technol.-Aqua 2017, 66, 673–683. [Google Scholar] [CrossRef]
- Kansal, M.L.; Kumar, A.; Sharma, P.B. Reliability analysis of water distribution systems under uncertainty. Reliab. Eng. Syst. Saf. 1995, 1, 51–59. [Google Scholar] [CrossRef]
- Klingel, P. Technical causes and impacts of intermittent water distribution. Water Sci. Technol. Water Supply 2012, 12, 504–512. [Google Scholar] [CrossRef]
- Lee, E.J.; Schwab, K.J. Deficiencies in drinking water distribution systems in developing countries. J. Water Health 2005, 3, 109–127. [Google Scholar] [CrossRef] [Green Version]
- Arregui, F.; Cabrera, E.; Cobacho, R. Integrated Water Meter Management; IWA Publishing: London, UK, 2006. [Google Scholar]
- Ricardo, C.; Francisco, A.; Enrique, C.; Enrique, C., Jr. Private water storage tanks: Evaluating their inefficiencies. Water Pract. Technol. 2008, 3, wpt2008025. [Google Scholar]
- Criminisi, A.; Fontanazza, C.M.; Freni, G.; La Loggia, G. Evaluation of the apparent losses caused by water meter under-registration in intermittent water supply. Water Sci. Technol. 2009, 60, 2373–2382. [Google Scholar] [CrossRef] [PubMed]
- Trifunović, N.; Abu-Madi, M.O.R. Demand Modelling of Networks with Individual Storage. Bridges 1999, 10, 47. [Google Scholar]
- Andey, S.; Kelkar, P. Influence of Intermittent and Continuous Modes of Water Supply on Domestic Water Consumption. Water Resour. Manag. 2009, 23, 2555–2566. [Google Scholar] [CrossRef]
- Zozmann, H.; Klassert, C.; Sigel, K.; Gawel, E.; Klauer, B. Commercial Tanker Water Demand in Amman, Jordan—A Spatial Simulation Model of Water Consumption Decisions under Intermittent Network Supply. Water 2019, 11, 254. [Google Scholar] [CrossRef] [Green Version]
- Guragai, B.; Takizawa, S.; Hashimoto, T.; Oguma, K. Effects of inequality of supply hours on consumers’ coping strategies and perceptions of intermittent water supply in Kathmandu Valley, Nepal. Sci. Total Environ. 2017; 599–600, 431–441. [Google Scholar]
- De Marchis, M.; Fontanazza, C.; Freni, G.; La Loggia, G.; Napoli, E.; Notaro, V. A model of the filling process of an intermittent distribution network. Urban Water J. 2010, 7, 321–333. [Google Scholar] [CrossRef]
- Vairavamoorthy, K.; Gorantiwar, S.D.; Pathirana, A. Managing urban water supplies in developing countries—Climate change and water scarcity scenarios. Phys. Chem. Earth Parts A/B/C 2008, 33, 330–339. [Google Scholar] [CrossRef]
- Giustolisi, O.; Berardi, L.; Laucelli, D. Generalizing WDN simulation models to variable tank levels. J. Hydroinform. 2012, 14, 562–573. [Google Scholar] [CrossRef] [Green Version]
- Chowdhury, M.; Ahmed, M.; Gaffar, M. Management of water non revenue in four cities of Bangladesh. J.-Am. Water Work. Assoc. 2002, 94, 64–75. [Google Scholar] [CrossRef]
- Andey, S.P.; Kelkar, P.S. Performance of water distribution systems during intermittent versus continuous water supply. J. Am. Water Work. Assoc. 2007, 99, 99–106. [Google Scholar] [CrossRef]
- Rosado, L.E.C.; López-Jiménez, P.A.; Sánchez-Romero, F.-J.; Fuertes, P.C.; Pérez-Sánchez, M. Applied strategy to characterize the energy improvement using PATs in a water supply system. Water 2020, 6, 1818. [Google Scholar] [CrossRef]
- Kumar, A. Technologies to improve efficiency in distribution system with intermittent supplies. Water Supply-Int. Water Supply Assoc. 1998, 16, 576–579. [Google Scholar]
- Totsuka, N.; Trifunovic, N.; Vairavamoorthy, K. Intermittent urban water supply under water starving situations. In Proceedings of the 30th WEDC International Conference on Peoplecentered Approaches to Water and Environmental Sanitation, Vientiane, Laos, 25–29 October 2004. [Google Scholar]
- DuChanois, R.M.; Liddle, E.S.; Fenner, R.A.; Jeuland, M.; Evans, B.; Cumming, O.; Zaman, R.U.; Mujica-Pereira, A.V.; Ross, I.; Gribble, M.O.; et al. Factors Associated with Water Service Continuity for the Rural Populations of Bangladesh, Pakistan, Ethiopia, and Mozambique. Environ. Sci. Technol. 2019, 53, 4355–4363. [Google Scholar] [CrossRef] [PubMed] [Green Version]
- Taylor, D.D.J.; Slocum, A.H.; Whittle, A.J. Demand Satisfaction as a Framework for Understanding Intermittent Water Supply Systems. Water Resour. Res. 2019, 55, 5217–5237. [Google Scholar] [CrossRef] [Green Version]
- Jensen, P.K.; Ensink, J.H.J.; Jayasinghe, G.; Van Der Hoek, W.; Cairncross, S.; Dalsgaard, A. Domestic transmission routes of pathogens: The problem of in-house contamination of drinking water during storage in developing countries. Trop. Med. Int. Health 2002, 7, 604–609. [Google Scholar] [CrossRef]
- Zyoud, S.H. Multi-Criteria Decision Making Techniques for Water Loss Management in Water Supply Networks of Developing Countries; Verlag der Technischen Universität Graz: Graz, Austria, 2017. [Google Scholar]
- Bhowmick, G.D.; Dhar, D.; Nath, D.; Ghangrekar, M.M.; Banerjee, R.; Das, S.; Chatterjee, J. Coronavirus disease 2019 (COVID-19) outbreak: Some serious consequences with urban and rural water cycle. NPJ Clean Water 2020, 3, 32. [Google Scholar] [CrossRef]
- Hannah, D.M.; Lynch, I.; Mao, F.; Miller, J.D.; Young, S.L.; Krause, S. Water and sanitation for all in a pandemic. Nat. Sustain. 2020, 3, 773–775. [Google Scholar] [CrossRef]
- Du, H.; Li, N.; Brown, M.A.; Peng, Y.; Shuai, Y. A bibliographic analysis of recent solar energy literatures: The expansion and evolution of a research field. Renew. Energy 2014, 66, 696–706. [Google Scholar] [CrossRef]
- Navarro-Ortega, A.; Acuña, V.; Bellin, A.; Burek, P.; Cassiani, G.; Choukr-Allah, R.; Dolédec, S.; Elosegi, A.; Ferrari, F.; Ginebreda, A. Managing the effects of multiple stressors on aquatic ecosystems under water scarcity. The GLOBAQUA project. Sci. Total Environ. 2015, 503, 3–9. [Google Scholar] [CrossRef] [PubMed] [Green Version]
- Pereira, L.S.; Cordery, I.; Iacovides, I. Coping with Water Scarcity: Addressing the Challenges; Springer Science & Business Media: Berlin/Heidelberg, Germany, 2009. [Google Scholar]
- Spiliotis, M.; Martín-Carrasco, F.; Garrote, L. A Fuzzy Multicriteria Categorization of Water Scarcity in Complex Water Resources Systems. Water Resour. Manag. 2015, 29, 521–539. [Google Scholar] [CrossRef]
- Liu, J.; Liu, Q.; Yang, H. Assessing water scarcity by simultaneously considering environmental flow requirements, water quantity, and water quality. Ecol. Indic. 2016, 60, 434–441. [Google Scholar] [CrossRef] [Green Version]
- Sofroniou, A.; Bishop, S. Water scarcity in Cyprus: A review and call for integrated policy. Water 2014, 6, 2898–2928. [Google Scholar] [CrossRef] [Green Version]
- Fontanazza, C.; Freni, G.; La Loggia, G. Analysis of intermittent supply systems in water scarcity conditions and evaluation of the resource distribution equity indices. WIT Trans. Ecol. Environ. 2007, 103, 635–644. [Google Scholar]
- Scott, C.A.; El-Naser, H.; Hagan, R.E.; Hijazi, A. Facing water scarcity in Jordan: Reuse, demand reduction, energy, and transboundary approaches to assure future water supplies. Water Int. 2003, 28, 209–216. [Google Scholar] [CrossRef]
- Shuval, H.; Dweik, H. Water Resources in the Middle East; Springer Science & Business Media: Berlin/Heidelberg, Germany, 2007; Volume 2. [Google Scholar]
- Zahra, B.A.A.A. Water crisis in Palestine. Desalination 2001, 136, 93–99. [Google Scholar] [CrossRef]
- Abu-Madi, M. Impacts of energy price changes on the financial viability of agricultural groundwater wells in Tulkarm district, Palestine. Int. J. Water 2009, 5, 205–222. [Google Scholar] [CrossRef]
- Simukonda, K.; Farmani, R.; Butler, D. Intermittent water supply systems: Causal factors, problems and solution options. Urban Water J. 2018, 15, 488–500. [Google Scholar] [CrossRef]
- Romero, L.; Portillo-Salido, E. Trends in Sigma-1 Receptor Research: A 25-Year Bibliometric Analysis. Front. Pharmacol. 2019, 10, 564. [Google Scholar] [CrossRef] [Green Version]
- Falagas, M.E.; Pitsouni, E.I.; Malietzis, G.A.; Pappas, G. Comparison of PubMed, Scopus, Web of Science, and Google Scholar: Strengths and weaknesses. FASEB J. 2008, 22, 338–342. [Google Scholar] [CrossRef] [PubMed]
- Martín-Martín, A.; Orduna-Malea, E.; Thelwall, M.; Delgado López-Cózar, E. Google Scholar, Web of Science, and Scopus: A systematic comparison of citations in 252 subject categories. J. Informetr. 2018, 12, 1160–1177. [Google Scholar] [CrossRef] [Green Version]
- Hirsch, J.E. An index to quantify an individual’s scientific research output. Proc. Natl. Acad. Sci. USA 2005, 102, 16569–16572. [Google Scholar] [CrossRef] [Green Version]
- Meho, L.I.; Rogers, Y. Citation counting, citation ranking, and h-index of human-computer interaction researchers: A comparison of Scopus and Web of Science. J. Am. Soc. Inf. Sci. Technol. 2008, 59, 1711–1726. [Google Scholar] [CrossRef] [Green Version]
- Cobo, M.J.; López-Herrera, A.G.; Herrera-Viedma, E.; Herrera, F. An approach for detecting, quantifying, and visualizing the evolution of a research field: A practical application to the Fuzzy Sets Theory field. J. Informetr. 2011, 5, 146–166. [Google Scholar] [CrossRef]
- Cobo, M.J.; Lopez-Herrera, A.G.; Herrera, F.; Herrera-Viedma, E. A Note on the ITS Topic Evolution in the Period 2000–2009 at T-ITS. IEEE Trans. Intell. Transp. Syst. 2012, 13, 413–420. [Google Scholar] [CrossRef]
- Chen, C. Searching for intellectual turning points: Progressive knowledge domain visualization. Proc. Natl. Acad. Sci. USA 2004, 101 (Suppl. S1), 5303–5310. [Google Scholar] [CrossRef] [Green Version]
- Zyoud, S.H.; Zyoud, A.H. Coronavirus disease-19 in environmental fields: A bibliometric and visualization mapping analysis. Environ. Dev. Sustain. 2021, 23, 8895–8923. [Google Scholar] [CrossRef]
- Van Eck, N.J.; Waltman, L. Software survey: VOSviewer, a computer program for bibliometric mapping. Scientometrics 2010, 84, 523–538. [Google Scholar] [CrossRef] [PubMed] [Green Version]
- Bornmann, L. Is the promotion of research reflected in bibliometric data? A network analysis of highly cited papers on the Clusters of Excellence supported under the Excellence Initiative in Germany. Scientometrics 2016, 107, 1041–1061. [Google Scholar] [CrossRef] [PubMed] [Green Version]
- Wang, L.; Zhao, L.; Mao, G.; Zuo, J.; Du, H. Way to accomplish low carbon development transformation: A bibliometric analysis during 1995–2014. Renew. Sustain. Energy Rev. 2017, 68, 57–69. [Google Scholar] [CrossRef]
- Aleixandre-Benavent, R.; Aleixandre-Tudó, J.L.; Castelló-Cogollos, L.; Aleixandre, J.L. Trends in scientific research on climate change in agriculture and forestry subject areas (2005–2014). J. Clean. Prod. 2017, 147, 406–418. [Google Scholar] [CrossRef] [Green Version]
- Cobo, M.J.; López-Herrera, A.G.; Herrera-Viedma, E.; Herrera, F. SciMAT: A new science mapping analysis software tool. J. Am. Soc. Inf. Sci. Technol. 2012, 63, 1609–1630. [Google Scholar] [CrossRef]
- Casado-Aranda, L.-A.; Sánchez-Fernández, J.; Viedma-del-Jesús, M.I. Analysis of the scientific production of the effect of COVID-19 on the environment: A bibliometric study. Environ. Res. 2020, 193, 110416. [Google Scholar] [CrossRef]
- Zyoud, S.H.; Zyoud, A.H. Mapping environmental impact assessment research landscapes in the Arab world using visualization and bibliometric techniques. Environ. Sci. Pollut. Res. 2021, 28, 22179–22202. [Google Scholar] [CrossRef]
- Lancet. Epidemic typhoid resulting from an intermittent water-supply. Lancet 1873, 102, 304–305. [Google Scholar] [CrossRef]
- Carpenter, A. The fever at croydon; and intermittent water-supply as a cause of typhoid. Br. Med. J. 1875, 2, 632–635. [Google Scholar] [CrossRef] [Green Version]
- Nature Index The Top 10 Countries in Research Collaboration. Available online: https://www.natureindex.com/news-blog/data-visualization-top-ten-countries-research-collaboration (accessed on 20 November 2021).
- Freni, G.; De Marchis, M.; Napoli, E. Implementation of pressure reduction valves in a dynamic water distribution numerical model to control the inequality in water supply. J. Hydroinform. 2014, 16, 207–217. [Google Scholar] [CrossRef] [Green Version]
- Bivins, A.; Lowry, S.; Wankhede, S.; Hajare, R.; Murphy, H.M.; Borchardt, M.; Labhasetwar, P.; Brown, J. Microbial water quality improvement associated with transitioning from intermittent to continuous water supply in Nagpur, India. Water Res. 2021, 201, 117301. [Google Scholar] [CrossRef]
- Galaitsi, S.E.; Russell, R.; Bishara, A.; Durant, J.L.; Bogle, J.; Huber-Lee, A. Intermittent domestic water supply: A critical review and analysis of causal-consequential pathways. Water 2016, 8, 274. [Google Scholar] [CrossRef] [Green Version]
- Kumpel, E.; Nelson, K.L. Comparing microbial water quality in an intermittent and continuous piped water supply. Water Res. 2013, 47, 5176–5188. [Google Scholar] [CrossRef]
- Kumpel, E.; Nelson, K.L. Intermittent Water Supply: Prevalence, Practice, and Microbial Water Quality. Environ. Sci. Technol. 2016, 50, 542–553. [Google Scholar] [CrossRef]
- Machdar, E.; van der Steen, N.P.; Raschid-Sally, L.; Lens, P.N.L. Application of Quantitative Microbial Risk Assessment to analyze the public health risk from poor drinking water quality in a low income area in Accra, Ghana. Sci. Total Environ. 2013, 449, 134–142. [Google Scholar] [CrossRef] [PubMed]
- Semenza, J.C.; Roberts, L.; Henderson, A.; Bogan, J.; Rubin, C.H. Water distribution system and diarrheal disease transmission: A case study in Uzbekistan. Am. J. Trop. Med. Hyg. 1998, 59, 941–946. [Google Scholar] [CrossRef] [PubMed]
- Soltanjalili, M.J.; Haddad, O.B.; Mariño, M.A. Operating water distribution networks during water shortage conditions using hedging and intermittent water supply concepts. J. Water Resour. Plan. Manag. 2013, 139, 644–659. [Google Scholar] [CrossRef]
- Mokssit, A.; De Gouvello, B.; Chazerain, A.; Figuères, F.; Tassin, B. Building a Methodology for Assessing Service Quality under Intermittent Domestic Water Supply. Water 2018, 10, 1164. [Google Scholar] [CrossRef] [Green Version]
- Taylor, D.D.J.; Slocum, A.H.; Whittle, A.J. Analytical scaling relations to evaluate leakage and intrusion in intermittent water supply systems. PLoS ONE 2018, 13, e0196887. [Google Scholar] [CrossRef] [Green Version]
- Kaminsky, J.; Kumpel, E. Dry Pipes: Associations between Utility Performance and Intermittent Piped Water Supply in Low and Middle Income Countries. Water 2018, 10, 1032. [Google Scholar] [CrossRef] [Green Version]
- Atnafu, B.; Desta, A.; Assefa, F. Microbial Community Structure and Diversity in Drinking Water Supply, Distribution Systems as well as Household Point of Use Sites in Addis Ababa City, Ethiopia. Microb. Ecol. 2021. [Google Scholar] [CrossRef]
- Zayed, A.R.; Butmeh, S.; Pecellin, M.; Salah, A.; Alalam, H.; Steinert, M.; Höfle, M.G.; Bitar, D.M.; Brettar, I. Biogeography and Environmental Drivers of Legionella pneumophila Abundance and Genotype Composition across the West Bank: Relevance of a Genotype-Based Ecology for Understanding Legionella Occurrence. Pathogens 2020, 9, 1012. [Google Scholar] [CrossRef]
- Sadiq, R.; Kleiner, Y.; Rajani, B. Estimating risk of contaminant intrusion in water distribution networks using Dempster–Shafer theory of evidence. Civ. Eng. Environ. Syst. 2006, 23, 129–141. [Google Scholar] [CrossRef]
- Besner, M.-C.; Prévost, M.; Regli, S. Assessing the public health risk of microbial intrusion events in distribution systems: Conceptual model, available data, and challenges. Water Res. 2011, 45, 961–979. [Google Scholar] [CrossRef]
- Rathi, S.; Gupta, R.; Kamble, S.; Sargaonkar, A. Risk Based Analysis for Contamination Event Selection and Optimal Sensor Placement for Intermittent Water Distribution Network Security. Water Resour. Manag. 2016, 8, 2671–2685. [Google Scholar] [CrossRef]
- Haider, H.; Alkhowaiter, M.H.; Shafiquzzaman, M.D.; Alresheedi, M.; AlSaleem, S.S.; Ghumman, A.R. Source to Tap Risk Assessment for Intermittent Water Supply Systems in Arid Regions: An Integrated FTA—Fuzzy FMEA Methodology. Environ. Manag. 2021, 67, 324–341. [Google Scholar] [CrossRef]
- Coelho, S.; James, S.; Sunna, N.; Chatila, J. Controlling water quality in intermittent supply systems. Water Supply 2003, 3, 119–125. [Google Scholar] [CrossRef]
- Alazzeh, S.; Galaitsi, S.E.; Bishara, A.; Al-Azraq, N.; Durant, J.L. Impacts of Intermittent Water Supply on Water Quality in Two Palestinian Refugee Camps. Water 2019, 11, 670. [Google Scholar] [CrossRef] [Green Version]
- Tokajian, S.; Hashwa, F. Water quality problems associated with intermittent water supply. Water Sci. Technol. 2003, 47, 229–234. [Google Scholar] [CrossRef]
- Gonzalez, C.I.; Erickson, J.; Chavarría, K.A.; Nelson, K.L.; Goodridge, A. Household stored water quality in an intermittent water supply network in Panama. J. Water Sanit. Hyg. Dev. 2020, 10, 298–308. [Google Scholar] [CrossRef] [Green Version]
- Yassin, M.M.; Amr, S.S.A.; Al-Najar, H.M. Assessment of microbiological water quality and its relation to human health in Gaza Governorate, Gaza Strip. Public Health 2006, 120, 1177–1187. [Google Scholar] [CrossRef]
- Abu Amr, S.; Yassin, M. Microbial contamination of the drinking water distribution system and its impact on human health in Khan Yunis Governorate, Gaza Strip: Seven years of monitoring (2000–2006). Public Health 2008, 122, 1275–1283. [Google Scholar] [CrossRef]
- Shrestha, A.; Six, J.; Dahal, D.; Marks, S.; Meierhofer, R. Association of nutrition, water, sanitation and hygiene practices with children’s nutritional status, intestinal parasitic infections and diarrhoea in rural Nepal: A cross-sectional study. BMC Public Health 2020, 20, 1241. [Google Scholar] [CrossRef]
- Elala, D.; Labhasetwar, P.; Tyrrel, S.F. Deterioration in water quality from supply chain to household and appropriate storage in the context of intermittent water supplies. Water Sci. Technol. Water Supply 2011, 11, 400–408. [Google Scholar] [CrossRef]
- Grube, A.M.; Stewart, J.R.; Ochoa-Herrera, V. The challenge of achieving safely managed drinking water supply on San Cristobal island, Galápagos. Int. J. Hyg. Environ. Health 2020, 228, 113547. [Google Scholar] [CrossRef]
- Bain, R.; Cronk, R.; Wright, J.; Yang, H.; Slaymaker, T.; Bartram, J. Fecal contamination of drinking-water in low-and middle-income countries: A systematic review and meta-analysis. PLoS Med. 2014, 11, e1001644. [Google Scholar] [CrossRef] [Green Version]
- Price, H.D.; Adams, E.A.; Nkwanda, P.D.; Mkandawire, T.W.; Quilliam, R.S. Daily changes in household water access and quality in urban slums undermine global safe water monitoring programmes. Int. J. Hyg. Environ. Health 2021, 231, 113632. [Google Scholar] [CrossRef]
- Adane, M.; Mengistie, B.; Medhin, G.; Kloos, H.; Mulat, W. Piped water supply interruptions and acute diarrhea among under-five children in Addis Ababa slums, Ethiopia: A matched case-control study. PLoS ONE 2017, 12, e0181516. [Google Scholar] [CrossRef] [Green Version]
- Kumpel, E.; Nelson, K.L. Mechanisms affecting water quality in an intermittent piped water supply. Environ. Sci. Technol. 2014, 48, 2766–2775. [Google Scholar] [CrossRef]
- Van den Berg, H.; Quaye, M.N.; Nguluve, E.; Schijven, J.; Ferrero, G. Effect of operational strategies on microbial water quality in small scale intermittent water supply systems: The case of Moamba, Mozambique. Int. J. Hyg. Environ. Health 2021, 236, 113794. [Google Scholar] [CrossRef]
- Li, H.; Cohen, A.; Li, Z.; Lv, S.; He, Z.; Wang, L.; Zhang, X. Intermittent Water Supply Management, Household Adaptation, and Drinking Water Quality: A Comparative Study in Two Chinese Provinces. Water 2020, 12, 1361. [Google Scholar] [CrossRef]
- Fontanazza, C.M.; Notaro, V.; Puleo, V.; Nicolosi, P.; Freni, G. Contaminant Intrusion through Leaks in Water Distribution System: Experimental Analysis. Proc. Eng. 2015, 119, 426–433. [Google Scholar] [CrossRef] [Green Version]
- Vairavamoorthy, K.; Yan, J.; Galgale, H.M.; Gorantiwar, S.D. IRA-WDS: A GIS-based risk analysis tool for water distribution systems. Environ. Model. Softw. 2007, 22, 951–965. [Google Scholar] [CrossRef]
- Sakomoto, T.; Lutaaya, M.; Abraham, E. Managing Water Quality in Intermittent Supply Systems: The Case of Mukono Town, Uganda. Water 2020, 12, 806. [Google Scholar] [CrossRef] [Green Version]
- Erickson, J.J.; Smith, C.D.; Goodridge, A.; Nelson, K.L. Water quality effects of intermittent water supply in Arraiján, Panama. Water Res. 2017, 114, 338–350. [Google Scholar] [CrossRef]
- Calero Preciado, C.; Husband, S.; Boxall, J.; del Olmo, G.; Soria-Carrasco, V.; Maeng, S.K.; Douterelo, I. Intermittent Water Supply Impacts on Distribution System Biofilms and Water Quality. Water Res. 2021, 201, 117372. [Google Scholar] [CrossRef]
- Indian Water Works Association (IWWA). International Seminar on Intermittent Drinking Water Supply System Management: Technical Papers. In Proceedings of the International Seminar on Intermittent Drinking Water Supply System Management, Mumbai, India, 20–23 April 2000. [Google Scholar]
- De Marchis, M.; Fontanazza, C.; Freni, G.; La Loggia, G.; Napoli, E.; Notaro, V. Analysis of the impact of intermittent distribution by modelling the network-filling process. J. Hydroinform. 2011, 13, 358–373. [Google Scholar] [CrossRef]
- Vairavamoorthy, K.; Elango, K. Guidelines for the design and control of intermittent water distribution systems. Waterlines 2002, 21, 19–21. [Google Scholar] [CrossRef] [Green Version]
- Rossman, L.A. EPANET 2 Users Manual, US Environmental Protection Agency; Water Supply and Water Resources Division, National Risk Management Research Laboratory: Cincinnati, OH, USA, 2000; p. 45268.
- Fontanazza, C.; Freni, G.; La Loggia, G.; Notaro, V. Definition of Performance Indicators for Urban Water Distribution Systems in Drought Conditions; IWA Publishing: London, UK, 2008. [Google Scholar]
- Ingeduld, P.; Svitak, Z.; Pradhan, A.; Tarai, A. Modelling intermittent water supply systems with EPANET. In Proceedings of the 8th Annual Water Distribution Systems Analysis Symposium, Cincinnati, OH, USA, 27–30 August 2006; pp. 27–30. [Google Scholar]
- Nyende-Byakika, S.; Ngirane-Katashaya, G.; Ndambuki, J.M. Modeling flow regime transition in intermittent water supply networks using the interface tracking method. Int. J. Phys. Sci. 2012, 7, 327–337. [Google Scholar] [CrossRef]
- Mohan, S.; Abhijith, G.R. Hydraulic Analysis of Intermittent Water-Distribution Networks Considering Partial-Flow Regimes. J. Water Resour. Plan. Manag. 2020, 146, 04020071. [Google Scholar] [CrossRef]
- Campisano, A.; Gullotta, A.; Modica, C. Using EPA-SWMM to simulate intermittent water distribution systems. Urban Water J. 2018, 15, 925–933. [Google Scholar] [CrossRef]
- Guragai, B.; Hashimoto, T.; Oguma, K.; Takizawa, S. Data logger-based measurement of household water consumption and micro-component analysis of an intermittent water supply system. J. Clean. Prod. 2018, 197, 1159–1168. [Google Scholar] [CrossRef]
- Rosenberg, D.E. Integrated water resources management and modeling at multiple spatial scales in Jordan. Water Policy 2009, 11, 615. [Google Scholar] [CrossRef] [Green Version]
- Rosenberg, D.E.; Tarawneh, T.; Abdel-Khaleq, R.; Lund, J.R. Modeling integrated water user decisions in intermittent supply systems. Water Resour. Res. 2007, 43, W07425. [Google Scholar] [CrossRef]
- Madanat, S.; Humplick, F. A model of household choice of water supply systems in developing countries. Water Resour. Res. 1993, 29, 1353–1358. [Google Scholar] [CrossRef]
- Kumpel, E.; Woelfle-Erskine, C.; Ray, I.; Nelson, K.L. Measuring household consumption and waste in unmetered, intermittent piped water systems. Water Resour. Res. 2017, 53, 302–315. [Google Scholar] [CrossRef] [Green Version]
- AL-Washali, T.; Sharma, S.; AL-Nozaily, F.; Haidera, M.; Kennedy, M. Monitoring Nonrevenue Water Performance in Intermittent Supply. Water 2019, 11, 1220. [Google Scholar] [CrossRef] [Green Version]
- Mastaller, M.; Klingel, P. Application of a water balance adapted to intermittent water supply and flat-rate tariffs without customer metering in Tiruvannamalai, India. Water Supply 2017, 18, 347–356. [Google Scholar] [CrossRef]
- Haider, H.; Al-Salamah, I.S.; Ghazaw, Y.M.; Abdel-Maguid, R.H.; Shafiquzzaman, M.; Ghumman, A.R. Framework to Establish Economic Level of Leakage for Intermittent Water Supplies in Arid Environments. J. Water Resour. Plan. Manag. 2019, 145, 05018018. [Google Scholar] [CrossRef]
- Zyoud, S.H.; Shaheen, H.; Samhan, S.; Rabi, A.; Al-Wadi, F.; Fuchs-Hanusch, D. Utilizing analytic hierarchy process (AHP) for decision making in water loss management of intermittent water supply systems. J. Water Sanit. Hyg. Dev. 2016, 6, 534–546. [Google Scholar] [CrossRef]
- Zyoud, S.H.; Fuchs-Hanusch, D. Comparison of Several Decision-Making Techniques: A Case of Water Losses Management in Developing Countries. Int. J. Inf. Technol. Decis. Mak. 2019, 18, 1551–1578. [Google Scholar] [CrossRef]
- Zyoud, S.H.; Fuchs-Hanusch, D. An Integrated Decision-Making Framework to Appraise Water Losses in Municipal Water Systems. Int. J. Inf. Technol. Decis. Mak. 2020, 19, 1293–1326. [Google Scholar] [CrossRef]
- Agathokleous, A.; Christodoulou, S. Vulnerability of Urban Water Distribution Networks under Intermittent Water Supply Operations. Water Resour Manag. 2016, 30, 4731–4750. [Google Scholar] [CrossRef]
- De Marchis, M.; Fontanazza, C.; Freni, G.; Messineo, A.; Milici, B.; Napoli, E.; Notaro, V.; Puleo, V.; Scopa, A. Energy recovery in water distribution networks. Implementation of pumps as turbine in a dynamic numerical model. Proc. Eng. 2014, 70, 439–448. [Google Scholar] [CrossRef] [Green Version]
- Carravetta, A.; Del Giudice, G.; Fecarotta, O.; Ramos, H.M. Pump as Turbine (PAT) Design in Water Distribution Network by System Effectiveness. Water 2013, 5, 1211–1225. [Google Scholar] [CrossRef] [Green Version]
- Puleo, V.; Fontanazza, C.M.; Notaro, V.; De Marchis, M.; Freni, G.; La Loggia, G. Pumps as turbines (PATs) in water distribution networks affected by intermittent service. J. Hydroinform. 2013, 16, 259–271. [Google Scholar] [CrossRef] [Green Version]
- Gullotta, A.; Campisano, A.; Creaco, E.; Modica, C. A Simplified Methodology for Optimal Location and Setting of Valves to Improve Equity in Intermittent Water Distribution Systems. Water Resour Manag. 2021, 35, 4477–4494. [Google Scholar] [CrossRef]
- Nyahora, P.P.; Babel, M.S.; Ferras, D.; Emen, A. Multi-objective optimization for improving equity and reliability in intermittent water supply systems. Water Supply 2020, 20, 1592–1603. [Google Scholar] [CrossRef] [Green Version]
- Ilaya-Ayza, A.E.; Martins, C.; Campbell, E.; Izquierdo, J. Implementation of DMAs in Intermittent Water Supply Networks Based on Equity Criteria. Water 2017, 9, 851. [Google Scholar] [CrossRef] [Green Version]
- Meyer, D.D.J.; Khari, J.; Whittle, A.J.; Slocum, A.H. Effects of hydraulically disconnecting consumer pumps in an intermittent water supply. Water Res. X 2021, 12, 100107. [Google Scholar] [CrossRef]
- Myers, S. 24-h water supply: Is this goal achievable? Drawing lessons from rapid distribution system diagnostic assessments in Indian cities. In Proceedings of the Fifteenth Meeting of the Urban Think Tank, Hyderabad, India, 23–24 September 2003; pp. 23–24. [Google Scholar]
- Dahasahasra, S. A model for transforming an intermittent into a 24x7 water supply system. Geospat. Today 2007, 8, 34–39. [Google Scholar]
- Klingel, P.; Deuerlein, J. Rehabilitation strategy for water supply systems in developing countries case study IWRM Oasis Beni Abbes, Algeria. In Proceedings of the 10th Annual Water Distribution Systems Analysis Conference WDSA, Kruger National Park, South Africa, 17–20 August 2008; pp. 17–20. [Google Scholar]
- David, C.; García, M.; Navarro Gómez, C.J. Analysis of hybrid demand pattern on a water distribution network with transition from intermittent to continuous water supply in Riberas de Sacramento, Chihuahua. Water Pract. Technol. 2020, 15, 213–224. [Google Scholar] [CrossRef] [Green Version]
- El Achi, N.; Rouse, M.J. A hybrid hydraulic model for gradual transition from intermittent to continuous water supply in Amman, Jordan: A theoretical study. Water Supply 2019, 20, 118–129. [Google Scholar] [CrossRef]
- Ray, I.; Billava, N.; Burt, Z.; Colford, J.M.; Ercümen, A.; Jayaramu, K.P.; Kumpel, E.; Nayak, N.; Nelson, K.; Woelfle-Erskine, C. From Intermittent to Continuous Water Supply a Household-level Evaluation of Water System Reforms in Hubli–Dharwad. Econ. Political Wkly. 2018, 53, 39–48. [Google Scholar]
- Burt, Z.; Ercümen, A.; Billava, N.; Ray, I. From intermittent to continuous service: Costs, benefits, equity and sustainability of water system reforms in Hubli-Dharwad, India. World Dev. 2018, 109, 121–133. [Google Scholar] [CrossRef] [Green Version]
- Chea, V. From Bad Service to Outstanding Water Utility: Phnom Penh’s Experience. Going Public: Southerm Solutions to the Global Water Crisis,” World Development Movement (March 2007). 2007. Available online: http://www.globalpolicy.org/socecon/gpg/2007/0319public.pdf (accessed on 21 November 2021).
- Seetharam, K.; Bridges, G. Helping India Achieve 24x7 Water Supply Service by 2010. In Proceedings of the Roundtable Discussion on Private Sector Participation in Water Supply in India, Bangalore, India, 15–16 June 2005; pp. 15–16. [Google Scholar]
Figure 1.
Major social, technical, economic, and health flaws associated with the adoption of intermittent water supply systems (IWSSs), modified after Zyoud [46].
Figure 1.
Major social, technical, economic, and health flaws associated with the adoption of intermittent water supply systems (IWSSs), modified after Zyoud [46].

Figure 2.
The strategic diagram that displays the various types of themes based on their centrality and density, adopted after Zyoud and Zyoud [76].
Figure 2.
The strategic diagram that displays the various types of themes based on their centrality and density, adopted after Zyoud and Zyoud [76].

Figure 3.
The roadmap outlines the entire analysis procedure including data collection, bibliometric analysis, and major outcomes.
Figure 3.
The roadmap outlines the entire analysis procedure including data collection, bibliometric analysis, and major outcomes.

Figure 4.
Evolution of publications on IWSSs with a timeframe from the beginning of 1875 to 1 October 2021.
Figure 4.
Evolution of publications on IWSSs with a timeframe from the beginning of 1875 to 1 October 2021.

Figure 5.
Nation–level production regarding intermittent water supply; a worldwide perspective of the research productivity at the country level. The intensity of colors elucidates the number of published works. The size of black circles represents the output of each country (i.e., the larger the circle, the higher the performance of the country with respect to the number of publications). The global map was created using Statplanet Interactive Mapping and Visualization Software, www.statsilk.com, free license.

Figure 6.
Countries’ collaboration map using network visualization maps. Five documents were specified as a threshold for each country. Twelve countries met the set threshold. The link thickness was used to indicate collaboration strength between countries. The circle that bounded the item (the country) indicates the contribution of each item based on the size of the circle (a country that has a higher contribution with respect to co-authorships has a larger circle compared to other countries). More related items have the same color (i.e., appointed to the same cluster).

Figure 7.
Bibliographical coupling among countries using network visualization maps. Five documents were specified as a threshold for each country. Fourteen countries met the set threshold. The overall strength of bibliographical coupling links was estimated for each country that met the threshold. The selected countries were the ones that acquired the highest total link strength.

Figure 8.
Co-citation analysis of top sources with 40 citations/source as a minimum number of citations (network visualization map). Of the 3623 sources, 8 sources met the set threshold. The overall strength of co-citation links was assessed for each source. The selected sources were the ones with the strongest co-citation links.

Figure 9.
The network visualization map of co-authorship links between scholars. Five documents/author were proposed as a minimum number. Five of the 609 authors met the set threshold. The overall strength of co-authorship links was assessed for each author. The selected authors were the ones with the strongest co-authorship links.

Figure 10.
Evolution of citations of published works on IWSSs.

Figure 11.
The network visualization map of terms co-occurrence in titles and abstracts. Ten occurrences of a term were set as the minimum number. A total of 152 terms met the set threshold out of 5268 terms. A relevance score was set to assess the most relevant terms: 60%. The selected terms were the most relevant: 91 terms were categorized into 3 major clusters.

Figure 12.
The strategic diagram depicts the number of published works and combines the different themes of IWSS research at the global level.
Figure 12.
The strategic diagram depicts the number of published works and combines the different themes of IWSS research at the global level.


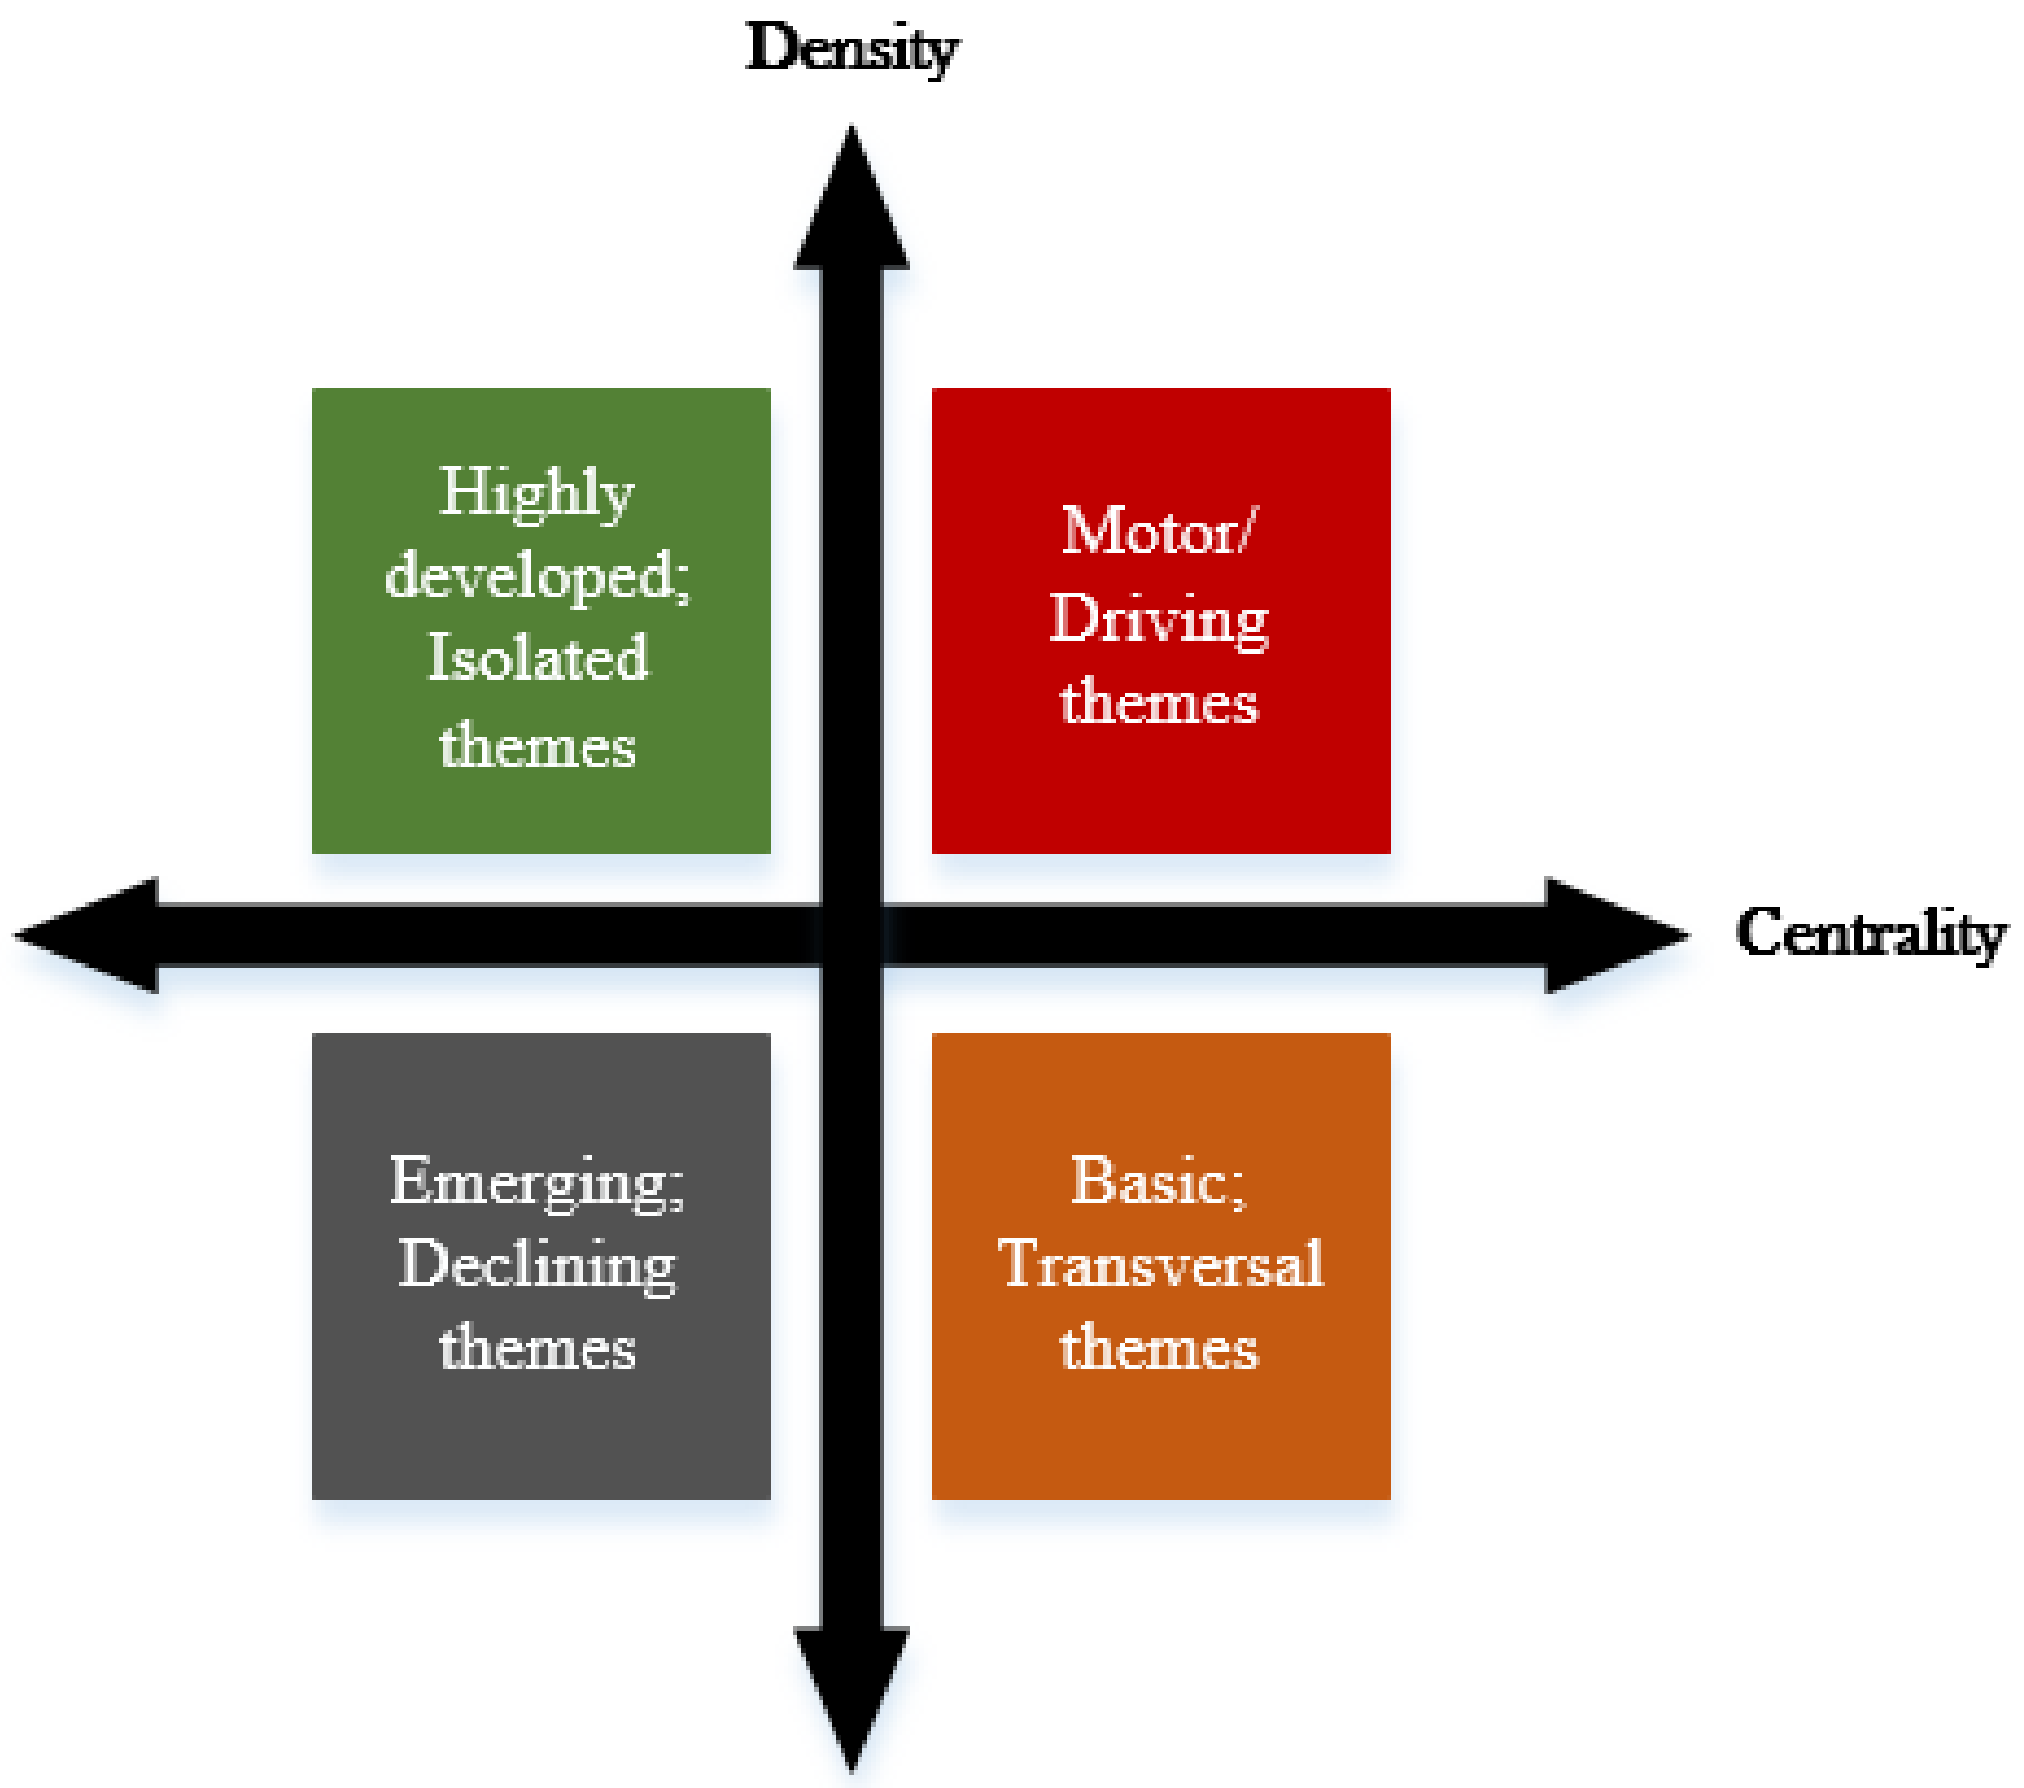
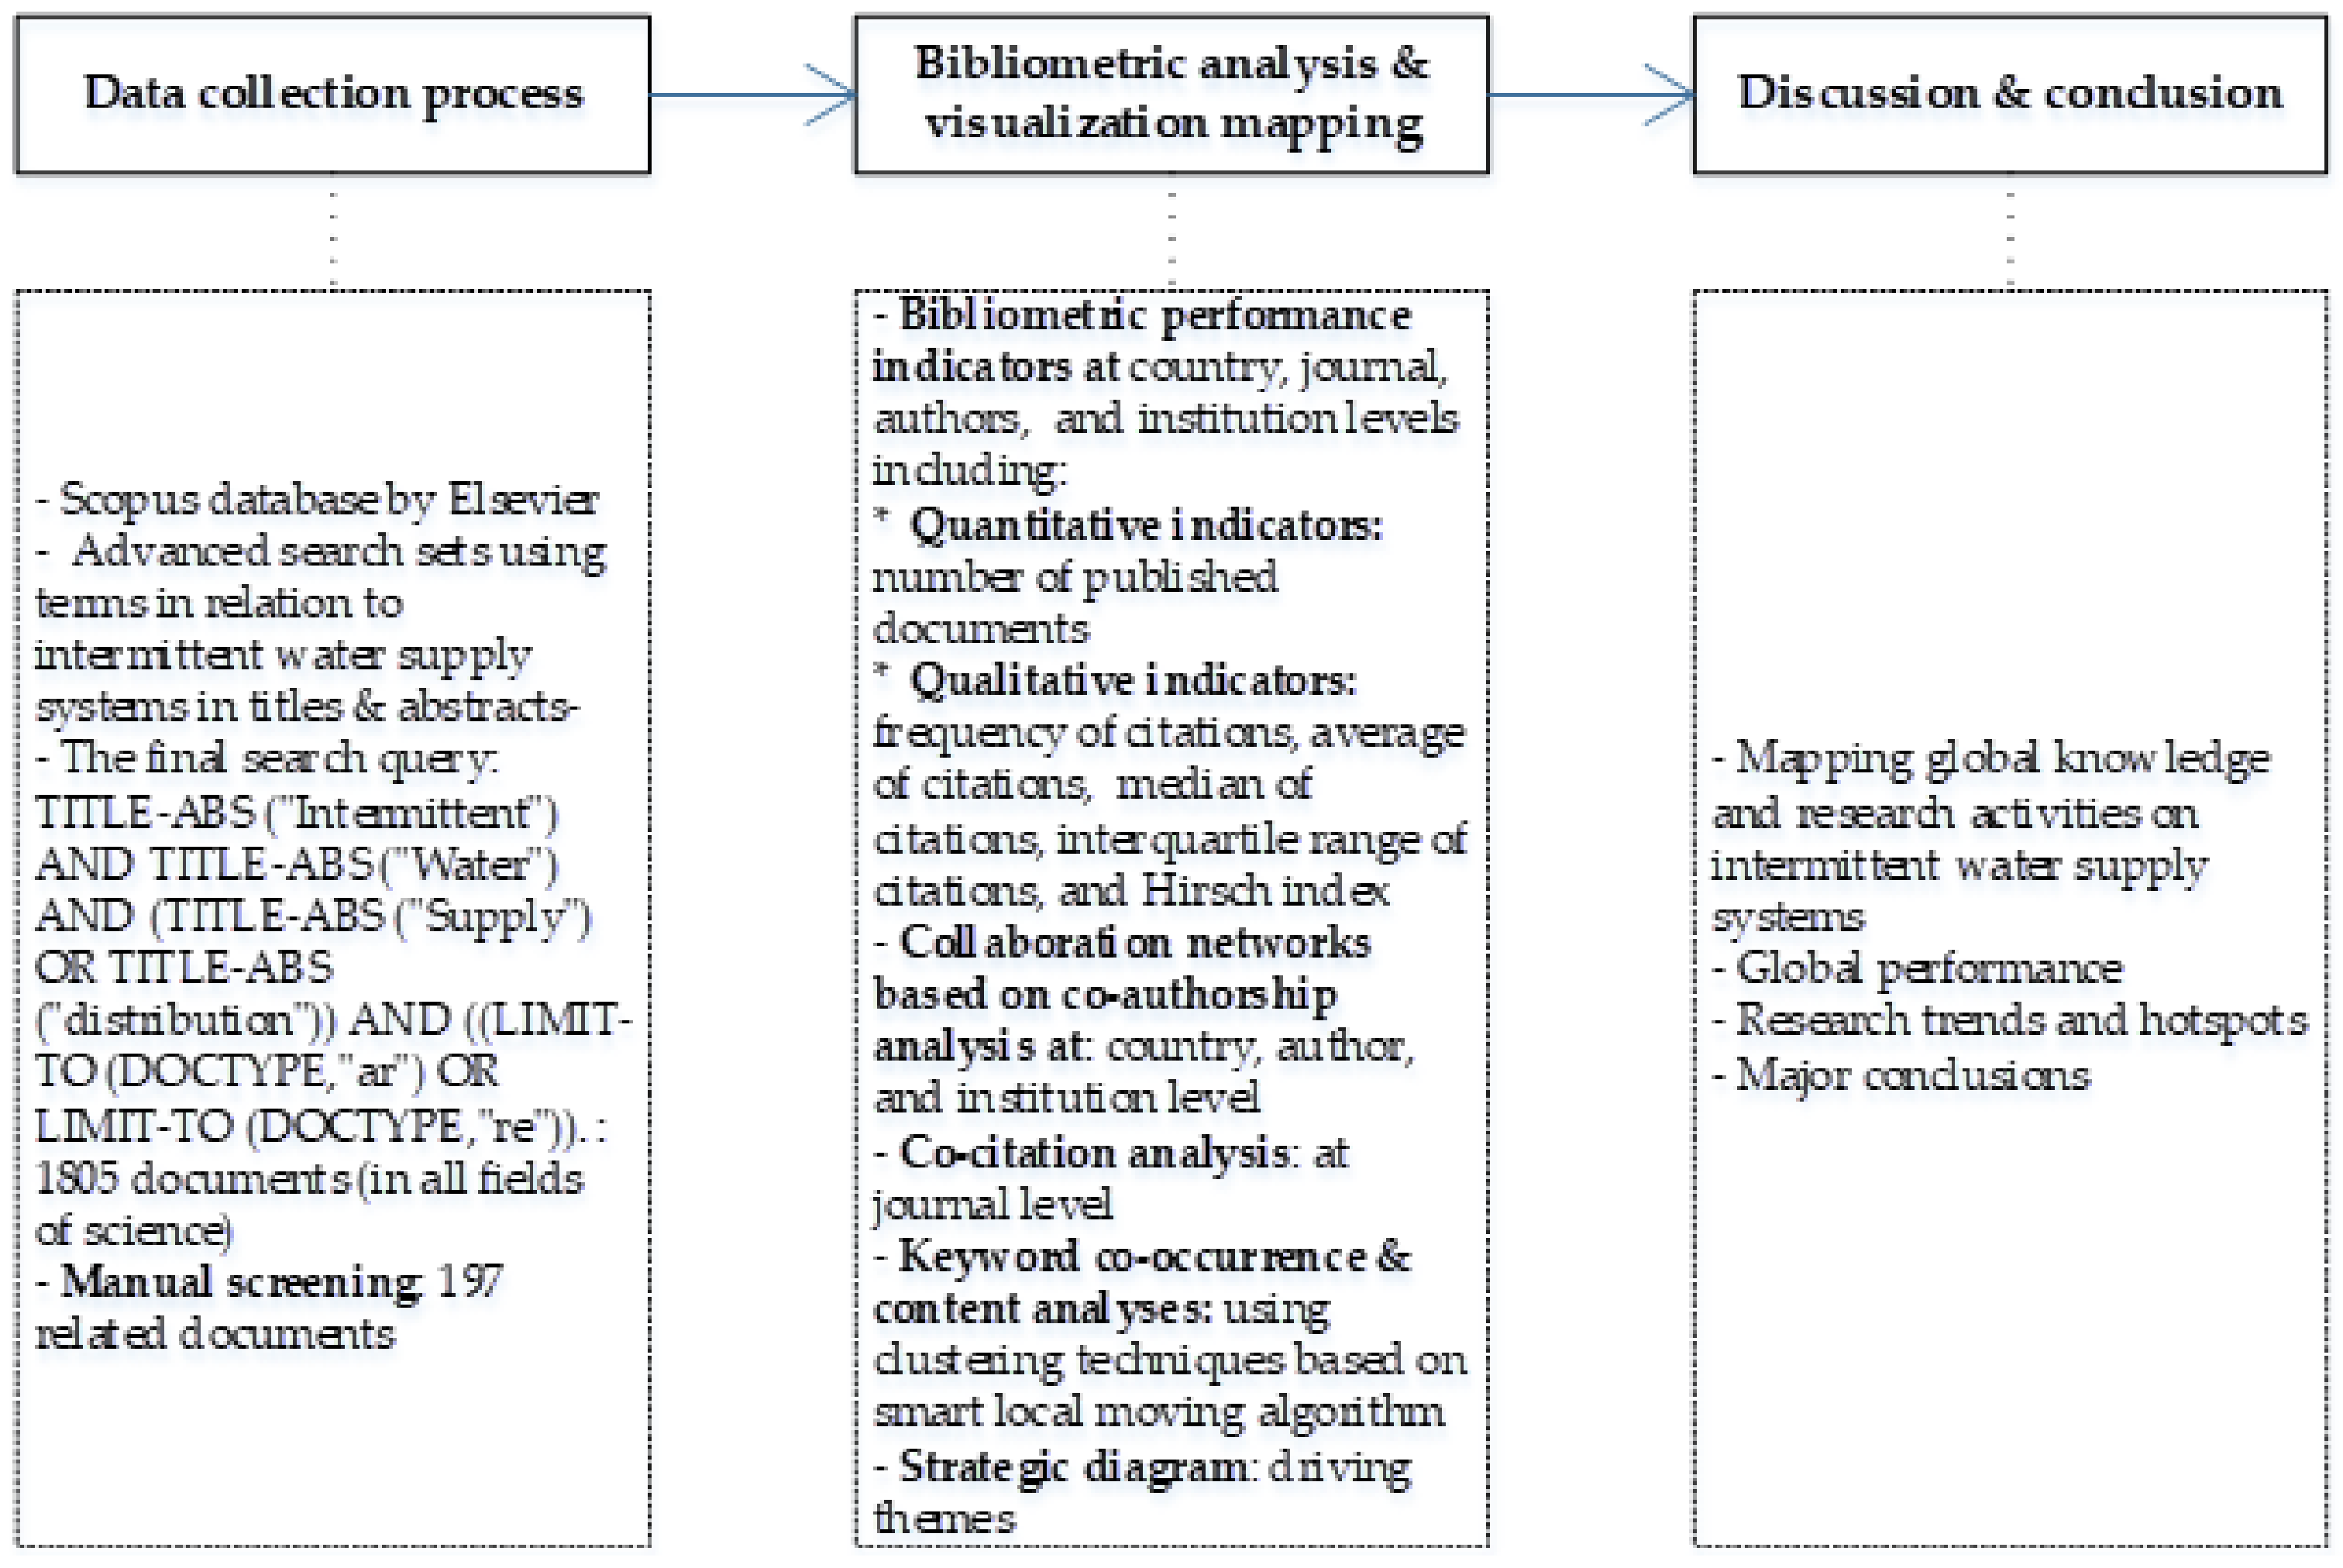
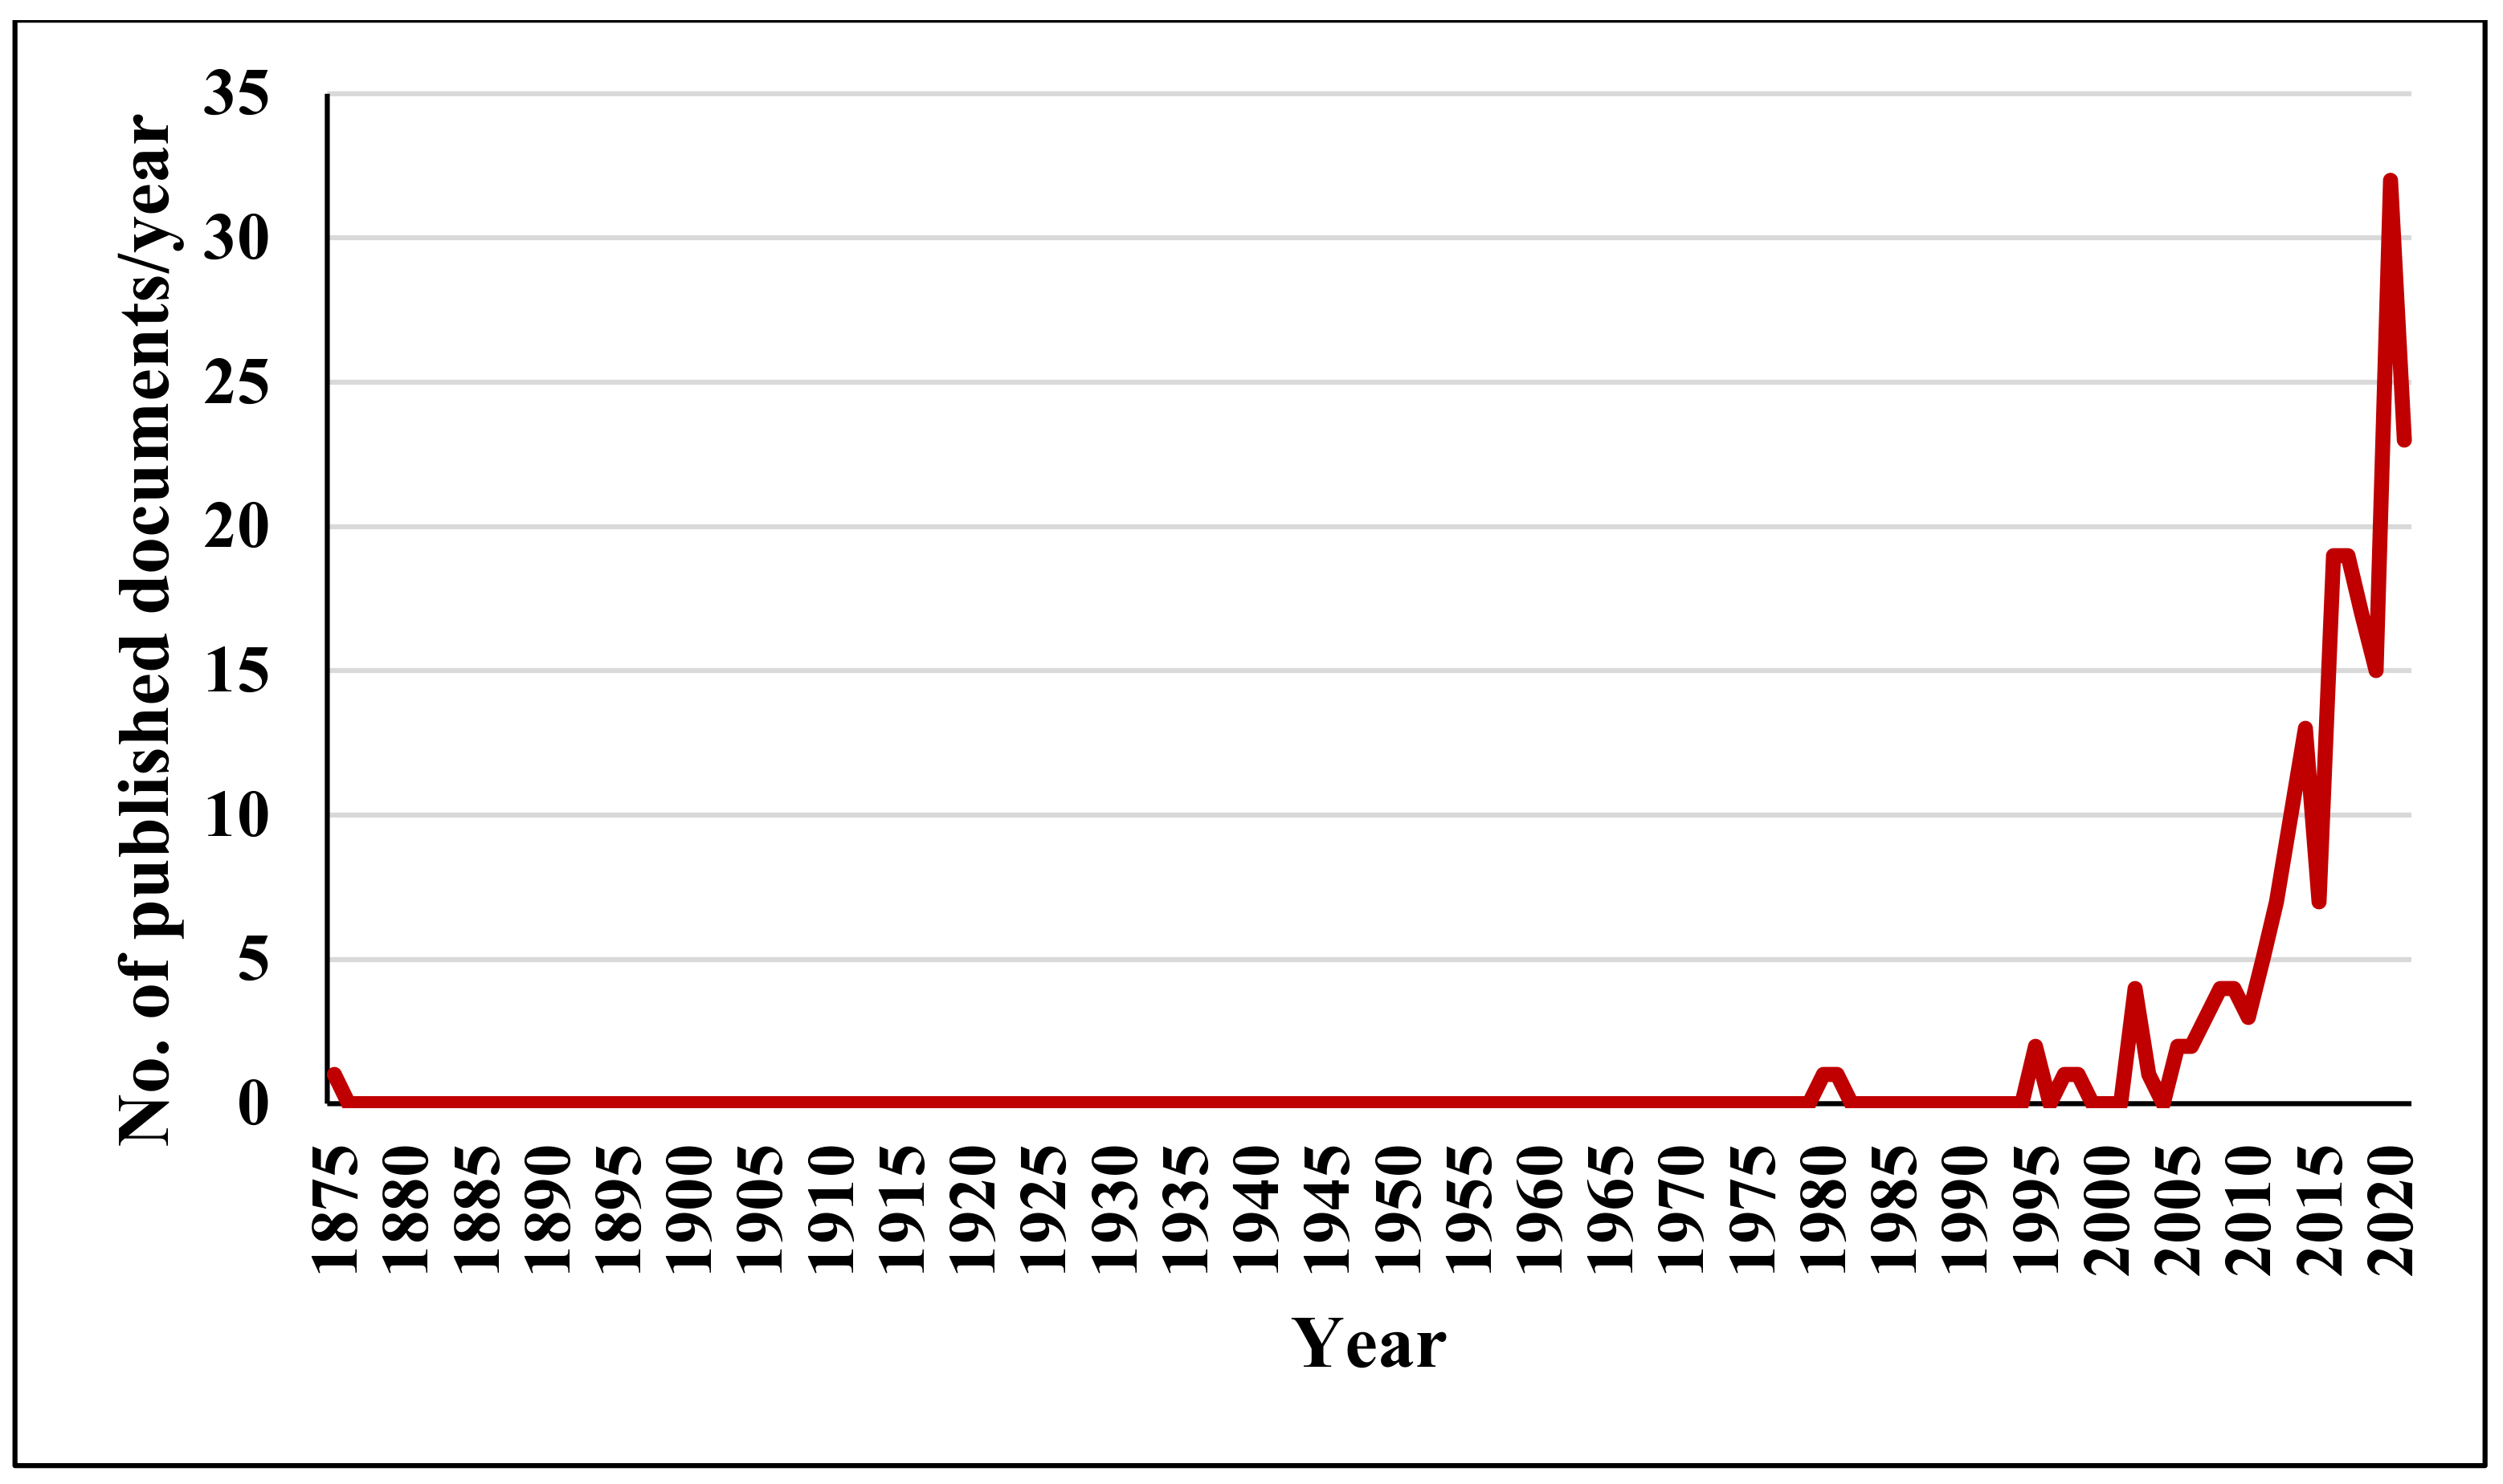
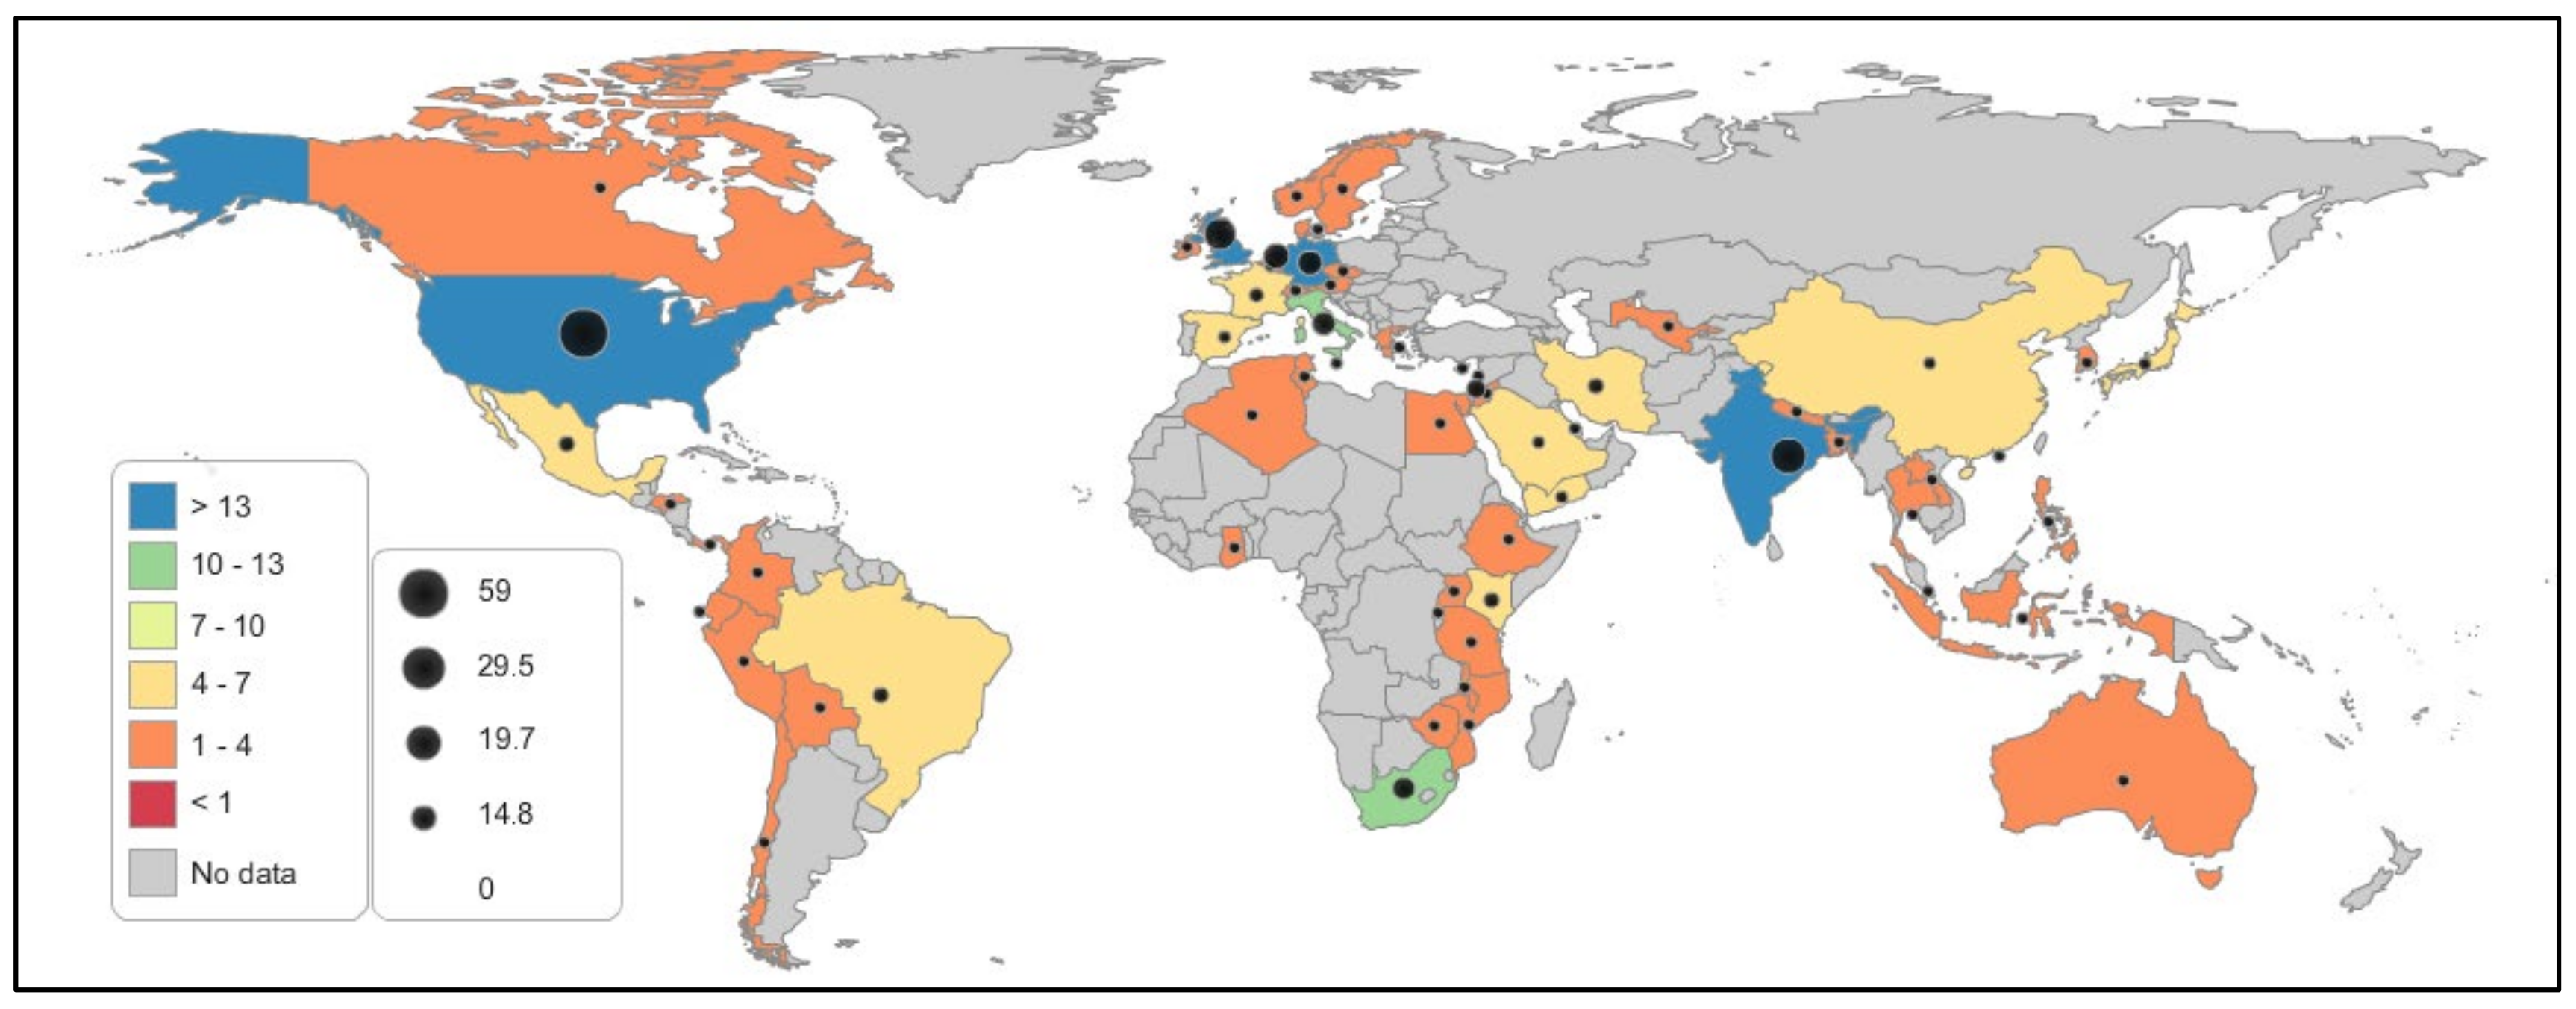
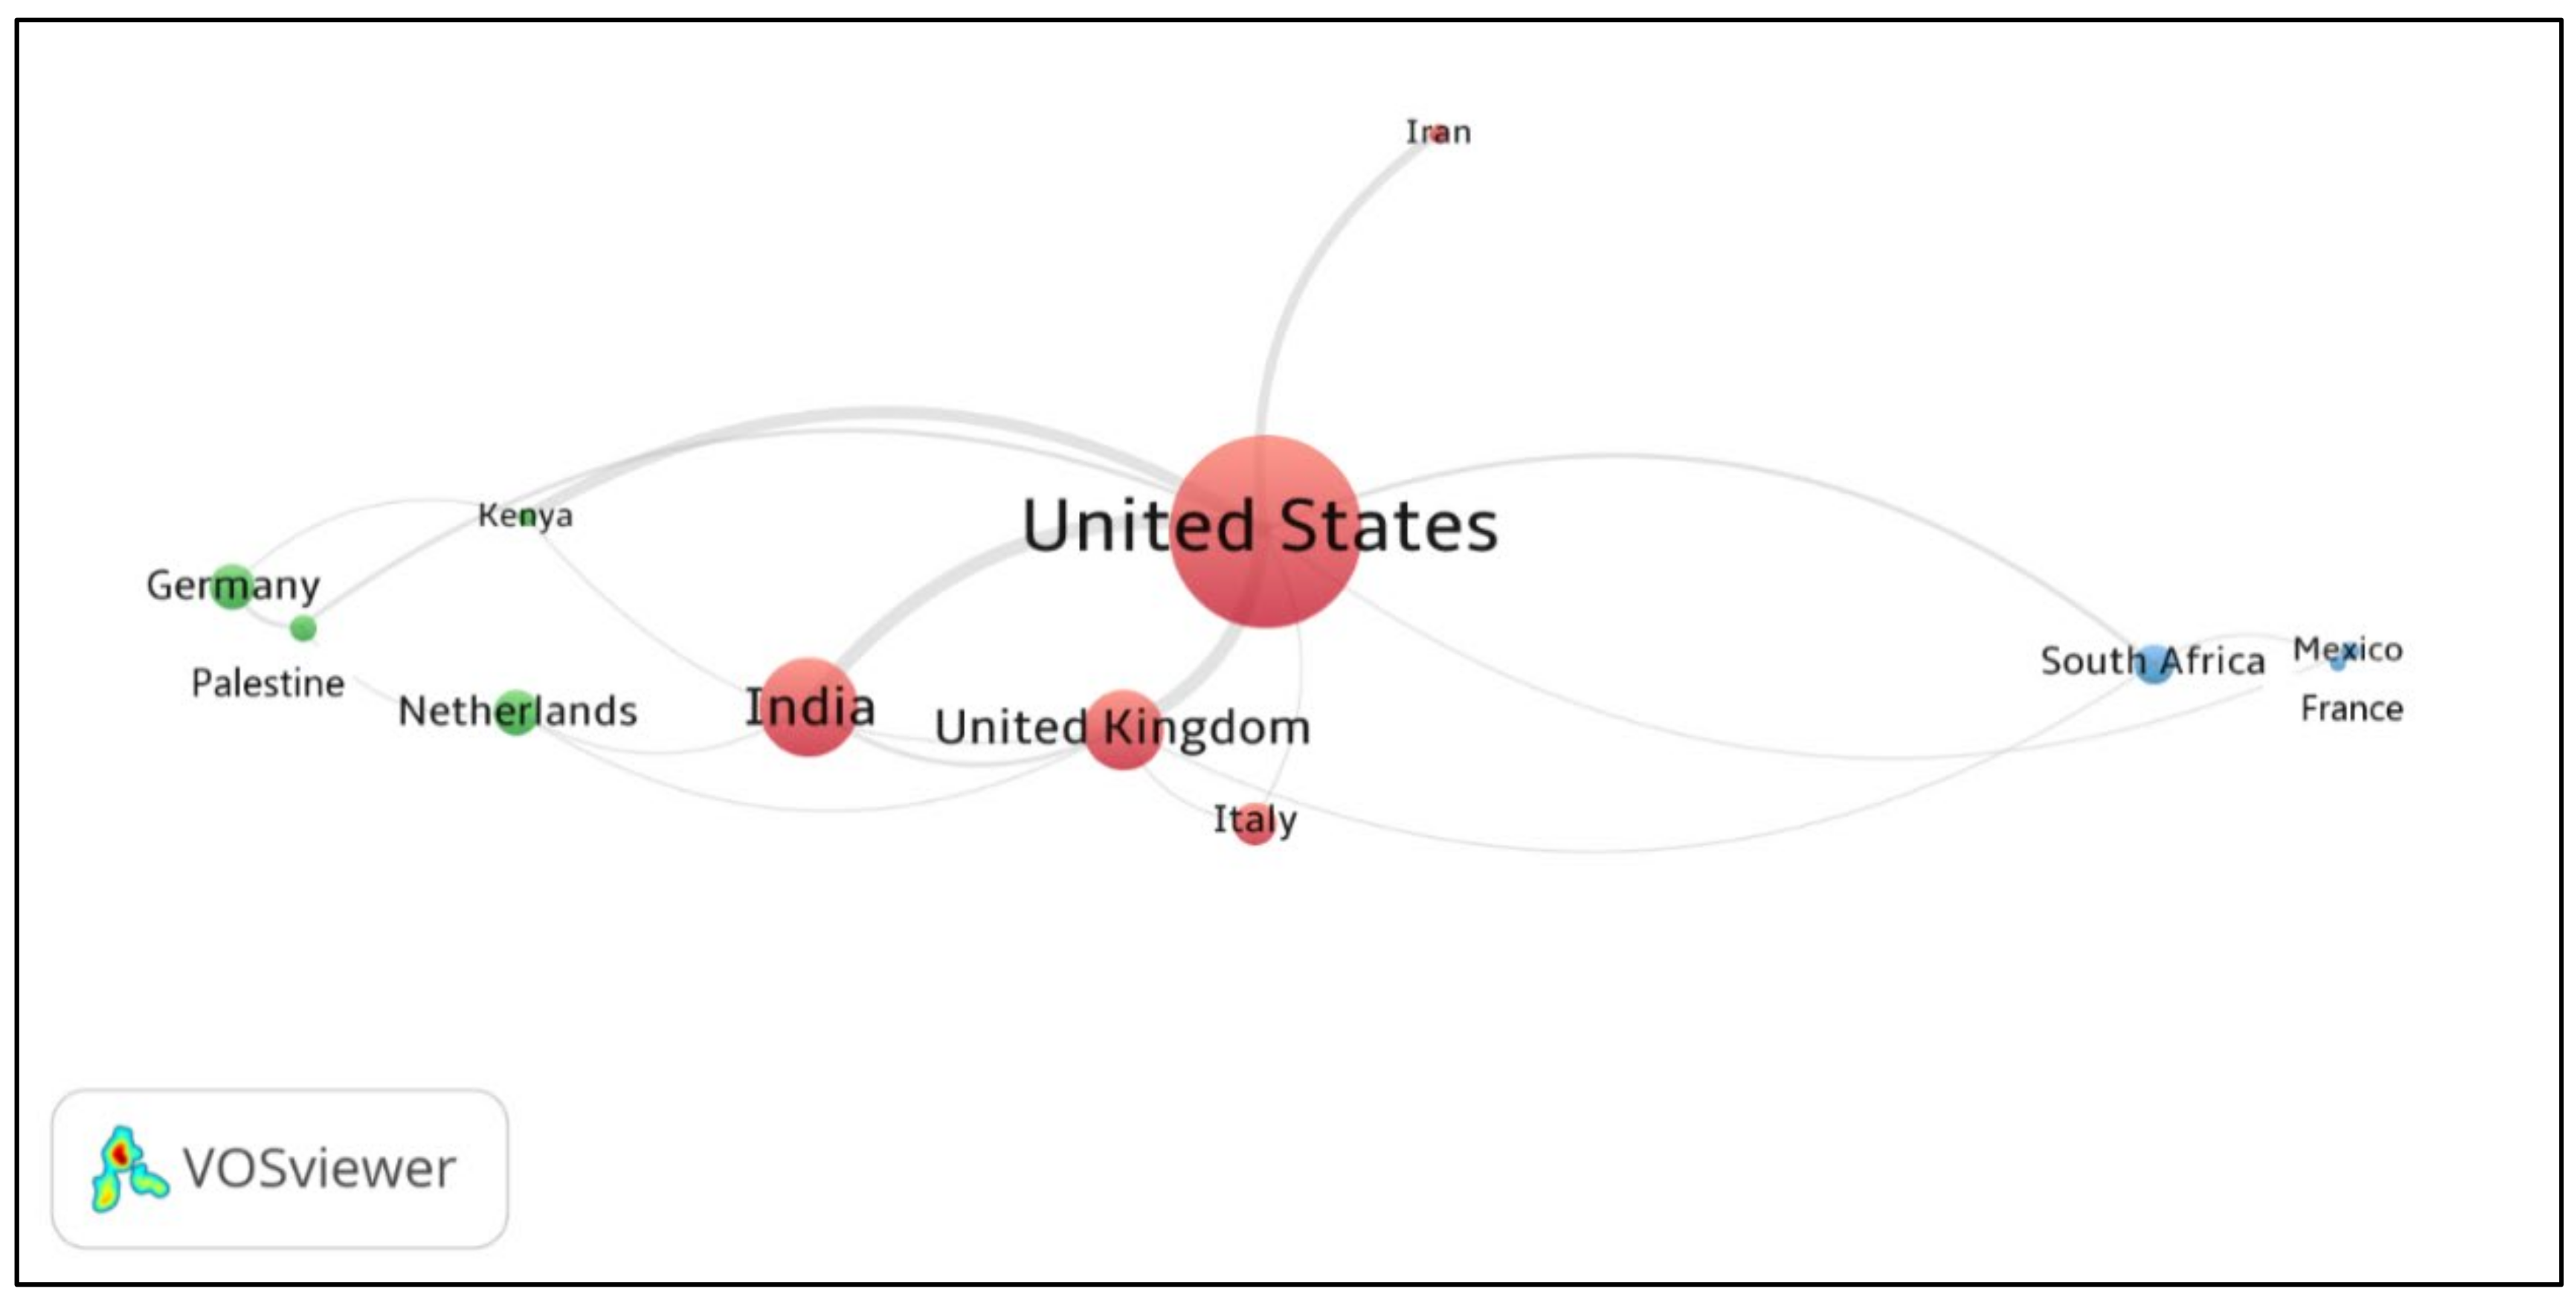
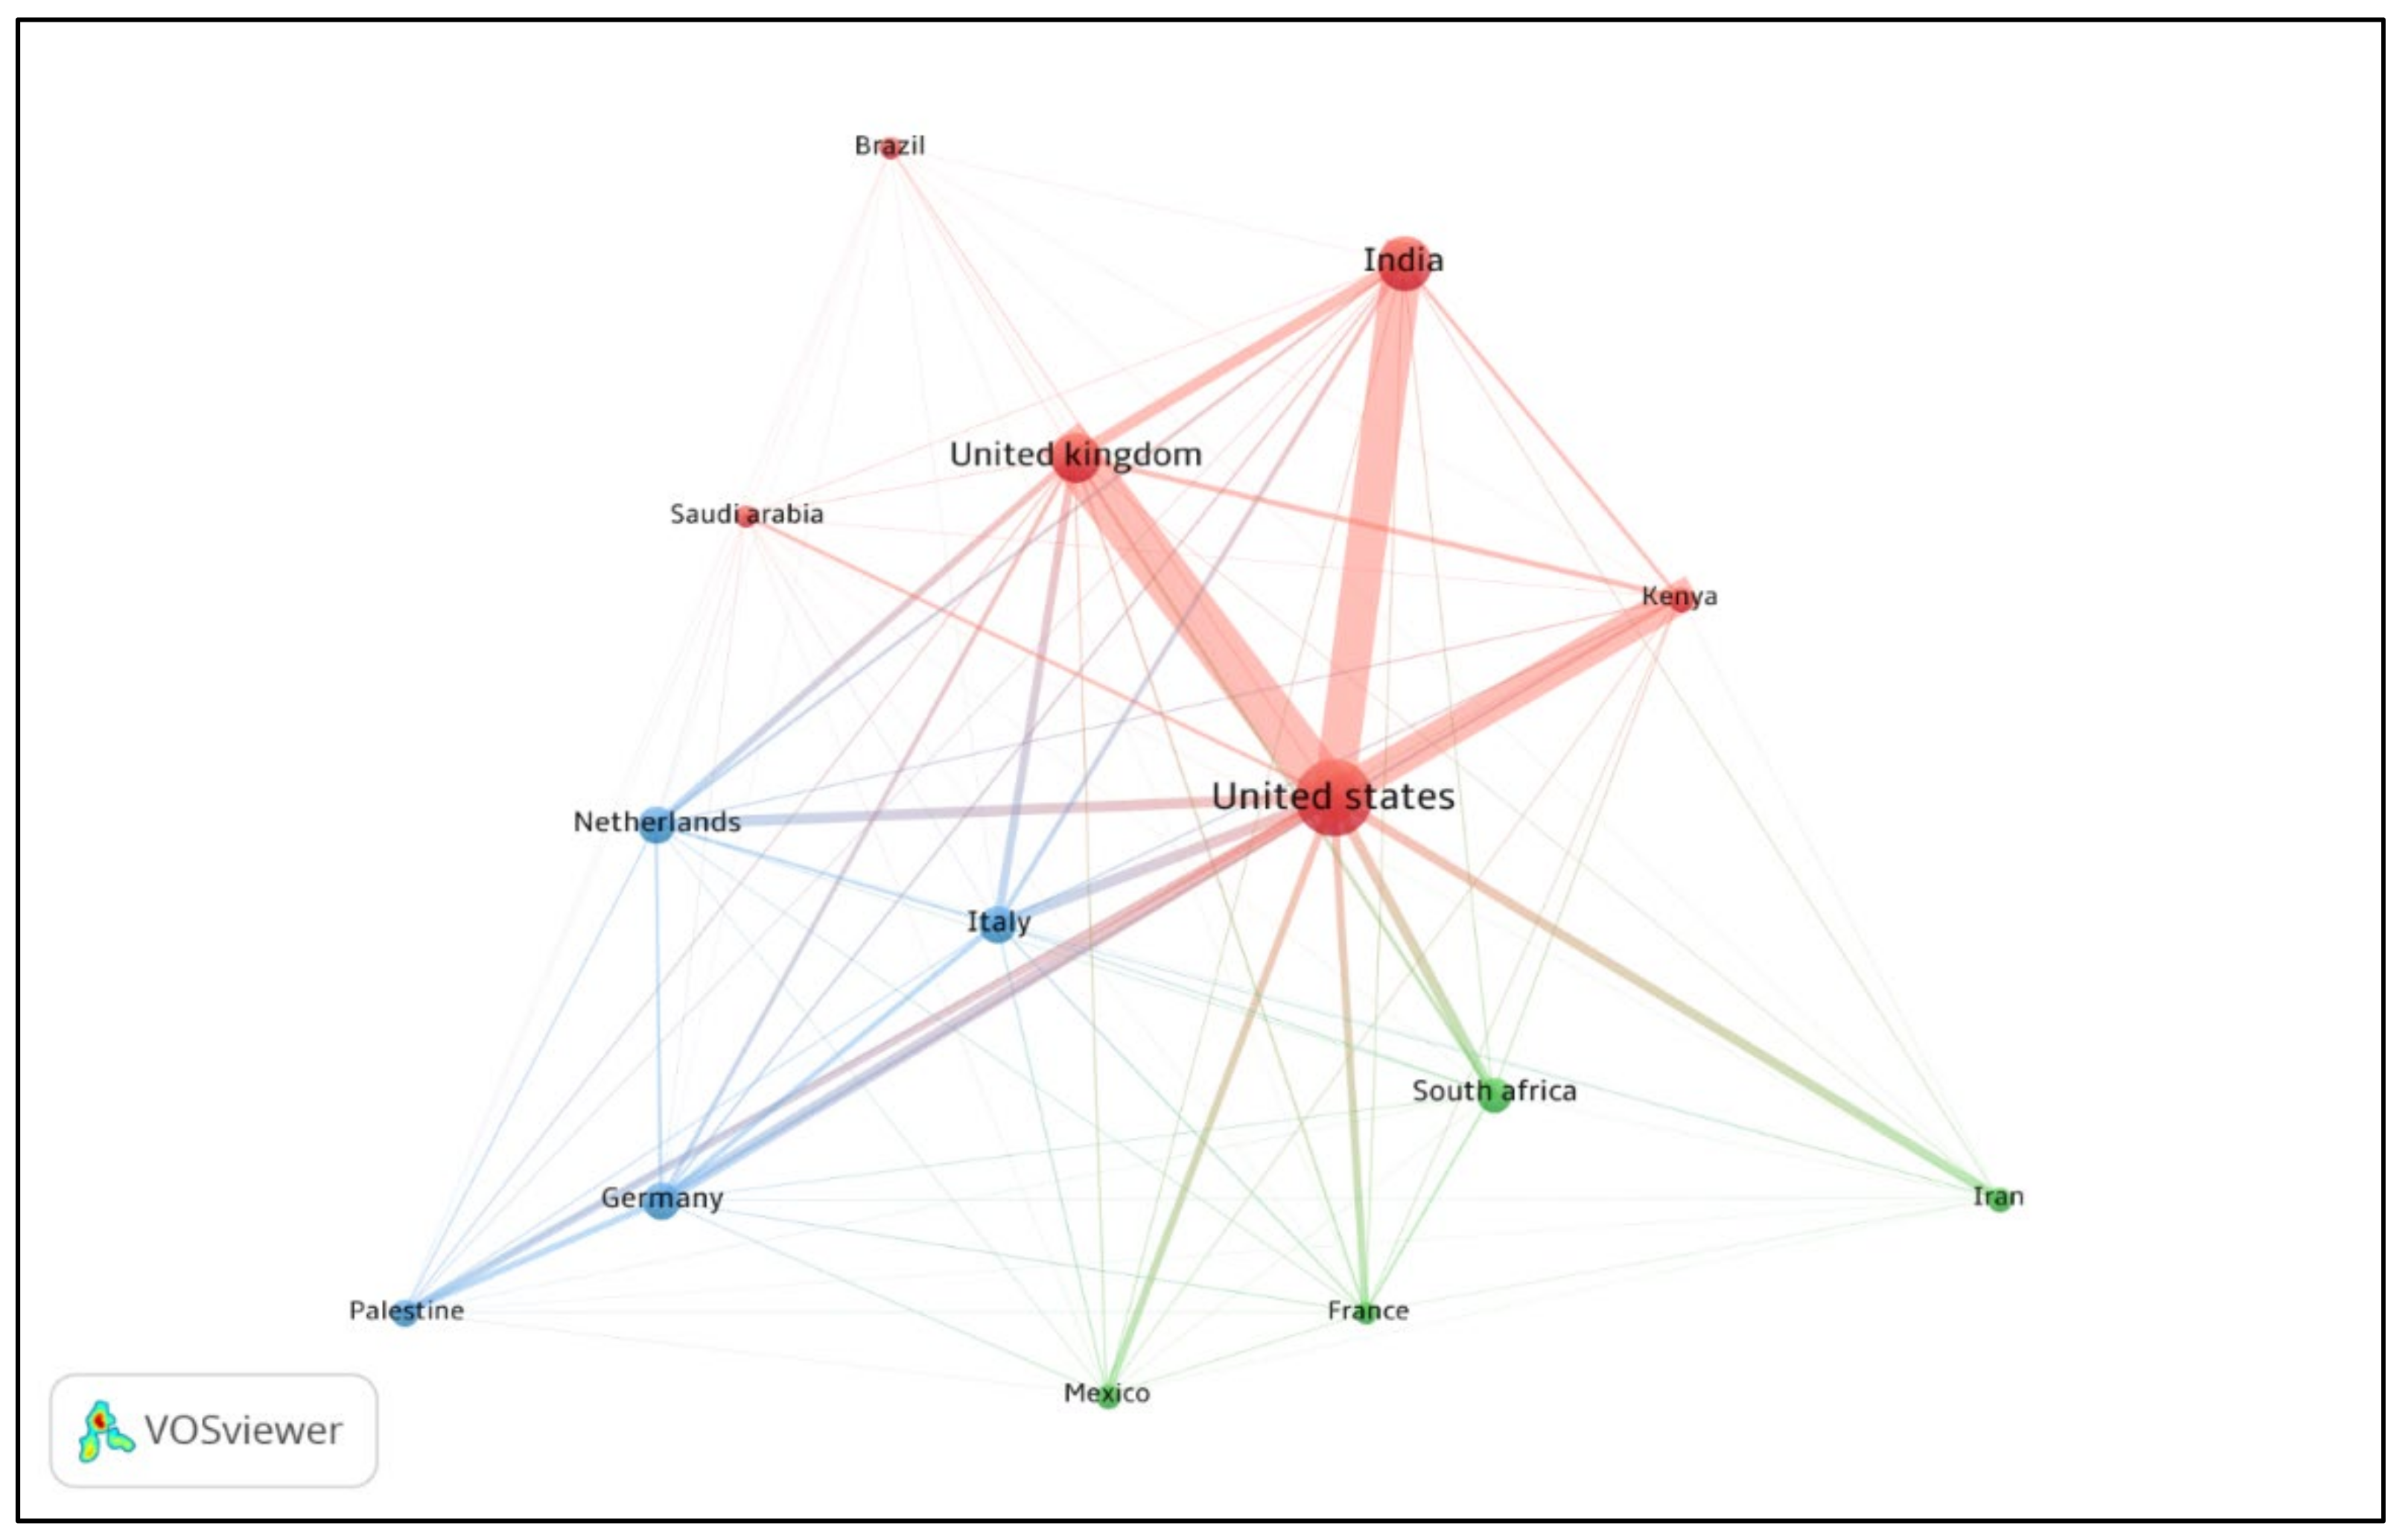
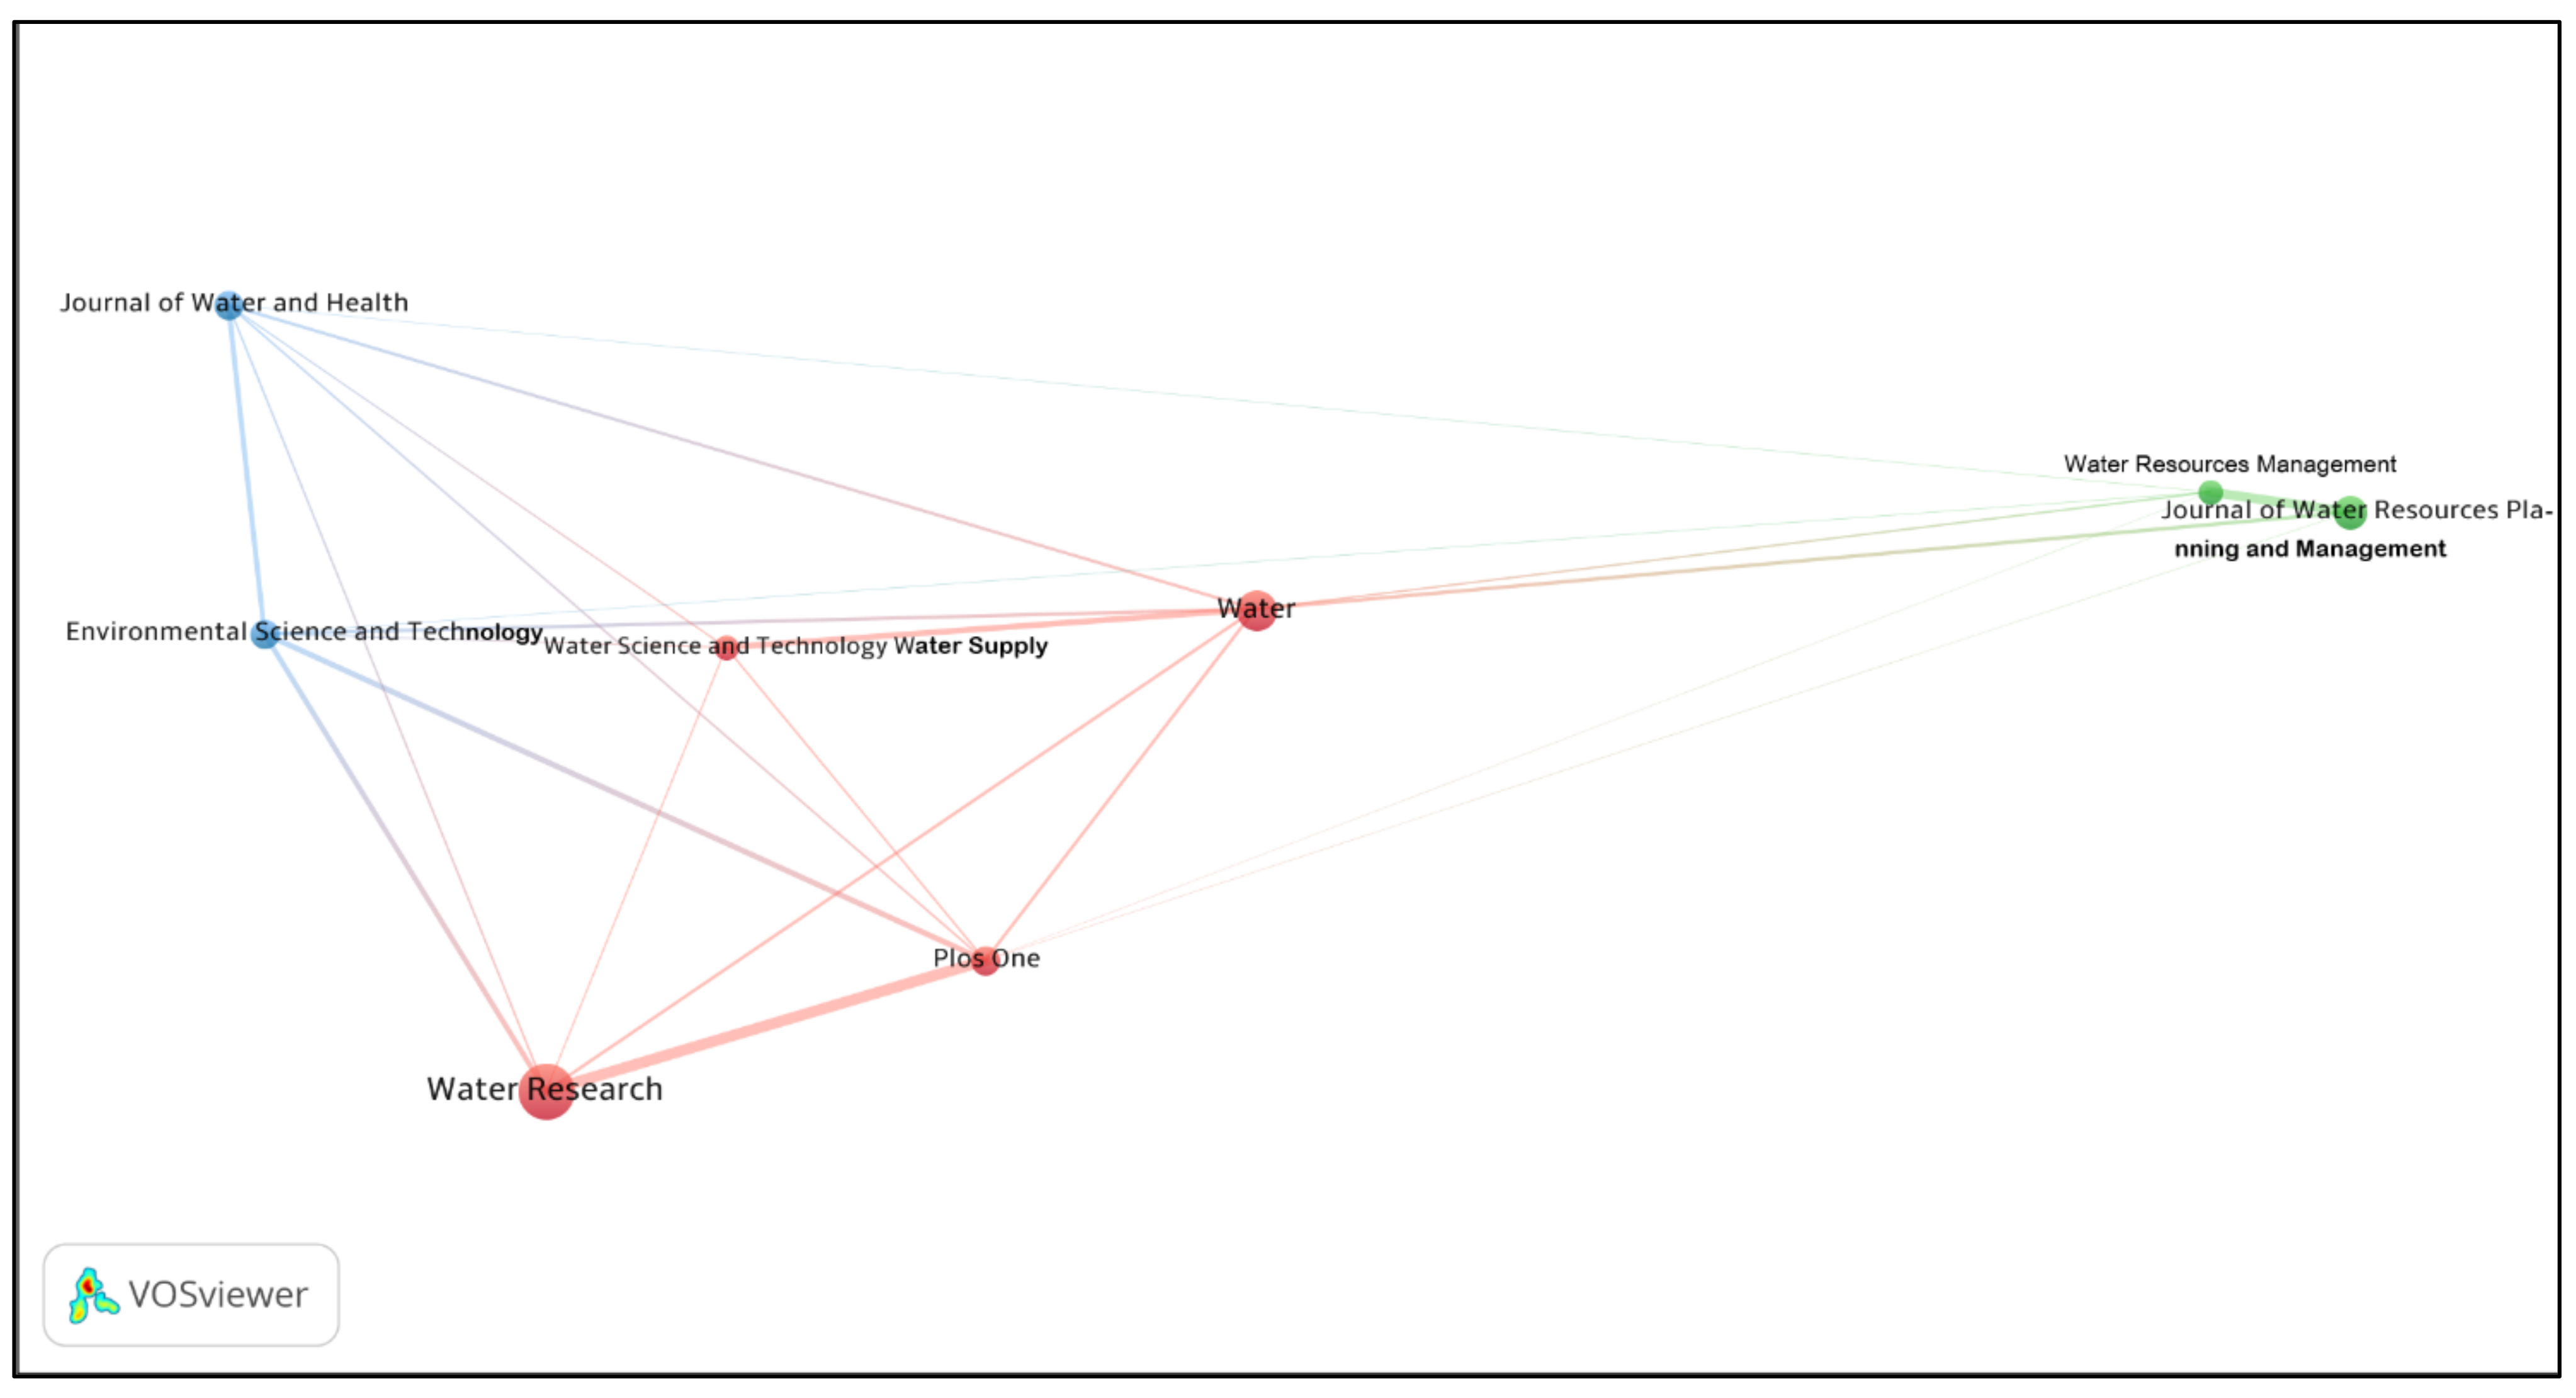
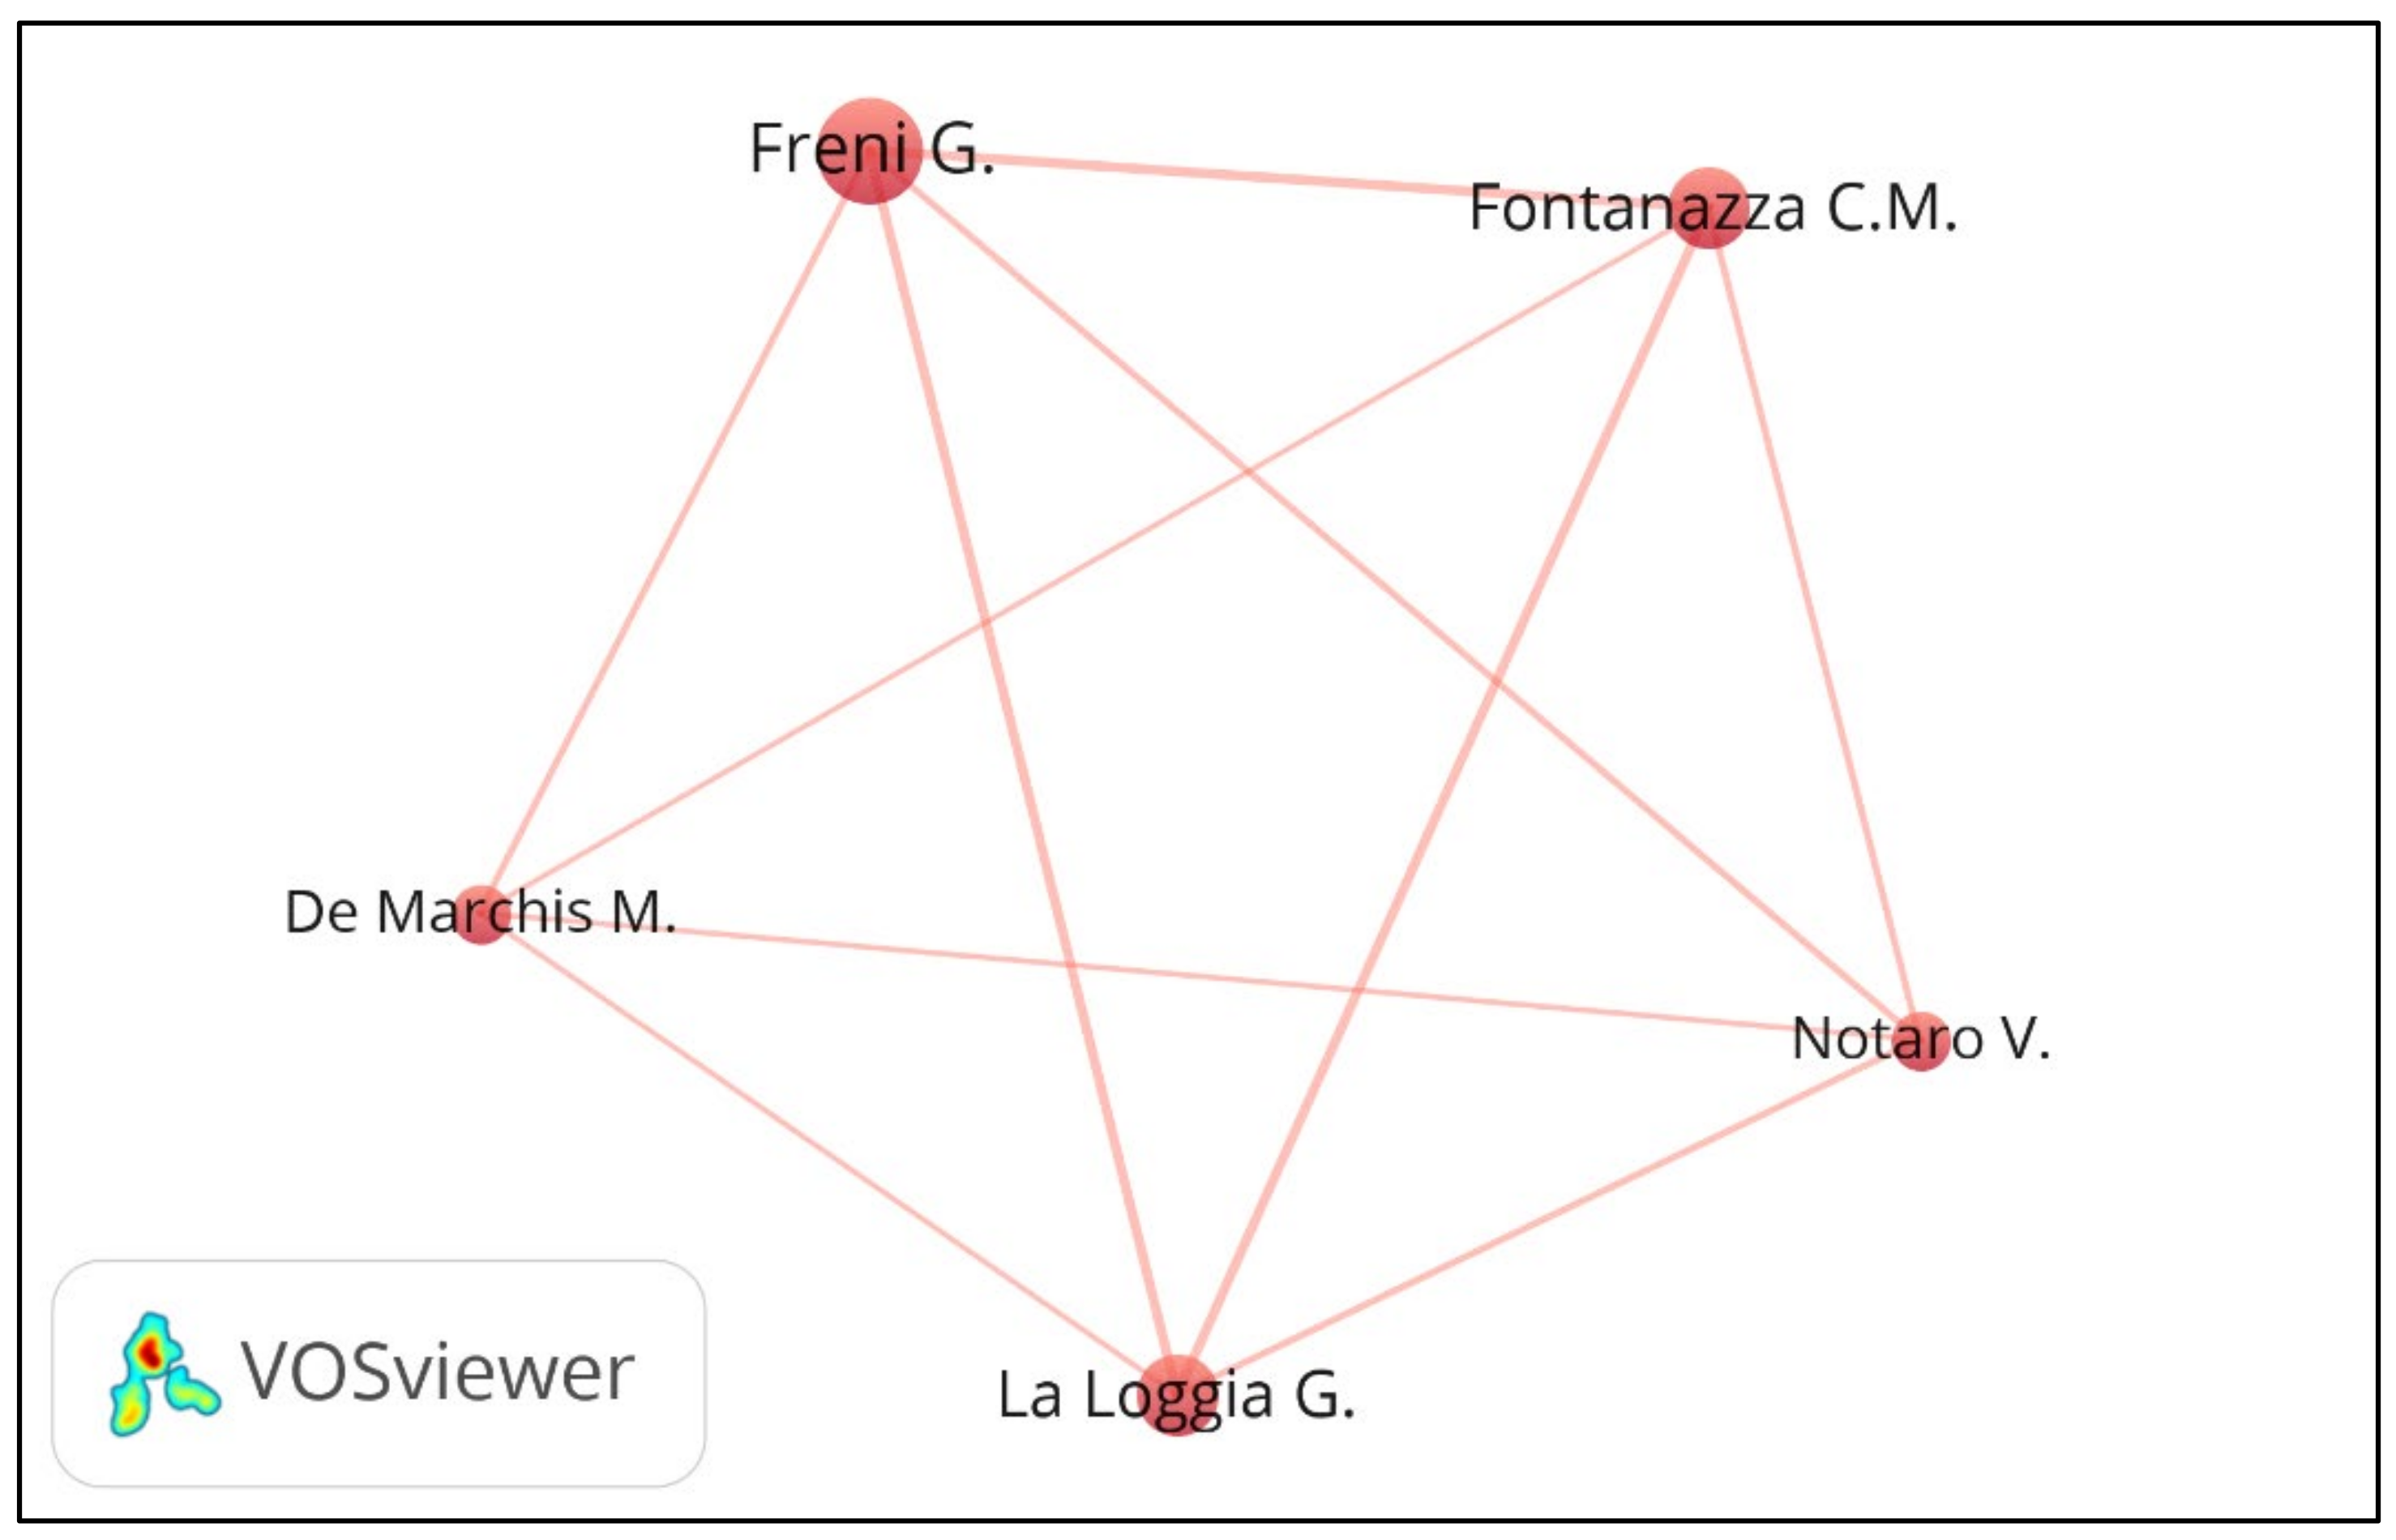
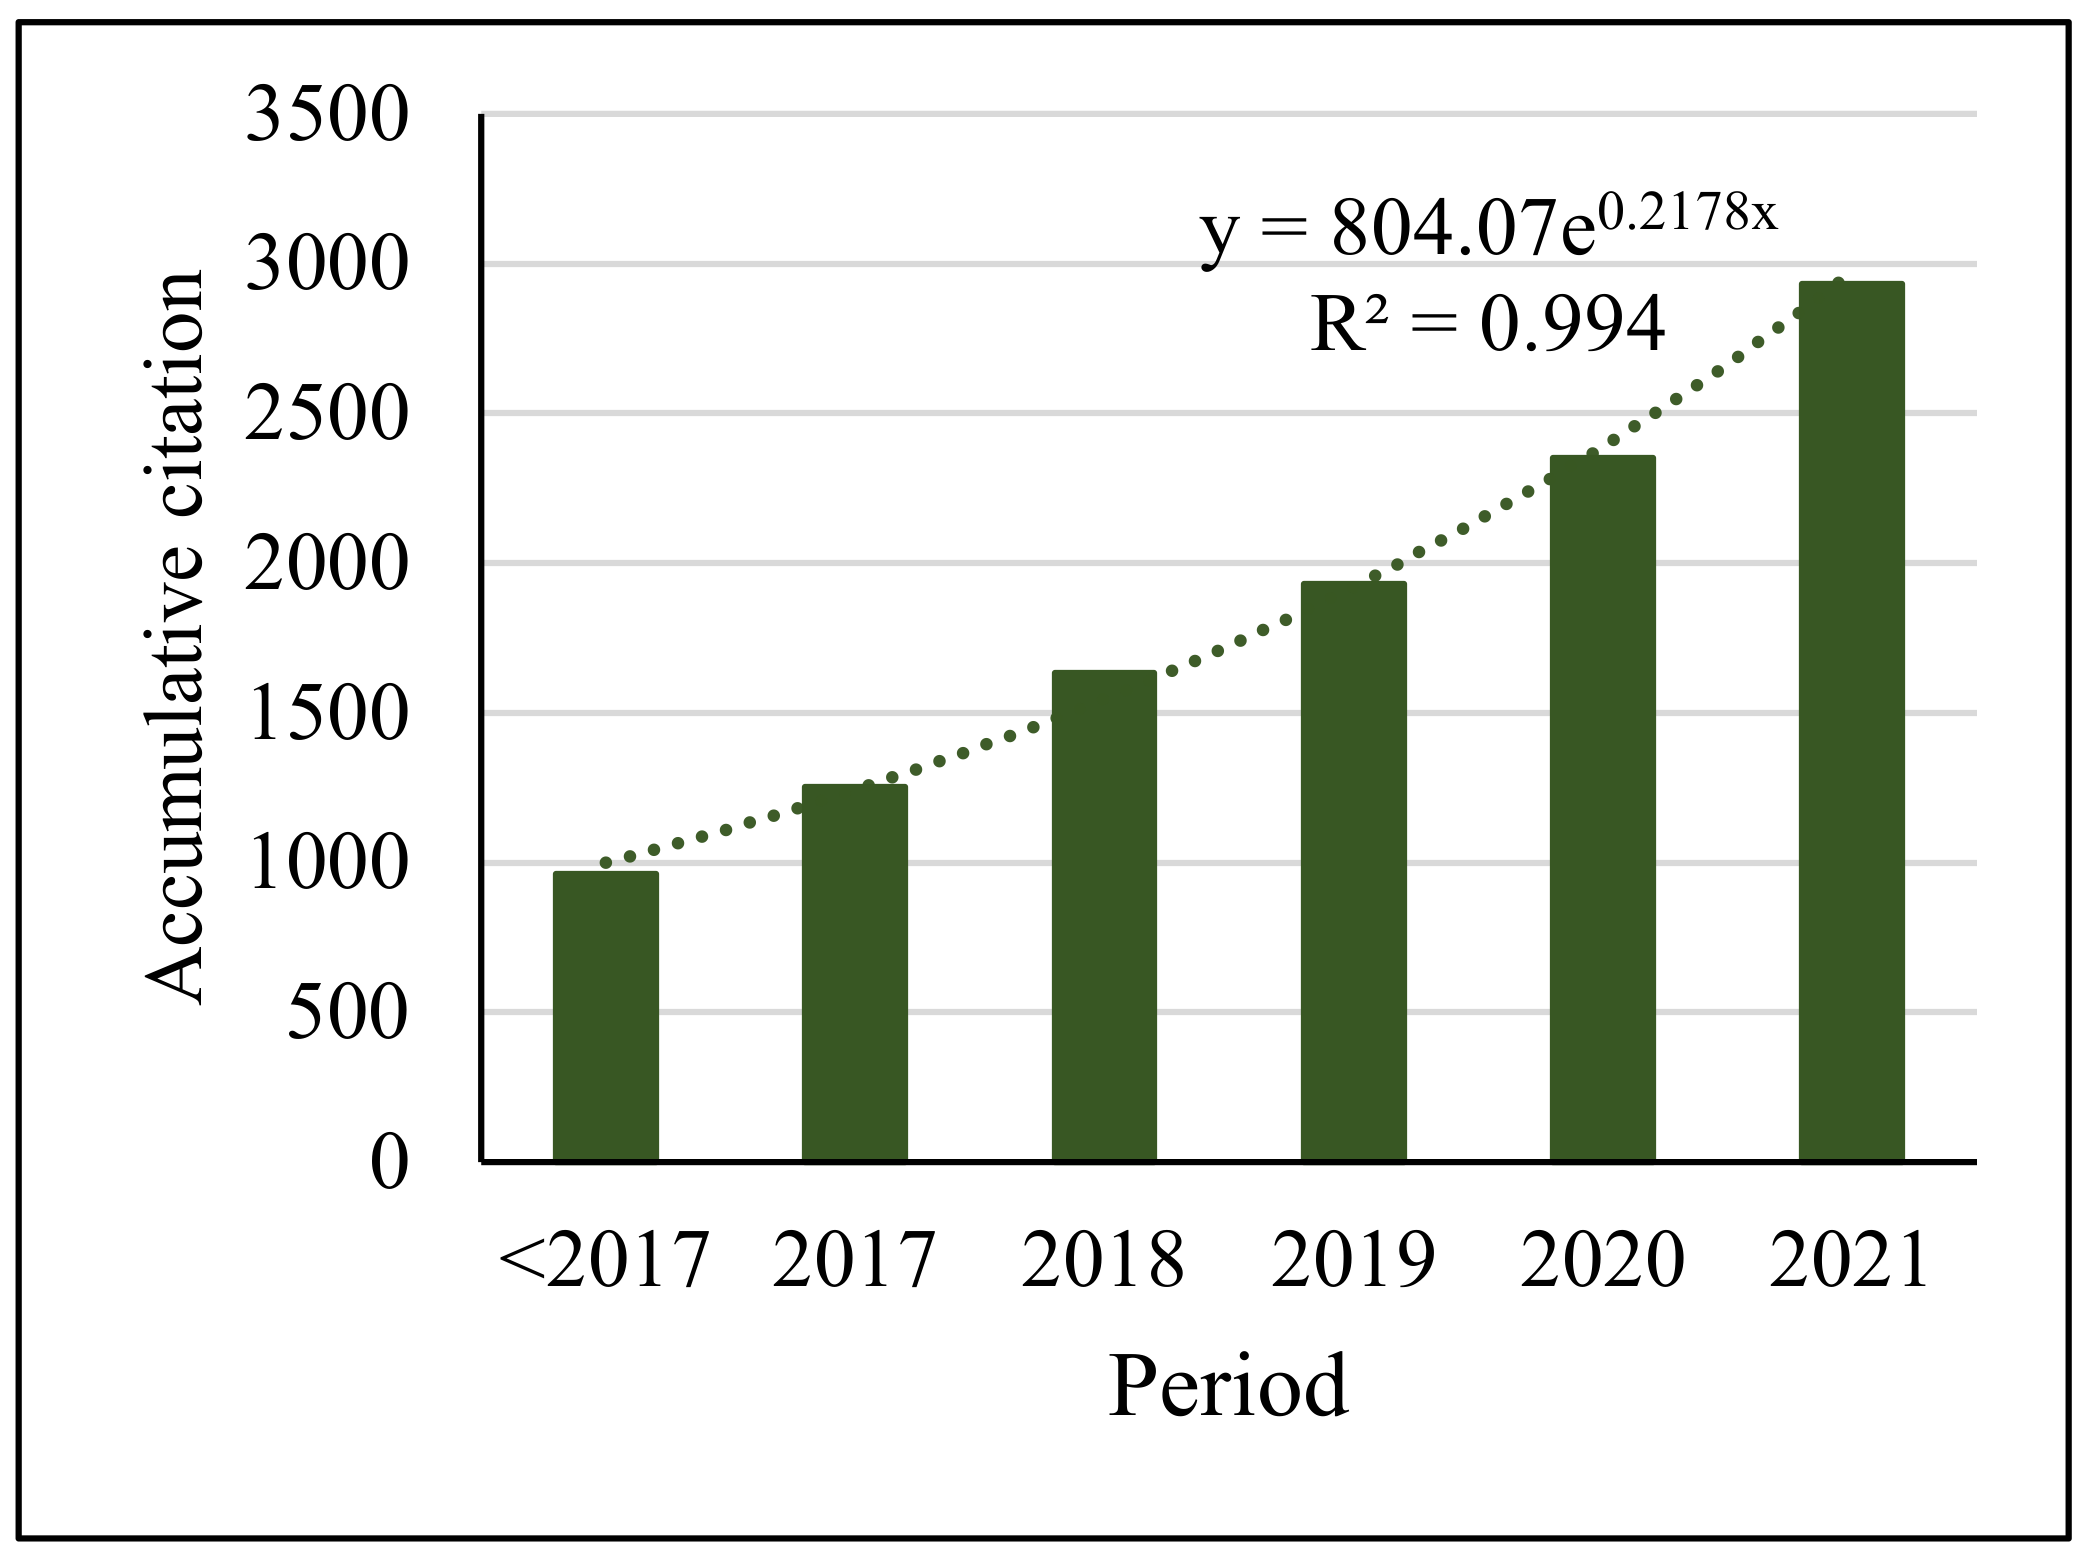
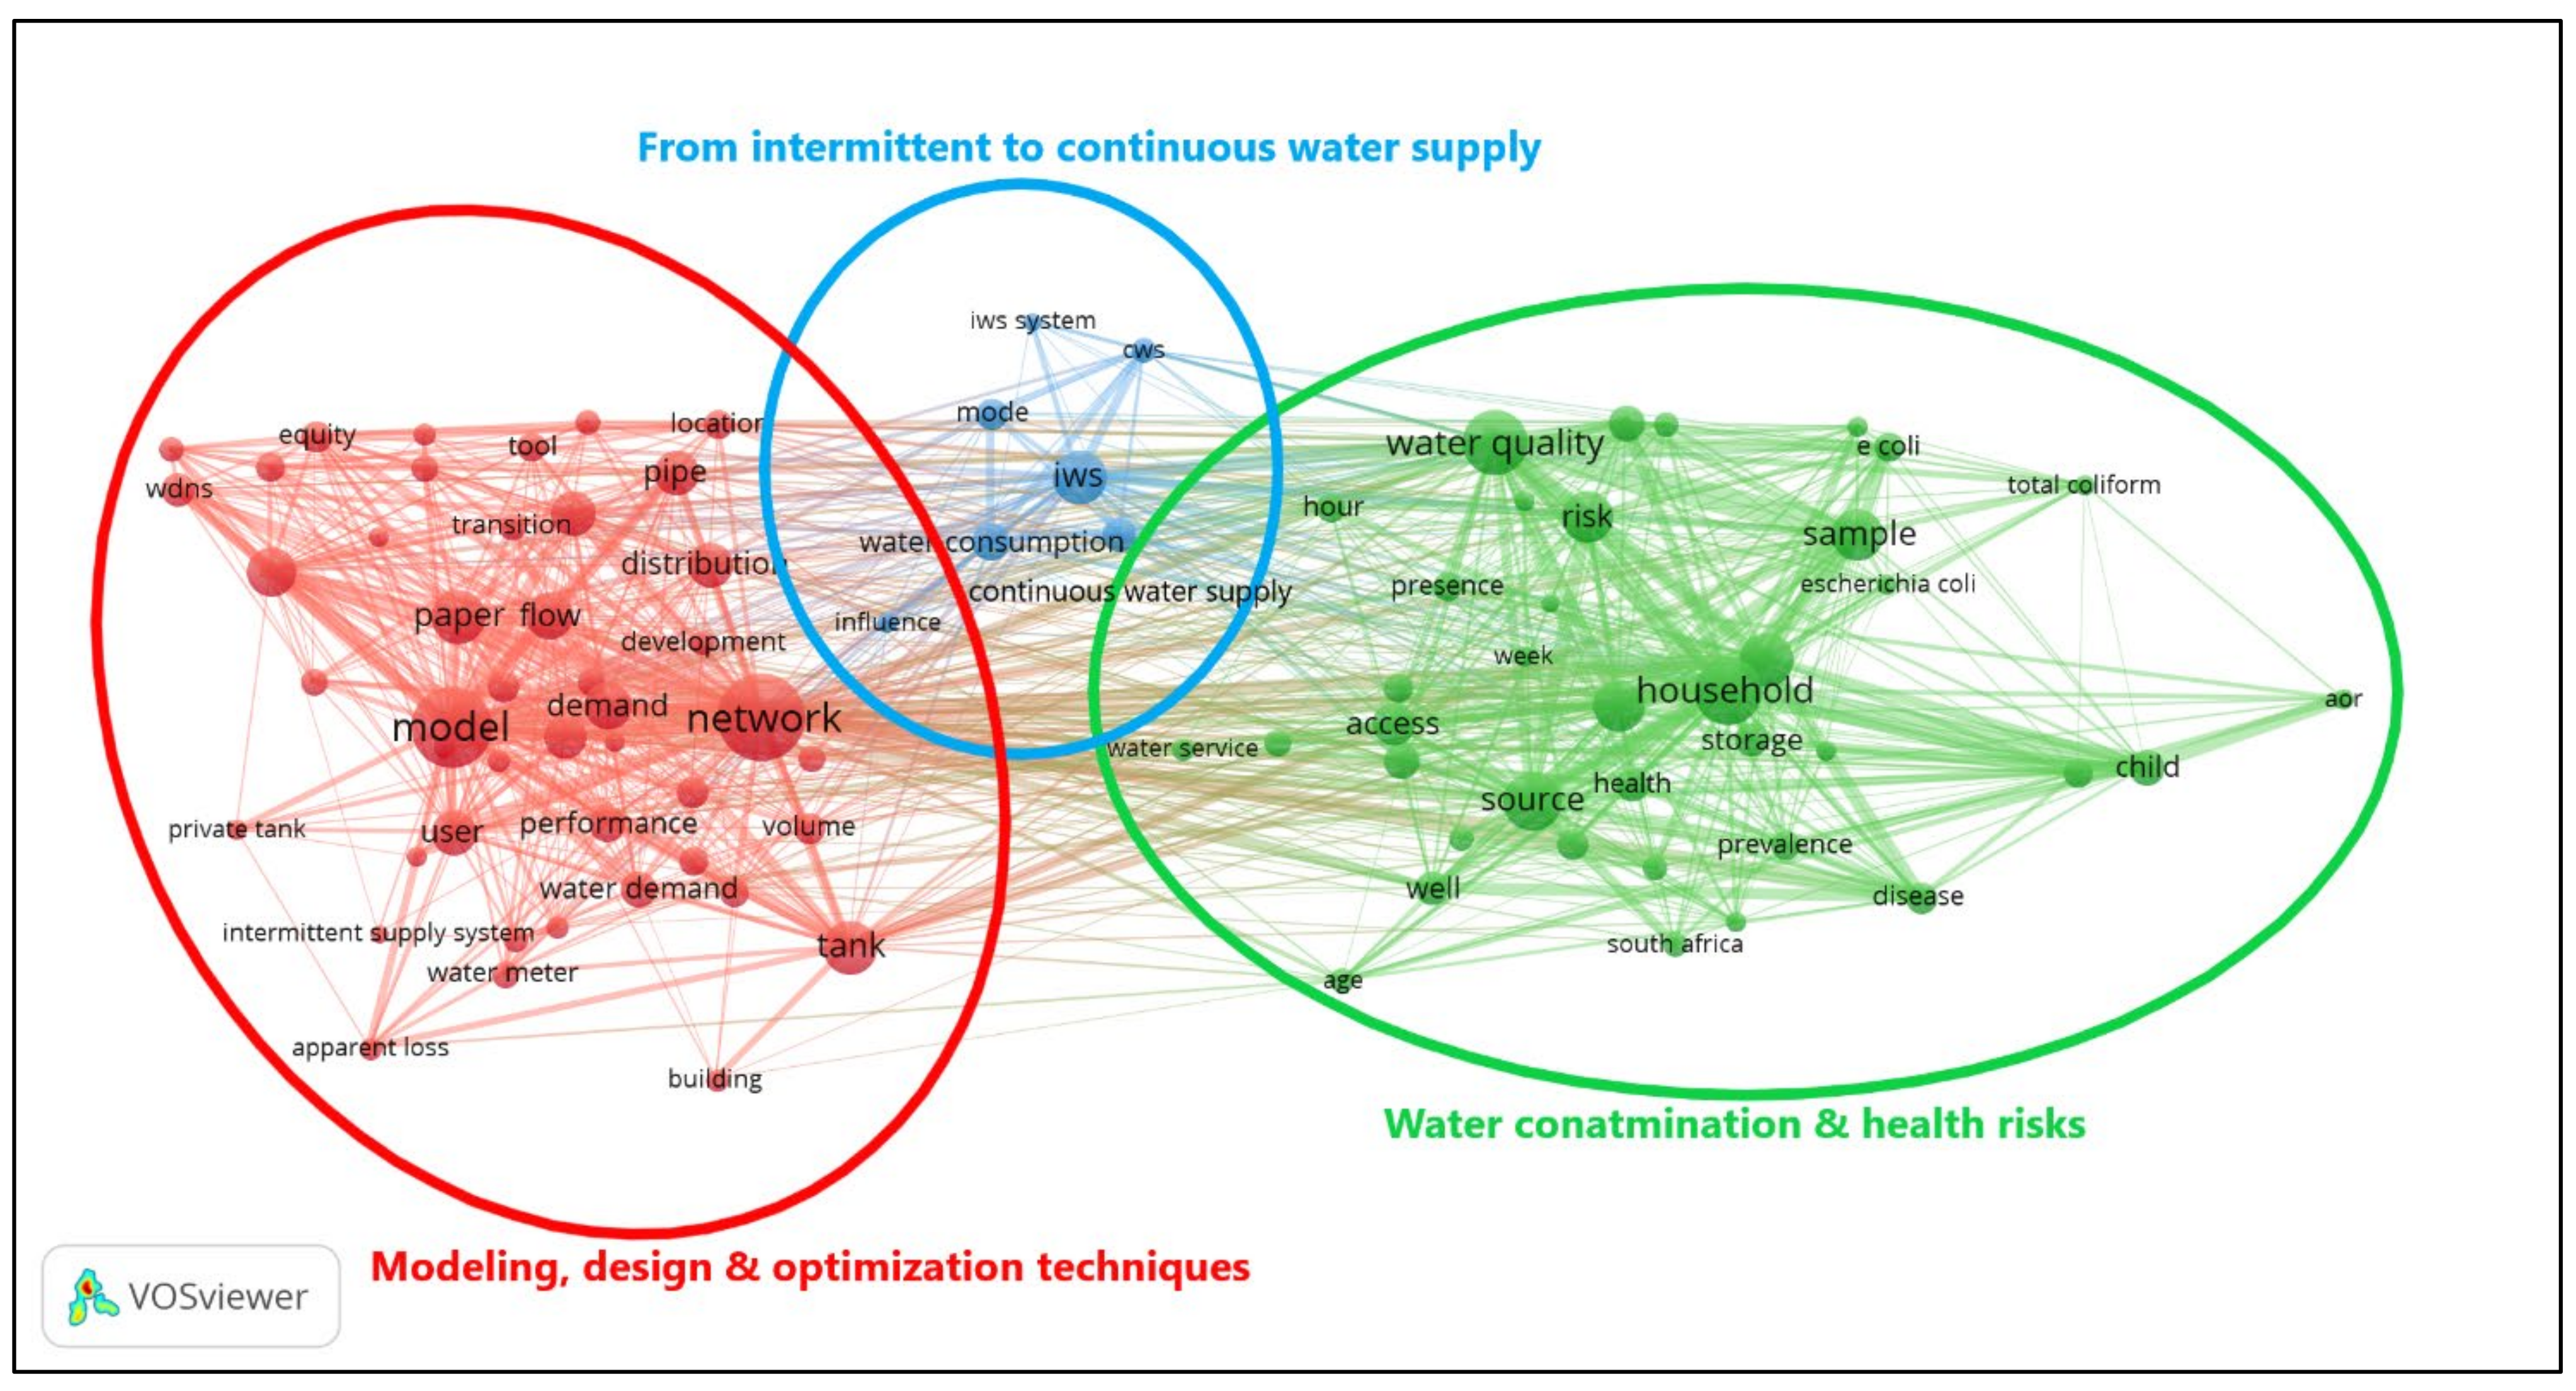
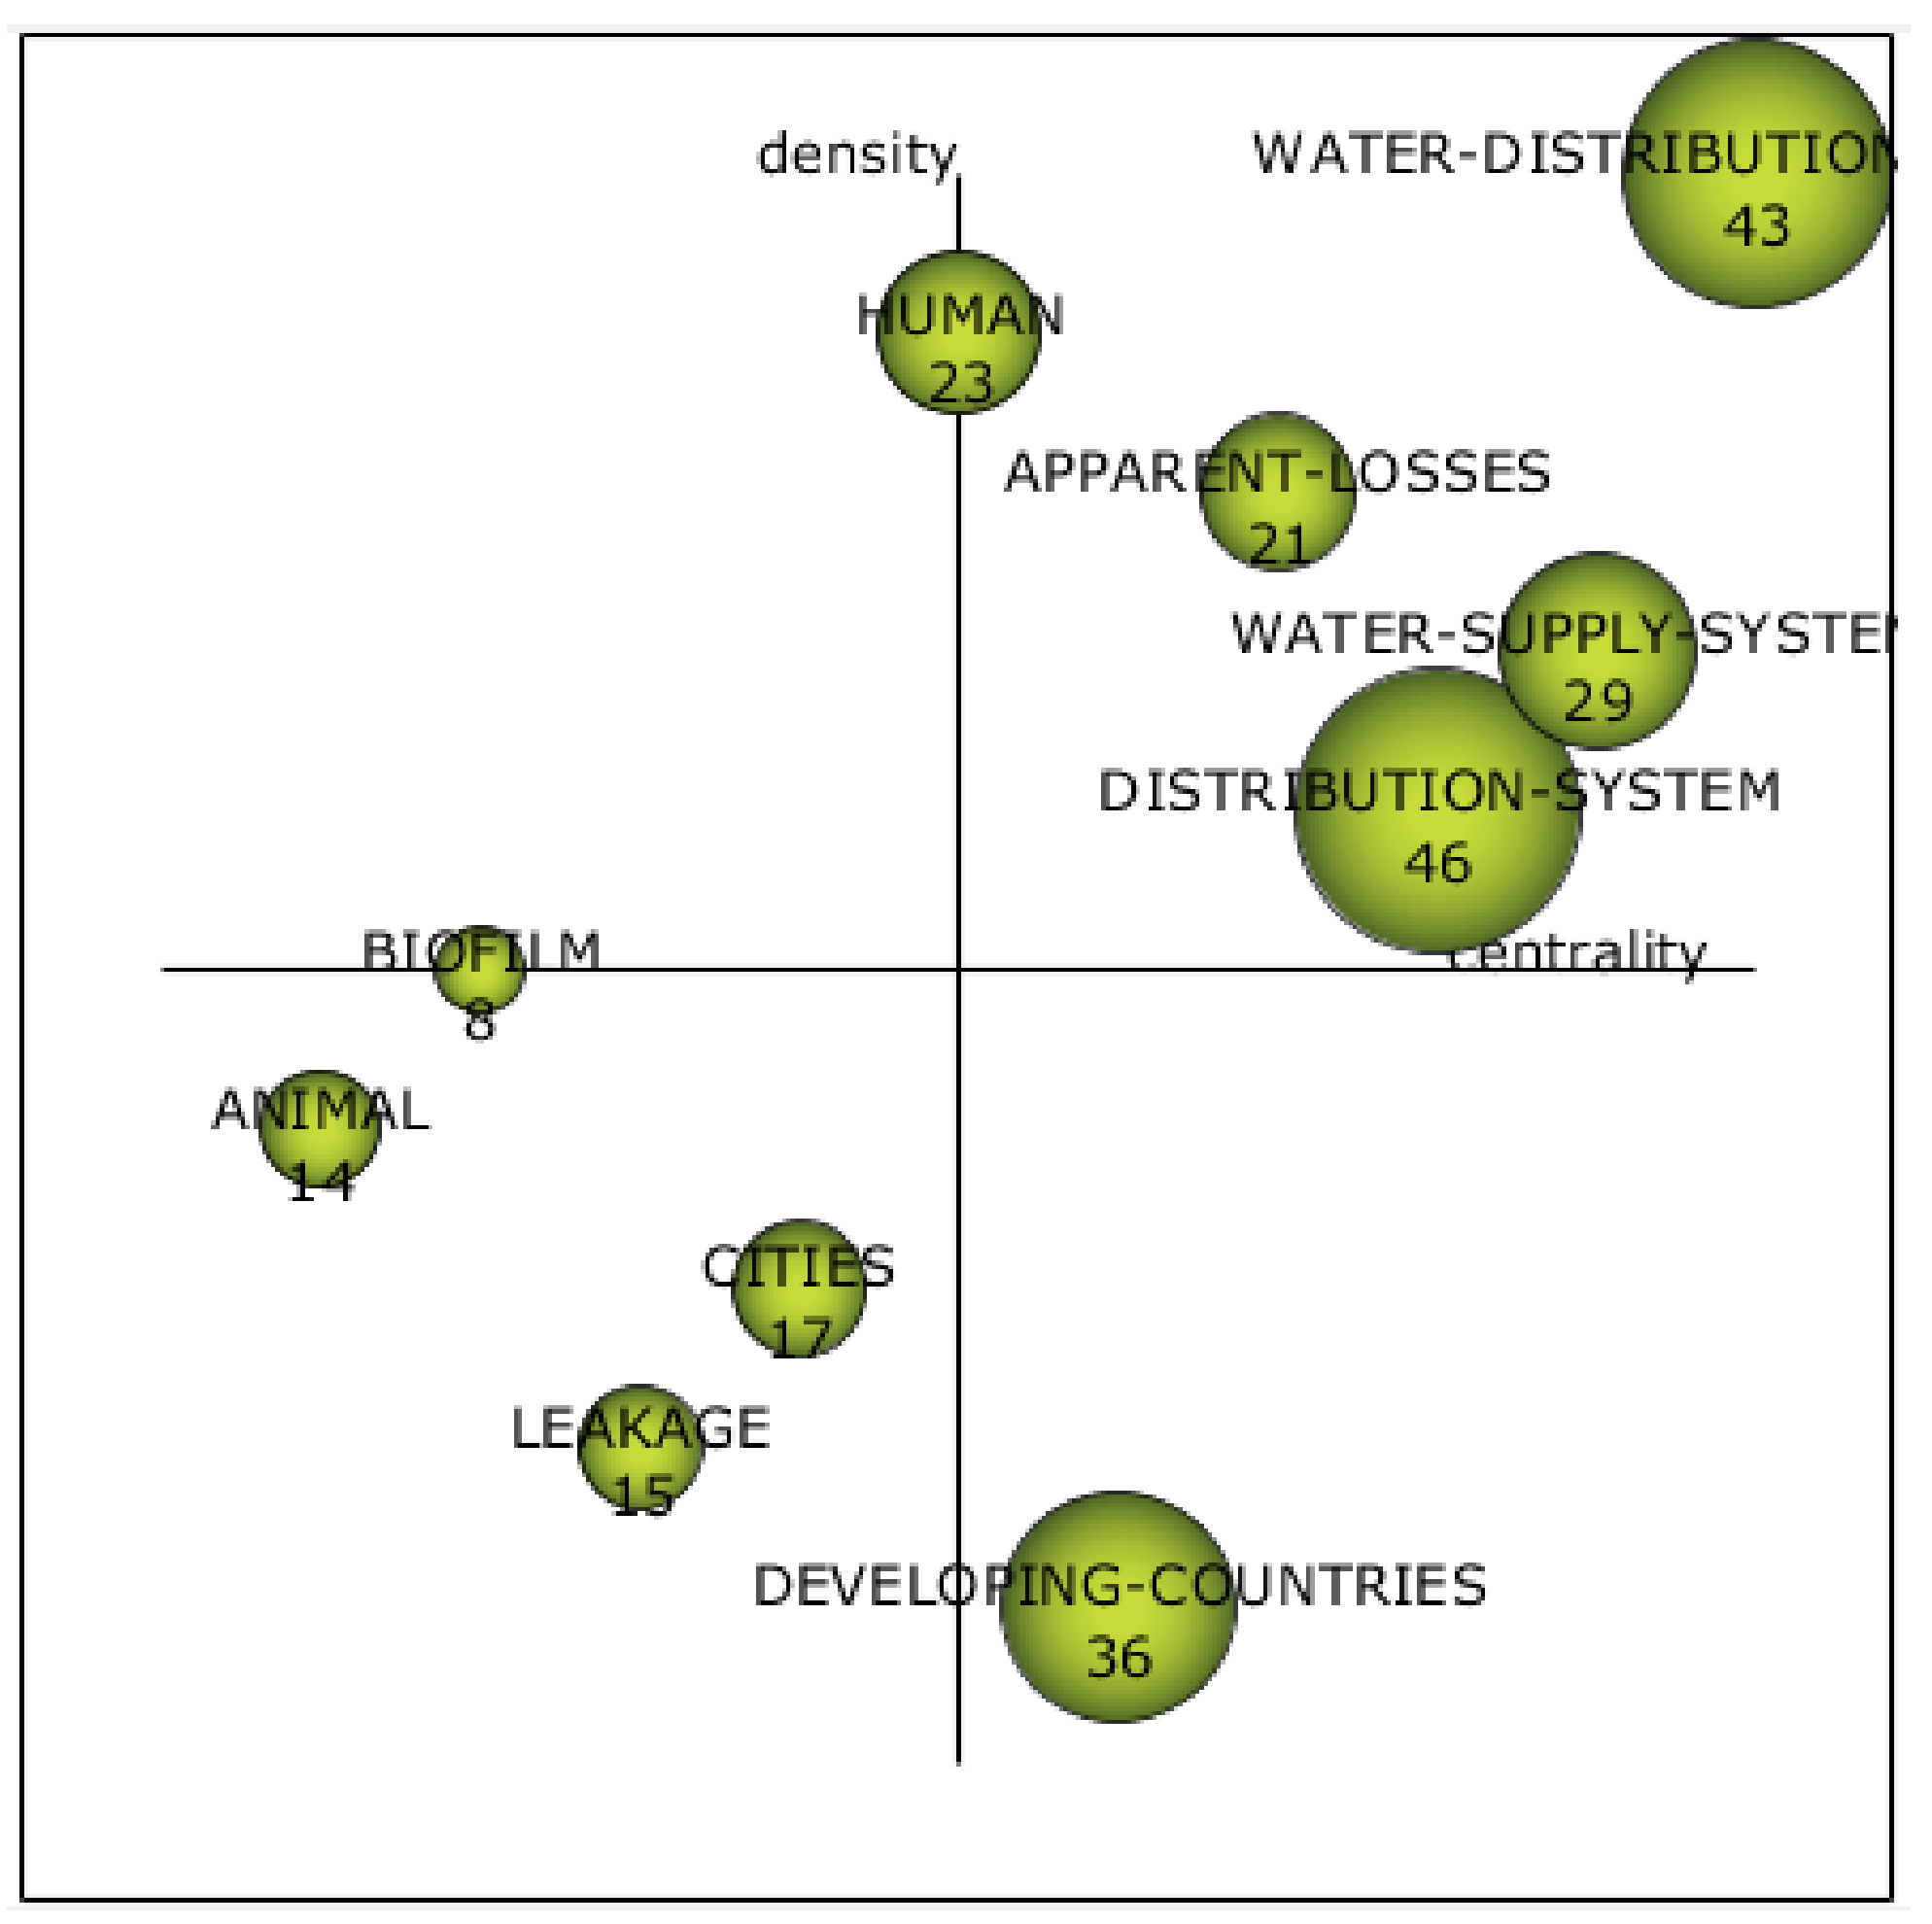
Table 1.
Countries’ key bibliometric performance indices associated with research on intermittent water supply systems (IWSSs); top 10 most-productive countries.
Table 1.
Countries’ key bibliometric performance indices associated with research on intermittent water supply systems (IWSSs); top 10 most-productive countries.
| SCR a | Country | No. of Documents (%) b | h-Index | No. of Citations | Average-Citations | Collaboration with Other Countries—No. of Collaborated Countries | No. of Documents Form Collaboration (%) c | Most Collaborated-With Country | No. of Documents with the Most Collaborated-With Country (%) d |
|---|---|---|---|---|---|---|---|---|---|
| 1st | United States | 58 (29.4%) | 18 | 1345 | 23.2 | 24 | 41 | India | 6 |
| United Kingdom | 6 | ||||||||
| 2nd | India | 30 (15.2%) | 10 | 417 | 13.9 | 5 | 10 | United States | 6 |
| 3rd | United Kingdom | 24 (12.2%) | 9 | 296 | 12.3 | 20 | 18 | United States | 6 |
| 4th | Germany | 14 (7.1%) | 5 | 128 | 9.1 | 7 | 5 | Palestine | 2 |
| 4th | The Netherlands | 14 (7.1%) | 8 | 315 | 22.5 | 15 | 13 | Yemen | 4 |
| 6th | Italy | 13 (6.6%) | 8 | 305 | 23.5 | 4 | 2 | Chile | 1 |
| Switzerland | 1 | ||||||||
| United Kingdom | 1 | ||||||||
| United States | 1 | ||||||||
| 7th | South Africa | 12 (6.1%) | 4 | 73 | 6.1 | 8 | 6 | United States | 2 |
| 8th | Palestine | 8 (4.1%) | 5 | 141 | 17.6 | 4 | 6 | Germany | 2 |
| United States | 2 | ||||||||
| 9th | Iran | 6 (3.0%) | 3 | 89 | 14.8 | 1 | 4 | United States | 4 |
| 9th | Kenya | 6 (3.0%) | 5 | 219 | 36.5 | 5 | 6 | United States | 5 |
| 9th | Mexico | 6 (3.0%) | 4 | 29 | 4.8 | 2 | 2 | France | 1 |
| United States | 1 |
Abbreviations: SCR = Standard Competition Ranking. a Countries with the same output have the same ranking number, and then a gap is left in the ranking numbers. b Percentage of publications/country out of the total published research. c Percentage of publications with international authors out of the total number of documents for each country. d Percentage of publications with the most collaborated-with country out of the total number of documents for each country.
Table 2.
List of top 10 most-prolific journals on intermittent water supply systems (IWSSs).
| SRC a | Name of the Journal | No. of Documents (%) b | h-Index c | No. of Citations | Impact Factor (IF) d |
|---|---|---|---|---|---|
| 1st | Water Switzerland | 19 (9.6%) | 8 | 218 | 3.103 |
| 2nd | Water Science and Technology Water Supply | 12 (6.1%) | 5 | 144 | 1.275 |
| 3rd | Urban Water Journal | 8 (4.1%) | 5 | 112 | 2.081 |
| 4th | Journal of Water Sanitation and Hygiene for Development | 7 (3.6%) | 3 | 29 | 1.25 |
| 4th | Journal of Water Supply Research and Technology Aqua | 7 (3.6%) | 5 | 82 | 1.644 |
| 4th | Water Resources Management | 7 (3.6%) | 6 | 140 | 3.517 |
| 7th | Journal of Water Resources Planning and Management | 6 (3.0%) | 4 | 97 | 3.054 |
| 8th | Environmental Science and Technology | 5 (2.5%) | 5 | 238 | 9.028 |
| 8th | Water Research | 5 (2.5%) | 3 | 167 | 11.236 |
| 10th | International Journal of Hygiene and Environmental Health | 4 (2.0%) | 2 | 11 | 5.840 |
| 10th | Journal of Hydroinformatics | 4 (2.0%) | 4 | 115 | 2.376 |
| 10th | PLOS One | 4 (2.0%) | 3 | 66 | 3.24 |
| 10th | Water Policy | 4 (2.0%) | 2 | 6 | 1.434 |
| 10th | Water Resources Research | 4 (2.0%) | 4 | 108 | 5.24 |
Abbreviations: SCR = Standard Competition Ranking; IF = impact factor. a Journals with the same productivity have the same order, a gap is fixed then with respect to ranking. b Proportion of the number of documents/journals with respect to the total number of publications on IWSSs. c This index represents h-index of research works on IWSSs in each journal. d Impact factors were extracted from Journal Citation Reports (JCR): released in 2021 by Web of Science for 2020 citations data.
Table 3.
Top 10 most-productive institutions regarding intermittent water supply systems (IWSS) research works.
Table 3.
Top 10 most-productive institutions regarding intermittent water supply systems (IWSS) research works.
| SRC a | Name of the Institution | No. of Documents (%) b |
|---|---|---|
| 1st | University of California, Berkeley, United States | 16 (8.1%) |
| 2nd | IHE Delft Institute for Water Education, Netherlands | 11 (5.6%) |
| 3rd | National Environmental Engineering Research Institute India, India | 9 (4.6%) |
| 4th | Università degli Studi di Palermo, Italy | 8 (4.1%) |
| 5th | University of Exeter, United Kingdom | 7 (3.6%) |
| 5th | Karlsruher Institut für Technologie, Germany | 7 (3.6%) |
| 5th | Università degli Studi di Enna Kore, Italy | 7 (3.6%) |
| 8th | Delft University of Technology, Netherlands | 6 (3.0%) |
| 9th | Stellenbosch University, South Africa | 5 (2.5%) |
| 9th | University of Massachusetts Amherst, United States | 5 (2.5%) |
| 9th | Georgia Institute of Technology, United States | 5 (2.5%) |
| 9th | University of Tehran, Iran | 5 (2.5%) |
Abbreviations: SCR = Standard Competition Ranking. a Institutions with the same productivity have the same order, a gap is fixed with respect to ranking. b Proportion of documents/institution with respect to the total number of publications on IWSSs.
Table 4.
Top 10 most prolific-authors on intermittent water supply systems (IWSSs).
| SRC a | Name of the Author | Institution | No. of Documents (%) b |
|---|---|---|---|
| 1st | Nelson, K.L. | University of California, Berkeley, Berkeley, United States | 11 (5.6%) |
| 2nd | Kumpel, E. | University of Massachusetts Amherst, Amherst MA, United States | 10 (5.1%) |
| 3rd | Freni, G. | Università degli Studi di Enna “Kore”, Enna, Italy | 9 (4.6%) |
| 4th | Fontanazza, C.M. | Università degli Studi di Enna “Kore”, Enna, Italy | 7 (3.6%) |
| 4th | Klingel, P. | Stadtwerke Karlsruhe GmbH, Karlsruhe, Germany | 7 (3.6%) |
| 4th | La Loggia, G. | Università degli Studi di Palermo, Palermo, Italy | 7 (3.6%) |
| 7th | Notaro, V. | Università degli Studi di Enna “Kore”, Enna, Italy | 5 (2.5%) |
| 7th | Sharma, S. | IHE Delft Institute for Water Education, Delft, Netherlands | 5 (2.5%) |
| 9th | Andey, S.P. | National Environmental Engineering Research Institute India, Nagpur, India | 4 (2.0%) |
| 9th | Brown, J. | Georgia Institute of Technology, Atlanta, United States | 4 (2.0%) |
| 9th | De Marchis, M. | Università degli Studi di Enna “Kore”, Enna, Italy | 4 (2.0%) |
| 9th | Farmani, R. | University of Exeter, Exeter, United Kingdom | 4 (2.0%) |
| 9th | Jacobs, H.E. | Stellenbosch University, Stellenbosch, South Africa | 4 (2.0%) |
| 9th | Kelkar, P.S. | Rajiv Gandhi Science and Technology Commission, Nagpur, India | 4 (2.0%) |
| 9th | Kennedy, M. | IHE Delft Institute for Water Education, Delft, The Netherlands | 4 (2.0%) |
| 9th | Mastaller, M. | Karlsruher Institut für Technologie, Karlsruhe, Germany | 4 (2.0%) |
| 9th | Ray, I. | Energy & Resources Group, Berkeley, United States | 4 (2.0%) |
| 9th | AL-Washali, T. | Sana’a University, Sana’a, Yemen | 4 (2.0%) |
Abbreviations: SCR = Standard Competition Ranking. a Authors with the same productivity have the same order, a gap is fixed then with respect to ranking. b Proportion of the number of documents/authors with respect to the total number of publications on IWSSs.
Table 5.
Top 10 most-cited publications on intermittent water supply systems (IWSSs).
| SRC a | Authors | Title | Journal Name | Times Cited b | Document Type |
|---|---|---|---|---|---|
| 1st | Lee E.J. and Schwab K.J., 2005 | Deficiencies in drinking water distribution systems in developing countries | Journal of Water and Health | 179 | Review |
| 2nd | Semenza J.C. et al., 1998 | Water distribution system and diarrheal disease transmission: A case study in Uzbekistan | American Journal of Tropical Medicine and Hygiene | 146 | Article |
| 3rd | Vairavamoorthy K. et al., 2008 | Managing urban water supplies in developing countries—Climate change and water scarcity scenarios | Physics and Chemistry of the Earth | 128 | Article |
| 4th | Kumpel E. and Nelson K.L., 2013 | Comparing microbial water quality in an intermittent and continuous piped water supply | Water Research | 115 | Article |
| 5th | Kumpel E. and Nelson K.L., 2016 | Intermittent Water Supply: Prevalence, Practice, and Microbial Water Quality | Environmental Science and Technology | 111 | Review |
| 6th | Criminisi A. et al., 2009 | Evaluation of the apparent losses caused by water meter under-registration in intermittent water supply | Water Science and Technology | 86 | Article |
| 7th | Machdar E. et al., 2013 | Application of Quantitative Microbial Risk Assessment to analyze the public health risk from poor drinking water quality in a low income area in Accra, Ghana | Science of the Total Environment | 78 | Article |
| 8th | Galaitsi S.E. et al., 2016 | Intermittent domestic water supply: A critical review and analysis of causal-consequential pathways | Water (Switzerland) | 72 | Review |
| 9th | De Marchis M. et al., 2010 | A model of the filling process of an intermittent distribution network | Urban Water Journal | 59 | Article |
| 10th | Soltanjalili M.-J. et al., 2013 | Operating water distribution networks during water shortage conditions using hedging and intermittent water supply concepts | Journal of Water Resources Planning and Management | 57 | Article |
Abbreviations: SCR = Standard Competition Ranking. a Documents with the same number of citations have the same order; a gap is then fixed regarding ranking. b Total citations were extracted from Scopus database. These figures could differ when using other research databases.
Publisher’s Note: MDPI stays neutral with regard to jurisdictional claims in published maps and institutional affiliations. |
© 2022 by the author. Licensee MDPI, Basel, Switzerland. This article is an open access article distributed under the terms and conditions of the Creative Commons Attribution (CC BY) license (https://creativecommons.org/licenses/by/4.0/).
Share and Cite
MDPI and ACS Style
Zyoud, S. Mapping and Visualizing Global Knowledge on Intermittent Water Supply Systems. Water 2022, 14, 738. https://doi.org/10.3390/w14050738
AMA Style
Zyoud S. Mapping and Visualizing Global Knowledge on Intermittent Water Supply Systems. Water. 2022; 14(5):738. https://doi.org/10.3390/w14050738
Chicago/Turabian StyleZyoud, Shaher. 2022. "Mapping and Visualizing Global Knowledge on Intermittent Water Supply Systems" Water 14, no. 5: 738. https://doi.org/10.3390/w14050738
Note that from the first issue of 2016, this journal uses article numbers instead of page numbers. See further details here.