Article

Quantifying the Impacts of Land Use and Cover Change (LUCC) and Climate Change on Discharge and Sediment Load in the Hunhe River Basin, Liaoning Province, Northeast China

1
State Key Laboratory of Simulation and Regulation of Water Cycle in River Basin, China Institute of Water Resources and Hydropower Research (IWHR), Beijing 100038, China
2
Hydrology Bureau of Yellow River Conservancy Commission, Zhengzhou 450004, China
*
Author to whom correspondence should be addressed.
Water 2022, 14(5), 737; https://doi.org/10.3390/w14050737
Submission received: 15 January 2022 / Revised: 18 February 2022 / Accepted: 22 February 2022 / Published: 25 February 2022
(This article belongs to the Section Hydrology)

Abstract

:
Assessing the impacts of land use and cover (LUCC) change and climate change on discharge and sediment load is beneficial for the regional management of water resources and the water environment. The Mann-Kendall test and soil and water assessment tool (SWAT) model were applied to analyze the change trends of meteorological and hydrological variables and to quantitatively assess the response of discharge and sediment load to LUCC and climate change, respectively, in the Hunhe River Basin (HRB). The results showed that LUCC changed little during 1980–2009, mainly from forestland (−0.36%) to other land use types, such as urban land (+0.13%) and grassland (+0.13%). Temperature increased significantly (p < 0.01), and precipitation showed a non-significant decreasing trend. Discharge showed a non-significant decreasing trend, and sediment load significantly (p < 0.05) decreased. The Nash–Sutcliffe efficiency (NSE), coefficient of determination (R2), and percent bias (PBIAS) during the calibration and validation periods indicated that good performance was achieved for the discharge simulation (NSE: 0.77–0.79; R2: 0.79–0.84; PBIAS: −9.61–1.48%) and satisfactory performance for the sediment load simulation (NSE: 0.65–0.77; R2: 0.65–0.78; PBIAS: −2.56–8.31%). The calibrated SWAT model was successfully utilized to assess the impacts of LUCC and climate change on discharge and sediment load, finding that the combined impact of LUCC and climate change decreased the annual discharge and sediment load by 22.65% and 31.51%, respectively. Minor changes in annual discharge (+0.08%) and sediment load (−1.33%) were caused by LUCC, and climate change led to a pronounced decrease in annual discharge (−22.69%) and sediment load (−30.61%). These findings indicate that climate change rather than LUCC dominated the hydrological alterations in the HRB. This study provides important information for decision makers to identify the reasons for changes in hydrological alterations and to design adaptive measures.

1. Introduction

Water quantity and quality have become major concerns of countries worldwide following the change of climate and human activities [1,2,3]. Moreover, land use and cover change (LUCC) and climate change are considered two key factors influencing changes in discharge and sediment loads [4,5,6]. As an important aspect of environmental change, LUCC is primarily caused by human activities. In fact, LUCC changes the hydrological conditions of a watershed, such as flood frequency and severity, base flow, discharge, and soil erosion [7,8,9]. As another important aspect, climate change alters changes in precipitation and temperature, which in turn affects the hydrological cycle [10], and thus changes the flow routing time, peak flow, flow volume, and sediment yield [9,11,12]. Previous studies show that global land change exhibits deforestation and agricultural expansion in tropical region and reforestation/afforestation, cropland intensification and urbanization in temperate region [13], and the increasing global temperature and the change of precipitation patterns have greatly affected regional water resource sustainability [10,14,15]. Therefore, analyzing the change trends of LUCC and hydrometeorological variables and assessing the impacts of LUCC change and climate change on discharge and sediment load are crucial for the regional management of water resources and the water environment.
Many studies have examined the individual and combined effects of LUCC and climate change on hydrological processes and water resources in different watersheds at different spatial and temporal scales, indicating different effects of LUCC and climate change on water across various regions [16,17,18,19,20,21]. For example, Chawla and Mujumdar [19] found that climate had a more dominant impact on streamflow than LUCC in the upper Ganga basin in India. Napoli et al. [20] indicated that LUCC played a considerable role in the formation of peak flow and total runoff under the same climatic conditions in a rural hilly basin in Italy. Luo et al. [21] analyzed the contributions of climate change and LUCC to hydrological changes in the Heihe River Basin in China and indicated that the short-term response of hydrological changes to LUCC was more obvious than the response to climate change, but climate change dominated hydrological changes over the long term. Although numerous studies have discussed the response of hydrological processes to LUCC and climate change, a scientific consensus on the dominate driving factor leading to the trend and amplitude of hydrological change has not been achieved. Furthermore, sediment load, which is affected by many factors (e.g., the duration and intensity of rainfall, peak flow, land use types), has received relatively less attention.
The hydrological modeling method, which is more suitable than the paired catchment approach or statistical analysis methods for scenario studies [22], has been used in the past to assess the hydrological impacts of LUCC and climate change. In recent years, the distributed hydrological model, i.e., the soil and water assessment tool (SWAT) model, has been widely applied to assess hydrology and water quality in different catchments worldwide [23,24]. Thus, the SWAT model was selected for this study to assess the responses of discharge and sediment load to LUCC and climate change in the Hunhe River Basin (HRB) in Liaoning Province of northeast China.
The HRB is subject to serious water shortages and water quality issues. The flow regimes in northeast China have lower homogenization than that in central and southeast China [25], and the responses of discharge to climate change in river basins of northern China tend to decrease [26]. Moreover, two large cities (i.e., Fushun and Shenyang) located in this region have a large population, and human activities have changed the landscape pattern of the region in the process of urbanization. Sustainable water resources and environmental management in the region require improved knowledge of the hydrological response to LUCC and climate change. The objectives of this study were to: (1) investigate the change trends of land use, climate, and hydrological variables, (2) calibrate and validate the SWAT model for the Hunhe River Basin, and (3) identify and quantify the individual and combined impacts of land use and cover change and climate change on changes in discharge and sediment load in the Hunhe River Basin.

2. Materials and Methods
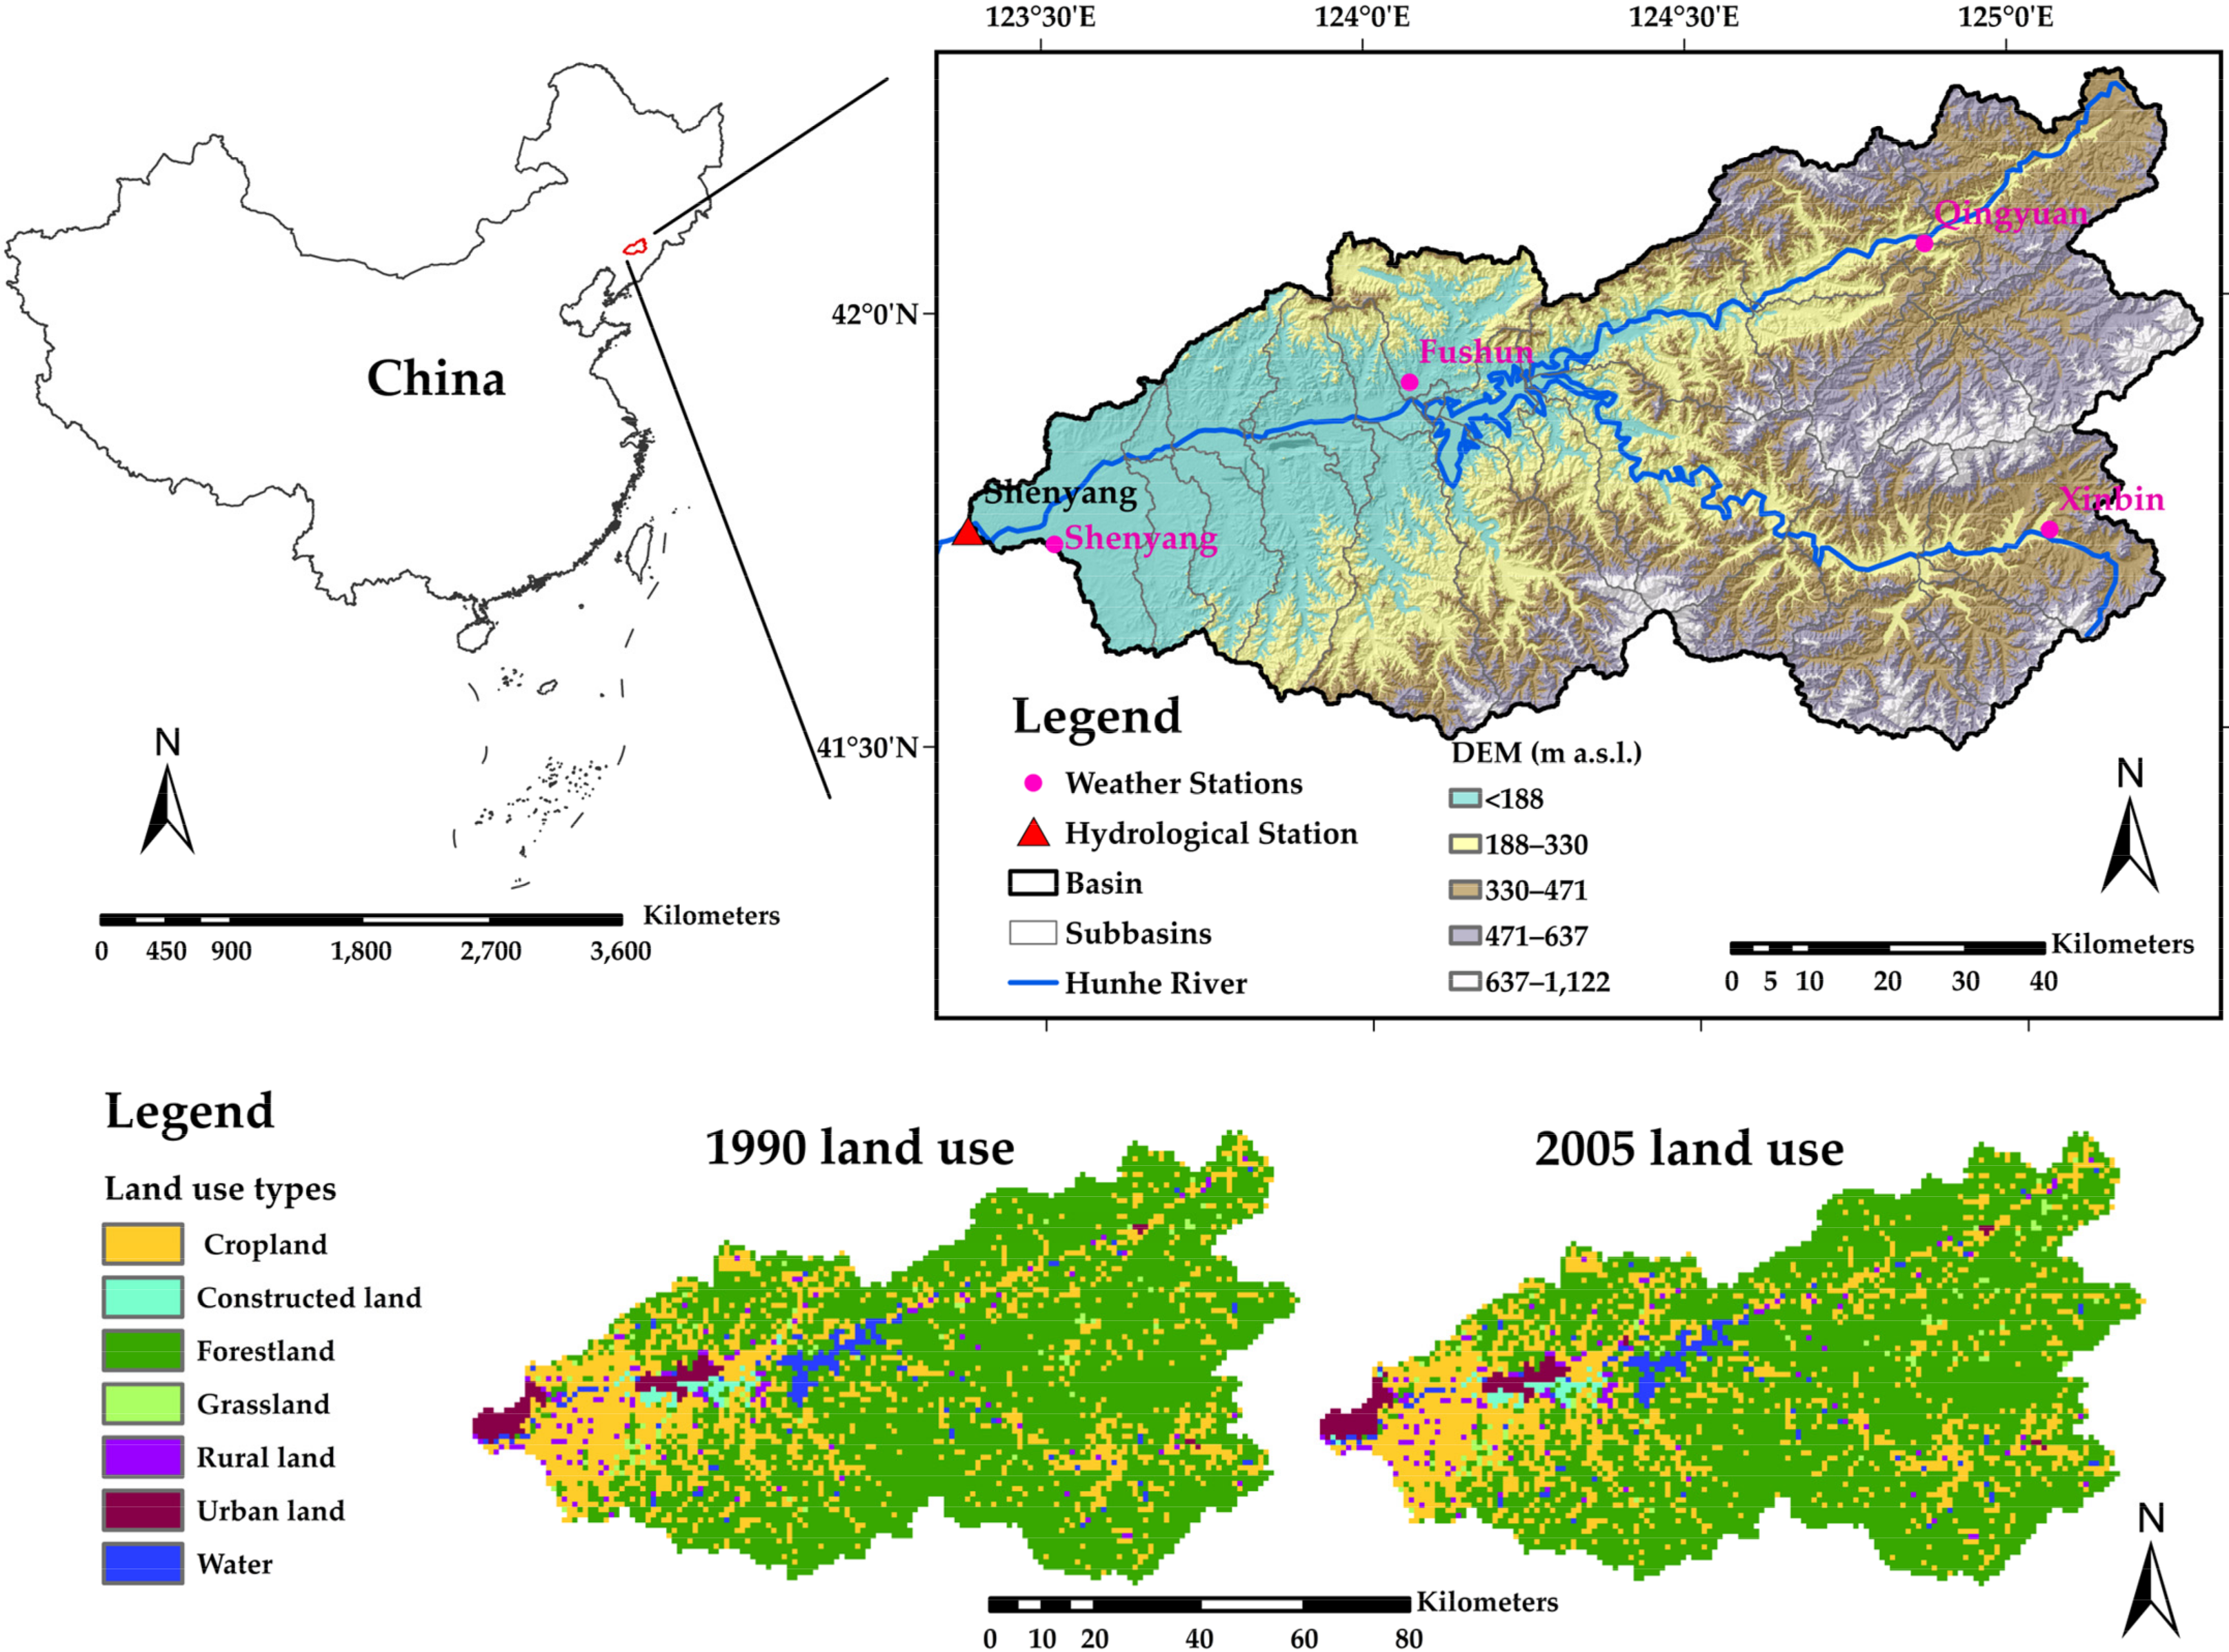
2.1. Study Area

The study region of HRB refers to the upstream area of the Shenyang Hydrologic Station, in northeastern China. The HRB, located between 123°22′–125°17′ E and 41°29′–42°16′ N (as shown in Figure 1), has an area of 7919 km2. The Hunhe River, which flows through the study region, originates from the Changbai Mountain, empties into the Bohai Sea, and passes through two large cities, Fushun and Shenyang. The upstream Hunhe River is mountainous with elevations ranging from 400 to 800 m a.s.l., and the downstream area is dominated by hills with elevations of 100–200 m a.s.l. The average annual temperature in the HRB is between 4 °C and 8 °C, and the average annual precipitation is 771.8 mm. The basin has a typical temperate monsoon climate. The wet season (May–August) accounts for 70–80% of the total annual precipitation. Land use in the catchment mainly includes two types: forestland and cropland (Figure 1).

2.2. Data Collection

The required input data for the SWAT model consist of the digital elevation model (DEM), land use map, soil map, and meteorological data. Hydrological measured data, including discharge and sediment load, were used for the model calibration and validation.
A DEM map at 90 m resolution was obtained from the USGS/NASA (United States Geological Survey/National Aeronautics and Space Administration) Shuttle Radar Topography Mission Digital Elevation Database [27]. The map was used to define the streams and boundaries of sub-basins. The soil data were obtained from the Harmonized World Soil Database (HWSD) and provided by the National Cryosphere Desert Data Center of China at a resolution of 1 km [28]. Land use maps (including those for 1990 and 2005) were purchased from the Resource and Environment Science and Data Center of China at a resolution of 1 km [29]. Monthly measured discharge and sediment load data (1979–2009) at the Shenyang Hydrologic Station were derived from the Annual Hydrological Report of the People’s Republic of China and Songliao Water Resources Commission of China.
The observed meteorological data from 1979 to 2009 were obtained from the National Meteorological Information Center of China [30], which comprises daily precipitation data, mean, maximum, and minimum temperature, solar radiation, wind speed, and relative humidity.

2.3. Methodology

2.3.1. SWAT Model Description

The SWAT model was developed by Dr. Jeff Arnold for the USDA (United States Department of Agriculture) Agricultural Research Service in large complex watersheds. It is a conceptual and semi-distributed hydrological model performing on a daily time step and initially designed to forecast changes in landscape management practices on water, sediment, and chemical yields [31,32]. In this study, the SWAT model (Version 2012) was used to assess the impacts of LUCC and climate change on discharge and sediment load in the HRB. First, the HRB was divided into sub-watersheds based on DEM and digital stream networks. The sub-watersheds were then further divided into hydrological response units (HRUs) to calculate hydrological components on the basis of soil type and land use type. The output of each HRU was independently calculated in SWAT and did not interact with other HRUs. Discharge and sediment load were calculated separately for each HRU, summed at the sub-watershed level, and then routed to achieve the total discharge and sediment load for the watershed.
The simulation of the watershed hydrologic cycle was calculated on the HRU scale using the water balance equation [32]:
S W t = S W 0 + i = 1 t ( R i - Q i - E T i - P i - Q R i )
where SWt and SW0 represent the final and initial soil water content on day t, respectively; and Ri, Qi, ETi, Pi, and QRi are the daily amounts of precipitation (mm), surface runoff (mm), potential evapotranspiration (mm), percolation (mm), and return flow (mm) at day t, respectively.
Erosion caused by rainfall and runoff was calculated on the basis of the modified universal soil loss equation (MUSLE) [32]:
sed = 11.8 · Q surf · q peak · area hru 0.56 · K U S L E · C U S L E · P U S L E · L S U S L E · C F R G
where sed, Qsurf, qpeak, and areahru are the sediment yield on a given day (tons), the surface runoff volume (mm/ha), the peak runoff rate (m3/s), and the area of the HRU (ha), respectively; KUSLE, CUSLE, PUSLE, LSUSLE, and CFRG are factors, representing the universal soil loss equation (USLE) soil erodibility factor (0.013 ton·m2·h/(m3·ton·cm)), the USLE cover and management factor, the USLE support practice factor, the USLE topographic factor, and the coarse fragment factor, respectively.
In this study, the watershed was divided into 34 sub-watersheds and 480 and 484 HRUs under land-use maps for 1990 and 2005, respectively. The SCS (Soil Conservation Service) curve number method [33] and Penman–Monteith equation [34] were selected to simulate surface discharge and potential evapotranspiration, respectively. Finally, a kinematic storage model was used to predict the lateral flow in each soil layer, while the peak discharge rate was calculated using a modified rational method [32].

2.3.2. SWAT Model Setup

The SWAT model parameters may be significantly affected by land use maps for different periods. In order to better simulate the hydrological processes, the land use map for 1990 and meteorological data for 1979–1990 were applied to calibrate the parameters. Subsequently, the parameters were validated using the land use map for 2005 and meteorological data for 1991–2009. The SWAT model was calibrated and validated using monthly hydrological data. The SUFI-2 (Sequential Uncertainty Fitting version 2) algorithm in the SWAT-CUP (SWAT Calibration Uncertainty Program) [35] was applied to analyze the parameter sensitivity and optimize the parameters. The Nash–Sutcliffe efficiency (NSE), coefficient of determination (R2), and percent bias (PBIAS) were applied for each period to assess the model simulated performance. Generally, NSE ranges from negative infinity to 1, R2 ranges from 0 to 1, and PBIAS ranges from infinity. In addition, as recommended by Moriasi et al. [36], the performance criteria for statistical R2, NSE, and PBIAS for discharge and sediment load at the monthly scale were followed; these are presented in Table 1. The more sensitive model parameters and their optimal values for discharge and sediment load are listed in Table 2.

2.3.3. Scenario Settings

To evaluate the individual and combined impacts of LUCC and climate change on discharge and sediment load in the HRB, it is advised to change one factor at a time while holding others constant, and four scenarios were set up (Table 3). Two time periods, 1980–1990 and 1999–2009, were established based on the periods of meteorological data and land use maps, and each time period included one corresponding land use map. Scenario 1 (S1) used meteorological data for 1980–1990 and the land use map for 1990, representing the baseline scenario. Scenario 2 (S2) used the meteorological data for 1999–2009 and the same land use map as S1, representing the climate change scenario. Scenario 3 (S3) used the land use map for 2005 and the same meteorological data as S1, representing the LUCC scenario. Scenario 4 (S4) used the meteorological data for 1999–2009 and the land use map for 2005, which is very different from S1, representing the combined scenario of LUCC and climate change.
The parameters Qi and SEDi were used in this study to represent the average annual discharge and sediment load simulated by the calibrated SWAT model under scenario i. Therefore, Q2-Q1 and SED2-SED1, Q3-Q1 and SED3-SED1, and Q4-Q1 and SED4-SED1 represent the impacts of climate change, LUCC, and combined scenarios on discharge and sediment load, respectively.

2.3.4. Trend Analysis

For trend analysis, the rank-based non-parametric method proposed by Mann [37] and Kendall [38] (the Mann-Kendall or M-K test) can be applied to evaluate whether the variables of interest have a monotonic upward or downward trend over time. This test does not require the assumption of any distribution form for the data and is not disturbed by the presence of a few abnormal values [39]. Therefore, the World Meteorological Organization strongly recommended the M-K test for general service [40], and the M-K test has been widely used to identify whether the meteorological data has monotonic trends [41,42,43]. In this study, the M-K test was applied to evaluate the monotonic trend of annual precipitation and mean temperature from four weather stations in the HRB, as well as the monotonic trend of hydrological variables at the watershed outlet.

3. Results

3.1. Change Trends of LUCC, Climate, and Hydrological Variables

3.1.1. Analysis of LUCC

Table 4 shows the variations in LUCC between 1990 and 2005. Forestland and cropland were the dominant land use types of the HRB, accounting for 69.24% and 23.79% of the total study area in 1990 and 68.88% and 23.83% in 2005, respectively. Spatially, forestland and cropland occupied the entire area (Figure 1), while the remainder was mainly distributed in the downstream area. Temporally, a 28.8 km2 decrease in the forestland and an increase in other land use types were observed, with a relative variation of less than 0.5% for both. Overall, a minor change occurred in LUCC for the HRB during 1980–2009.

3.1.2. Analysis of Climate Change and Hydrological Variables Change

Figure 2 shows the annual meteorological changes and hydrological changes in the HRB from 1980 to 2009. Temperature showed an increasing trend, while precipitation, discharge, and sediment load showed a decreasing trend. Compared to the 1980s (1980–1990), in the 2000s (1999–2009), the annual mean temperature increased 0.5 °C (+8.10%), while annual precipitation, discharge and sediment load respectively decreased to 60.25 mm (−7.91%), 7.98 m3/s (−18.20%), and 143.1 thousand tons (−42.1%). Table 5 shows the monotonic trends of annual precipitation and mean temperature at four weather stations and discharge and sediment load at the Shenyang Hydrologic Station in the HRB during 1980–2009. The annual precipitation for two weather stations (i.e., Qingyuan and Fushun, as shown in Figure 1) tended to decrease, while that for the rest indicated an increasing trend; however, the average change trends in the HRB were not significant. In contrast, the annual mean temperature displayed a significant increasing trend (p < 0.01) for the three stations, which were mostly located in the mountain area of the upstream. Discharge showed a non-significant decreasing trend, and sediment load significantly (p < 0.05) decreased in the HRB. Overall, the results indicated a non-significant decreasing trend for precipitation and discharge, a significant increase in temperature, and a significant decrease in sediment load.

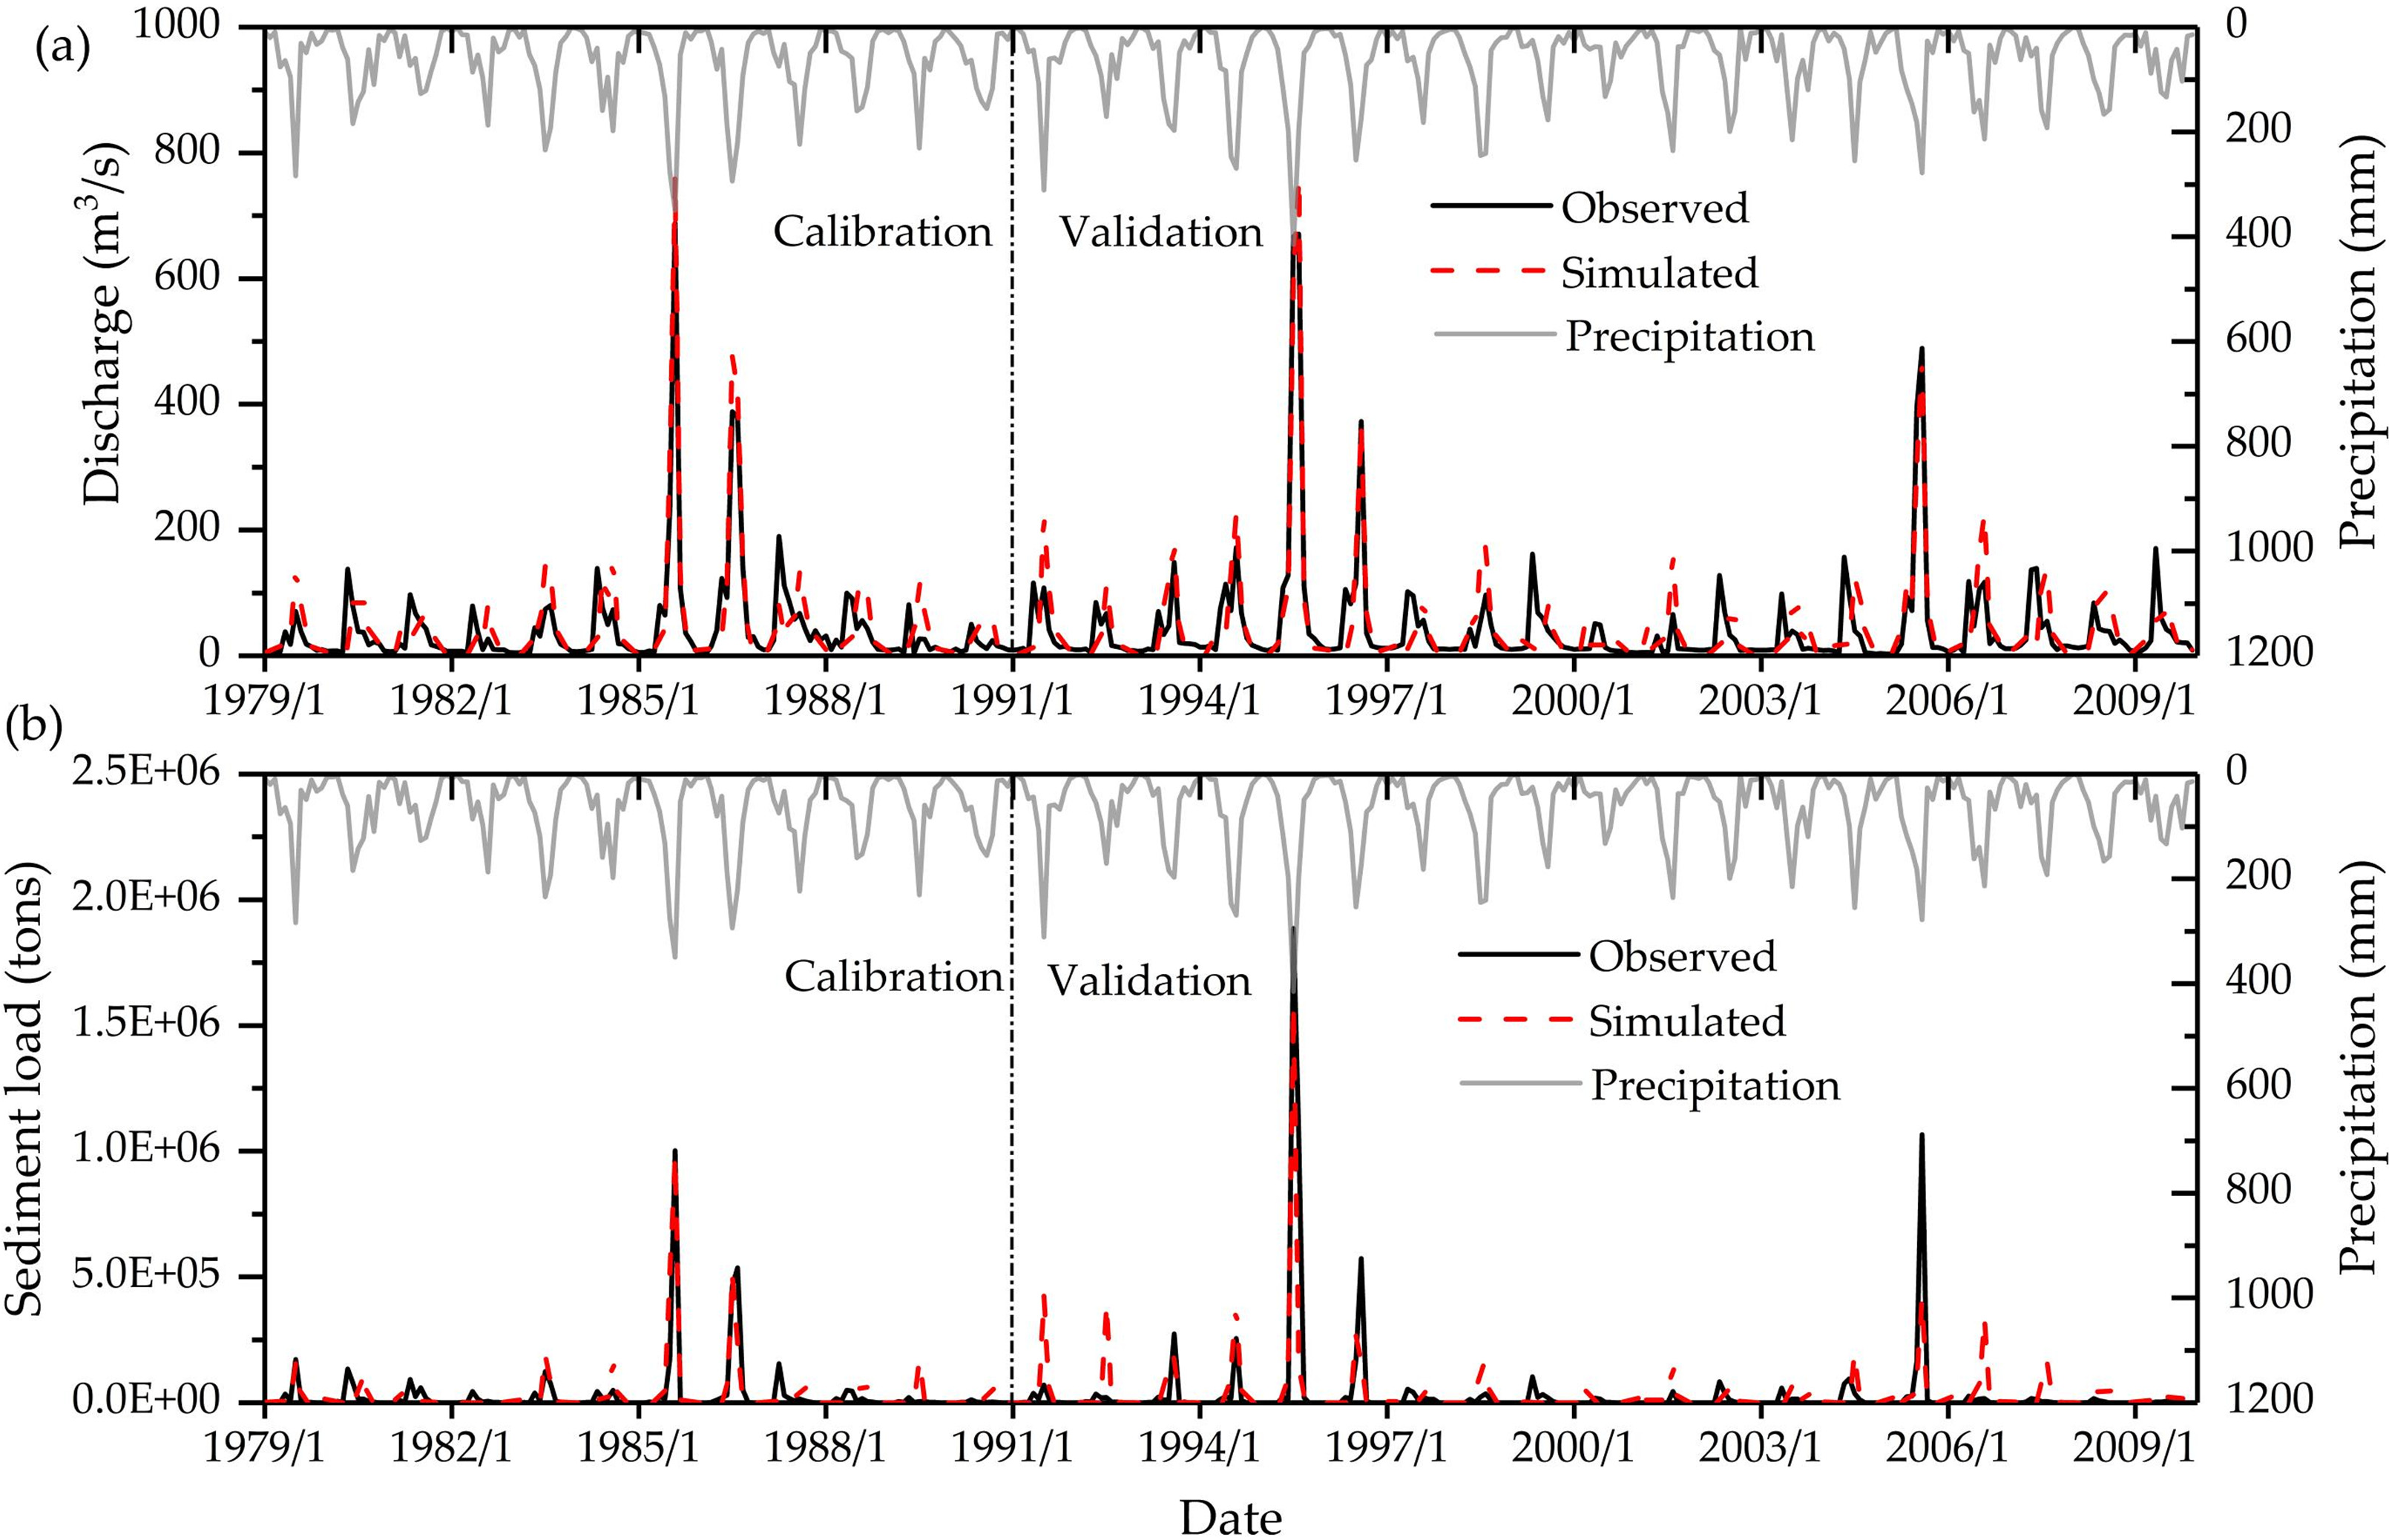
3.2. Calibration and Validation of SWAT Model

Figure 3 shows the observed and simulated monthly discharge and sediment load at the Shenyang Hydrologic Station, which is the watershed outlet hydrological station during the calibration and validation periods in the HRB. The performance indicators NSE and R2 were all greater than 0.60, and PBIAS were all within ±10% (Table 6). On the basis of the criteria of Moriasi et al. [36], we found that good model performance was achieved for discharge, and the sediment load simulation performance was satisfactory. Generally, the SWAT model is considered to be a reliable model to simulate hydrological responses for catchment studies.

3.3. The Responses of Hydrology to LUCC and Climate Change

Table 7 shows the annual discharge and sediment loads simulated by the calibrated SWAT model under different scenarios. The simulated results were used to compare the hydrological changes in response to individual and combined climate change and LUCC for all four hypothetical scenarios. The variations in discharge and sediment loads under the different scenarios are listed in Table 7 and illustrated in Figure 4.
Compared to the baseline scenario (S1), the simulation results indicated a decreasing trend in both annual discharge and sediment load under the combined impact of LUCC and climate change (S4), with −22.65% for discharge and −31.51% for sediment load. Under the climate change scenario (S2), discharge and sediment load reduced by 22.69% and 30.61%, respectively, whereas the LUCC (S3) led to small changes in them, increasing discharge by 0.08% but reducing sediment load by −1.33%. The results showed that climate change and LUCC had a consistent negative effect on sediment load but a contrary influence on discharge, that is, climate change decreased discharge while LUCC increased it, and the relative variations in sediment load were more notable than those in discharge. Moreover, climate change had a far greater contribution to changes in discharge and sediment load than LUCC.

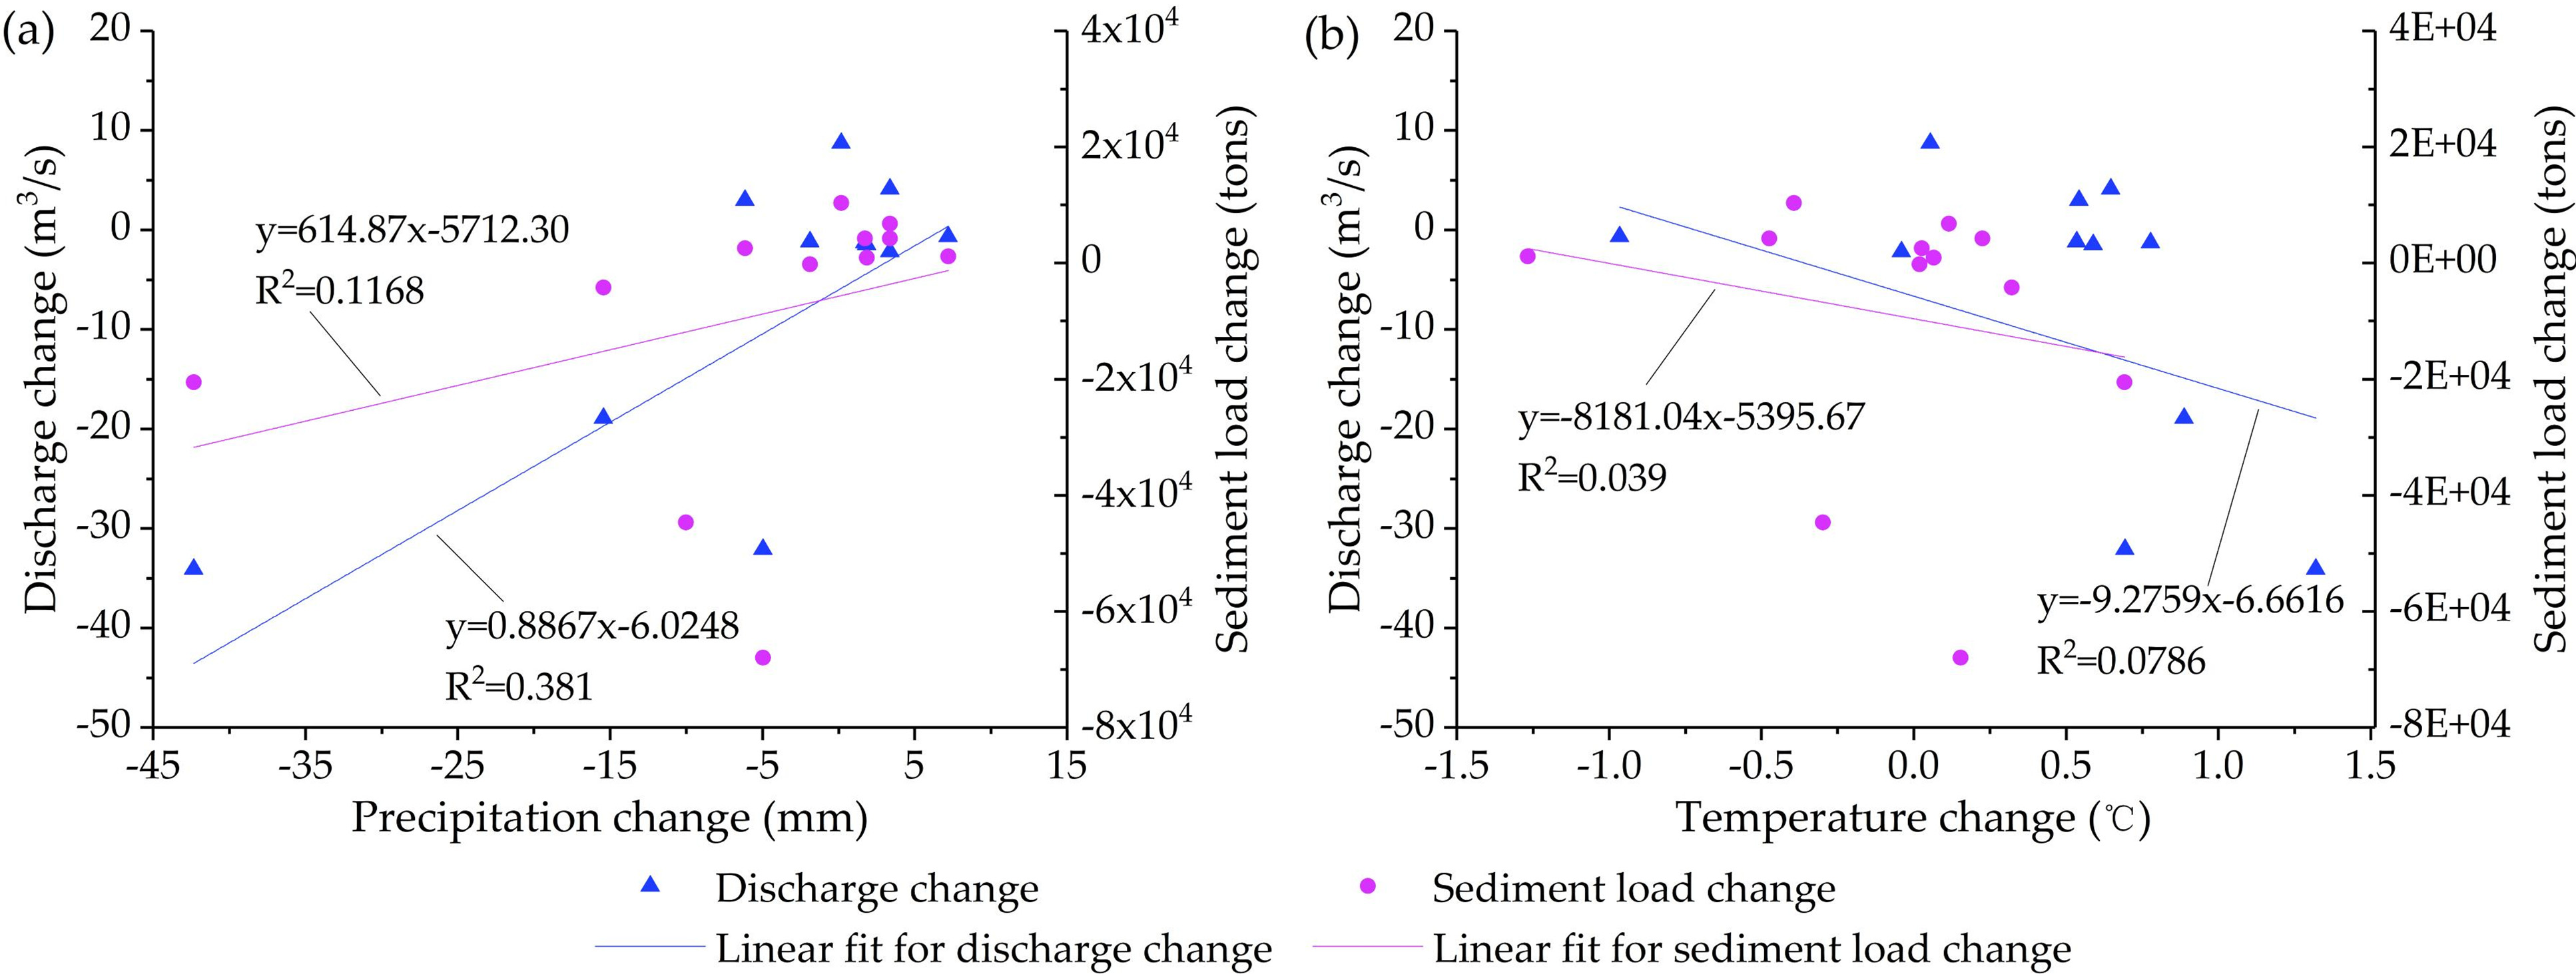
3.4. Impacts of Precipitation and Temperature on Hydrology

To further analyze the impacts of the changes in climate variables (i.e., precipitation and temperature) on annual discharge and sediment load in the HRB, the correlations between the variations in climate variables (i.e., precipitation and temperature) and hydrological variables (i.e., discharge and sediment load) were investigated. Due to the minor contribution of LUCC to changes in discharge and sediment load from 1980 to 2009, the changes in discharge and sediment load between 1980 to 1990 and 1999 to 2009 were considered to be mainly caused by climate change. The changes in monthly precipitation, mean temperature, discharge, and sediment load for the two periods mentioned above were calculated, and the correlations between the changes in climate variables (i.e., precipitation and temperature) and the changes in hydrological variables (i.e., discharge and sediment load) are shown in Figure 5. The results indicate that the changes of discharge and sediment load were positively correlated with the changes of precipitation and negatively correlated with the changes of temperature. Therefore, precipitation change rather than temperature change dominated the response of discharge and sediment load to climate change.

4. Discussion

4.1. Uncertainty of SWAT Model Simulations

The calibration and validation results in the HRB showed that better accuracy was achieved for the discharge simulation than for the sediment load simulation (Figure 3 and Table 6). Typically, simulated sediment loads can often be overestimated or underestimated, particularly during summer [44]. This was demonstrated in this study, in that the simulated sediment load in 2005 was notably lower than the measured value (Figure 3). Another factor that can vary is soil erosion, which is affected by many factors [45,46] including the duration and intensity of rainfall, peak flow, soil properties, land use types, and human activities. Moreover, it is well understood that the monsoon climate has a great effect on the types and amount of rainfall in summer in the HRB, as it often results in extremely heavy rainfall events followed by severe debris flow disasters. These disasters can lead to a considerable increase in sediment load, which may influence the performance of the SWAT model. According to previous studies [47,48,49] in the HRB, severe rainstorm and flood events occurred in 1985, 1995, and 2005 during 1979–2009. The total precipitation in summer for 2005 was less than that for 1985 (−20%) and 1995 (−25%), resulting in less discharge for 2005, whereas the rainstorm intensity of 2005 that was affected by a tropical storm was significantly higher than that of 1985 and 1995. The intensity of the 2005 rainstorm was uniquely rare and subsequently caused severe debris flow disasters in the upstream mountainous areas. Because of this, the sediment load simulation was seriously underestimated in the summer of 2005. In addition, the sediment load calculated with the MUSLE was assumed to only be deposited in the main channel, without considering other effects such as the amount of sediment deposition over the surface of the landscape [32]. This uncertainty can cause overestimation of the sediment load modeled by the SWAT in most cases. Moreover, the observed sediment load data may have some uncertainties [50], particularly the observed data derived from debris flow disasters, and this can greatly affect the accuracy of model simulations. However, regardless of these uncertainties, the simulated sediment load results are satisfactory [36].

4.2. Contrasting Roles of Climate Change and LUCC on Hydrology

During 1980–2009, the precipitation in the HRB showed a non-significant monotonic downward trend, corresponding to a significant monotonic upward trend in temperature (Table 4). This agrees with the climatic trend found by Liu et al. [51] for the Tangwang River Basin, also in Northeast China. In particular, in this study, precipitation change had a greater impact on annual discharge and sediment load than temperature change, with a positive correlation between precipitation change and discharge/sediment load change and a negative correlation between temperature change and discharge/sediment load change (Figure 5). A similar result was also reported by Guo [52] in the Chaohe Watershed using a hypothetical climate scenario method in which precipitation and temperature was designed in different ranges.
According to the findings of this study, the decreased precipitation and increased temperature (Table 5) led to a pronounced decrease in discharge and sediment load (Table 7), while a minor change (within 0.5%) in the land-use map during 1980–2009 caused a minor change (within 1.5%) in discharge/sediment load under the LUCC scenario (S3). The responses of discharge and sediment load to the combined impact of climate change and LUCC and climate change were nearly equal (Table 7). Climate change rather than LUCC dominated the changes in discharge and sediment load, which is consistent with previous investigations carried out by Li et al. [42] and Serpa et al. [53]. However, other studies have also indicated that LUCCs were more dominant [9,45].
We also noticed that LUCC caused an increase in discharge but a decrease in sediment load, although the associated change ratios were very small (Table 7). Although Table 4 shows that forestland decreased, other land use types such as urban land, rural land, water, and cropland actually increased. These increased land use types, particularly urban land and water with more impervious areas, generally have a stronger water production capacity than forestland [54,55]. Many previous studies have reported that deforestation can increase discharge and sediment load [45,46,56,57,58]. In general, cropland is considered a primary source of sediment load, whereas urban land, afforestation, and grass planting can reduce soil erosion [46,53,59]. Furthermore, LUCC can alter the spatial distribution of HRUs in the SWAT model and discharge processes. In addition to the uncertainties of the SWAT model, many factors in the MUSLE, such as surface discharge volume, peak flows, and area of HRU, can also influence sediment exports; as a result, in this study, a minor land use change led to a slight reduction (−1.33%) in the sediment load in the HRB.

5. Conclusions

In this study, the changes in land use, climate, and hydrological variables were analyzed in the HRB using the SWAT model for discharge and sediment load, which were calibrated at a monthly scale, and the individual and combined contributions of LUCC and climate change to alterations of hydrology were investigated. The main conclusions are summarized as follows:
(1)
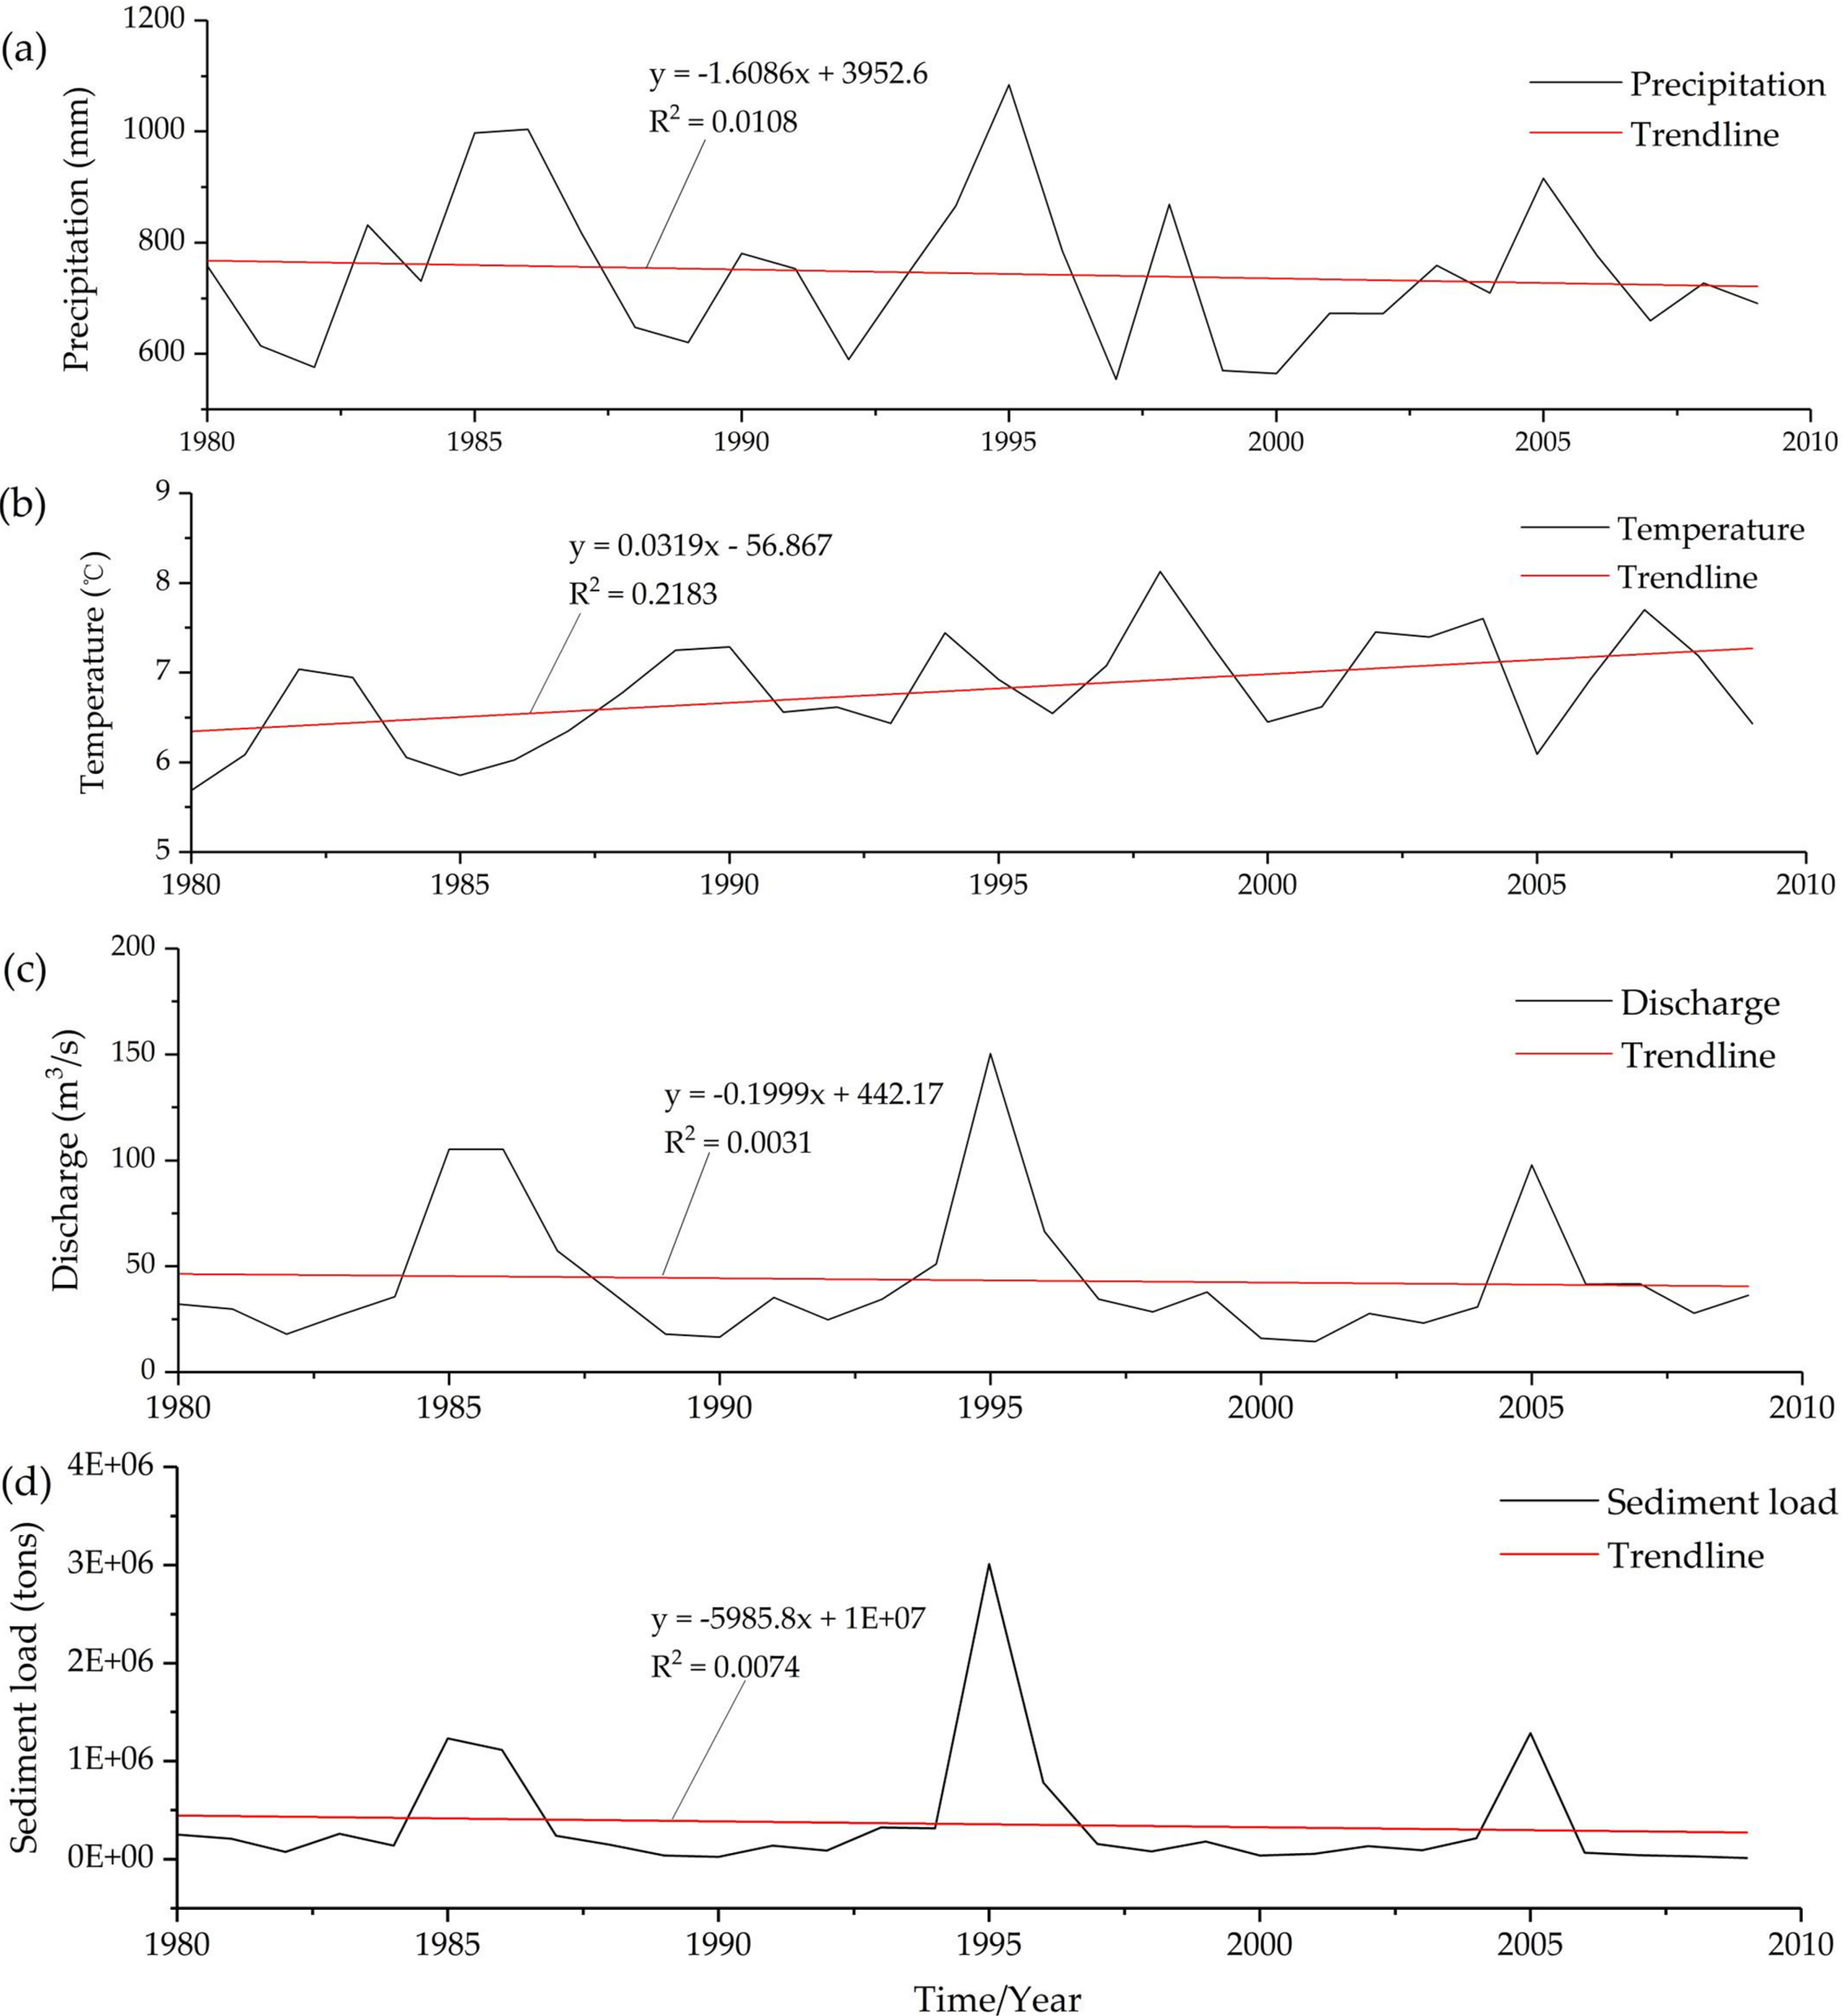
During 1980–2009, only minor land use variations were observed (within 1% of the basin area), with a decrease for forestland and an increase for other land use types such as urban land, grassland, and cropland. The precipitation and discharge showed a non-significant monotonic downward trend and sediment load showed a significant monotonic downward trend, with a correspondingly significant monotonic upward trend in temperature.
(2)
During the calibration and validation periods, the PBIAS was within ±10% for both discharge and sediment load simulation. Both the NSE and R2 for the monthly discharge ranged from 0.77 to 0.80, indicating a good performance for SWAT model to simulate discharge. The NSE and R2 for the monthly sediment load ranged from 0.65 to 0.78, indicating a satisfactory model performance. The SWAT model proved to be a valid tool for assessing the impacts of climate and land use changes on discharge and sediment load.
(3)
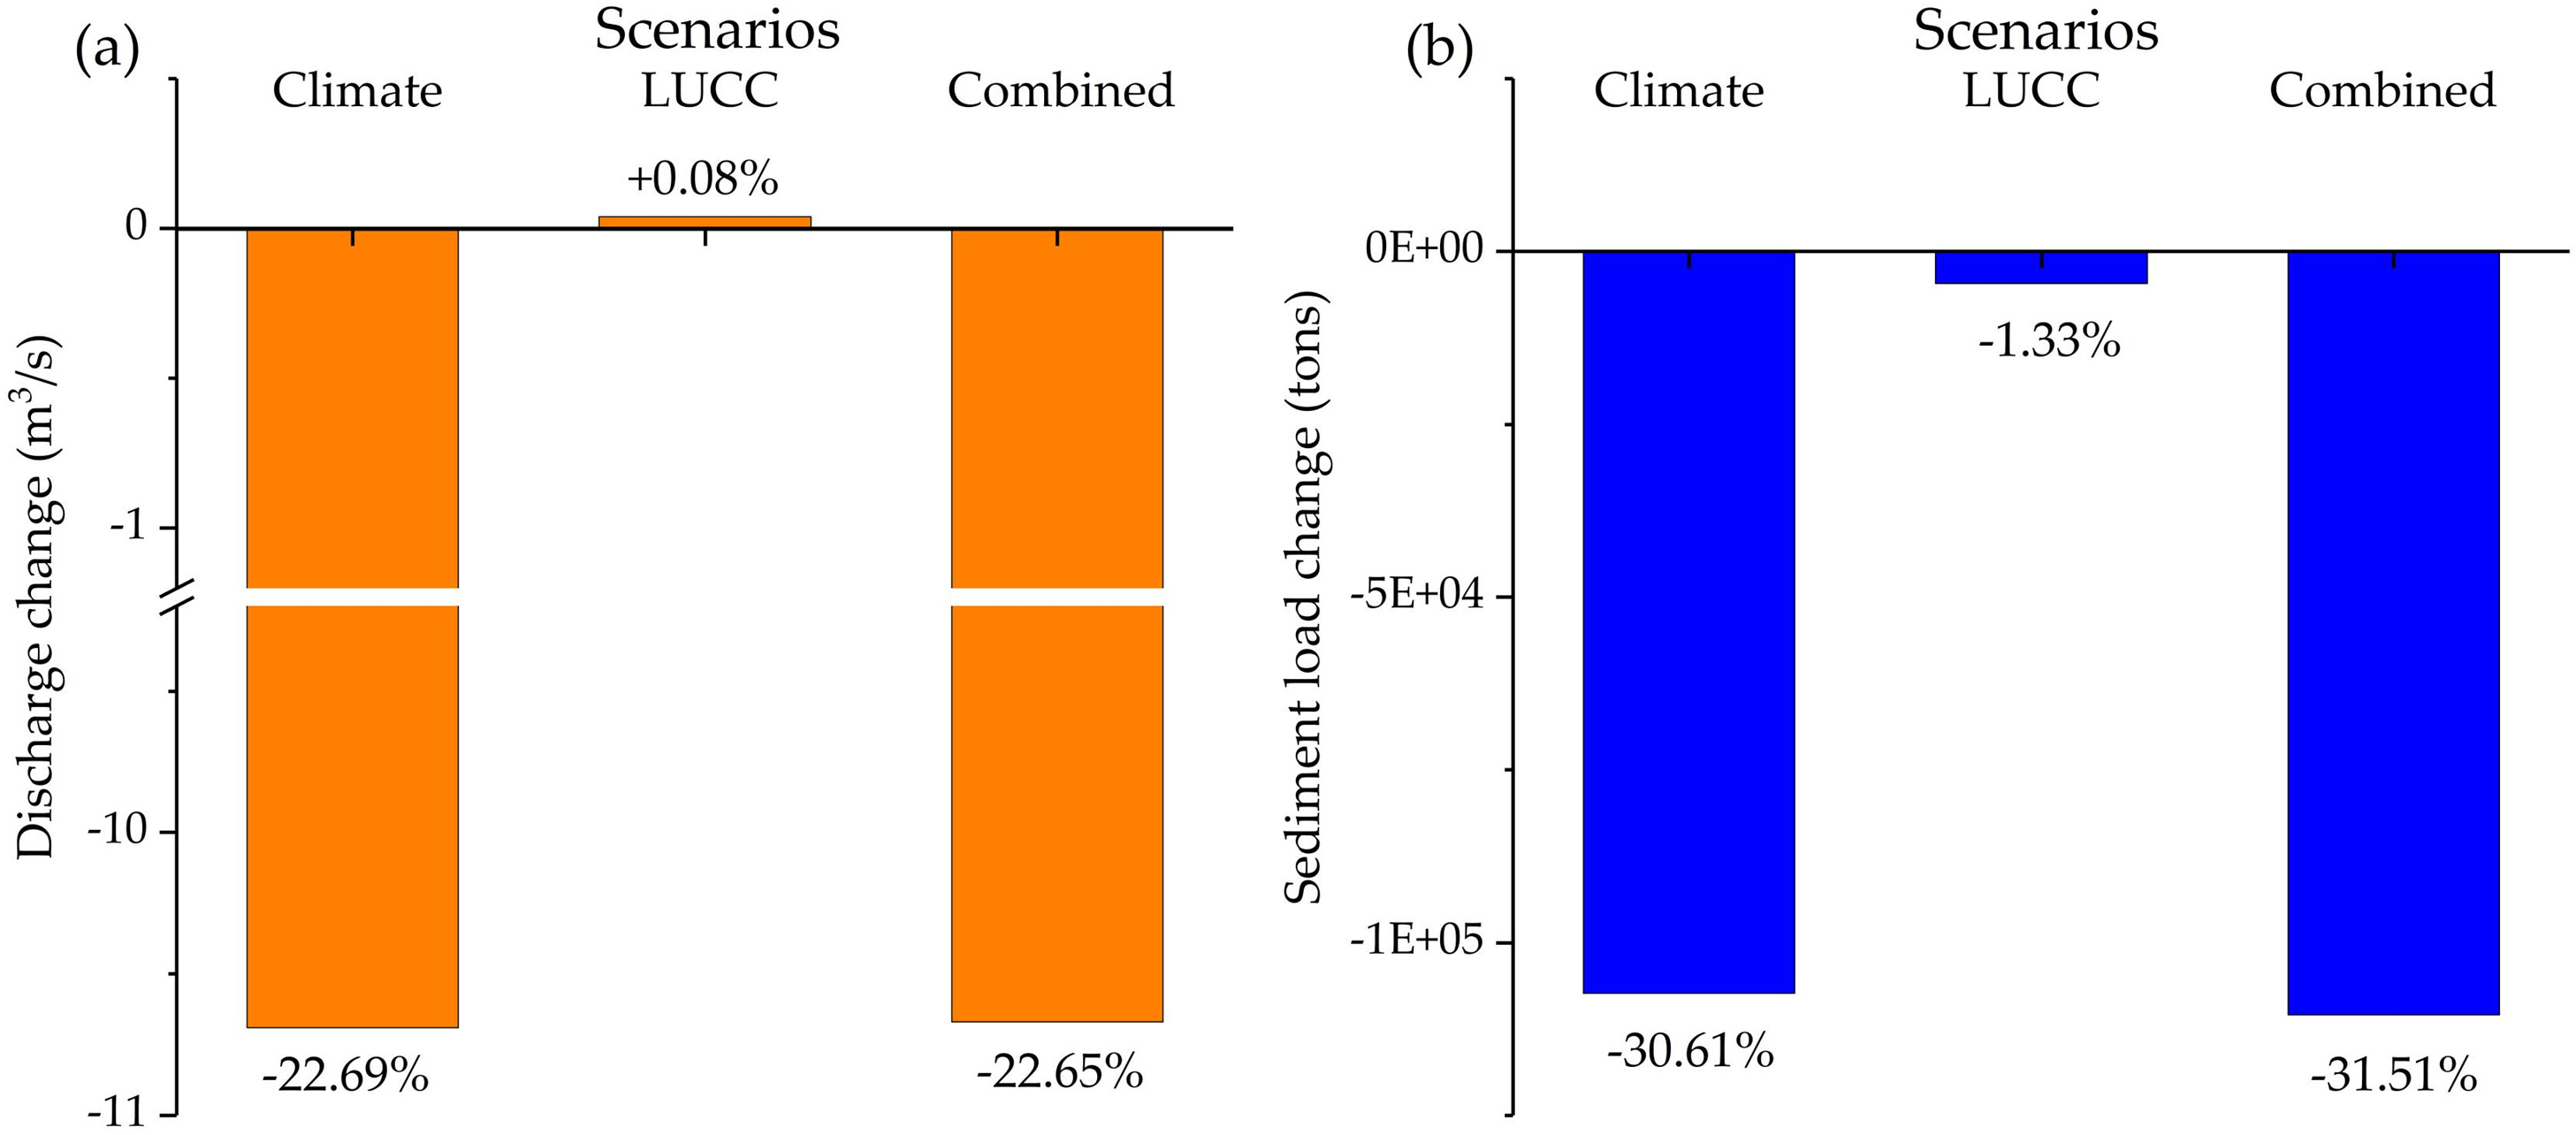
During 1980–2009, climate change rather than land use change dominated the hydrological changes in the HRB, and precipitation played a more important role in alterations of discharge and sediment load than temperature.

Author Contributions

Conceptualization, L.Z. and Y.J.; methodology, M.Y., H.W. (Hao Wang), and N.D.; software, H.W. (Hejia Wang) and X.L.; validation, L.Z. and N.D.; formal analysis, H.W. (Hejia Wang) and X.L.; investigation, L.Z and L.C.; data collection and curation, M.Y. and K.L.; writing—original draft preparation, L.Z. and N.D.; writing—review and editing, Y.J., M.Y. and H.W. (Hao Wang); visualization, X.L.; supervision, M.Y.; funding acquisition, M.Y. All authors have read and agreed to the published version of the manuscript.

Funding

This study is supported by the free exploration topic of State Key Laboratory of Simulation and Regulation of Water Cycle in River Basin, grant number SKL2020TS01; National Natural Science Foundation of China, grant number U1865102; and the Belt and Road Special Foundation of the State Key Laboratory of Hydrology-Water Resources and Hydraulic Engineering, grant number 2021490311.

Institutional Review Board Statement

Not applicable.

Informed Consent Statement

Not applicable.

Data Availability Statement

The data used in this study are available on request from the corresponding author.

Acknowledgments

The authors appreciate editors and anonymous reviewers for their valuable comments on the manuscript.

Conflicts of Interest

The authors declare no conflict of interest.

References

  1. Lins, H.F.; Slack, J.R. Streamflow trends in the United States. Geophys. Res. Lett. 1999, 26, 227–230. [Google Scholar] [CrossRef] [Green Version]
  2. Molina-Navarro, E.; Trolle, D.; Martínez-Pérez, S.; Sastre-Merlín, A.; Jeppesen, E. Hydrological and water quality impact assessment of a Mediterranean limno-reservoir under climate change and land use management scenarios. J. Hydrol. 2014, 509, 354–366. [Google Scholar] [CrossRef]
  3. Bangash, R.F.; Passuello, A.; Sanchez-Canales, M.; Terrado, M.; López, A.; Elorza, F.J.; Ziv, G.; Acuña, V.; Schuhmacher, M. Ecosystem services in Mediterranean river basin: Climate change impact on water provisioning and erosion control. Sci. Total Environ. 2013, 458–460, 246–255. [Google Scholar] [CrossRef]
  4. Kim, J.; Choi, J.; Choi, C.; Park, S. Impacts of changes in climate and land use/land cover under IPCC RCP scenarios on streamflow in the Hoeya River Basin, Korea. Sci. Total Environ. 2013, 452–453, 181–195. [Google Scholar] [CrossRef]
  5. Li, Z.; Fang, H. Impacts of climate change on water erosion: A review. Earth Sci. Rev. 2016, 163, 94–117. [Google Scholar] [CrossRef]
  6. Yang, X.; Sun, W.; Li, P.; Mu, X.; Gao, P.; Zhao, G. Reduced sediment transport in the Chinese Loess Plateau due to climate change and human activities. Sci. Total Environ. 2018, 642, 591–600. [Google Scholar] [CrossRef] [PubMed]
  7. Brath, A.; Montanari, A.; Moretti, G. Assessing the effect of flood frequency of land use change via hydrological simulation (with uncertainty). J. Hydrol. 2006, 324, 141–153. [Google Scholar] [CrossRef]
  8. Schilling, K.E.; Jha, M.K.; Zhang, Y.K.; Gassman, P.W.; Wolter, C.F. Impact of land use and land cover change on the water balance of a large agricultural watershed: Historical effects and future directions. Water Resour. Res. 2008, 44, W00A09. [Google Scholar] [CrossRef]
  9. Yin, J.; He, F.; Xiong, Y.; Qiu, G. Effects of land use/land cover and climate changes on surface runoff in a semi-humid and semi-arid transition zone in northwest China. Hydrol. Earth Syst. Sci. 2017, 21, 183–196. [Google Scholar] [CrossRef] [Green Version]
  10. Milly, P.C.D.; Dunne, K.A.; Vecchia, A.V. Global pattern of trends in streamflow and water availability in a changing climate. Nature 2005, 438, 347–350. [Google Scholar] [CrossRef]
  11. Piao, S.; Ciais, P.; Huang, Y.; Shen, Z.; Peng, S.; Li, J.; Zhou, L.; Liu, H.; Ma, Y.; Ding, Y.; et al. The impacts of climate change on water resources and agriculture in China. Nature 2010, 467, 43–51. [Google Scholar] [CrossRef]
  12. Tu, T.; Ercan, A.; Carr, K.J.; Kavvas, M.L.; Trinh, T.; Ishida, K.; Nosacka, J.; Brown, K. Coupling hydroclimate-hydraulic-sedimentation models to estimate flood inundation and sediment transport during extreme flood events under a changing climate. Sci. Total Environ. 2020, 740, 140117. [Google Scholar] [CrossRef]
  13. Song, X.; Hansen, M.C.; Stehman, S.V.; Potapov, P.V.; Tyukavina, A.; Vermote, E.F.; Townshend, J.R. Global land change from 1982 to 2016. Nature 2018, 560, 639–64310. [Google Scholar] [CrossRef]
  14. Xie, Z.; Mu, X.; Gao, P.; Wu, C.; Qiu, D. Impacts of Climate and Anthropogenic Activities on Streamflow Regimes in the Beiluo River, China. Water 2021, 13, 2892. [Google Scholar] [CrossRef]
  15. Kundu, S.; Khare, D.; Mondal, A. Individual and combined impacts of future climate and land use changes on the water balance. Ecol. Eng. 2017, 105, 42–57. [Google Scholar] [CrossRef]
  16. Wang, G.; Zhang, J.; Yang, Q. Attribution of Runoff Change for the Xinshui River Catchment on the Loess Plateau of China in a Changing Environment. Water 2016, 8, 267. [Google Scholar] [CrossRef] [Green Version]
  17. Zhou, Y.; Lai, C.; Wang, Z.; Chen, X.; Zeng, Z.; Chen, J.; Bai, X. Quantitative Evaluation of the Impact of Climate Change and Human Activity on Runoff Change in the Dongjiang River Basin, China. Water 2018, 10, 571. [Google Scholar] [CrossRef] [Green Version]
  18. Stagl, J.C.; Hattermann, F.F. Impacts of Climate Change on the Hydrological Regime of the Danube River and Its Tributaries Using an Ensemble of Climate Scenarios. Water 2015, 7, 6139–6172. [Google Scholar] [CrossRef]
  19. Chawla, I.; Mujumdar, P.P. Isolating the impacts of land use and climate change on streamflow. Hydrol. Earth Syst. Sci. 2015, 19, 3633–3651. [Google Scholar] [CrossRef] [Green Version]
  20. Napoli, M.; Massetti, L.; Orlandini, S. Hydrological response to land use and climate changes in a rural hilly basin in Italy. Catena 2017, 157, 1–11. [Google Scholar] [CrossRef]
  21. Luo, K.S.; Tao, F.L.; Moiwo, J.P.; Xiao, D. Attribution of hydrological change in Heihe River Basin to climate and land use change in the past three decades. Sci. Rep. 2016, 6, 33704. [Google Scholar] [CrossRef] [Green Version]
  22. Li, Z.; Liu, W.; Zhang, X.; Zheng, F. Impacts of land use change and climate variability on hydrology in an agricultural catchment on the Loess Plateau of China. J. Hydrol. 2009, 377, 35–42. [Google Scholar] [CrossRef]
  23. Akoko, G.; Le, T.U.; Gomi, T.; Kato, T. A Review of SWAT Model Application in Africa. Water 2021, 13, 1313. [Google Scholar] [CrossRef]
  24. Tan, M.L.; Gassman, P.W.; Srinivasan, R.; Arnold, J.G.; Yang, X. A Review of SWAT Studies in Southeast Asia: Applications, Challenges and Future Directions. Water 2019, 11, 914. [Google Scholar] [CrossRef] [Green Version]
  25. Zhang, Q.; Gu, X.; Singh, V.P.; Xu, C.; Kong, D.; Xiao, M.; Chen, X. Homogenization of precipitation and flow regimes across China: Changing properties, causes and implications. J. Hydrol. 2015, 530, 462–475. [Google Scholar] [CrossRef]
  26. Liu, J.; Zhang, Q.; Singh, W.P.; Shi, P. Contribution of multiple climatic variables and human activities to streamflow changes across China. J. Hydrol. 2017, 545, 145–162. [Google Scholar] [CrossRef] [Green Version]
  27. SRTM Digital Elevation Database. Available online: http://srtm.csi.cgiar.org/ (accessed on 10 March 2021).
  28. HWSD Data. Available online: http://www.ncdc.ac.cn (accessed on 2 April 2021).
  29. Land Use Maps. Available online: https://www.resdc.cn/ (accessed on 7 March 2021).
  30. Observed Meteorological Data. Available online: http://data.cma.cn (accessed on 12 March 2021).
  31. Arnold, J.G.; Srinivasan, R.; Muttiah, R.S.; Williams, J.R. Large area hydrologic modeling and assessment—Part 1: Model development. J. Am. Water Resour. Assoc. 1998, 34, 73–89. [Google Scholar] [CrossRef]
  32. Neitsch, S.L.; Arnold, J.G.; Kiniry, J.R.; Williams, J.R. Soil and Water Assessment Tool Theoretical Documentation Version 2009; Texas Water Resources Institute: College Station, TX, USA, 2011. [Google Scholar]
  33. USDA Soil Conservation Service. National Engineering Handbook Section 4 Hydrology; Department of Agriculture-Soil Conservation Service: Washington, DC, USA, 1972. [Google Scholar]
  34. Monteith, J.L. Evaporation and the environment in the State and Movement of Water in Living Organisms. In Proceedings of the 19th Symposia of the Society for Experimental Biology, Swansea, UK, September 1964; Cambridge University Press: London, UK, 1965; pp. 205–234. [Google Scholar]
  35. Abbaspour, K.C.; Johnson, C.A.; Van Genuchten, M.T. Estimating uncertain flow and transport parameters using a sequential uncertainty fitting procedure. Vadose Zone J. 2004, 3, 1340–1352. [Google Scholar] [CrossRef]
  36. Moriasi, D.N.; Gitau, M.W.; Pai, N.; Daggupati, P. Hydrologic and water quality models: Performance measures and evaluation criteria. Trans. ASABE 2015, 58, 1763–1785. [Google Scholar] [CrossRef] [Green Version]
  37. Mann, H.B. Nonparametric tests against trend. Econometrica 1945, 13, 245–259. [Google Scholar] [CrossRef]
  38. Kendall, M.G. Rank Correlation Methods; Charles Griffin and Co. Ltd.: London, UK, 1975; p. 15. [Google Scholar]
  39. Serrano, V.L.; Mateos, V.L.; Garcia, J.A. Trend analysis of monthly precipitation over the Iberian Peninsula for the period 1921–1995. Phys. Chem. Earth 1999, 24, 85–90. [Google Scholar] [CrossRef]
  40. Mitchell, J.M.; Dzerdzeevskii, B.; Flohn, H.; Hofmeyr, W.L.; Lamb, H.H.; Rao, K.N.; Wallen, C.C. Climatic change. In WMO Technical Note No.79; World Meteorological Organization: Geneva, Switzerland, 1966. [Google Scholar]
  41. Guo, Y.; Fang, G.; Xu, Y.; Tian, X.; Xie, J. Identifying how future climate and land use/cover changes impact streamflow in Xinanjiang Basin, East China. Sci. Total Environ. 2020, 710, 13627. [Google Scholar] [CrossRef] [PubMed]
  42. Li, L.; Jiang, D.; Hou, X.; Li, J. Simulated runoff responses to land use in the middle and upstream reaches of Taoerhe River basin, Northeast China, in wet, average and dry years. Hydrol. Process. 2013, 27, 3484–3494. [Google Scholar] [CrossRef]
  43. Gocic, M.; Trajkovic, S. Analysis of changes in meteorological variables using Mann-Kendall and Sen’s slope estimator statistical tests in Serbia. Global Planet. Chang. 2013, 100, 172–182. [Google Scholar] [CrossRef]
  44. Xu, Z.; Pang, J.; Liu, C.; Li, J. Assessment of runoff and sediment yield in the Miyun Reservoir catchment by using SWAT model. Hydrol. Process. 2009, 23, 3619–3630. [Google Scholar] [CrossRef]
  45. Khoi, D.N.; Suetsugi, T. The responses of hydrological processes and sediment yield to land-use and climate change in the Be River Catchment, Vietnam. Hydrol. Process. 2014, 28, 640–652. [Google Scholar] [CrossRef]
  46. Yan, B.; Fang, N.; Zhang, P.; Shi, Z. Impacts of land use change on watershed stream flow and sediment yield an assessment using hydrologic modelling and partial least squares regression. J. Hydrol. 2013, 484, 26–37. [Google Scholar] [CrossRef]
  47. Le, J.; Wang, G. Brief analysis of rainstorm and flood in July 1995 in Hunhe River Basin. J. China Hydrol. 1997, 6, 57–59. (In Chinese) [Google Scholar]
  48. Wang, D.; Wang, C.; Fu, H.; Liang, G. Analysis of rainstorm flood in August 2005 in Liaohe River Basin. J. China Hydrol. 2006, 26, 76–79. (In Chinese) [Google Scholar]
  49. Zeng, D.; Zhang, Y. Rainstorm and flood in August 1985 in Liaohe River Basin. J. China Hydrol. 1987, 2, 48–52. (In Chinese) [Google Scholar]
  50. Wang, S.; Luan, J.; Liu, Q. Analysis of Sediment Characteristics in Upper Hunhe River Basin (Fushun Section). Water Resour. Hydr. Northeast. Chin. 2008, 26, 28–29. (In Chinese) [Google Scholar]
  51. Liu, W.; Cai, T.; Fu, G.; Zhang, A.; Liu, C.; Yu, H. The streamflow trend in Tangwang River basin in northeast China and its difference response to climate and land use change in sub-basins. Environ. Earth Sci. 2013, 69, 51–62. [Google Scholar] [CrossRef]
  52. Guo, J. Hydrological Responses to Land Use Change and Climate Variability in Chaohe Watershed, Beijing, China; Beijing Forestry University: Beijing, China, 2012. (In Chinese) [Google Scholar]
  53. Serpa, D.; Nunes, J.P.; Santos, E.S.; Jacinto, R.; Veiga, S.; Lima, J.C.; Moreira, M.; Corte-Real, J.; Keizer, J.J.; Abrantes, N. Impacts of climate and land use changes on the hydrological and erosion processes of two contrasting Mediterranean catchments. Sci. Total Environ. 2015, 538, 64–77. [Google Scholar] [CrossRef] [PubMed] [Green Version]
  54. Willuweit, L.; O’Sullivan, J.J.; Shahumyan, H. Simulating the effects of climate change, economic and urban planning scenarios on urban runoff patterns of a metropolitan region. Urban Water J. 2016, 13, 803–818. [Google Scholar] [CrossRef]
  55. Wong, T.S.W.; Chen, C. Use of a Tropical Basin Model to Assess the Importance of Urbanized Land Condition on the Increase of Flood Peak. Water Sci. Technol. 1994, 29, 155–161. [Google Scholar] [CrossRef]
  56. Ghaffari, G.; Keesstra, S.; Ghodousi, J.; Ahmadi, H. SWAT-simulated hydrological impact of land-use change in the Zanjanrood basin, Northwest Iran. Hydrol. Process. 2010, 24, 892–903. [Google Scholar] [CrossRef]
  57. Lin, B.; Chen, X.; Yao, H.; Chen, Y.; Liu, M.; Gao, L.; James, A. Analyses of landuse change impacts on catchment runoff using different time indicators based on SWAT model. Ecol. Indic. 2015, 58, 55–63. [Google Scholar] [CrossRef]
  58. Zhang, M.; Liu, N.; Harper, R.; Li, Q.; Liu, K.; Wei, X.; Ning, D.; Hou, Y.; Liu, S. A global review on hydrological responses to forest change across multiple spatial scales: Importance of scale, climate, forest type and hydrological regime. J. Hydrol. 2017, 546, 44–59. [Google Scholar] [CrossRef] [Green Version]
  59. Nunes, J.P.; Naranjo Quintanilla, P.; Santos, J.M.; Serpa, D.; Carvalho-Santos, C.; Rocha, J.; Keizer, J.J.; Keesstra, S.D. Afforestation, subsequent forest fires and provision of hydrological services: A model-based analysis for a Mediterranean mountainous catchment. Land Degrad. Dev. 2018, 29, 776–788. [Google Scholar] [CrossRef]
Figure 1. Overview of the study area and two land use maps in different periods.
Water 14 00737 g001
Figure 2. Meteorological change and hydrological change in the HRB at the annual scale: (a) change trend of precipitation; (b) change trend of temperature; (c) change trend of discharge; (d) change trend of sediment load.
Water 14 00737 g002
Figure 3. Monthly observed and simulated discharge and sediment load at the Shenyang Hydrologic Station during the calibration (1979–1990) and validation (1991–2009) periods: (a) calibration and validation for discharge; (b) calibration and validation for sediment load.
Water 14 00737 g003
Figure 4. The variations of discharge and sediment load under different scenarios: (a) discharge variations; (b) sediment load variations.
Water 14 00737 g004
Figure 5. Correlations between the variations of climate variables (i.e., precipitation and temperature) and hydrological variables (i.e., discharge and sediment load) at a monthly scale: (a) correlation between the variations of precipitation and hydrological variables; (b) correlation between the variations of temperature and hydrological variables.
Water 14 00737 g005
Table 1. Model performance for discharge and sediment load simulation at the monthly scale [36].
ElementsIndicatorsVery GoodGoodSatisfactoryUnsatisfactory
DischargeR2R2 > 0.850.75 < R2 ≤ 0.850.60 < R2 ≤ 0.75R2 ≤ 0.60
NSENSE > 0.800.70 < NSE ≤ 0.800.50 < NSE ≤ 0.70NSE ≤ 0.50
PBIAS (%)PBIAS < ±5±5 ≤ PBIAS < ± 10±10 ≤ PBIAS < ± 15PBIAS ≥ ±15
Sediment loadR2R2 > 0.800.65 < R2 ≤ 0.800.40 < R2 ≤ 0.65R2 ≤ 0.40
NSENSE > 0.800.70 < NSE ≤ 0.800.45 < NSE ≤ 0.70NSE ≤ 0.45
PBIAS (%)PBIAS < ±10±10 ≤ PBIAS < ±15±15 ≤ PBIAS < ±20PBIAS ≥ ±20
Table 2. Calibrated parameters for discharge and sediment load at the Shenyang Hydrologic Station.
ParameterDefinitionRangeSensitivity
Rank
Optimal
Parameters used to calibrate discharge
v GW_DELAY.gwGroundwater delay time (day)0–500118.8
v ALPHA_BNK.rteBaseflow alpha factor for bank storage (day)0–120.58
r CN2.mgtSCS runoff curve number for moisture condition II35–9830.21
r SOL_K.solSoil conductivity (mm/h)0–200040.004
v ALPHA_BF.gwBaseflow alpha factor (day)0–150.86
v ESCO.hruSoil evaporation compensation factor0.01–160.76
Parameters used to calibrate sediment
v PRF.bsnPeak rate adjustment factor for sediment routing in the main channel0–211.45
v SPCON.bsnLinear parameters for calculating the channel sediment rooting0.001–0.0120.006
v CH_EROD.rteChannel erodibility factor0–0.630.39
v CH_COV.rteChannel cover factor0–140.25
v USLE_P.mgtUSLE equation support practices (P) factor0–150.48
v SPEXP.bsnExponent parameter for calculating the channel sediment routing1–1.561.44
Notes: r is the current parameter value multiplied by 1 + r, and v indicates that the current parameter value is replaced by the new value.
Table 3. The scenario setup for this study.
ScenariosLand UseClimate
S1Baseline scenario19901980–1990
S2Climate change scenario19901999–2009
S3LUCC scenario20051980–1990
S4Combined scenario20051999–2009
Table 4. Statistics for land use type changes in the HRB during 1980–2009.
Land Use TypeYearArea Change
(km2)
Area Change of
Total Area (%)
19902005
Cropland1884.21887.12.90.04
Forestland5483.15454.3−28.8−0.36
Grassland75.380.24.90.06
Water160.5165.44.90.06
Urban130.8140.79.90.13
Rural land131.8136.74.90.06
Constructed land53.554.51.00.01
Table 5. M-K test results for meteorological and hydrological variables during 1980–2009.
StationsPrecipitationTemperatureDischargeSediment Load
SlopeZpSlopeZpSlopeZpSlopeZp
Xinbin0.2350 0.0432.68**
Qingyuan−2.313−0.93 0.0493.00**
Fushun−0.095−0.04 0.0412.71**
Shenyang0.3170.11 0.0141.00 −0.0040 −5904.8−2.03*
Average−1.63−0.46 0.0372.60**
Notes: ‘*’ indicates significance at p < 0.05; ‘**’ indicates significance at p < 0.01.
Table 6. Model calibration and validation accuracy.
PeriodsEvaluation
Indicators
DischargeSediment Load
Calibration
(1979–1990)
NSE0.790.77
R20.840.78
PBIAS (%)−9.61−2.56
Validation
(1991–2009)
NSE0.770.65
R20.790.65
PBIAS (%)1.488.31
Table 7. Simulated annual discharge and sediment load under four setup scenarios.
ScenariosSimulated
Discharge (m3/s)
Discharge Change (m3/s)Discharge Change (%)Simulated Sediment Load (Tons)Sediment Load Change (Tons)Sediment Load Change (%)
S1 (baseline)47.09350,611
S2 (climate)36.40−10.69−22.69243,305−107,306−30.61
S3 (LUCC)47.120.040.08345,953−4658−1.33
S4 (combined)36.42−10.67−22.65240,134−110,477−31.51
Publisher’s Note: MDPI stays neutral with regard to jurisdictional claims in published maps and institutional affiliations.

