Article

Quantifying Evapotranspiration and Drainage Losses in a Semi-Arid Nectarine (Prunus persica var. nucipersica) Field with a Dynamic Crop Coefficient (Kc) Derived from Leaf Area Index Measurements

1
Energy Environment and Water Research Center, The Cyprus Institute, Aglantzia 2121, Cyprus
2
Cyprus Geological Survey Department, Ministry of Agriculture, Rural Development and Environment, Strovolos 2064, Cyprus
3
Fachbereich Bauwesen, University of Applied Sciences Lübeck, 23562 Lübeck, Germany
*
Author to whom correspondence should be addressed.
Water 2022, 14(5), 734; https://doi.org/10.3390/w14050734
Submission received: 3 February 2022 / Revised: 23 February 2022 / Accepted: 24 February 2022 / Published: 25 February 2022
(This article belongs to the Section Hydrology)

Abstract

:
Quantifying evapotranspiration and drainage losses is essential for improving irrigation efficiency. The FAO-56 is the most popular method for computing crop evapotranspiration. There is, however, a need for locally derived crop coefficients (Kc) with a high temporal resolution to reduce errors in the water balance. The aim of this paper is to introduce a dynamic Kc approach, based on Leaf Area Index (LAI) observations, for improving water balance computations. Soil moisture and meteorological data were collected in a terraced nectarine (Prunus persica var. nucipersica) orchard in Cyprus, from 22 March 2019 to 18 November 2021. The Kc was derived as a function of the canopy cover fraction (c), from biweekly in situ LAI measurements. The use of a dynamic Kc resulted in Kc estimates with a bias of 17 mm and a mean absolute error of 0.8 mm. Evapotranspiration (ET) ranged from 41% of the rainfall (P) and irrigation (I) in the wet year (2019) to 57% of P + I in the dry year (2021). Drainage losses from irrigation (DR_I) were 44% of the total irrigation. The irrigation efficiency in the nectarine field could be improved by reducing irrigation amounts and increasing the irrigation frequency. Future studies should focus on improving the dynamic Kc approach by linking LAI field observations with remote sensing observations and by adding ground cover observations.

1. Introduction

Water plays a key role in agricultural production and food security. Irrigated agriculture represents 20% of the total cultivated land and contributes 40% of the total food produced worldwide [1]. It is estimated that agricultural production will need to expand by approximately 70% by 2050 due to population growth which, combined with projected water scarcities, is a key challenge for water management in agriculture [1]. Quantifying actual crop water consumption and drainage losses is essential in order to improve irrigation efficiency.
The island of Cyprus, located within the eastern Mediterranean and Middle East region, has been historically exposed to high temperatures and droughts, which have intensified in recent decades. According to climate model projections, extreme climate phenomena (droughts, floods, dust events) are expected in this region, which has been identified as a climate change hot spot [2,3,4]. These phenomena will have a serious impact on various sectors, such agriculture and water management [5,6]. Monitoring water balance components in agricultural sites is essential for optimizing irrigation and minimizing drainage losses.
The most widely used method for calculating irrigation demand is based on the water balance approach proposed in FAO-56 [7]. This method computes the crop evapotranspiration (ETc) by multiplying the reference evapotranspiration (ET0) with a crop coefficient (Kc), adjusted for each crop. The ET0 is computed from meteorological data with the use of the Penman–Monteith equation. Various methods have been developed for the estimation of Kc, such as the use of spectral remote sensing images, measurements of plant canopy parameters, weighing lysimeters, eddy covariance systems and sap flow sensors [8,9,10,11,12,13]. All these methods have their limitations (specific calibrations, resource intensive, coarse spatial or temporal resolution). Standard Kc values, which can be found in the literature, are usually assigned for each crop growth stage. The advantage of these segmented Kc values is that it requires the knowledge of only three values (initial stage, midseason and at harvesting or end season) [14]. However, Kc values can deviate from the tabulated values due to different planting densities and agronomic practices [15].
Several studies have shown that the seasonal course of Kc is positively related to the leaf area index (LAI) [15,16,17]. The LAI, which is the amount of leaf area per unit ground area, determines the amount of light intercepted by a canopy and is a key variable in mass (water and carbon) and energy (radiation and heat) exchange between the biosphere and the atmosphere [18,19,20,21]. The relation between Kc and LAI has an obvious physical basis, where relatively greater plant leaf surface area leads to greater total bulk stomatal surface and conductance; thus, more water vapor can be diffused from the leaves as transpiration [15]. However, only a small number of studies derive Kc as a function of LAI (e.g, [22,23,24]). Allen and Pereira [23] expressed the increase in Kc as a function of the increase in the amount of vegetation with the use of a density coefficient, which was computed as an exponential function of LAI. They obtained Kc estimates for various crops that were similar to those in the literature. However, they reported that orchard crops can vary widely with respect to plant spacing, tree pruning, and age, and thus the relationship between Kc and LAI for these crop types is not singular. According to Netzer et al. [24], the relationship between LAI and Kc can serve as a tool for the estimation of Kc in situations in which LAI can be measured directly and can be used for precision irrigation.
Different values and seasonal trends of Kc for Prunus persica trees have been reported in the literature [25,26,27,28]. These studies were conducted with trees planted in weighing lysimeters. Zambrano-Vaca et al. [28] performed regular measurements (3-week interval) of the projected canopy area for the determination of Kc and reported that these measurements allow the seasonal adjustment of irrigation scheduling, and thus water stress or over-irrigation of young peach trees is avoided. However, Girona et al. [29] showed that the soil water uptake by Prunus persica trees in lysimeters differs from the soil water uptake by trees outside them during irrigation treatments due to differences in the root architecture. There is a knowledge gap on the derivation of Kc values from frequent plant observations of Prunus persica in field conditions.
The seasonal course of Kc has a great effect on the evapotranspiration estimates and subsequently on the quantification of the water balance components. Thus, there is a need to increase the temporal resolution of LAI measurements in order to capture the dynamic changes of the canopy cover of crops and thus the dynamic changes of the Kc. The main objective of this paper is the introduction of a dynamic crop coefficient (Kc) approach based on in situ LAI measurements, soil moisture and meteorological observations to provide robust computations of the water balance components of irrigated fields. The study was conducted in a nectarine field in Cyprus between 22 March 2019 and 18 November 2021.

2. Materials and Methods
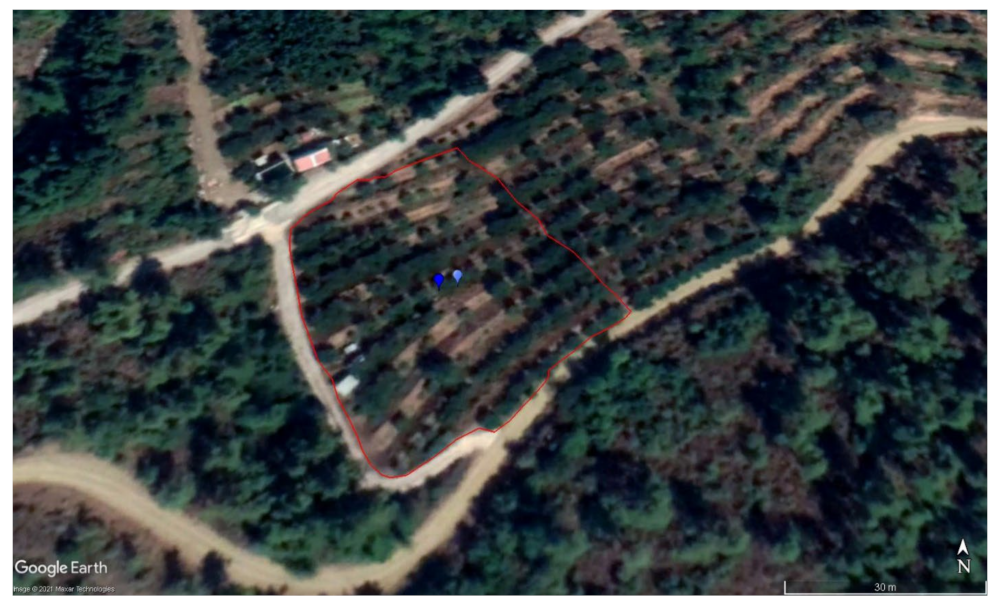
2.1. Study Site

The study site is situated 1.8 km southwest of Galata village (Cyprus), at an elevation of 800 m (Figure 1). Long-term average annual rainfall (1980/81-2009/10) for the site, computed from the 1 km gridded rainfall data of Cyprus is 650 mm [30]. Reference evapotranspiration for this period, computed with the Hargreaves equation, was 1250 mm.
The terraced field is cultivated with nectarine trees (Prunus Persica var. nucipersica, cultivar “Fairlane”) and covers an area of approximately 2500 m2. There is one tree row per terrace, with an approximate planting distance of 4 m. The total number of trees in the field is 122. Each tree is irrigated by two drippers, located approximately 1 m west and east from the tree trunks. The maximum rooting depth observed from two 90 cm soil core samples was 80 cm. The geology of the substrate is diabase and gabbroic diabase [31]. The soil texture from 0 to 15 cm depth is classified as sandy loam–loam, from 15 to 30 cm depth as loam, and from 30 to 60 cm depth as clay loam.

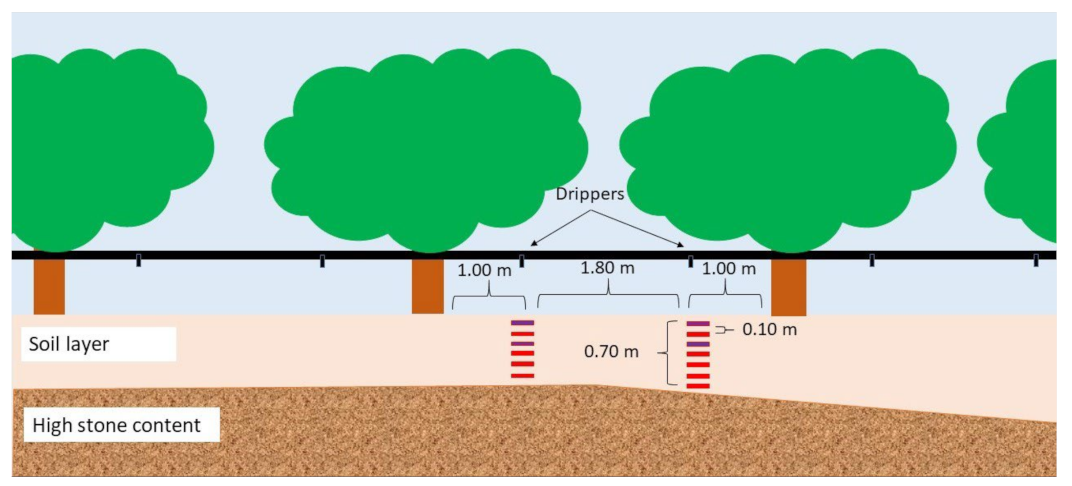
2.2. Water Balance and LAI Monitoring

We installed 13 soil moisture sensors (5TM, Decagon), 4 soil water potential sensors (TEROS 21, Meter group), an automatic rain gauge (Lambrecht), a weather station (WS501, Lufft) and two manual rain gauges (ClimeMET). We installed the manual rain gauges on 4 January 2019, the automatic rain gauge and the datalogger on 11 January 2019 and the meteorological station, the soil moisture and the soil water potential sensors on 18 January 2019. We selected two soil depth profiles for the soil moisture sensors’ installation (Figure 2). Each profile is at 1 m distance from the stem of the closest tree and the distance between the two profiles is 1.8 m. We installed seven soil moisture sensors in the first (east) soil profile, at 10 cm depth intervals (10–70 cm). Due to the high stone content at deeper depths, we installed six sensors (10–60 cm) in the second (west) soil profile. The soil water potential sensors were installed at 10 and 30 cm depths in each profile. All the sensors are connected to a data logger (NetDl 500, OTT Hydromet GmbH, Kempten, Germany) powered by a 12 v battery and a solar panel. The station became fully operational on 22 March 2019.
Leaf Area Index (LAI) and canopy gap fraction (p) of the two monitored trees were measured with a plant canopy analyzer (LAI-2200C, Li-Cor Bioscience, Lincoln, NE, USA) from 2 April 2021 to 3 December 2021, on a biweekly basis. We placed the instrument’s optical sensor above the main tree trunk and below the canopy of each monitored tree and measured LAI at four different azimuths, with the use of 90° viewing cap. Similarly, the above canopy measurements were taken at the same azimuths. The sensor projects the image of hemispheric view onto five detectors (rings) arranged to measure the brightness at different zenith angles (7°, 23°, 38°, 53°, 68°). The instrument calculates the gap fraction (p) as the interception of the blue light (320–490 nm) at the five zenith angles (θ) from the radiation readings (Rad) taken above canopy (AC) and below the canopy (BC). The canopy cover fraction (c) of the two trees was computed as 1-p. LAI was computed from p(θ) according to the procedures of LI-COR Inc. [32] as:
L A I = 2 0 π 2 ln p θ cos θ sin θ d θ
where p(θ) is the gap probability (fraction) at zenith angle θ, computed as the fraction of the radiation measured below and above the canopy (Rad(BC)/Rad(AC)).
Irrigation (I) of the entire field was measured by a flow meter (m3) connected to the main irrigation line, which was recorded on a biweekly basis from 2 April 2021 to 3 December 2022. Irrigation per unit area (mm) was computed by dividing the flow meter measurements with the field area (2500 m2). Irrigation applications, which were generally applied weekly, were computed from the number of positive hourly soil moisture changes of each irrigation day. For the irrigation days where no irrigation data were available (before 2 April 2021), we multiplied the average irrigation per hour (7.9 mm h−1) with the number of irrigation hours of each day.

2.3. Water Balance Computations

Daily water balance components were calculated for the 80 cm soil root zone from 22 March 2019 to 18 November 2021. Soil moisture of the root zone was calculated assuming that the sensors located at 10 and 70 cm depths represent a soil layer thickness of 15 cm and sensors located at 20, 30, 40, 50 and 60 cm depths represent a soil layer thickness of 10 cm. The sensors are assumed to represent the soil moisture of the field area during the rainfed period and the wetted area (WA) of the irrigation drippers during the irrigated period.
The daily evapotranspiration estimated from the crop coefficient approach (ETa_Kc) was computed as:
E T a _ K c = K m a x E T o     for   P     K m a x E T o  
E T a _ K c = max K s K c E T o , P   for   P < K m a x E T o  
where Kmax is the maximum crop coefficient, Ks is the crop stress coefficient, Kc is the crop coefficient, ETo is the daily reference evapotranspiration (mm) and P is the daily precipitation (mm).
The Kmax is defined by Allen et al. [7] as:
K m a x = 1.2 + 0.04 u 2 0.004 R H 45 h 3 0.3
where u is the mean value for daily wind speed (0.68 m s−1), RH the mean value for daily minimum relative humidity (33%) and h is the tree height (3 m).
The Ks was computed according to Allen et al. [7] as:
K s = S M S M w p T A W R A W         for   S M p s > S M > S M w p
where SM is the measured soil moisture (mm), SMwp is the soil moisture at wilting point (mm), TAW is the total available water (mm) and RAW is the readily available water (mm). TAW is computed as the difference between the soil moisture at field capacity (SMfc) and at wilting point (SMwp). RAW is computed as psTAW, where ps is the moisture stress coefficient of the trees. The volumetric soil moisture content at the ps threshold is denoted as SMps. The Ks is equal to 1 for an SM value above SMps and equal to 0 for an SM value below the SMwp. The SMfc is defined as the measured SM, 24 h after rainfall events that saturate the soil. The SMwp is equal to the measured SM at a soil water potential of −1500 kPa (theoretical wilting point).
The Kc values were computed as:
K c = K c 1 for I = 0 , W A = 1 , c = 0.25
K c = c K c 2       for   c > 0.25
where Kc1 and Kc2 are the crop coefficients during the leafless (c = 0.25, see Section 3) and full canopy cover (c = 1) periods, respectively.
Drainage losses (DR) were computed with the following equation:
D R = M A X I + W A P W A Δ S M E T a e s t , 0     for   S M i > S M f c   or   S M i + 1 > S M f c
where I is the daily irrigation (mm), WA is the fraction of the field area wetted by irrigation (0–1), ΔSM is the soil moisture change (mm), computed from 00:00 of the current day to 00:00 of the following day (SMi+1 − SMi). The WA is equal to 1 during the rainfed period. The drainage losses after rainfall (DR_P) and irrigation (DR_I) are presented separately in the results section.
The daily evapotranspiration estimated from the water balance (ETa_wb) was computed as:
E T a _ w b = P W A + I Δ S M W A D R
Finally, the error (e) between ETa_wb and ETa_Kc was computed as:
e = E T a _ w b E T a _ e s t
The unknown parameters Kc1, Kc2, WA and ps were derived with a two-step parameter derivation approach. First, we derived the parameter Kc1 for the leafless period, where the WA is equal to 1 and I is equal to 0. This was done by minimizing the sum of the daily errors (∑e_dry) and mean absolute error (MAE_dry), for days without P and without water stress (Ks = 1). Additionally, days with an increase in soil moisture (ΔSM > 0) while P was zero were not included in the parameter derivation. This increase in soil moisture sometimes occurred on days following P, most likely due to lateral soil moisture flows. Secondly, we derived the parameters Kc2, WA and ps for the leafed period by minimizing ∑e_dry and MAE_dry, for days without I, P and ΔSM > 0.
Evapotranspiration of rainfall or residual moisture from the area outside the WA during the irrigation season was computed as the difference between ETa_wb for WA equal to 1 and the ETa_wb for the derived WA value.

3. Results and Discussion

The water balance components of the nectarine trees (Table 1) for the period between 22 March 2019 and 18 November 2021 were computed with the parameter set: Kc1 of 0.69, Kc2 of 0.88, ps of 0.45 and WA of 0.25. We obtained a ∑e_dry of 17 mm and a MAE_dry of 0.8 mm/d with this parameter set. We used a total of 83 days for the leafless period and 540 days for the leafed period with the two-step parameter derivation, after the exclusion of days with I, P and ΔSM > 0.
Most soil moisture sensors remained nearly constant during the high rainfall event (79.8 mm) between 12 March 2020 and 13 March 2020, indicating that the soil was saturated (Figure 3). Twenty-four hours after rainfall had ceased, when hourly soil moisture change and, therefore, drainage around midnight was near zero, the average volumetric soil moisture content was 24%. This value represents the SMfc. The theoretical wilting point (−1500 kPa) was reached by the soil water potential sensors in the east (E) profile only (Figure 4). This occurred at a volumetric soil moisture content (SMwp) of 11% of the soil moisture sensor installed at 30 cm depth (east). This sensor did not show any diurnal variations when it reached −1500 kPa, meaning that transpiration at that point was zero, and thus the wilting point was reached.
The changes in LAI and c of the nectarine trees for the period from 2 April 2021 to 3 December 2021 are shown in Figure 5. LAI during the leafless period was 0.4 (c = 0.26), instead of 0.0 as would be expected. The reason for this is that LAI-2200 measures all sun blocking elements of the tree (both branches and leaves). The leafless period started at the end of November and lasted until the end of March. Then, there was a gradual increase in the number of leaves, and subsequently an increase in LAI and c until early June. The trees remained fully covered with leaves until late October, which was reflected by the minor changes in c (0.85 ± 0.03), which was equal to a LAI of 3.5 ± 0.4. Finally, there was a gradual decrease in LAI and c until the end of November when the trees became leafless. Our visual observations at the site during 2019 and 2020 indicate similar growth pattern of these trees; thus, we assume the same pattern of c for the previous two years too.
In their study on the estimation of crop water stress in nectarine and peach orchards in Victoria (Australia), where average annual P and ETo are approximately 480 mm and 1190 mm, respectively, Park et al. [33] reported a similar seasonal trend in the canopy cover. According to these authors, the rapid change in the canopy cover of nectarine trees occurs early in spring, when the soil water profile is typically full after winter rainfall. Full canopy cover occurs in late spring and remains constant until the commencement of leaf senescence in late autumn.
The seasonal course of the Kc is presented in Figure 6. During the rainy, dormant period when groundcover vegetation is present, Kc for dry days is equal to 0.69. During the initial development of the tree leaves in spring, Kc for dry days is 0.23 and gradually increases to 0.75 during the period with full canopy cover.
The Kc values for peach trees according to FAO-56 [7] range from 0.20 (bare ground–dry soil) to 0.80 (actively growing ground cover) during the leafless period and from 0.90 (no ground cover) to 1.15 (active ground cover) during the full canopy period. The absolute values of Kc computed from the FAO-56 differ from those of this study, but the seasonal trends of Kc are similar. Using evapotranspiration data from lysimeters, Ayars et al. [25] developed linear and cubic fit equations to estimate Kc as a function of time for late-season Prunus persica trees in California (USA). The age of these trees was 3-years during the study period, and they were planted with an in-row spacing of 1.8 m and in between-row spacing of 4.8 m. They found an average Kc of 1.06 between July and August. According to the authors, both equations are suitable for use in irrigation scheduling. However, the cubic equation resulted in negative Kc values in December. Wang et al. [26] applied a piece-wise linear function for computing Kc based on the on the evapotranspiration of Prunus perscica in California (USA) from the lysimeter study of Johnson et al. [27]. The authors reported Kc values of 1.2 during the full canopy cover period. A quadratic fit equation was proposed by Zambrano-Vaca et al. [28] for young Prunus persica trees (1–3 years) in a humid subtropical climate, in Florida (USA). The Kc values ranged from 0.20 during dormancy stage (December–January) to 0.68 during the shoot development stage (August–October). According to the authors, the differences in the Kc of Prunus persica between their study and other studies can be attributed to the different meteorological conditions and the difference in the duration of the crop stages of each location.
The total sum of errors ∑e (including days with P, I and ΔSM > 0) was 8% of the ETa_wb over the three years. The ∑e during the leafed period was −1% of the ETa_wb, but during the leafless period it was much higher, at 36% of the ETa_wb. This was caused by small rainfall events that were not captured by the sensor at 10 cm depth and some larger rainfall events that may have resulted in runoff. The ps value of 0.45 is equal to a volumetric soil moisture content of 18.1% (SMps). The year 2019 was exceptionally wet, with a total P of 1233 mm, of which 537 mm were measured with the manual rain gauges between 4 January 2019 and 22 March 2019, before the start of the water balance computations. Drainage losses resulting from rainfall (DR_P) were 47% of P in 2019, 41% of P in 2020 and 32% of P in 2021. Evapotranspiration from outside the WA during the irrigation season was 136 mm in the wet year (2019), while in the drier years it was 8 mm (2020) and 57 mm (2021).
The lowest I was in 2019 (512 mm). Drainage losses during irrigation (DR_I) were 48% of I in 2019, 47% of I in 2020 and 35% of I in 2021. The number of irrigation events was 18 in 2019, 28 in 2020 and 23 in 2021, and the average interval between irrigations was 10 days in 2019, 7 days in 2020 and 9 days in 2021 (Figure 7). Irrigations began on 1 May in 2019, on 21 April in 2020 and on 24 April in 2021. The initial soil moisture on the day of the first irrigation was 20.5% in 2019, 13.7% in 2020 and 21.4% in 2021. The results showed that the farmer could have started irrigation on a later date both in 2019 and in 2021, as the initial soil moisture in these years was above SMps. In addition to this, there were three irrigation applications in 2019, nine in 2020 and three in 2021 where the initial soil moisture was above SMps. On average, daily I was 28 mm. The results above show that the farmer can apply smaller irrigation volumes in order to minimize DR_I, but more frequently to maintain the soil moisture above the SMps.
The daily ETa_Kc and the daily ETa_wb for the period between 22 March 2019 and 18 November 2021 are presented in Figure 8a. Generally, higher differences between ETa_wb and ETa_Kc were observed on days with rainfall or irrigation (Figure 8b). During the July–September periods, ETa_wb was higher than ETa_Kc, except in 2019. This difference may be due to the lower irrigation applied by the farmer during the very wet 2019 year, compared to 2020 and 2021. This is also reflected by the smaller peaks in the soil moisture during irrigation in 2019 (Figure 7). In November 2019, we can see large differences between ETa_wb and ETa_Kc. In the same period, a sharp decline in the soil moisture was observed, where it reached the SMps. A possible explanation for this difference may be the high growth of the ground cover vegetation after the large rainfall event (110 mm) on 23 October 2019. The effect of the ground cover may also be an explanation for the higher ETa_wb than ETa_Kc in April 2019. The farmer weeded the field earlier in 2021 than in 2020 as shown in Figure 9. The presence of ground cover in April 2019 resulted in the high ETa_wb and in the sharp decline of the soil moisture (Figure 6).
The differences between ETa_wb and ETa_Kc (Table 1) may also be due to rainfall interception, which was not measured in this study. Rainfall interception can be an important water balance component, amounting to 21% of P on a global average [34], whereas 18% was observed in a pine forest near the study site [35]. This percentage varies between different climates and plant types. According to Sadeghi et al. [34], the largest non-disturbance-related differences in relative throughfall typically occur in deciduous trees between the leafed and leafless periods due to large changes in canopy cover fraction. Throughfall during the leafless period can be between 15 and 40% higher than throughfall during the leafed period. In their study on rainfed pomegranate orchards located in an arid environment (P = 214 mm), in Saveh city in Iran, Hakimi et al. [36] examined the partitioning of rainfall across stands with different structural characteristics. Rainfall interception ranged from 10% of P in the dense stand (LAI = 3.19) to 19% of P at the heavily thinned stand (LAI = 2.33). Reductions in LAI, crown length, canopy coverage, and tree height maximize throughfall, but the additional water input may not be available for tree water use. Preferential flow paths in the soil profile and the increased radiation on the soil surface may increase soil evaporation and drainage losses and thereby reduce the water available for the tree.
The production was 1.8 ton ha−1 of fruits (375 boxes of 12 kg) with a variation of ±10 boxes per year. Even though P, I and ET varied between years, the farmer stated that nectarine fruit production was similar (personal communication).

4. Conclusions

The main conclusions drawn from this study are:
  • The use of a dynamic crop coefficient (Kc) approach, based on in situ leaf area index measurements, soil moisture and meteorological observations, resulted in Kc estimates with a bias (∑e_ΔSM < 0) of 17 mm and an MAE_ΔSM < 0 of 0.8 mm, over a three-year observation period in a terraced nectarine orchard in Cyprus.
  • The fraction of rain and irrigation that returned to the atmosphere as evapotranspiration was lower in the wet year 2019 than in the dry years. It was 41% of (P + I) in 2019, 49% in 2020 and 57% in 2021.
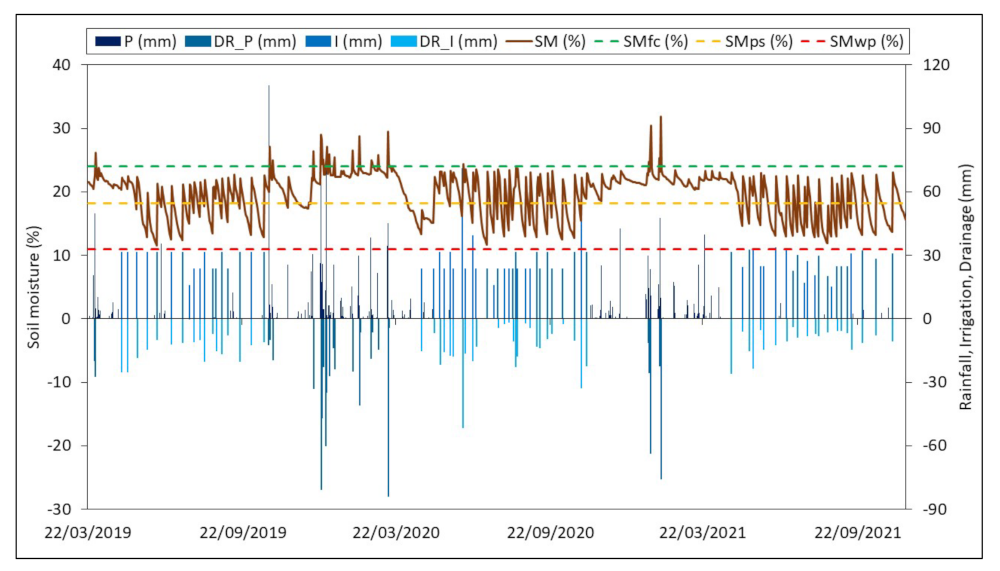
  • Drainage of precipitation from the 80 cm rootzone was 42% of the total rainfall (1574 mm) during the three years. These losses are higher than what would be expected from rainfed agricultural fields and natural ecosystem in this environment, because of the wet conditions of the irrigated field.
  • Drainage losses from irrigation were 44% of the total irrigation (1923 mm) for the three irrigation seasons. The irrigation efficiency in the nectarine field could be improved by reducing irrigation amounts and increasing the irrigation frequency, based on the continuous soil moisture observations.
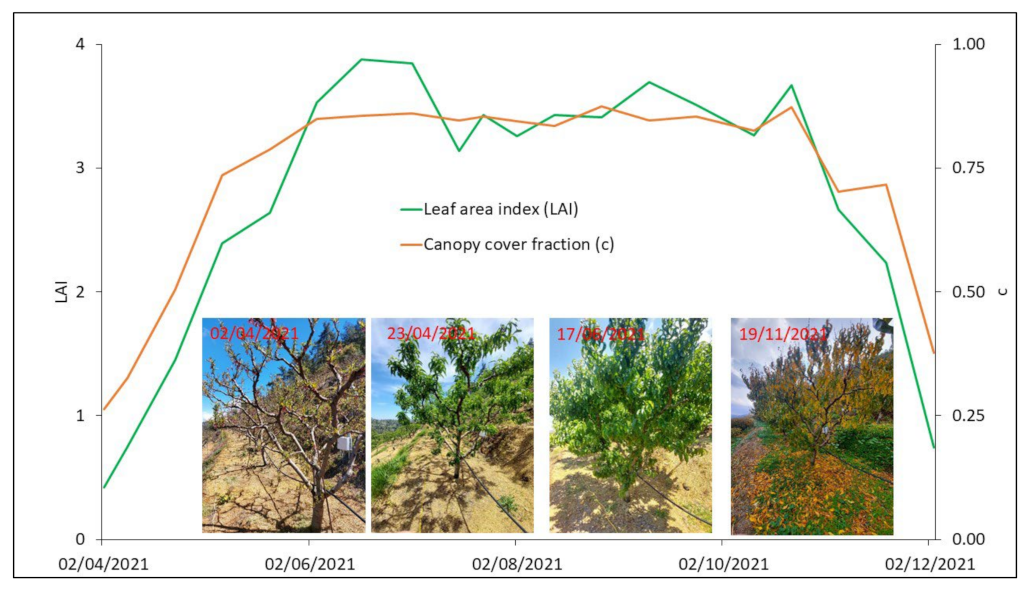
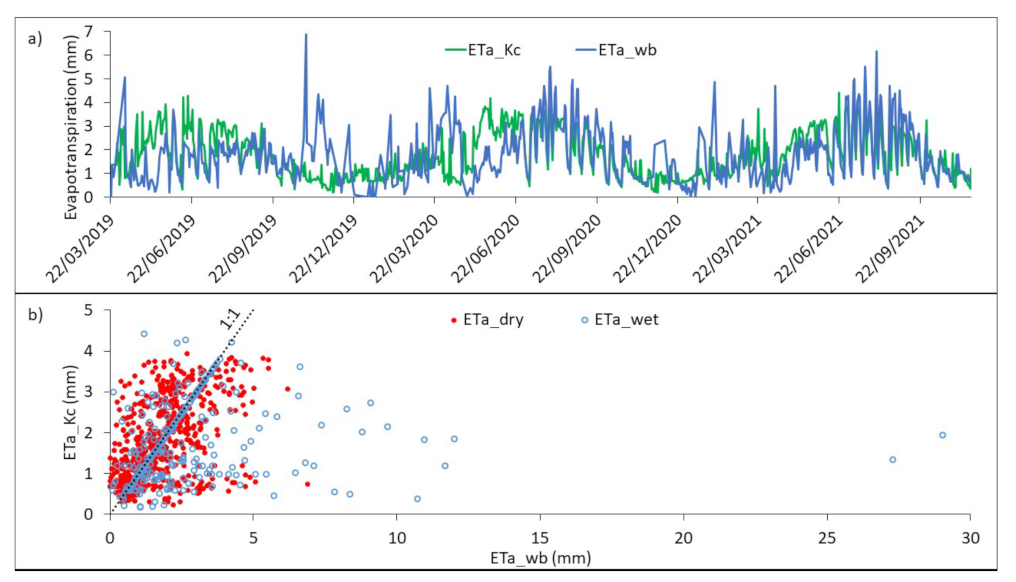
  • The ground cover was not explicitly modeled in the Kc computations in this study. However, soil moisture observations indicated that it had an effect on evapotranspiration, as shown by the differences between ETa_wb in April 2020 and in April 2021.
Observations of the changes in LAI over time provide important information for ecohydrological studies. Future studies should focus on improving the dynamic Kc approach by linking LAI field observations with airborne (drones) and satellite-based observations and by adding ground cover observations.

Author Contributions

Conceptualization, methodology, software, validation, formal analysis: M.E. and A.B.; investigation, resources, data curation: M.E., A.B. and H.D.; writing—original draft preparation, M.E.; writing—review and editing, A.B., H.D., C.C. and C.K.; visualization, M.E. and A.B.; supervision, A.B.; project administration, A.B.; funding acquisition, C.K. All authors have read and agreed to the published version of the manuscript.

Funding

This research was funded by the Republic of Cyprus through the Research and Innovation Foundation, grant number P2P/ERANETMED/0517/0005, ISOMED Project (Environmental isotope techniques for water accounting), as part of the ERANETMED Program.

Institutional Review Board Statement

Not applicable.

Informed Consent Statement

Not applicable.

Data Availability Statement

Data is contained within the article.

Acknowledgments

We would like to express our sincere thanks to Athos Piperides for hosting this study in his field. Additionally, we would like to thank Christos Zoumides, Ioannis Sofokleous and Melpomeni Siakou for their valuable help during field work.

Conflicts of Interest

The authors declare no conflict of interest.

References

  1. The World Bank Water in Agriculture. Available online: https://www.worldbank.org/en/topic/water-in-agriculture#1 (accessed on 24 January 2022).
  2. Lelieveld, J.; Proestos, Y.; Hadjinicolaou, P.; Tanarhte, M.; Tyrlis, E.; Zittis, G. Strongly Increasing Heat Extremes in the Middle East and North Africa (MENA) in the 21st Century. Clim. Change 2016, 137, 245–260. [Google Scholar] [CrossRef] [Green Version]
  3. Zittis, G.; Hadjinicolaou, P.; Fnais, M.; Lelieveld, J. Projected Changes in Heat Wave Characteristics in the Eastern Mediterranean and the Middle East. Reg. Environ. Chang. 2016, 16, 1863–1876. [Google Scholar] [CrossRef]
  4. Zittis, G.; Bruggeman, A.; Lelieveld, J. Revisiting Future Extreme Precipitation Trends in the Mediterranean. Weather Clim. Extrem. 2021, 34, 100380. [Google Scholar] [CrossRef] [PubMed]
  5. Lelieveld, J.; Hadjinicolaou, P.; Kostopoulou, E.; Chenoweth, J.; El Maayar, M.; Giannakopoulos, C.; Hannides, C.; Lange, M.A.; Tanarhte, M.; Tyrlis, E.; et al. Climate Change and Impacts in the Eastern Mediterranean and the Middle East. Clim. Change 2012, 114, 667–687. [Google Scholar] [CrossRef] [PubMed] [Green Version]
  6. Constantinidou, K.; Hadjinicolaou, P.; Zittis, G.; Lelieveld, J. Effects of Climate Change on the Yield of Winter Wheat in the Eastern Mediterranean and Middle East. Clim. Res. 2016, 69, 129–141. [Google Scholar] [CrossRef] [Green Version]
  7. Allen, R.G.; Pereira, L.S.; Raes, D.; Smith, M. FAO Irrigation and Drainage Paper No. 56 Crop Evapotranspiration; Food and Agriculture Organization of the United Nations: Rome, Italy, 1998; Volume 300. [Google Scholar]
  8. González-Altozano, P.; Pavel, E.W.; Oncins, J.A.; Doltra, J.; Cohen, M.; Paço, T.; Massai, R.; Castel, J.R. Comparative Assessment of Five Methods of Determining Sap Flow in Peach Trees. Agric. Water Manag. 2008, 95, 503–515. [Google Scholar] [CrossRef]
  9. Gautam, D.; Ostendorf, B.; Pagay, V. Estimation of Grapevine Crop Coefficient Using a Multispectral Camera on an Unmanned Aerial Vehicle. Remote Sens. 2021, 13, 2639. [Google Scholar] [CrossRef]
  10. Bellvert, J.; Marsal, J.; Girona, J.; Gonzalez-Dugo, V.; Fereres, E.; Ustin, S.L.; Zarco-Tejada, P.J. Airborne Thermal Imagery to Detect the Seasonal Evolution of Crop Water Status in Peach, Nectarine and Saturn Peach Orchards. Remote Sens. 2016, 8, 39. [Google Scholar] [CrossRef] [Green Version]
  11. Ding, J.; Li, S.; Wang, H.; Wang, C.; Zhang, Y.; Yang, D. Estimation of Evapotranspiration and Crop Coefficient of Chinese Cabbage Using Eddy Covariance in Northwest China. Water 2021, 13, 2781. [Google Scholar] [CrossRef]
  12. Carpintero, E.; Mateos, L.; Andreu, A.; González-Dugo, M.P. Effect of the Differences in Spectral Response of Mediterranean Tree Canopies on the Estimation of Evapotranspiration Using Vegetation Index-Based Crop Coefficients. Agric. Water Manag. 2020, 238, 106201. [Google Scholar] [CrossRef]
  13. Zheng, S.; Ni, K.; Ji, L.; Zhao, C.; Chai, H.; Yi, X.; He, W.; Ruan, J. Estimation of Evapotranspiration and Crop Coefficient of Rain-Fed Tea Plants under a Subtropical Climate. Agronomy 2021, 11, 2332. [Google Scholar] [CrossRef]
  14. Pereira, L.S.; Paredes, P.; Hunsaker, D.J.; López-Urrea, R.; Mohammadi Shad, Z. Standard Single and Basal Crop Coefficients for Field Crops. Updates and Advances to the FAO56 Crop Water Requirements Method. Agric. Water Manag. 2021, 243, 106466. [Google Scholar] [CrossRef]
  15. Pereira, L.S.; Paredes, P.; Melton, F.; Johnson, L.; Wang, T.; López-Urrea, R.; Cancela, J.J.; Allen, R.G. Prediction of Crop Coefficients from Fraction of Ground Cover and Height. Background and Validation Using Ground and Remote Sensing Data. Agric. Water Manag. 2020, 241, 106697. [Google Scholar] [CrossRef]
  16. Scott, R.L.; Biederman, J.A. Partitioning Evapotranspiration Using Long-Term Carbon Dioxide and Water Vapor Fluxes. Geophys. Res. Lett. 2017, 44, 6833–6840. [Google Scholar] [CrossRef]
  17. Wei, Z.; Yoshimura, K.; Wang, L.; Miralles, D.G.; Jasechko, S.; Lee, X. Revisiting the Contribution of Transpiration to Global Terrestrial Evapotranspiration. Geophys. Res. Lett. 2017, 44, 2792–2801. [Google Scholar] [CrossRef] [Green Version]
  18. Yan, G.; Hu, R.; Luo, J.; Weiss, M.; Jiang, H.; Mu, X.; Xie, D.; Zhang, W. Review of Indirect Optical Measurements of Leaf Area Index: Recent Advances, Challenges, and Perspectives. Agric. For. Meteorol. 2019, 265, 390–411. [Google Scholar] [CrossRef]
  19. Breda, N.J.J. Ground-Based Measurements of Leaf Area Index: A Review of Methods, Instruments and Current Controversies. J. Exp. Bot. 2003, 54, 2403–2417. [Google Scholar] [CrossRef]
  20. Parker, G.G. Tamm Review: Leaf Area Index (LAI) Is Both a Determinant and a Consequence of Important Processes in Vegetation Canopies. For. Ecol. Manage. 2020, 477, 118496. [Google Scholar] [CrossRef]
  21. Iio, A.; Hikosaka, K.; Anten, N.P.R.; Nakagawa, Y.; Ito, A. Global Dependence of Field-Observed Leaf Area Index in Woody Species on Climate: A Systematic Review. Glob. Ecol. Biogeogr. 2014, 23, 274–285. [Google Scholar] [CrossRef]
  22. Beeri, O.; Netzer, Y.; Munitz, S.; Mintz, D.F.; Pelta, R.; Shilo, T.; Horesh, A.; Mey-tal, S. Kc and LAI Estimations Using Optical and SAR Remote Sensing Imagery for Vineyards Plots. Remote Sens. 2020, 12, 3478. [Google Scholar] [CrossRef]
  23. Allen, R.G.; Pereira, L.S. Estimating Crop Coefficients from Fraction of Ground Cover and Height. Irrig. Sci. 2009, 28, 17–34. [Google Scholar] [CrossRef] [Green Version]
  24. Netzer, Y.; Yao, C.; Shenker, M.; Bravdo, B.A.; Schwartz, A. Water Use and the Development of Seasonal Crop Coefficients for Superior Seedless Grapevines Trained to an Open-Gable Trellis System. Irrig. Sci. 2009, 27, 109–120. [Google Scholar] [CrossRef]
  25. Ayars, J.E.; Johnson, R.S.; Phene, C.J.; Trout, T.J.; Clark, D.A.; Mead, R.M. Water Use by Drip-Irrigated Late-Season Peaches. Irrig. Sci. 2003, 22, 187–194. [Google Scholar] [CrossRef]
  26. Wang, D.; Zhang, H.; Gartung, J. Long-Term Productivity of Early Season Peach Trees under Different Irrigation Methods and Postharvest Deficit Irrigation. Agric. Water Manag. 2020, 230, 105940. [Google Scholar] [CrossRef]
  27. Johnson, R.S.; Williams, L.E.; Ayars, J.E.; Trout, T.J. Weighing Lysimeters Aid Study of Water Relations in Tree and Vine Crops. Calif. Agric. 2005, 59, 133–136. [Google Scholar] [CrossRef] [Green Version]
  28. Zambrano-Vaca, C.; Zotarelli, L.; Beeson, R.C.; Morgan, K.T.; Migliaccio, K.W.; Chaparro, J.X.; Olmstead, M.A. Determining Water Requirements for Young Peach Trees in a Humid Subtropical Climate. Agric. Water Manag. 2020, 233, 106102. [Google Scholar] [CrossRef]
  29. Girona, J.; Mata, M.; Fereres, E.; Goldhamer, D.A.; Cohen, M. Evapotranspiration and Soil Water Dynamics of Peach Trees under Water Deficits. Agric. Water Manag. 2002, 54, 107–122. [Google Scholar] [CrossRef]
  30. Camera, C.; Bruggeman, A.; Hadjinicolaou, P.; Pashiardis, S.; Lange, M.A. Evaluation of Interpolation Techniques for the Creation of Gridded Daily Precipitation (1  × 1 km2); Cyprus, 1980–2010. J. Geophys. Res. Atmos. 2014, 119, 693–712. [Google Scholar] [CrossRef]
  31. Geological Survey Department of Cyprus. Geological Map of Cyprus. Available online: https://gsd.maps.arcgis.com/apps/View/index.html?appid=e6f54157fe8640cc853df09bf2e75dd72022 (accessed on 1 February 2022).
  32. LI-COR Inc. LAI-2200C Plant Canopy Analyzer: Instruction Manual. Available online: https://www.licor.com/env/support/LAI-2200C/manuals.html (accessed on 1 June 2017).
  33. Park, S.; Ryu, D.; Fuentes, S.; Chung, H.; Hernández-Montes, E.; O’Connell, M. Adaptive Estimation of Crop Water Stress in Nectarine and Peach Orchards Using High-Resolution Imagery from an Unmanned Aerial Vehicle (UAV). Remote Sens. 2017, 9, 828. [Google Scholar] [CrossRef] [Green Version]
  34. Sadeghi, S.M.M.; Gordon, D.A.; Van Stan, J.T. A Global Synthesis of Throughfall and Stemflow Hydrometeorology. In Precipitation Partitioning by Vegetation; Springer: Cham, Switzerland, 2020; pp. 49–70. [Google Scholar] [CrossRef]
  35. Eliades, M.; Bruggeman, A.; Djuma, H.; Christou, A.; Rovanias, K.; Lubczynski, M.W. Testing Three Rainfall Interception Models and Different Parameterization Methods with Data from an Open Mediterranean Pine Forest. Agric. For. Meteorol. 2022, 313, 108755. [Google Scholar] [CrossRef]
  36. Hakimi, L.; Sadeghi, S.M.M.; Van Stan, J.T.; Pypker, T.G.; Khosropour, E. Management of Pomegranate (Punica granatum) Orchards Alters the Supply and Pathway of Rain Water Reaching Soils in an Arid Agricultural Landscape. Agric. Ecosyst. Environ. 2018, 259, 77–85. [Google Scholar] [CrossRef]
Figure 1. The Galata field (red line). The dots indicate the two soil profiles.
Water 14 00734 g001
Figure 2. Soil moisture (red and purple rectangles) and soil water potential (purple rectangles) sensor installations at the two soil profiles.
Water 14 00734 g002
Figure 3. Hourly rainfall, average volumetric soil moisture of the root zone (SM_AV) and average soil moisture for 70 cm (SM70), 60 cm (SM60), 50 cm (SM50), 40 cm (SM40), 30 cm (SM30), 20 cm (SM20), 10 cm (SM10) soil depths.
Water 14 00734 g003
Figure 4. Hourly soil moisture (SM) and soil water potential (WP) at the east (E) and west (W) profile, at 30 cm (30) and 10 cm (10) depths.
Water 14 00734 g004
Figure 5. Changes in leaf area index (LAI) and canopy cover fraction (c) of the Nectarine trees for the period 2 April 2021–3 December 2021. The photos show the changes in the foliage of the nectarine trees over time.
Water 14 00734 g005
Figure 6. Daily crop coefficients for Prunus persica computed as a function of the LAI (Kc f(c)) (current study), from the FAO-56 table (Kc-FAO-56) and as a function of time according to [25] (Kc-A), [27] (Kc-J) and [28] (Kc-ZV).
Water 14 00734 g006
Figure 7. Daily soil moisture at the root zone (SM), rainfall (P), irrigation (I) and drainage losses during the rainfed (DR_P) and irrigation (DR_I) periods. The green, yellow, and red dotted lines indicate the soil moisture at field capacity (SMfc), water stress (SMps), and wilting point (SMwp), respectively.
Water 14 00734 g007
Figure 8. Daily evapotranspiration estimated with the Kc approach (ETa_Kc) and daily evapotranspiration estimated from the water balance (ETa_wb), for the period between 22 March 2019 and 18 November 2021 (a) and ETa_wb vs. ETa_Kc on wet (P > 0, I > 0) and dry days (b).
Water 14 00734 g008
Figure 9. Galata nectarine field on 10 April 2020 (a) and on 9 April 2021 (b).
Water 14 00734 g009
Table 1. Water balance components of the nectarine trees.
Water Balance Components (mm) 2019 *20202021 ^Total
Rainfall (P)6964853921574
Irrigation (I)5127966151923
Drainage from rainfall (DR_P)328198127654
Drainage from irrigation (DR_I)248372218838
Soil moisture change (ΔSM)11−11−47−48
Reference evapotranspiration (ETo)7939889732754
Evapotranspiration estimated from Kc approach (ETa_Kc)4986285711698
Evapotranspiration estimated from water balance (ETa_wb)4867156531853
Sum of Errors (∑e)−138682155
* Measurements began on 22 March 2019, 537 mm rain was measured with the manual rain gauges between 1 January 2019 and 22 March 2019; ^ Measurements ended on 18 November 2021.
Publisher’s Note: MDPI stays neutral with regard to jurisdictional claims in published maps and institutional affiliations.

