
Impact of Climate Change on Hydrometeorology and Droughts in the Bilate Watershed, Ethiopia


1
Earth System Science, Taiwan International Graduate Program (TIGP), Academia Sinica, Taipei 115, Taiwan
2
Graduate Institute of Hydrological and Oceanic Sciences, College of Earth Science, National Central University, Taoyuan 320, Taiwan
3
Arba Minch Water Technology Institute, Department of Meteorology and Hydrology, College of Natural and Computational Sciences, Arba Minch University, Arba Minch P.O. Box 21, Ethiopia
*
Author to whom correspondence should be addressed.
Water 2022, 14(5), 729; https://doi.org/10.3390/w14050729
Submission received: 29 January 2022
/
Revised: 19 February 2022
/
Accepted: 21 February 2022
/
Published: 24 February 2022
(This article belongs to the Special Issue Climate Change Impact on Hydrological Cycle and Water Resources Management)
Abstract
:This study aims to assess the potential impacts of climate change on hydrometeorological variables and drought characteristics in the Ethiopian Bilate watershed. Climate projections under two Representative Concentration Pathways (RCP4.5 and RCP8.5) were obtained from the Coordinated Regional Downscaling Experiment (CORDEX) Africa for the near future (2021–2050) and far future (2071–2100) periods. The Soil and Water Assessment Tool (SWAT) model was applied to assess changes in watershed hydrology with the CORDEX-Africa data. The Standardized Precipitation Index (SPI), Streamflow Drought Index (SDI), and Reconnaissance Drought Index (RDI) were calculated to identify the characteristics of meteorological, hydrological, and agricultural droughts, respectively. Due to a significant rise in temperature, evapotranspiration will increase by up to 16.8% by the end of the 21st century. Under the RCP8.5 scenario, the annual average rainfall is estimated to decrease by 38.3% in the far future period, inducing a reduction of streamflow of up to 37.5%. Projections in reduced diurnal temperature range might benefit crop growth but suggest elevated heat stress. Probabilities of drought occurrence are expected to be doubled in the far future period, with increased intensities for all three types of droughts. These projected impacts will exacerbate water scarcity and threaten food securities in the study area. The study findings provide forward-looking quantitative information for water management authorities and decision-makers to develop adaptive measures to cope with the changing climate.
1. Introduction
Climate change is associated with shifts in average climatic conditions and extreme events likely to impact human and ecological systems [1]. According to the Intergovernmental Panel on Climate Change report (IPCC), the frequency and intensity of heavy precipitation events and daily temperature extremes are expected to increase in the mid-21st century [2]. Based on past studies, the increase in long-term temperature and variability in precipitation in different parts of the world and their impacts on the environment are becoming evident. For example, the pattern of climatic data in East Africa showed a significant increasing trend of maximum and minimum temperatures and a non-significant trend of rainfall from 1981–2016 [3]. A decreasing trend of differences between the maximum and minimum temperatures was observed for 1979–2004 in Kenya and Tanzania due to a substantial rise in the minimum temperature faster than the maximum temperature [4]. On the other hand, rainfall variability and trends studies over the African continent during 1983–2020 designated statistically significant increases in the northern and central regions and no significant change in Africa’s southern and eastern areas [5]. A recent study in the Bilate watershed also reported a considerable rise in temperature with a faster-increasing rate in the minimum temperature than the maximum and a significant decrease in rainfall and streamflow [6,7].
There are inter-regional variations in the magnitude of the impacts of climate change and the relationship between the effects at different levels of temperature increase. Some impact indicators, such as temperature extremes, heatwaves, hydrological changes, floods, and droughts, increase with the global average temperature and show very high regional variabilities. For example, the emergence of hot and humid days is concentrated in South Asia and parts of Africa, and the damaging effects of hot spells to spring wheat remain very rare in Europe and North America, even with 4 °C of warming [8]. These effects of climate change show a disturbance in the global and regional hydrologic cycle. Water resources, which were always limited and unevenly distributed, become regionally/locally scarce under the pressure of water consumption dependent on population growth and climate change. Thus, this intensifies scarcity, shocks, and access inequalities [9].
The frequency and severity of extreme hydrological hazards, floods, and droughts are closely linked to climate change [2,10]. Droughts can result in crop failures, leading to loss of life and livelihood, especially in developing economies [11]. These extreme events have profoundly influenced the African economy [12,13]. Water is an economic good with the attribute of being a necessity [9], so drought-induced scarcity has an augmented impact. Ethiopia is one of these drought-prone countries whose economy is primarily dependent on rain-fed agriculture. Its low adaptive capacity makes it highly vulnerable to climate change and drought [14]. For example, the droughts of 1984 and 2015 had severe impacts on Ethiopia’s agricultural production [15,16].
Climate change impact assessments are based on future climate change scenarios to obtain projected temperature, precipitation, rise in sea level, and other changes [17]. For example, future temperature predictions in the IPCC mid-range scenario show that the average annual temperature in Ethiopia will increase by 2.7–3.4 °C by 2080 compared to the baseline of 1961–1990 [18]. The IPCC regional review on climate change identified three vulnerable sectors in Ethiopia: food security, water resources, and health [19]. Natural hazards have claimed millions of lives and destroyed crops [20] as Ethiopia was highly affected by increased soil erosion [21], reduction in available water [22], and severe droughts [23,24].
Climate change impact studies were conducted in Ethiopia using the outputs of different global climate models (GCMs) as the input data for hydrologic models to evaluate the influence of climate change on hydrology. Previous studies have found conflicting results regarding the likely effects of climate change on river basin hydrology. For instance, some river basins have experienced excess flow, while others have low flow [22,25,26,27]. The trends and magnitude of rainfall projections from different GCM scenarios for East Africa are uncertain, leading to inconsistent streamflow projections. For example, some studies predict an increase in streamflow in the Nile Basin by the end of the 21st century [26,28,29], while others [30,31,32] predict a decline.
Although several studies have assessed the impact of climate change on the hydrology of different Ethiopian regions, only a few have discussed the Rift Valley Lakes Basin, let alone the Bilate watershed. Streamflow is projected to increase in the Hare watershed and Lake Ziway sub-basin in the Rift Valley Lakes Basin in the future [33,34], but decrease in the Kulfo, Shala, Abiyata, and Langano catchments [35,36]. The estimated total population dependent on agriculture in the Bilate watershed is around 2.4 million. The watershed is also known for the highest rural population density in Ethiopia, with about 500 persons/km2 [36,37]. Since the economy in the Bilate watershed is mainly dependent on agriculture with a low adaptive capacity, the area is particularly vulnerable [38], and the sustainability of water resources in the Bilate watershed is worsening due to climate change [39]. Water demand continues to grow because of increased agricultural activities, population growth, and urban water use [35]. Past studies of the impact of climate change on the Bilate watershed’s hydrology were conducted using a single GCM and the Fourth Assessment Report (AR4) emission scenarios [36,38]. However, it is necessary to consider multiple GCM projections with different scenarios to alleviate the uncertainties in climate simulations. Thus, in this study, the Coordinated Regional Downscaling Experiment (CORDEX) Africa dataset is utilized with multiple models and high spatial resolution scenarios. The CORDEX-Africa prioritizes RCP4.5 and RCP8.5 scenarios [40]. An increase in greenhouse gas emissions characterizes RCP8.5, and no climate mitigation target is assumed through the period [41]. In contrast, RCP4.5 is characterized by the stabilization of radiative forcing after 2100 without exceeding the long-run radiative target [42].
Drought is a major problem in any country or climatic zone in which it occurs [43]. The effect of drought on the water cycle and agricultural activities can be significant, especially in regions dependent on rainfall-fed agriculture [44]. Preparation and planning to cope with adverse drought events are subject to its characteristics, such as intensity, magnitude, and duration. These characteristics can be obtained through monitoring and forecasting, usually using drought indices to provide quantitative information to decision-makers [45]. Many weather-related drought indices have been utilized in various climatic conditions for different purposes. Since drought indices have advantages and disadvantages, multiple indices can better characterize drought events instead of applying a single index for drought monitoring [46,47]. Therefore, in the study, drought assessments have been carried out using three drought indices: the Standardized Precipitation Index (SPI), the Streamflow Drought Index (SDI), and the Reconnaissance Drought Index (RDI).
SPI is calculated from a long-time precipitation series for any location [48]. Due to its low data requirements, it has become popular [49,50]. SDI was developed by [51] using the SPI as a base for its calculation to characterize hydrological drought. The RDI has significant advantages over other indices because it includes another meteorological parameter, potential evaporation (PET), apart from rainfall. Moreover, it provides reliable outcomes for agricultural droughts [52]. Thus, the inclusion of PET in the calculation of the RDI enhances its validity in studies aiming at risk assessment in agriculture caused by drought occurrence.
Here, the characteristics of future droughts are analyzed using multiple GCM emission scenarios and hydrological modeling. Climate projections are adopted to provide temperature and rainfall data as inputs of hydrological simulations to obtain streamflow data. Meteorological, hydrological, and agricultural drought characteristics are evaluated using the SPI, SDI, and RDI drought indices. The impact of climate change on drought in different Ethiopian river basins has been assessed in previous studies, for instance, [23] in the Blue Nile Basin and [24] in the Awash Basin of Ethiopia. However, few studies have been conducted in the Rift Valley Lakes Basin, despite the fact that this basin has 15 million stakeholders [53]. To ensure better planning of adaption measures for the future, it is essential to evaluate the impact of climate change on the hydrology and droughts in this area. The study’s main objective is to evaluate the impact of climate change on the hydrology and drought characteristics of the Bilate watershed in two periods, the near (2021–2050) and the far future (2071–2100), in comparison to the baseline period (1986–2005).
We obtained the projected temperature and rainfall outputs of five bias-corrected GCMs under two representative concentration pathways (RCP4.5 and RCP8.5). The streamflow in the Bilate watershed was simulated with a calibrated and validated SWAT model, which is a physically based, semi-distributed, basin-scale hydrologic model. It can be used to predict the impact of watershed management on hydrology, sediment yield, and water quality [54,55]. The climate model data were obtained from the Coordinated Regional Climate Downscaling Experiment’s (CORDEX) African database. Study results are discussed and compared with recent studies [33,34,35,36,38,56,57,58,59,60] in the same and neighboring watersheds. The findings could be helpful with the provision of appropriate adaptation plans for water managers to make timely decisions to deal with the potential impacts of climate change.
2. Materials and Methods
2.1. Study Area
The Bilate watershed is a sub-basin of the Ethiopian Rift Valley Lakes Basin (RVLB). It is located between 6°38′18″ N and 8°6′57″ N in latitude and 37°47′6″ E to 38°20′14″ E in longitude. The Bilate River is the main perennial stream and a primary contributor to Lake Abaya. It flows from the north and rises from the slope of Mount Gurage [36,61]. It has a stream length of 197 km and covers 5518 km2 ranging in elevation from 1176 m to 3328 m asl [36], as shown in Figure 1. The mean annual rainfall in the watershed varies from 916 to 1407 mm/year, and the temperature ranges from 10.9 °C to 30.4 °C. The daily river discharge at the Bilate gauging station is from 3 m3/s to 45.7 m3/s [36,62]. The rainfall pattern can be characterized as bimodal, with one dry season, the Bega (October–January), and two rainy seasons, locally called the Kiremt/main rainy season (June–September) and the Belg/minor rainy season (February–May). Overall, the watershed is characterized by arid and semi-arid climatic conditions. The average annual and seasonal rainfall and temperature variability in the watershed correlate with the altitudinal variations [62]. The seasonal climate is influenced by the Inter-Tropical Convergence Zone (ITCZ) [61]. The Belg and Kiremt seasons are the main crop growing periods, and any climatic variability affects the farmers’ agricultural activities [63].
Land use in the Bilate watershed is dominated by agriculture, with over 90% of land area in the watershed, followed by shrublands which occupy about 6.5%, as illustrated in Figure 2a. With the growth in the population, forests have been transformed into croplands and grazing lands [62]. The study area is characterized by six different soil types, as shown in Figure 2b, the dominant type being Haplic Xerosols that constitute about 43%, followed by Eutric Nitosols, covering 29.5%, then Plinthic Ferralsols, accounting for 27.9%.
2.2. Data
Daily streamflow data from the Bilate gauging station for a period of 20 years (1986–2005), and spatial data including a 30 × 30 m digital elevation model (DEM), as well as soil and land use data collected from the Ministry of Water, Irrigation and Electricity (MoWIE) of Ethiopia, are utilized in our study. The DEM is required to calculate the flow accumulation, stream networks, slope, and watershed delineation [65,66]. The land use–land cover (LULC) dataset is required for hydrological simulations to understand the hydrological processes [67,68]. The meteorological data, such as daily rainfall, maximum and minimum temperatures, relative humidity, solar radiation, and wind speed from 1986 to 2015, are obtained from the Ethiopian National Meteorological Agency (NMA).
2.3. The SWAT Hydrological Model
The Soil and Water Assessment Tool (SWAT) [69,70,71,72,73] is widely used for assessing climate change impacts on hydrological processes because of its computational efficiency for large basins and wide global acceptability [74]. The SWAT model computes water balance components, such as evapotranspiration, runoff, lateral flow, and baseflow at the HRU level. The flows from each HRU are summed for each sub-basin, and the resulting loads are routed via channels, ponds, or reservoirs to the watershed outlet. The hydrologic cycle is computed by the water balance model expressed in equation 1 [54]. The Soil Conservation Service (SCS) curve number approach is applied to compute surface runoff [75], while evapotranspiration is estimated using the Penman–Monteith equation [76]. We implemented a Muskingum routing method for flow routing that models the storage volume as a combination of wedge and prism storage [77]. Thus, we arrived at the following equation:
where t is the time (days); SWt is the final soil water content (mm); SW0 is the initial soil water content on day i (mm); Ri is the amount of precipitation on day i (mm); Qsi, is the amount of surface runoff on day i (mm); Ei is the amount of evapotranspiration on day i (mm); Wi is the amount of water entering the vadose zone from the soil profile on day i (mm); and Qgi is the amount of return flow on day i (mm).
2.3.1. Model Setup
The geographical information system interface, ArcSWAT 2012 [55], was used to set up and parameterize the model. The model was built using hydrometeorological and geospatial (DEM, land use, and soil) data. The DEM was used to delineate the catchment’s boundaries and divide the catchment into sub-catchments. The Bilate watershed was divided into nine sub-basins, then further subdivided into 246 hydrological response units (HRUs), spatially overlaying the land use map, soil map, and slope classes. It was based on user-defined threshold values that limit the number of HRUs in each sub-basin. For this study, land use, soil, and slope that comprise over 10%, 5%, and 5%, respectively, of the subbasin were used for HRU definition. This enabled us to include critical factors in assessing river basin hydrology studies. Because of high topographic variability and to minimize complexity and use manageable data while considering the steepness of the area, five slope classes (0–5%, 5–10%, 10–15%, 15–20%, and >20%) were defined based on literature slope classes of the area [78].
2.3.2. Sensitivity Analysis, Calibration, and Validation of SWAT Model
The Sequential Uncertainty Fitting 2 (SUFI-2) approach was used with the SWAT Calibration Uncertainty Procedure (SWAT-CUP) [79] for sensitivity analysis and model calibration and validation. Twenty years of observed daily streamflow data from the Bilate gauging station were used for the model calibration (1989–2000) and validation (2001–2005). A warm-up period of three years (1986–1988) was employed to help the model reach optimum efficiency. Before the calibration and validation process, it is necessary to determine the most sensitive parameters for a given watershed [55]. Sensitivity analysis is helpful to identify and rank the parameters that have a significant impact on the model output [80]. The parameters used in the calibration and validation of the SWAT model were determined by using a one-at-a-time (OAT) and global sensitivity analysis technique [81].
In the sensitivity analysis procedure, a multiple regression system was used to obtain the statistical value of the parameter sensitivity. A t-test (Student’s t-distribution) and p-value test were applied to calculate the relative significance of each calibrated parameter. A parameter with a large t-Stat value and a small p-value suggests a higher sensitivity [82,83]. During the calibration and validation process, the goodness-of-fit between the simulated and observed streamflow was evaluated through the visual inspection of hydrographs and using three objective functions, the Nash and Sutcliffe simulation (NSE), the root mean square error observation standard deviation ratio (RSR), and the coefficient of determination (R2) [84,85].
2.4. Climate Models and RCPs Emission Scenarios
The climate projections obtained from CORDEX-Africa provided GCM-RCM outputs with a high spatial resolution of 0.44° × 0.44° (~50 × 50 km) resulting from the dynamic downscaling of the fifth Coupled Model Intercomparison Project (CMIP5) [86] using the Rossby Center Regional Atmospheric model (RCA4) developed by the Swedish Meteorological and Hydrological Institute (SMHI). Our study area can be covered by eight grid points, as shown in Figure 3. Further information about CORDEX-Africa can be found on the project website https://www.csag.uct.ac.za/cordex-africa/ (accessed on 7 September 2021) and in [87].
We used the available projected data to evaluate patterns of change in the climate data with a temporal coverage from the baseline period (1986–2005) to 2021–2050 for the near future and 2071–2100 for the far future. Details of the GCM data are provided in Table 1. Since climate model outputs may differ systematically from the observed data, bias correction techniques are often applied to adjust the mean and distribution of downscaled variables. In this study, rainfall and temperature data were bias-corrected using the power transformation (PT) and variance scaling (VARI) methods [88,89] to ensure that the coefficient of variation and the mean of the model output were in line with the corresponding statistics of the observed data [90].
2.5. Drought Analysis
To reduce the negative impact of drought, it is crucial to predict magnitude and duration in a specific period using drought indices and numerical indicators [91,92]. We applied three primary indices, SPI, SDI, and RDI, to assess the characteristics of meteorological, hydrological, and agricultural droughts, respectively. A 12-month evaluation time scale was selected because this is the time required for water deficit conditions to affect various agricultural and hydrological systems, especially in arid and semi-arid African and Asian basins [93,94,95]. The analysis also helps to identify the persistence of dry periods [96]. The SPI, SDI, and RDI values were calculated using a specialized software package, the Drought Indices Calculator (DrinC) version 1.7 (91) [97]. The two-step calculation process was the same for all three drought indices. First, a gamma distribution was fitted to the monthly data and then normalized so that the mean value of the new time series was equal to zero over a specified period [98]. A time series of the observed and model-derived rainfall and temperature, along with the streamflow data for the baseline and future periods, were used as input for the Drought Indices Calculator (DrinC) software package.
The SPI calculation involved fitting the gamma probability density function (PDF) to a given precipitation time series. The gamma distribution can be defined by its probability density function as:
where Γ is the gamma function, α is a shape factor, β is a scale factor, and x is the amount of precipitation. The maximum probability for a dataset, α, and β vary according to the following equation:
where denotes the mean precipitation and n is the number of observations. Since the gamma function is undefined when x = 0 and a precipitation distribution may contain zeros, the cumulative probability becomes:
The probability of no precipitation (q) is calculated by dividing m and n as q = m/n, where m is the number of the zero-precipitation in a temporal sequence of data. The H (x) is then transformed into a z score value with mean zero and unit variance, which indicates the value of the SPI [99]. Positive SPI values indicate wet conditions, and negative values indicate a drought.
The RDI was calculated on a time basis of k (months) using the following equation
where Pij and PETij are precipitation and PET of the j-th month of the i-th year, and N is the total number of years of the available data. The normalized RDI (RDIn) is computed as:
where is the arithmetic mean of values. The initial formulation of the standardized RDI (RDIst) [52] uses the assumption that values follow the lognormal distribution, and thus
where is , is the arithmetic mean of and , indicating the standard deviation.
Streamflow Drought Index (SDI) was calculated to characterize hydrological drought [51]. Monthly streamflow (Qij) data is used to investigate wet and dry periods, where i is the hydrological year and j is the month within the hydrological year, then,
where Vik gives the cumulative streamflow volume of k months for the i-th year. For example, the value of k = 3, 6, 9, and 12 can be selected for calculating 3, 6, 9, and 12 months of SDI, respectively. N is the total number of data year. From cumulative flow values, for each k, SDI is defined for the ith hydrological year as below:
where and Sk are the mean value and the standard deviation, respectively, of cumulative streamflow for k months.
A drought event is defined as the period when the SPI, RDI, or SDI values are continuously negative and less than the threshold value of −1.0 for more than two consecutive months. It ends when the indices’ values become positive [48,100]. More negative values indicate more severe conditions. The results for each index can be used to characterize and classify the drought event. The classification varies depending on the impact of the drought on specific systems and factors related to each application, such as study objectives and location. The indices used in drought analysis are classified as: extremely wet conditions (≥2); severely wet (1.5 to 1.99); moderately wet (1.0 to 1.49); near-normal (0.0 to 0.99); mild drought (0.0 to −0.99); moderate drought (−1.0 to −1.49); severe drought (−1.5 to −1.99); and extreme drought (≤−2.0) [52].
Droughts are characterized by drought duration (di), drought magnitude (DM), and drought intensity (DI), as shown in Figure 4 and Equations 10–12 for SPI. It is similar for SDI and RDI. The drought magnitude (DM) is the sum of the negative deviations of SPI, SDI, and/or RDI during a drought event. The average is calculated by dividing by the number of drought events in the study period [101]. DM measures the cumulative water deficit over the drought period [48,102], which can be expressed as follows:
where DM denotes the drought magnitude and n represents the number of consecutive months per drought event. The magnitudes of SDI and RDI are calculated similarly.
The drought intensity (DI) is the ratio of drought magnitude over the drought duration of the drought index (SPI, SDI, or RDI) [103].
where Dd is the average duration of the drought.
The average drought duration is calculated as the mean duration of all drought events as represented in Equation (12) [104].
where di is the duration of the ith drought event in an area, and n is the total number of drought events.
Figure 4.
Definition of drought characteristics based on the SPI index (blue dashed line shows one standard deviation wetter than average, while the red dashed line shows one standard deviation drier than average (modified from [105]).
Figure 4.
Definition of drought characteristics based on the SPI index (blue dashed line shows one standard deviation wetter than average, while the red dashed line shows one standard deviation drier than average (modified from [105]).

The long-term drought projection for the near future (2021–2050) and far future (2071–2100) periods, relative to the baseline period (1986–2005), was analyzed for each RCP. The change in drought characteristics was computed as percentage change from the baseline. These results help us to derive a better understanding of the effect of climate change on droughts in the Bilate watershed, which is helpful for policymakers to develop adaptation strategies.
3. Results
3.1. SWAT Calibration and Validation
For optimization of the SWAT model, sensitivity analysis was conducted using the global sensitivity analysis method in SWAT-CUP, SUFI2, as suggested by Abbaspour [81]. The most sensitive parameters with a larger absolute t-Stat value and a smaller p-value (<0.05) were selected for calibration of the streamflow. The results showed the curve number (CN2), soil evaporation compensation factor (ESCO), maximum canopy storage (CANMAX), threshold depth of water in the shallow aquifer required for return flow to occur (GWQMN), deep aquifer percolation fraction (RCHRG_DP), groundwater recession factor (ALPHA_BF), plant evaporation compensation factor (EPCO), and average slope steepness (HRU_SLP) to be the most sensitive parameters.
After identifying these parameters, streamflow calibration and validation were performed using the SWAT-CUP SUFI2 algorithms to evaluate the model’s performance. Despite the fact that some overestimations were observed, the results showed that the overall patterns of monthly streamflows were adequately captured (Figure 5). The statistical analysis results showed the calibration performance obtained with R2 of 0.86, NSE of 0.75, and RSR of 0.50 and the simulation validation period with R2 of 0.88, NSE of 0.79, and RSR of 0.44. The simulated streamflow results show good agreement with the observed streamflow, indicating that the SWAT model can be used to simulate the streamflow at the catchment outlet with reasonable accuracy.
3.2. Climate Change Impact Assessment
3.2.1. Baseline Hydroclimatic Variables
The monthly average temperatures (maximum and minimum) and GCM rainfall outputs for the baseline period were compared with the observed data. Figure 6 shows the monthly trends of observed maximum and minimum temperatures. They were well captured by the GCM baseline period outputs, with deviations in minimum and maximum temperature generally being less than 0.35 °C (between 0.12–0.35 °C) and 0.5 °C (between 0.12–0.46 °C), respectively. The seasonal pattern for the maximum temperature is naturally different from the pattern for the minimum temperature. For example, the highest maximum temperature (28.8 °C) is in February and the lowest is in July (23.0 °C) (Figure 6a), while the highest minimum temperature is in March (13.1 °C) and the lowest is in November (10.4 °C) (Figure 6b).
We also compared observed rainfall and GCM baseline outputs, as illustrated in Figure 7. Although the adopted models capture the observed monthly rainfall well, there is a deviation between the observed and baseline rainfall. The baselines of the Can-ESM2, IPSL-CM5A-MR, and MIROC5 models show more rainfall than observation in all three seasons, while the CSIRO and MPI-ESM-LR baselines show lower rainfall in the Belg and Kiremt seasons. The most significant discrepancy of 14 mm/month was between the MIROC5 baseline and the July observations, as shown in Figure 7. The most significant deviation in rainfall among all GCMs was obtained for the IPSL-CM5A-MR, and it was more extensive than observed rainfall in all seasons.
As shown in Figure 8, there is a high correlation with a coefficient value of about 0.89 between the baseline monthly streamflows simulated with different GCMs and the observed streamflow. However, there is a discrepancy between the observed and baseline period. The greatest difference is 7.8 mm/month for November, obtained with the MIROC5 model, followed by 7.3 mm/month for March with the IPSL-CM5A-MR. The simulated streamflows with CanESM2 and IPSL-CM5A-MR for the baseline period are greater than the observed values, but with CSIRO, it is lower than the observed values, except for January. Furthermore, the simulated streamflow with MPI-ESM-LR was lower than the observed streamflow in the Kiremt and Bega seasons. The larger simulated streamflows in the baseline period given by CanESM2, MIROC5, and IPSL-CM5A-MR could be due to the more significant rainfall than the observations.
3.2.2. Climate Change Impacts on Hydroclimatology
- A.
- Maximum and Minimum Temperatures
All GCMs indicated a projected increase in both monthly minimum and maximum temperatures in both the near (2021–2050) and far future (2071–2100) (Figure 9, Figure 10, Figure 11 and Figure 12). Modeling results showed increases in temperature from 0.2–5.8 °C, with higher increases in both the maximum and minimum temperatures in 2071–2100 than in 2021–2050. A comparison shows that the IPSL-CM5A-MR gives the most significant projected maximum temperature increase for the near future period of 3.7 °C (i.e., March) and for the far future period of 4.8 °C (i.e., February and March) in the RCP8.5 scenarios (Figure 9 and Figure 10). A previous study in the Lake Ziway watershed also reported that IPSL-CM5A-MR projected higher mean temperatures than the other three models [34]. On the other hand, in this study, CanESM2 and MIROC5 gave the lowest projected near future increase with a maximum temperature of 0.2 °C for October and July under the RCP4.5 scenarios. The lowest projected increase in maximum temperature was for the Kiremt season, and the highest the Belg. This indicates that the projected seasonal pattern for the maximum temperature will be more significant due to the highest increase for the Belg, followed by the Bega, then the Kiremt, indicating warmer in warm seasons and colder in cold seasons.
The IPSL-CM5A-MR under RCP8.5 projects the highest rise in minimum temperature for the far future periods of 5.8 °C. (in March) and 5.6 °C (in February). It also projects the largest increase in the minimum temperature of the near future of 4.0 °C and 4.5 °C under RCP4.5 and RCP8.5, respectively. The CSIRO under RCP8.5 likewise shows one of the most significant minimum temperature increases for the near future of 4.3 °C (in March). On the other hand, CSIRO projects the lowest upward change in the minimum temperature of the near future, under RCP4.5, of 0.3 °C (in November and December). The lowest projected increase for the far future is given by the MIROC5 model of 1.1 °C under RCP4.5 (in November). The minimum temperature increase in the Belg season (February to May) is higher than in the Kiremt (June to September) and Bega (October to January) seasons. The lowest projected change in increase in the minimum temperature is in the Bega (Figure 11 and Figure 12).
The overall results showed that the increasing change in the minimum and maximum temperatures under RCP8.5 exceeded that of RCP4.5. This occurred because RCP8.5 is a high emission scenario (i.e., more greenhouse gases) than RCP4.5 [41]. In addition, we generally found increases in the minimum temperatures to be more significant than increases in the maximum temperatures in both periods. The growth of average monthly mean maximum and minimum temperature projections obtained with the five models is consistent with previous Rift Valley Lakes Basin studies. For example, the HadCM3 model projections for the far future period for the Ziway watershed in the Rift Valley Lakes Basin under the A2a scenario showed a rise in maximum and minimum temperatures of 3.6 °C and 4.2 °C, respectively [56]. The mean change in the maximum (minimum) temperature for the Central Rift Valley sub-basin for the period 2041–2070 obtained for all five GCMs shows increases of 1.73 °C (2.16 °C) and 2.36 °C (3.07 °C) under RCP4.5 and RCP8.5, respectively [57]. Furthermore, a study of the Lake Chamo catchment area using a single climate model predicted an increase of the maximum (minimum) temperature of 0.1 °C to 2.8°C (0.2 °C to 2.8 °C) in the far future [58]. This projected temperature increase is consistent with the IPCC 2001 report predicting a probable rise in the global mean temperature of 6.4 °C in the next 100 years [106].
The change in the global diurnal temperature range, DTR (Tmax − Tmin), is a valuable indicator of climate change. The decrease of global DTR is attributed to a faster increase in the global minimum land-surface air temperatures than the maximum temperature [107,108]. To investigate the implications of the uneven warming rate between the minimum and maximum temperatures, we further examined the DTR in the Bilate watershed using the means of the five GCMs for the baseline and future periods, as shown in Figure 13. The findings show that the DTR will be smaller in the Kiremt and late Belg in the projected period than in the baseline period under all scenarios, and only slightly different in the early Belg season. The projected DTR is larger than the baseline in November and December, with the tipping point being in October. The smaller estimated DTR might be because of a faster increase in minimum temperature than the maximum in the projected period and vice versa. The DTR from June to August, under both emission scenarios, would be much smaller in the far future period than in the near future period. There is no significant difference among DTRs in other months between different projections.
- B.
- Rainfall
Percentage changes in projected rainfall on a seasonal and annual basis for the near and far future periods are illustrated in Figure 14. The projections mostly show an increase in the Bega season and a decrease in the Belg and Kiremt seasons. The reduction in projected annual rainfall ranges between 6.5% (MPI-ESM-LR-RCP4.5) in the near future to 38.3% (CanEMS2-RCP8.5) in the far future. Seasonal projections obtained with CanESM2-RCP8.5 show the most significant decreases in the Belg (55.2%) and Kiremt (51.5%) seasons. The lowest seasonal reductions of 8.5% in the Belg and 11.2% in the Kiremt season were obtained with MPI-ESM-LR-RCP4.5. In contrast, the highest increases in the Bega were obtained under RCP8.5, 34.9% in the near future, and 48.6% in the far future.
The overall results indicated that in most GCM runs, the decline in the far future was more significant than in the near future. It is understood that changes in annual rainfall can mainly be attributed to changes during the Belg and Kiremt seasons. Even though there was a difference in magnitude, our findings exhibited consistency in the percentage increases or decreases in the annual and seasonal rainfall for all GCMs in the near and far future periods. Previous studies of nearby watersheds predicted a decrease in projected rainfall. For instance, the annual average projected rainfall in the Central Rift Valley sub-basin with an ensemble of five models would decrease by 7.97% and 2.55% for 2041–2070 under RCP4.5 and RCP8.5, respectively [57]. By the end of the 21st century, RCP4.5 predicts that the Meki watershed can expect a decrease of 32.8%, while a reduction of 25.6% is predicted under RCP8.5. Furthermore, a single model predicts that the annual rainfall in the Chamo catchment in the Rift Valley Lakes Basin will likely decrease by 10% [58].
- C.
- Evapotranspiration
The results of the current study reveal an increase in evapotranspiration by both emission scenarios. The increase is associated with the higher estimated temperature rise (Figure 9, Figure 10, Figure 11 and Figure 12). Figure 15 shows a consistent rise in the average annual and seasonal evapotranspiration rates for all scenarios. The estimated increase in the annual average ranges from 6.3–14.8% and 8.9–16.8% for RCP4.5 and RCP8.5, respectively. The projected seasonal change in the near future ranges from 2.6% in the Kiremt for MIROC5 under RCP4.5 to 16.3% in the Belg for IPSL-CM5A-MR under RCP8.5. In the far future period, the change in evapotranspiration ranges from 6.6%, given by MIROC5 under RCP4.5 during the Kiremt, to 21.3%, obtained by IPSL-CM5A-MR under RCP8.5 during the Belg.
The evapotranspiration results show the most significant increase to be obtained with IPSL-CM5A-MR-RCP8.5 and the lowest rise with MIROC5-RCP4.5 among the five GCMs. The most significant increase is in the Belg season, mainly due to the highest projected rise in temperatures (Figure 9, Figure 10, Figure 11 and Figure 12). The study points out a more significant increase in the far future than in the near future. The decrease in rainfall and increase in evapotranspiration in the Belg and Kiremt seasons would increase the severity of water stress in the area, impacting agricultural activities. Agriculture is highly dependent on climatic variables, such as temperature, rainfall, and relative humidity. Effects of climate change on these variables may induce water scarcity, affect the length of the growing period, crop development, crop evaporation, and the amount of irrigation water, and reduce crop yield [109,110]. It could also result in extreme droughts and loss of live stocks [6].
- D.
- Streamflow
The calibrated and validated hydrological SWAT model was run to obtain streamflow for the baseline, near future, and far future periods for RCP4.5 and RCP8.5 scenarios. A comparison of the percentage change in projected streamflow simulated by the SWAT model under five GCMs to the baseline period is presented in Figure 16. The estimated decrease in average annual streamflow ranges from 8.9% to 26.6% in the near future and from 15.2% to 37.5% by the end of the century. The decrease in annual streamflow during the far future period is more significant than for the near future period. A study of the nearby Lake Ziway catchment area also estimated a projected decline in the average annual streamflow of 23.58% for the near future and 12.75% by the end of the century [56].
In the far future, CanESM2 under RCP8.5 projected the most significant seasonal decreases to occur in the Belg (69.1%) and Kiremt (67.0%) seasons. An estimated minimum seasonal decrease of 23.5% in the Belg and 17.5% in the Kiremt was obtained with MPI-ESM-LR under RCP4.5. In contrast, CanESM2-RCP8.5 gave the highest projected increase in the Bega, 32.4% in the near future, and 44.4% in the far future. The pattern of decrease and increase in the average annual and seasonal streamflow was consistent with the rainfall projections, indicating that a change in streamflow is mainly attributable to changes in rainfall. Increased evapotranspiration and a decrease in streamflow will affect water availability in the watershed as demand increases, especially in the Kiremt and Belg seasons.
3.2.3. Climate Change Impact on Drought Characteristics
This study investigated drought characteristics, including the magnitude, duration, and intensity. Five GCM projections were carried out to calculate the SPI, SDI, and RDI indices using the bias-corrected rainfall, temperature, and streamflow from the SWAT model simulation results for the baseline (1985–2005) and the two future periods (2021–2050 and 2071–2100). The results will help formulate better water resource management policies for the agricultural production perspective in the study area [111].
- A.
- Drought Duration
Drought duration was calculated as the mean duration in months for all drought events in each period. Table 2 shows the average duration of months for meteorological (SPI), hydrological (SDI), and agricultural (RDI) droughts obtained with the five GCMs. Under scenarios RCP4.5 and RCP8.5, the average duration of drought events in the near future and far future is expected to increase in comparison with the baseline. The results indicate that the worst scenario would be in the near future under RCP8.5, which showed average increases of 1.8, 1.8, and 2.32 months with respect to those in the baseline for SPI, SDI, and RDI, respectively. This most significant change in duration was obtained with the CSIRO, MIROC5, and IPSL-CM5A-MR models.
By averaging increases in drought duration of all models, the average increase in drought duration obtained by SPI under the RCP4.5 scenario is 1.38 months in the near future and 1.08 months in the far future than those in the baseline. For the same scenario, SDI gives an increase of about 1.3 months for 2021–2050 and 0.6 months for 2071–2100. RDI also shows a consistent increase under RCP4.5 of 1.6 months for the near future and 1.4 months for the far future periods. In general, increases in drought duration in the far future are less than those in the near future under the RCP4.5 scenario. Under the RCP8.5 scenario, SPI predicts average increases in the drought duration of 1.8 months and 1.74 months in 2021–2050 and 2071–2100, respectively. For SDI, the average increase is 1.8 months in 2021–2050 and 1.02 months in 2071–2100. The RDI estimates average increases in the drought duration of 2.32 months and 2.02 months for 2021–2050 and 2071–2100, respectively. Similar to those in RCP4.5 projections, increases of drought duration in the far future are less than those in the near future under the RCP8.5 scenario. The findings indicate that future droughts will be longer lasting than the baseline regardless of the RCP, and the worst case will be in the near future. Our result is consistent with the study in Jordan that indicates the average drought duration of meteorological, agricultural, and hydrological droughts will be increasing in 2011–2040, 2041–2070, and 2071–2100 for RCP4.5 and RCP8.5 compared to the baseline period (1981–2010) [112]. Similarly, the study in South Korea reported that the projected average drought duration for almost all timescales would constantly increase by the end of 2085 compared to the historical period 1981–2010 [113].
- B.
- Drought Magnitude
The average results of drought magnitude in the Bilate watershed obtained using five climate models are illustrated in Table 3. Future changes in magnitude are described by the percentage of change from the baseline period. Based on the SPI, SDI, and RDI results, the magnitude of droughts in the Bilate watershed can be expected to increase in the future. The results show that climate change leads to a severe deficit in water accumulated in the near and far future. For example, for the near future period, for scenario RCP4.5, the magnitudes of SPI, SDI, and RDI are 29.8%, 24.6%, and 29.9% larger than the baseline, respectively. Under the same scenario, the magnitude in the far future is expected to increase by 57.9%, 40.7%, and 58.6% for the SPI, SDI, and RDI indices, respectively.
Under the RCP8.5 scenarios, the magnitude of meteorological, hydrological, and agricultural droughts will increase by 49.1%, 33.7%, and 52.0% in the near future. In the far future, using the same RCP, drought magnitude increases of 80.4% for meteorological drought and 54.3% for hydrological drought are expected. The magnitude of agricultural drought is projected to increase by 75.9%. The results suggest an even more significant water deficit in the far future than in the near future.
- C.
- Drought Intensity
The impact of climate change on drought intensity can be discussed using the percentage of change between future periods compared to the baseline. The results are illustrated in Table 4. The average drought intensity of the baseline was less for SDI (−1.18) than for SPI (−1.21) or RDI (−1.28). The projected results exhibited a similar pattern to the baseline results, indicating the possibility of larger intensities of meteorological and agricultural droughts than hydrological drought.
The results projected an increase in the average drought intensity in both near future and far future periods, with a more significant increase in the far future under RCP8.5. For example, the average drought intensity determined using the SPI, SDI, and RDI indices in the far future period can be expected to increase by 35.6%, 31.6%, and 28.8% for RCP4.5 and 43.0%, 37.4%, and 34.2% for RCP8.5, respectively. The intensity would be more profound under scenarios RCP8.5 than RCP4.5. These findings suggest that the watershed will be more susceptible to severe drought events in the far future. Our results are consistent with previous studies in different parts of the world, which have found a widespread increase in drought intensity [114,115].
4. Discussion
4.1. Impacts of Climate Change on Hydroclimatology
The Bilate watershed is situated in the arid and semi-arid Ethiopian Rift Valley region, where agriculture and natural resources are especially susceptible to the effects of climate change [116]. The baseline temperature and rainfall estimate from all models are in good agreement with observations in the study area.
- A.
- Temperature
Our analysis for all scenarios projected increases in the maximum and minimum temperatures, ranging from 0.2 °C to 5.8 °C, with the most significant projected change of temperature in the area being in March and February. Previous studies [36,38] have argued for an increasing trend of future temperature in the Bilate watershed. Comparable findings have been reported for nearby areas, such as in the Awash Basin [22], Ziway catchment of Central Rift Valley Basin [117], Omo Ghibe Basin [118], and Jema sub-basin [119] of the Upper Blue Nile Basin. The findings align with the trend of global projections for a mean temperature increase by the end of the 21st century [2,106]. A considerable temperature rise might initiate higher evapotranspiration, amplifying the scarcity of available water and aggravating droughts in the primary farming months in the study area. In addition, the results indicated that the increase in the minimum temperature would be higher than the increase in the maximum temperature. Studies of the Melka Kuntrie sub-basin [74] of the Awash Basin and Jema sub-basin [79] of the Upper Blue Nile Basin reveal similar findings. The findings also indicate significant DTR narrowing in the study area, which might benefit crop growth by reducing chill damage in the watershed [87,88] but suggesting elevated heat stress during future heat waves [120]. In addition, diurnal temperature reduction might increase night respiration, allowing carbohydrate utilization for maintenance rather than growth [121]. The increase in DTR in the study area in November and December is responsible for an increase in nighttime respiration that might decrease crop yield [122].
- B.
- Rainfall
The modeling results suggest that the annual average rainfall will decrease in the near and far future, with a more pronounced decrease in the far future. The projected seasonal rainfall patterns obtained with all selected GCMs show notable seasonality, with rainfall likely to increase in the dry season (Bega) and decrease in the wet seasons (Kiremt and Belg) under all scenarios. The decrease will be more significant during the Belg season than the Kiremt, with the uncertainty being high in the Belg season. A previous study [36] considering only the HadGEM2-ES model for 2016 to 2035 also reported similar seasonality of rainfall in the watershed. A likely decrease in the wet seasons and an increase in the dry season were also reported for Upper Blue Nile Basin [27]. The rainfall in the Jema watershed of the Upper Blue Nile Basin was determined using an ensemble mean of six models, suggesting a decrease in rainfall in all seasons except autumn [119].
In contrast to our findings, larger African river basins reported a less significant increase or decrease in the dry and rainy seasons [123]. For example, the annual rainfall in the Ziway watershed projected by a single model would increase by 9.4% [57]. A study of the Ketar watershed [34] reported an estimated increase in rainfall of 6.4% under RCP4.5 and a decrease of 3.5% under RCP8.5 by the end of the 21st century. This inconsistency of changes in rainfall patterns in Ethiopian river basins might be due to the uncertainty of the projections and the period considered in the analysis. Our findings suggest that there will be a larger rainfall reduction in the future in the Bilate watershed than in other watersheds in the Rift Valley Lakes Basin. The reduction of rainfall accompanied by significant warming during the main crop growing seasons may adversely impact agricultural activities where crop production mainly depends on rain-fed water resources. For example, lack of rainfall during the Belg and Kiremt seasons might delay the planting of crops and decrease productivity. Therefore, instead of only depending on rain-fed agriculture, inhabitants in the Bilate watershed should look for modern irrigation technologies to enhance agricultural production in the area.
- C.
- Evapotranspiration
Analysis of evapotranspiration with the SWAT model showed an increasing tendency of seasonal and annual average evapotranspiration in both near future and far future periods under both RCPs. The increase in the Bilate watershed is associated with a significant temperature rise, resulting in surface water storage depletion. Studies in neighboring basins, such as the Omo-Ghibe Basin [86], Melka Kuntrie, and Keleta sub-basins of the Awash Basin [59,60], also showed consistent growth in evapotranspiration. The IPSL-CM5A-MR under RCP8.5 projected the most significant increase in evapotranspiration among the five models adopted in this study. This increase is associated with the projected significant increase of maximum and minimum temperatures obtained with IPSL-CM5A-MR. The lowest increase was obtained with MIROC5, perhaps related to a smaller change in minimum temperature with this model. This projected increase in evapotranspiration and decrease in rainfall would strengthen the severity of water stress.
- D.
- Streamflow
The simulated streamflow results exhibited a decreasing tendency of the annual average flow for all time horizons under both RCPs. The largest projected decrease in annual streamflow in the watershed at the end of the century would be 37.5%. A study in the adjacent Chamo catchment of the Rift Valley Lakes Basin noted a comparable decrease of the mean annual streamflow of 42.8% at the end of the century compared to the baseline period [58]. The reduction of annual streamflow in the Bilate watershed is associated with a decrease in streamflow in the Belg and Kiremt seasons. The projected seasonal streamflow likely follows the rainfall pattern; it is expected to increase in the Bega and decrease in the Belg and Kiremt. The similarity suggests that future increases and decreases in streamflow will be associated with projected increases and reductions in rainfall. Our findings showed that by the end of the century, the most significant increase in streamflow would be in the Bega (44.4%), and the largest reduction could be in the Belg (69%). A previous study using the HadGEM2-ES model has also projected a similar pattern from 2016 to 2035, except for a reported decrease in the projected streamflow in the 2021–2025 Bega season [36]. Our results are consistent with those from a study made in the Ziway watershed in the RVLB using the HadCM3 model, which indicated an increase of streamflow in the Bega and a reduction in the Belg and Kiremt seasons [56]. With the projected increase in evapotranspiration and decrease in streamflow in the crop growing seasons, water stress in the Belg and Kiremt would increase, affecting water security for agricultural production and other investment sectors. In addition, increasing streamflow in the Bega might increase the danger of flash floods and soil erosion. Therefore, watershed management adaptation strategies should be developed to reduce the adverse effects of climate change on agricultural production, food security, rural development, and natural resource conservation.
4.2. Impact of Climate Change on Drought Characteristics
We analyzed the probability of drought occurrence and average drought intensity (SPI, RDI, SDI) in the Bilate watershed by an ensemble mean of five GCMs for near future and far future periods under two scenarios, RCP4.5 and RCP8.5 (Figure 17 and Figure 18). The probability of drought occurrence from January to December is computed by taking the ratio of the number of years having the drought index value ≤1 to the total number of years in the period [124]. For meteorological drought (SPI), the projections indicated an increase in the probability of drought from the baseline to the future. For example, the likelihood of meteorological drought during the Kiremt (June to September) ranged from 0.10 in the baseline result to 0.16 for the far future period. It reached its maximum (0.19) for the Belg (February to May) in the far future period under RCP8.5 (Figure 17a). This higher chance of occurrence is mainly caused by a significant decrease in projected rainfall. Higher variability of rainfall in the Belg [125] might be another reason. The RDI results showed a similar temporal pattern of drought occurrence to the SPI results (Figure 17c). In addition to reduced rainfall, the high probability of agricultural drought in the Belg may be related to the projected increase in evapotranspiration due to increased temperature. A study of factors influencing a community’s vulnerability to drought shows that the areas most vulnerable to agricultural drought were rainfed farmland and sandy pastures, located in areas with a very high probability of moisture deficiency. This indicates that drought vulnerability is also linked closely to types of land-uses conditions, which might contribute to available water scarcity [126,127,128]. Although the current study took the simplification without considering future LULC changes, it is noted that climate change is likely to have significant impacts on LULC conditions, which is also highly related to socioeconomic developments. Such changes in LULC will further induce feedback on water resources and require proper adaptation measures to support the sustainability of socio-economy developments.
Although the probabilities of hydrological drought showed relatively lower values, from 0.07 for the baseline to 0.14 for the far future period, than those of meteorological and agricultural drought, changes in increased probabilities are comparable among the three types of droughts, showing doubled increases. The results also suggested a similar seasonal pattern for the three kinds of drought with a lower possibility in the Kiremt than in the other two seasons. Our results are reliable with those from studies in the Hare watershed in the RVLB and the Upper Blue Nile Basin, indicating a 0.22 probability of occurrence of meteorological drought in the Belg and 0.16 in the Kiremt [129,130]. The range of drought probability of occurrence seen for different months shows a higher temporal climate variability in the area. A study on drought hazard assessment in the context of climate change for South Korea using the standardized precipitation evapotranspiration index (SPEI) stated a gradual increase in the frequency of drought events by the end of the century. For example, the frequency of drought events for 2085 will increase by 7.6% (SPEI-6) and 18.8% (SPEI-12) for RCP 8.5 [113].
The study findings suggest that climate change impacts on drought occurrence in the Bilate watershed will exacerbate water scarcity in the future. Previous studies confirmed that the watershed is highly susceptible to hydro climatological variability [6] with frequent drought occurrences [125]. We also understand that these droughts will have a longer duration than the baseline period due to climate change. A drought with a longer duration would aggravate soil moisture deficit, disrupting hydrological processes like runoff and intensifying the water shortage. In addition, more frequent drought events might reduce soil fertility, further disrupting agricultural activities [131]. As the Ethiopian economy is primarily dependent on agriculture, any negative impact on crop production could affect food security for the increasing population. Therefore, farmers are recommended to adopt drought-resistant crops to cope with possible droughts and look for additional water sources.
The ensemble averages of drought intensity for the baseline, near future, and far future periods under scenarios RCP4.5 and RCP8.5 are shown in Figure 18. The SPI findings indicate that meteorological droughts will be more intense in both future periods, with the intensity being larger in the Belg than in the Kiremt. The most severe drought intensity in the far future period would occur under RCP8.5, reaching −1.71 to −1.79 from October to May (Figure 18a). Similarly, a study of the upper Blue Nile basin noted that drought risk was three times greater in the Belg than in the Kiremt [132]. The findings for agricultural drought are consistent with those for meteorological drought, with the most significant projected increase of intensity being in the Belg season. The most severe agricultural drought intensity would be −1.69 to −1.79 from October to May (Figure 18c).
Since the Belg is one of the crop growing seasons in this watershed [6], an expected increase in the intensity of droughts might affect the crop growing period. Impacts of drought in the Belg season are more challenging than during the Kiremt due to water shortages in dry seasons often inducing devastating effects to the society [98]. The SDI calculation showed that the projected intensity of hydrological drought in the watershed would increase in all seasons, with the most significant increased intensity during the Belg, up to −1.68 in the far future under RCP8.5 (Figure 18b). A previous study in the Hare watershed of the RVLB noted a comparable maximum intensity of −1.83 and −1.42 for SPI and SDI, respectively [130]. Similarly, a study by [93] using two indices, Standardised Soil Moisture Index (SSMI) and SPI, reported that drought intensity and average drought duration would significantly increase in the future period (2006–2100) compared to the baseline (1900–2005). Besides, they described that more severe drought hazards would appear over a larger area, particularly in southern and eastern Australia.
Assessment of global drought propensity using reformulated standardized precipitation evapotranspiration index (SPEI-PM) also indicated that due to significant increase in temperature and decrease in precipitation, consistent and intensified drought would occur in parts of South America and Africa under RCP2.6, RCP4.5, and RCP8.5 scenarios in the future period (the 2030s, 2050s, 2080s) compared to the baseline (1976–2005) [133]. A study on drought hazard assessment in the context of climate change for South Korea stated that in 2085, a drought would be intensified by 25.5% and 34.2% for RCP4.5 and RCP8.5, respectively, for the standardized precipitation evapotranspiration index (SPEI-6). The SPEI-24 is projected to intensify by 37.3% under RCP 4.5 and 53.3% under RCP 8.5 in 2085 compared to the historical period 1981–2010 [113].
Overall, the change in average intensity of meteorological drought in the Bilate watershed during 2071–2100 under RCP8.5 (42.5%) will be more profound than under RCP4.5 (35.2%). The agricultural drought is projected to increase by 28.4% and 33.8% under RCP4.5 and RCP8.5, respectively. The intensity of hydrological drought is expected to increase by 2071–2100 compared to the baseline period, with 30.9% under RCP4.5 and 36.6% under RCP8.5. These findings reveal that the Bilate watershed will experience a more severe cumulative water deficit and longer-lasting droughts. Previous studies conducted in different parts of the world also suggest an increased risk of drought in the 21st century [134,135]. A reduction of available water could result in water stress, reduced crop yields, hunger, and loss of life and property. Water resource managers should consider the findings and implement appropriate water resource management strategies to deal with water scarcity issues in the future. For example, the early warning system for drought monitoring should be developed with climate outlooks and drought indices proposed in this study. Water infrastructures of reservoirs and water harvesting ponds to store the excess water of rainy seasons should be constructed with irrigation systems.
5. Conclusions
The inhabitants of the Bilate watershed are heavily dependent on rain-fed agriculture for their livelihood, but the hydrology and agriculture in the area are being affected by climate change. The future projections considered in this study were selected based on data availability and capturing the observed data patterns. A calibrated and validated SWAT model was employed to quantify the impacts of future climate variations on the hydrology driven by the five GCMs for the RCP4.5 and RCP8.5 emission scenarios. The SWAT model simulated monthly streamflow in the watershed for two future periods (2021–2050 and 2071–2100) for comparison with the baseline. The impacts of climate change on drought characteristics in the Bilate watershed for the near future and far future periods were further evaluated using three drought indices, SPI, SDI, and RDI.
The maximum and minimum temperatures are expected to rise in the future. The increase in the minimum temperature is predicted to be greater than the increase in the maximum temperature, which would cause a reduction in the DTR. Due to a significant rise in projected temperature, evapotranspiration is anticipated to increase, resulting in water storage depletion. The results of all GCMs considered in this study show that the annual average rainfall over the Bilate watershed is likely to decrease in future periods under both scenarios, RCP4.5 and RCP8.5. The analysis of seasonal change in all five GCM projections indicates a decrease in rainfall in the Kiremt and Belg seasons and an increase in the Bega. The projected patterns of decrease and increase of the average annual and seasonal streamflow percentage change are consistent with the rainfall projections, implying that change in streamflow can mainly be attributed to rainfall. Such a consistent projected decrease of rainfall and streamflow during the crop growing seasons (Belg and Kiremt) suggests that the watershed is most likely to experience water scarcity in the future, which would affect agricultural production. Moreover, the impact of climate change on drought characteristics is analyzed using three drought indices, SPI, SDI, and RDI. The findings indicate that future droughts (under both emission scenarios) would be more severe and long-lasting than for the baseline period.
Residents in the Bilate watershed are quite dependent on surface water availability, such as in rivers and seasonal streams, which can be severely affected by drought resulting from climate change. Therefore, special attention needs to be given to developing water resource management strategies and adapting to climate change to ensure sustainable agricultural production and food security in the study area. In addition, further investigation is recommended to quantify the effects of LULC changes in association with the impacts of climate change for proper utilization of the scarce water resources in the watershed.
Author Contributions
Y.A.O. was responsible for data analysis and writing the draft. M.-H.L. supervised and instructed the analyses of the results and modified the manuscript. All authors have read and agreed to the published version of the paper. All authors have read and agreed to the published version of the manuscript.
Funding
This study was partially supported by the Ministry of Science and Technology, Taiwan: MOST 109-2116-M-008-030; MOST 110-2116-M-008-005.
Institutional Review Board Statement
Not applicable.
Informed Consent Statement
Not applicable.
Data Availability Statement
Data will be available upon request to the authors.
Acknowledgments
We wish to thank the Ministry of Science and Technology, Taiwan (MOST 109-2116-M-008-030; MOST 110-2116-M-008-005). We are also grateful to the National Meteorological Agency of Ethiopia (NMA) for providing the data on temperature and rainfall and the Department of Water, Irrigation, and Electricity (MoWIE) for providing hydrological and spatial data.
Conflicts of Interest
The authors declare no conflict of interest.
References
- Vaghefi, S.S.A.; Mousavi, S.J.; Abbaspour, K.C.; Srinivasan, R.; Yang, H. Analyses of the impact of climate change on water resources components, drought and wheat yield in semiarid regions: Karkheh River Basin in Iran. J. Hydrol. Process. 2013, 28, 2018–2032. [Google Scholar] [CrossRef]
- IPCC Climate Change 2014: Synthesis Report; IPCC: Geneva, Switzerland, 2014; pp. 1–151.
- Gebrechorkos, S.H.; Hülsmann, S.; Bernhofer, C. Long-term trends in rainfall and temperature using high-resolution climate datasets in East Africa. Sci. Rep. 2019, 9, 11376. [Google Scholar] [CrossRef] [PubMed] [Green Version]
- Christy, J.R.; Norris, W.B.; McNider, R.T. Surface Temperature Variations in East Africa and Possible Causes. J. Clim. 2009, 22, 3342–3356. [Google Scholar] [CrossRef] [Green Version]
- Alahacoon, N.; Edirisinghe, M.; Simwanda, M.; Perera, E.; Nyirenda, V.R.; Ranagalage, M. Rainfall Variability and Trends over the African Continent Using TAMSAT Data (1983–2020): Towards Climate Change Resilience and Adaptation. Remote Sens. 2021, 14, 96. [Google Scholar] [CrossRef]
- Orke, Y.; Li, M.-H. Hydroclimatic Variability in the Bilate Watershed, Ethiopia. Climate 2021, 9, 98. [Google Scholar] [CrossRef]
- Lambe, B.T.; Kundapura, S. Analysis of meteorological variability and tendency over Bilate basin of Rift Valley Lakes basins in Ethiopia. Arab. J. Geosci. 2021, 14, 1–22. [Google Scholar] [CrossRef]
- Arnell, N.W.; Lowe, J.A.; Challinor, A.J.; Osborn, T.J. Global and regional impacts of climate change at different levels of global temperature increase. Clim. Chang. 2019, 155, 377–391. [Google Scholar] [CrossRef] [Green Version]
- Zisopoulou, K.; Zisopoulos, D.; Panagoulia, D. Water Economics: An In-Depth Analysis of the Connection of Blue Water with Some Primary Level Aspects of Economic Theory I. Water 2022, 14, 103. [Google Scholar] [CrossRef]
- IPCC. IPCC Climate Change 2007: The Physical Science Basis; Cambridge University Press: New York, NY, USA, 2007; p. 333. [Google Scholar]
- Boko, M.; Niang, I.; Nyong, A.; Vogel, C.; Githeko, A.; Medany, M.; Osman Elasha, B.; Tabo, R.; Yanda, P. Climate change: Impacts, adaptation and vulnerability. Contribution of working group II to the fourth assessment report of the intergovernmental panel on climate change. J. Environ. Qual. 2007, 37, 433–467. [Google Scholar]
- Setegn, S.G.; Rayner, D.; Melesse, A.M.; Dargahi, B.; Srinivasan, R.; Wörman, A. Climate Change Impact on Agricultural Water Resources Variability in the Northern Highlands of Ethiopia. In Nile River Basin; Springer: Dordrecht, The Netherlands, 2011; pp. 241–265. [Google Scholar] [CrossRef]
- Mimura, N.; Pulwarty, R.S.; Elshinnawy, I.; Redsteer, M.H.; Huang, H.Q.; Nkem, J.N.; Rodriguez, R.A.S.; Moss, R.; Vergara, W.; Darby, L.S. Adaptation planning and implementation. In Climate Change 2014 Impacts, Adaptation and Vulnerability: Part A: Global and Sectoral Aspects; Cambridge University Press: Cambridge, UK, 2015; pp. 869–898. [Google Scholar]
- Gebre, S.; Tadele, K.; Mariam, B. Potential impacts of climate change on the hydrology and water resources availability of Didessa Catchment, Blue Nile River Basin, Ethiopia. J. Geol. Geosci. 2015, 4, 193. [Google Scholar] [CrossRef]
- Viste, E.; Korecha, D.; Sorteberg, A. Recent drought and precipitation tendencies in Ethiopia. Theor. Appl. Climatol. 2013, 112, 535–551. [Google Scholar] [CrossRef] [Green Version]
- Liou, Y.-A.; Mulualem, G.M. Spatio–temporal Assessment of Drought in Ethiopia and the Impact of Recent Intense Droughts. Remote Sens. 2019, 11, 1828. [Google Scholar] [CrossRef] [Green Version]
- Ayele, H.S.; Li, M.-H.; Tung, C.-P.; Liu, T.-M. Impact of Climate Change on Runoff in the Gilgel Abbay Watershed, the Upper Blue Nile Basin, Ethiopia. Water 2016, 8, 380. [Google Scholar] [CrossRef] [Green Version]
- Aragie, E.A. Climate Change, Growth and Poverty in Ethiopia. The Robert S. 2013. Available online: https://www.files.ethz.ch/isn/165446/ccaps%20working%20paper%20no.%203.pdf (accessed on 5 November 2021).
- IPCC. The Concept of Risk in the IPCC Sixth Assessment Report: A Summary of Cross-Working Group Discussions; Intergovernmental Panel on Climate Change: Geneva, Switzerland, 2011; pp. 2–15. [Google Scholar]
- Amsalu, A.; Adem, A. Assessment of Climate Change-Induced Hazards, Impacts and Responses in the Southern Lowlands of Ethiopia; Forum for Social Studies (FSS): Addis Ababa, Ethiopia, 2009. [Google Scholar]
- Girmay, G.; Moges, A.; Muluneh, A. Assessment of Current and Future Climate Change Impact on Soil Loss Rate of Agewmariam Watershed, Northern Ethiopia. Air Soil Water Res. 2021, 14, 117862212199584. [Google Scholar] [CrossRef]
- Taye, M.T.; Dyer, E.; Hirpa, F.A.; Charles, K. Climate Change Impact on Water Resources in the Awash Basin, Ethiopia. Water 2018, 10, 1560. [Google Scholar] [CrossRef] [Green Version]
- Enyew, B.; Van Lanen, H.; Van Loon, A. Assessment of the impact of climate change on hydrological drought in Lake Tana catchment, Blue Nile basin, Ethiopia. J. Geol. Geosci. 2014, 3, 174. [Google Scholar]
- Tadese, M.; Kumar, L.; Koech, R. Long-Term Variability in Potential Evapotranspiration, Water Availability and Drought under Climate Change Scenarios in the Awash River Basin, Ethiopia. Atmosphere 2020, 11, 883. [Google Scholar] [CrossRef]
- Abebe, E.; Kebede, A. Assessment of climate change impacts on the water resources of megech river catchment, Abbay Basin, Ethiopia. OJMH 2017, 7, 141. [Google Scholar] [CrossRef] [Green Version]
- Roth, V.; Lemann, T.; Zeleke, G.; Subhatu, A.T.; Nigussie, T.K.; Hurni, H. Effects of climate change on water resources in the upper Blue Nile Basin of Ethiopia. Heliyon 2018, 4, e00771. [Google Scholar] [CrossRef] [Green Version]
- Worqlul, A.W.; Dile, Y.T.; Ayana, E.K.; Jeong, J.; Adem, A.A.; Gerik, T. Impact of Climate Change on Streamflow Hydrology in Headwater Catchments of the Upper Blue Nile Basin, Ethiopia. Water 2018, 10, 120. [Google Scholar] [CrossRef] [Green Version]
- Dile, Y.T.; Berndtsson, R.; Setegn, S.G. Hydrological Response to Climate Change for Gilgel Abay River, in the Lake Tana Basin—Upper Blue Nile Basin of Ethiopia. PLoS ONE 2013, 8, e79296. [Google Scholar] [CrossRef] [PubMed] [Green Version]
- Andargachew, M.; Fantahun, A.; Melke, A.; Abegaz, F. Impact of climate change on hydrological responses of Gumara catchment, in the Lake Tana Basin—Upper Blue Nile Basin of Ethiopia. Int. J. Water Resour. Environ. Eng. 2017, 9, 8–21. [Google Scholar] [CrossRef] [Green Version]
- Koch, M.; Cherie, N. SWAT modeling of the impact of future climate change on the hydrology and the water resources in the upper Blue Nile River basin, Ethiopia. In Proceedings of the 6th International Conference on Water Resources and Environment Research, ICWRER, Koblenz, Germany, 3–8 June 2013; pp. 488–523. [Google Scholar]
- Mulu, G.F.; Moges, M.A.; Bihonegn, B.G. Evaluating the Impacts of Climate Change on the Stream Flow Events in Range of Scale of Watersheds, in the Upper Blue Nile Basin. In Proceedings of the International Conference on Advances of Science and Technology, Bahir Dar, Ethiopia, 2–4 August 2019; pp. 169–192. [Google Scholar]
- Beyene, T.; Lettenmaier, D.P.; Kabat, P. Hydrologic impacts of climate change on the Nile River Basin: Implications of the 2007 IPCC scenarios. Clim. Chang. 2009, 100, 433–461. [Google Scholar] [CrossRef]
- Menna, B.Y. Simulation of Hydro Climatological Impacts Caused by Climate Change: The Case of Hare Watershed, Southern Rift Valley of Ethiopia. J. Waste Water Treat. Anal. 2017, 8, 276. [Google Scholar] [CrossRef]
- Musie, M.; Sen, S.; Srivastava, P. Application of CORDEX-AFRICA and NEX-GDDP datasets for hydrologic projections under climate change in Lake Ziway sub-basin, Ethiopia. J. Hydrol. Reg. Stud. 2020, 31, 100721. [Google Scholar] [CrossRef]
- Molla, D.D.; Tegaye, T.A.; Fletcher, C.G. Simulated surface and shallow groundwater resources in the Abaya-Chamo Lake basin, Ethiopia using a spatially-distributed water balance model. J. Hydrol. Reg. Stud. 2019, 24, 100615. [Google Scholar] [CrossRef]
- Hussen, B.; Mekonnen, A.; Pingale, S.M. Integrated water resources management under climate change scenarios in the sub-basin of Abaya-Chamo, Ethiopia. Model. Earth Syst. Environ. 2018, 4, 221–240. [Google Scholar] [CrossRef]
- Wodaje, G.G.; Eshetu, Z.; Argaw, M. Temporal and spatial variability of rainfall distribution and evapotranspiration across altitudinal gradient in the Bilate River Watershed, Southern Ethiopia. J. AJEST 2016, 10, 167–180. [Google Scholar]
- Tekle, A. Assessment of climate change impact on water availability of Bilate watershed, Ethiopian Rift Valley Basin. In Proceedings of the AFRICON 2015, Addis Ababa, Ethiopia, 14–17 September 2015; pp. 1–5. [Google Scholar]
- Girma, M.M.A.; Seleshi, B. Irrigation Practices in Ethiopia: Characteristics of Selected Irrigation Schemes; IWMI: Addis Ababa, Ethiopia, 2007; Volume 124. [Google Scholar]
- Alemseged, T.H.; Tom, R. Evaluation of regional climate model simulations of rainfall over the Upper Blue Nile basin. Atmos. Res. 2015, 161, 57–64. [Google Scholar] [CrossRef]
- Riahi, K.; Rao, S.; Krey, V.; Cho, C.; Chirkov, V.; Fischer, G.; Kindermann, G.; Nakicenovic, N.; Rafaj, P. RCP 8.5—A scenario of comparatively high greenhouse gas emissions. Clim. Change 2011, 109, 33. [Google Scholar] [CrossRef] [Green Version]
- Thomson, A.M.; Calvin, K.V.; Smith, S.J.; Kyle, G.P.; Volke, A.; Patel, P.; Delgado-Arias, S.; Bond-Lamberty, B.; Wise, M.A.; Clarke, L.E.; et al. RCP4.5: A pathway for stabilization of radiative forcing by 2100. Clim. Chang. 2011, 109, 77. [Google Scholar] [CrossRef] [Green Version]
- van Huijgevoort, M.H.J.; Hazenberg, P.; van Lanen, H.A.J.; Uijlenhoet, R. A generic method for hydrological drought identification across different climate regions. Hydrol. Earth Syst. Sci. 2012, 16, 2437–2451. [Google Scholar] [CrossRef] [Green Version]
- Dalezios, N.R.; Blanta, A.; Spyropoulos, N.V.; Tarquis, A.M. Risk identification of agricultural drought for sustainable Agroecosystems. Nat. Hazards Earth Syst. Sci. 2014, 14, 2435–2448. [Google Scholar] [CrossRef] [Green Version]
- Dogan, S.; Berktay, A.; Singh, V.P. Comparison of multi-monthly rainfall-based drought severity indices, with application to semi-arid Konya closed basin, Turkey. J. Hydrol. 2012, 470, 255–268. [Google Scholar] [CrossRef]
- Bayissa, Y.; Maskey, S.; Tadesse, T.; Van Andel, S.J.; Moges, S.A.; Van Griensven, A.; Solomatine, D. Comparison of the Performance of Six Drought Indices in Characterizing Historical Drought for the Upper Blue Nile Basin, Ethiopia. Geosciences 2018, 8, 81. [Google Scholar] [CrossRef] [Green Version]
- Zargar, A.; Sadiq, R.; Naser, G.; Khan, F.I. A review of drought indices. Environ. Rev. 2011, 19, 333–349. [Google Scholar] [CrossRef]
- McKee, T.B.; Doesken, N.J.; Kleist, J. In The relationship of drought frequency and duration to time scales. In Proceedings of the 8th Conference on Applied Climatology, Anaheim, CA, USA, 17–22 January 1993; pp. 179–183. [Google Scholar]
- Jain, V.K.; Pandey, R.P.; Jain, M.; Byun, H.-R. Comparison of drought indices for appraisal of drought characteristics in the Ken River Basin. Weather Clim. Extrem. 2015, 8, 1–11. [Google Scholar] [CrossRef] [Green Version]
- Tsakiris, G.; Pangalou, D.; Vangelis, H. Regional Drought Assessment Based on the Reconnaissance Drought Index (RDI). Water Resour. Manag. 2006, 21, 821–833. [Google Scholar] [CrossRef]
- Nalbantis, I.; Tsakiris, G. Assessment of Hydrological Drought Revisited. Water Resour. Manag. 2008, 23, 881–897. [Google Scholar] [CrossRef]
- Tigkas, D.; Vangelis, H.; Tsakiris, G. The drought indices calculator (DrinC). In Proceedings of the 8th International Conference of EWRA: Water Resources Management in an Interdisciplinary and Changing Context, Porto, Portugal, 26–29 June 2013. [Google Scholar]
- Abraham, T.; Liu, Y.; Tekleab, S.; Hartmann, A. Quantifying the regional water balance of the Ethiopian Rift Valley Lake basin using an uncertainty estimation framework. J. Hydrol. Earth Syst. Sci. Discuss. 2021, 2021, 1–25. [Google Scholar]
- Neitsch, S.; Arnold, J.; Kiniry, J.; Williams, J. Soil and Water Assessment Tool (SWAT) Theoretical Documentation, Version 2005; Grassland Soil and Water Research Laboratory: Temple, TX, USA, 2005; Available online: https://swat.tamu.edu/media/99192/swat2009-theory.pdf (accessed on 7 September 2021).
- Arnold, J.G.; Moriasi, D.N.; Gassman, P.W.; Abbaspour, K.C.; White, M.J.; Srinivasan, R.; Santhi, C.; Harmel, R.; Van Griensven, A.; Van Liew, M.W. SWAT: Model use, calibration, and validation. J. ASABE 2012, 55, 1491–1508. [Google Scholar] [CrossRef]
- Abraham, L.Z.; Roehrig, J.; Chekol, D.A. Climate Change Impact on Lake Ziway Watershed Water Availability, Ethiopia; Institute for Technology in the Tropics, University of Applied Science: Cologne, Germany, 2006. [Google Scholar]
- Gadissa, T.; Nyadawa, M.; Behulu, F.; Mutua, B. The Effect of Climate Change on Loss of Lake Volume: Case of Sedimentation in Central Rift Valley Basin, Ethiopia. Hydrology 2018, 5, 67. [Google Scholar] [CrossRef] [Green Version]
- Elias, G.; Gebeyehu, E. Impact of climate change on Lake Chamo Water Balance, Ethiopia. Int. J. Water Resour. Environ. Eng. 2017, 9, 86–95. [Google Scholar] [CrossRef] [Green Version]
- Bekele, D.; Alamirew, T.; Kebede, A.; Zeleke, G.; Melesse, A.M. Modeling Climate Change Impact on the Hydrology of Keleta Watershed in the Awash River Basin, Ethiopia. Environ. Model. Assess. 2018, 24, 95–107. [Google Scholar] [CrossRef]
- Getahun, Y.S.; Li, M.-H.; Chen, P.-Y. Assessing Impact of Climate Change on Hydrology of Melka Kuntrie Subbasin, Ethiopia with Ar4 and Ar5 Projections. Water 2020, 12, 1308. [Google Scholar] [CrossRef]
- Thiemann, S.; Förch, G. Water resources assessment in the Bilate river catchment-precipitation variability. In Proceedings of the Lake Abaya Research Symposium, Arba Minch, Ethiopia, 4–7 June 2005; pp. 53–78. [Google Scholar]
- Wagesho, N. Catchment dynamics and its impact on runoff generation: Coupling watershed modelling and statistical analysis to detect catchment responses. Int. J. Water Resour. Environ. Eng. 2014, 6, 73–87. [Google Scholar]
- Wolde-Georgis, T.; Aweke, D.; Hagos, Y. The Case of Ethiopia Reducing the Impacts of Environmental Emergencies through Early Warning and Preparedness: The Case of the 1997–98 El Niño; National Meteorological Service Agency (NMSA): Addis Ababa, Ethiopia, 2000; pp. 1–73.
- Land and Water Development Division—FAO, UNESCO Digital Soil Map of the World and Derived Soil Properties; FAO: Rome, Italy, 2003.
- Lin, W.; Chou, W.; Lin, C.; Huang, P.; Tsai, J. WinBasin: Using improved algorithms and the GIS technique for automated watershed modelling analysis from digital elevation models. Int. J. Geogr. Inf. Sci. 2008, 22, 47–69. [Google Scholar] [CrossRef]
- Imran, R.M.; Rehman, A.; Khan, M.M.; Jamil, M.R.; Abbas, U.; Mahmood, R.S.; Mahmood, S.A.; Haq, E.U.; Ehsan, R.M. Delineation of Drainage Network and Estimation of Total Discharge using Digital Elevation Model (DEM). Int. J. Innov. Sci. Technol. 2019, 1, 50–61. [Google Scholar] [CrossRef]
- Tewabe, D.; Fentahun, T. Assessing land use and land cover change detection using remote sensing in the Lake Tana Basin, Northwest Ethiopia. Cogent Environ. Sci. 2020, 6, 1778998. [Google Scholar] [CrossRef]
- Srivastava, P.K.; Han, D.; Rico-Ramirez, M.A.; Bray, M.; Islam, T. Selection of classification techniques for land use/land cover change investigation. Adv. Space Res. 2012, 50, 1250–1265. [Google Scholar] [CrossRef]
- Arnold, J.G.; Srinivasan, R.; Muttiah, R.S.; Williams, J.R. large area hydrologic modeling and assessment part i: Odel development. JAWRA J. Am. Water Resour. Assoc. 1998, 34, 73–89. [Google Scholar] [CrossRef]
- Leta, O.T.; El-Kadi, A.I.; Dulai, H. Impact of Climate Change on Daily Streamflow and Its Extreme Values in Pacific Island Watersheds. Sustainability 2018, 10, 2057. [Google Scholar] [CrossRef] [Green Version]
- Wang, J.; Liang, Z.; Liu, T.; Yang, J. Impact of Climate Change on Hydrologic Extremes in the Upper Basin of the Yellow River Basin of China. Adv. Meteorol. 2016, 2016, 1404290. [Google Scholar] [CrossRef]
- Sharannya, T.; Mudbhatkal, A.; Mahesha, A. Assessing climate change impacts on river hydrology–A case study in the Western Ghats of India. J. Earth Syst. Sci. 2018, 127, 78. [Google Scholar] [CrossRef] [Green Version]
- Troin, M.; Caya, D.; Velázquez, J.A.; Brissette, F. Hydrological response to dynamical downscaling of climate model outputs: A case study for western and eastern snowmelt-dominated Canada catchments. J. Hydrol. Reg. Stud. 2015, 4, 595–610. [Google Scholar] [CrossRef] [Green Version]
- Gassman, P.W.; Reyes, M.R.; Green, C.H.; Arnold, J.G. The Soil and Water Assessment Tool: Historical Development, Applications, and Future Research Directions. Trans. ASABE Appl. Eng. 2007, 50, 1211–1250. [Google Scholar] [CrossRef] [Green Version]
- Hawkins, R.H.; Hjelmfelt, A.T., Jr.; Zevenbergen, A.W. Runoff probability, storm depth, and curve numbers. J. Irrig. Drain. Eng. 1985, 111, 330–340. [Google Scholar] [CrossRef]
- Allen, R.; Pereira, L.; Raes, D.; Smith, M. Guidelines for Computing Crop Water Requirements-FAO Irrigation and Drainage; Paper 56; ARPAV (2000), La Caratterizzazione Climatica della Regione Veneto, Quaderni per; FAO–Food and Agriculture Organisation of the United Nations: Rome, Italy, 2000; Available online: http://www.fao.org/docrep (accessed on 15 September 2021).
- Kaviya, B. Runoff estimation using swat model in brahmani-baitarani river basin. Int. J. Biot. Trends Technol. 2013, 3, 1–16. [Google Scholar]
- Wodaje, G.G.; Asfaw, Z.E.; Denboba, M.A. Impacts and uncertainties of climate change on stream flow of the Bilate River (Ethiopia), using a CMIP5 general circulation models ensemble. IJWREE 2021, 13, 64–75. [Google Scholar]
- Abbaspour, K.C. SWAT Calibration Uncertainty Program User Manual; Swiss Federal Institute of Aquatic Science and Technology, Eawag Zurich: Dübendorf, Switzerland, 2013; pp. 1–100. [Google Scholar]
- Cibin, R.; Sudheer, K.P.; Chaubey, I. Sensitivity and identifiability of stream flow generation parameters of the SWAT model. Hydrol. Process. 2010, 24, 1133–1148. [Google Scholar] [CrossRef]
- Abbaspour, K.C. SWAT Calibration and Uncertainty Programs: A User Manual; Swiss Federal Institute of Aquatic Science and Technology, Eawag Zurich: Dübendorf, Switzerland, 2008; Volume 20, pp. 1–100. [Google Scholar]
- Abbaspour, K.C.; Vaghefi, S.A.; Srinivasan, R. A Guideline for Successful Calibration and Uncertainty Analysis for Soil and Water Assessment: A Review of Papers from the 2016 International SWAT Conference. Water 2017, 10, 6. [Google Scholar] [CrossRef] [Green Version]
- Shope, C.L.; Maharjan, G.R.; Tenhunen, J.; Seo, B.; Kim, K.; Riley, J.; Arnhold, S.; Koellner, T.; Ok, Y.S.; Peiffer, S.; et al. Using the SWAT model to improve process descriptions and define hydrologic partitioning in South Korea. Hydrol. Earth Syst. Sci. 2014, 18, 539–557. [Google Scholar] [CrossRef] [Green Version]
- Tegegne, G.; Park, D.K.; Kim, Y.-O. Comparison of hydrological models for the assessment of water resources in a data-scarce region, the Upper Blue Nile River Basin. J. Hydrol. Reg. Stud. 2017, 14, 49–66. [Google Scholar] [CrossRef]
- Golmohammadi, G.; Prasher, S.; Madani, A.; Rudra, R. Evaluating Three Hydrological Distributed Watershed Models: MIKE-SHE, APEX, SWAT. Hydrology 2014, 1, 20–39. [Google Scholar] [CrossRef] [Green Version]
- Brands, S.; Herrera, S.; Fernández, J.; Gutiérrez, J.M. How well do CMIP5 Earth System Models simulate present climate conditions in Europe and Africa? J. Clim. Dyn. 2013, 41, 803–817. [Google Scholar] [CrossRef] [Green Version]
- Nikulin, G.; Jones, C.; Giorgi, F.; Asrar, G.; Büchner, M.; Cerezo-Mota, R.; Christensen, O.B.; Déqué, M.; Fernandez, J.; Hänsler, A.; et al. Precipitation climatology in an ensemble of CORDEX-Africa regional climate simulations. J. Clim. 2012, 25, 6057–6078. [Google Scholar] [CrossRef] [Green Version]
- Fang, G.H.; Yang, J.; Chen, Y.N.; Zammit, C. Comparing bias correction methods in downscaling meteorological variables for a hydrologic impact study in an arid area in China. Hydrol. Earth Syst. Sci. 2015, 19, 2547–2559. [Google Scholar] [CrossRef] [Green Version]
- Schmidli, J.; Frei, C.; Vidale, P.L. Downscaling from GCM precipitation: A benchmark for dynamical and statistical downscaling methods. Int. J. Clim. 2006, 26, 679–689. [Google Scholar] [CrossRef]
- Raneesh, K.; Thampi, S. Bias correction for RCM predictions of precipitation and temperature in the Chaliyar River Basin. J. WAF 2013, 1, 1–6. [Google Scholar]
- Svoboda, M.D.; Fuchs, B.A. Handbook of Drought Indicators and Indices; World Meteorological Organization: Geneva, Switzerland, 2016. [Google Scholar]
- Karamouz, M.; Rasouli, K.; Nazif, S. Development of a Hybrid Index for Drought Prediction: Case Study. J. Hydrol. Eng. 2009, 14, 617–627. [Google Scholar] [CrossRef]
- Kirono, D.G.; Round, V.; Heady, C.; Chiew, F.H.; Osbrough, S. Drought projections for Australia: Updated results and analysis of model simulations. J. Weather Clim. Extremes 2020, 30, 100280. [Google Scholar] [CrossRef]
- Musonda, B.; Jing, Y.; Iyakaremye, V.; Ojara, M. Analysis of long-term variations of drought characteristics using standardized precipitation index over Zambia. J. Atmos. 2020, 11, 1268. [Google Scholar] [CrossRef]
- Edossa, D.C.; Babel, M.S.; Das Gupta, A. Drought analysis in the Awash river basin, Ethiopia. J. Water Resour. Manag. 2010, 24, 1441–1460. [Google Scholar] [CrossRef]
- Tabari, H.; Abghari, H.; Hosseinzadeh Talaee, P. Temporal trends and spatial characteristics of drought and rainfall in arid and semiarid regions of Iran. J. Hydrol. Process 2011, 26, 3351–3361. [Google Scholar] [CrossRef]
- Tigkas, D.; Vangelis, H.; Tsakiris, G. DrinC: A software for drought analysis based on drought indices. Earth Sci. Inform. 2014, 8, 697–709. [Google Scholar] [CrossRef]
- Tapoglou, E.; Vozinaki, A.E.; Tsanis, I. Climate change impact on the frequency of hydrometeorological extremes in the island of crete. J. Water 2019, 11, 587. [Google Scholar] [CrossRef] [Green Version]
- Gao, F.; Zhang, Y.; Ren, X.; Yao, Y.; Hao, Z.; Cai, W. Evaluation of CHIRPS and its application for drought monitoring over the Haihe River Basin, China. J. Nat. Hazards 2018, 92, 155–172. [Google Scholar] [CrossRef]
- Schwalm, C.R.; Anderegg, W.R.L.; Michalak, A.M.; Fisher, J.B.; Biondi, F.; Koch, G.; Litvak, M.; Ogle, K.; Shaw, J.D.; Wolf, A.; et al. Global patterns of drought recovery. Nature 2017, 548, 202–205. [Google Scholar] [CrossRef]
- Suryabhagavan, K.V. GIS-based climate variability and drought characterization in Ethiopia over three decades. Weather Clim. Extrem. 2017, 15, 11–23. [Google Scholar] [CrossRef]
- Thompson, S.A. Hydrology for Water Management; CRC Press: Boca Raton, FL, USA, 2017. [Google Scholar] [CrossRef]
- Chattopadhyay, S.; Edwards, D.R.; Yu, Y.; Hamidisepehr, A. An assessment of climate change impacts on future water availability and droughts in the Kentucky River Basin. J. Environ. Process. 2017, 4, 477–507. [Google Scholar] [CrossRef]
- Haile, G.G.; Tang, Q.; Hosseini-Moghari, S.; Liu, X.; Gebremicael, T.G.; Leng, G.; Kebede, A.; Xu, X.; Yun, X. Projected Impacts of Climate Change on Drought Patterns Over East Africa. Earth’s Futur. 2020, 8, e2020EF001502. [Google Scholar] [CrossRef]
- Santos, J.F.; Portela, M.M.; Pulido-Calvo, I. Regional Frequency Analysis of Droughts in Portugal. Water Resour. Manag. 2011, 25, 3537–3558. [Google Scholar] [CrossRef]
- Griggs, D.J.; Noguer, M. Climate change 2001: The scientific basis. Contribution of working group I to the third assessment report of the intergovernmental panel on climate change. Weather 2002, 57, 267–269. [Google Scholar] [CrossRef]
- Karl, T.R.; Jones, P.D.; Knight, R.W.; Kukla, G.; Plummer, N.; Razuvayev, V.; Gallo, K.P.; Lindseay, J.; Charlson, R.J.; Peterson, T.C. Asymmetric trends of daily maximum and minimum temperature. J. Nat.Resour. 1993, 185. [Google Scholar]
- Horton, B. Geographical distribution of changes in maximum and minimum temperatures. Atmos. Res. 1995, 37, 101–117. [Google Scholar] [CrossRef]
- Ali, M.A.S.; Noresah, M.S.; Sanjay, G.; Saad, A.M.A.; Shariff, N.M.; Gairola, S. Nature and causes of land degradation and desertification in Libya: Need for sustainable land management. Afr. J. Biotechnol. 2011, 10, 13680–13687. [Google Scholar] [CrossRef] [Green Version]
- Osborne, C.P.; Chuine, I.; Viner, D.; Woodward, F.I. Olive phenology as a sensitive indicator of future climatic warming in the Mediterranean. Plant Cell Environ. 2000, 23, 701–710. [Google Scholar] [CrossRef] [Green Version]
- Giri, S.; Mishra, A.; Zhang, Z.; Lathrop, R.G.; Alnahit, A.Q. Meteorological and Hydrological Drought Analysis and Its Impact on Water Quality and Stream Integrity. Sustainability 2021, 13, 8175. [Google Scholar] [CrossRef]
- Rajsekhar, D.; Gorelick, S.M. Increasing drought in Jordan: Climate change and cascading Syrian land-use impacts on reducing transboundary flow. Sci. Adv. 2017, 3, e1700581. [Google Scholar] [CrossRef] [Green Version]
- Nam, W.-H.; Hayes, M.J.; Svoboda, M.D.; Tadesse, T.; Wilhite, D.A. Drought hazard assessment in the context of climate change for South Korea. Agric. Water Manag. 2015, 160, 106–117. [Google Scholar] [CrossRef]
- Ukkola, A.M.; De Kauwe, M.G.; Roderick, M.L.; Abramowitz, G.; Pitman, A.J. Robust Future Changes in Meteorological Drought in CMIP6 Projections Despite Uncertainty in Precipitation. Geophys. Res. Lett. 2020, 47. [Google Scholar] [CrossRef]
- Blanco-Gómez, P.; Jimeno-Sáez, P.; Senent-Aparicio, J.; Pérez-Sánchez, J. Impact of Climate Change on Water Balance Components and Droughts in the Guajoyo River Basin (El Salvador). Water 2019, 11, 2360. [Google Scholar] [CrossRef] [Green Version]
- Dawson, B.; Spannagle, M. Ethiopia’s Second National Communication to the United Nations Framework Convention on Climate Change (UNFCCC); Ministry of Environment and Forest (MEF): Addis Ababa, Ethiopia, 2015; pp. 1–235.
- Abraham, T.; Woldemicheala, A.; Muluneha, A.; Abateb, B. Hydrological responses of climate change on Lake Ziway catchment, Central Rift Valley of Ethiopia. J. Earth Sci. Clim. Change 2018, 9, 2. [Google Scholar]
- Chaemiso, S.E.; Abebe, A.; Pingale, S.M. Assessment of the impact of climate change on surface hydrological processes using SWAT: A case study of Omo-Gibe river basin, Ethiopia. Model. Earth Syst. Environ. 2016, 2, 1–15. [Google Scholar] [CrossRef] [Green Version]
- Worku, G.; Teferi, E.; Bantider, A.; Dile, Y.T. Modelling hydrological processes under climate change scenarios in the Jemma sub-basin of upper Blue Nile Basin, Ethiopia. Clim. Risk Manag. 2021, 31, 100272. [Google Scholar] [CrossRef]
- Kueh, M.-T.; Lin, C.Y.; Chuang, Y.-J.; Sheng, Y.-F.; Chien, Y.-Y. Climate variability of heat waves and their associated diurnal temperature range variations in Taiwan. Environ. Res. Lett. 2017, 12, 074017. [Google Scholar] [CrossRef]
- Sunoj, V.S.J.; Prasad, P.V.V.; Ciampitti, I.A.; Maswada, H.F. Narrowing Diurnal Temperature Amplitude Alters Carbon Tradeoff and Reduces Growth in C4 Crop Sorghum. Front. Plant Sci. 2020, 11. [Google Scholar] [CrossRef]
- Rahman, A.; Kang, S.; Nagabhatla, N.; MacNee, R. Impacts of temperature and rainfall variation on rice productivity in major ecosystems of Bangladesh. Agric. Food Secur. 2017, 6, 10. [Google Scholar] [CrossRef] [Green Version]
- Aich, V.; Liersch, S.; Vetter, T.; Huang, S.; Tecklenburg, J.; Hoffmann, P.; Koch, H.; Fournet, S.; Krysanova, V.; Müller, E.N.; et al. Comparing impacts of climate change on streamflow in four large African river basins. Hydrol. Earth Syst. Sci. 2014, 18, 1305–1321. [Google Scholar] [CrossRef] [Green Version]
- Mohseni Saravi, M.; Safdari, A.; Malekian, A. Intensity-Duration-Frequency and spatial analysis of droughts using the Standardized Precipitation Index. J. Hydrol. Earth Syst. Sci. Discuss. 2009, 6, 1347–1383. [Google Scholar]
- Moloro, T.L. Spatio-Temporal Analysis of Rainfall Variability and Meteorological Drought: A Case Study in Bilate River Basin, Southern Rift Valley, Ethiopia. Int. J. Environ. Sci. Nat. Resour. 2018, 14, 76–89. [Google Scholar] [CrossRef]
- Regasa, M.; Nones, M.; Adeba, D. A Review on Land Use and Land Cover Change in Ethiopian Basins. Land 2021, 10, 585. [Google Scholar] [CrossRef]
- Biazin, B.; Sterk, G. Drought vulnerability drives land-use and land cover changes in the Rift Valley dry lands of Ethiopia. Agric. Ecosyst. Environ. 2013, 164, 100–113. [Google Scholar] [CrossRef]
- Gebretekle, H.; Nigusse, A.G.; Demissie, B. Stream flow dynamics under current and future land cover conditions in Atsela Watershed, Northern Ethiopia. J. Acta Geophys. 2021, 1–14. [Google Scholar] [CrossRef]
- Taye, M.; Sahlu, D.; Zaitchik, B.F.; Neka, M. Evaluation of Satellite Rainfall Estimates for Meteorological Drought Analysis over the Upper Blue Nile Basin, Ethiopia. Geosciences 2020, 10, 352. [Google Scholar] [CrossRef]
- Khadr, M. Temporal and spatial analysis of meteorological drought characteristics in the upper Blue Nile river region. Water Policy 2016, 48, 265–276. [Google Scholar] [CrossRef]
- Zhai, J.; Mondal, S.K.; Fischer, T.; Wang, Y.; Su, B.; Huang, J.; Tao, H.; Wang, G.; Ullah, W.; Uddin, J. Future drought characteristics through a multi-model ensemble from CMIP6 over South Asia. Atmos. Res. 2020, 246, 105111. [Google Scholar] [CrossRef]
- Mekonen, A.A.; Berlie, A.B.; Ferede, M.B. Spatial and temporal drought incidence analysis in the northeastern highlands of Ethiopia. Geoenviron. Disasters 2020, 7, 1–17. [Google Scholar] [CrossRef] [Green Version]
- Lu, Y.; Cai, H.; Jiang, T.; Sun, S.; Wang, Y.; Zhao, J.; Yu, X.; Sun, J. Assessment of global drought propensity and its impacts on agricultural water use in future climate scenarios. Agric. For. Meteorol. 2019, 278, 107623. [Google Scholar] [CrossRef]
- Dai, A. Drought under global warming: A review. WIREs Clim. Chang. 2011, 2, 45–65. [Google Scholar] [CrossRef] [Green Version]
- Dai, A. Increasing drought under global warming in observations and models. Nat. Clim. Chang. 2012, 3, 52–58. [Google Scholar] [CrossRef]
Figure 1.
Map of the study area: (a) world map; (b) RVLB; (c) DEM and meteorological stations in the Bilate watershed.
Figure 1.
Map of the study area: (a) world map; (b) RVLB; (c) DEM and meteorological stations in the Bilate watershed.

Figure 2.
(a) Major land-use types derived from harmonized FAO 98 database [64] land use classification; and (b) major soil types in the Bilate Watershed.
Figure 2.
(a) Major land-use types derived from harmonized FAO 98 database [64] land use classification; and (b) major soil types in the Bilate Watershed.

Figure 3.
Locations of CORDEX-Africa output grid points in the Bilate watershed.

Figure 5.
Comparison between simulated and observed monthly streamflow for the calibration (1989–2000) and validation (2001–2005) periods.
Figure 5.
Comparison between simulated and observed monthly streamflow for the calibration (1989–2000) and validation (2001–2005) periods.

Figure 6.
Observed monthly temperature and GCM simulated temperature in the baseline period (1986–2005): (a) maximum temperature; and (b) minimum temperature.
Figure 6.
Observed monthly temperature and GCM simulated temperature in the baseline period (1986–2005): (a) maximum temperature; and (b) minimum temperature.

Figure 7.
Observed monthly rainfall and GCM simulated baseline rainfall (1986–2005).

Figure 8.
Observed and GCM simulated monthly streamflows in the baseline (1986–2005) period.

Figure 9.
Changes in the monthly maximum temperature for the near future period from 2021–2050 with respect to the baseline obtained with: (a) RCP4.5; and (b) RCP8.5.
Figure 9.
Changes in the monthly maximum temperature for the near future period from 2021–2050 with respect to the baseline obtained with: (a) RCP4.5; and (b) RCP8.5.

Figure 10.
Changes in the monthly maximum temperature for the far future period from 2071–2100 with respect to the baseline obtained with: (a) RCP4.5; and (b) RCP8.5.
Figure 10.
Changes in the monthly maximum temperature for the far future period from 2071–2100 with respect to the baseline obtained with: (a) RCP4.5; and (b) RCP8.5.

Figure 11.
Changes in monthly minimum temperature of the near future period from 2021–2050, with respect to the baseline obtained with: (a) RCP4.5; and (b) RCP8.5.
Figure 11.
Changes in monthly minimum temperature of the near future period from 2021–2050, with respect to the baseline obtained with: (a) RCP4.5; and (b) RCP8.5.

Figure 12.
Changes in the monthly minimum temperature of the far future period from 2071–2100, with respect to the baseline obtained with: (a) RCP4.5; and (b) RCP8.5.
Figure 12.
Changes in the monthly minimum temperature of the far future period from 2071–2100, with respect to the baseline obtained with: (a) RCP4.5; and (b) RCP8.5.

Figure 13.
Diurnal temperature range (DTR) for the baseline, near, and far future periods.

Figure 14.
Percentage changes in annual and seasonal rainfall with reference to the baseline for (a) the near future period from 2021–2050; and (b) the far future period from 2071–2100.
Figure 14.
Percentage changes in annual and seasonal rainfall with reference to the baseline for (a) the near future period from 2021–2050; and (b) the far future period from 2071–2100.

Figure 15.
Percentage changes of annual and seasonal evapotranspiration with reference to the baseline in the: (a) near future period from 2021–2050; and (b) far future period from 2071–2100.
Figure 15.
Percentage changes of annual and seasonal evapotranspiration with reference to the baseline in the: (a) near future period from 2021–2050; and (b) far future period from 2071–2100.

Figure 16.
Percentage changes of annual and seasonal streamflow with reference to the baseline: (a) near future period from 2021–2050; and (b) far future period from 2071–2100.
Figure 16.
Percentage changes of annual and seasonal streamflow with reference to the baseline: (a) near future period from 2021–2050; and (b) far future period from 2071–2100.

Figure 17.
Probability of drought: (a) SPI; (b) SDI; and (c) RDI for the baseline and future periods.
Figure 17.
Probability of drought: (a) SPI; (b) SDI; and (c) RDI for the baseline and future periods.

Figure 18.
Average drought intensities: (a) SPI; (b) SDI; and (c) RDI for the baseline and future periods.
Figure 18.
Average drought intensities: (a) SPI; (b) SDI; and (c) RDI for the baseline and future periods.


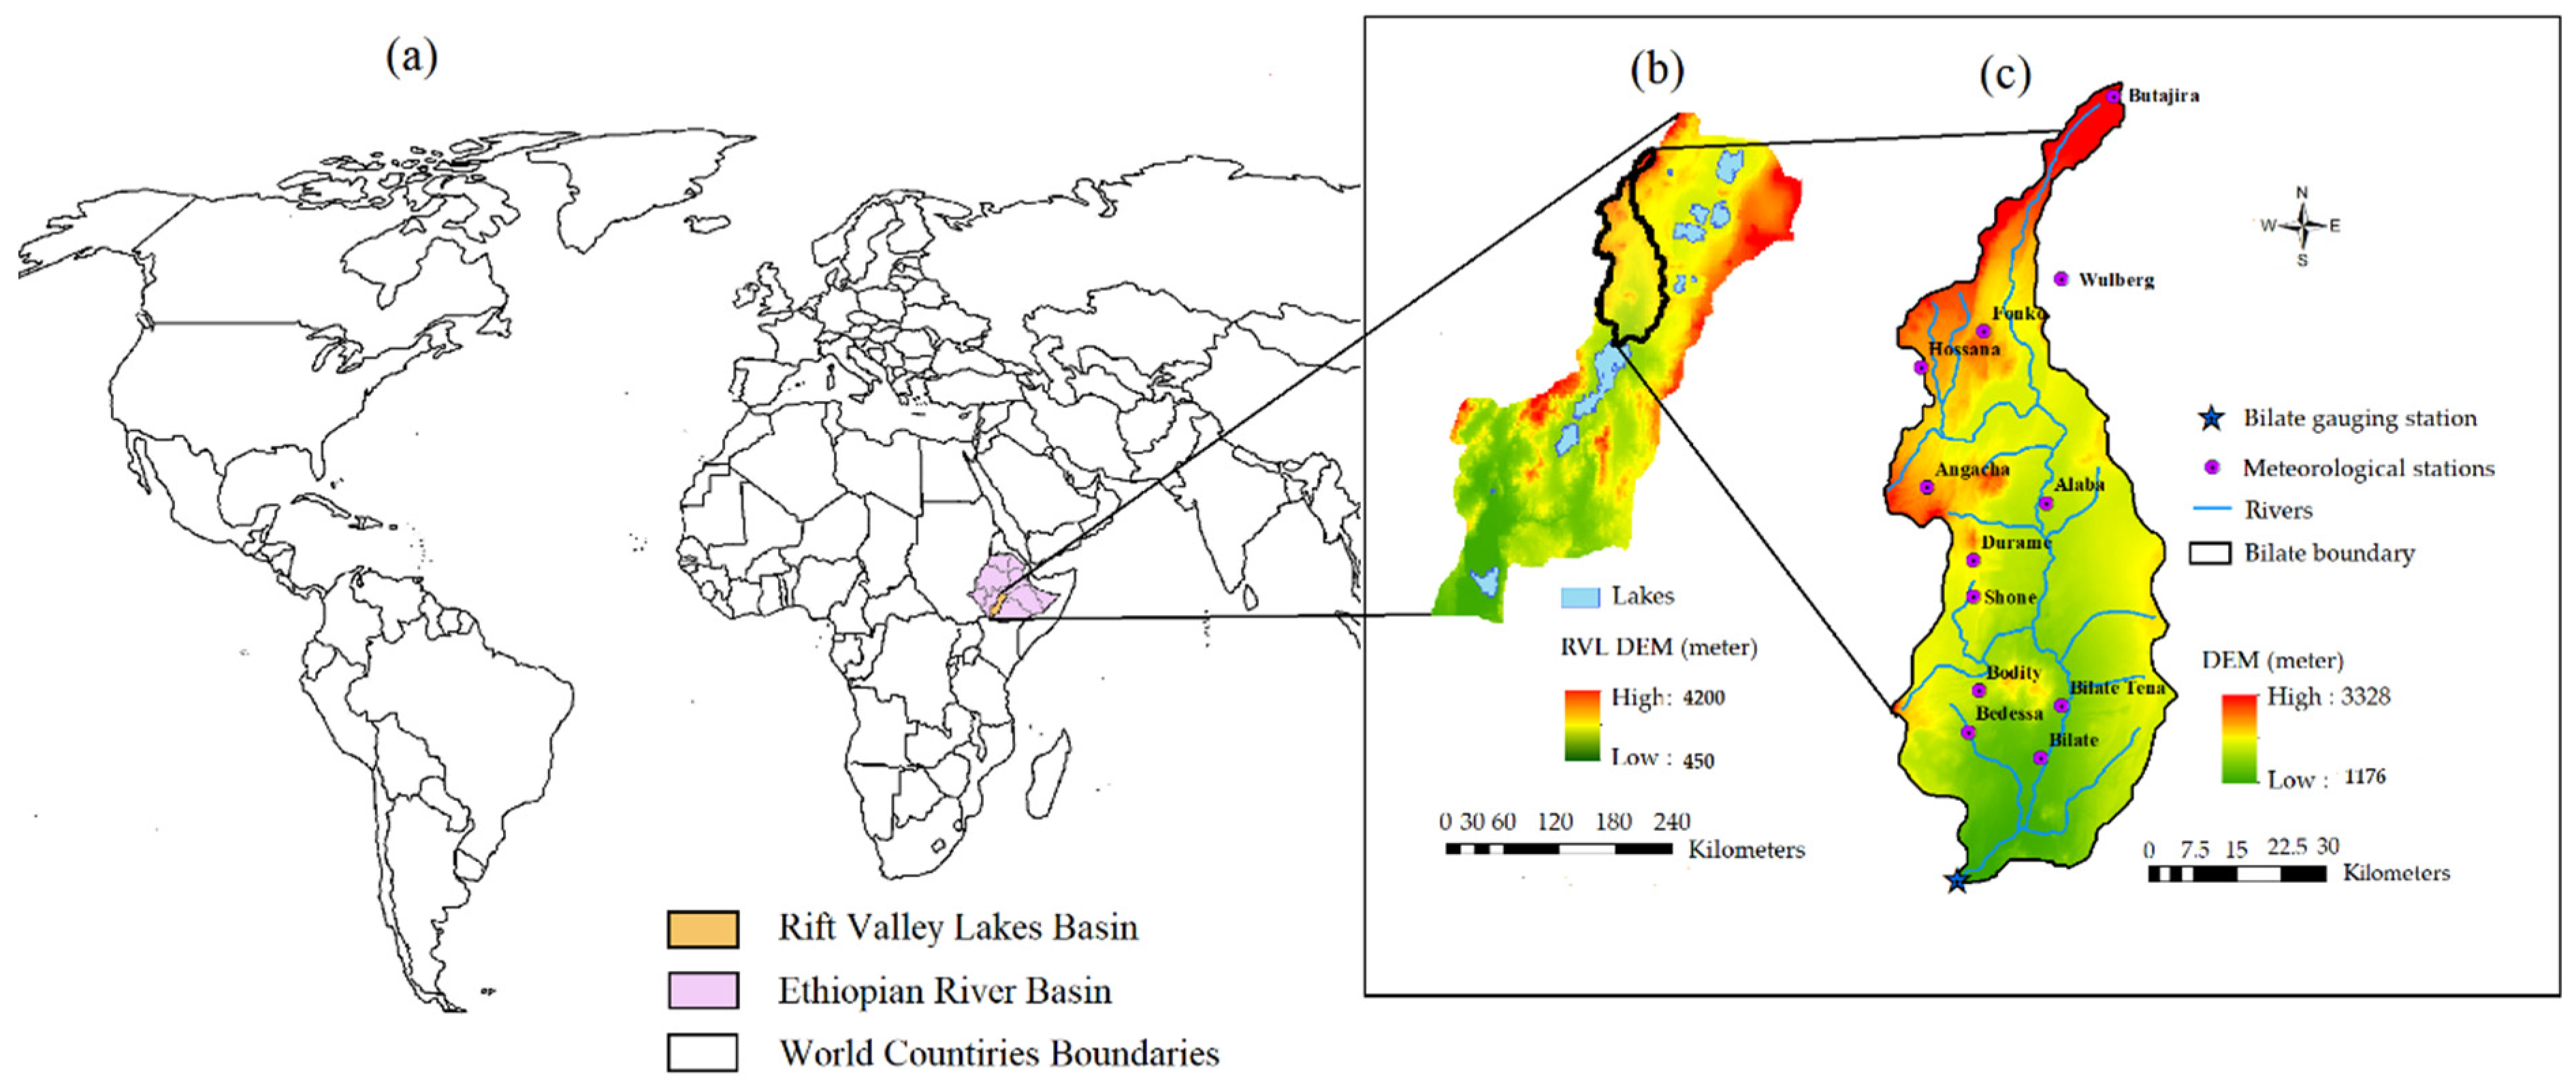
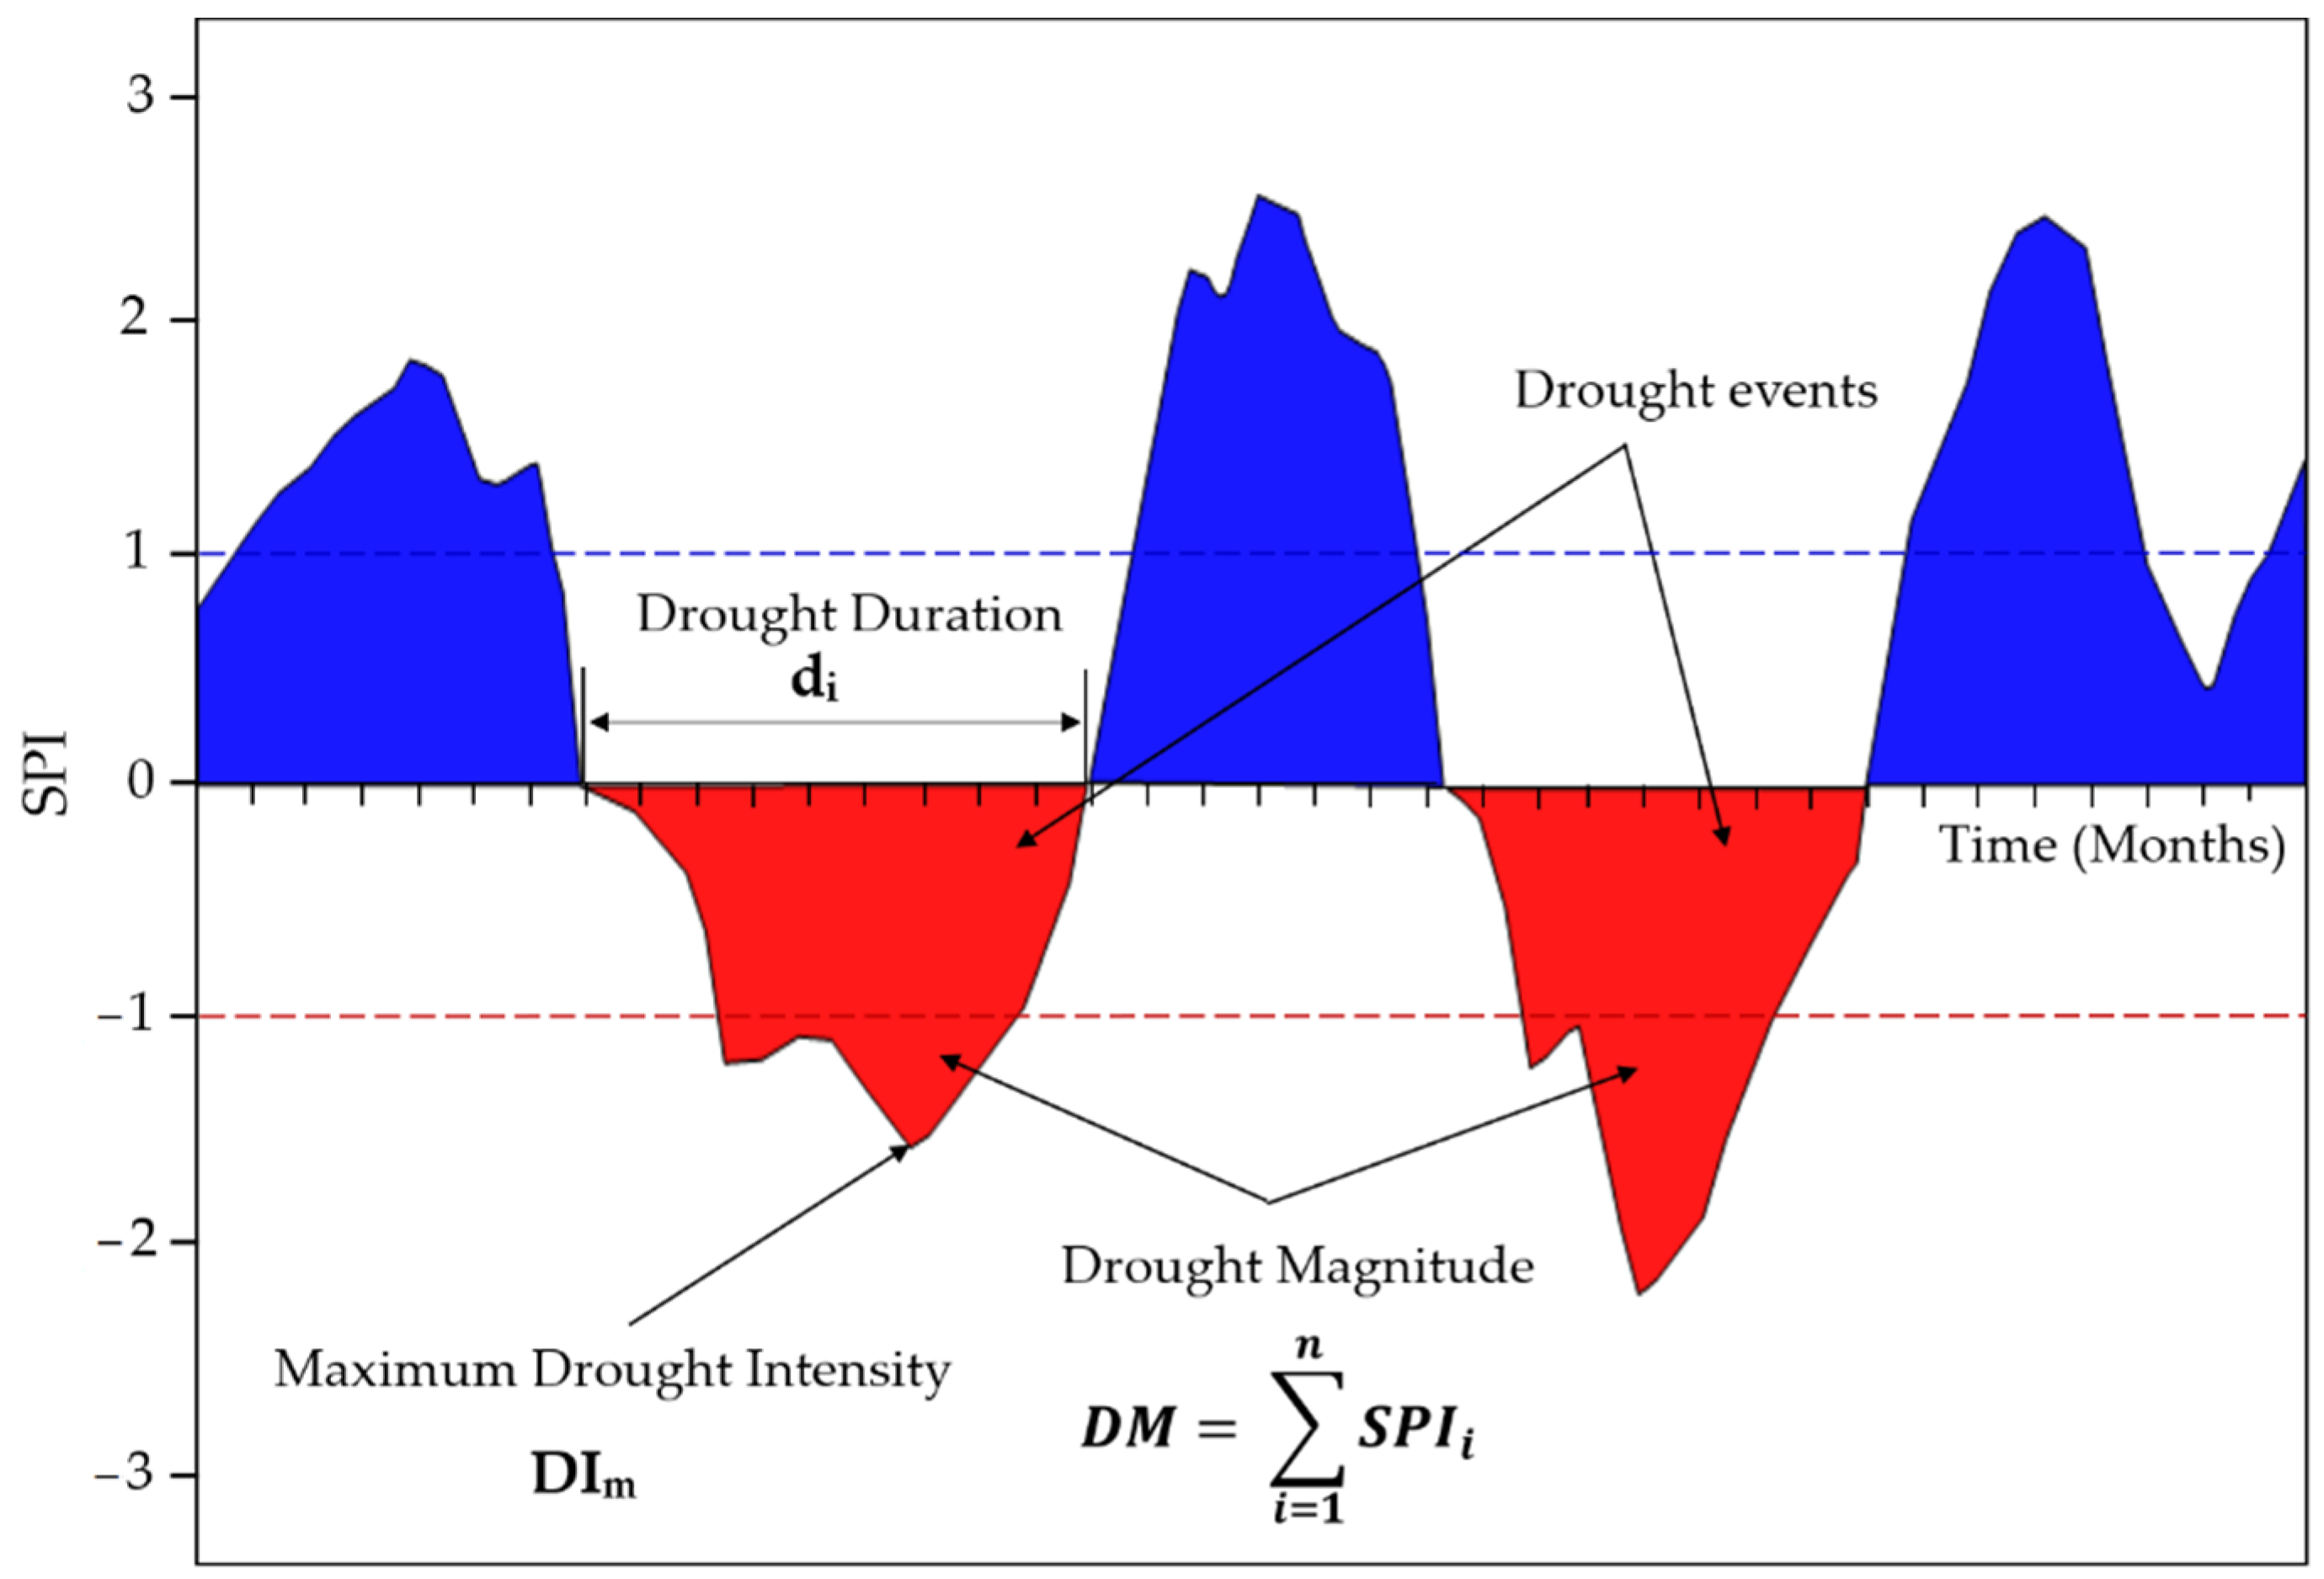
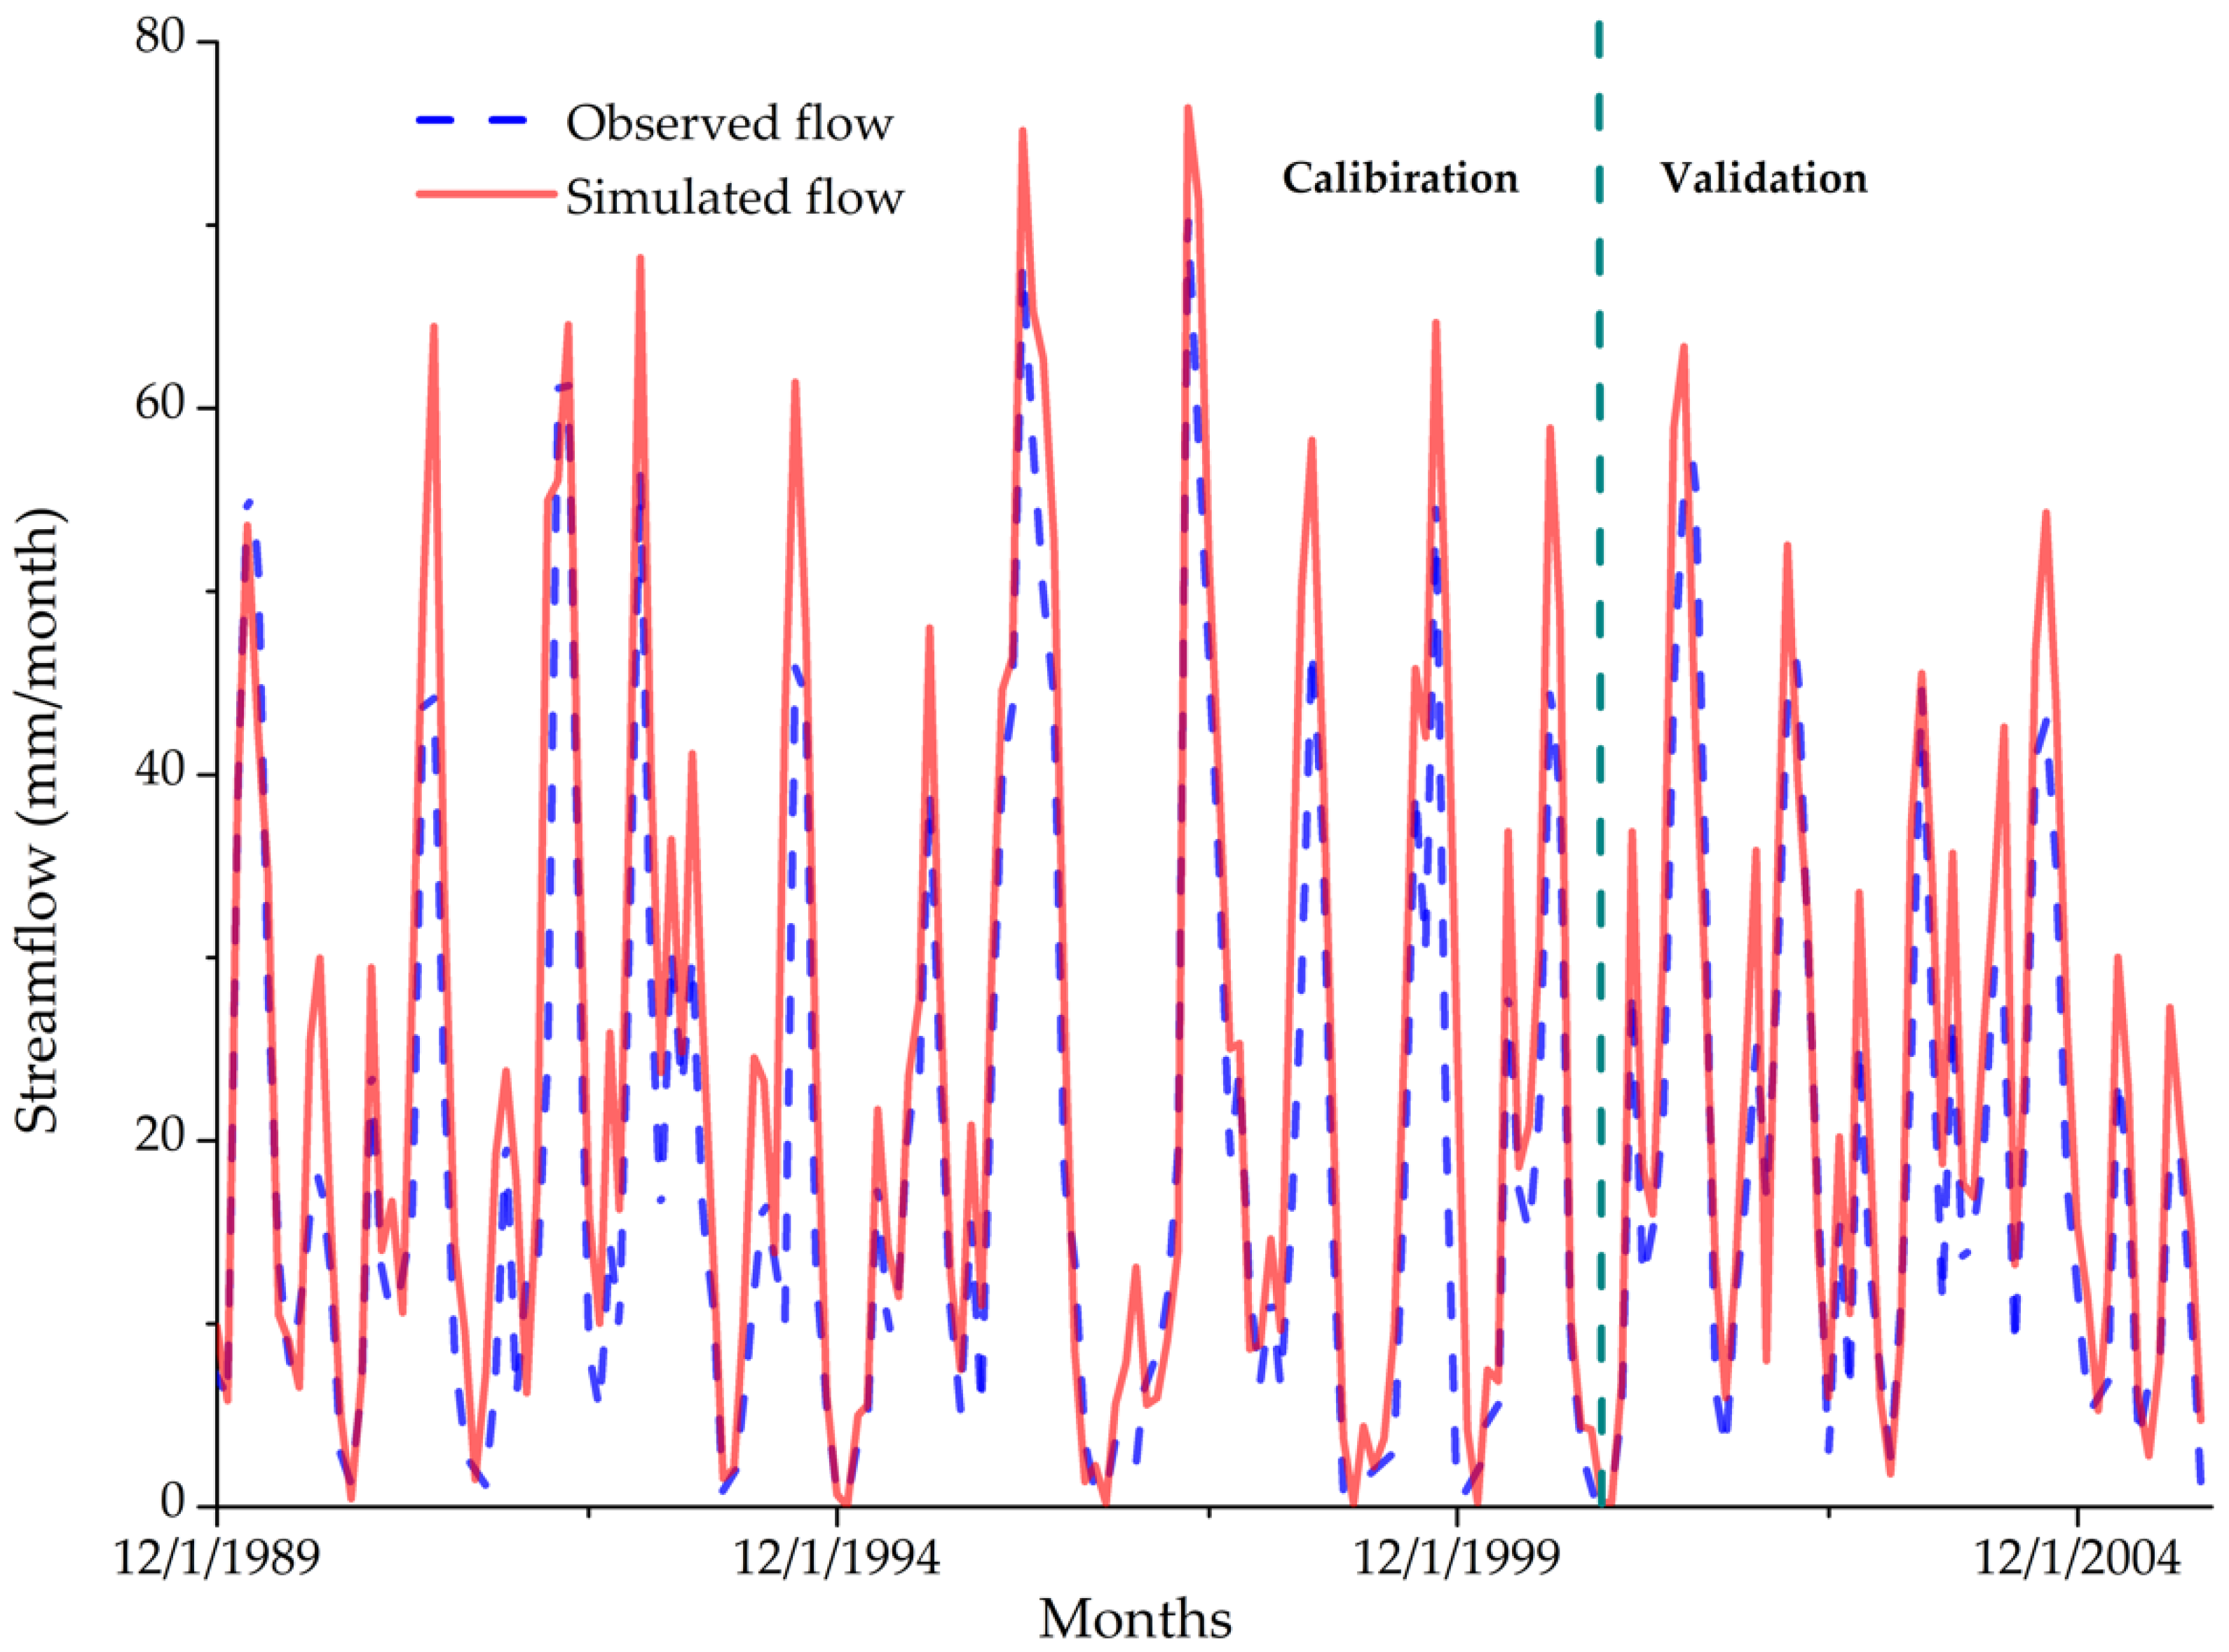
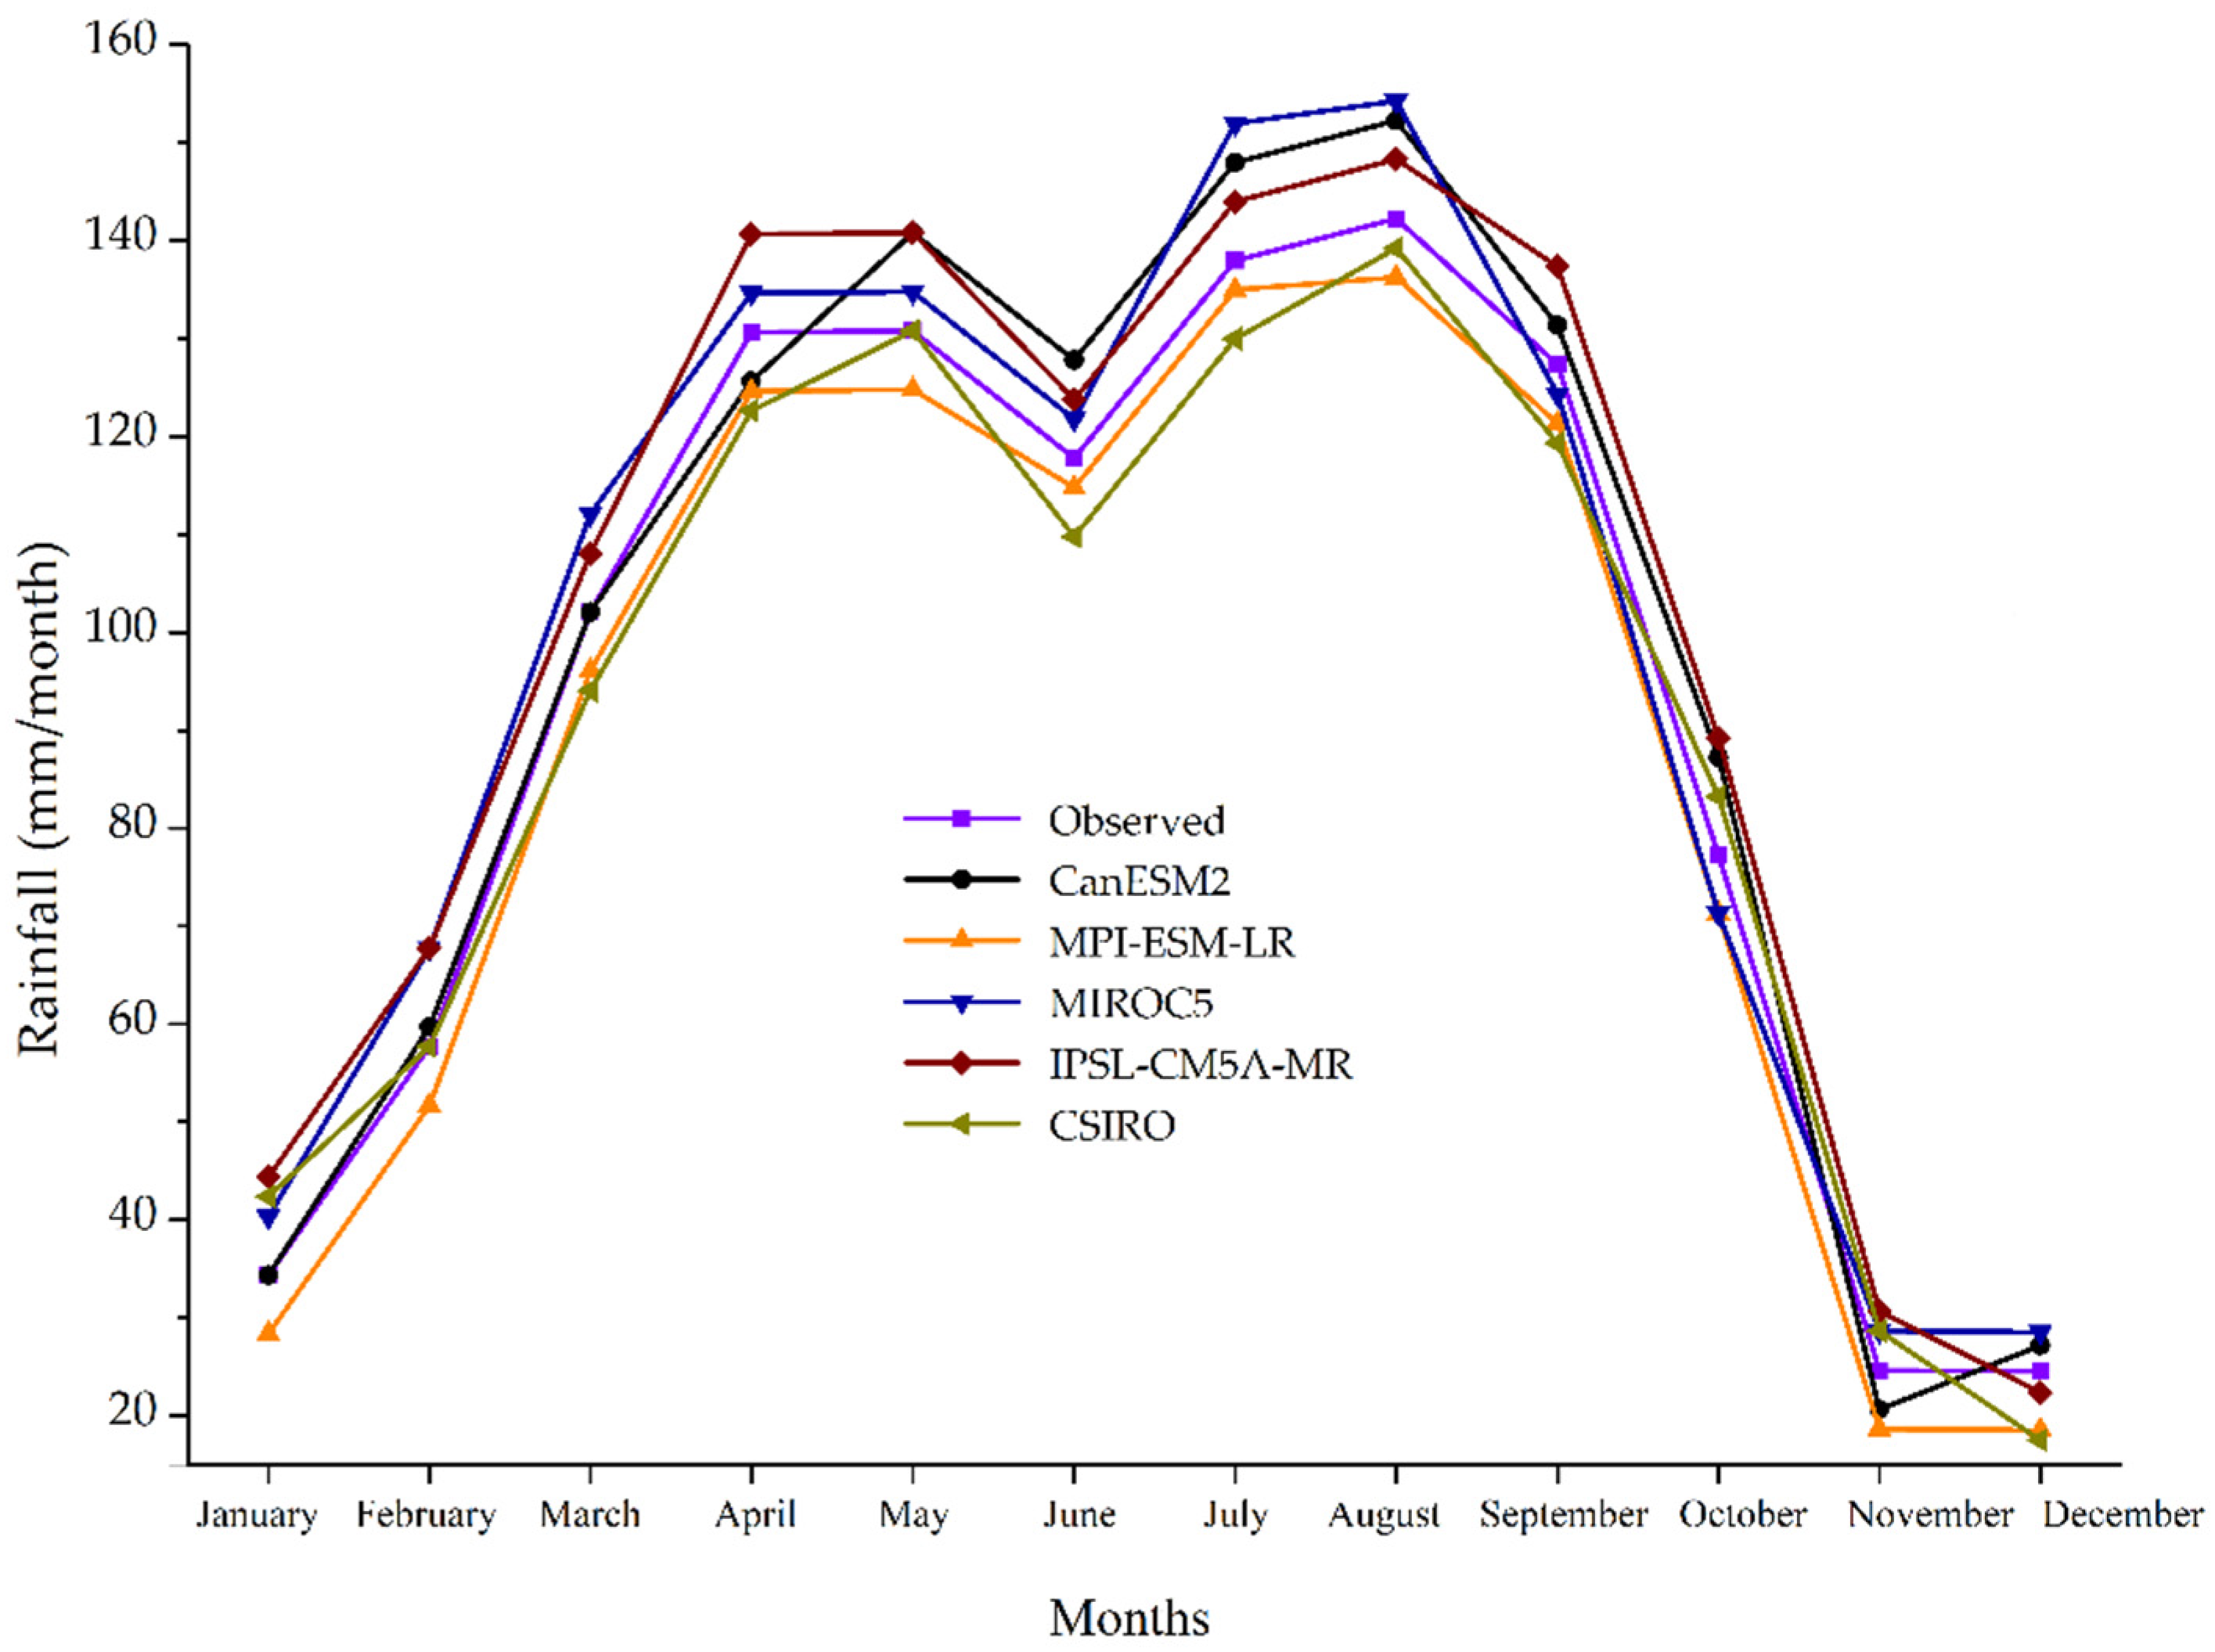
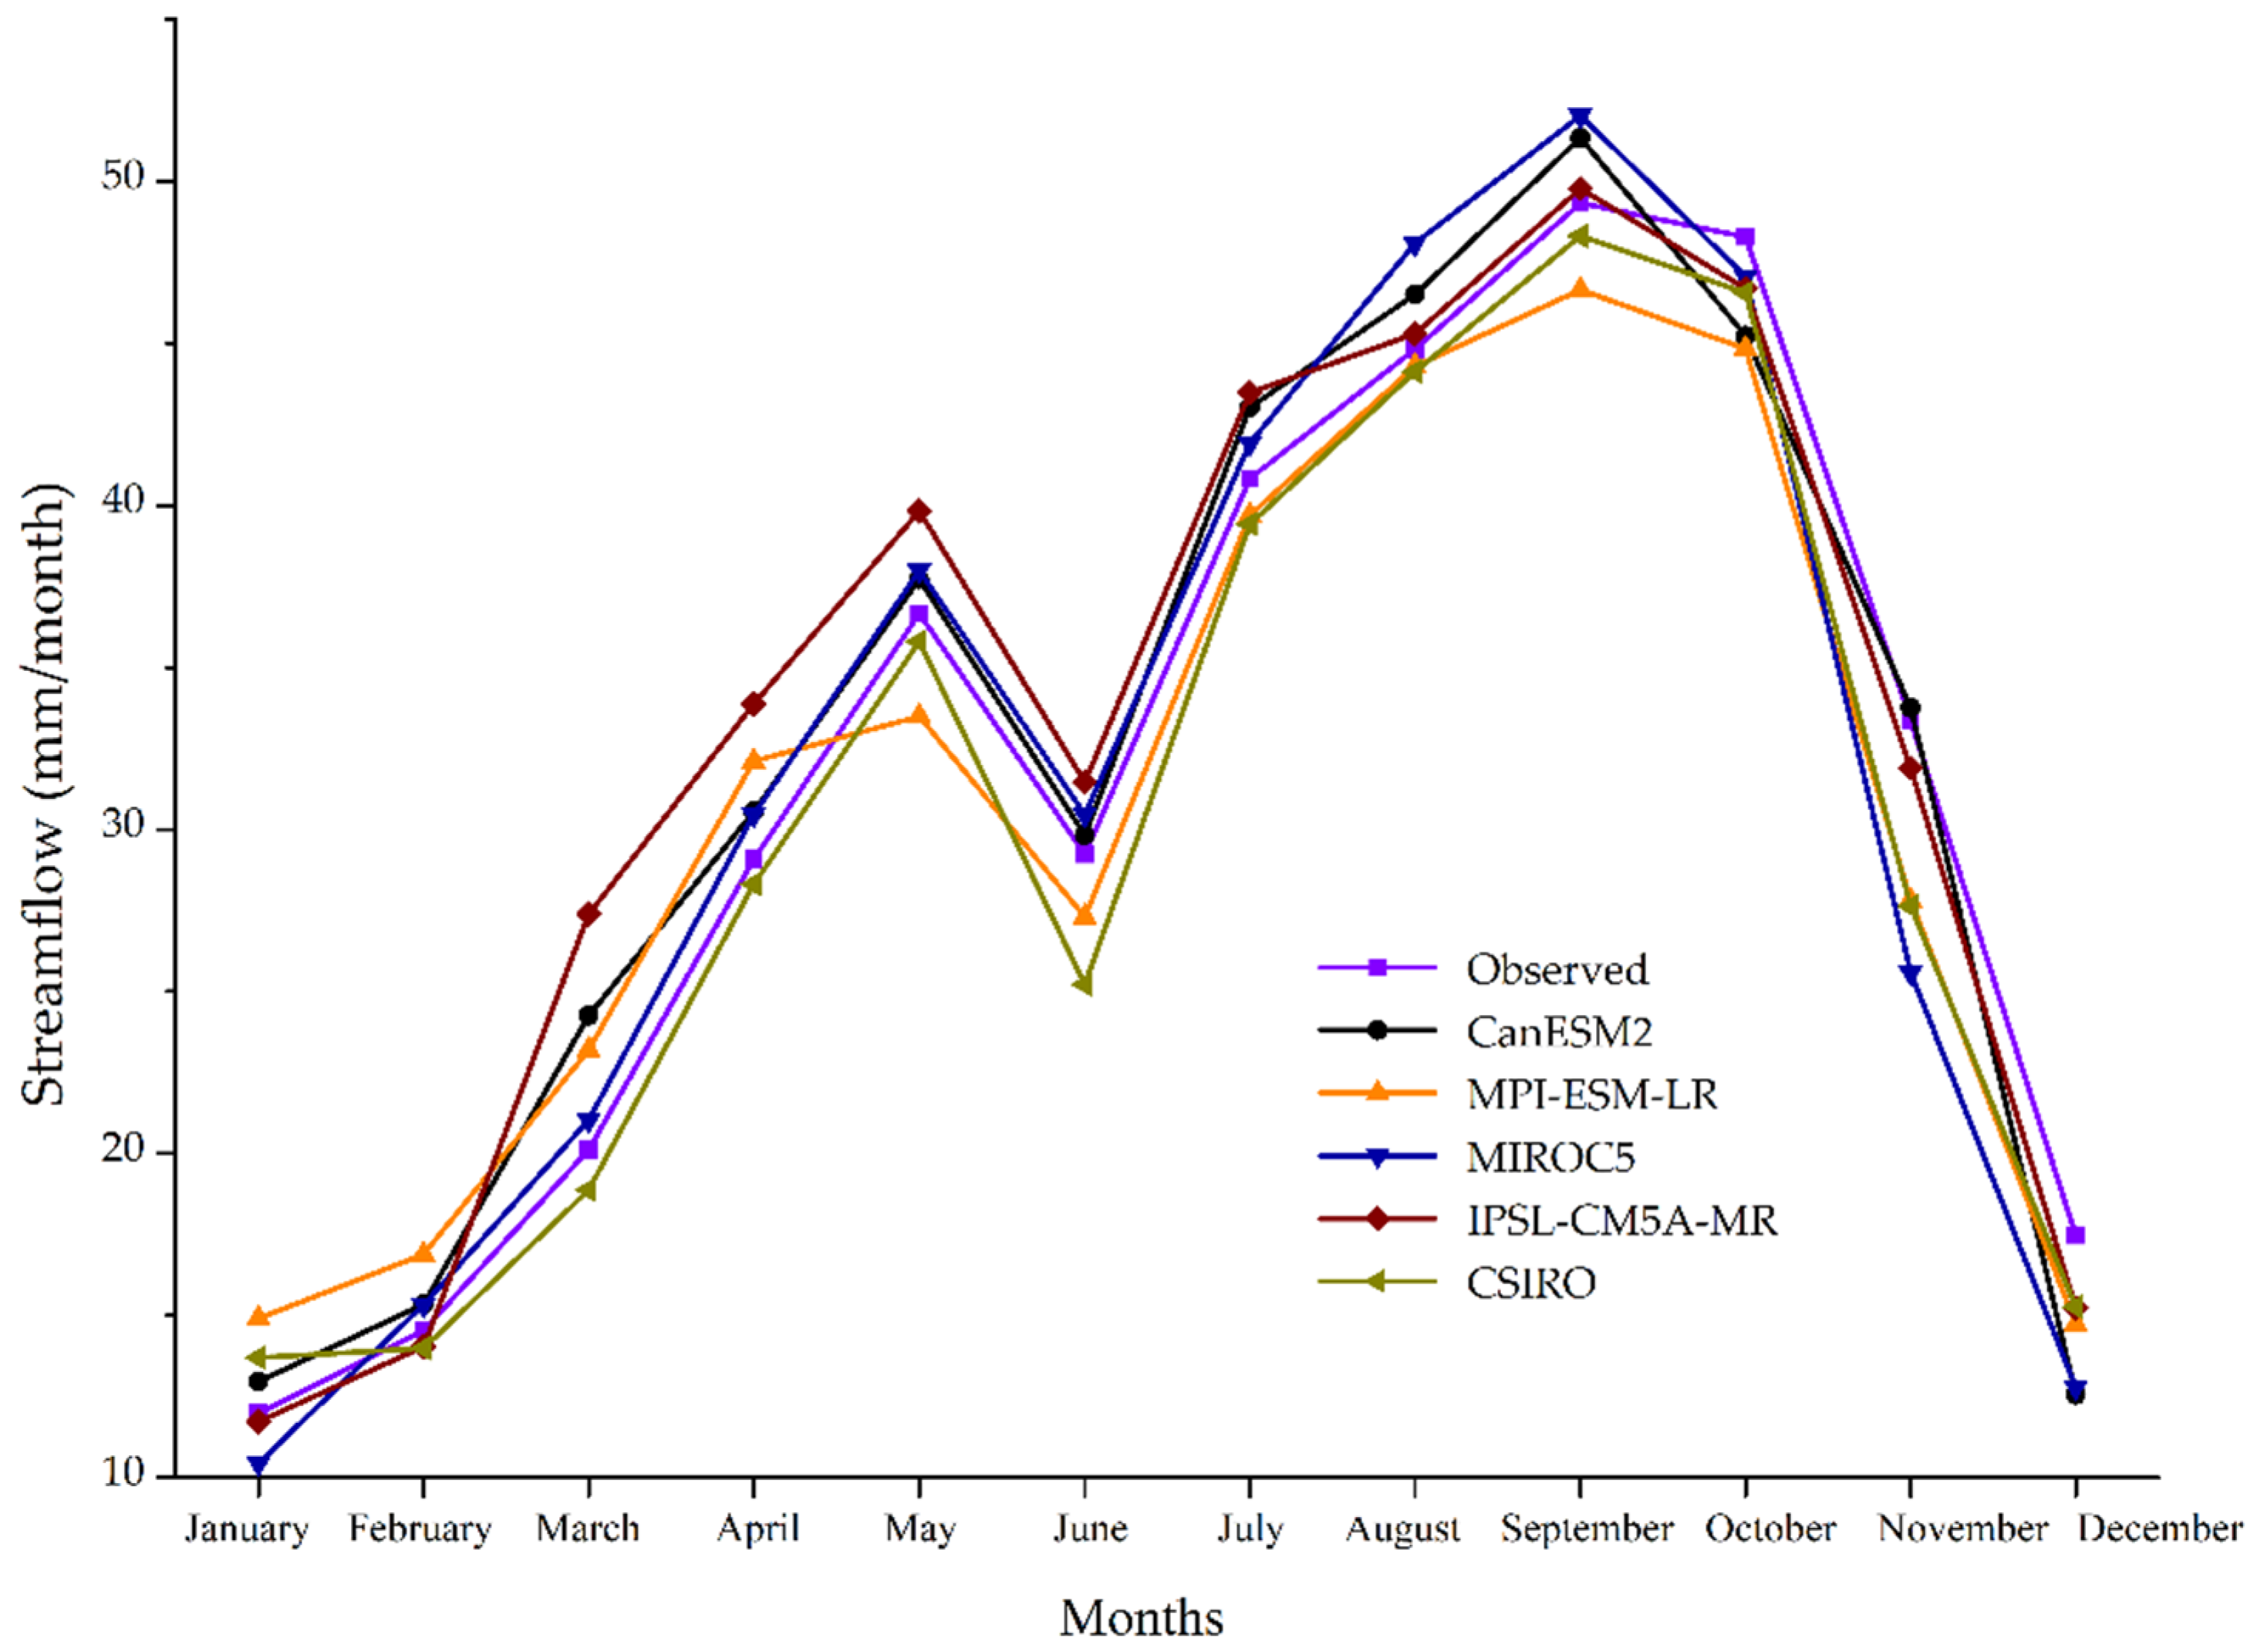
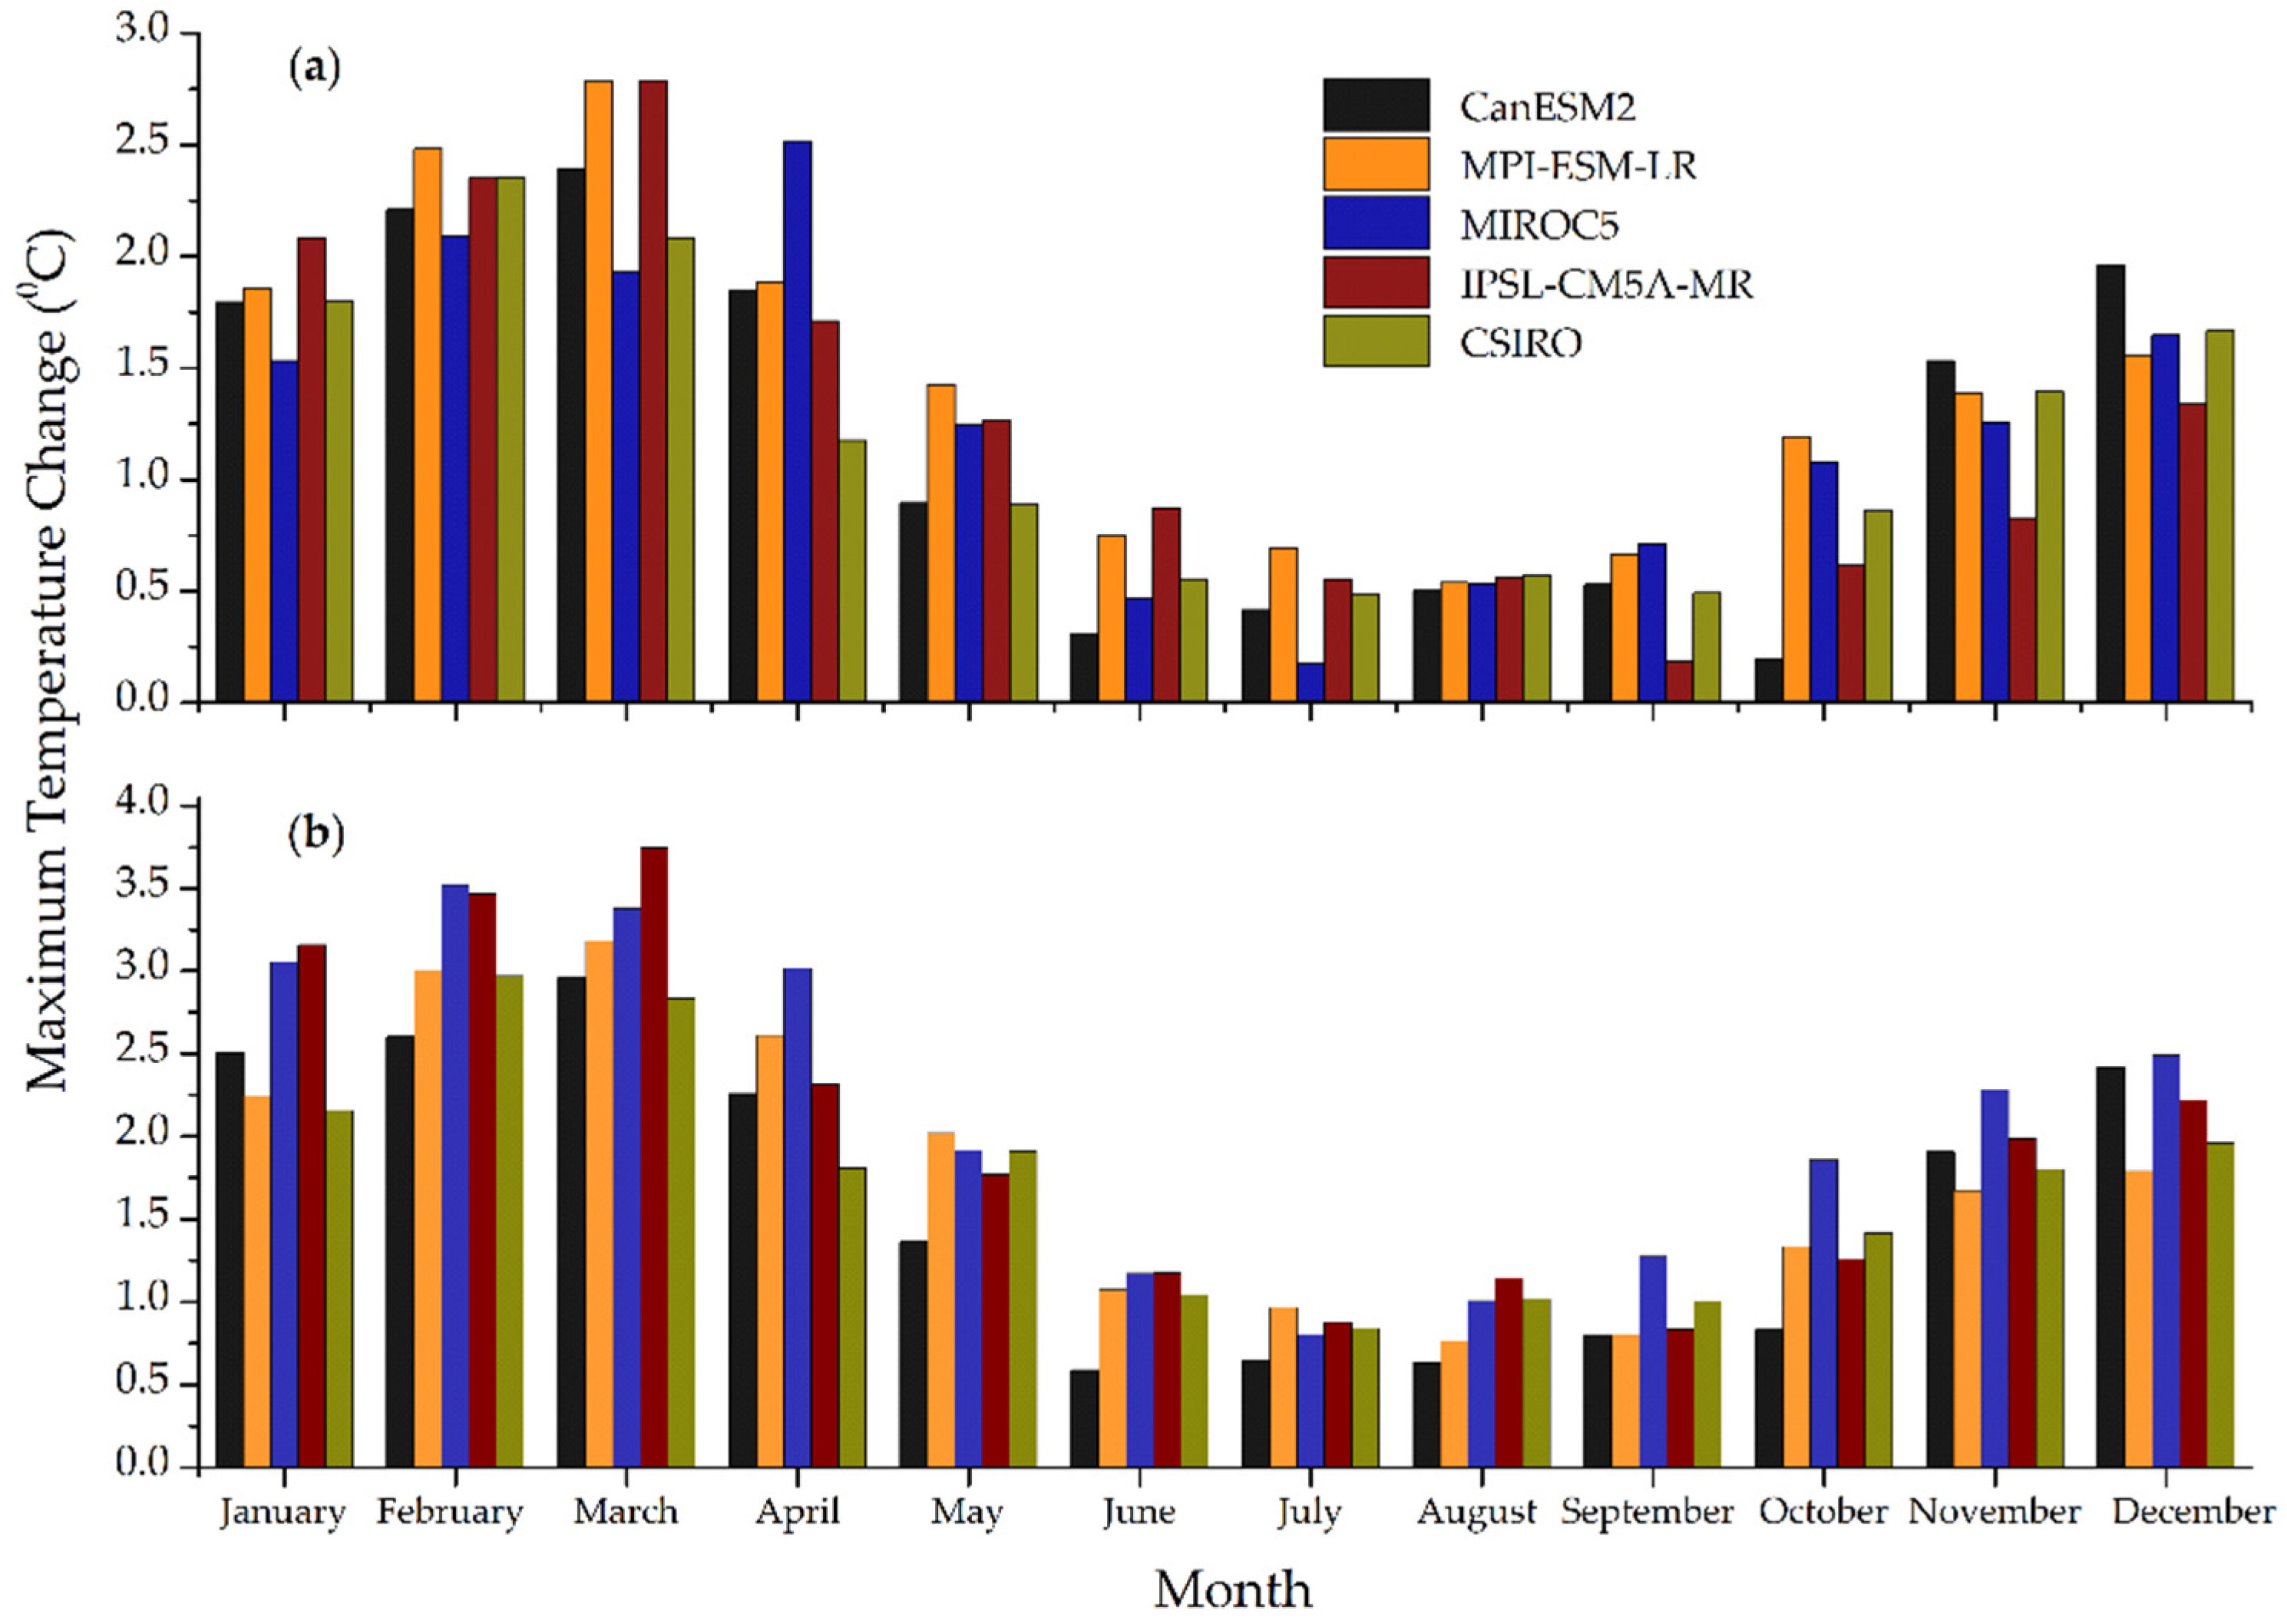
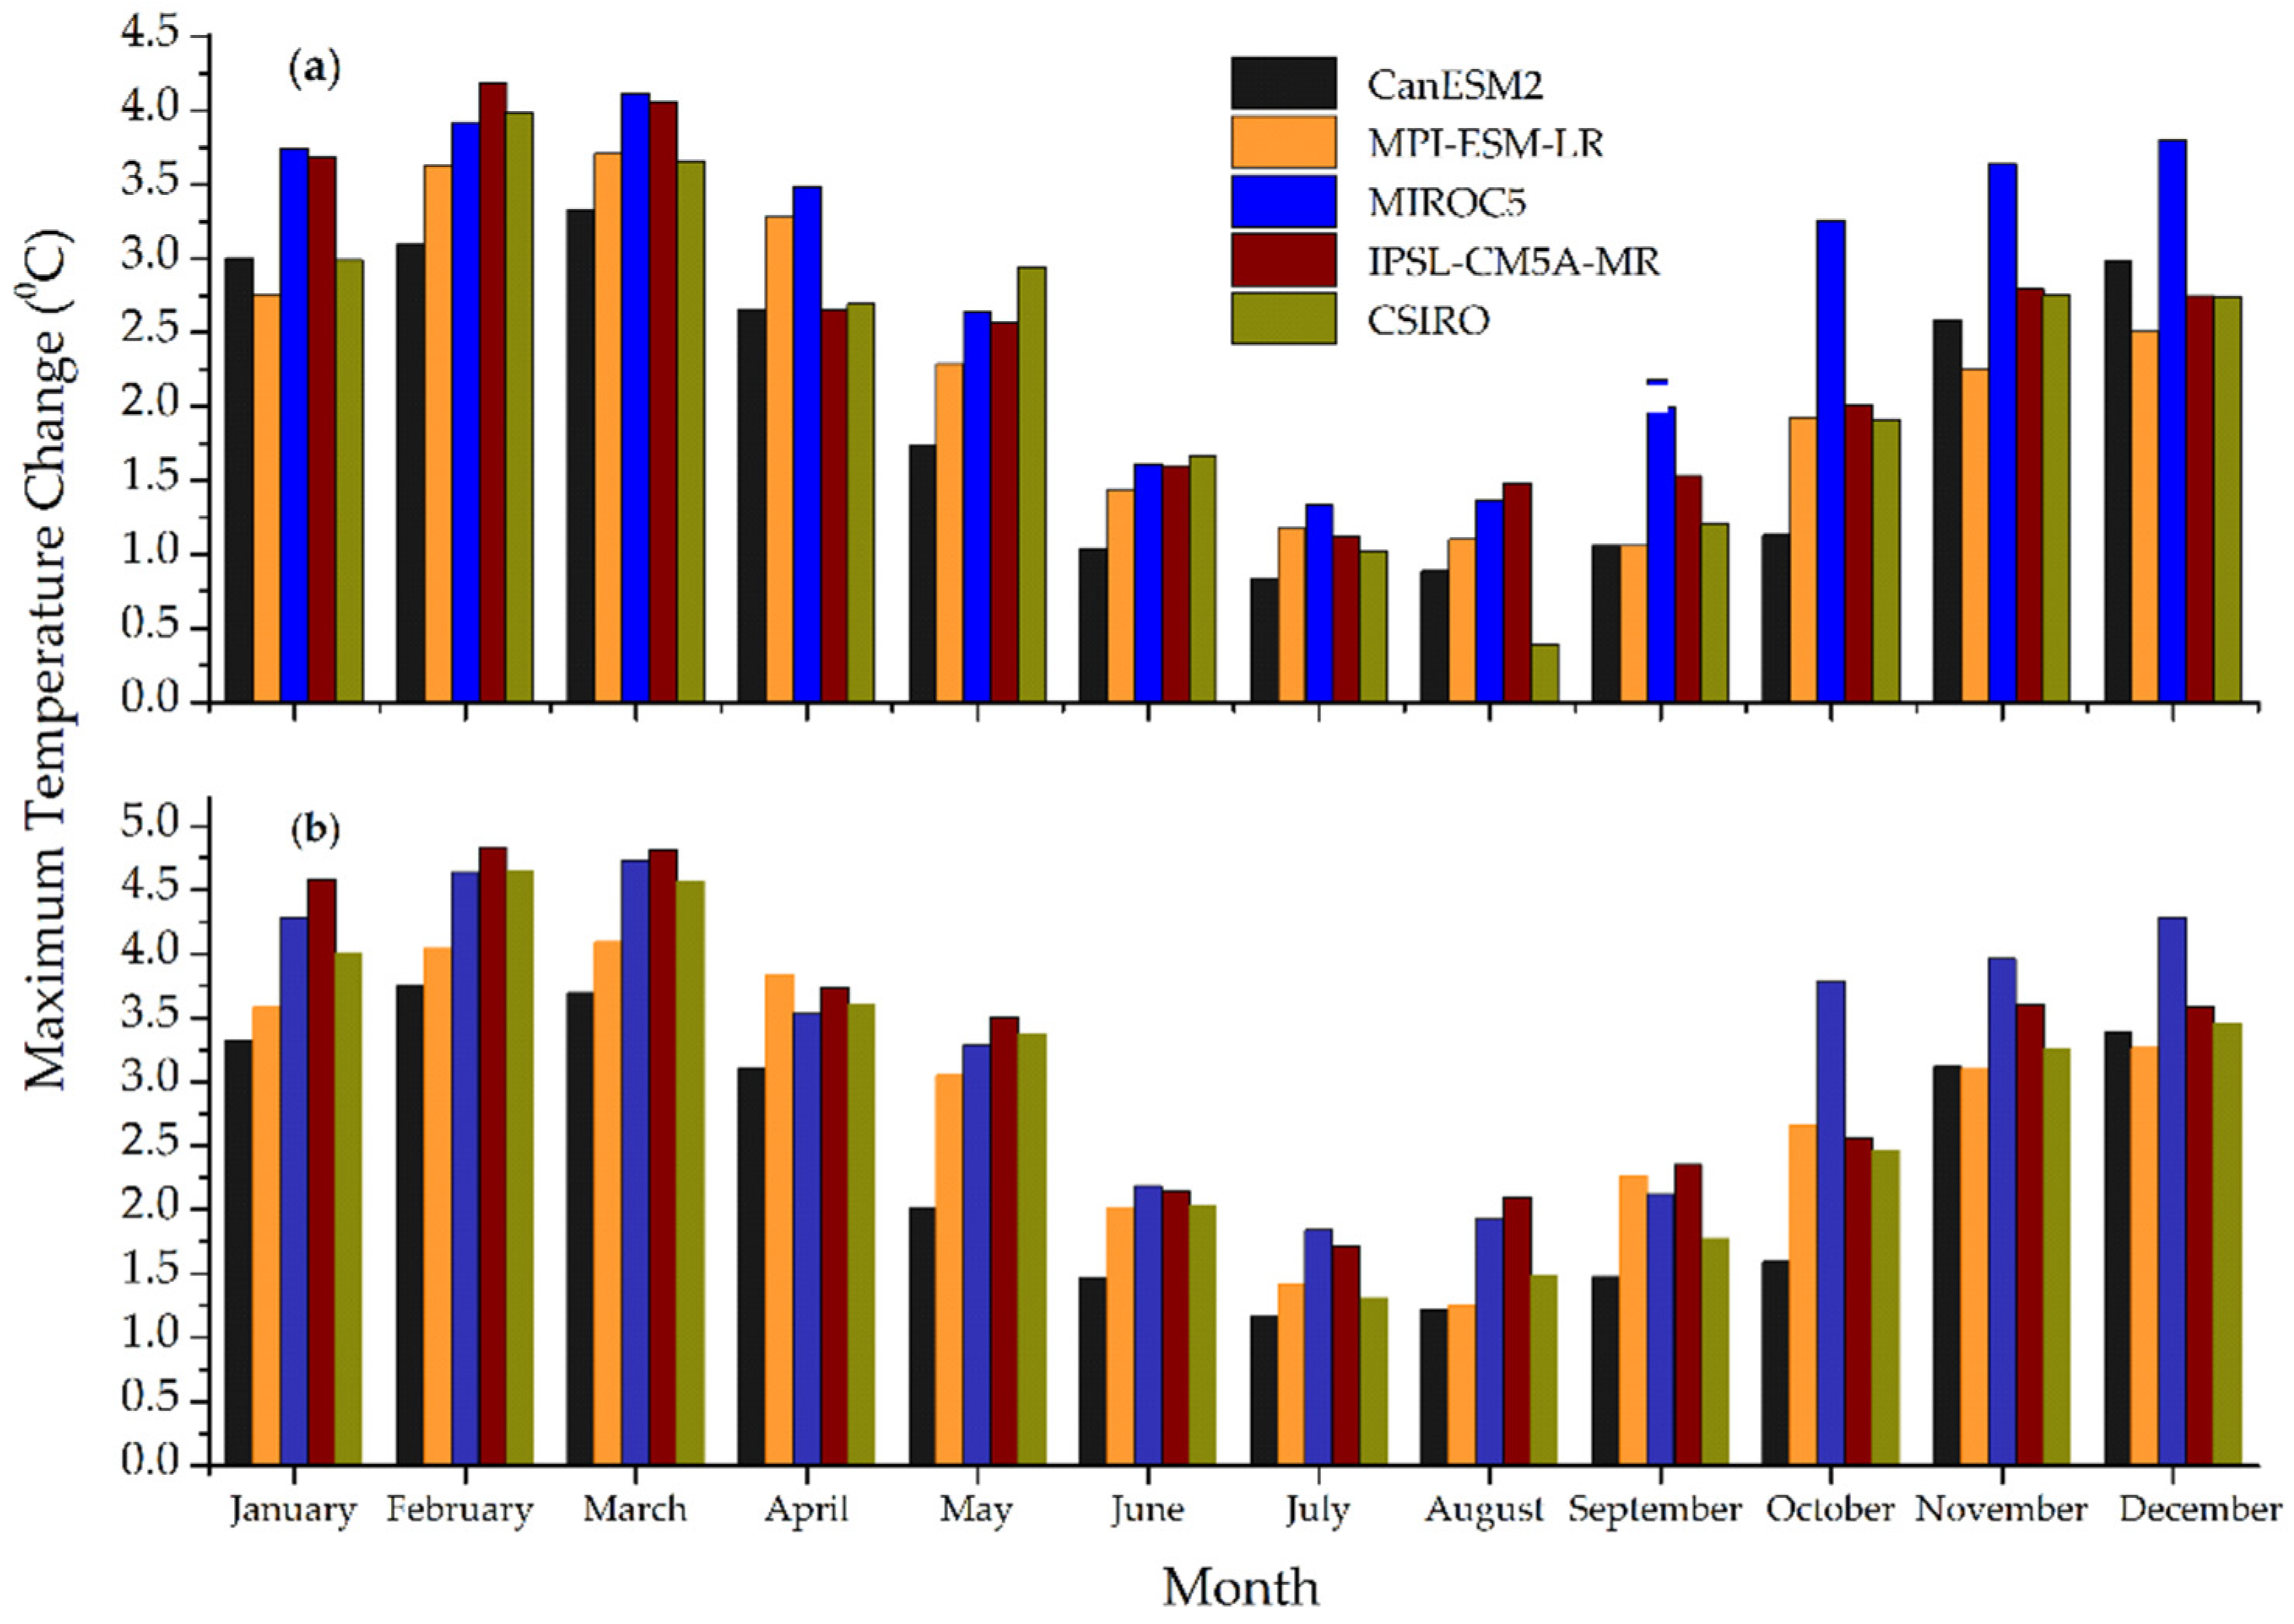
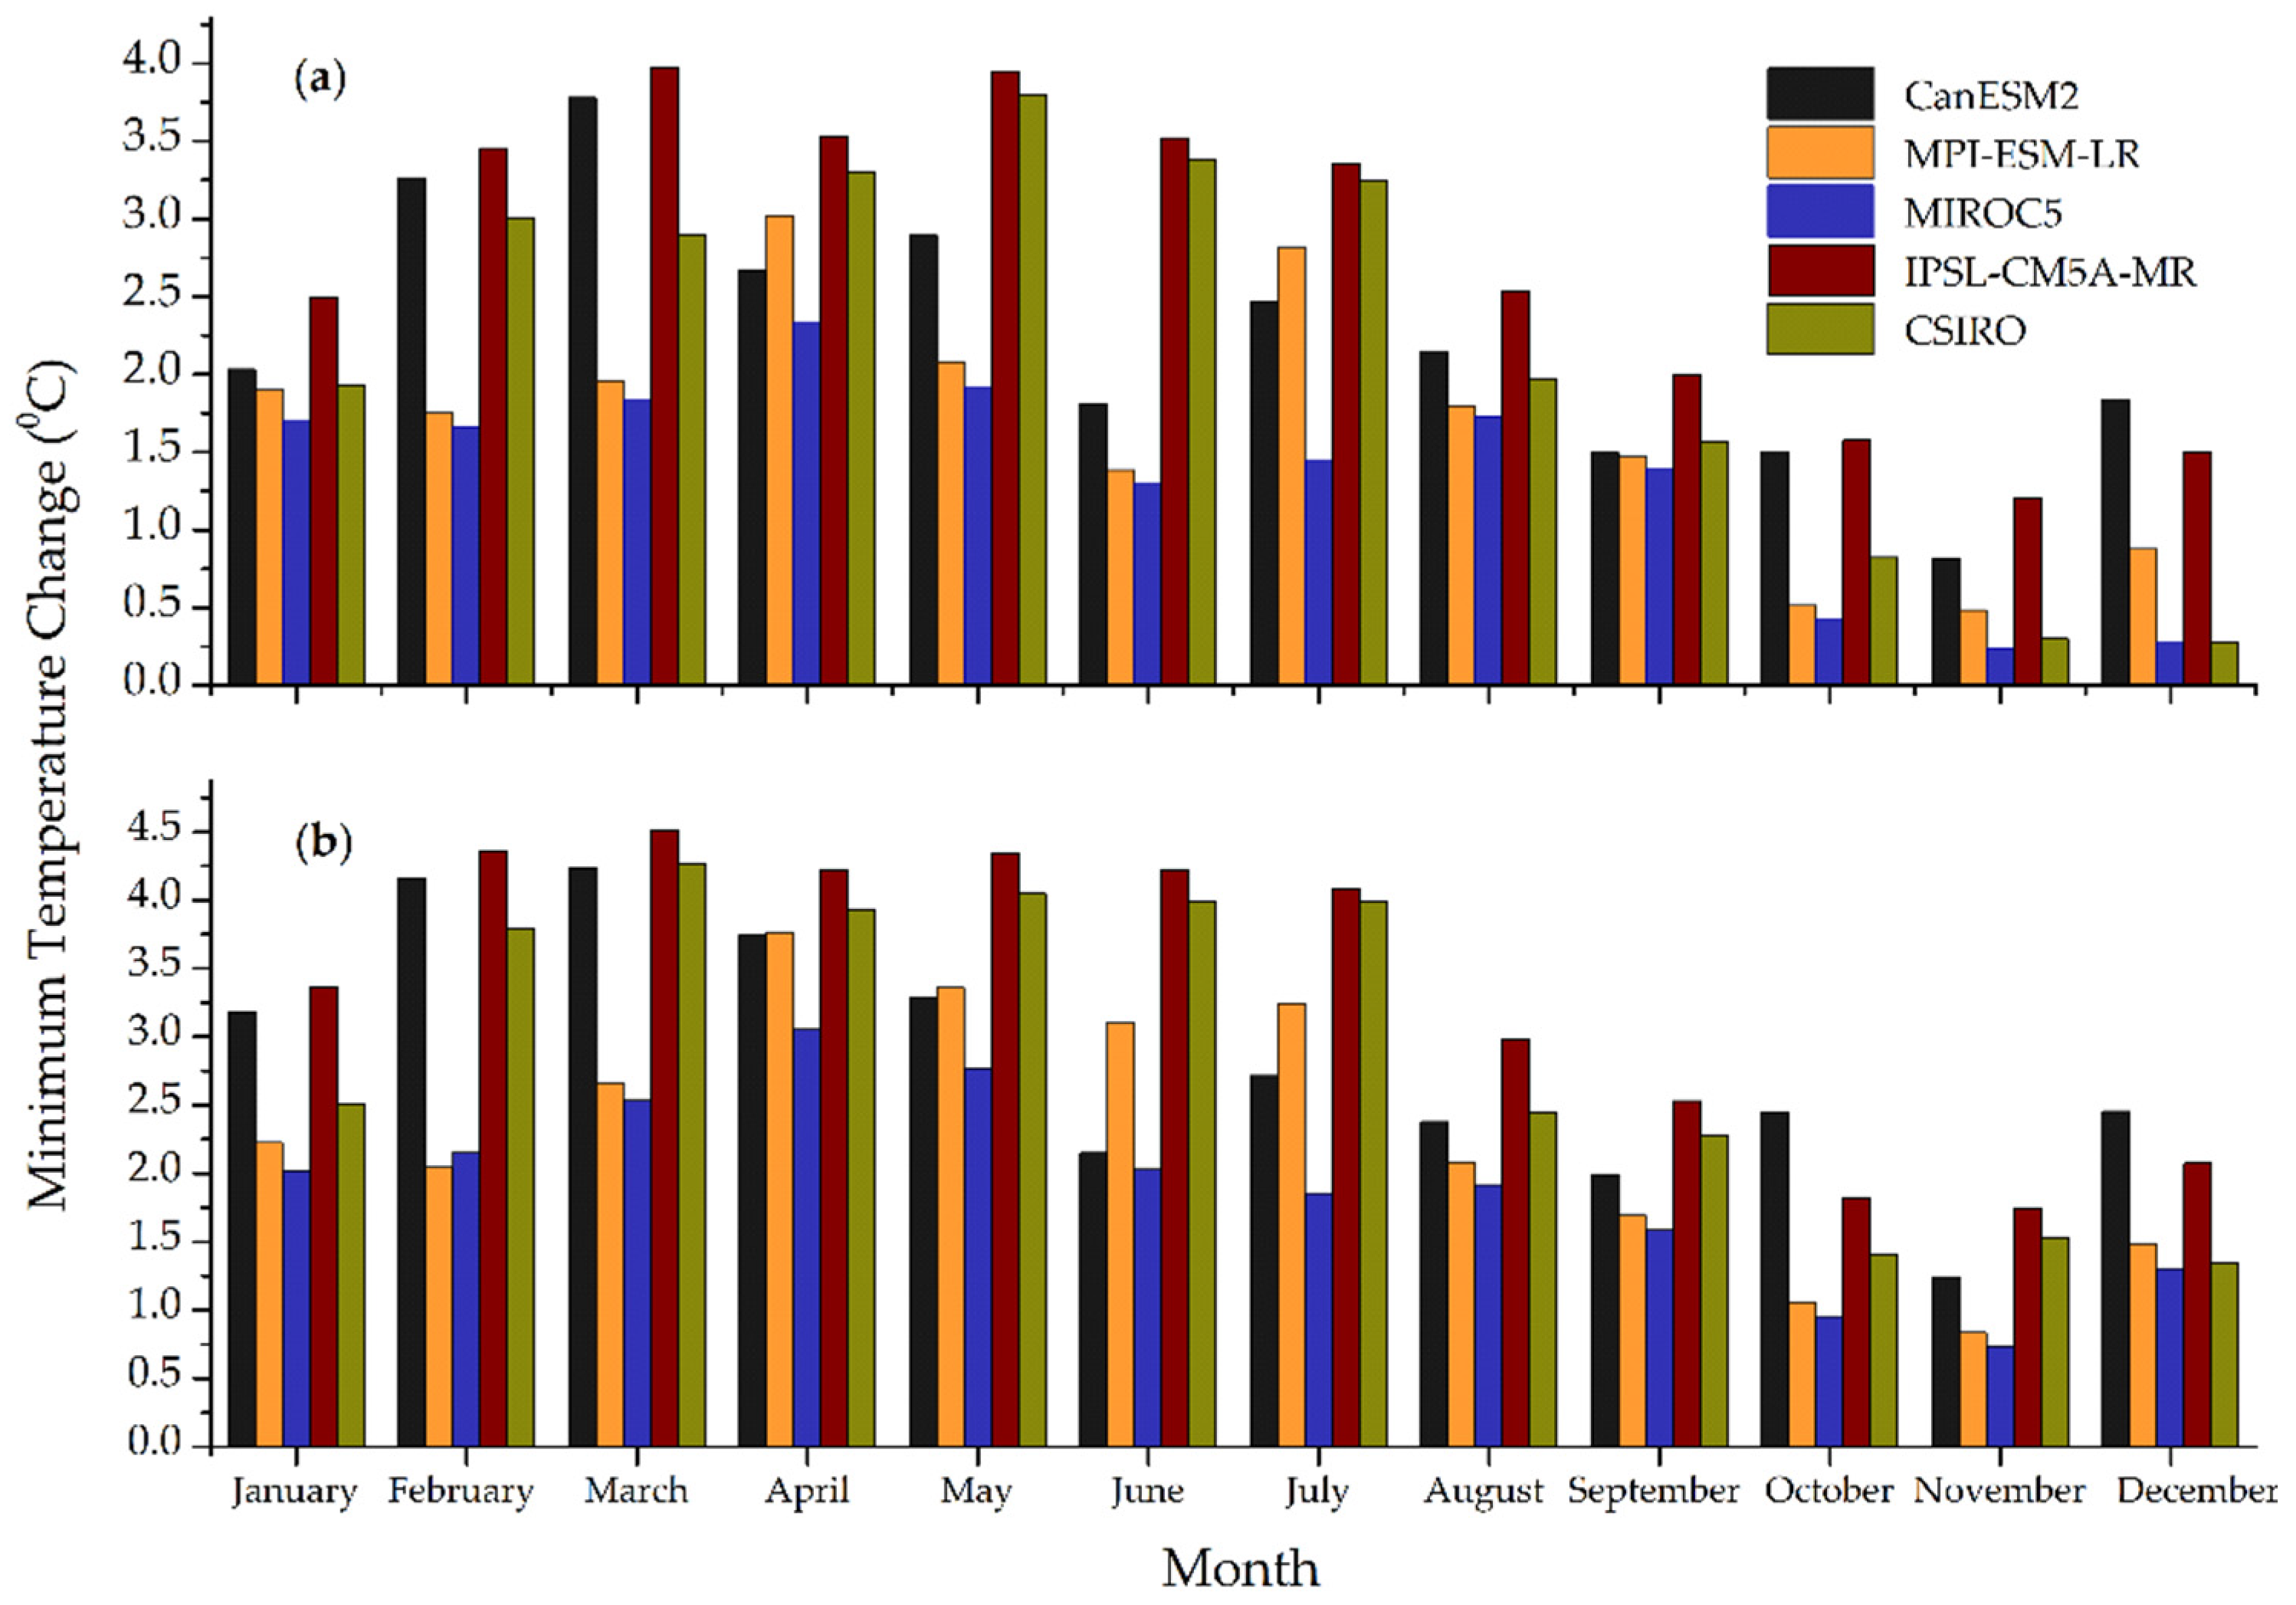
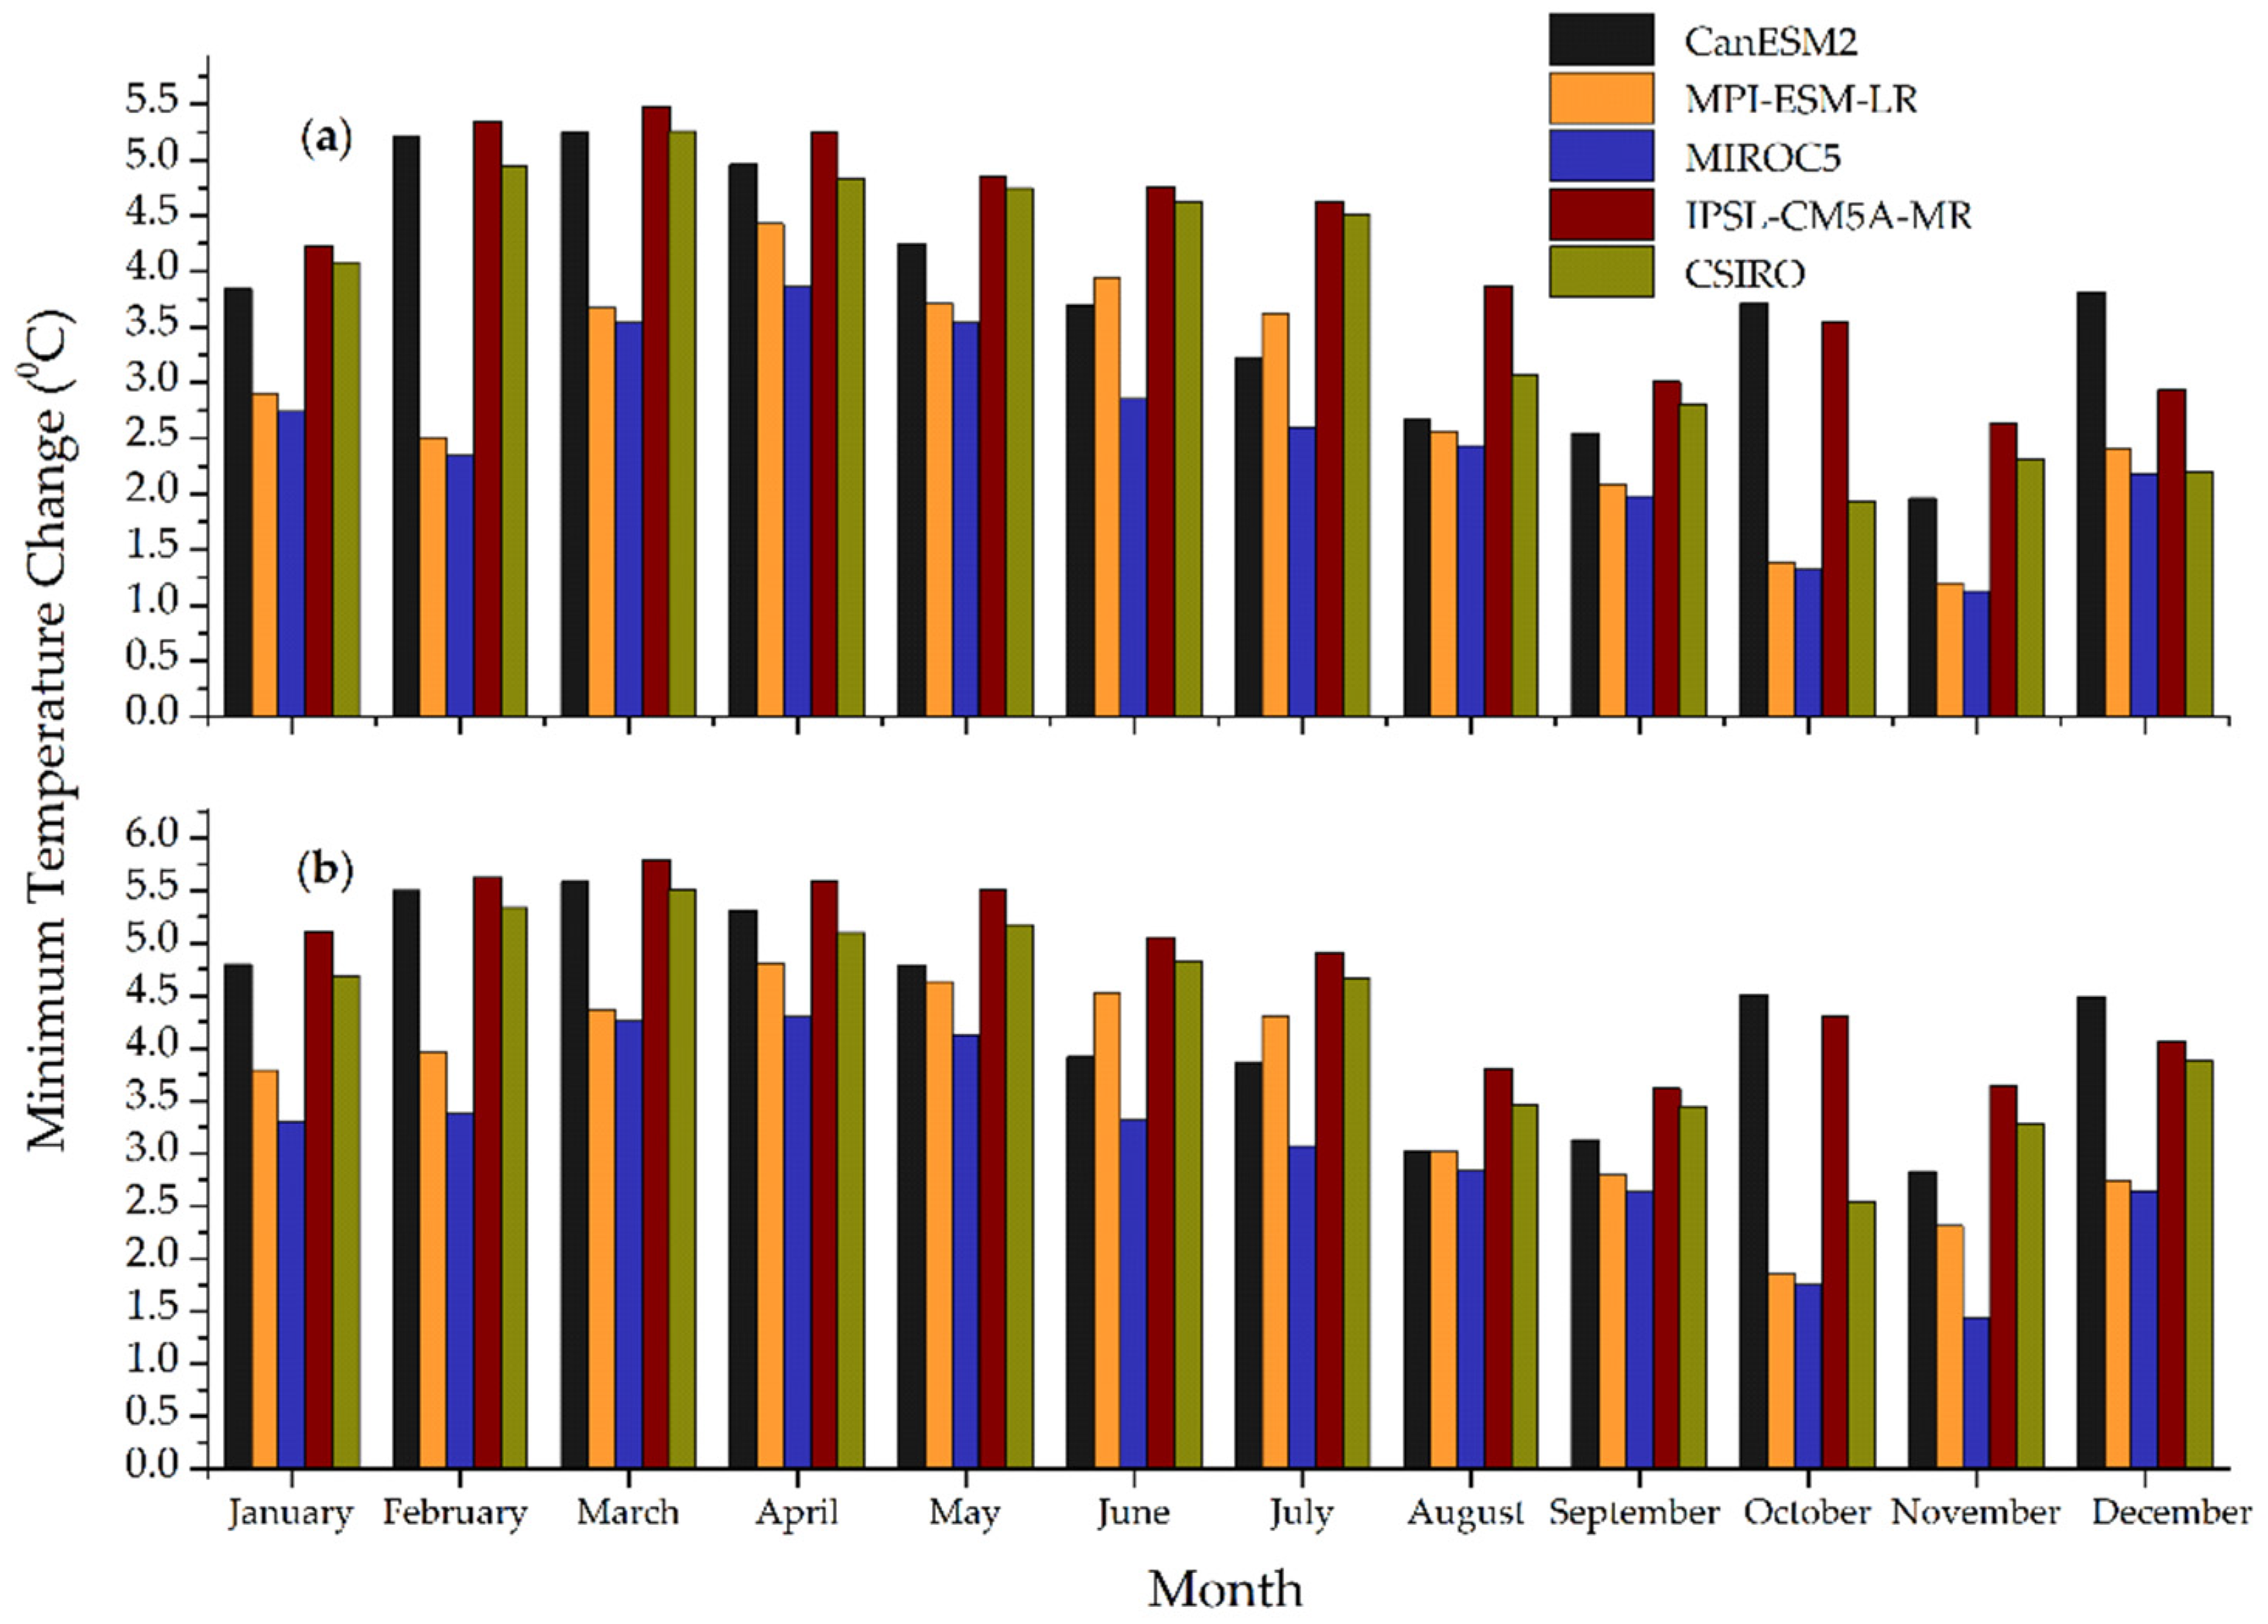
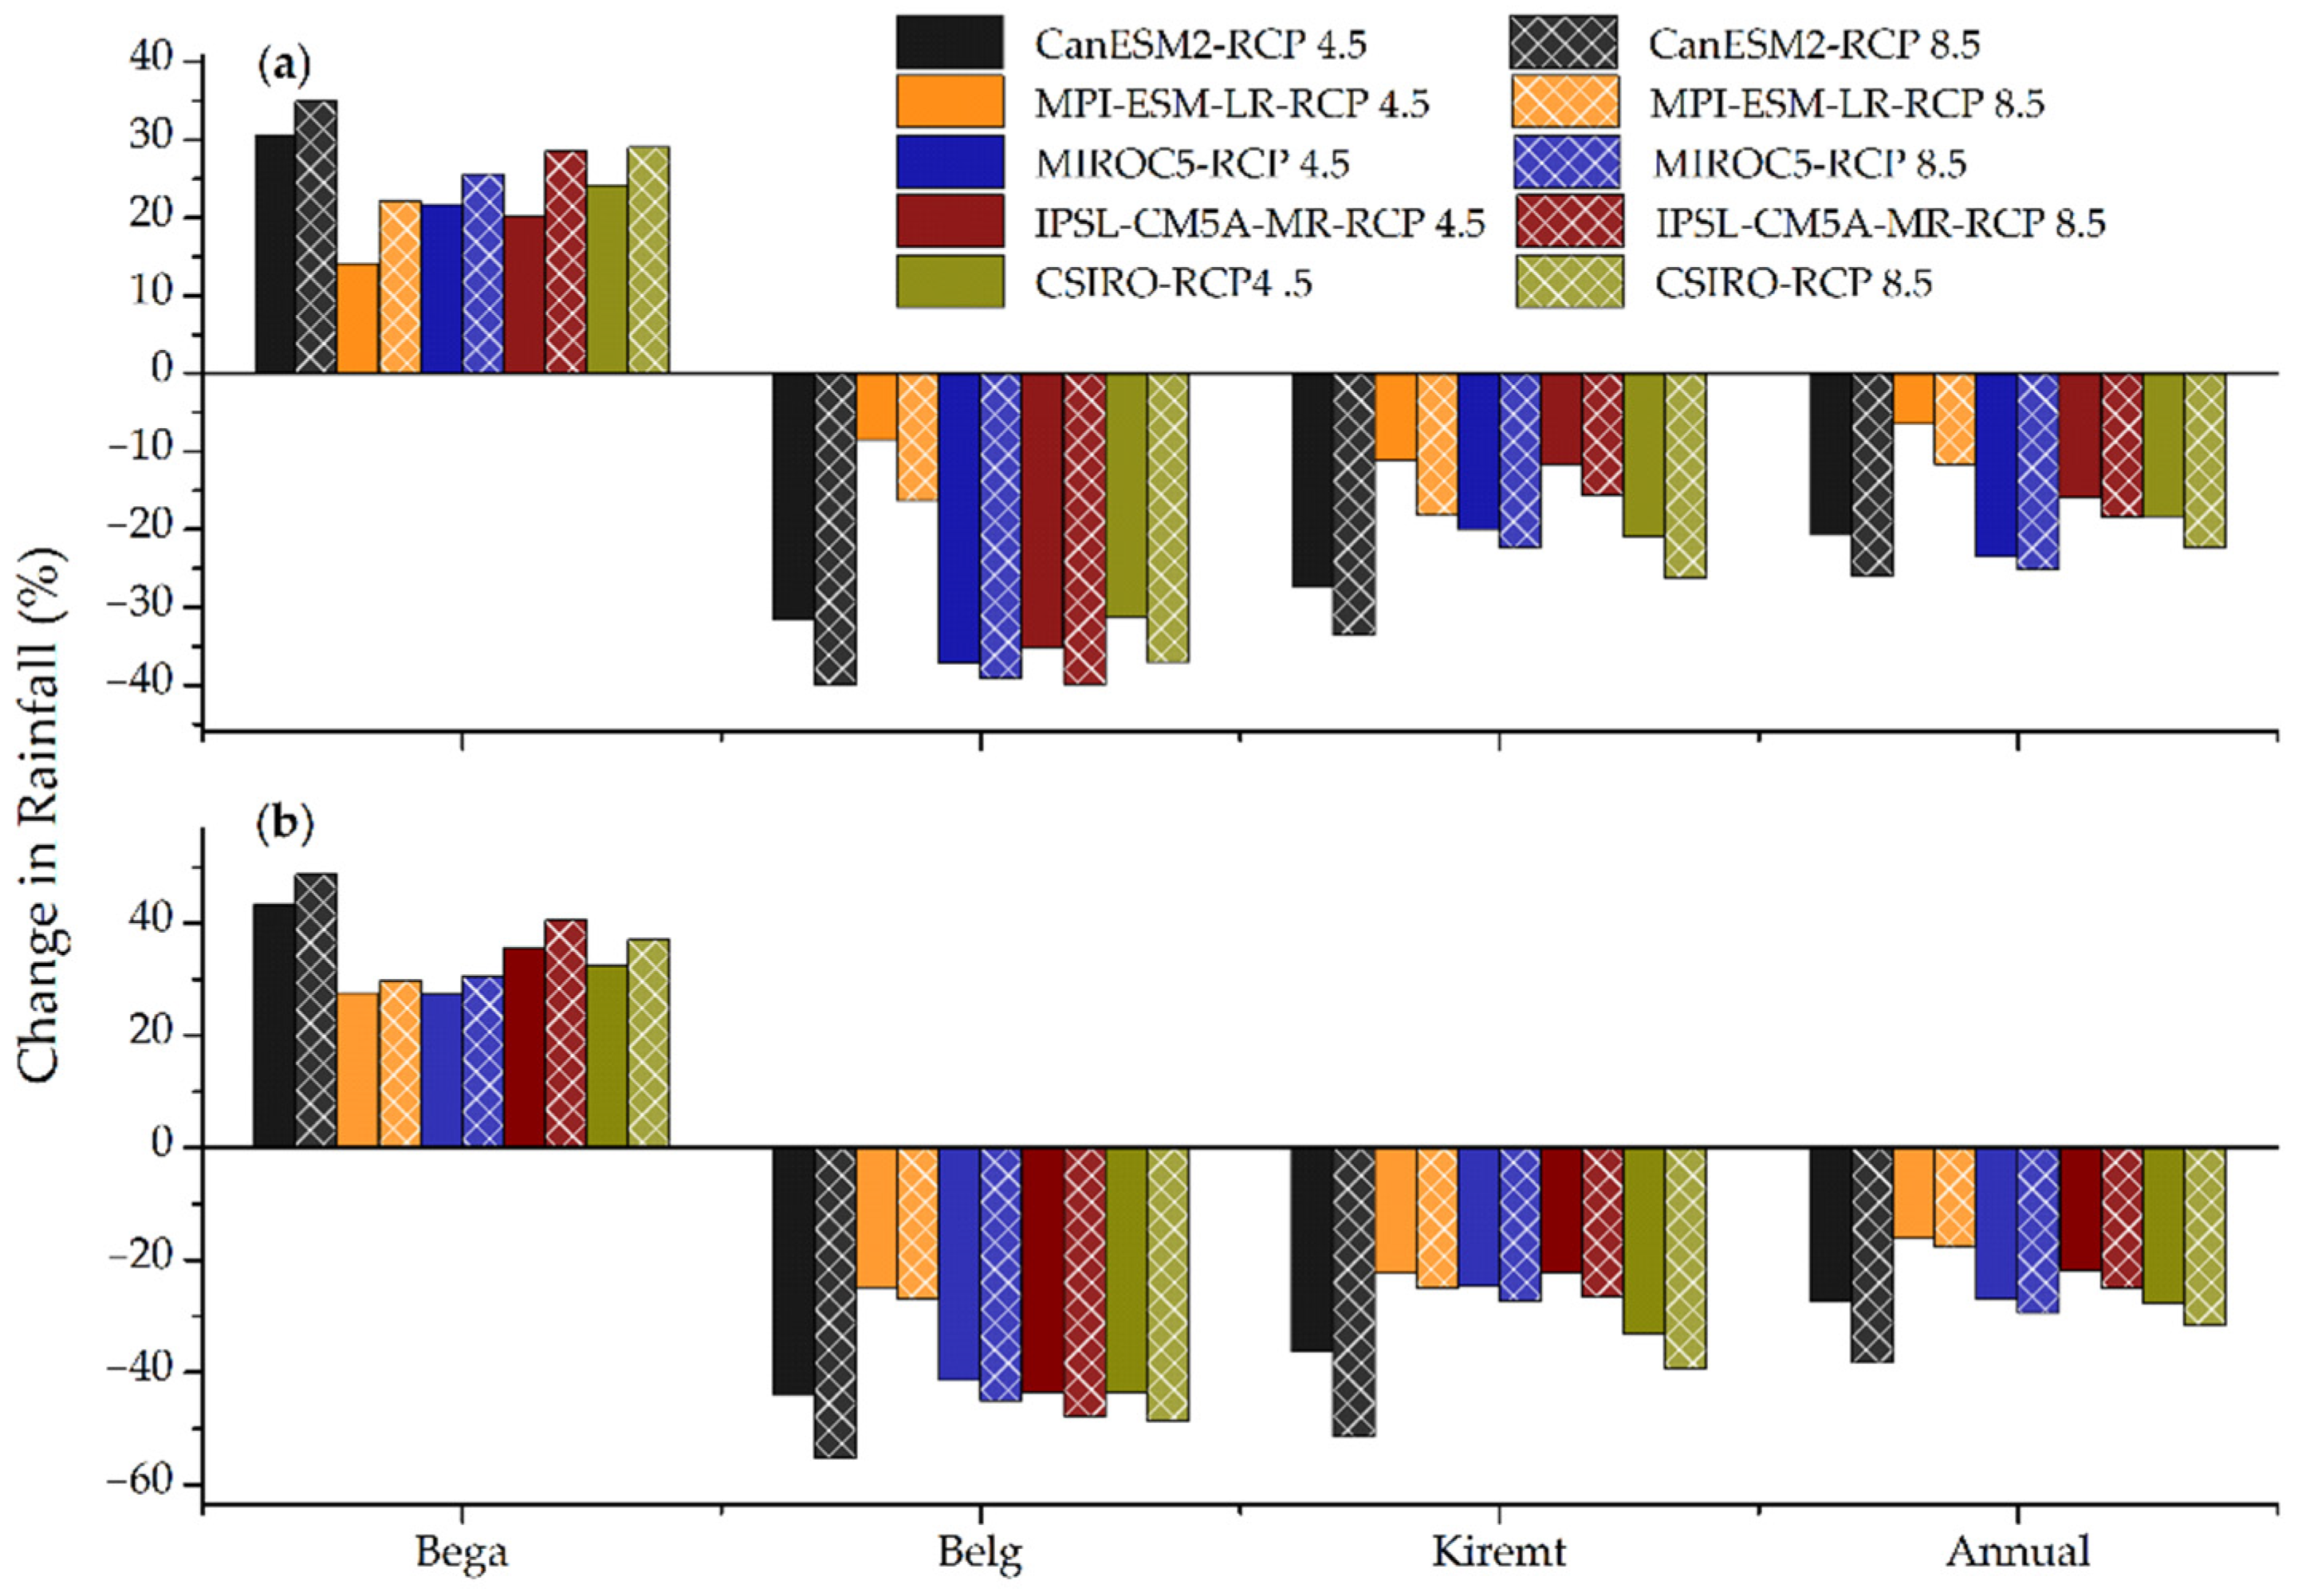
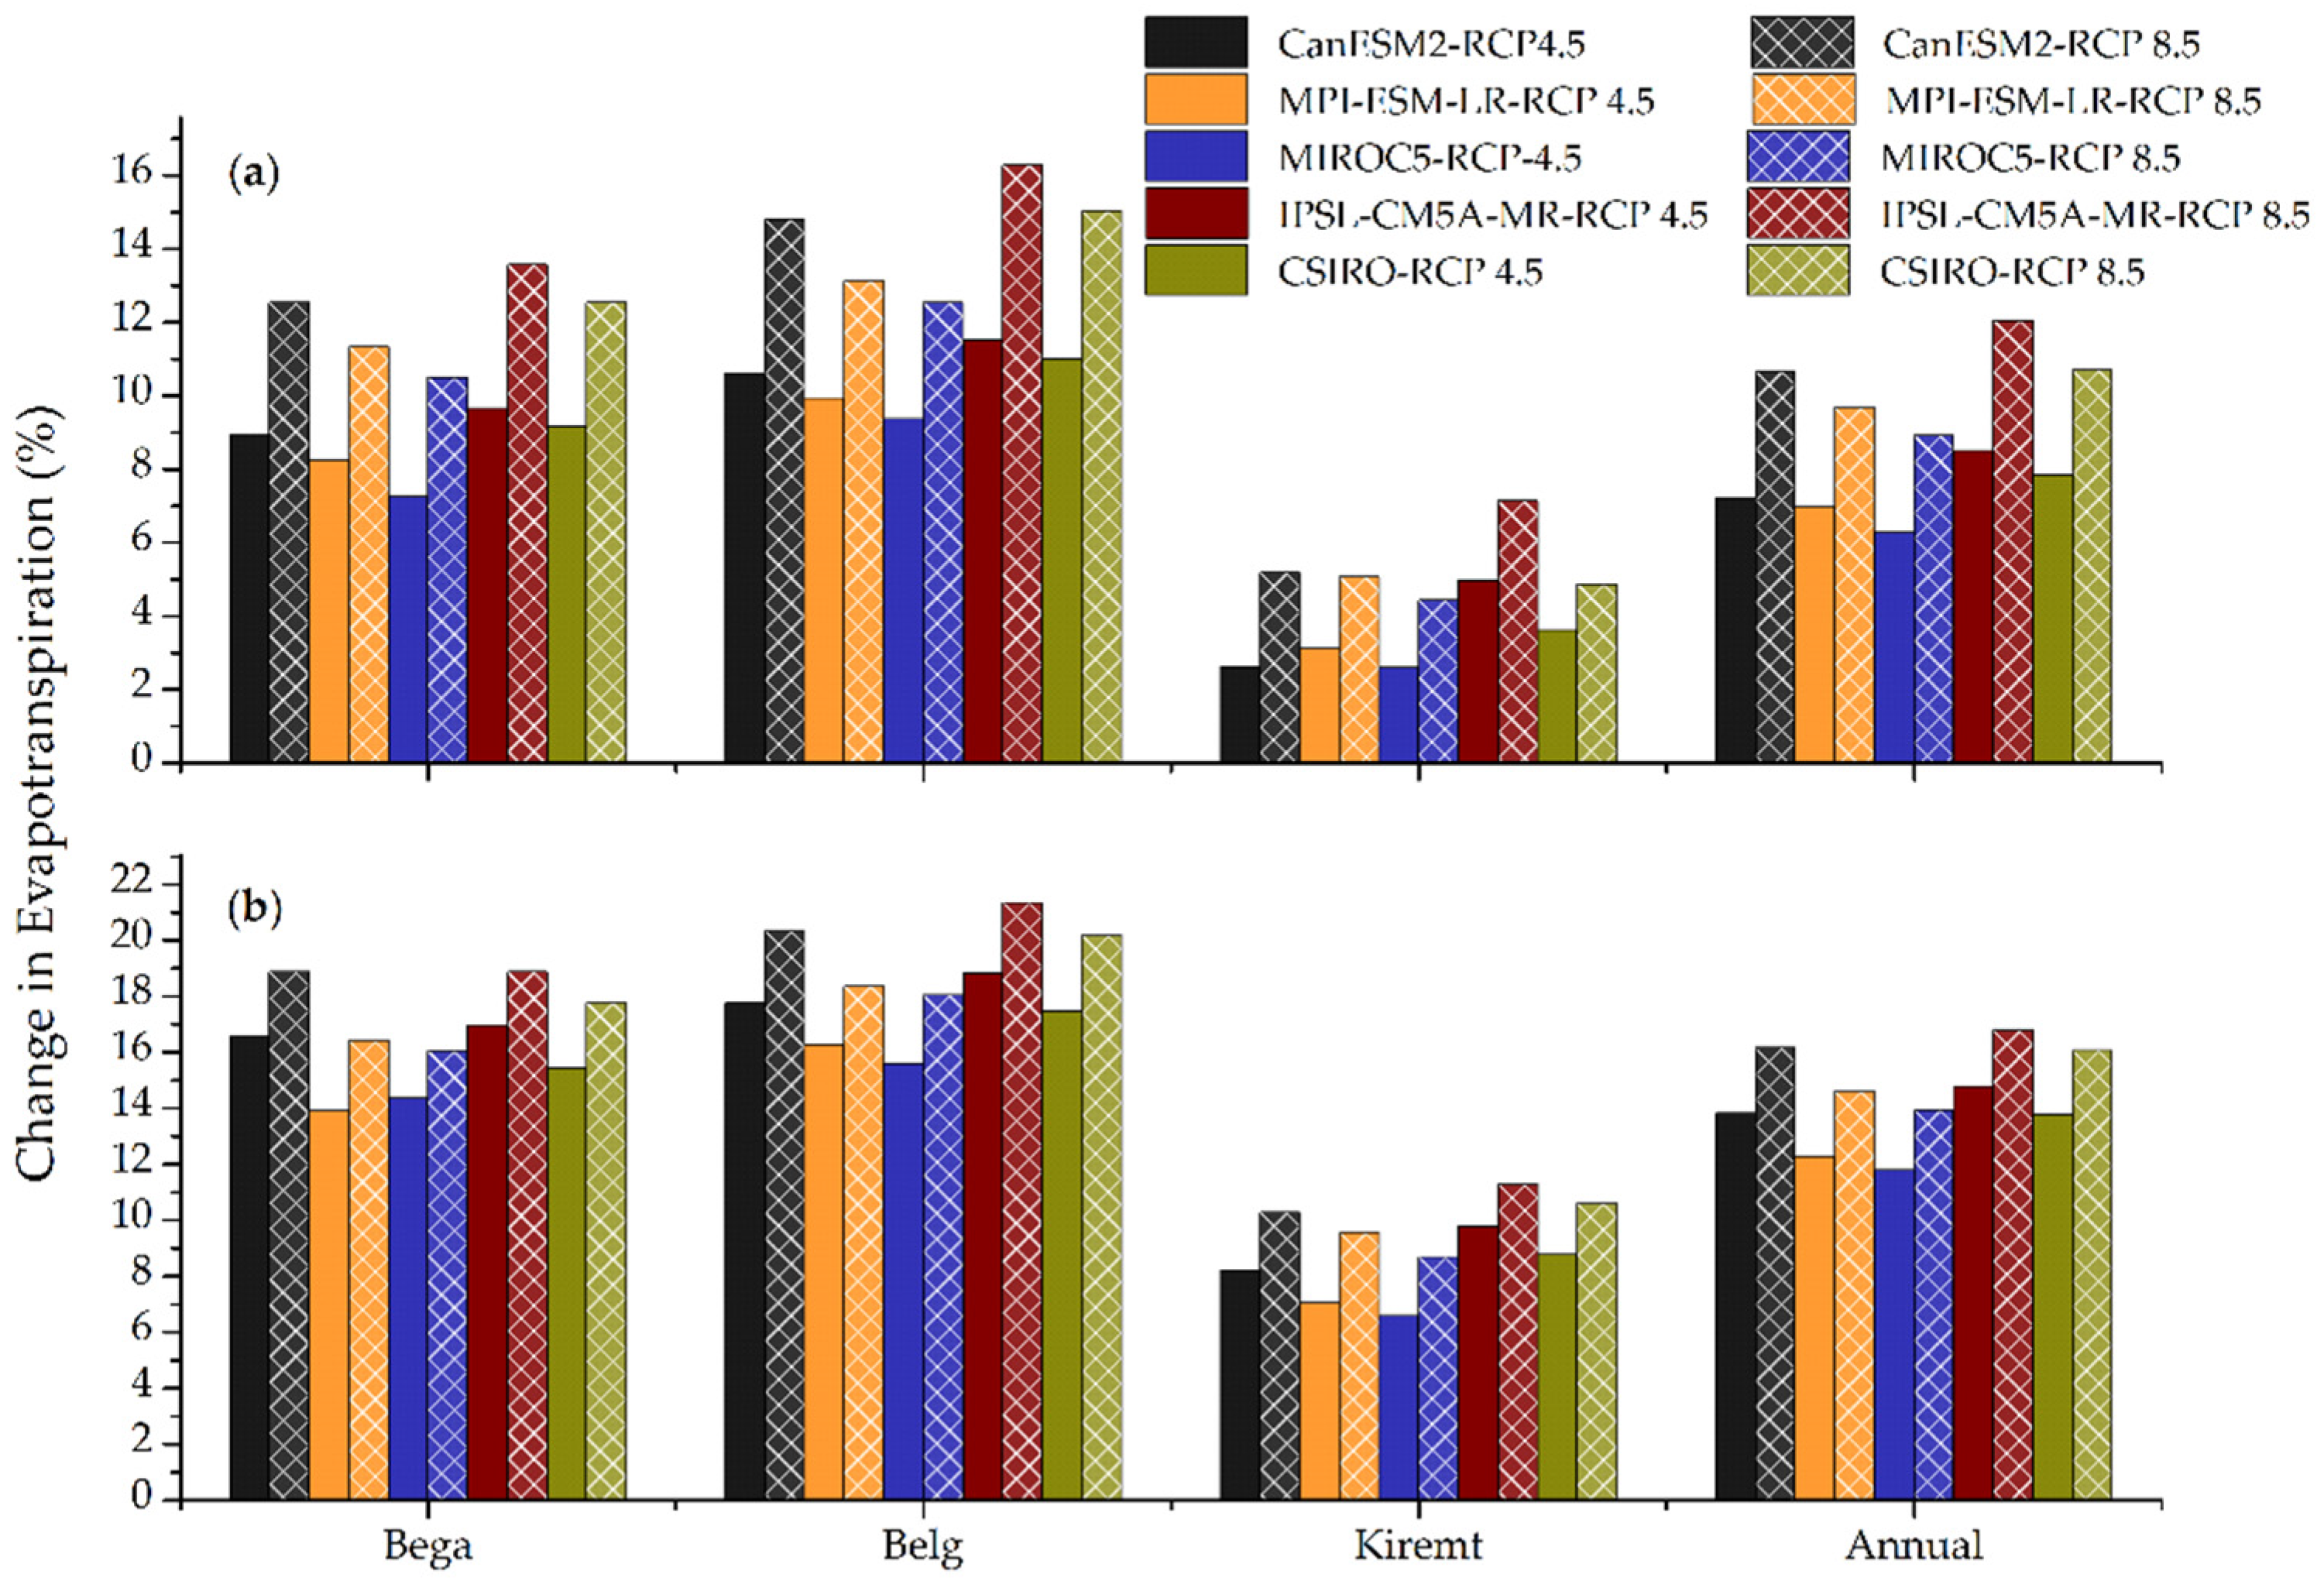
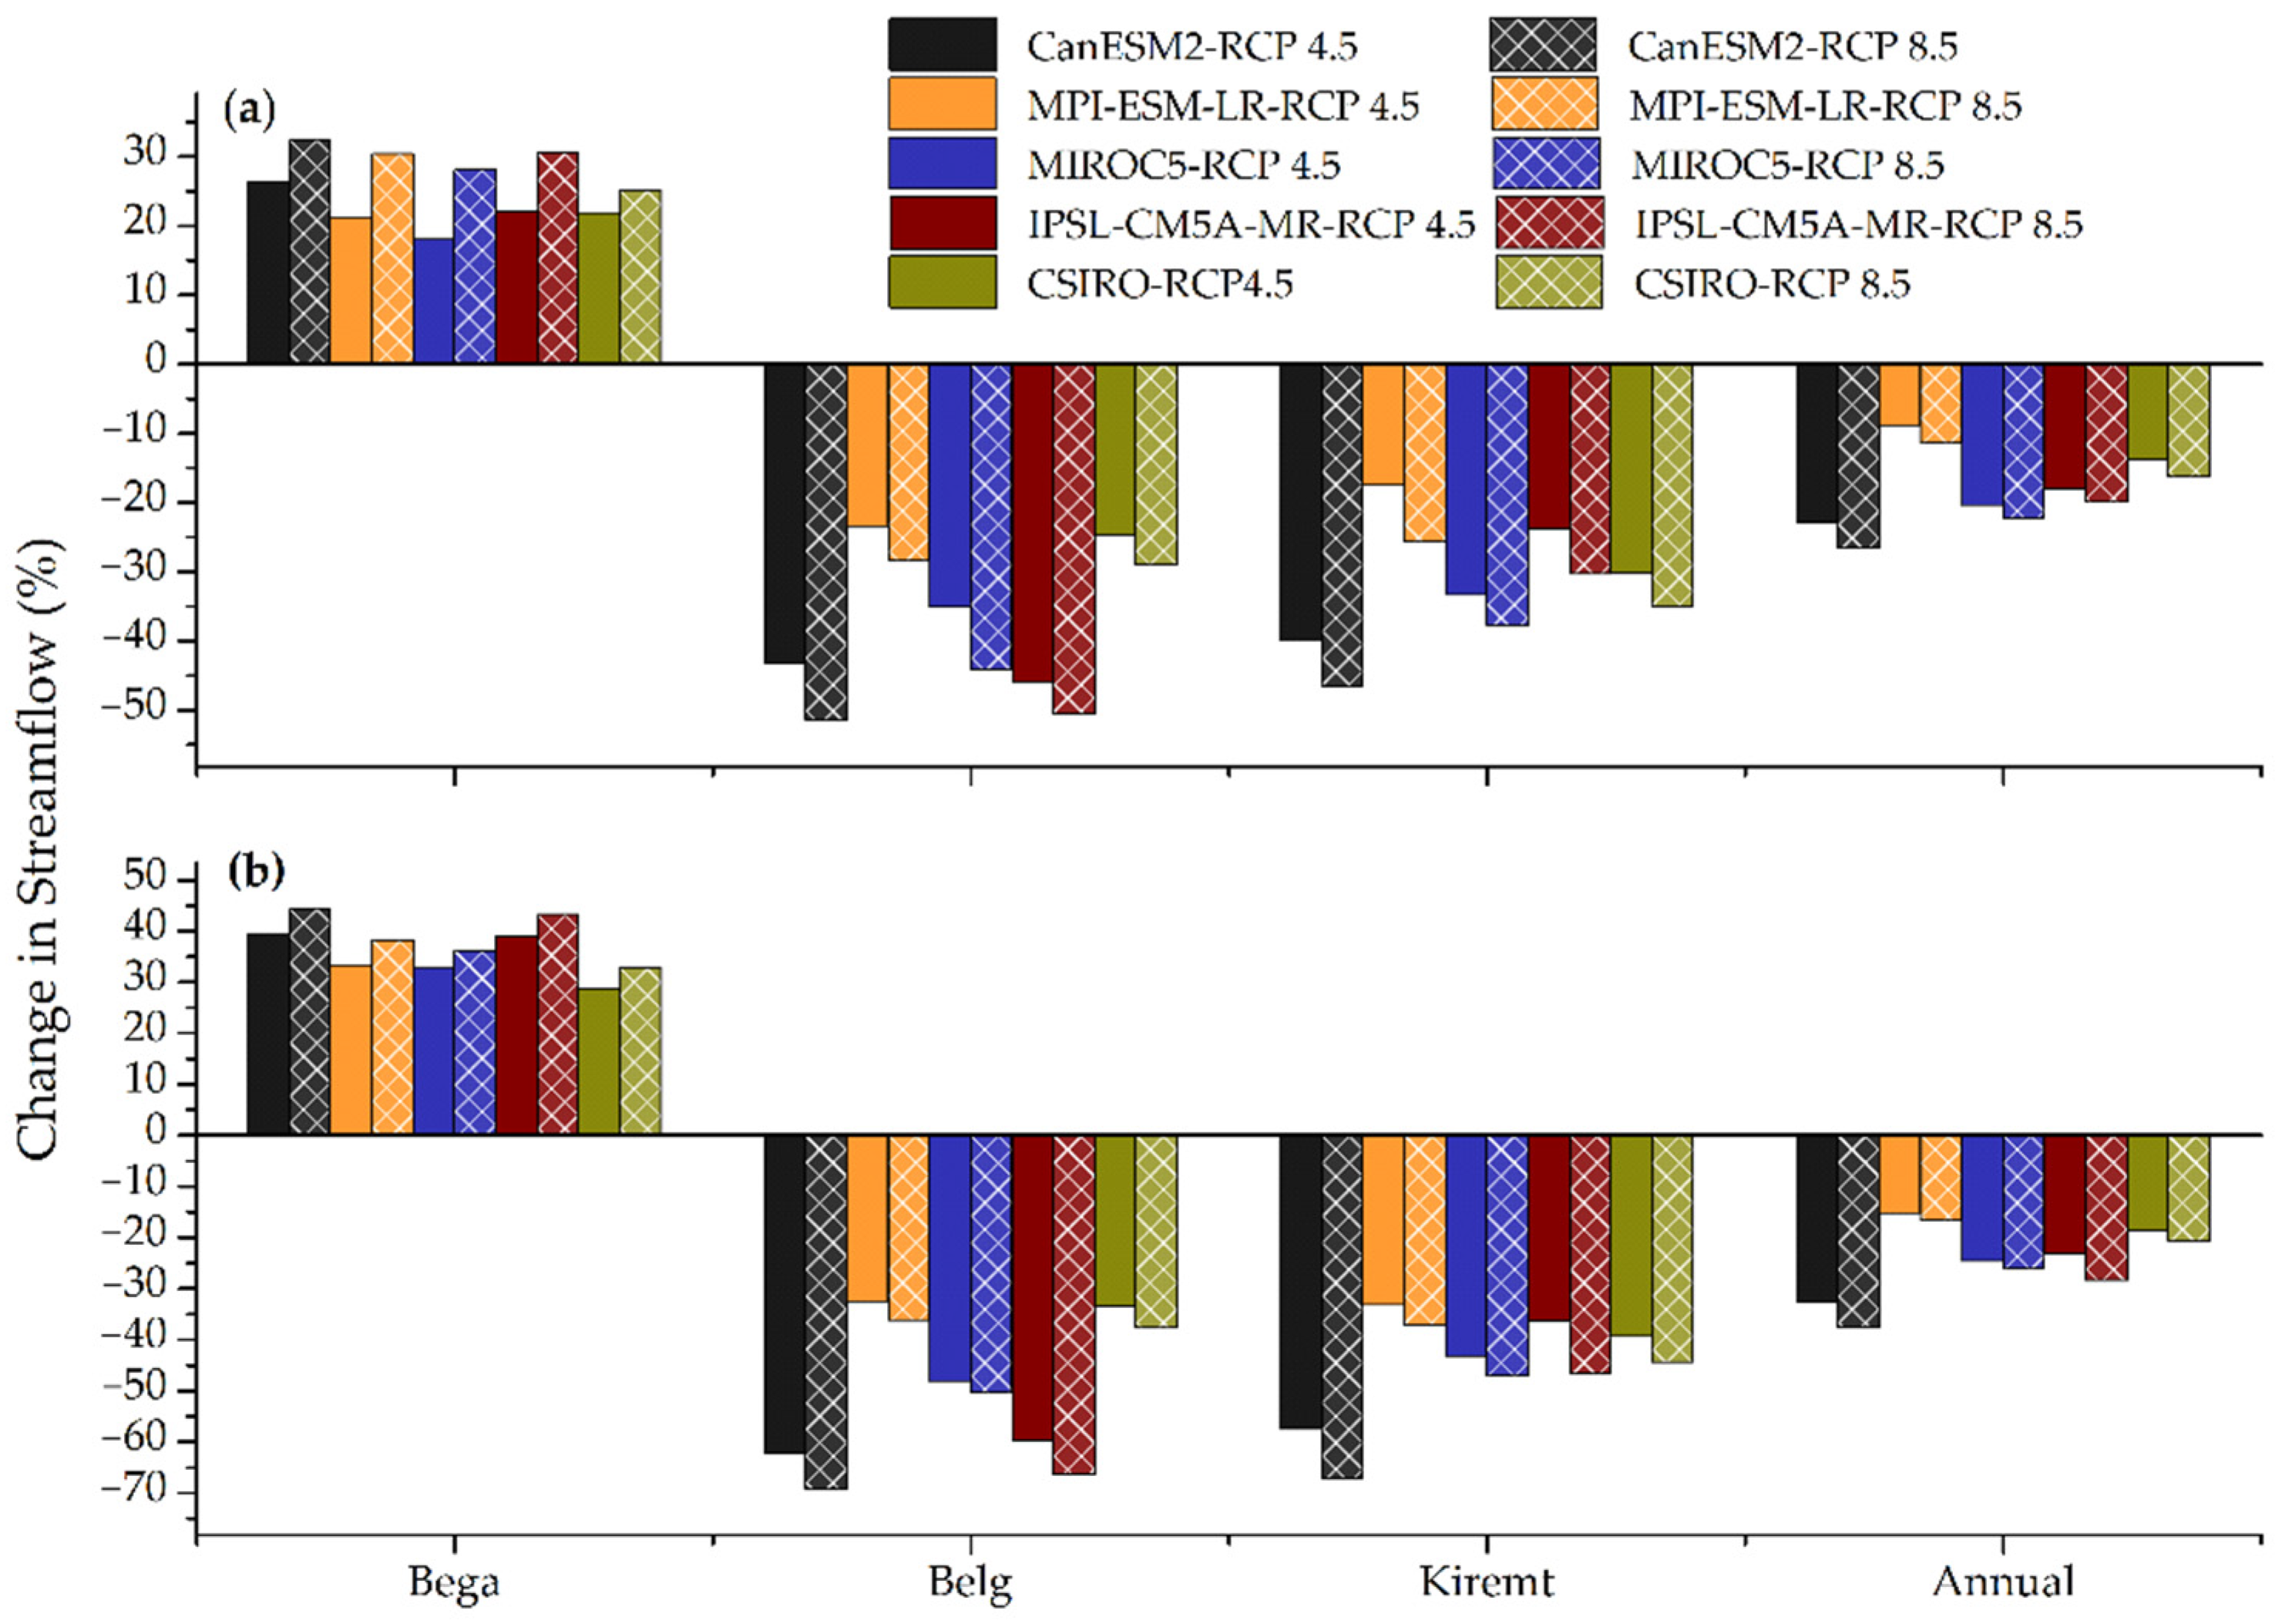
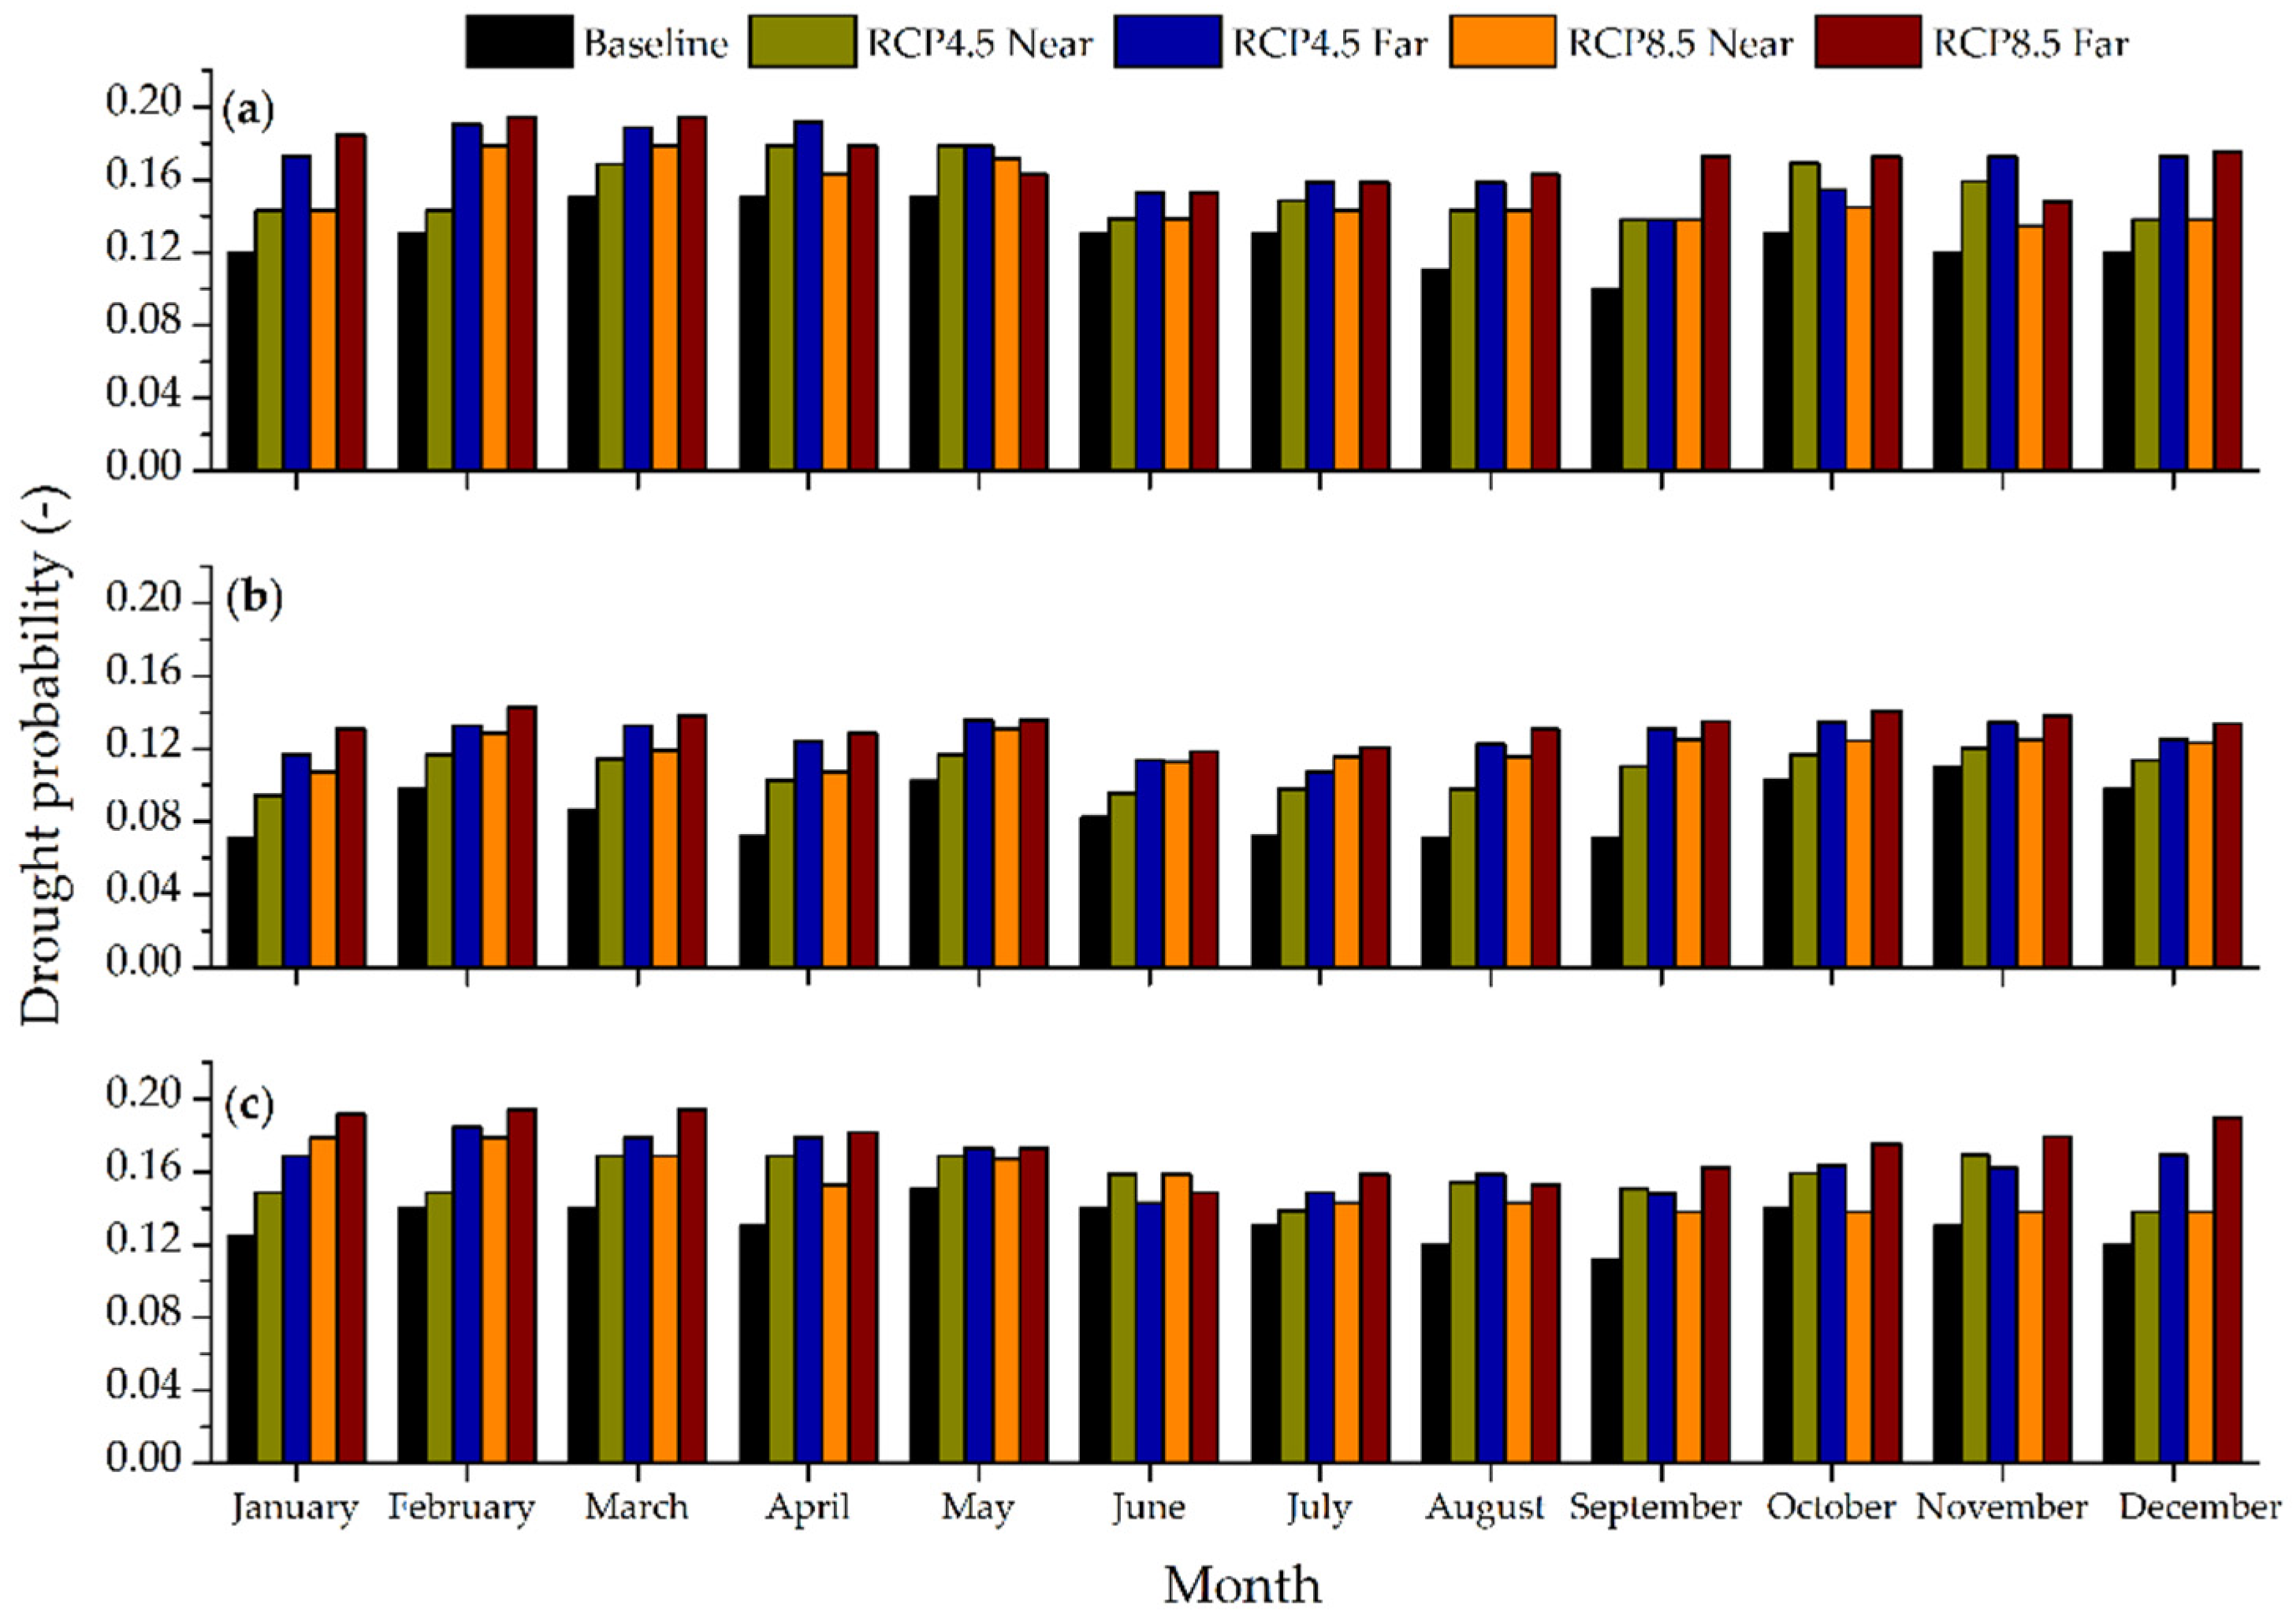
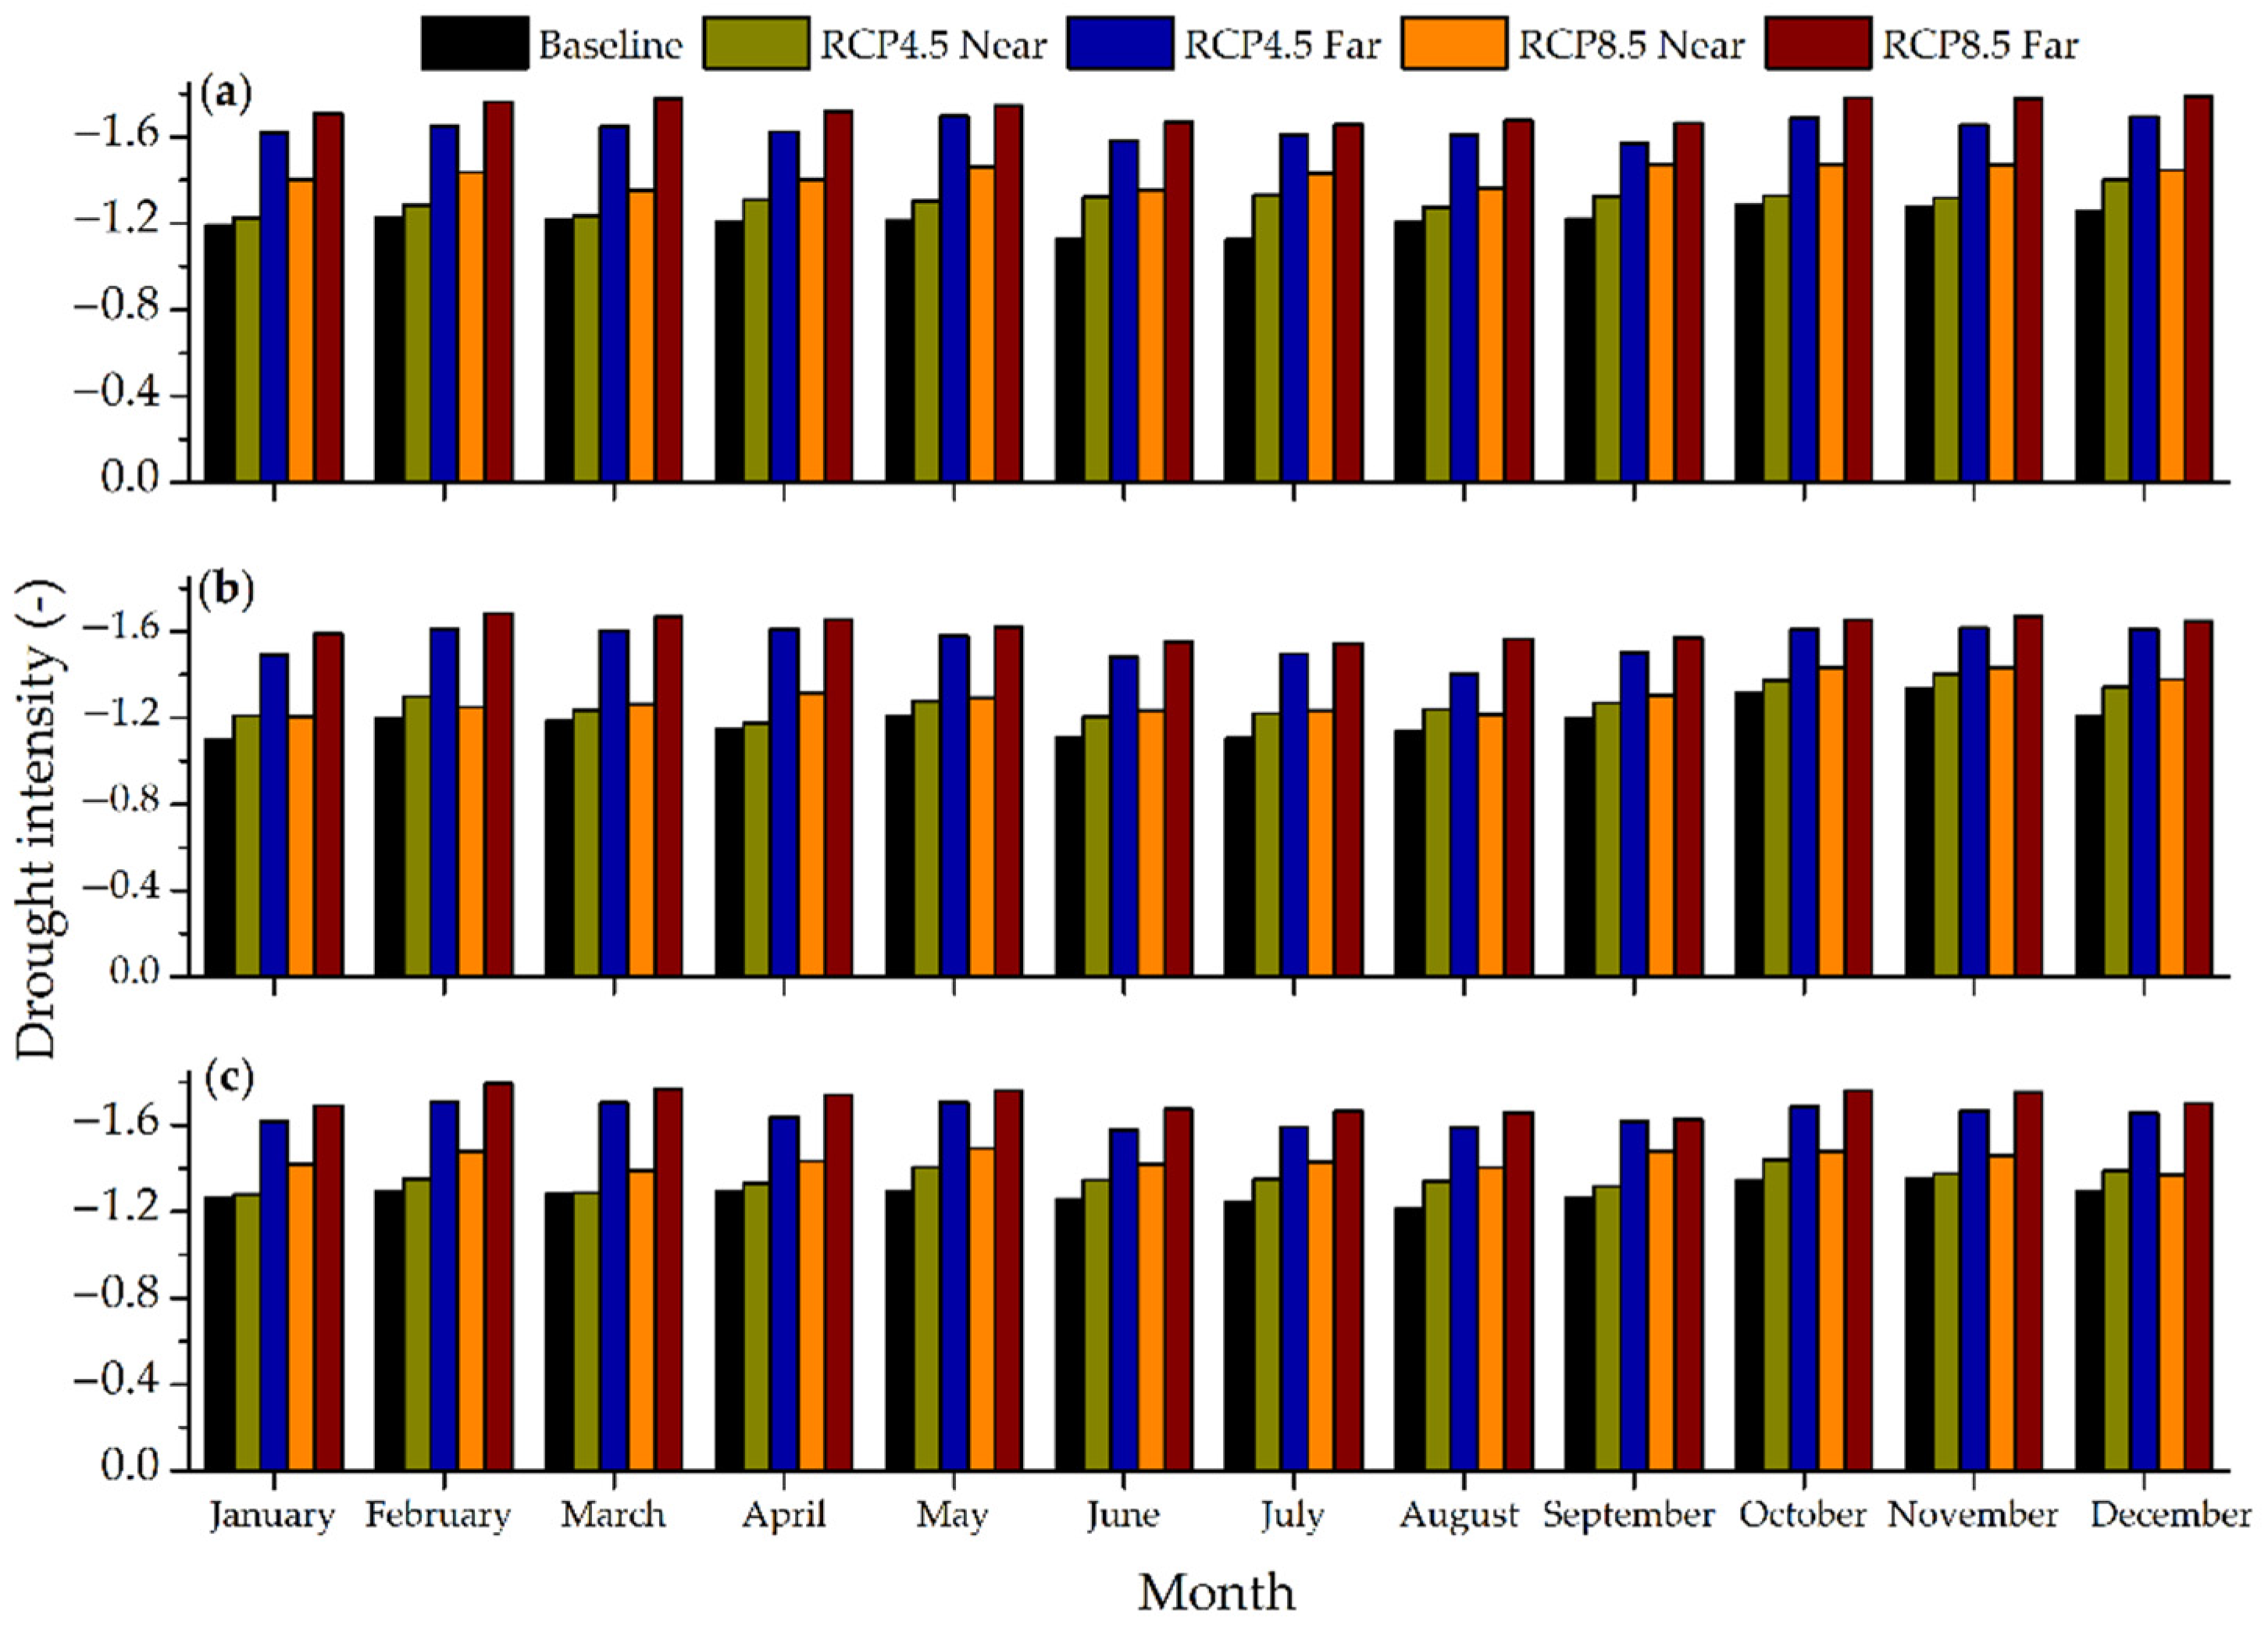
Table 1.
Description of the CORDEX-Africa Regional Climate Model (RCA4) simulations.
| Modeling Center (Group) | GCM Name | Short Name |
|---|---|---|
| Canadian Centre for Climate Modelling and Analysis | CCCma-CanESM2 | CanESM2 |
| Institut Pierre-Simon Laplace, France | IPSL-IPSL-CM5A-MR | IPSL-CM5A-MR |
| National Institute for Environmental Studies and Japan Agency for Marine-earth Science and Technology (MIROC), Japan | MIROC-MIROC5 | MIROC5 |
| Commonwealth Scientific and Industrial Research Organization | CSIRO-MK3-6-0 | CSIRO |
| Max Planck Institute for Meteorology, Germany | MPI-M-MPI-ESM-LR | MPI-ESM-LR |
Table 2.
Average drought durations of months for the Bilate watershed (SPI, SDI, and RDI < −1).
| Climate Model | Baseline | RCP4.5 | RCP8.5 | ||||||||||||
|---|---|---|---|---|---|---|---|---|---|---|---|---|---|---|---|
| 2021–2050 | 2071–2100 | 2021–2050 | 2071–2100 | ||||||||||||
| SPI | SDI | RDI | SPI | SDI | RDI | SPI | SDI | RDI | SPI | SDI | RDI | SPI | SDI | RDI | |
| MPI-ESM-LR | 6.8 | 9.3 | 8.3 | 7.6 | 10.0 | 9.2 | 7.1 | 9.6 | 8.8 | 7.8 | 10.7 | 9.7 | 8.0 | 10.0 | 9.0 |
| MIROC5 | 5.2 | 8.3 | 5.3 | 5.9 | 9.6 | 5.8 | 6.3 | 8.9 | 7.4 | 6.7 | 10.1 | 8.4 | 7.6 | 9.4 | 7.8 |
| IPSL-CM5A-MR | 7.3 | 7.7 | 6.8 | 9.1 | 9.7 | 8.8 | 8.8 | 8.7 | 8.5 | 9.4 | 10.3 | 8.7 | 8.9 | 9.3 | 9.3 |
| CSIRO | 7.0 | 8.0 | 6.3 | 9.0 | 9.3 | 8.6 | 8.5 | 8.4 | 8.2 | 9.8 | 9.5 | 9.3 | 9.1 | 8.8 | 9.0 |
| CanESM2 | 7.4 | 8.3 | 7.9 | 9.0 | 9.5 | 10.2 | 8.4 | 9.0 | 9.1 | 9.0 | 10.0 | 10.1 | 8.8 | 9.2 | 9.6 |
| Average | 6.74 | 8.32 | 6.92 | 8.12 | 9.62 | 8.52 | 7.82 | 8.92 | 8.4 | 8.54 | 10.12 | 9.24 | 8.48 | 9.34 | 8.94 |
Table 3.
Average drought magnitude for Bilate watershed calculated from SPI, SDI, and RDI.
| Climate Model | Baseline | RCP4.5 | RCP8.5 | ||||||||||||
|---|---|---|---|---|---|---|---|---|---|---|---|---|---|---|---|
| 2021–2050 | 2071–2100 | 2021–2050 | 2071–2100 | ||||||||||||
| SPI | SDI | RDI | SPI | SDI | RDI | SPI | SDI | RDI | SPI | SDI | RDI | SPI | SDI | RDI | |
| MPI-ESM-LR | −8.1 | −11.1 | −9.5 | −9.2 | −12.7 | −11.6 | −10.8 | −14.1 | −13.6 | −10.3 | −13.3 | −13.3 | −12.8 | −15.1 | −14.3 |
| MIROC5 | −7.0 | −9.1 | −7.1 | −8.3 | −11.4 | −8.0 | −10.2 | −12.6 | −12.1 | −9.6 | −12.1 | −11.7 | −12.8 | −14.6 | −13.4 |
| IPSL-CM5A-MR | −8.4 | −9.4 | −9.0 | −11.4 | −12.6 | −12.8 | −15.2 | −14.8 | −15.2 | −14.4 | −14.1 | −14.4 | −16.0 | −16.0 | −17.0 |
| CSIRO | −8.6 | −10.2 | −9.1 | −11.9 | −12.8 | −12.0 | −14.7 | −14.1 | −14.1 | −13.7 | −13.4 | −13.6 | −16.4 | −15.6 | −16.6 |
| CanESM2 | −8.5 | −9.3 | −9.1 | −12.1 | −11.5 | −12.9 | −13.4 | −13.2 | −14.0 | −12.7 | −12.4 | −13.2 | −15.1 | −14.1 | −15.5 |
| Average | −8.1 | −9.8 | −8.8 | −10.6 | −12.2 | −11.5 | −12.9 | −13.8 | −13.8 | −12.1 | −13.1 | −13.2 | −14.6 | −15.1 | −15.4 |
Table 4.
Average intensity of drought events calculated from the SPI, SDI, and RDI values for the Bilate watershed.
Table 4.
Average intensity of drought events calculated from the SPI, SDI, and RDI values for the Bilate watershed.
| Climate Model | Baseline | RCP 4.5 | RCP 8.5 | ||||||||||||
|---|---|---|---|---|---|---|---|---|---|---|---|---|---|---|---|
| 2021–2050 | 2071–2100 | 2021–2050 | 2071–2100 | ||||||||||||
| SPI | SDI | RDI | SPI | SDI | RDI | SPI | SDI | RDI | SPI | SDI | RDI | SPI | SDI | RDI | |
| MPI-ESM-LR | −1.18 | −1.19 | −1.15 | −1.21 | −1.24 | −1.27 | −1.53 | −1.48 | −1.55 | −1.33 | −1.24 | −1.37 | −1.60 | −1.50 | −1.58 |
| MIROC5 | −1.35 | −1.09 | −1.34 | −1.39 | −1.18 | −1.38 | −1.61 | −1.42 | −1.62 | −1.45 | −1.20 | −1.39 | −1.69 | −1.56 | −1.72 |
| IPSL-CM5A-MR | −1.15 | −1.22 | −1.32 | −1.25 | −1.30 | −1.45 | −1.73 | −1.70 | −1.78 | −1.54 | −1.38 | −1.66 | −1.81 | −1.73 | −1.82 |
| CSIRO | −1.23 | −1.27 | −1.45 | −1.32 | −1.37 | −1.39 | −1.72 | −1.69 | −1.76 | −1.40 | −1.42 | −1.45 | −1.82 | −1.77 | −1.84 |
| CanESM2 | −1.15 | −1.12 | −1.15 | −1.36 | −1.21 | −1.26 | −1.60 | −1.48 | −1.53 | −1.40 | −1.24 | −1.32 | −1.72 | −1.54 | −1.62 |
| Average | −1.21 | −1.18 | −1.28 | −1.31 | −1.26 | −1.35 | −1.64 | −1.55 | −1.65 | −1.42 | −1.30 | −1.44 | −1.73 | −1.62 | −1.72 |
Publisher’s Note: MDPI stays neutral with regard to jurisdictional claims in published maps and institutional affiliations. |
© 2022 by the authors. Licensee MDPI, Basel, Switzerland. This article is an open access article distributed under the terms and conditions of the Creative Commons Attribution (CC BY) license (https://creativecommons.org/licenses/by/4.0/).
Share and Cite
MDPI and ACS Style
Orke, Y.A.; Li, M.-H. Impact of Climate Change on Hydrometeorology and Droughts in the Bilate Watershed, Ethiopia. Water 2022, 14, 729. https://doi.org/10.3390/w14050729
AMA Style
Orke YA, Li M-H. Impact of Climate Change on Hydrometeorology and Droughts in the Bilate Watershed, Ethiopia. Water. 2022; 14(5):729. https://doi.org/10.3390/w14050729
Chicago/Turabian StyleOrke, Yoseph Arba, and Ming-Hsu Li. 2022. "Impact of Climate Change on Hydrometeorology and Droughts in the Bilate Watershed, Ethiopia" Water 14, no. 5: 729. https://doi.org/10.3390/w14050729
Note that from the first issue of 2016, this journal uses article numbers instead of page numbers. See further details here.