Article

Different Assembly Patterns of Planktonic and Sedimentary Bacterial Community in a Few Connected Eutrophic Lakes

1
Hubei Engineering Research Center for Protection and Utilization of Special Biological Resources in the Hanjiang River Basin, School of Life Sciences, Jianghan University, Wuhan 430056, China
2
Hubei Key Laboratory of Environmental and Health Effects of Persistent Toxic Substances, Jianghan University, Wuhan 430056, China
3
Yangtze River Fisheries Research Institute, Key Laboratory of Freshwater Biodiversity Conservation and Utilization, Chinese Academy of Fishery Sciences, Ministry of Agriculture, Wuhan 430223, China
4
State Key Laboratory of Freshwater Ecology and Biotechnology, Institute of Hydrobiology, Chinese Academy of Sciences, Wuhan 430072, China
*
Author to whom correspondence should be addressed.
Water 2022, 14(5), 723; https://doi.org/10.3390/w14050723
Submission received: 14 January 2022 / Revised: 20 February 2022 / Accepted: 22 February 2022 / Published: 24 February 2022
(This article belongs to the Topic Microorganisms in Aquatic Environments)

Abstract

:
The mechanism of bacterial community assembly has been the hot spot in the field of microbial ecology and it is difficult to quantitatively estimate the influences of different ecological processes. Here, a total of 23 pairs of planktonic and sedimentary samples were collected from five lakes in Wuhan, China. significant higher α-diversity (p < 0.001) and β-diversity (p < 0.001) of bacterial communities were observed in sediment than those in water. Some phylum had linear relationships with the comprehensive TSI (TSIc) by regression analysis. Non-metric multidimensional scaling (NMDS) and redundancy analysis (RDA) revealed that the depth of water, NO3-N, NH4+-N, PO43−, and CODcr were the key environmental variables in planktonic bacterial communities, whereas in sediment they were the depth, NO3-N, and NH4+-N. Furthermore, variation partitioning analysis (VPA) showed that spatial and environmental factors could only explain 40.2% and 27.9% of the variation in planktonic and sedimentary bacterial communities, respectively. More importantly, null model analysis suggested that different assembly mechanisms were found between in water and in sediment with the fact that planktonic bacterial community assembly was mainly driven by dispersal limitation process whereas variable selection process played a vital role in that of sediment.

1. Introduction

Lakes are one of the most important parts of a freshwater ecosystem. It is a common concept that there are distinct habitats known as water columns, sediments, and aquatic surface microlayers in a lake because of their totally different environmental conditions [1,2,3]. In aquatic ecosystems, it is widely known that bacteria, as the major consumers and transformers of organic substrates, play irreplaceable roles in aquatic biogeochemical cycles [4,5]. Investigating the diversity and community assembly mechanisms of lacustrine microbiota is important and meaningful [6].
In recent years, the high-throughput 16S rRNA gene sequencing method has become more and more common with the characteristics of acquiring a large number of sequence data on microbial communities [7,8,9]. Liao’s work has found that neutral and niche processes played different roles in bacterial community assembly between habitat generalists and specialists [10]. And the biogeographic patterns of the planktonic bacterial community in some lakes and reservoirs were investigated through this method [11].
In the beginning, studies relating to bacterioplankton are about the α-diversity in an individual community or β-diversity between some communities, as well as factors that contributed to the community composition, such as spatial [12,13], temporal [14,15], or environmental variables [16,17,18]. In the past few years, some breakthroughs were obtained concerning the mechanisms of microbial community assembly [19], primarily including deterministic processes [20] and stochastic processes [21]. The deterministic portion was made up of the abiotic environment and species interaction [22], whereas the stochastic class was comprised of birth, death, speciation, extinction, colonization, and dispersal limitations [23,24]. These two processes always co-operate in the formation of microbial communities [25,26], but their relative importance tends to vary across habitats [27]. In recent years, some methods have used phylogenetic parameters to calculate the relative contribution of each progress (including variable selection, homogeneous selection, dispersal limitation, homogenizing dispersal, and undominated), even to predict driving factors that impose selection or dispersal limitation [22,28,29].
Eutrophication results in the oversupply of nutrients, which gives rise to the overgrowth of plants and algae. Recently, great attention has been paid to the eutrophic freshwater ecosystems, especially in Chinese lakes. Human activities are commonly believed to accelerate rates of eutrophication, which is recognized as a water pollution in lake ecosystems around the world [30,31]. Until now, more than a half of lakes in Asia and Europe have become eutrophicated as well as a sizable portion of lakes in North America, South America, and Africa. Some published papers paid more attention to the effect of nutrients or cyanobacteria biomass on the microbial community assemblages in lake ecosystems [32,33,34]; however, research about the influence of eutrophication on both planktonic and sedimentary bacterioplankton in one lake still need to be supplied.
Therefore, five freshwater eutrophic lakes in Wuhan city, Hubei province were selected to compare the bacterial community composition and community assembly processes between the water and the sediments under eutrophication conditions. This study was conducted to: (1) measure the α-diversity and β-diversity of bacterial community composition in water and sediments; (2) investigate the planktonic and sedimentary community assembly processes; and (3) predict the driving factors that impose the bacterial community assembly in water and sediment habitats.

2. Materials and Methods

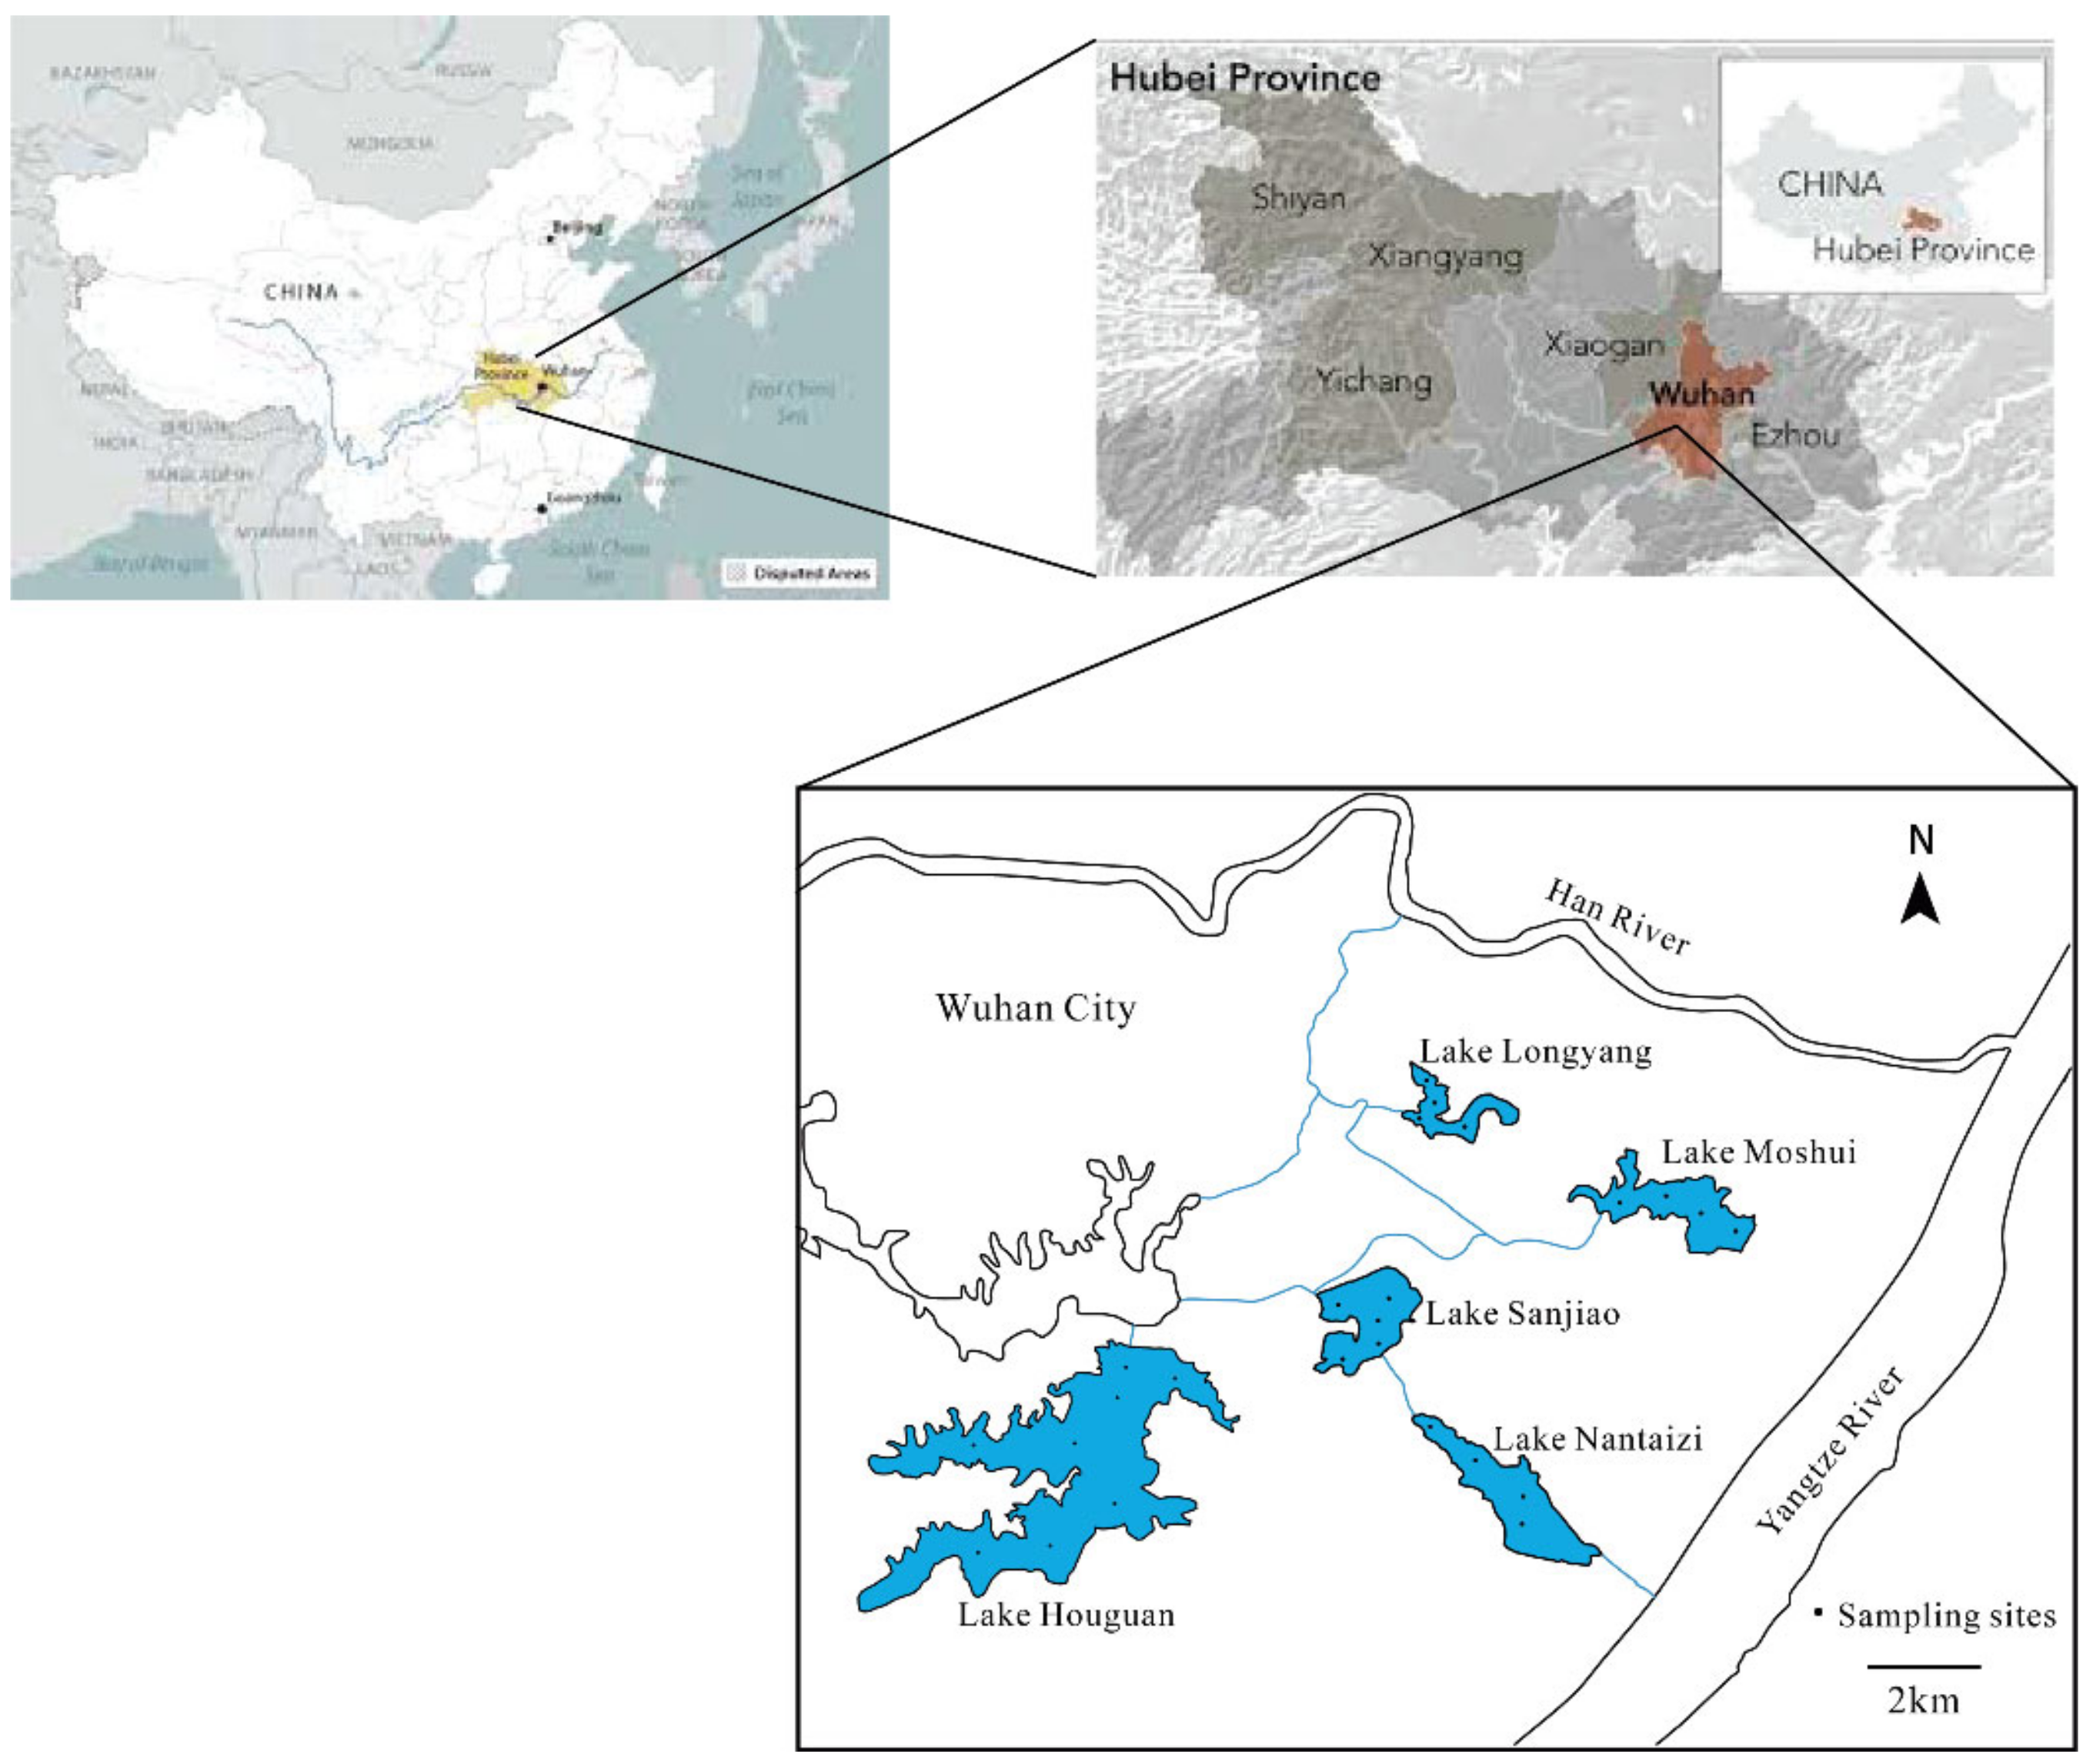
2.1. Site and Sampling

There are many lakes in Wuhan, which is the capital city in Hubei province. Sampling in five lakes (Figure 1), located in the Hanyang District, were carried out in July 2019. In each lake, we surveyed 4–6 sites and collected water and sediment samples with three replicates. In total, 23 sites were sampled. Geographic coordinates of each sampling site were shown in Table S1. The three water samples in each site were then mixed in equal volumes and the three sediment samples from each site were also mixed and transferred to 50-mL sterilized centrifuge tubes. All samples were immediately placed on ice and returned to the laboratory for the following processes. For each water sample, we filtered 250 mL of water through a 0.22-µm filter and then stored it at −80 °C until the DNA extraction.

2.2. DNA Extraction, PCR Amplification, and Sequencing

The DNA was extracted with the TGuide S96 Magnetic Soil/Stool DNA Kit (Tiangen Biotech Co., Ltd., Beijing, China) according to manufacturer instructions. The DNA concentration of the samples was measured with the Qubit dsDNA HS Assay Kit and Qubit 4.0 Fluorometer (Invitrogen, Thermo Fisher Scientific, Waltham, MA, USA).
To amplify the V3–V4 region of the 16S rRNA gene for Illumina deep sequencing, universal primers, 338F: 5′-ACTCCTACGGGAGGCAGCA-3′ and 806R: 5′-GGACTACHVGGGTWTCTAAT-3′, were used [35]. The PCR was performed in a total reaction volume of 20 µL: H2O 13.25 µL, 10 × PCR ExTaq Buffer 2.0 µL, DNA template (100 ng/mL) 0.5 µL, primer 338F (10 mmol/L) 1.0 µL, primer 806R (10 mmol/L) 1.0 µL, 2 mM dNTP 2.0 µL, ExTaq (5 U/mL) 0.25 µL. After an initial denaturation at 95 °C for 5 min, an amplification was performed by 30 cycles of incubations for 30 s at 95 °C, 20 s at 58 °C, and 6 s at 72 °C, followed by a final extension at 72 °C for 7 min. Then the amplified products were purified and recovered using the 1.0% agarose gel electrophoresis method.

2.3. Bioinformatics Analysis

The bioinformatic analysis in this study was performed at the Biomarker biocloud platform (www.biocloud.org accessed on 30 September 2019). To obtain the raw tags, paired-end reads were merged by FLASH (v1.2.7, http://ccb.jhu.edu/software/FLASH/ (accessed on 30 September 2019)) [36]. Then raw tags were filtered and clustered in the next steps. The merged tags were compared to the primers, and the tags with more than six mismatches were discarded by FASTX-Toolkit. Tags with an average quality score <20 in a 50 bp sliding window were truncated using Trimmomatic (http://www.usadellab.org/cms/?page=trimmomatic accessed on 30 September 2019) [37] and tags shorter than 350 bp were removed. We identified possible chimeras by employing UCHIME, a tool included in mothur (http://drive5.com/uchime (accessed on 30 September 2019)). The denoised sequences were clustered using USEARCH (version 10.0) and tags with similarity ≥97% were regarded as an OTU [38], and the OTUs with reabundance <0.005% were filtered. Taxonomy was assigned to all OTUs by searching against the Silva databases (Release128, http://www.arb-silva.de (accessed on 30 September 2019)) using the UCLUST within QIIME. The platform and the instrument used for the sequencing was Illumina Novaseq6000 and the length of reads was PE250. The library construction and sequencing steps were performed by Beijing Biomarker Technologies Co. Ltd. Raw data of the OTUs in every sampling site have been submitted on the NCBI (PRJNA777015 is for water and PRJNA777413 is for sediment)

2.4. Environmental Variables

In each site, we recorded the longitude and latitude using the Global Positioning System (GPS). Some parameters, including the temperature, dissolved oxygen (DO), pH, oxidation–reduction potential (ORP), and conductivity were measured in situ with a water quality monitor. Water transparency (SD) was measured using Secchi disk. Other water physiochemical variables, such as total nitrogen (TN), ammonia nitrogen (NH4+-N), nitrate nitrogen (NO3-N), total phosphorus (TP), phosphate radical (PO43−), and chlorophyll-a (chl.a) were measured according to Zhao et al. [39]. We also assessed the degree of trophic level in each site according to the comprehensive TSI (TSIc), with a higher TSIc representing a higher eutrophic degree.

2.5. Relationships between Bacterial Communities and Spatial and Environmental Variables

To decipher the relationships between bacterial community and spatial and environmental variables, we performed a redundancy analysis (RDA) and the variation partitioning analysis (VPA). First, spatial variables were calculated by the principal coordinates of neighbor matrices analysis (PCNMs) based on the longitude and latitude coordinates of each sampling site. Then, the spatial and environmental variables were filtered according to the variance inflation factor (VIF < 10) to eliminate collinearity among factors. Ultimately, the VPA was used to quantitatively assess the importance of neutral processes and selective processes in the bacterial community assembly.

2.6. Analysis of Factors Driving the Assembly of Bacterial Community

To test whether we could use the phylogenetic metric to uncover the bacterial community assembly, we had to test the phylogenetic signals in water and sediment habitats using Mantel correlation between the pairwise matrix of phylogenetic distance and OTU niche distance in R [22].
The standardized effect size of the mean nearest taxon distance (SES.MNTD) was calculated by using the “Picante” package of R [40]. Then, we quantified the phylogenetic turnover among samples applying the standardized effect size of the beta mean nearest taxon distance (SES.βMNTD) [22,41]. Furthermore, we measured the relative contribution of each ecological process in the assembly of the bacterial community by combining the SES.βMNTD and Bray–Curtis-based Raup–Crick [29,42].

2.7. Statistical Analysis

The two-tailed independent-sample t-test was conducted using the “t-test” function in R, and the Spearman’s correlation between environmental parameters and bacterial taxa was performed with “stats” package of R. Non-metric multidimensional scaling (NMDS) and the redundancy analysis were examined using “vegan” package of R. Variance inflation factors (VIFs), used to find out the multicollinearity among so many environmental variables, were calculated by the function “vif.cca” in “vegan” package of R. Pairwise Spearman’s rank correlation matrix analysis was analyzed by “corrplot” package of R. βNTI and RCbray were used to identify which factor drives the selection process was conducted by “vegan” and “stats” packages of R.

3. Results

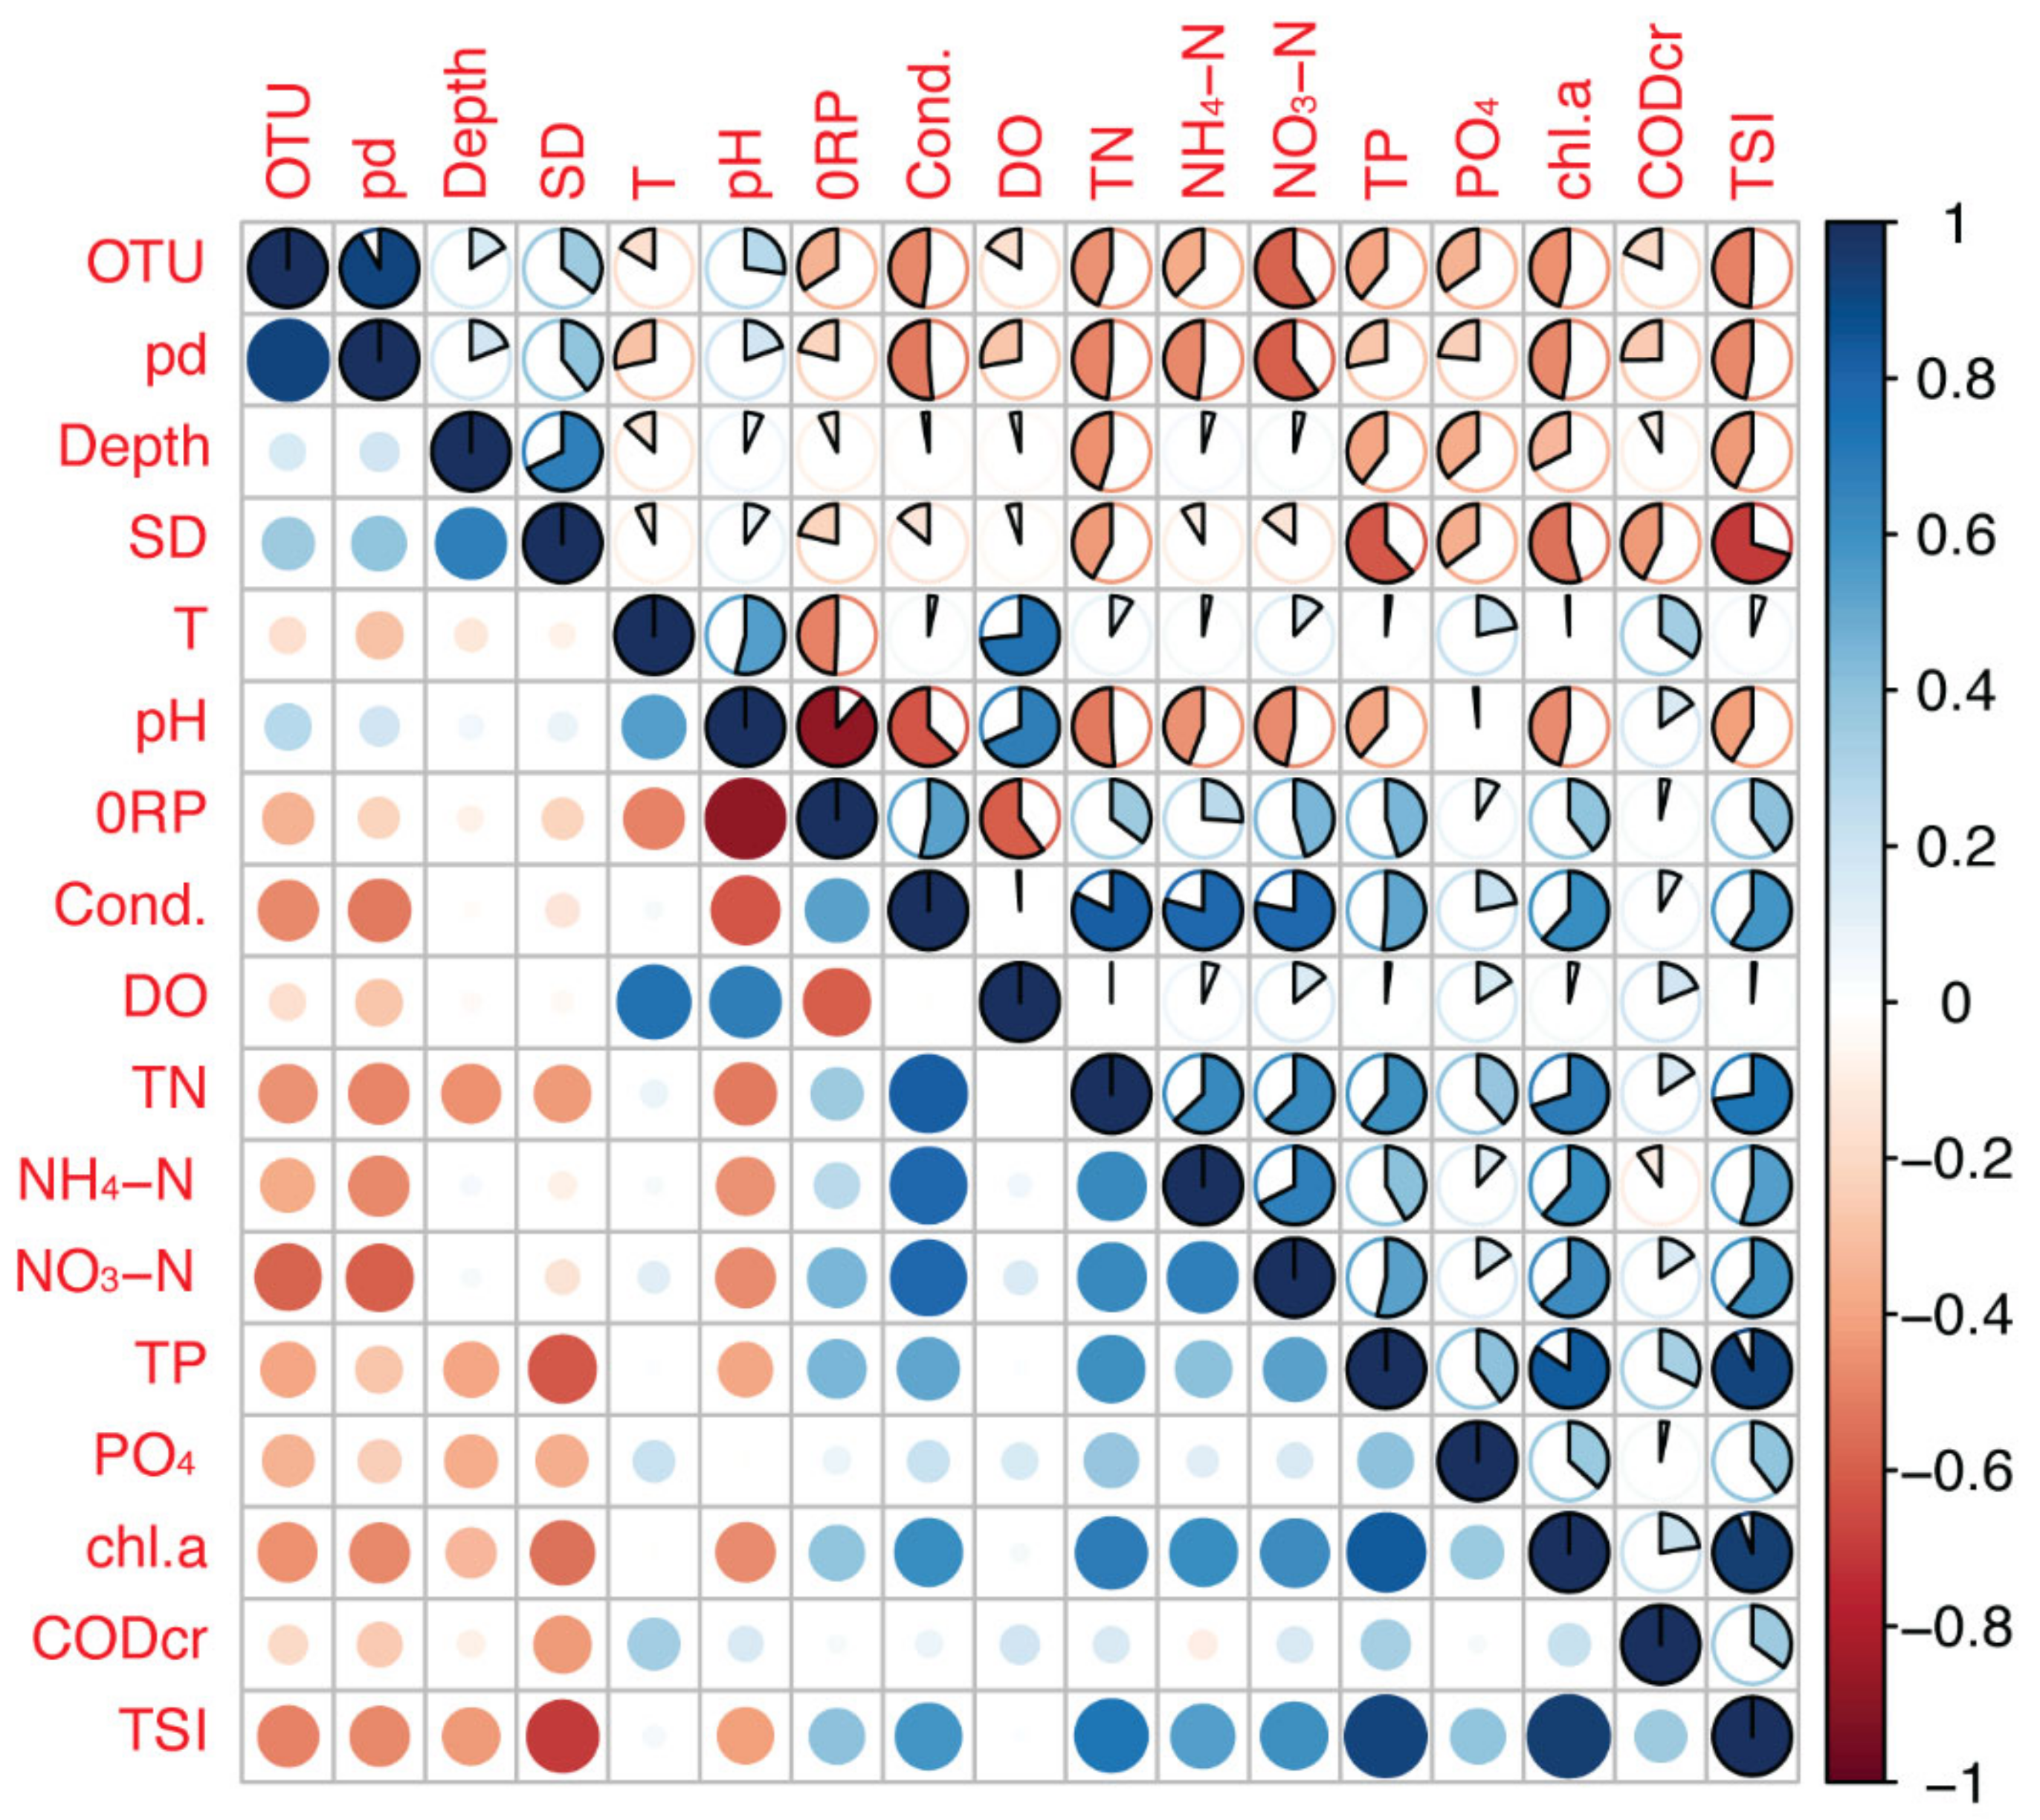
3.1. Environmental Properties

In this study, we identified different patterns and assembly processes between planktonic and sedimentary bacterial communities in five freshwater lakes under the condition of eutrophication. The environmental variables of the water body are summarized in Table S1. The concentrations of TP and TN varied from 0.129 to 0.404 mg/L and from 0.61 to 12.51 mg/L, respectively. Water NO3-N and NH4+-N ranged from 0.08 to 1.09 mg/L and from 0.17 to 4.12 mg/L, respectively. TSIc, an indicator of nutrient level, varied from 71.20 to 86.65, suggesting that all the five lakes are in eutrophication. Some water measured variables showed correlation to each other through the pairwise spearman of all these variables (Figure 2). For instance, SD was negatively correlated with TN, TP, on the other hand, TN had a positive relationship with TP, PO43−, and chl.a.

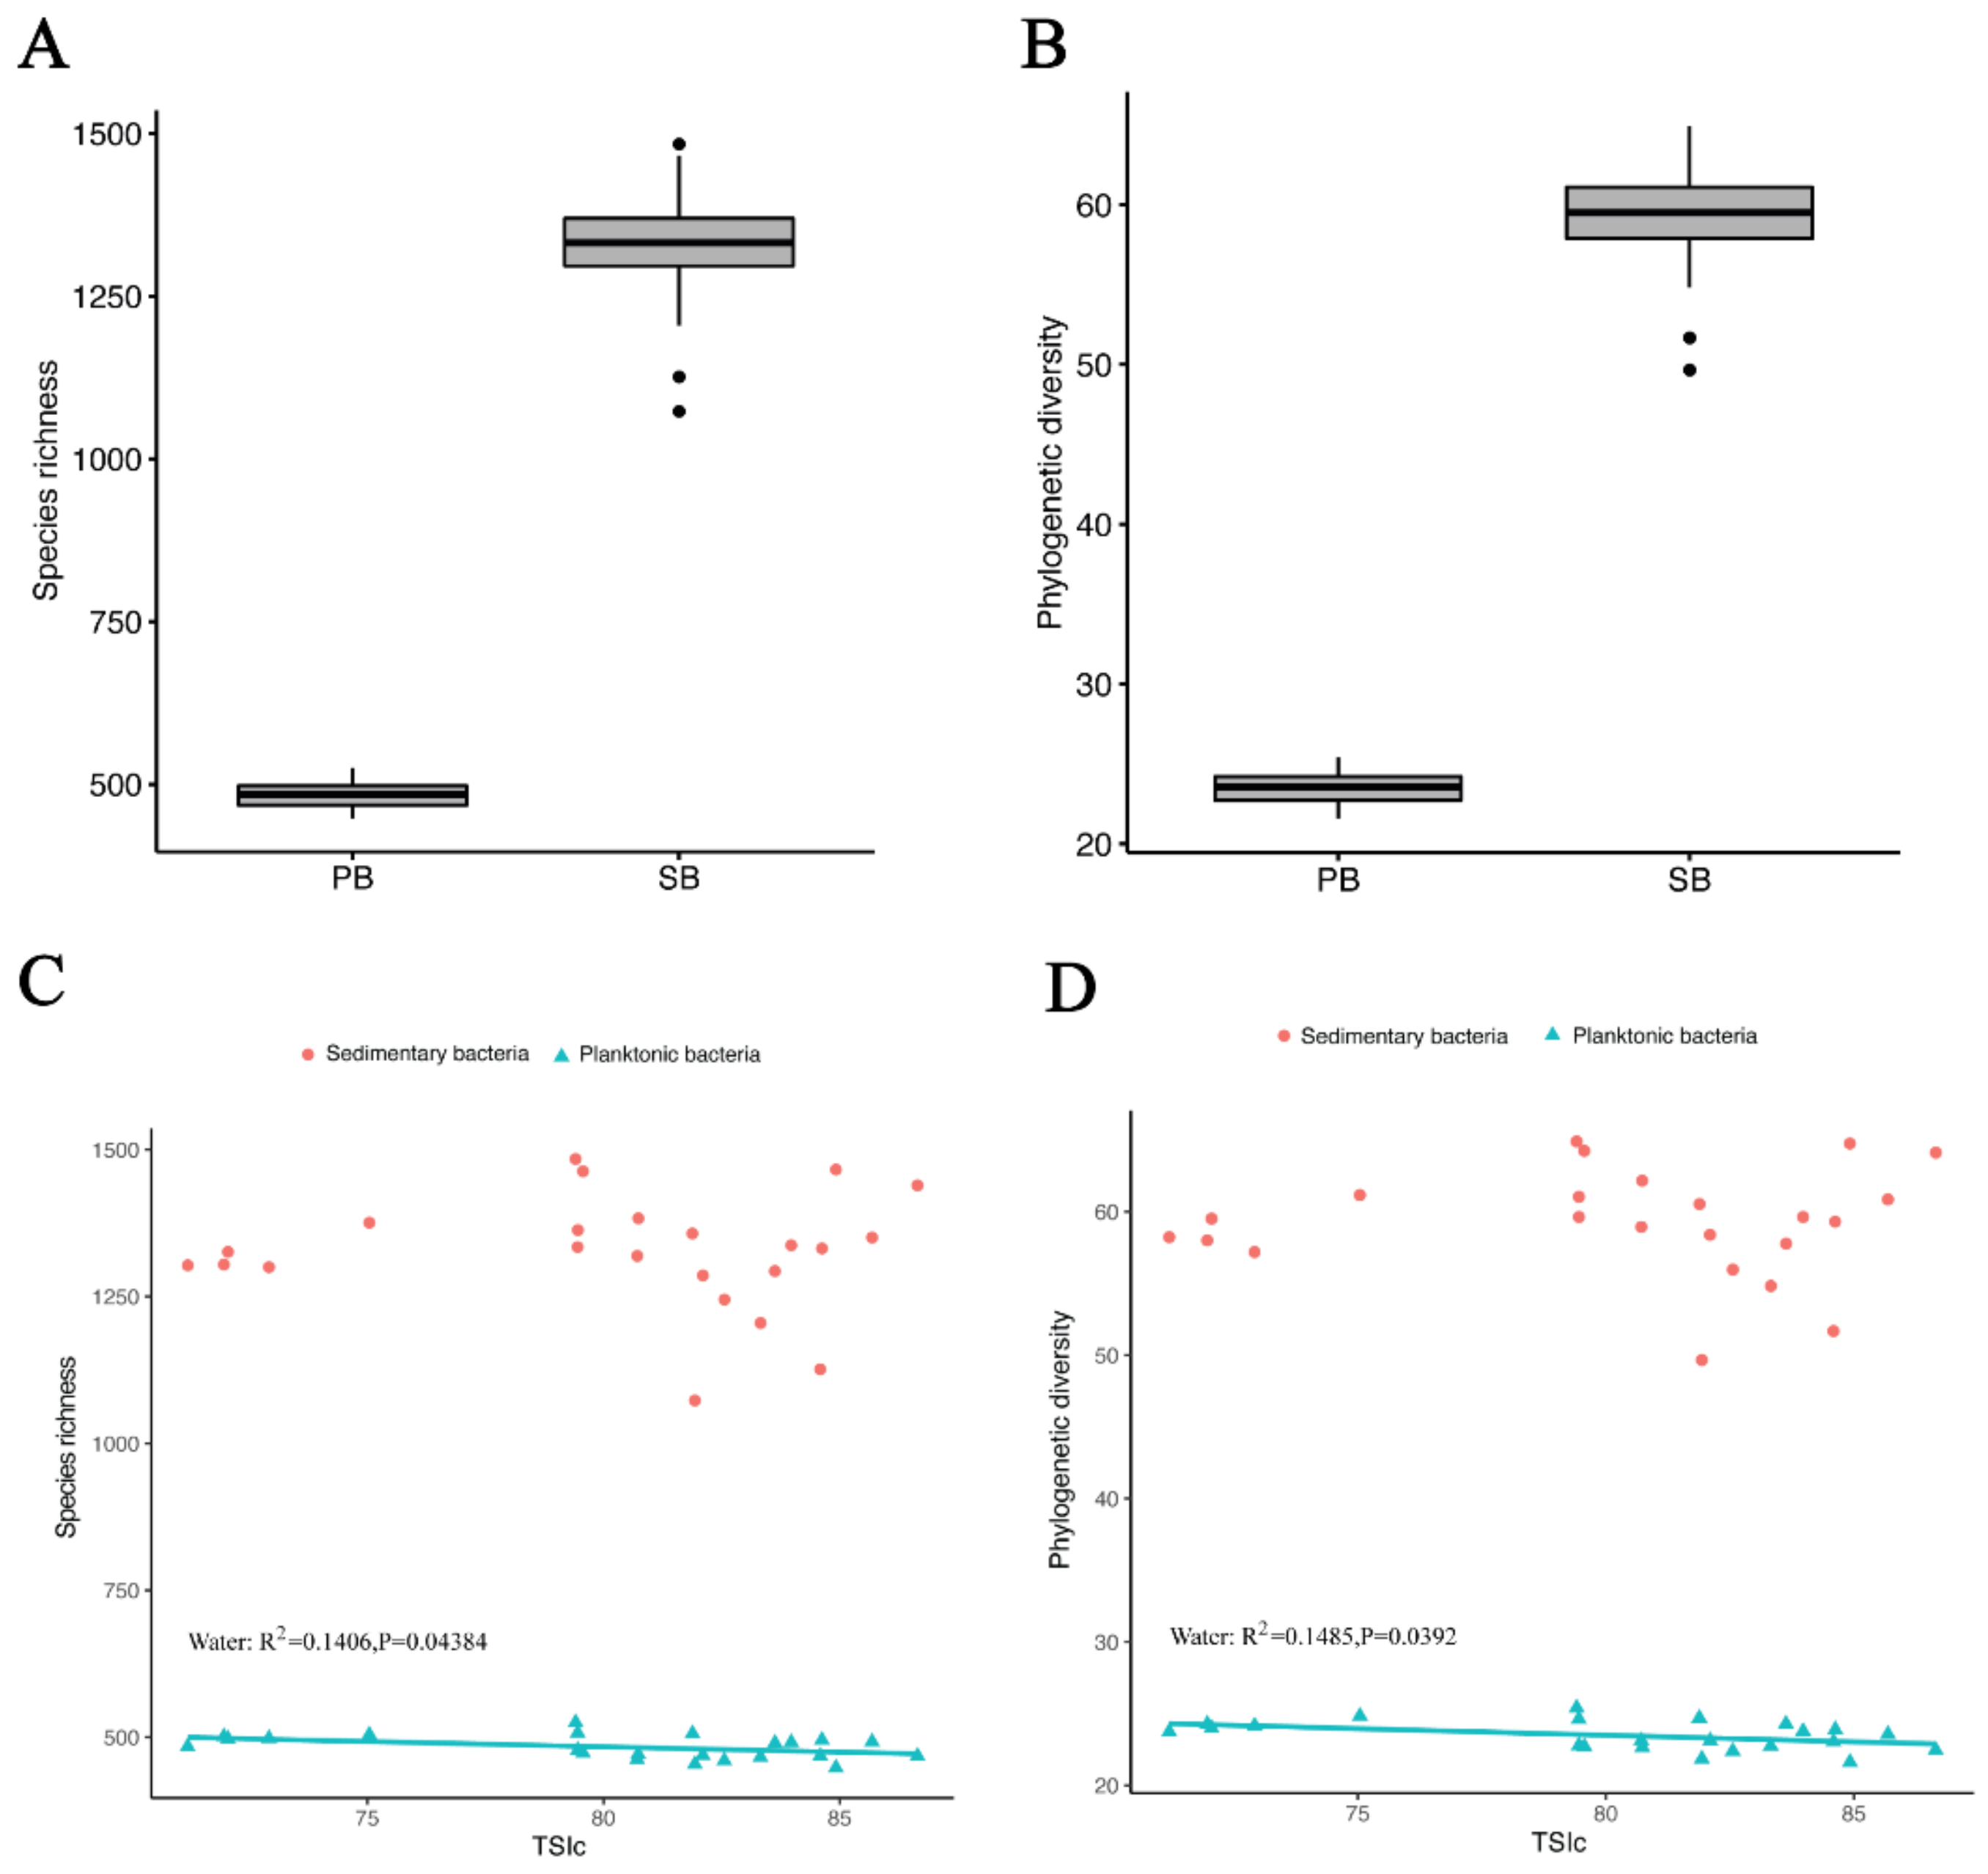
3.2. Bacterial Community Richness and Diversity in Water and Sediment Samples

A total of 551 operational taxonomic units (OTUs) at the 97% similarity level were identified from sequences in the water sample and 1601 OTUs from sequences in the sediment sample. The rarefaction curves in these two samples all reached the plateau, implying that the sequences were able to represent bacterioplankton diversity in both planktonic and sedimentary samples (Figure S1). In terms of the species richness (numbers of OTUs) and Faith’s phylogenetic diversity, results showed that both richness and diversity were significantly higher in sediments than in water (two-tailed independent sample t-test, p < 0.001) (Figure 3A,B). Moreover, a significant, but weak linear relationship, was found between the species richness and phylogenetic diversity and TSIc in water, whereas there was no such correlation in sediments (Figure 3C,D). Additionally, the alpha diversity of the planktonic bacterial community showed a positive correlation with the depth, SD, and pH of the water but a negative correlation with the nutrients (including TP, TN, NH4+-N, and NO3-N) (Figure 2).

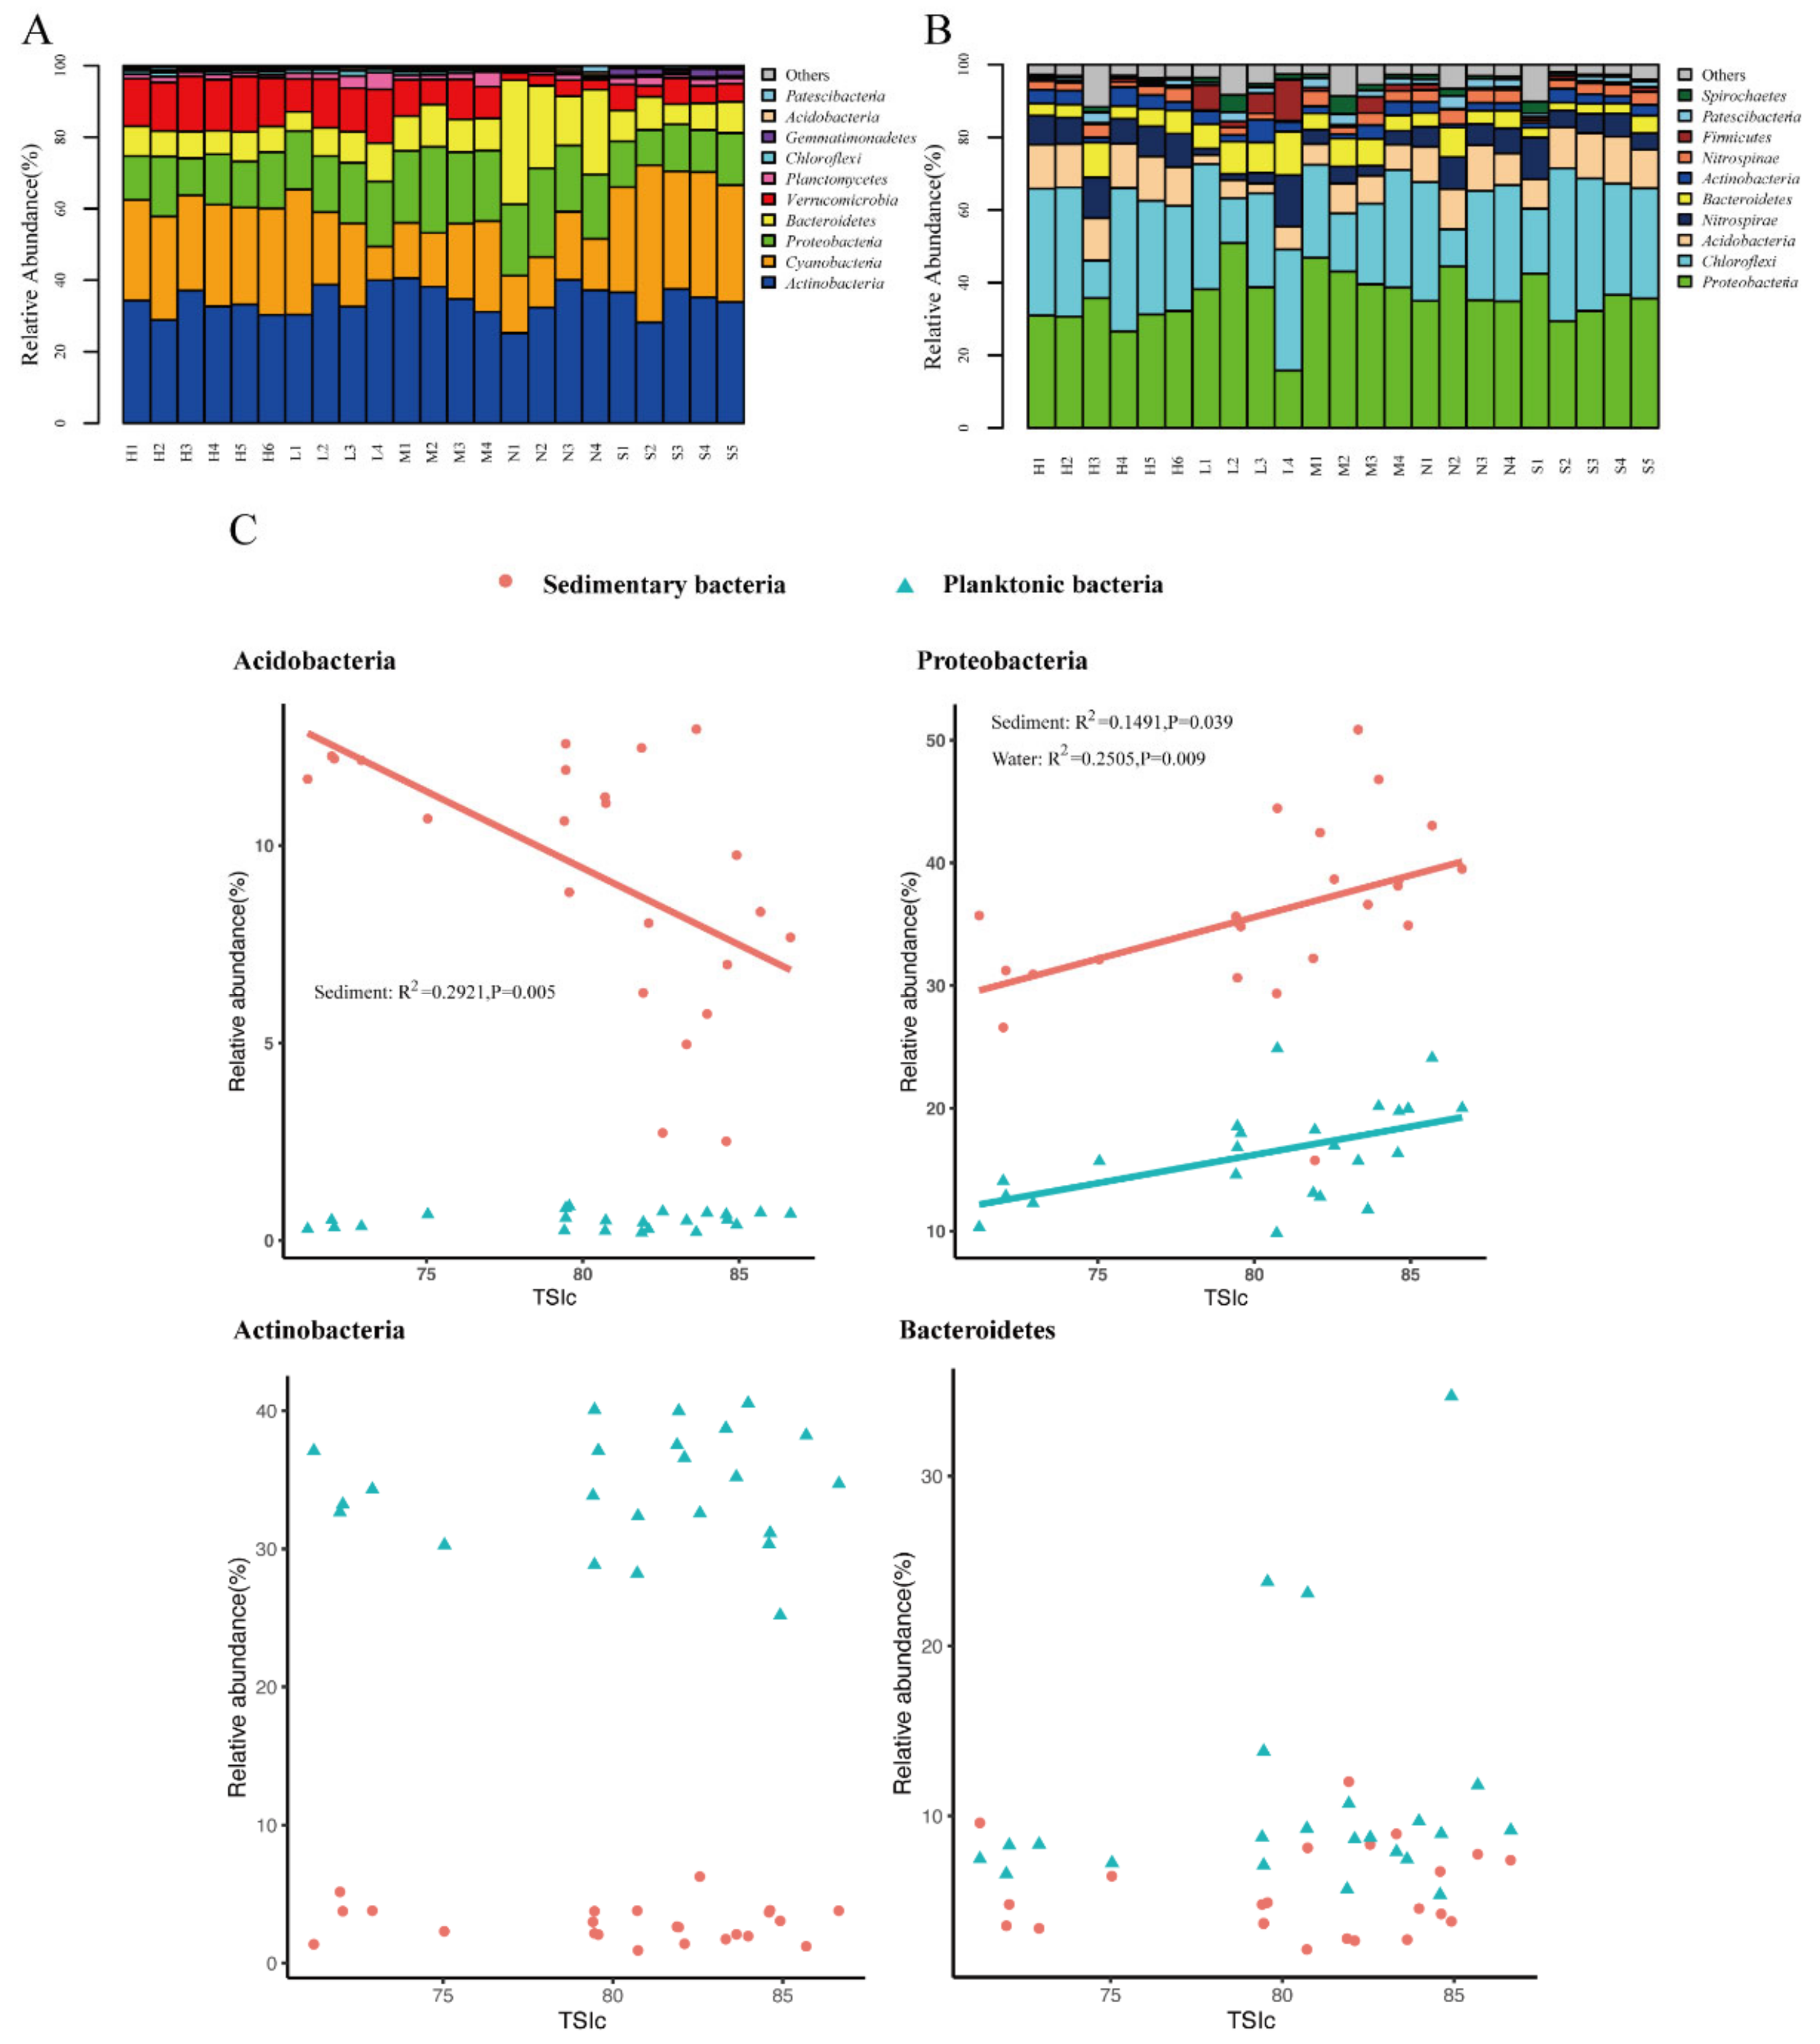
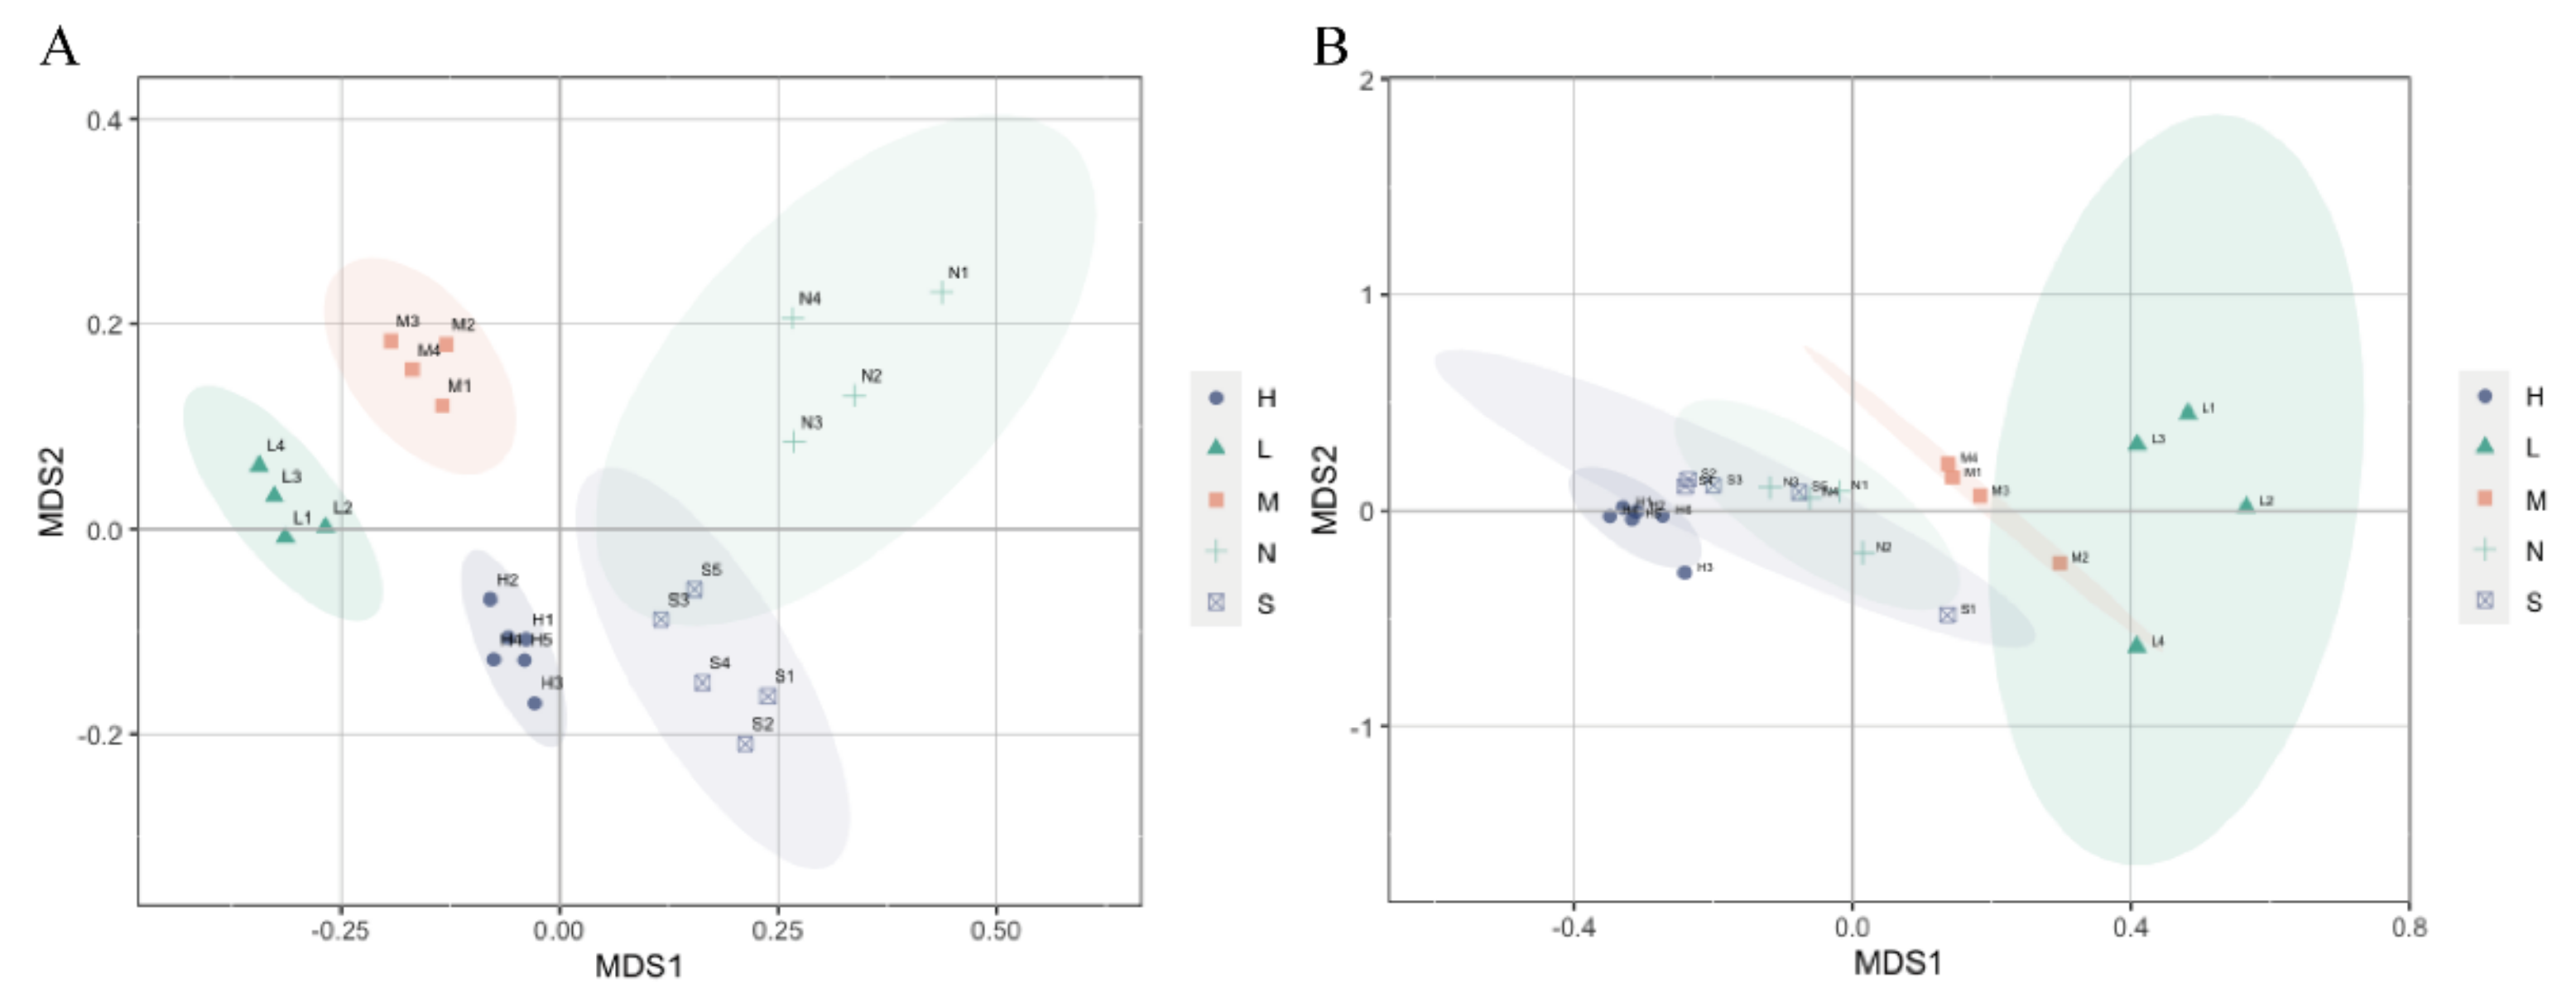
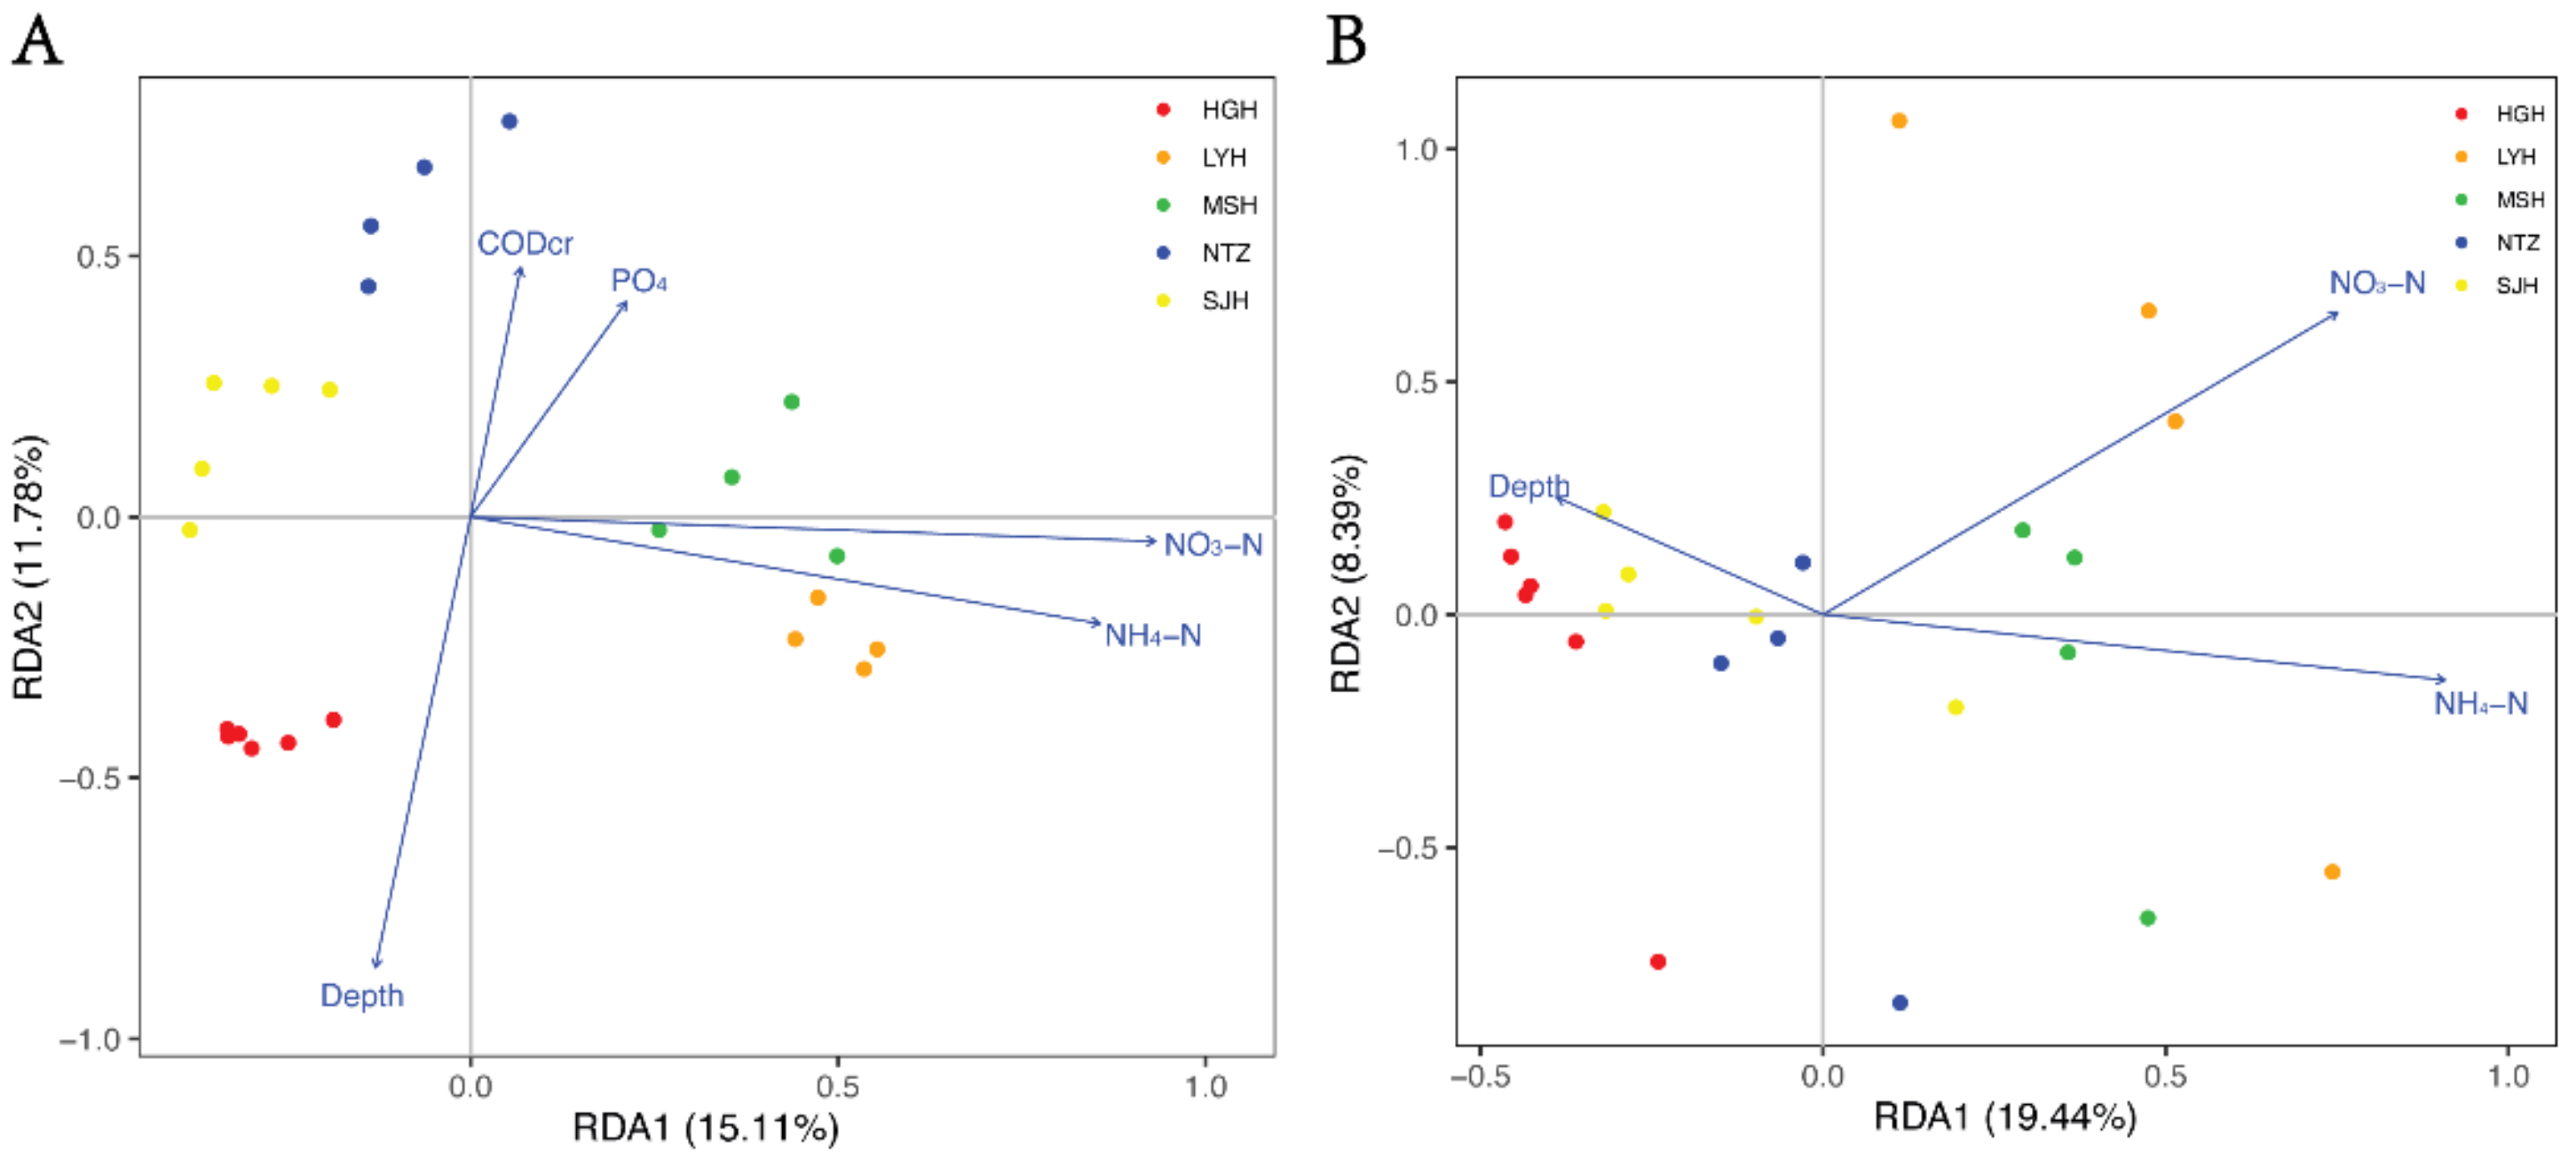
3.3. Planktonic and Sedimentary Bacterial Community Composition and Their Relationships to Environmental and Spatial Environmental Variables

Across all samples, there was a difference in the composition of the bacterial community between planktonic and sedimentary samples. Proteobacteria (35.84%), Chloroflexi (28.06%), Acidobacteria (9.29%), Nitrospirae (6.33%), and Bacteroidetes (5.52%) were the dominant phyla in water, whereas Actinobacteria (34.29%), Cyanobacteria (24.86%), Proteobacteria (16.39%), Bacteroidetes (10.98%), and Verrucomicrobia (9.25%) were the dominant phyla in sediments (Figure 4A,B). By means of analyzing the correlation of the relative abundance of the top ten OTUs shared by planktonic and sedimentary BCCs and TSIc, we found that Acidobacteria had a negative relationship with TSIc in sediment, but no significant relationship in water. Proteobacteria was increased with the increment of TSIc in both water and sediment. Actinobacteria and Bacteroidetes showed no significant linear relationship with this parameter (Figure 4C).
The NMDS analysis indicated that planktonic bacterial communities could be divided into five distinct groups, which were the same as sampling sites. There was little overlap between NTZ and SJH, whereas those in sediment could only be classified into three parts (LYH-MSH, NTZ-SJH, and HGH) (Figure 5). The following analysis of similarities (ANOSIM) testified that there was a significant difference between these groups both in water and sediment (water: R = 0.944, p = 0.001; sediment: R = 0.4164, p = 0.001). Furthermore, a redundancy analysis (RDA) was performed to explore the relationship between bacterial community composition and environmental variables with variance inflation factors (VIFs) < 10, results showed that Depth, NO4+-N, and NO3-N were the most important factor in the difference between lakes (Figure 6).
At last, the VPA revealed that the explained proportion of purely environmental variables tended to be higher than the purely spatial variables both in planktonic community composition (27.9% and 27.5%, respectively) and in sedimentary community composition (4.1% and 0.7%, respectively). It also showed that shared environmental and spatial factors explained 8.1% of the variation in planktonic communities, whereas nearly no such factor was found in sedimentary communities. More importantly, there was a large amount of variation remaining unexplained in these two habitats (59.8% in water and 72.1% in sediment) (Figure 7).

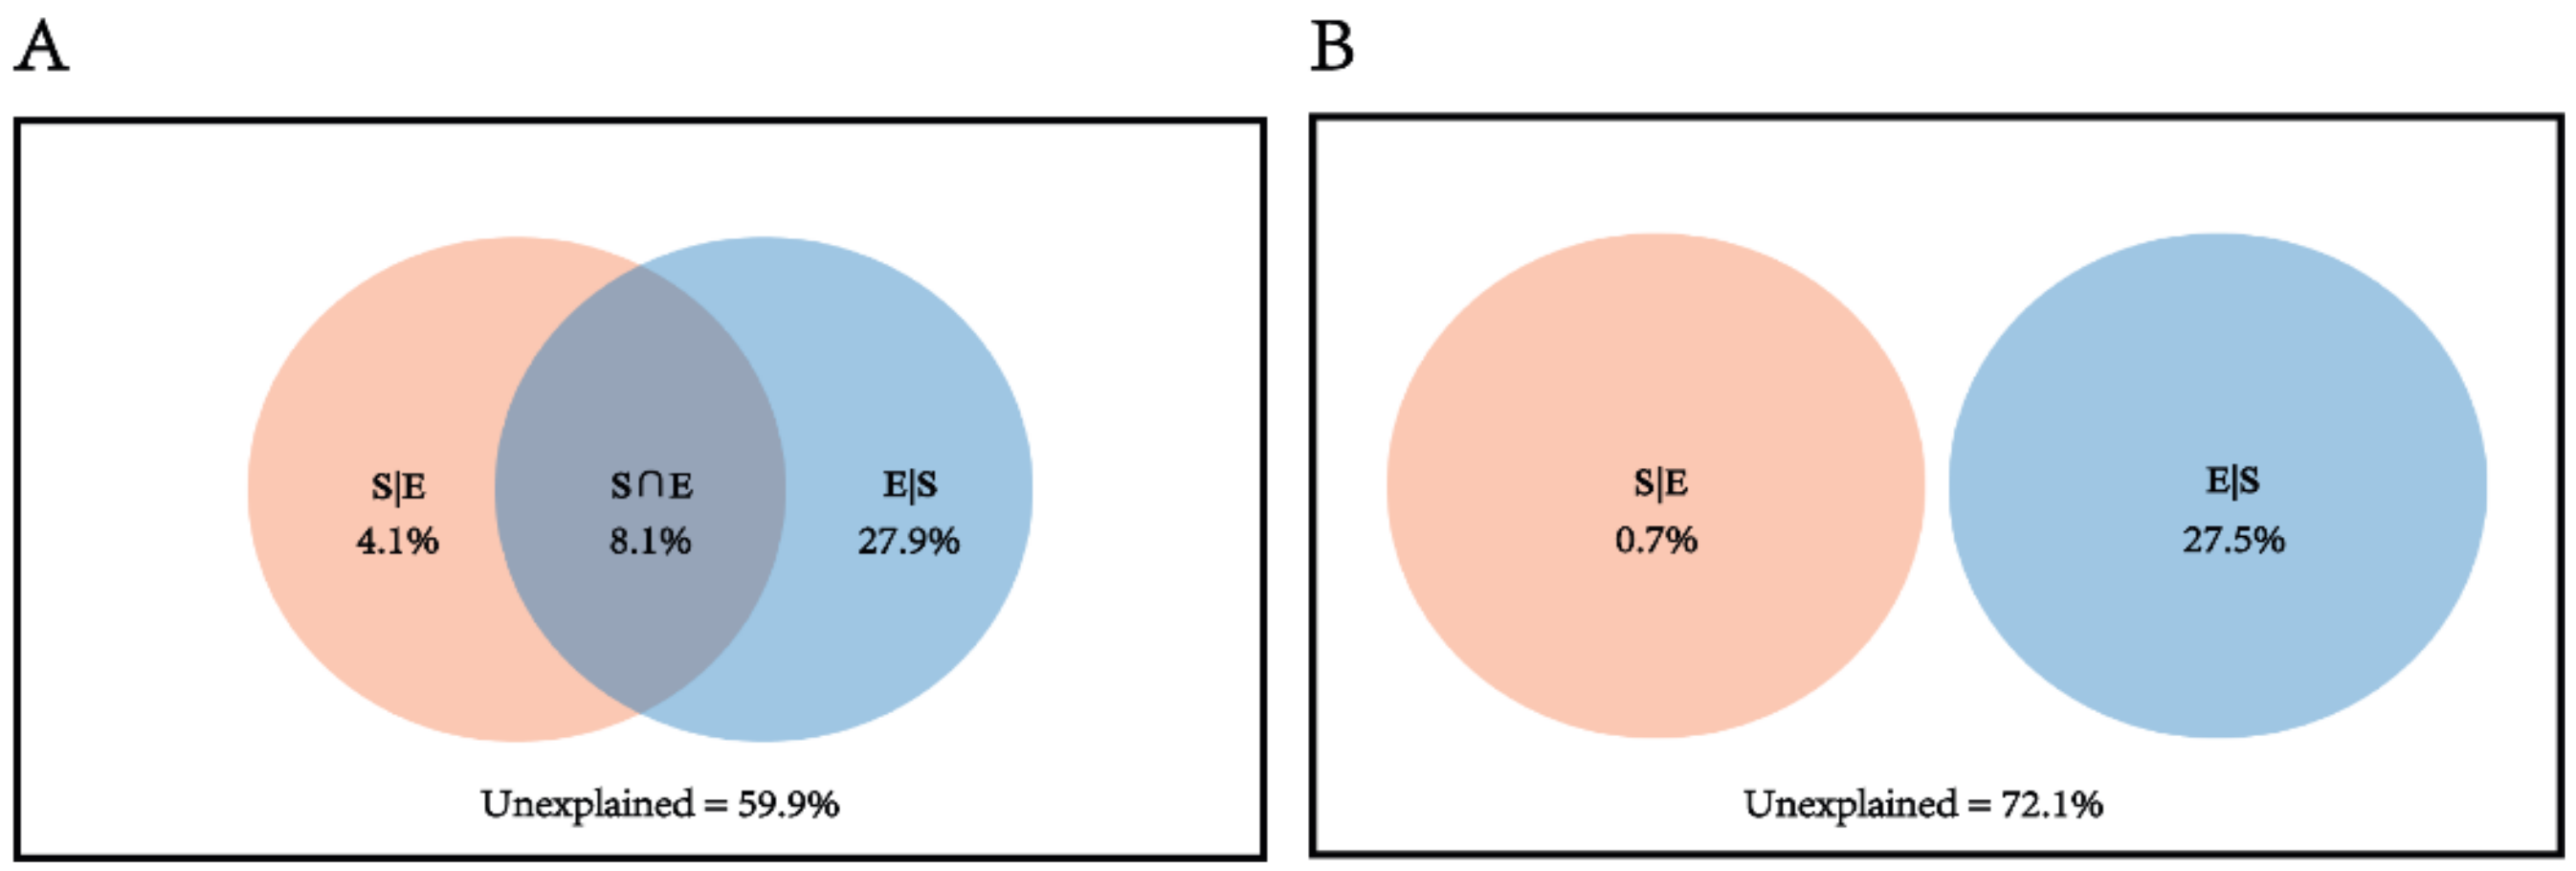
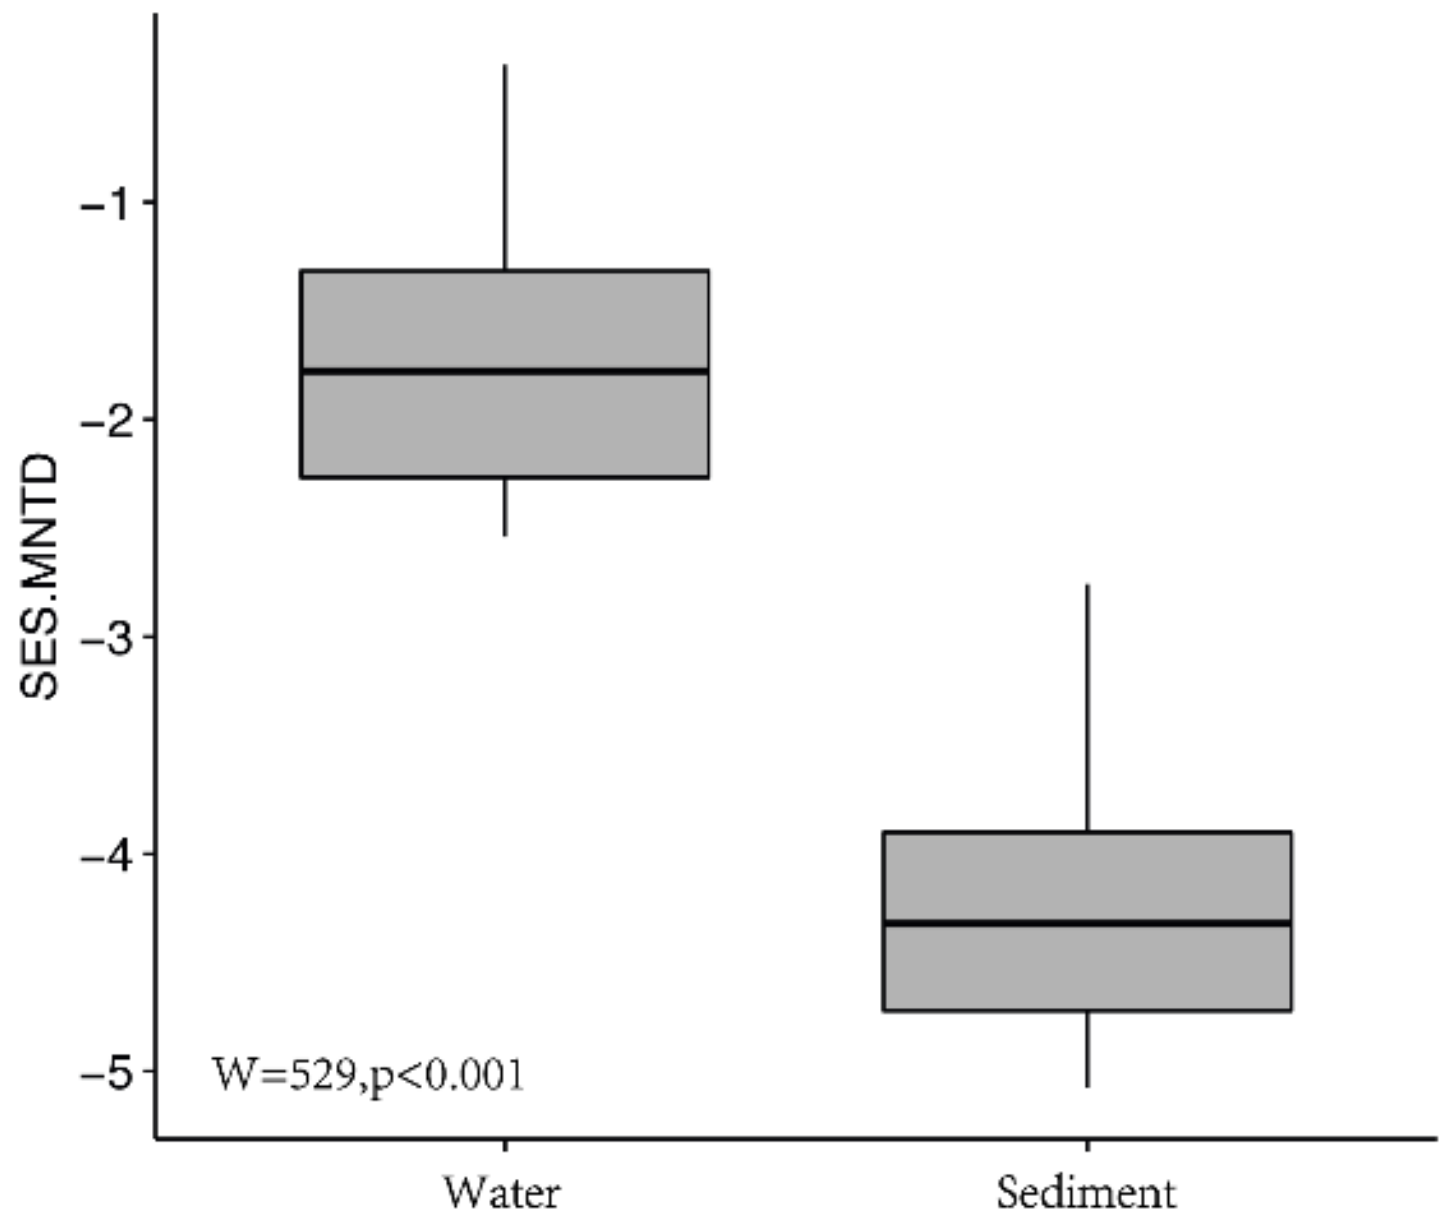
3.4. Ecological Processes Influencing Bacterial Community Assembly

A significant phylogenetic signal could be found as a positive relationship between the phylogenetic relatedness and ecological similarity in both water and sediment (Figure S2), which could be confirmed by mantel tests. Therefore, we could use closely related phylogenetic distance (the nearest taxon distance (SES.MNTD)) to predict ecological processes in both habitats. Then, we found that the mean SES.MNTD value in water was −1.70 (<0 and >−2), whose absolute magnitude was significantly lower than that in sediment (−4.21) (<−2) (Figure 8), demonstrating that environmental filtering had a larger effect on controlling sedimentary bacterial communities. Moreover, it was shown that bacterial communities in water tended to be phylogenetic overdispersion, and stochastic processes were more important than deterministic processes. However, different phenomena existed in sediment, bacterial community assembly was phylogenetically clustered, with the role of deterministic processes overwhelmed that of stochastic processes.
To quantitatively estimate the influences of each ecological process, which mainly include Selection, Drift acting along, and Dispersal Limitation acting in concert with Drift and Homogenizing Dispersal, we used applied methods combing standardized effect size of the beta mean nearest taxon distance (SES.βMNTD) and Bray–Curtis-based Raup–Crick (RCbray) [28]. Results showed that turnover in planktonic community composition was primarily due to dispersal limitation (68.0%) and variable selection (22.5%), while variable selection (77.5%) and dispersal limitation (22.1%) were predominant in shaping sedimentary community composition. In both habitats, undominated had little effect on governing bacterial communities (Figure 9).

4. Discussion

With the popularity of high-throughput studies on the microbial ecology, the mechanisms explaining eutrophic patterns of the planktonic and sedimental microbial composition have been published [33,43]. However, the driving factors that assemble the communities within and between different freshwater lakes in a larger pool are still not well-studied. In this study, we described the microbial community assembly in five lakes and tried to analyze the mechanisms driving the patterns.

4.1. The Bacterial Community Composition Differs between the Water and Sediment

Our results showed that more bacterial taxa exist in sediment than in water (Figure 3), which is consistent with some previous articles [44]. This phenomenon may be the result that parts of the microbiota of lake bottom come from the overlying water through the settling process. We also observed that the β diversity of sediment is significantly higher than that of water (Figure S3), which may be explained by the fact that the fluidity of sediment is weaker than that of the water column to the sediment environment is more stable to support microbial colonization [43].
The dominant phyla of the planktonic bacterial community including Actinobacteria (34.30 ± 4.12%), Cyanobacteria (24.86 ± 8.50%), and Proteobacteria (16.39 ± 4.03%), whereas those in the sediment bacterial community were Proteobacteria (35.83 ± 7.33%), Chloroflexi (28.06 ± 9.10%), and Acidobacteria (9.29 ± 3.19%) for the sediment bacterial community (Figure 4A,B). Actinobacteria and Acidobacteria are always detected in freshwater [45,46,47,48]. However, Cyanobacteria are only dominant in the water column, the reason may come from two aspects: one is their planktonic characterization and the other is that some lakes are under the status of eutrophic always caused by Cyanobacteria. Some studies have shown that Cyanobacteria can coexist and functionally interact with other bacteria in the water column [49]. For instance, some Betaproteobacteria coexist with Cyanobacteria and some Alphaproteobacteria can promote or inhibit the growth of Cyanobacteria [50,51].

4.2. Heterogeneity in Bacterial Community Composition between Different Lakes

From the NMDS analysis, we observed that the bacterioplankton community composition of samples from one lake tended to be clustered, whereas samples from different lakes were dispersed. However, the bacterial community distribution pattern in sediment is different from that in water (Figure 4A,B). The sedimentary bacterial community composition of sites from different lakes tends to be overlapped to a larger extent. The different assembly patterns between different habitats may come from the disparate characteristics of these two habitats. The water column is more mobile so that the OTUs composition between different lakes shows obvious heterogeneity.
Linking the distance between different bacterial communities with environmental variables can help us explore the key factors affecting the heterogeneity in bacterial community composition between different lakes. Previous studies have discussed the influence of environmental factors on planktonic and sedimentary bacterial communities. For instance, another study showed that DO (dissolved oxygen), TN (total nitrogen), and salinity take an important role in bacterial community composition in lakes [10]. Kong et al. reported that lakes’ bacterial community composition was co-variated with the water level, pH, total phosphorus, and other environmental parameters [46]. Ji’s work illustrated that the N/P ratio tended to play a vital role in bacterial communities in eutrophic lakes [52]. Shao et al. reported that CODMn and NH4+-N were the most important environmental parameters in driving the bacterial community of rivers around eutrophic Chaohu lake [53]. Our RDA analysis results show that depth of water, NO3-N, NH4+-N, PO43−, and CODcr are the important environmental factors that affect the bacterial community assembly in the water column (Figure 6). It is interesting to see that NO3-N, NH4+-N, and PO43− are parameters associated with eutrophy, which may be the key factor that assembles the bacterial communities. Moreover, we find that different phylum taxa exhibited distinct relationships with the TSIc index. For instance, Acidobacteria’s relative abundance decreased monotonously along the TSIc gradient in water but no significant linear relationship was found in sediment. On the other hand, Proteobacteria’s relative abundance increased monotonously along the TSIc gradient both in water and in sediment. The relationship between some bacteria and TSIc was also found in other studies in which Chloroflexi and Gammaproteobacteria had a significant correlation with TSIc in water and sediment from lakes [43].

4.3. Different Ecological Processes Driven the Bacterial Community Assembly between in Water and Sediment

It has long been a debatable issue in microbial ecology how bacterial community composition assembles [19]. There are two generally accepted theories—niche theory and the neutral theory—explaining the mechanisms governing the community assembly. Some studies had found that these two mechanisms always work together rather than act alone to determine the bacterial community composition [54]. Furthermore, Vellend comes up with the idea that selection, dispersal, drift, and speciation are the main factors driving the community composition [55]. However, quantitatively estimating the influence of multiple progresses on governing ecological systems was still unknown until a new framework integrating the taxonomic distance and phylogenetic distance and relying partly on null models had been put forward [22,56]. This framework can efficiently quantitatively calculate the proportion of influences of selection, dispersal limitation acting alongside drift, drift acting along and homogenizing dispersal on bacterial community composition [28].
In this work, we firstly used the VPA to analyze the relation contribution of spatial variables and environmental variables in the planktonic and sedimentary community assembly. In water, purely environmental factors accounted for 27.9% of variation which was nearly equal to that in sediment (27.5%). However, few proportions of variation were explained by spatial variables in both habitats (4.1% in water and 0.7% in sediment). The shorter distance among lakes may be the reason why spatial variables were less important than physicochemical parameters. More importantly, a large number of proportions of variation were unexplained in planktonic (59.8%) and sedimentary (72.1%) bacterial community composition, which was also found in a previous study [57]. Therefore, a more comprehensive and elaborate method was needed to decipher the driving factors.
It is common to investigate the mechanism of bacterial community assembly by using phylogenetic information. Here, a significant phylogenetic signal shown in both water and sediment suggests that there is a positive relationship between ecological differences and phylogenetic distances across close relatives, so that we can use the nearest phylogenetic information to infer the ecological process [41]. Then, we calculate the standardized effect size of the mean nearest taxon distance (SES.MNTD) and find that: (i) In water, the SES.MNTD is −1.70 so that the bacterial communities are inclined to be phylogenetically stochastic, indicating that stochastic processes play a more important role in governing the assembly of planktonic bacterial communities. This result was not consistent with Zeng’s work which had the opposite conclusion [43]. This may be because our sampling lakes were connected, which reduced the impact of deterministic processes. (ii) In sediment, the SES.MNTD is −4,21 so that deterministic processes were more crucial than stochastic processes in assembling the sedimentary bacteria communities which agree with Zeng’s work [43].
We used the SES.βMNTD combing with RCbray to investigate the relative importance of homogenizing selection, variable selection, dispersal limitation, homogenizing dispersal and undominated. We found that dispersal limited process and variable selection process dominated 68.0% and 22.5% of the assembly of planktonic bacterial community, respectively (Figure 9), which was consistent with our previous results that planktonic bacterial community assembly was primarily governed by neutral process and that 27% of whose variation was due to purely environmental factor by VPA (Figure 7). However, the variable selection was the main reason causing the difference between sediment samples, accounting for 77.5% in sedimentary bacterial community assembly (Figure 9), which was agreed with Zeng’s work [43]. This phenomenon may result from the factor that the heterogeneity and less mobility of sediments made these habitats have a strong filter effect on bacteria.

5. Conclusions

This study has provided a better understanding of the bacterial community assembly in the water and sediment habitats of some eutrophic lakes. Our results showed that bacterial communities exhibit different patterns between these two groups, and this difference can be partly explained by environmental variables, such as Depth, NO4+-N, and NO3-N. It also demonstrated that the neutral process played an important role in planktonic bacterial community assembly, whereas the deterministic process did in bacterial community assembly in sediment. To fully understand the assembly mechanism, our work illustrated that the dispersal limitation and various selection were the primary driven factor in bacterial community assembly in water and sediment, respectively.

Supplementary Materials

The following are available online at https://www.mdpi.com/article/10.3390/w14050723/s1, Figure S1: Rarefaction curve of planktonic (A) and sedimentary (B) samples, Figure S2: Phylogenetic signal in waters (A) and in sediments (B), Figure S3: Comparison of Bray-Curtis dissimilarity (A) and Unweighted Unifrac dissimilarity (B) between planktonic and sedimentary bacterial, Table S1: Limnological parameters, Table S2: Physicochemical properties of the water and sediment collected from the sampled lakes.

Author Contributions

Conceptualization, M.X. and D.L.; Data curation, X.L.; Formal analysis, Z.W. and D.Z.; Funding acquisition, D.L.; Investigation, H.L. and Y.W.; Methodology, F.X., Z.W., D.Z., Y.C. and J.Y.; Resources, X.L., Y.C. and Y.W.; Visualization, J.Y.; Writing—original draft, M.X.; Writing—review & editing, F.X. and H.L. All authors have read and agreed to the published version of the manuscript.

Funding

This work was supported by the National Key R&D Program of China (2019YFD0900603), the National Natural Science Foundation of China (51779105, 31900095), the Innovative Research Team Foundation of the Department of Education of Hubei Province, China (T2020034), and the Scientific Research Project of Jianghan University.

Institutional Review Board Statement

Not applicable.

Informed Consent Statement

Not applicable.

Data Availability Statement

Raw data of the OTUs in every sampling site have been submitted on the NCBI (PRJNA777015 is for water and PRJNA777413 is for sediment).

Acknowledgments

The authors acknowledge the financial support from the National Key R&D Program of China (2019YFD0900603), the National Natural Science Foundation of China (51779105, 31900095), the Innovative Research Team Foundation of the Department of Education of Hubei Province, China (T2020034), and the Scientific Research Project of Jianghan University.

Conflicts of Interest

The authors declare no conflict of interest.

References

  1. Galachyants, A.D.; Tomberg, I.V.; Sukhanova, E.V.; Shtykova, Y.R.; Suslova, M.Y.; Zimens, E.A.; Blinov, V.V.; Sakirko, M.V.; Domysheva, V.M.; Belykh, O.I. Bacterioneuston in Lake Baikal: Abundance, Spatial and Temporal Distribution. Int. J. Environ. Res. Public Health 2018, 15, 2587. [Google Scholar] [CrossRef] [PubMed] [Green Version]
  2. Jiang, H.; Dong, H.; Zhang, G.; Yu, B.; Chapman, L.R.; Fields, M.W. Microbial diversity in water and sediment of Lake Chaka, an athalassohaline lake in northwestern China. Appl. Environ. Microbiol. 2006, 72, 3832–3845. [Google Scholar] [CrossRef] [PubMed] [Green Version]
  3. Lozupone, C.A.; Knight, R. Global patterns in bacterial diversity. Proc. Natl. Acad. Sci. USA 2007, 104, 11436–11440. [Google Scholar] [CrossRef] [PubMed] [Green Version]
  4. Newton, R.J.; Jones, S.E.; Eiler, A.; McMahon, K.D.; Bertilsson, S. A guide to the natural history of freshwater lake bacteria. Microbiol. Mol. Biol. Rev. 2011, 75, 14–49. [Google Scholar] [CrossRef] [Green Version]
  5. Xie, G.; Tang, X.; Shao, K.; Hu, Y.; Liu, H.; Martin, R.M.; Gao, G. Spatiotemporal patterns and environmental drivers of total and active bacterial abundances in Lake Taihu, China. Ecol. Indic. 2020, 114, 106335. [Google Scholar] [CrossRef]
  6. Hanson, C.A.; Fuhrman, J.A.; Horner-Devine, M.C.; Martiny, J.B. Beyond biogeographic patterns: Processes shaping the microbial landscape. Nat. Rev. Microbiol. 2012, 10, 497–506. [Google Scholar] [CrossRef]
  7. Fuhrman, J.A. Microbial community structure and its functional implications. Nature 2009, 459, 193–199. [Google Scholar] [CrossRef]
  8. Małecka-Adamowicz, M.; Kubera, Ł. Patterns of Structural and Functional Bacterioplankton Metacommunity along a River under Anthropogenic Pressure. Sustainability 2021, 13, 11518. [Google Scholar] [CrossRef]
  9. Shendure, J.; Ji, H. Next-generation DNA sequencing. Nat. Biotechnol. 2008, 26, 1135–1145. [Google Scholar] [CrossRef]
  10. Liao, J.; Cao, X.; Zhao, L.; Wang, J.; Gao, Z.; Wang, M.C.; Huang, Y. The importance of neutral and niche processes for bacterial community assembly differs between habitat generalists and specialists. FEMS Microbiol. Ecol. 2016, 92, fiw174. [Google Scholar] [CrossRef] [Green Version]
  11. Liu, L.; Yang, J.; Yu, Z.; Wilkinson, D.M. The biogeography of abundant and rare bacterioplankton in the lakes and reservoirs of China. ISME J. 2015, 9, 2068–2077. [Google Scholar] [CrossRef] [PubMed]
  12. Fortunato, C.S.; Herfort, L.; Zuber, P.; Baptista, A.M.; Crump, B.C. Spatial variability overwhelms seasonal patterns in bacterioplankton communities across a river to ocean gradient. ISME J. 2012, 6, 554–563. [Google Scholar] [CrossRef] [PubMed]
  13. Zeng, J.; Zhao, D.; Li, H.; Huang, R.; Wang, J.; Wu, Q.L. A monotonically declining elevational pattern of bacterial diversity in freshwater lake sediments. Environ. Microbiol. 2016, 18, 5175–5186. [Google Scholar] [CrossRef] [PubMed]
  14. Kent, A.D.; Yannarell, A.C.; Rusak, J.A.; Triplett, E.W.; McMahon, K.D. Synchrony in aquatic microbial community dynamics. ISME J. 2007, 1, 38–47. [Google Scholar] [CrossRef] [PubMed]
  15. Lin, X.; McKinley, J.; Resch, C.T.; Kaluzny, R.; Lauber, C.L.; Fredrickson, J.; Knight, R.; Konopka, A. Spatial and temporal dynamics of the microbial community in the Hanford unconfined aquifer. ISME J. 2012, 6, 1665–1676. [Google Scholar] [CrossRef] [PubMed]
  16. Cao, X.F.; Wang, J.; Liao, J.Q.; Gao, Z.; Jiang, D.L.; Sun, J.H.; Zhao, L.; Huang, Y.; Luan, S.J. Bacterioplankton community responses to key environmental variables in plateau freshwater lake ecosystems: A structural equation modeling and change point analysis. Sci. Total Environ. 2017, 580, 457–467. [Google Scholar] [CrossRef]
  17. Niu, Y.; Yu, H.; Jiang, X. Within-lake heterogeneity of environmental factors structuring bacterial community composition in Lake Dongting, China. World J. Microbiol. Biotechnol. 2015, 31, 1683–1689. [Google Scholar] [CrossRef]
  18. Souffreau, C.; Van der Gucht, K.; van Gremberghe, I.; Kosten, S.; Lacerot, G.; Lobao, L.M.; Huszar, V.L.D.; Roland, F.; Jeppesen, E.; Vyverman, W.; et al. Environmental rather than spatial factors structure bacterioplankton communities in shallow lakes along a > 6000 km latitudinal gradient in South America. Environ. Microbiol. 2015, 17, 2336–2351. [Google Scholar] [CrossRef]
  19. Nemergut, D.R.; Schmidt, S.K.; Fukami, T.; O’Neill, S.P.; Bilinski, T.M.; Stanish, L.F.; Knelman, J.E.; Darcy, J.L.; Lynch, R.C.; Wickey, P.; et al. Patterns and processes of microbial community assembly. Microbiol. Mol. Biol. Rev. 2013, 77, 342–356. [Google Scholar] [CrossRef] [Green Version]
  20. Gilbert, J.A.; Steele, J.A.; Caporaso, J.G.; Steinbruck, L.; Reeder, J.; Temperton, B.; Huse, S.; McHardy, A.C.; Knight, R.; Joint, I.; et al. Defining seasonal marine microbial community dynamics. ISME J. 2012, 6, 298–308. [Google Scholar] [CrossRef] [Green Version]
  21. Ofiteru, I.D.; Lunn, M.; Curtis, T.P.; Wells, G.F.; Criddle, C.S.; Francis, C.A.; Sloan, W.T. Combined niche and neutral effects in a microbial wastewater treatment community. Proc. Natl. Acad. Sci. USA 2010, 107, 15345–15350. [Google Scholar] [CrossRef] [PubMed] [Green Version]
  22. Stegen, J.C.; Lin, X.; Konopka, A.E.; Fredrickson, J.K. Stochastic and deterministic assembly processes in subsurface microbial communities. ISME J. 2012, 6, 1653–1664. [Google Scholar] [CrossRef] [Green Version]
  23. Chave, J. Neutral theory and community ecology. Ecol. Lett. 2004, 7, 241–253. [Google Scholar] [CrossRef]
  24. Zhou, J.Z.; Ning, D.L. Stochastic Community Assembly: Does It Matter in Microbial Ecology? Microbiol. Mol. Biol. R 2017, 81, e00002–e00017. [Google Scholar] [CrossRef] [PubMed] [Green Version]
  25. Dumbrell, A.J.; Nelson, M.; Helgason, T.; Dytham, C.; Fitter, A.H. Relative roles of niche and neutral processes in structuring a soil microbial community. ISME J. 2010, 4, 337–345. [Google Scholar] [CrossRef] [Green Version]
  26. Szekely, A.J.; Langenheder, S. The importance of species sorting differs between habitat generalists and specialists in bacterial communities. FEMS Microbiol. Ecol. 2014, 87, 102–112. [Google Scholar] [CrossRef]
  27. Maren, I.E.; Kapfer, J.; Aarrestad, P.A.; Grytnes, J.A.; Vandvik, V. Changing contributions of stochastic and deterministic processes in community assembly over a successional gradient. Ecology 2018, 99, 148–157. [Google Scholar] [CrossRef] [Green Version]
  28. Stegen, J.C.; Lin, X.; Fredrickson, J.K.; Chen, X.; Kennedy, D.W.; Murray, C.J.; Rockhold, M.L.; Konopka, A. Quantifying community assembly processes and identifying features that impose them. ISME J. 2013, 7, 2069–2079. [Google Scholar] [CrossRef]
  29. Stegen, J.C.; Lin, X.; Fredrickson, J.K.; Konopka, A.E. Estimating and mapping ecological processes influencing microbial community assembly. Front. Microbiol. 2015, 6, 370. [Google Scholar] [CrossRef] [Green Version]
  30. Houseman, G.R.; Mittelbach, G.G.; Reynolds, H.L.; Gross, K.L. Perturbations alter community convergence, divergence, and formation of multiple community states. Ecology 2008, 89, 2172–2180. [Google Scholar] [CrossRef]
  31. McCrackin, M.L.; Jones, H.P.; Jones, P.C.; Moreno-Mateos, D. Recovery of lakes and coastal marine ecosystems from eutrophication: A global meta-analysis. Limnol. Oceanogr. 2017, 62, 507–518. [Google Scholar] [CrossRef]
  32. Dai, W.; Zhang, J.; Tu, Q.; Deng, Y.; Qiu, Q.; Xiong, J. Bacterioplankton assembly and interspecies interaction indicating increasing coastal eutrophication. Chemosphere 2017, 177, 317–325. [Google Scholar] [CrossRef] [PubMed]
  33. Ren, L.J.; He, D.; Chen, Z.; Jeppesen, E.; Lauridsen, T.L.; Sondergaard, M.; Liu, Z.W.; Wu, Q.L. Warming and nutrient enrichment in combination increase stochasticity and beta diversity of bacterioplankton assemblages across freshwater mesocosms. ISME J. 2017, 11, 613–625. [Google Scholar] [CrossRef] [PubMed] [Green Version]
  34. Wang, J.; Pan, F.; Soininen, J.; Heino, J.; Shen, J. Nutrient enrichment modifies temperature-biodiversity relationships in large-scale field experiments. Nat. Commun. 2016, 7, 13960. [Google Scholar] [CrossRef] [Green Version]
  35. Hong, C.; Si, Y.; Xing, Y.; Li, Y. Illumina MiSeq sequencing investigation on the contrasting soil bacterial community structures in different iron mining areas. Environ. Sci. Pollut. Res. Int. 2015, 22, 10788–10799. [Google Scholar] [CrossRef]
  36. Magoc, T.; Salzberg, S.L. FLASH: Fast length adjustment of short reads to improve genome assemblies. Bioinformatics 2011, 27, 2957–2963. [Google Scholar] [CrossRef]
  37. Bolger, A.M.; Lohse, M.; Usadel, B. Trimmomatic: A flexible trimmer for Illumina sequence data. Bioinformatics 2014, 30, 2114–2120. [Google Scholar] [CrossRef] [Green Version]
  38. Edgar, R.C. UPARSE: Highly accurate OTU sequences from microbial amplicon reads. Nat. Methods 2013, 10, 996–998. [Google Scholar] [CrossRef]
  39. Zhao, D.; Cao, X.; Huang, R.; Zeng, J.; Shen, F.; Xu, H.; Wang, S.; He, X.; Yu, Z. The heterogeneity of composition and assembly processes of the microbial community between different nutrient loading lake zones in Taihu Lake. Appl. Microbiol. Biotechnol. 2017, 101, 5913–5923. [Google Scholar] [CrossRef]
  40. Kembel, S.W. Disentangling niche and neutral influences on community assembly: Assessing the performance of community phylogenetic structure tests. Ecol. Lett. 2009, 12, 949–960. [Google Scholar] [CrossRef]
  41. Wang, J.; Shen, J.; Wu, Y.; Tu, C.; Soininen, J.; Stegen, J.C.; He, J.; Liu, X.; Zhang, L.; Zhang, E. Phylogenetic beta diversity in bacterial assemblages across ecosystems: Deterministic versus stochastic processes. ISME J. 2013, 7, 1310–1321. [Google Scholar] [CrossRef] [PubMed]
  42. Chase, J.M.; Myers, J.A. Disentangling the importance of ecological niches from stochastic processes across scales. Philos. Trans. R. Soc. Lond. B Biol. Sci. 2011, 366, 2351–2363. [Google Scholar] [CrossRef] [PubMed] [Green Version]
  43. Zeng, J.; Jiao, C.C.; Zhao, D.Y.; Xu, H.M.; Huang, R.; Cao, X.Y.; Yu, Z.B.; Wu, Q.L.L. Patterns and assembly processes of planktonic and sedimentary bacterial community differ along a trophic gradient in freshwater lakes. Ecol. Indic. 2019, 106. [Google Scholar] [CrossRef]
  44. Liu, T.; Zhang, A.N.; Wang, J.; Liu, S.; Jiang, X.; Dang, C.; Ma, T.; Liu, S.; Chen, Q.; Xie, S.; et al. Integrated biogeography of planktonic and sedimentary bacterial communities in the Yangtze River. Microbiome 2018, 6, 16. [Google Scholar] [CrossRef] [PubMed] [Green Version]
  45. Hanashiro, F.T.T.; Mukherjee, S.; Souffreau, C.; Engelen, J.; Brans, K.I.; Busschaert, P.; De Meester, L. Freshwater Bacterioplankton Metacommunity Structure Along Urbanization Gradients in Belgium. Front. Microbiol. 2019, 10, 743. [Google Scholar] [CrossRef] [PubMed] [Green Version]
  46. Kong, Z.; Kou, W.; Ma, Y.; Yu, H.; Ge, G.; Wu, L. Seasonal dynamics of the bacterioplankton community in a large, shallow, highly dynamic freshwater lake. Can. J. Microbiol. 2018, 64, 786–797. [Google Scholar] [CrossRef]
  47. Langenheder, S.; Szekely, A.J. Species sorting and neutral processes are both important during the initial assembly of bacterial communities. ISME J. 2011, 5, 1086–1094. [Google Scholar] [CrossRef] [Green Version]
  48. Zhao, D.; Xu, H.; Zeng, J.; Cao, X.; Huang, R.; Shen, F.; Yu, Z. Community composition and assembly processes of the free-living and particle-attached bacteria in Taihu Lake. FEMS Microbiol. Ecol. 2017, 93, 6. [Google Scholar] [CrossRef]
  49. Zhao, D.; Shen, F.; Zeng, J.; Huang, R.; Yu, Z.; Wu, Q.L. Network analysis reveals seasonal variation of co-occurrence correlations between Cyanobacteria and other bacterioplankton. Sci. Total Environ. 2016, 573, 817–825. [Google Scholar] [CrossRef]
  50. Berg, K.A.; Lyra, C.; Sivonen, K.; Paulin, L.; Suomalainen, S.; Tuomi, P.; Rapala, J. High diversity of cultivable heterotrophic bacteria in association with cyanobacterial water blooms. ISME J. 2009, 3, 314–325. [Google Scholar] [CrossRef]
  51. Eiler, A.; Heinrich, F.; Bertilsson, S. Coherent dynamics and association networks among lake bacterioplankton taxa. ISME J. 2012, 6, 330–342. [Google Scholar] [CrossRef] [Green Version]
  52. Ji, B.; Liu, C.; Liang, J.; Wang, J. Seasonal Succession of Bacterial Communities in Three Eutrophic Freshwater Lakes. Int. J. Environ. Res. Public Health 2021, 18, 6950. [Google Scholar] [CrossRef] [PubMed]
  53. Shao, K.; Yao, X.; Wu, Z.; Jiang, X.; Hu, Y.; Tang, X.; Xu, Q.; Gao, G. The bacterial community composition and its environmental drivers in the rivers around eutrophic Chaohu Lake, China. BMC Microbiol. 2021, 21, 179. [Google Scholar] [CrossRef] [PubMed]
  54. Lindstrom, E.S.; Langenheder, S. Local and regional factors influencing bacterial community assembly. Environ. Microbiol. Rep. 2012, 4, 1–9. [Google Scholar] [CrossRef]
  55. Vellend, M. Conceptual Synthesis in Community Ecology. Q. Rev. Biol. 2010, 85, 183–206. [Google Scholar] [CrossRef] [Green Version]
  56. Chase, J.M.; Kraft, N.J.B.; Smith, K.G.; Vellend, M.; Inouye, B.D. Using null models to disentangle variation in community dissimilarity from variation in alpha-diversity. Ecosphere 2011, 2, 183–206. [Google Scholar] [CrossRef]
  57. Mo, Y.; Zhang, W.; Yang, J.; Lin, Y.; Yu, Z.; Lin, S. Biogeographic patterns of abundant and rare bacterioplankton in three subtropical bays resulting from selective and neutral processes. ISME J. 2018, 12, 2198–2210. [Google Scholar] [CrossRef] [PubMed] [Green Version]
Figure 1. Map of five lakes in Wuhan city, Hubei province, China. LYH: Lake Longyang; MSH: Lake Moshui; SJH: Lake Sanjiao; NTZ: Lake Nantaizi; HGH: Lake Houguan.
Water 14 00723 g001
Figure 2. Pairwise Spearman’s rank correlation matrix of bacterial α-diversity and environmental parameters in water. Circle size reflects the magnitude of the correlation coefficient. Color represents the level of Spearman’s correlations (blue means positive correlation and red means negative correlation). OTU: species richness; pd: phylogenetic diversity; ORP: oxidation–reduction potential; Cond.: conductivity; DO: dissolved oxygen; c.
Water 14 00723 g002
Figure 3. Comparison of species richness (A) and phylogenetic diversity (B) between planktonic and sedimentary bacteria as well as their correlations with TSIc ((C) represents the species richness and (D) represent the phylogenetic diversity). PB represents the planktonic bacteria and the SB represents the sedimentary bacteria. The bottom, middle, and top line of each box represents the first quartile, the median, and the third quartiles of the value range. The whiskers extend to values at 1.5× the inter-quartile range. Outliers, with values extend out of whiskers, are shown as solid circles. Red circle represents the bacteria in sediment and green triangle represents the bacteria in water. The significance of relationships was determined by F-statistics. All R2 values were adjusted.
Water 14 00723 g003
Figure 4. Relative abundance of the dominant bacterial phyla among the different planktonic (A) and sedimentary (B) samples. Relationships between the relative of top-ten OTUs shared by planktonic and sedimentary environment and comprehensive trophic state index (TSIc) (C). The red circle represents the bacteria in sediment and the green triangle represents the bacteria in water. The significance of relationships was determined by F-statistics. All R2 values were adjusted.
Water 14 00723 g004
Figure 5. Non-metric multidimensional scaling (NMDS) analysis of planktonic (A) and sedimentary (B) bacterial community composition. H, L, M, N, and S represent HGH, LYH, MSH, NTZ, and SJH, respectively.
Water 14 00723 g005
Figure 6. Redundancy analysis (RDA) of environmental variables with variance inflation factors (VIFs) < 10 and bacterial communities in water (A) and in sediment (B). Samples were differentiated by color.
Water 14 00723 g006
Figure 7. The proportion of variation in planktonic (A) and sedimentary (B) community composition explained by spatial and environmental variables. SIE pure spatial variables, S∩E share explained variables, EIS pure environmental variables, unexplained = 1−SIE− S∩E−EIS.
Water 14 00723 g007
Figure 8. Comparison of the standardized effect size of the mean nearest taxon distance (SES.MNTD) between planktonic and sedimentary BBCs. The bottom, middle, and top line of each box represents the first quartile, the median, and the third quartiles of the value range. The whiskers extend to values at 1.5× the inter-quartile range. Wilcoxon test was used to test significant at a p < 0.001 level. The SES.MNTD of BCCs in water was significantly greater than −2 through t-test (t = 2.1682, p < 0.05).
Water 14 00723 g008
Figure 9. Relative importance of ecological processes that participate in the bacterial community assemble in water (A) and sediment (B).
Water 14 00723 g009
Publisher’s Note: MDPI stays neutral with regard to jurisdictional claims in published maps and institutional affiliations.

