
Synergistic Effects of PDO and IOD on Water Vapor Transport in the Preflood Season over South China

1
South China Sea Institute of Marine Meteorology, College of Ocean and Meteorology, Guangdong Ocean University, Zhanjiang 524088, China
2
Education Information Center, Guangdong Ocean University, Zhanjiang 524088, China
*
Author to whom correspondence should be addressed.
Water 2022, 14(5), 722; https://doi.org/10.3390/w14050722
Submission received: 25 January 2022
/
Revised: 21 February 2022
/
Accepted: 22 February 2022
/
Published: 24 February 2022
(This article belongs to the Topic Water Management in the Era of Climatic Change)
Abstract
:It is urgent to improve the prediction accuracy of precipitation in the preflood season (PFS) over South China (SC) under the background of global warming, and thus the research of water vapor conditions is the key. For the period of 1960–2012, using the daily precipitation data from 60 meteorology stations in SC and National Centers for Environmental Prediction (NCEP) reanalysis data, the synergistic effect of PDO (the Pacific Decadal Oscillation) &IOD (the Indian Ocean Dipole Mode) on water vapor transport process to frontal/monsoon precipitation is revealed, based on the Hybrid Single-Particle Lagrangian Integrated Trajectory model (HYSPLIT_4.9). For the frontal precipitation, the positive PDO phase (PDO+) compared with the negative PDO phase (PDO−), there is more water vapor over the West Pacific (WP), the northern South China Sea (SCS), and the Bay of Bengal (BOB). Water vapor for frontal precipitation mainly comes from WP and SCS. When PDO and IOD are in phase resonance, the water vapor transport tracks from the SCS, WP are shorter and westward, so more water vapor is transported to SC, the precipitation efficiency of water vapor to PFS precipitation is higher too. For the summer monsoon precipitation, the tropical Indian Ocean (IO)-BOB is rich in water vapor, especially for PDO−& IOD+. The main water vapor transport tracks are the cross-equatorial flows in the IO, BOB and SCS. The precipitation efficiency of water vapor from the IO-BOB is higher for the positive IOD phase (IOD+) than that for the negative IOD phase (IOD−); however, the precipitation efficiency of water vapor from SCS is higher for the IOD− than that for IOD+. Compared with frontal precipitation, the strong westerly anomaly in the northern IO increases the water vapor transport from the north IO, BOB to SC during monsoon precipitation. For the PDO+&IOD+, the stronger Indian Low and cyclonic anomaly in the WP increases the water vapor transported from the IO-BOB to SC, improving the precipitation efficiency of water vapor. Understanding the synergistic effect of the PDO and IOD on water vapor transport will help to improve the accuracy of precipitation prediction, and reduce the negative impact of drought and flood disasters.
1. Introduction
Precipitation falling over a given area is an aggregation of water molecules over a period of time. Some water molecules may come from the vicinity, some water may be transported from farther sources [1]. There is rich precipitation in the PFS (April–June) over SC, and its variability is enhanced under the background of global warming, but the prediction for PFS precipitation is still a great difficulty for meteorologists [2]. Sufficient water vapor is a necessary condition for the PFS rain formation. The study on the water vapor source of PFS rain, the characteristics of water vapor transport and its formation mechanism, are helpful to deeply understand the occurrence law of drought and flood disasters over SC, thus providing a reference for government decision-making and precipitation prediction [3,4,5].
There are two common approaches for analyzing water vapor transport. The Lagrangian method is better than the Eulerian method because it can calculate the air trajectory, and clearly determine the source of water vapor transport [1,6,7,8].
Thus, based on the HYSPLIT model [9,10,11], the characteristics of water vapor transport in the PFS over SC can be obtained by statistical and quantitative analysis. The WP, SCS, IO, BOB and Eurasian landmass are the main water vapor sources for rain in SC [12,13].
Studies have also shown that [14,15], before and after the onset of SCSSM, the characteristics of water vapor transport for the PFS over SC are quite different. Before the onset of SCSSM, the WP is the largest source of water vapor contributing to the PFS precipitation, the IO is the largest source of water vapor after its onset. Previous studies have shown [16,17] that the water vapor transport in the PFS also has obvious interdecadal variation characteristics. A further study [18,19,20,21,22,23] shows that the interdecadal variation of water vapor transport in PFS is closely related to the PDO. By affecting low-level water vapor transport, the IOD has a greater contribution to the variation of precipitation in SC on both interdecadal and interannual scales [24,25,26,27,28,29,30,31].
Multi-factor synergy refers to the combined effect of two or more influencing factors, and the variability of precipitation in SC is the result of multi-factor synergy [32,33,34,35,36]. On the interdecadal scale, the summer precipitation in SC is affected by the tropical IO SST, spring snow cover over the Tibetan Plateau [37], summer intraseasonal oscillation in the Northern Hemisphere [38], and summer convective activity in the SCS [39], a synergistic effect of external forcing factors.
The results of these studies have contributed to a deeper understanding of the complexity of precipitation variability, and also showed that the SST anomaly of the IO and WP has an important impact on the water vapor transport for the PFS. There have been many valuable studies and meaningful results on the relationship between the PFS precipitation variability and SST anomaly of the WP and IO, respectively. On the interdecadal time scale, how does the interdecadal variability of the SST in WP and IO cooperatively affect the water vapor transport for PFS precipitation? In this study, the mechanism of the PDO and IOD synergistically affecting the variability of water vapor transport for the PFS in SC is discussed. Our findings will provide a theoretical basis for an in-depth understanding of the factors governing the PFS precipitation, provide additional information for analyzing drought and flood disasters.
2. Data and Methods
2.1. Data
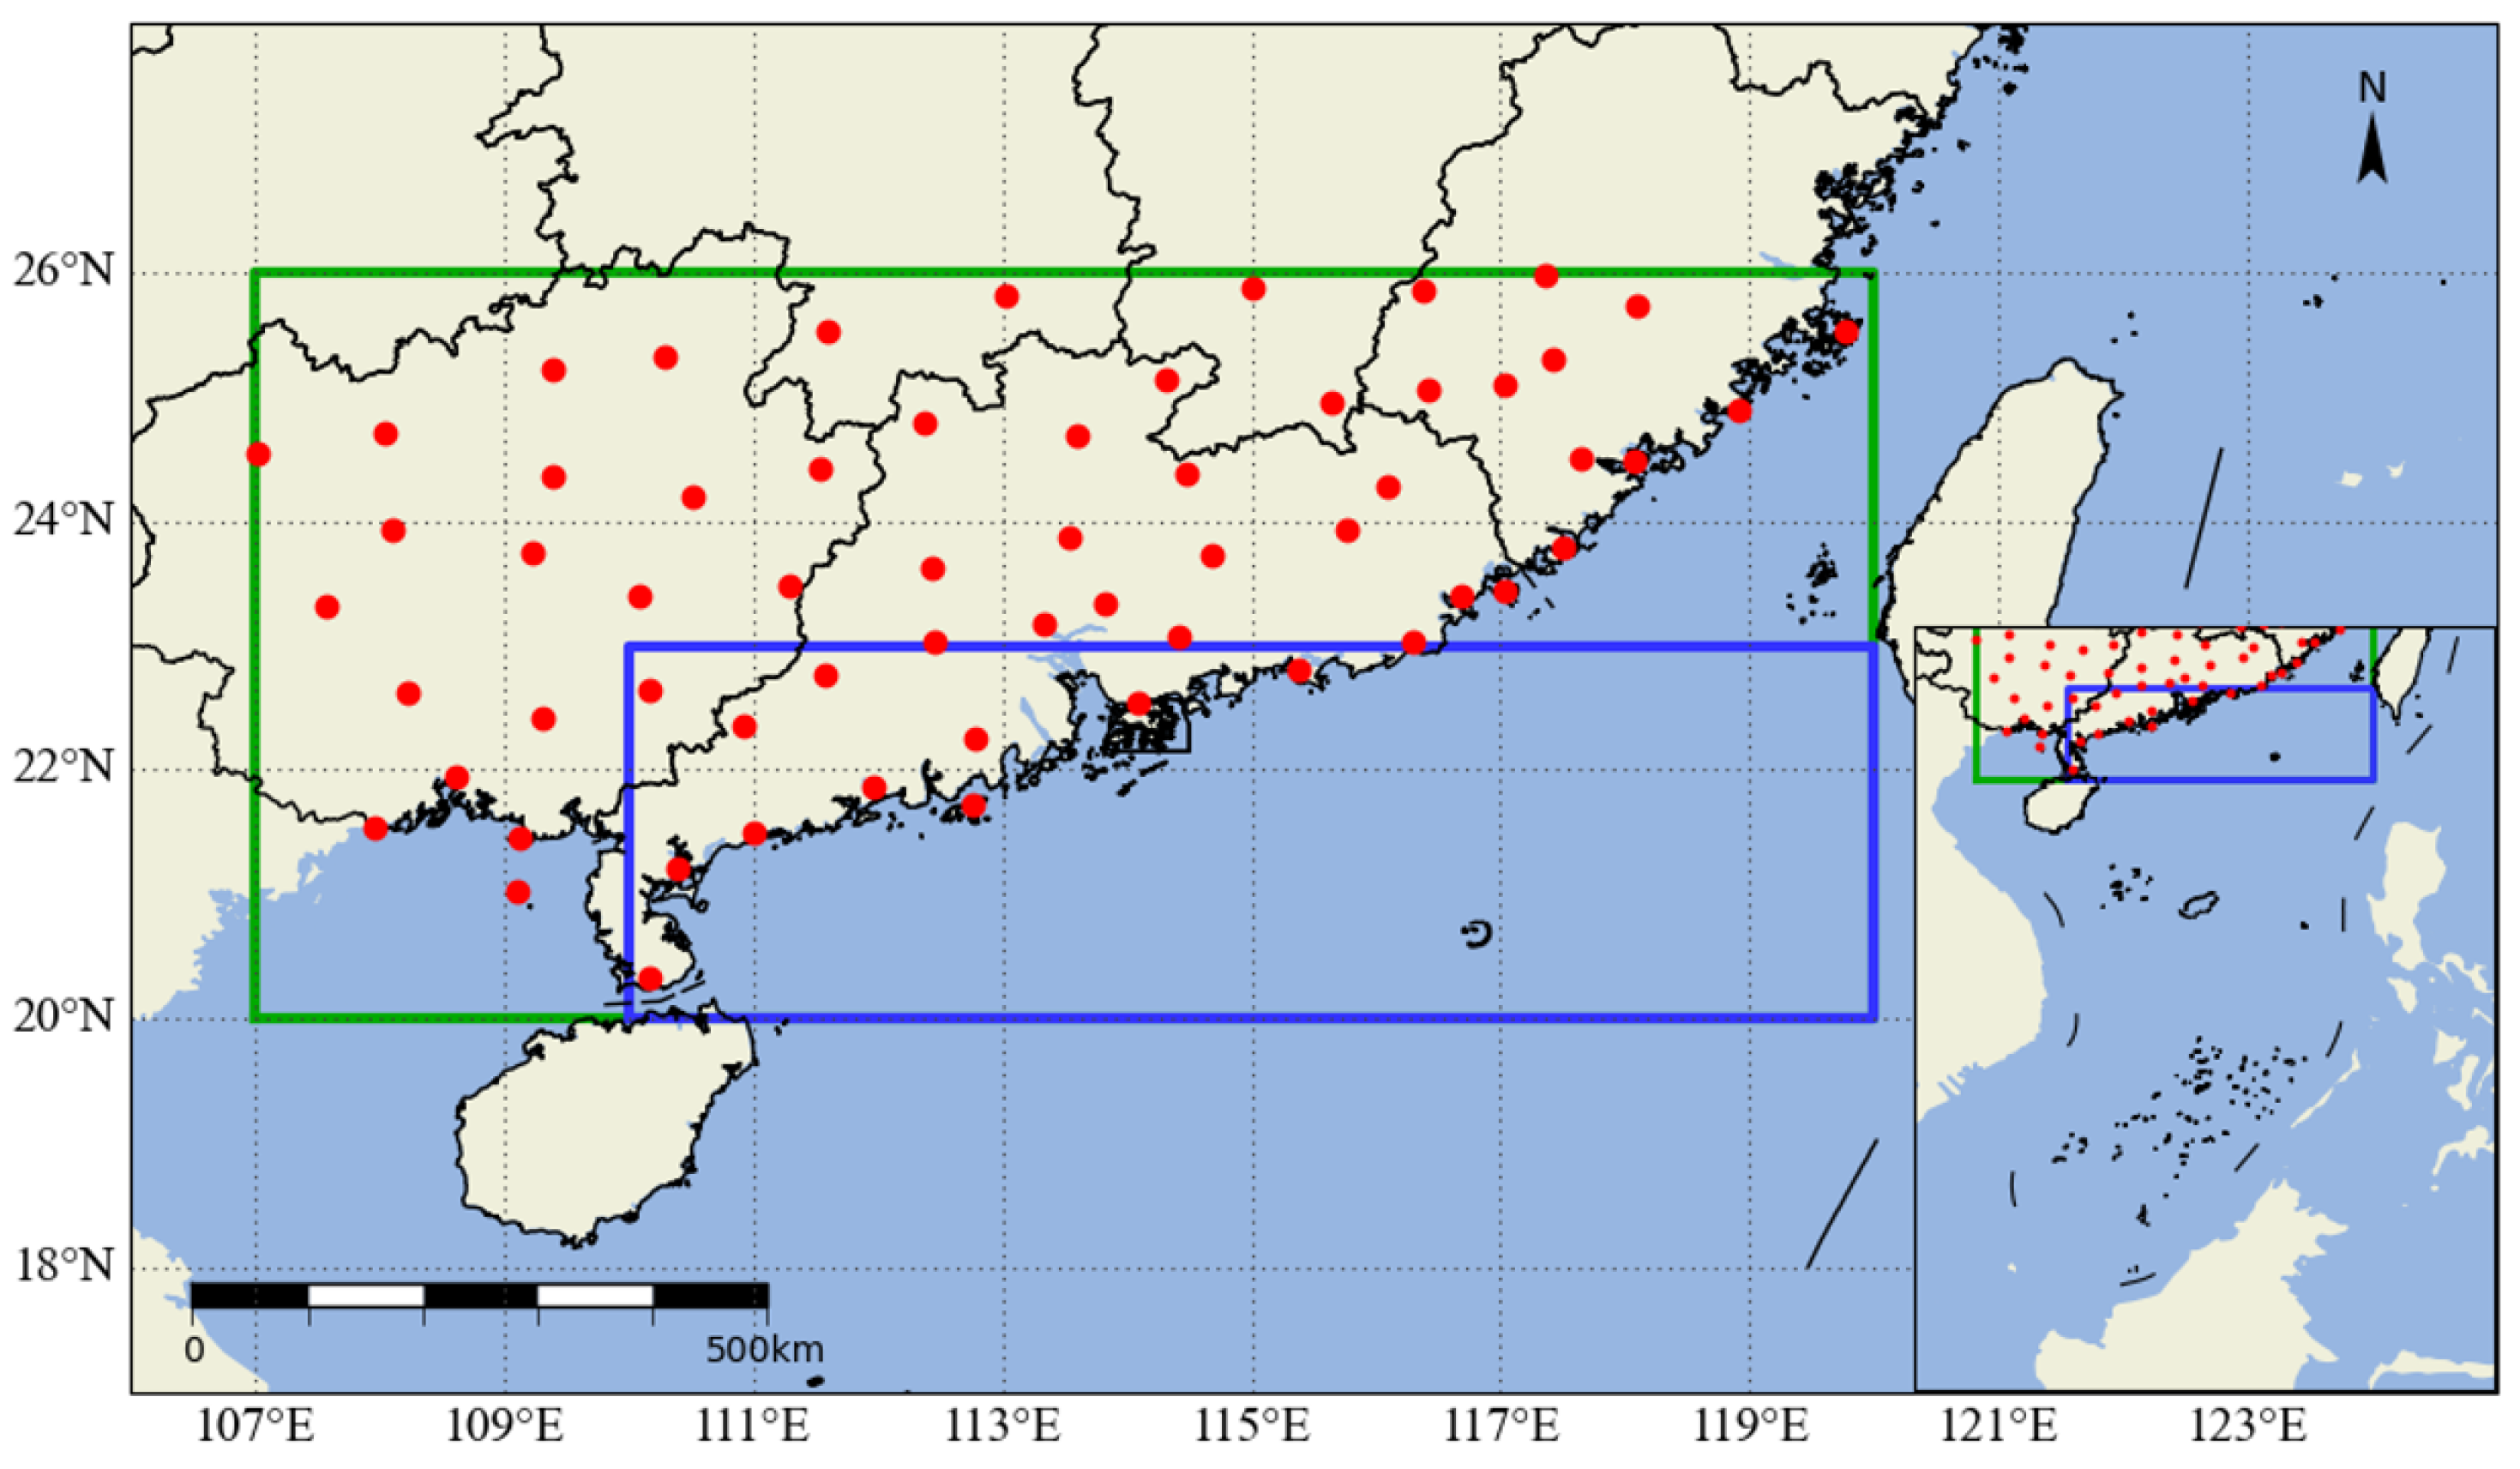
Our study is based on, daily precipitation data of 60 meteorology stations over SC (20°–26° N,107°–120° E; Figure 1) from 1960 to 2012 provided by CMA. The NCEP reanalysis data available every six hours (00, 06, 12 and 18 UTC), provided by NOAA covers the period from 1960 to 2012, with a resolution of 2.5°∗2.5°, including 17 layers of temperature, wind and relative humidity (1000~10 hPa). The definitions and data of PDO and IOD indicators are from the NOAA website (https://psl.noaa.gov/ accessed on 24 February 2022).
2.2. Methods
The Lagrangian particle dispersion model (HYSPLIT 4.9) developed by Draxler and Hess [9,10] is used to simulate the trajectories of air parcels formed during PFS rain events for the period of 1960–2012. The air parcels at three levels (1000 m, 1500 m, and 3000 m, most water vapor converge) over 60 meteorology stations are selected. The backward trajectory is calculated by taking 02UTC and 14UTC of every day as the starting time point, the position of the trajectory point is output every hour, and the air block specific humidity at the position is obtained by interpolation. Air parcels are traced 240 h into the past, which is the average lifespan of water vapor in the atmosphere [40], to analyze the water vapor sources for SC, 716,416 tracks are selected from 60 stations with rain recording periods. The water vapor trajectories are analyzed by clustering method, to identify the main water vapor channels [41].
2.3. Division of Frontal Precipitation and Monsoon Precipitation for PFS over SC
The atmospheric circulation in PFS over SC is significantly different before and after the establishment of the SCSSM, and the precipitation characteristics are also different [2,42]. It is necessary to determine the beginning date of summer monsoon precipitation in SC, and then divide the water vapor transport process into two stages: frontal precipitation and monsoon precipitation. Climatological mean, SCSSM advances to SC about one week after its onset, when monsoon precipitation begins. According to the definition of Zheng et al. [2], if the 100 hPa over the region (20°–23° N, 110°–120° E) changes from westerly to easterly and lasts for more than 5 days, the first day is the beginning day of monsoon precipitation. Based on the NCEP reanalysis data, the mean onset date of monsoon precipitation is May 16 from 1960 to 2012 over SC. In this study, the period from April 1 to May 15 is defined as the frontal precipitation, and the period from May 16 to June 30 is the monsoon precipitation.
3. Results
As previously mentioned, the PDO and IOD are interrelated and have a synergistic effect on precipitation [43,44]. It is necessary to discuss the role of the PDO in detail when paying attention to the impact of the IOD on the water vapor transport in the PFS over SC.
3.1. Cold and Warm Phase of PDO
The PDO index has obvious interdecadal variation characteristics. The monthly PDO index is 12-yr low-pass filtered by the CMA [45]. After filtering, the positive (negative) PDO index corresponds to the warm (cold) phase. The period of 1960–2012 can be divided into three phases: 1961–1976 (cold), 1977–1998 (warm), and 1999–2012 (cold). When the PDO is in a warm phase, SST in the northern, northeastern and southeastern parts of the North Pacific has a positive anomaly, while the central, western and southern parts have a negative SST anomaly; the PDO cold phase is on the contrary.
3.2. Phase Combinations of PDO and IOD
Using the COBE SST data of NOAA and referring to the definition of Saji et al. [46], the tropical western IO (50–70° E, 10° S–10° N) is called the western IOD region, and the tropical eastern IO (90–110° E, 10° S–0°N) is called the eastern IOD region. The Dipole Mode Index is the west region SST anomaly average minus the IOD East region SST anomaly average. The IOD positive (negative) phase events occur when the index is greater (less) than 0.5 standard deviations in autumn (from September to November). The classification results of phase combinations of PDO and IOD are obtained, as shown in Table 1.
3.3. Synergistic Effects of PDO and IOD on the Water Vapor Transport Process of Precipitation in PFS over SC
The synergistic effects of PDO and IOD on the water vapor transport process are introduced from three aspects: water vapor distribution, water vapor transport trajectory, and characteristics of atmospheric circulation.
3.3.1. Distribution of Water Vapor
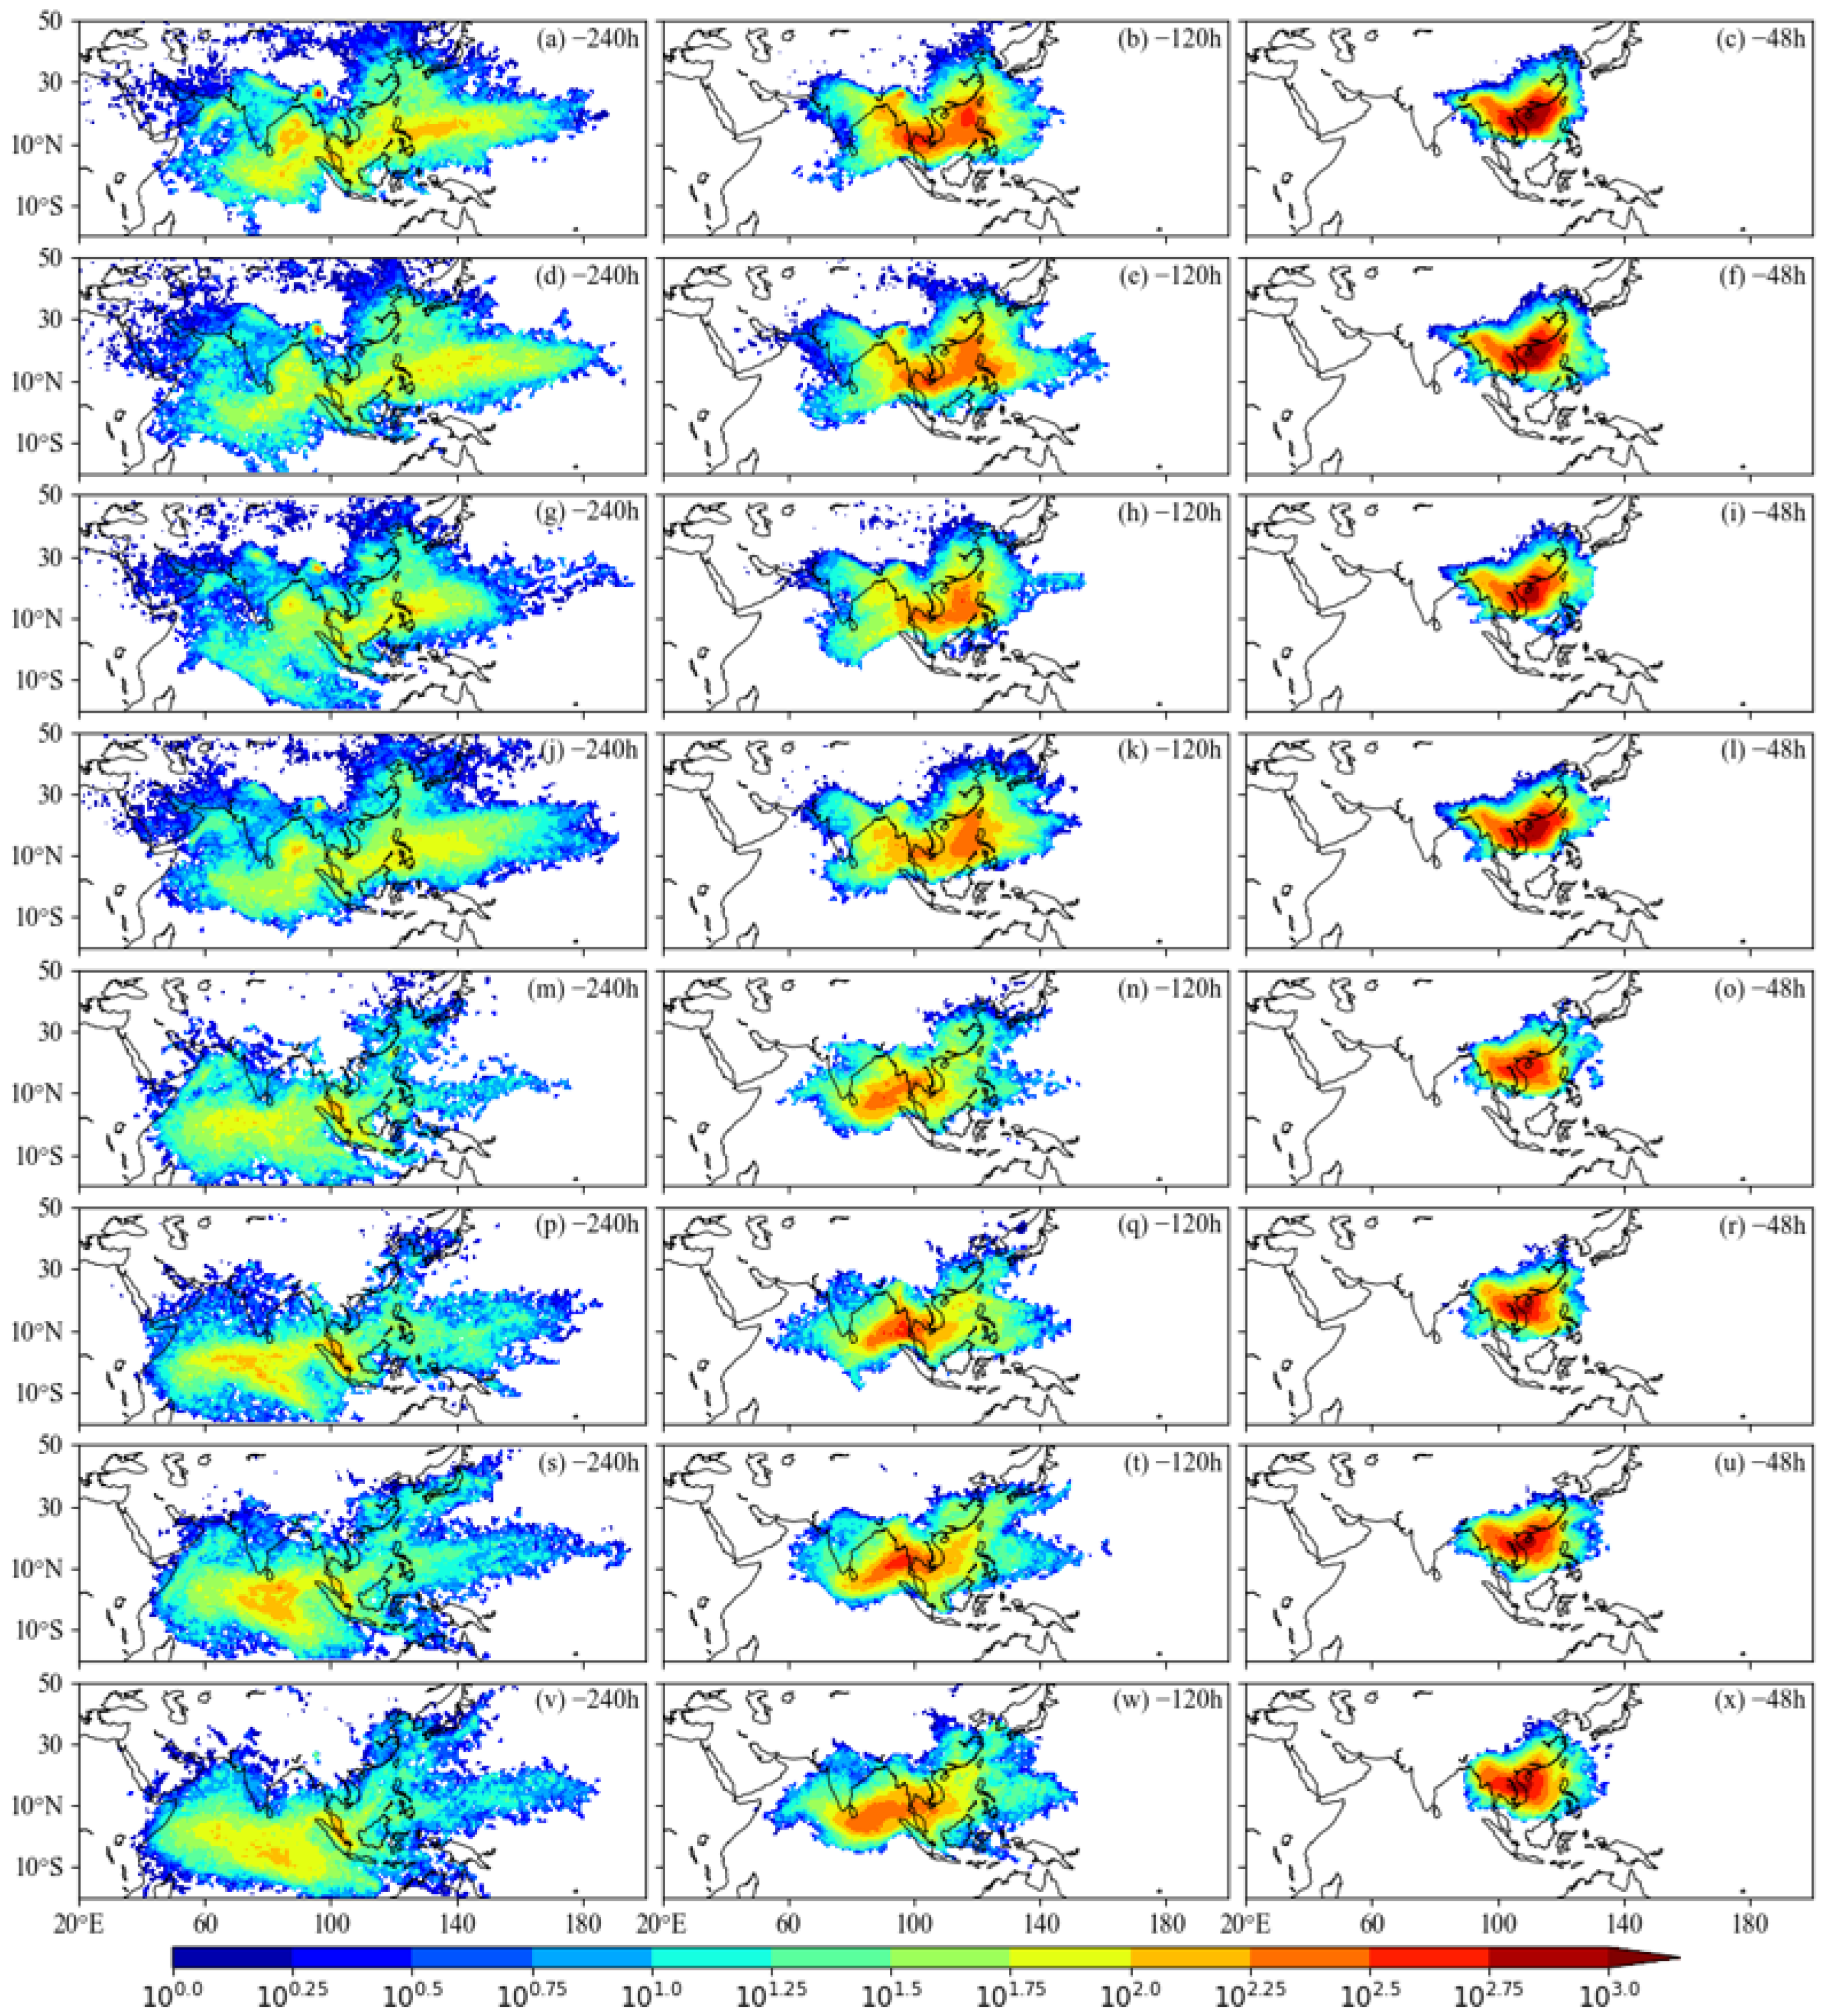
For frontal precipitation, the WP-SCS has rich water vapor from 10 days to 2 days before the water vapor arrives at SC. Water vapor over the WP-SCS-BOB is more for the PDO+ (Figure 2a–f) than that for PDO− (Figure 2m–r). Although the initial position of water vapor transport from the WP is more eastward during the IOD−, the water vapor is more abundant in the WP-SCS-BOB for IOD+ than that of IOD−, and water vapor of PDO+&IOD+ is the most abundant (Figure 2a). For monsoon precipitation, water vapor gathers in IO-BOB (Figure 2m–x), and water vapor maximum covers a larger area in the middle tropical IO for the PDO−&IOD+ (Figure 2s).
3.3.2. Water Vapor Transport Trajectories
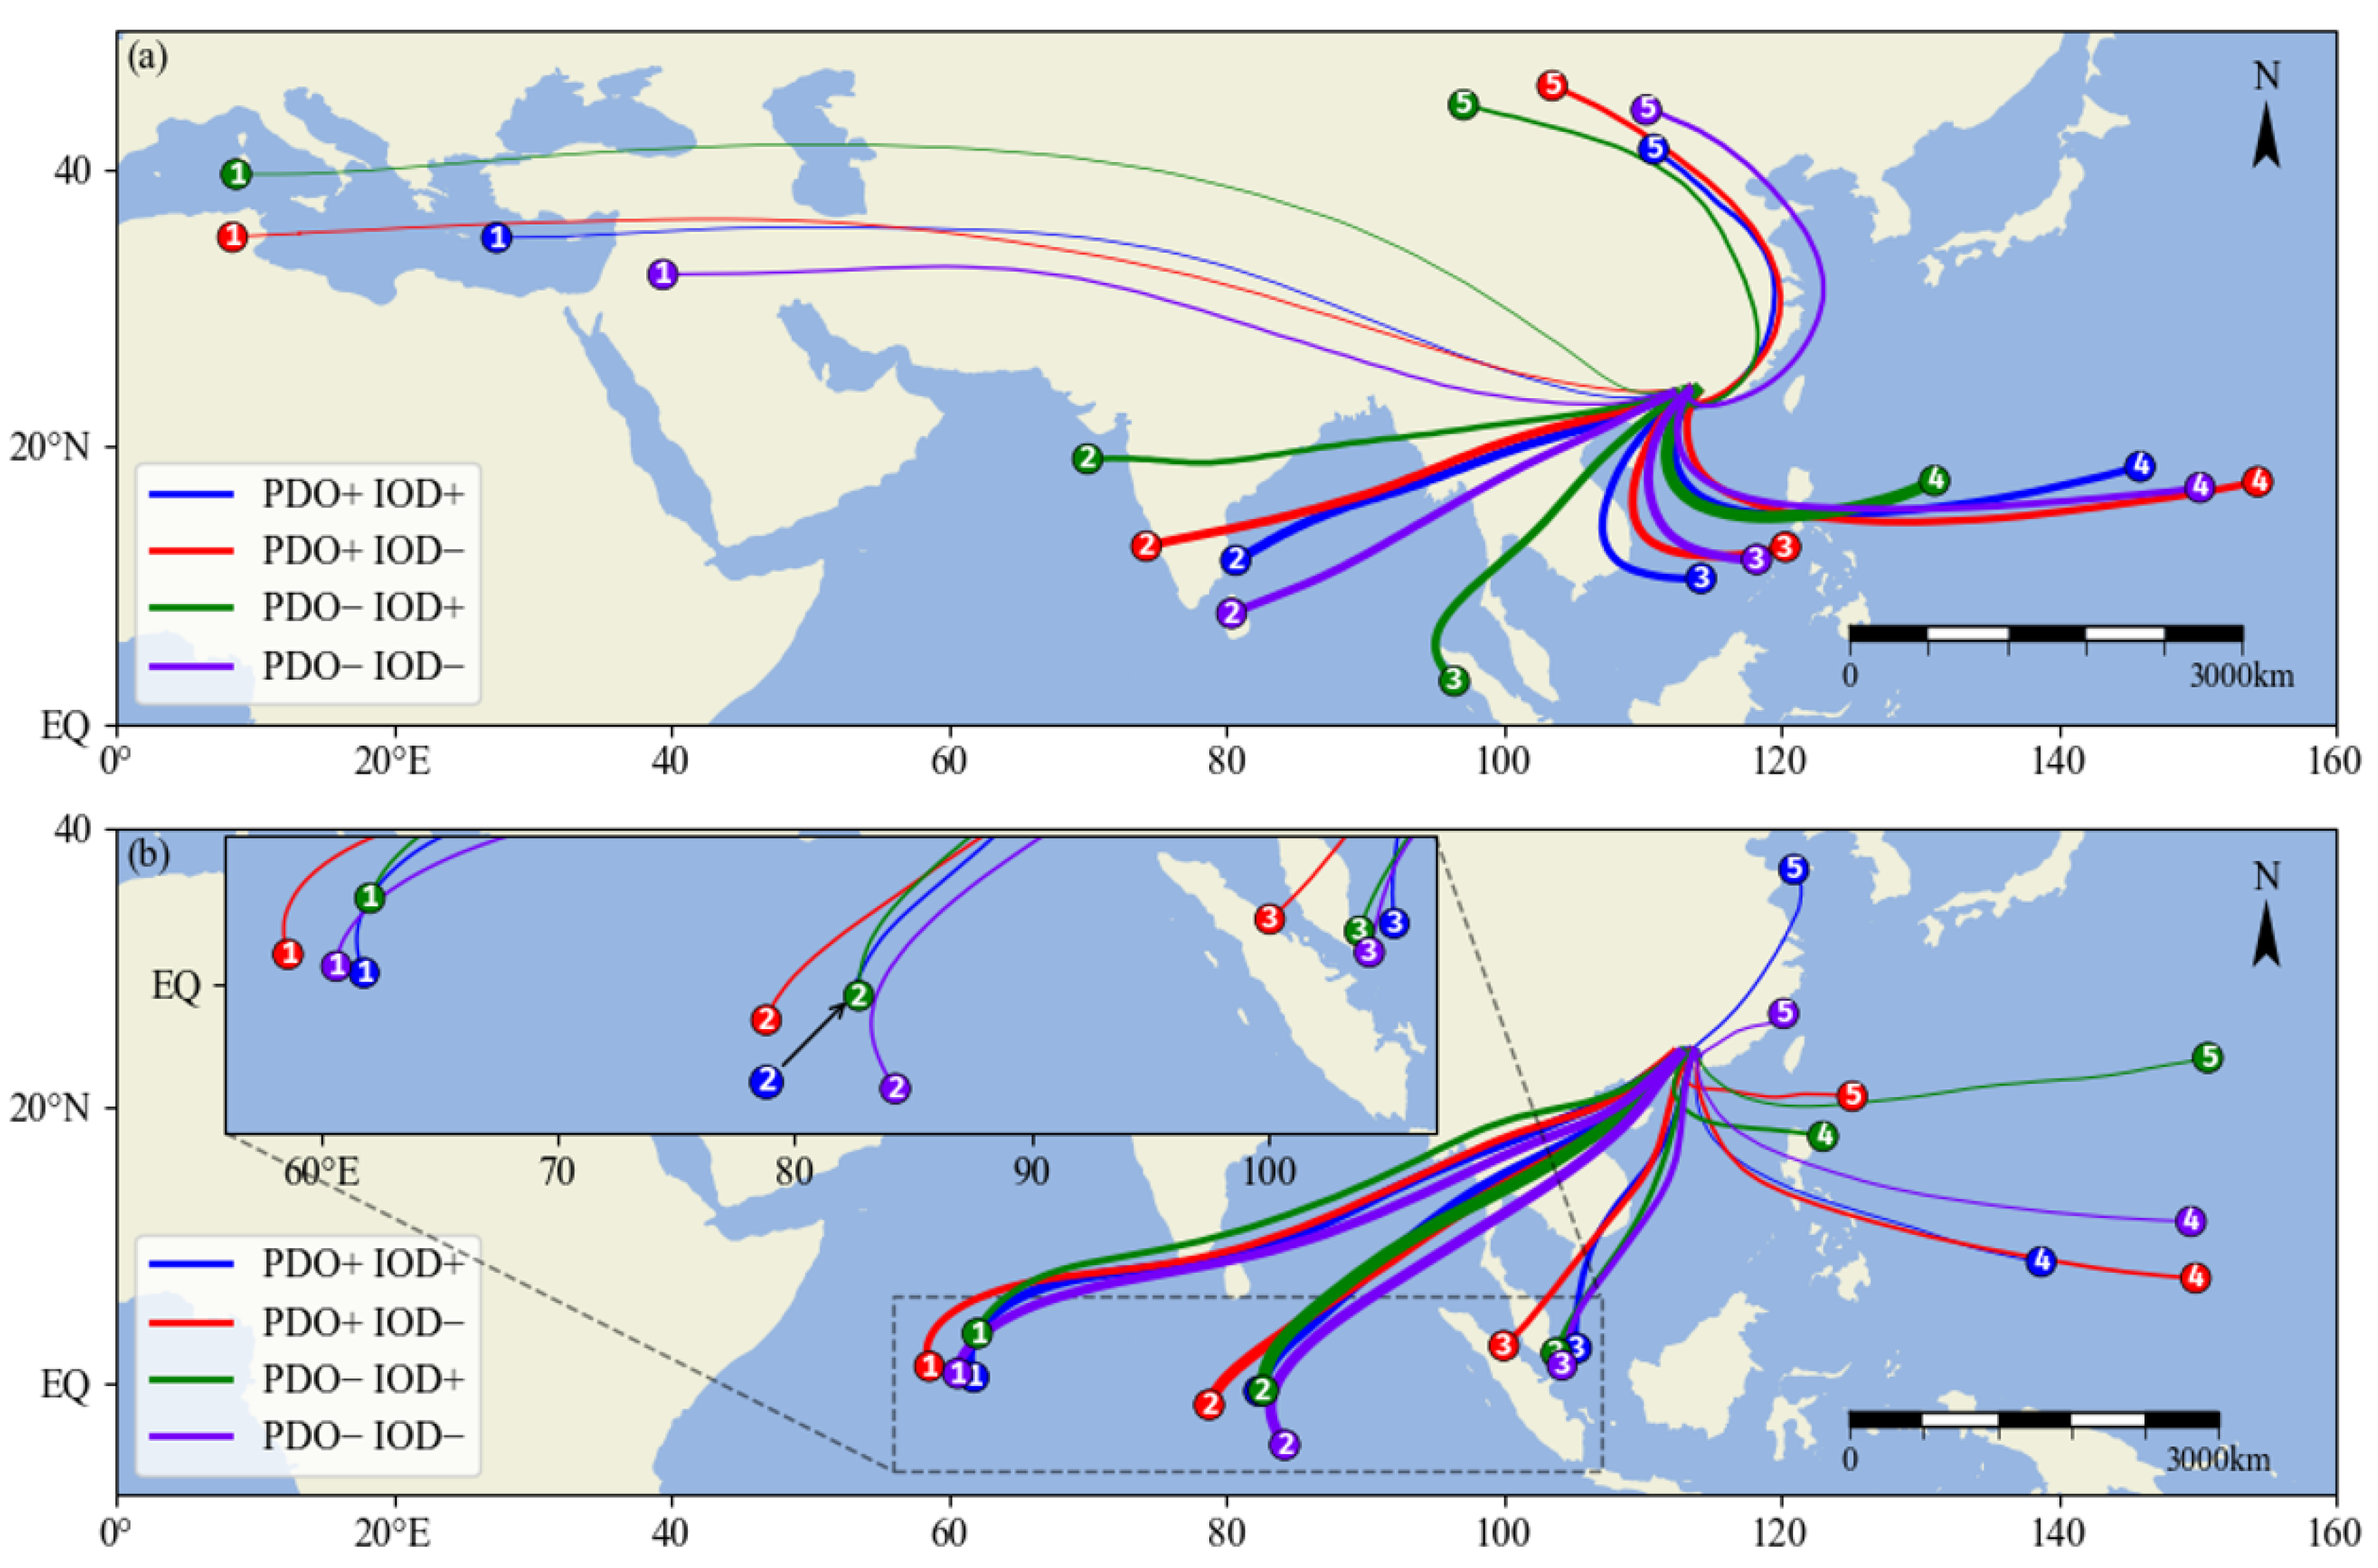
The main atmospheric water vapor source regions that involved the PFS rain events over SC are the Mediterranean-Eurasian interior, IO, BOB, SCS, WP, and East China (Figure 3), which is consistent with the previous results presented in the introduction. The differences between clustering water vapor transport tracks for four combinations of the IOD and the PDO phases are shown in Figure 3.
For the frontal precipitation, when the PDO and IOD are in phase resonance, most water vapor transport tracks from the WP-SCS (trajectories labeled 3 and 4 in Figure 3a) are shorter and westward, so more water vapor is transported to SC, the precipitation efficiency of water vapor is higher (Table 2). The track of the PDO+&IOD+ (blue track 3) is shorter and more westward than that of the PDO+&IOD− (red track 3), the track of PDO−&IOD− (purple track 3) is shorter than that of the PDO−&IOD+ (green track 3). For water vapor from the WP, the percentages of the PDO+&IOD+ (with 23.97% track number and 25.96% precipitation efficiency) are higher than that of the PDO+&IOD− (with 17.15% track number and 11.91% precipitation efficiency). The percentages of the PDO−&IOD− (with 21.35% track number and 22.67% precipitation efficiency) are higher than that of the PDO−&IOD+ (with 18.22% track number and 17.82% precipitation efficiency).
For the summer monsoon precipitation, the main water vapor transport tracks are the cross-equatorial flows in the IO, BOB and SCS (trajectories labeled 1, 2 and 3 in Figure 3b), the cluster tracks of four cases for the same region are similar, but the water vapor transport is quite different. The contribution rate of water vapor from the IO-BOB is higher for the IOD+ than that for the IOD−. For example, for water vapor from the IO, the percentages for the PDO+&IOD+ (with 32.00% track number and 36.02% precipitation efficiency) are higher than that of the PDO+&IOD− (with 9.58% track number and 5.71% precipitation efficiency). However, the contribution rate from the SCS is higher for the IOD− than for the IOD+. For example, the percentages for the PDO+&IOD− (with 36.12% track number and 43.30% precipitation efficiency) are higher than that of the PDO+&IOD+ (with 19.67% track number and 17.03% precipitation efficiency).
3.3.3. Characteristics of Atmospheric Circulation
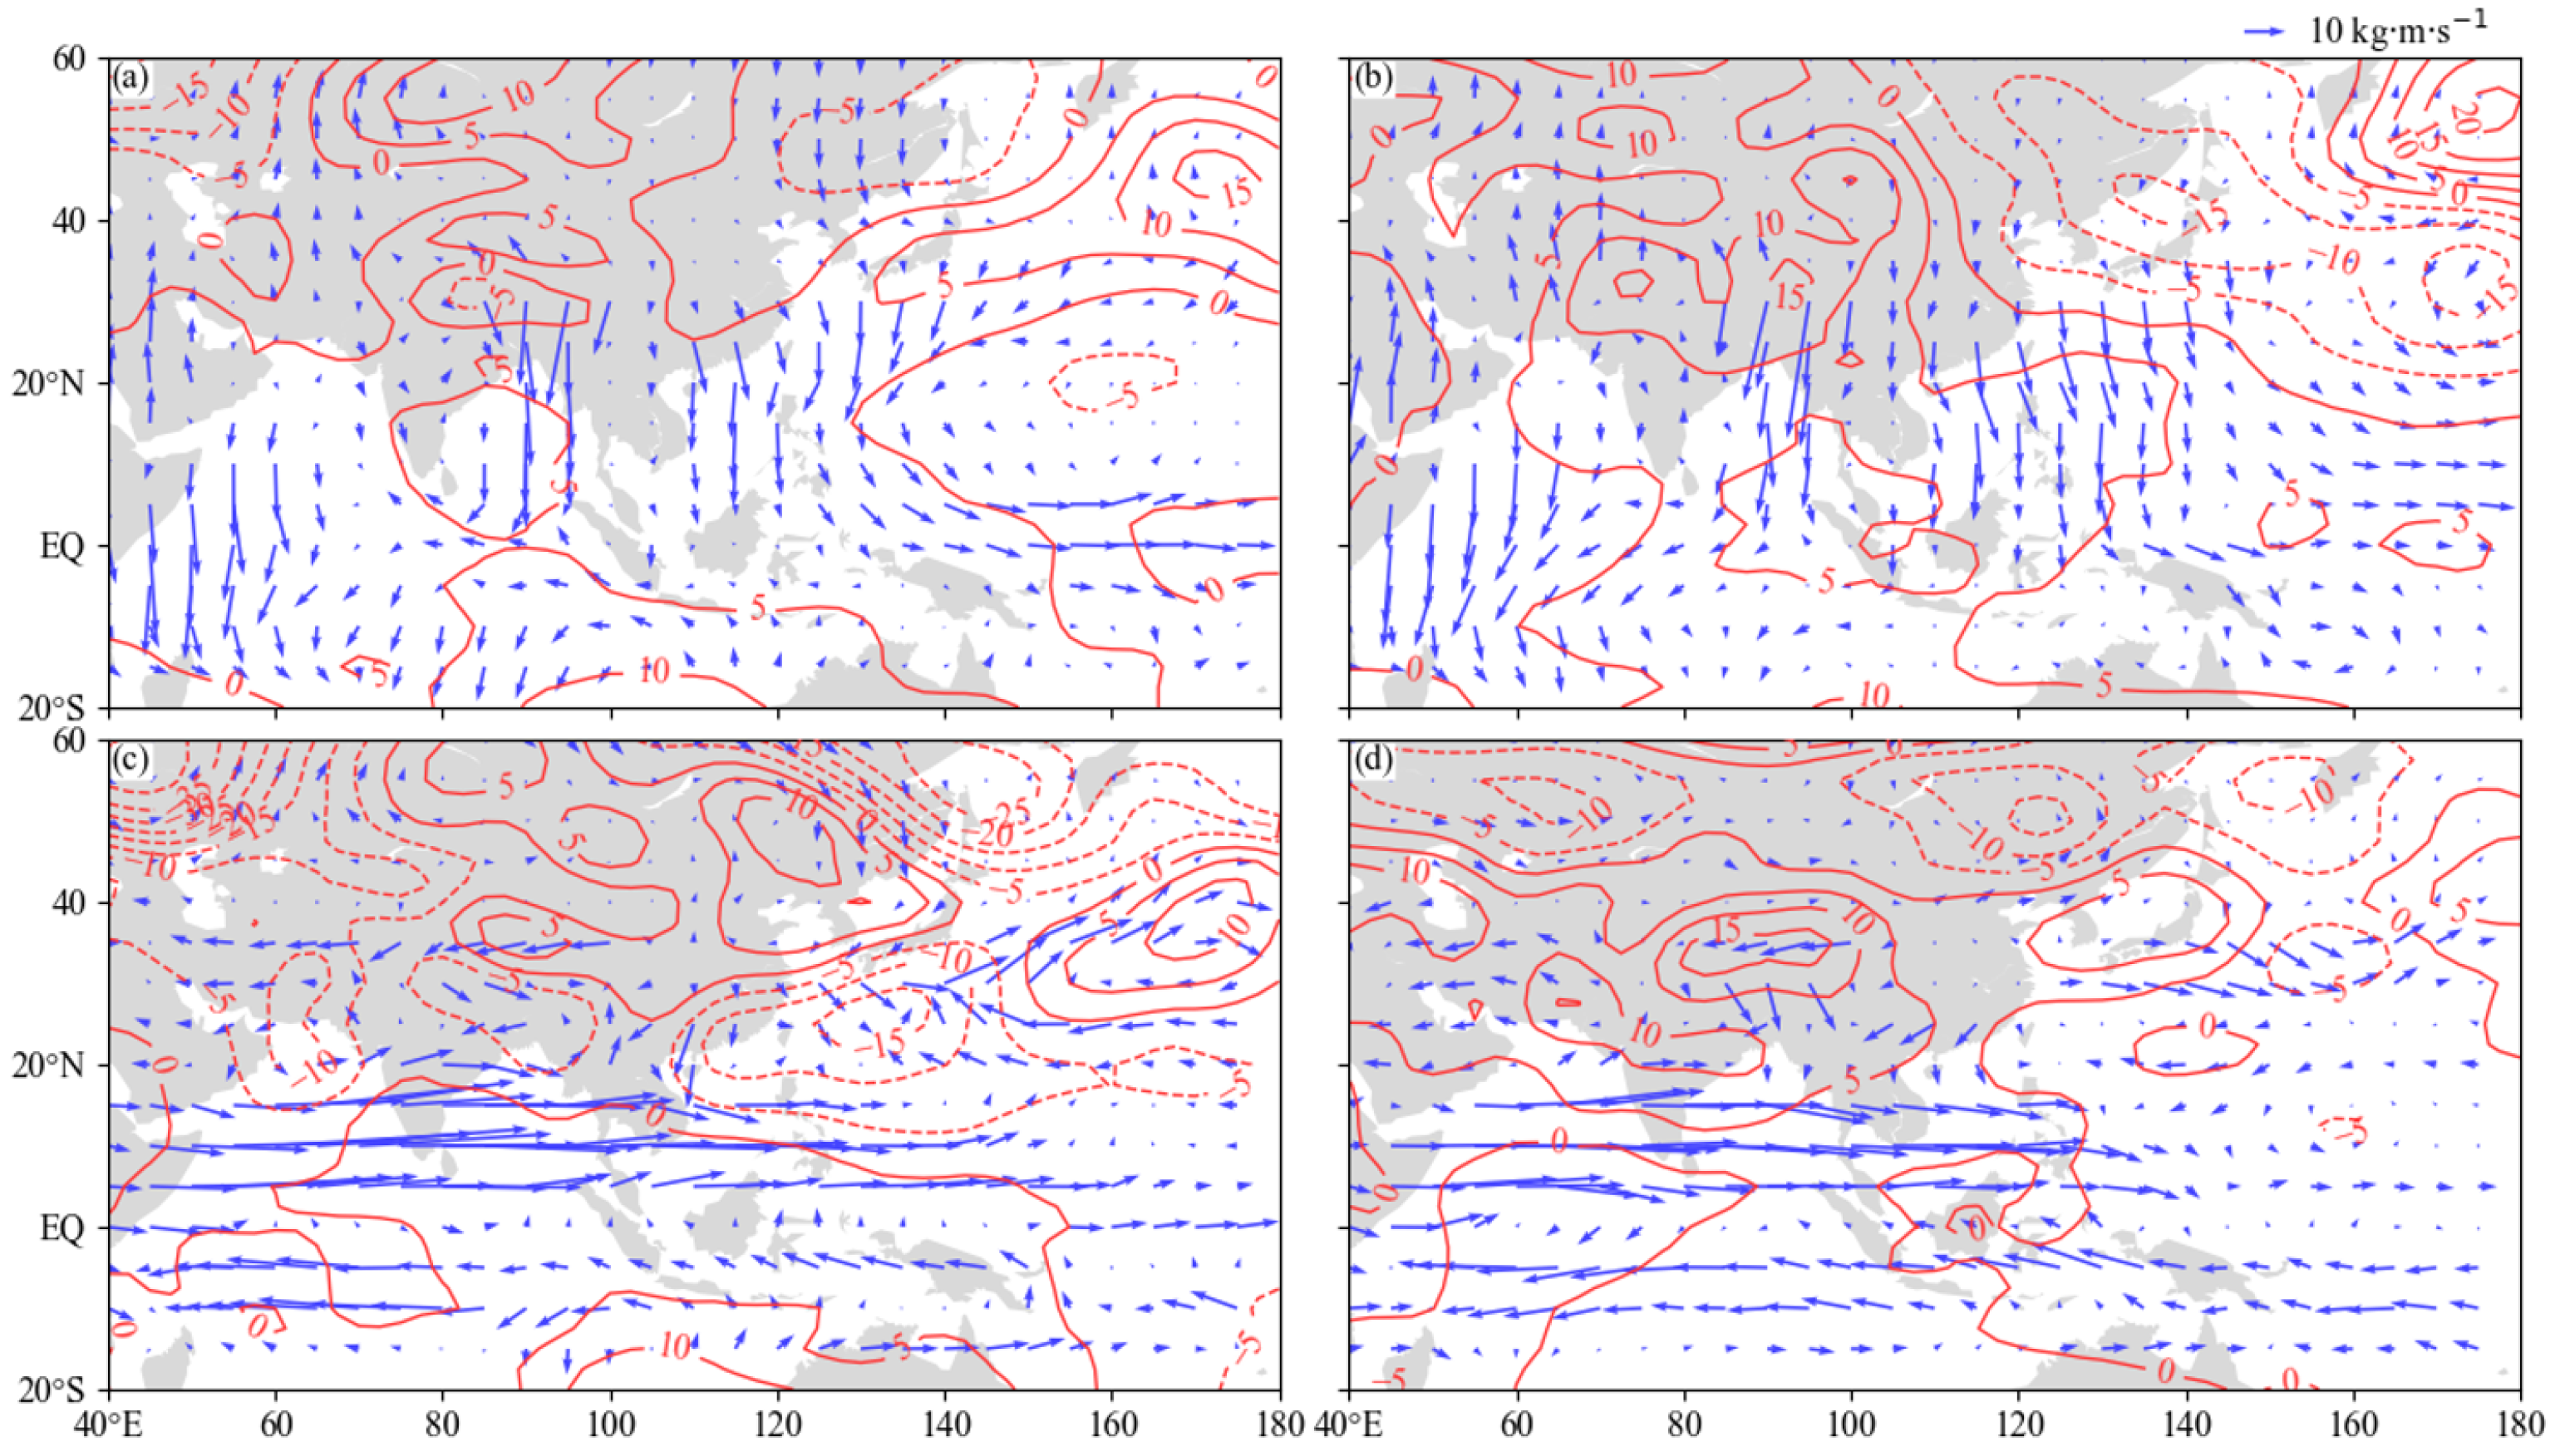
The differences of 850 hPa geopotential height and integrated water vapor flux for the PFS over SC between four PDO&IOD phase combinations are shown in Figure 4. For frontal precipitation (Figure 4a,b), the PDO+&IOD+ compares with the PDO+&IOD−, the western Pacific subtropical high is weaker (Figure 4a), there is a cyclonic anomaly in the WP, which causes a northerly anomaly near South China, and further shortens the length of water vapor transport track from the WP to SC. Similarly, for the PDO−& IOD+ minus PDO−&IOD− (Figure 4b), there is a stronger cyclonic anomaly in the WP, which makes a shorter water vapor transport track from the WP to SC. Compared with frontal precipitation, the strong westerly anomaly in the northern IO increases the water vapor transport from the north IO, BOB to SC during monsoon precipitation (Figure 4c,d). The PDO+&IOD+ compares with the PDO+&IOD−, there are strong westerly anomalies in the north IO and BOB (Figure 4c), which causes abundant water vapor to be transported eastward from the IO and BOB, and the Indian Low is stronger, which makes the path of water vapor transport to move northward, and more water vapor arrives at SC. Meanwhile, SC is located in the west of the cyclonic anomaly of WP, which increases the water vapor transported from the WP to SC. For the PDO−&IOD+ (Figure 4d), there is still a strong westerly anomaly in the IO and BOB, which enhances the water vapor eastward transport. However, the Indian Low is weaker, which makes less water vapor enter the SCS through BOB. At the same time, the cyclonic anomaly in the WP is weaker and more easterly, which makes less water vapor over the WP be transported to the SCS too, resulting in the lowest precipitation efficiency of water vapor from the SCS.
4. Conclusions and Discussion
Valuable research on the respective links between SST anomaly of IO, WP and water vapor has provided a framework within which to understand coupled air-sea processes and tropical circulations that produce PFS precipitation variability on different time scales. HYSPLIT 4.9 is used to simulate the trajectories of air parcels formed during PFS precipitation events, cluster analysis is conducted on the trajectories to identify the main water vapor channels. This study reveals some basic facts of the synergistic effect of the PDO and IOD on the water vapor transport process under the background of global warming, to improve the accuracy of precipitation prediction, reduce the negative impact of drought and flood disasters.
For frontal precipitation, the PDO+ compared with PDO−, there is more water vapor over the WP-SCS-BOB, regardless of the PDO phase, the IOD+ has more water vapor over this region than that of the IOD−. Water vapor for frontal precipitation mainly comes from the WP and SCS. When the PDO and IOD are in phase resonance, the water vapor transport tracks from the SCS, the WP is shorter and westward, so more water vapor is transported to SC, the precipitation efficiency of water vapor is higher too. It may be due to the western Pacific subtropical high being weaker, resulting in a northerly anomaly near SC, which shortens the length of the water vapor transport track from the WP to SC but is conducive to the formation of precipitation.
For the summer monsoon precipitation, the tropical IO-BOB is rich in water vapor, the water vapor maximum covers the largest area over the tropical IO for the PDO−& IOD+. The main water vapor transport tracks are the cross-equatorial flows in the IO, BOB and SCS. The precipitation efficiency of water vapor from the IO-BOB is higher for the IOD+ than that for the IOD−; however, the precipitation efficiency of water vapor from the SCS is higher for the IOD−than that for the IOD+. Compared with frontal precipitation, regardless of the phase of the PDO and IOD, the strong westerly anomaly in the northern IO increases the water vapor transport from the north IO, BOB to SC during monsoon precipitation. For the PDO−&IOD+, the Indian Low Pressure is weaker, which causes less water vapor to enter the SCS through the BOB. At the same time, the cyclonic anomaly in the WP is weaker and more easterly, which reduces the water vapor transport from the WP to the SCS, resulting in the lowest precipitation efficiency of water vapor from the SCS.
The results presented in this study are mainly on the interdecadal time scale. Nevertheless, the linkage between the SST anomaly of the Pacific, Indian Ocean and the water vapor transport over SC on an interannual time scale is also an interesting issue and deserves further study in the future.
Author Contributions
Conceptualization, L.F. and J.L.; methodology, G.Z.; software, G.Z.; validation, L.F., G.Z. and J.L.; formal analysis, L.F.; investigation, G.Z.; resources, J.L.; data curation, G.Z.; writing—original draft preparation, L.F. and J.L.; writing—review and editing, L.F.; visualization, G.Z.; supervision, G.Z.; project administration, L.F.; funding acquisition, L.F. All authors have read and agreed to the published version of the manuscript.
Funding
This research was funded by National Key Research and Development Program of China, grant number No. 2018YFC1506002, and by Innovative Experiment Project of Guangdong Ocean University, grant number No.CXXL2020048, No.201710566005, Undergraduate Innovation and Entrepreneurship Team Project of Guangdong Ocean University, grant number No.CCTD201805.
Institutional Review Board Statement
Not applicable.
Informed Consent Statement
Not applicable.
Data Availability Statement
Publicly available datasets are analyzed in this study. All data used in this paper are available in the relevant organizations described in the data section.
Acknowledgments
We would like to acknowledge all data used in this paper, which are available in the relevant organizations described in the data section.
Conflicts of Interest
The authors declare no conflict of interest.
Abbreviations
The preflood season (PFS); South China (SC); the Pacific Decadal Oscillation (PDO); the Indian Ocean Dipole Mode (IOD); the positive PDO phase (PDO+); the negative PDO phase (PDO-); the positive IOD phase (IOD+); the negative IOD phase (IOD-); the West Pacific (WP); the South China Sea (SCS); the Bay of Bengal (BOB); the Indian Ocean (IO); the South China Sea Summer Monsoon (SCSSM); China Meteorological Administration (CMA); National Centers for Environmental Prediction (NCEP); the National Oceanic and Atmospheric Administration (NOAA); the Hybrid Single Particle Lagrangian Integrated Trajectory (HYSPLIT); the sea surface temperature (SST).
References
- James, P.; Stohl, A.; Spichtinger, N.; Eckhardt, S.; Forster, C. Climatological aspects of the extreme European rainfall of August 2002 and a trajectory method for estimating the associated evaporative source regions. Nat. Hazards Earth Syst. Sci. 2004, 4, 733–746. [Google Scholar] [CrossRef] [Green Version]
- Zheng, B.; Liang, J.Y.; Lin, A.L.; Li, C.H.; Gu, D.J. Frontal Rain and Summer Monsoon Rain During Pre-rainy Season in South China. Part I: Determination of the Division Dates. Chin. J. Atmos. Sci. 2006, 30, 1207–1210. (In Chinese) [Google Scholar] [CrossRef]
- Perry, L.B.; Konrad, C.E.; Schmidlin, T.W. Antecedent upstream air trajectories associated with northwest flow snowfall in the southern Appalachians. Weather Forecast 2007, 22, 334–352. [Google Scholar] [CrossRef]
- Winschall, A.; Pfahl, S.; Sodemann, H.; Wernli, H. Comparison of Eulerian and Lagrangian moisture source diagnostics−the flood event in eastern Europe in May 2010. Atmos. Chem. Phys. 2014, 14, 29333–29373. [Google Scholar] [CrossRef] [Green Version]
- Liu, J.P.; Li, W.J.; Chen, L.J.; Zuo, J.Q.; Zhang, P.Q. Estimation of the Monthly Precipitation Predictability Limit in China Using the Nonlinear Local Lyapunov Exponent. J. Meteorol. Res. 2016, 30, 93–102. [Google Scholar] [CrossRef]
- Brubaker, K.L.; Dirmeyer, P.A.; Sudradjat, A.; Levy, B.S.; Bernal, F. A 36-yr climatological description of the evaporative sources of warm-season precipitation in the Mississippi River basin. J. Hydrometeorol. 2001, 2, 537. [Google Scholar] [CrossRef]
- Stohl, A.; James, P. A Lagrangian analysis of the atmospheric branch of the global water cycle. Part I: Method description, validation, and demonstration for the August 2002 flooding in central Europe. J. Hydrometeorol. 2004, 5, 656–678. [Google Scholar] [CrossRef]
- Drumond, A.; And, R.N.; Gimeno, L. On the contribution of the tropical western hemisphere warm pool source of moisture to the northern hemisphere precipitation through a Lagrangian approach. J. Geophys. Res. Atmos. 2011, 116, D00Q04. [Google Scholar] [CrossRef]
- Draxler, R.R.; Hess, G.D. Description of the HYSPLIT_4 Modeling System. NOAA Tech. Memo. ERL ARL 1997, 224, 1–25. [Google Scholar] [CrossRef] [Green Version]
- Draxler, R.R.; Hess, G.D. An overview of the HYSPLIT_4 modeling system of trajectories, dispersion, and deposition. Aust. Meteorol. Mag. 1998, 47, 295–308. [Google Scholar]
- Jackson, D.R.; Driscoll, S.J.; Highwood, E.J.; Harries, J.E.; Russell, J.M., III. Troposphere to stratosphere transport at low latitudes as studies using HALOE observations of water vapour 1992–1997. Q. J. R. Meteorol. Soc. 1998, 124, 169–192. [Google Scholar] [CrossRef]
- Sun, B.; Wang, H.J. Analysis of the major atmospheric moisture sources affecting three sub-regions of East China. Int. J. Climatol. 2015, 35, 2243–2257. [Google Scholar] [CrossRef]
- Zhou, L.; Cai, R.H.; Lan, M.C.; Yao, R.; Yang, Y.Y. Analysis on the characteristics of low frequency oscillation in precipitation in flood season in Hunan Province. J. Meteorol. Sci. 2019, 39, 644–653. (In Chinese) [Google Scholar] [CrossRef]
- Chen, L.X.; Zhang, B.; Zhang, Y. Progress in research on the East Asian monsoon. J. Appl. Meteorol. Sci. 2006, 17, 711–724. (In Chinese) [Google Scholar] [CrossRef]
- Chi, Y.Z.; He, J.H.; Wu, Z.W. Features Analysis of the Different Precipitation Periods in the Pre-flood Season in South China. J. Nanjing Inst. Meteorol. 2005, 28, 163–171. (In Chinese) [Google Scholar] [CrossRef]
- Li, X.F.; Tang, Z.F.; Yang, T.; Chi, Y.Z. Study on water vapor transport characteristics of low frequency precipitation in South China during pre-flood seasons. Meteorol. Disaster Reduct. Res. 2017, 40, 83–91. (In Chinese) [Google Scholar] [CrossRef]
- Zhao, H.; Zhang, R.H.; Wen, M. Severe rainfalls in south China during May 2013 and its relation to the onset of the south China sea summer monsoon. Acta Meteorol. Sin. 2015, 73, 442–458. [Google Scholar] [CrossRef]
- Mantua, N.J.; Hare, S.R.; Zhang, Y.; Wallace, J.M.; Francis, R.C. A pacific interdecadal climate oscillation with impacts on salmon production. Bull. Am. Meteorol. Soc. 1997, 78, 1069–1079. [Google Scholar] [CrossRef]
- Chu, Q.C.; Wang, Q.G.; Feng, G.L. The roles of moisture transports in intraseasonal precipitation during the preflood season over South China. Int. J. Climatol. 2019, 40, 2239–2252. [Google Scholar] [CrossRef]
- Chen, S.; Gao, J.Y.; Huang, L.N.; You, L.J. Decadal variation characteristics of South China pre-flood season persistent rainstorm and its mechanism. J. Appl. Meteorol. Sci. 2017, 28, 86–97. [Google Scholar] [CrossRef]
- Qian, C.; Zhou, T.J. Multidecadal variability of north China aridity and its relationship to PDO during 1900–2010. J. Clim. 2013, 27, 1210–1222. [Google Scholar] [CrossRef] [Green Version]
- Wu, X.F.; Mao, J.Y. Interdecadal variability of early summer monsoon rainfall over south China in association with the pacific decadal oscillation. Int. J. Climatol. 2017, 37, 706–721. [Google Scholar] [CrossRef]
- Newman, M.; Alexander, M.A.; Ault, T.R.; Cobb, K.M.; Deser, C.; Di Lorenzo, E.; Mantua, N.J.; Miller, A.J.; Minobe, S.; Nakamura, H. The pacific decadal oscillation, revisited. J. Clim. 2016, 29, 4399–4427. [Google Scholar] [CrossRef] [Green Version]
- Jia, X.J.; Zhang, C.; Wu, R.G.; Qian, Q.F. Changes in the relationship between spring precipitation in southern China and tropical Pacific-South Indian Ocean SST. J. Clim. 2021, 34, 1–37. [Google Scholar] [CrossRef]
- Swapna, P.; Krishnan, R.; Wallace, J.M. Indian ocean and monsoon coupled interactions in a warming environment. Clim. Dyn. Obs. Theor. Comput. Res. Clim. Syst. 2014, 42, 2439–2454. [Google Scholar] [CrossRef]
- Cao, J.; Yao, P.; Wang, L.; Liu, K. Summer rainfall variability in low-latitude highlands of China and subtropical Indian Ocean Dipole. J. Clim. 2014, 27, 880–892. [Google Scholar] [CrossRef]
- Zhao, S.S.; Zhou, T.J.; Yang, X.Q.; Zhu, Y.M.; Tan, Y.K.; Sun, X.G. Interdecadal change of the relationship between the tropical Indian Ocean Dipole mode and the summer climate anomaly in China. J. Meteorol. Res. 2011, 25, 129–141. [Google Scholar] [CrossRef]
- Tang, W.Y.; Sun, Z.B.; Tan, G.R. Effect of Indian Ocean Dipole on rainfall anomaly in South of China. J. Nanjing Inst. Meteorol. 2008, 31, 836–843. [Google Scholar] [CrossRef]
- Krishnan, R.; Ramesh, K.V.; Samala, B.K.; Meyers, G.; Slingo, J.M.; Fennessy, M.J. Indian Ocean-monsoon coupled interactions and impending monsoon droughts. Geophys. Res. Lett. 2006, 33, 153–172. [Google Scholar] [CrossRef]
- Zhang, H.Y.; Wen, Z.P.; Wu, R.G.; Chen, Z.S. Inter-decadal changes in the East Asian summer monsoon and associations with sea surface temperature anomaly in the South Indian Ocean. Clim. Dyn. 2016, 48, 1–15. [Google Scholar] [CrossRef]
- Meehl, G.A.; Arblaster, J.M. Decadal variability of Asian-Australian monsoon-ENSO-TBO relationships. J. Clim. 2010, 24, 4925–4940. [Google Scholar] [CrossRef]
- Wu, J.F.; Tan, X.Z.; Chen, X.H.; Lin, K.R. Dynamic changes of the dryness/wetness characteristics in the largest river basin of South China and their possible climate driving factors. Atmos. Res. 2020, 232, 104685. [Google Scholar] [CrossRef]
- Li, W.J.; Zhang, R.N.; Sun, C.H.; Ren, H.L.; Liu, J.P.; Zuo, J.Q.; Li, X. Recent research advances on the interannual-interdecadal variations of drought/flood in South China and associated causes. J. Appl. Meteorol. Sci. 2016, 27, 577–591. [Google Scholar] [CrossRef]
- Li, Y.; Yuan, W.J.; Xu, Q.Q.; Hu, R.J.; Li, J.L.; Mei, X.Y.; Li, X.L. Water vapor transportation characteristics in Pre-rainy season precipitation anomaly of South China. Plateau Meteorol. 2017, 36, 501–509. [Google Scholar] [CrossRef]
- Li, W.J.; Liu, J.P.; Ren, H.L.; Zuo, J.Q. Characteristics and corresponding mechanisms of the leading modes of interdecadal variability of summer rainfall in southern China. Chin. J. Atmos. Sci. (Chin.) 2018, 42, 859–876. [Google Scholar] [CrossRef]
- Fan, L.L.; Zhang, G.Y.; Xu, J.J. Differentiated Effects of Urbanization on Precipitation in South China. Water 2021, 13, 1386. [Google Scholar] [CrossRef]
- Wu, R.G.; Wen, Z.P.; Song, Y.; Li, Y.Q. An Interdecadal change in Southern China summer rainfall around 1992/93. J. Clim. 2010, 23, 2389–2403. [Google Scholar] [CrossRef]
- Wang, L.; Chen, W.; Zhou, W.; Huang, G. Understanding and detecting super-extreme droughts in Southwest China through an integrated approach and index. Q. J. R. Meteorol. Soc. 2015, 142, 529–535. [Google Scholar] [CrossRef]
- Kajikawa, Y.; Yasunari, T.; Wang, B. Decadal change in intraseasonal variability over the South China Sea. Geophys. Res. Lett. 2009, 36, L06810. [Google Scholar] [CrossRef] [Green Version]
- Trenberth, K.E. Atmospheric moisture recycling: Role of advection and local evaporation. J. Clim. 1999, 12, 1368–1381. [Google Scholar] [CrossRef]
- Jiang, Z.H.; Ren, W.; Liu, Z.Y.; Yang, H. Analysis of water vapor transport characteristics during the Meiyu over the Yangtze-Huaihe River valley using the Lagrangian method. Acta Meteorol. Sin. 2013, 71, 295–304. (In Chinese) [Google Scholar] [CrossRef]
- Jian, M.Q.; Qiao, Y.T.; Luo, H.B. The abrupt change of the circulation in Low-Latitudes during the period from April to June. Clim. Environ. Res. 2000, 5, 356–362. (In Chinese) [Google Scholar] [CrossRef]
- Duan, W.S.; Song, L.Y.; Li, Y.; Mao, J.Y. Modulation of PDO on the predictability of the interannual variability of early summer rainfall over south China. J. Geophys. Res. Atmos. 2013, 118, 13008–13021. [Google Scholar] [CrossRef]
- Sun, Z.B.; Xu, Q.Z.; Ni, D.H. Interdecadal variation of spring precipitation in South China and its relationships with atmospheric circulation and SST. Trans. Atmos. Sci. 2017, 40, 433–442. (In Chinese) [Google Scholar] [CrossRef]
- China Meteorological Administration. Available online: http://cmdp.ncc-cma.net/pred/cn_enso.php?product=cn_enso_pdo (accessed on 21 February 2022).
- Saji, N.H.; Goswami, B.N.; Vinayachandran, P.N.; Yamagata, T. A dipole mode in the tropical Indian ocean. Nature 1999, 401, 360–363. [Google Scholar] [CrossRef]
Figure 1.
Schematic diagram of the South China (the green box represents the area where the precipitation is studied, the blue box is the judgment area of South China Sea summer monsoon onset, and the red spot is the meteorology stations).
Figure 1.
Schematic diagram of the South China (the green box represents the area where the precipitation is studied, the blue box is the judgment area of South China Sea summer monsoon onset, and the red spot is the meteorology stations).

Figure 2.
Distribution of cumulative specific humidity of each 1° × 1°grid on the water vapor transport trajectories in the preflood season (1960–2012) 10 days, 5 days, 2 days before the water vapor reaches South China.((a–l) for the frontal precipitation, (m–x) for the monsoon precipitation; (a–f,m–r) for PDO positive phase, (g–l,s–x) for PDO negative phase; (a–c,g–i,m–o,s–u) for IOD positive phase, (d–f,j–l,p–r,v–x) for IOD negative phase, unit: g/kg/grid).

Figure 3.
Clustering path of water vapor transport trajectories of precipitation for positive/negative phase of IOD in the preflood season over SC with the synergy of PDO (1960–2012) ((a) the frontal precipitation, (b) the monsoon precipitation, blue line: clustering trajectories for PDO positive phase and IOD positive phase, red line: clustering trajectories for PDO positive phase and IOD negative phase, green line: clustering trajectories for PDO negative phase and IOD positive phase, purple line: clustering trajectories for PDO negative phase and IOD positive phase, the number at the start of the trace is the trace number).

Figure 4.
Difference of 850 hPa geopotential height field (red contours, unit: gpm), integrated water vapor flux (blue vector, unit: kg·m·s−1) between four PDO&IOD phase combinations in the preflood season over South China during 1960–2012 ((a,b) for the frontal precipitation, (c,d) for the monsoon precipitation; (a,c) for PDO positive phase &IOD positive phase minus PDO positive phase &IOD negative phase, (b,d) for PDO negative phase &IOD positive phase minus PDO negative phase &IOD negative phase).


Table 1.
Phase combinations of PDO and IOD.
| PDO Positive Phase | PDO Positive Phase | |
|---|---|---|
| IOD positive phase | 1977, 1982, 1987, 1994, 1997 | 1963, 1972, 2006, 2007, 2011, 2012 |
| IOD negative phase | 1989, 1992, 1995, 1996, 1998 | 1964, 1971, 1974, 1975, 1999, 2010 |
The Pacific Decadal Oscillation (PDO); the Indian Ocean Dipole Mode (IOD).
Table 2.
Percentage of track number for clustering path in the total number of water vapor transport tracks and effective precipitation track number for clustering path in its total track number in the preflood season over SC for phase combinations of IOD and PDO (1960–2012) (unit: %).
Table 2.
Percentage of track number for clustering path in the total number of water vapor transport tracks and effective precipitation track number for clustering path in its total track number in the preflood season over SC for phase combinations of IOD and PDO (1960–2012) (unit: %).
| PDO Positive Phase | PDO Negative Phase | |||||||||||
|---|---|---|---|---|---|---|---|---|---|---|---|---|
| Track Number | 1 | 2 | 3 | 4 | 5 | 1 | 2 | 3 | 4 | 5 | ||
| Frontal precipitation | IOD+ | Track amount | 23.99 | 15.98 | 30.52 | 23.97 | 5.54 | 4.94 | 12.36 | 26.11 | 18.22 | 38.37 |
| precipitation | 23.77 | 12.90 | 33.48 | 25.96 | 3.9 | 2.51 | 8.75 | 30.07 | 17.82 | 40.86 | ||
| IOD− | Track amount | 26.23 | 27.9 | 6.08 | 17.15 | 22.63 | 15.1 | 28.49 | 26.28 | 21.35 | 8.78 | |
| precipitation | 28.91 | 29.63 | 2.91 | 11.91 | 26.65 | 12.08 | 28.52 | 29.37 | 22.67 | 7.36 | ||
| Monsoon precipitation | IOD+ | Track amount | 32.00 | 33.64 | 19.67 | 6.30 | 8.39 | 20.74 | 17.25 | 7.39 | 13.06 | 41.56 |
| precipitation | 36.02 | 35.71 | 17.03 | 5.57 | 5.68 | 25.64 | 15.96 | 4.26 | 9.52 | 44.62 | ||
| IOD− | Track amount | 9.58 | 11.88 | 36.12 | 22.97 | 19.45 | 8.26 | 7.74 | 19.94 | 34.16 | 29.91 | |
| precipitation | 5.71 | 8.37 | 43.30 | 25.56 | 17.06 | 6.1 | 6.55 | 19.26 | 35.05 | 33.04 | ||
The Pacific Decadal Oscillation (PDO); the Indian Ocean Dipole Mode (IOD); the positive IOD phase (IOD+); the negative IOD phase (IOD−).
Publisher’s Note: MDPI stays neutral with regard to jurisdictional claims in published maps and institutional affiliations. |
© 2022 by the authors. Licensee MDPI, Basel, Switzerland. This article is an open access article distributed under the terms and conditions of the Creative Commons Attribution (CC BY) license (https://creativecommons.org/licenses/by/4.0/).
Share and Cite
MDPI and ACS Style
Li, J.; Fan, L.; Zhang, G. Synergistic Effects of PDO and IOD on Water Vapor Transport in the Preflood Season over South China. Water 2022, 14, 722. https://doi.org/10.3390/w14050722
AMA Style
Li J, Fan L, Zhang G. Synergistic Effects of PDO and IOD on Water Vapor Transport in the Preflood Season over South China. Water. 2022; 14(5):722. https://doi.org/10.3390/w14050722
Chicago/Turabian StyleLi, Junjie, Lingli Fan, and Guangya Zhang. 2022. "Synergistic Effects of PDO and IOD on Water Vapor Transport in the Preflood Season over South China" Water 14, no. 5: 722. https://doi.org/10.3390/w14050722
Note that from the first issue of 2016, this journal uses article numbers instead of page numbers. See further details here.