Article

The Nutrient and Heavy Metal Contents in Water of Tidal Creek of the Yellow River Delta, China: Spatial Variations, Pollution Statuses, and Ecological Risks

1
The Institute of Ecology, Chinese Research Academy of Environmental Sciences, Beijing 100012, China
2
State Key Laboratory of Environmental Criteria and Risk Assessment, Beijing 100012, China
3
Shandong Yellow River Delta National Nature Reserve Administration Bureau, Dongying 257091, China
*
Author to whom correspondence should be addressed.
Water 2022, 14(5), 713; https://doi.org/10.3390/w14050713
Submission received: 18 January 2022 / Revised: 17 February 2022 / Accepted: 21 February 2022 / Published: 24 February 2022

Abstract

:
In order to understand the spatial distribution, ecological risks, and pollution status of nutrients and heavy metals in the coastal tidal creek water of the Yellow River Delta (YRD), a total of 21 water samples were collected from 7 sample sites. The results indicated that along the coastline from northwest to southeast in the YRD, the concentrations of TN, TP, and NH4+-N in the water decreased and then increased; the Cu concentration increased, decreased, and then increased; and the Pb concentration decreased. The average TN/TP mass ratio indicated that the tidal creek water belonged to a potential phosphorus-restricted eutrophication state. The RI result indicated that Cu and Pb in the water were at low ecological risk, while the SSD and RQ results indicated that Cu in the water was at a high ecological risk level and had potential harm to aquatic organisms. Based on the single-factor method, the water quality of the tidal creek inside and outside the Yellow River Delta Nature Reserve belonged to Grade IV. Cu should be controlled to improve the water quality and reduce the ecological risk, especially in the Yellow River Delta Nature Reserve.

1. Introduction

Coastal tidal flats are in the important transitional regions between land and sea, with special climatic, hydrological, soil, and biological characteristics. Coastal tidal flats, influenced by both sea and land, are very fragile ecosystems [1,2]. Coastal tidal flats in the Yellow River Delta (YRD) are not only important parts of natural wetland in the YRD, but also important parts of coastal wetlands around the Bohai Sea [3]. Coastal tidal flats in the YRD provide an important transfer station and wintering habitat for bird migration in Northeast Asia and the Western Pacific Rim, which is of great significance for global biodiversity conservation [4]. Tidal creek, which provides an important channel for tidal flat water exchange, is the most significant first-level geomorphic unit on the natural silt beach [5]. Tidal creek affects biodiversity maintenance in tidal flats, especially vegetation and bird diversity [6,7]. Birds are very sensitive to the change of wetland environment, so the wetland environment is directly related to the reproduction and survival of water birds [8]. In order to better protect the biodiversity and ecological environment, the Shandong Yellow River Delta National Nature Reserve (SYNR) was established in the YRD.
With the rapid development of industry and agriculture in the YRD, more land-based pollutants are transported to the coastal water and adversely affected the coastal tidal flats, especially nutrients and heavy metal pollution [3,9,10]. As the youngest estuary delta in the world, the YRD has a wide distribution of saline–alkali land due to its low precipitation-evaporation ratio and seawater influence. Therefore, farmers in the YRD increased the use of fertilizer to improve crop yield in saline-alkali land and increased the amount of nitrogen and phosphorus fertilizer applied in the YRD, resulting in a large amount of land nitrogen and phosphorus into the water of the YRD [11]. The Yellow River Delta is an important mining area of Shengli Oilfield. Previous studies have shown that plumbum (Pb), arsenic (As), and cadmium (Cd) in sediments of the YRD were mainly imported from petroleum exploitation [9,12,13,14,15]. Heavy metals have the characteristics of environmental persistence, accumulation, high biotoxicity, and wide sources [16,17]. Compared with sediments, heavy metals have a stronger migration in water, which threatens the safety of aquatic organisms due to bioenrichment and bioaccumulation [18]. Oil exploitation has a long-term risk for heavy metal pollution in the coastal beach of the YRD.
Meanwhile, with the development of marine industries such as the tidal flat breeding industry and port shipping industry, coastal water was directly threatened [19,20]. This increases the risk of near-shore eutrophication and heavy metal contamination, which will cause great harm to marine ecological balance and aquatic resources [21,22]. The investigation of nitrogen, phosphorus, and heavy metal pollution in the tidal creek water of the YRD will help to understand the environmental quality of the YRD and support biodiversity protection and pollution prevention in the YRD.
Thus, the objectives of this study were as follows: investigate the concentrations and spatial distribution characteristics of nitrogen, phosphorus, and heavy metals (Cd, Cu, Pb, As) in the coastal tidal creek water of the YRD; assess the ecological risks of nitrogen and phosphorus eutrophication and heavy metals; analyze the water quality of the coastal tidal creek in the YRD; and compare the water quality inside and outside the SYNR.

2. Materials and Methods

2.1. Study Area

The coastal tidal flats of the YRD were selected as the study area. The coastal tidal flats of the YRD, which lie between Bohai Bay and Laizhou Bay, span the coastlines of Dongying City and Binzhou City. The annual average precipitation is 530–630 mm, and the annual average temperature is 11.7–12.6 °C in the study area, which belongs to the temperate semi-humid continental monsoon climate [23]. The coastal tidal flats in the YRD are the key wintering habitat and breeding ground for migratory birds from East Asia to Australia, which is of strategic significance for global biodiversity conservation and ecological security maintenance in the Yellow Sea and Bohai Sea [24]. With the intensification of human activities such as petroleum development, port construction, and agricultural development, the coastal tidal flats of the YRD were under increasing environmental pressure.

2.2. Sample Collection

A total of 7 coastal tidal creek sample sites were selected along the coastline of the YRD from the west of the Tuhai river estuary in Binzhou city to the north of the Zhimai river estuary in Dongying city. Sampling Site 3, Sampling Site 4, and Sampling Site 5 were located in the SYNR (Figure 1). In September 2017, in total, 21 water samples were selected, all of which were located in intertidal flats with the same plant communities (single populations of Suaeda glauca). In each sample site, a tidal creek with a width of 5 m was selected, which was 800–1000 m away from the low tide line. Three sampling points, with a spacing of at least 200 m, were selected for each tidal creek. The water samples of the tidal creek were collected with a polyethylene water collector when the tide was low. One liter water samples for nitrogen and phosphorus analysis were put into polyethylene bottles, which were soaked with 1.0% (v/v) hydrochloric acid for 24 h before use and then cleaned. The other part of the water sample was put into clean polyethylene bottles, and the sample used for heavy metal determination was acidified with nitric acid on site to maintain the stability of the metal elements in the samples. The water samples before analysis were kept in the refrigerator at 4 °C. The basic physical and chemical properties of the water in the tidal creek were measured at each sample site. The pH, the oxidation–reduction potential (ORP), the total dissolved solid matter (TDS), and the temperature of the water were measured by the HI98195 tester (Hanna, Roma, Italy).

2.3. Laboratory Analysis

The total nitrogen (TN) in the water was determined by alkaline potassium persulfate with UV spectrophotometry (Hitachi, Tokyo, Japan). According to the Chinese National Standard (HJ535-2009), ammonium nitrogen (NH4+-N) was determined by Nessler’s reagent spectrophotometry. The nitrate nitrogen (NO3-N) in the water was determined by ultraviolet spectrophotometry. The total phosphorus (TP) in the water was determined by ammonium molybdate spectrophotometry. According to Chinese national standards (GB7475-87, GB7485-87), Cu, Cd, and Pb in the water samples were determined by atomic absorption spectrophotometry, and As was determined by silver diethyldithiocarbamate spectrophotometry. In this study, the quality control and assurance system included reagent blanks, replicate samples, and reference materials, including cupric nitrate solution, cadmium nitrate solution, lead nitrate solution, and arsenic trioxide solution (GB7475-87, GB7485-87). The standard deviations of triplicate measurements were less than 5.0%. Recovery rates of the heavy metals were between 85% and 103%.

2.4. Ecological Risk Assessment

2.4.1. Potential Eutrophication Assessment

The potential eutrophication evaluation method is based on the fact that the relative excess of nutrients in seawater cannot be used by phytoplankton and represents only potential eutrophication. The substantial contribution of excess P or N to eutrophication can be shown only when sufficient maximum limiting N or P supplement is obtained in water to make the N/P value close to the Redfield value [25]. The method was mainly used to evaluate the nutrient level and limiting factors of coastal estuaries and marine waters. The classification of potential eutrophication levels is shown in Table 1 [26].

2.4.2. Potential Ecological Risk Index Method

The potential ecological risk index method (RI) considers heavy metal pollution, biotoxicity, and combined ecological risks and reflects the characteristics of bioavailability and the relative contribution ratio [27]. The RI can analyze the pollution degree of a single pollution element and determine the comprehensive ecological risk of pollutants. The calculation formula is as follows:
RI = i = 1 n E r i = i = 1 n ( T i × C i C n i )
where RI is the potential ecological risk index, E r i is the potential ecological risk coefficient of the metal i, Ci is the measured concentration of heavy metals in water, and C n i is the reference concentration for heavy metal i in water. The C n i in this study was mainly based on the heavy metal concentration standard in the China National Seawater Quality Standard (GB3097-1997), the sea water quality in China can be divided into four grades according to the different use functions and protection objectives of the sea (Table 2). In this study, Sample Sites 3, 4, and 5 were all located in the SYNR, so the Grade I water quality standard was selected for these sites. Sample Site 7 was adjacent to Guangli Port, so the Grade IV water quality standard was selected for Sample Site 7. The Grade III water quality standard was selected for other sample sites. Ti was the toxicity coefficient of the metal i, which mainly reflected the sensitivity of organisms to heavy metal pollution and the toxicity level of heavy metals. Hakanson gave the toxicity coefficient of metals (Table 3) [28]. Classification of E r i and RI is shown in Table 4.

2.4.3. Risk Quotient

The risk quotient (RQ) method was used to evaluate the water ecological risk of Cu and Pb. The calculation formula is as follows:
RQ = C/PNEC
where C is the exposure concentration of heavy metals, and PNEC is the predicted no-effect concentration. In this study, PNEC was calculated as the quotient of HC5 and the assessment factor (AF, AF = 2) according to the AF method provided by the European Technical Guidance Document. The assessment factor was set as 2 to explain the uncertainty of missing populations and provide a preferable protection margin. The risk classification of the RQ is shown in Table 5 [29].
In this study, the toxicity data of Cu and Pb to aquatic organisms used, such as median lethal concentration (LC50) and median effect concentration (EC50), were collected from the USEPA ECOTOX database (http://www.epa.gov/ecotox/, accessed on 30 November 2021). The 4–7-day toxicity data was selected for algae, and the 24–96 h toxicity data were selected for crustaceans, invertebrates, fish, and amphibians. If a species had multiple toxicity data to meet the requirements, the geometric mean value was taken. According to the above screening principles, the statistical values of Cu and Pb toxicity data are shown in Table 6. Selected toxicity data were tested with the Shapiro-Wilk test (p > 0.05) and Kolmogorov-Smirnov test (p > 0.05) to construct SSD curves. The logarithm of the ascending toxicity data concentration is the abscissa of the SSD curve, and the cumulative probability is the ordinate of the SSD curve. The maximum environmental harmful concentration (HC5) allowed to protect 95% and above species from being affected was finally obtained through logistic model fitting.

2.5. Single-Factor Method

The single-factor (SF) method classifies water quality according to an individual factor. The calculation formula is as follows:
Q = Max (Qi)
where Q is the comprehensive level of water quality evaluated by a single factor, Qi is the water quality level of evaluation parameter i, and Max is the worst evaluated water quality among water quality parameter i, according to the China National Seawater Quality Standard (GB3097-1997).

2.6. Data Analysis

One-way ANOVA was used to analyze the effects of the sample sites on the TN, NO3-N, NH4+-N, TP, Cd, As, Pb, and Cu in the tidal creek water. After carrying out one-way ANOVA, Fisher’s protected LSD test was used to detect significant differences (p < 0.05) among the sample sites. Pearson’s correlation analysis was performed to test the relationship between the TN, NO3-N, NH4+-N, TP, Cd, As, Pb, Cu, pH, ORP, TDS, and water temperature in the water.

3. Results and Discussion

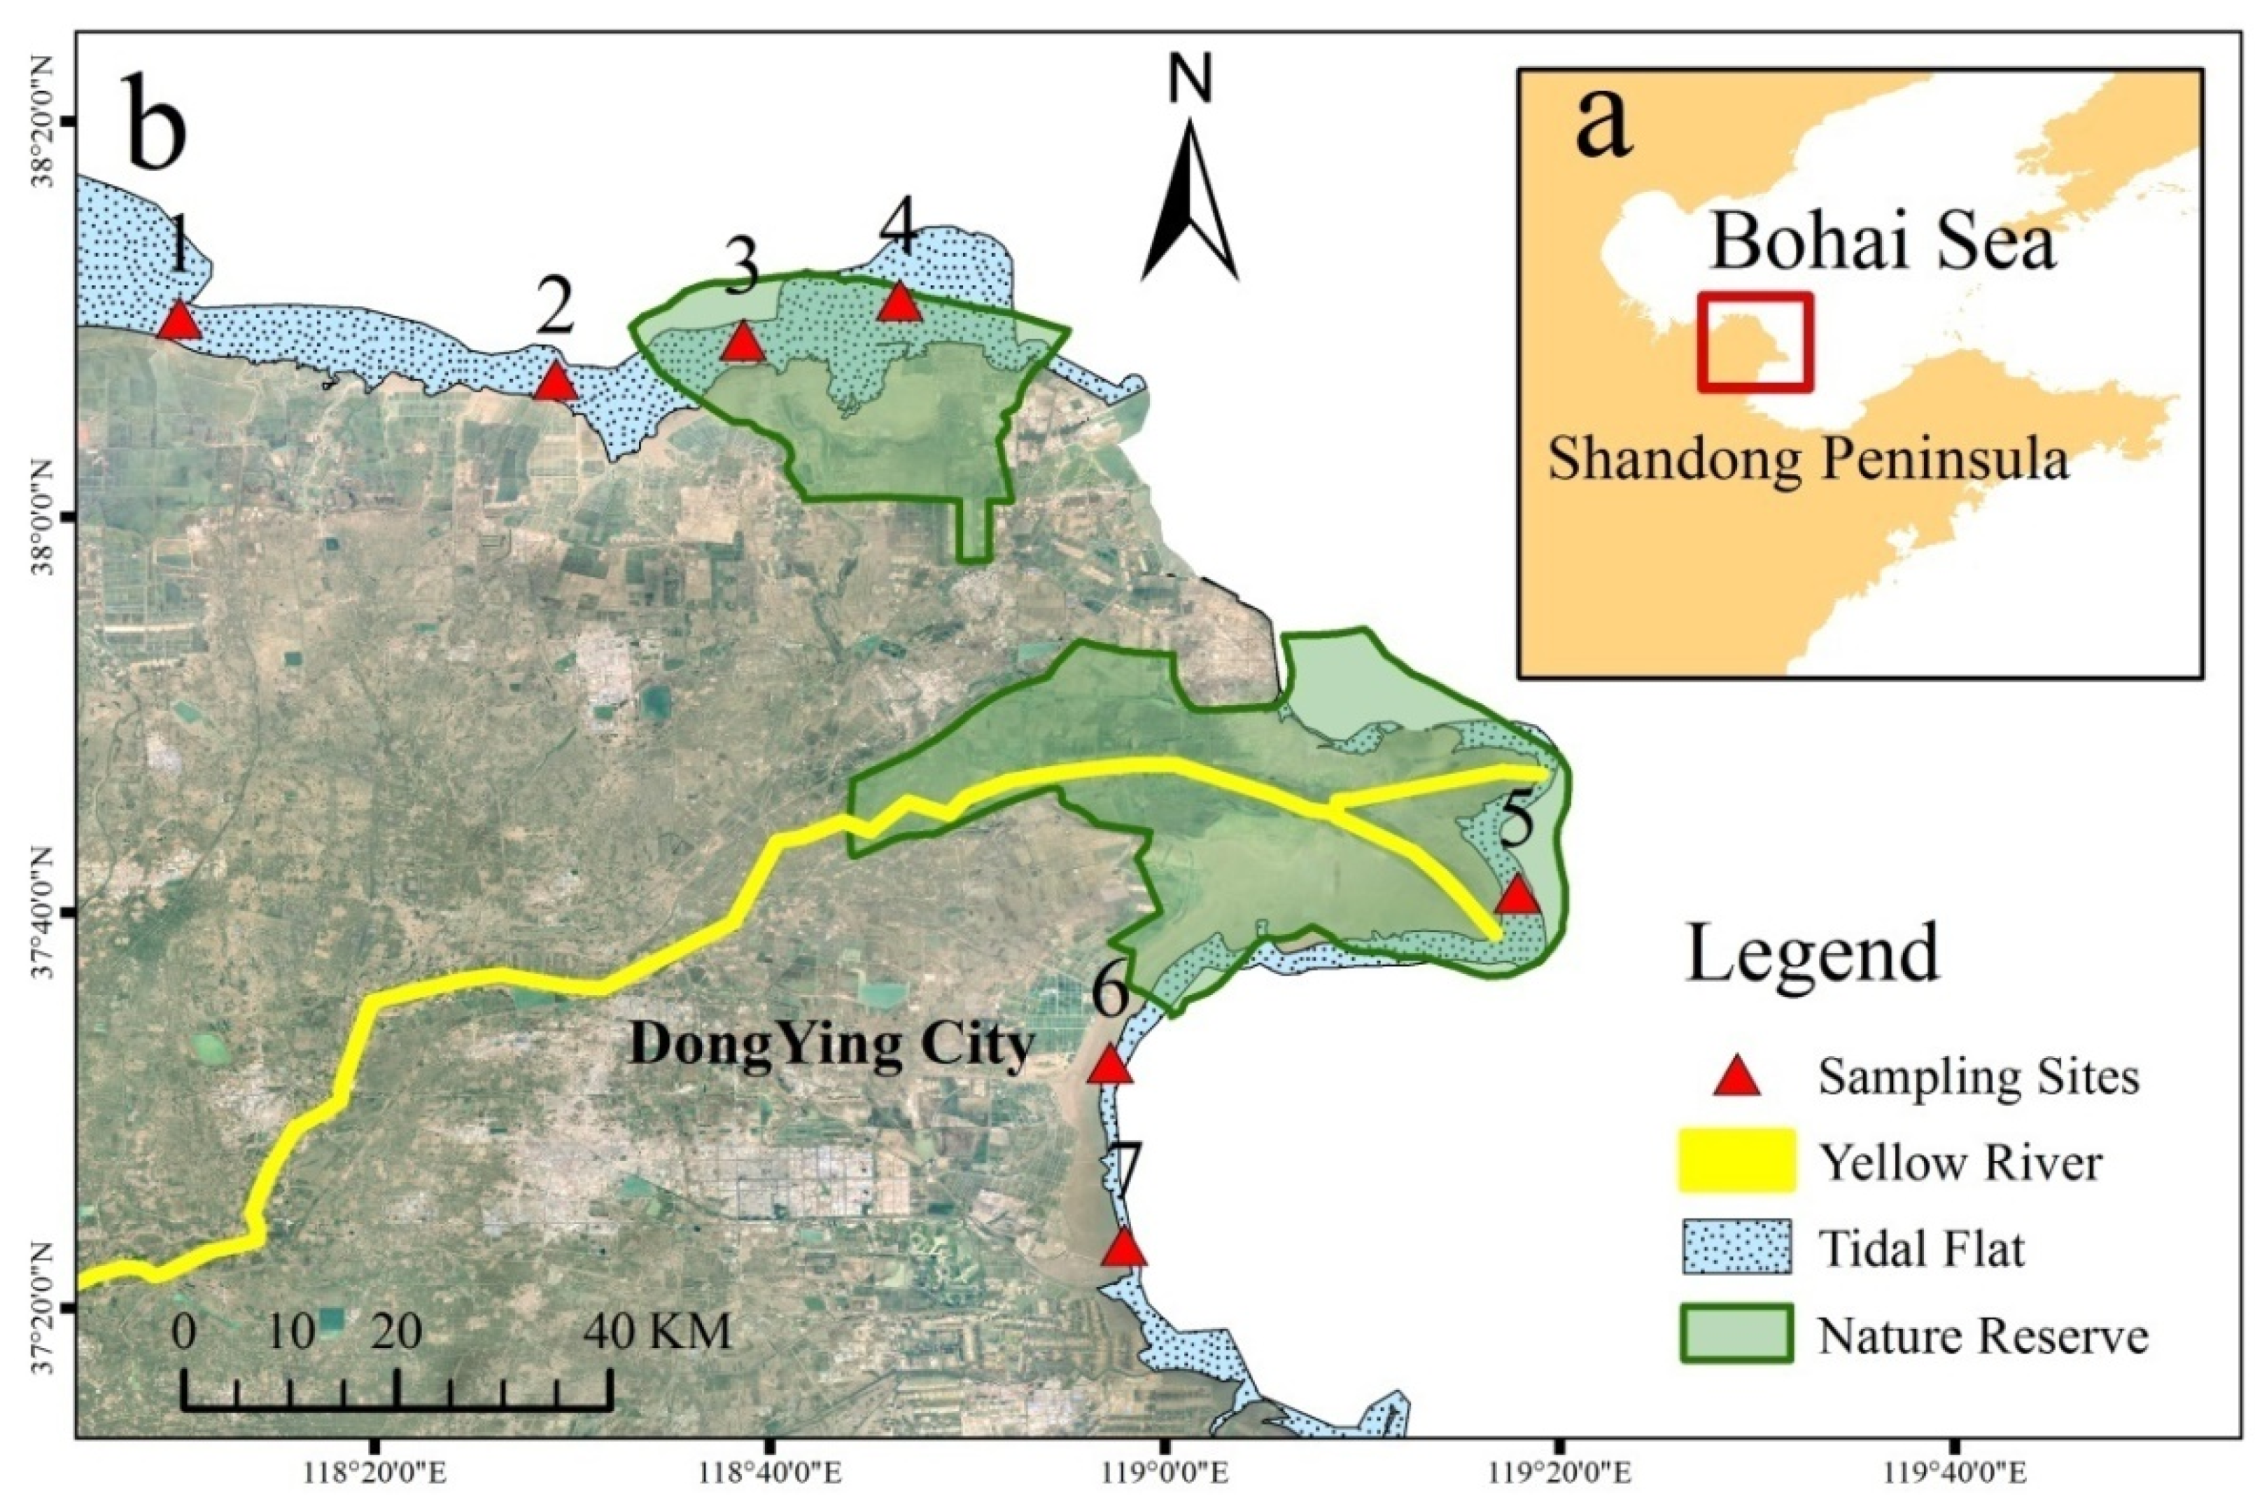
3.1. Spatial Distribution of Nitrogen and Phosphorus

In general, along the coastline from northwest to southeast in the YRD, the contents of TN, TP, and NH4+-N in the tidal creek water showed a spatial trend of decreasing and then increasing, while the contents of NO3-N had no obvious spatial distribution trend (
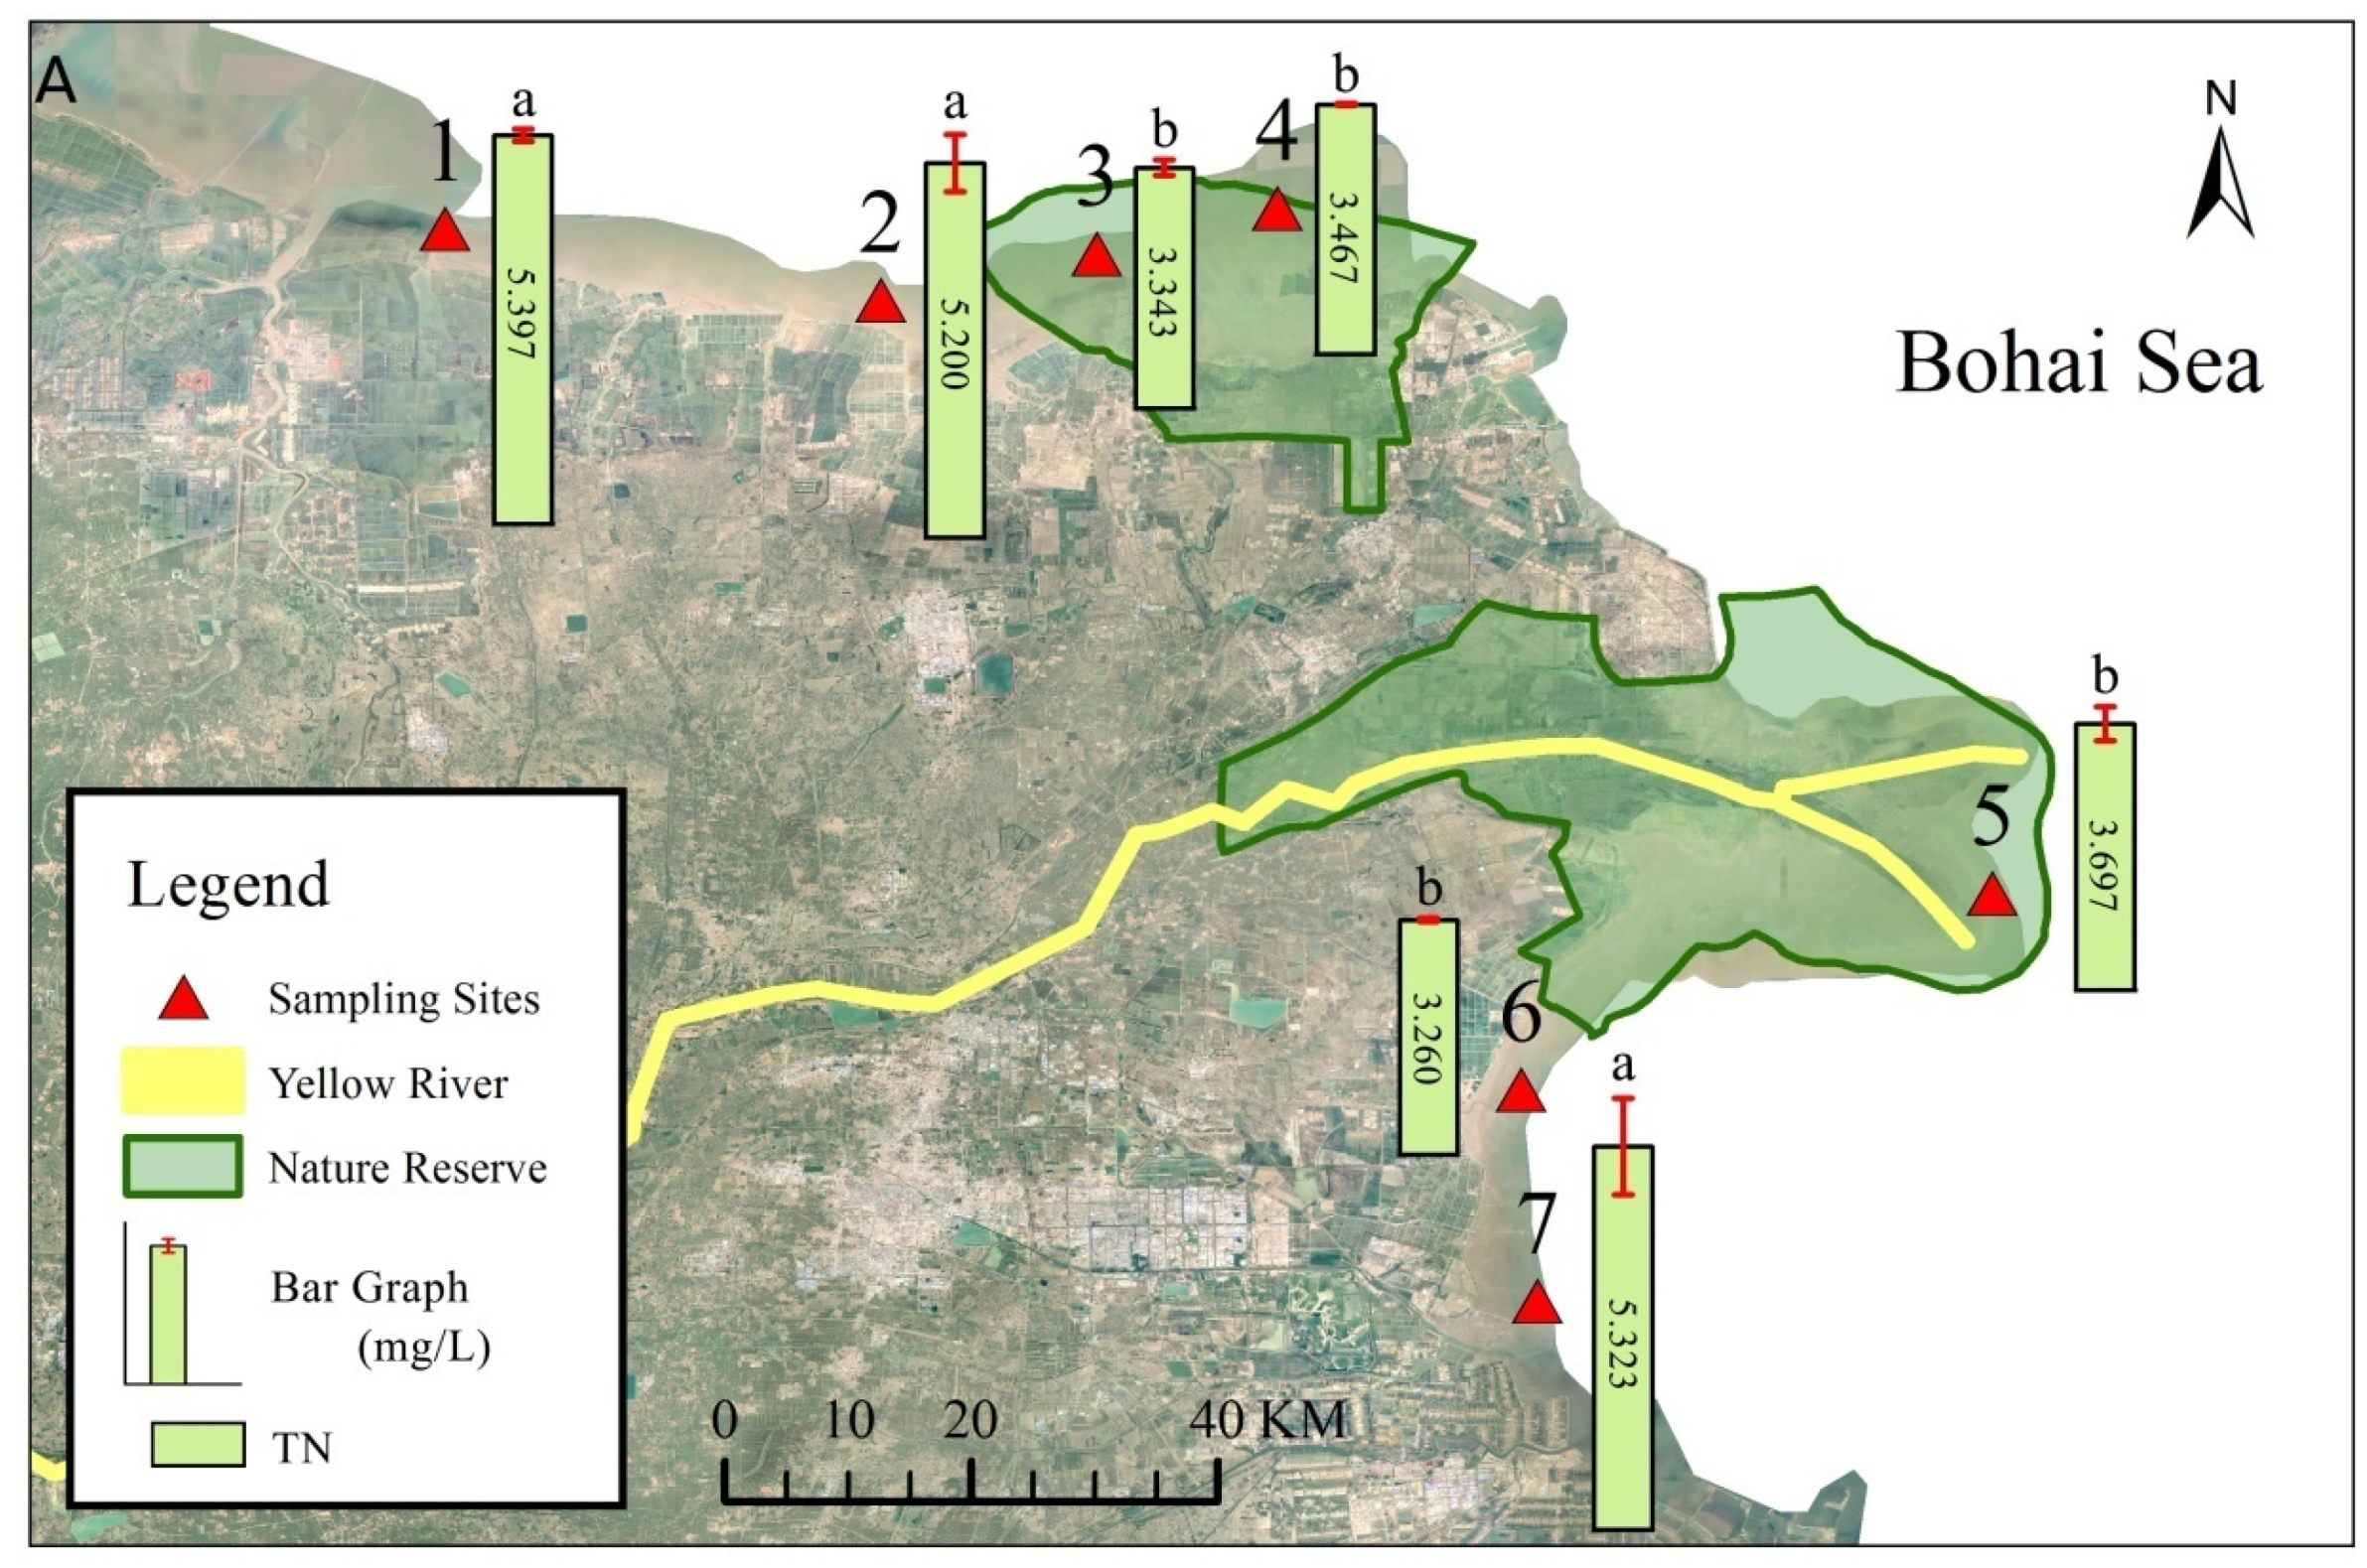
Figure 2). The contents of TN, TP, and NH4+-N in the water samples from the SYNR were lower than those outside the SYNR (Figure 2). The TN concentration in the water of the 7 sample sites ranged from 3.26 to 5.39 mg L−1, with an average of 4.24 mg L−1. There were significant differences in the TN concentration among different sample sites (F = 10.485, p < 0.001). Comparing the TN concentration in the water samples from the 7 sample sites, the TN concentration in Sample Site 1 was the highest, while those in Sample Site 6 were the lowest. The TN concentration in the water samples from the SYNR was lower than that in Sample Sites 1, 2, and 7 outside the SYNR (Figure 2A). There were different spatial distributions of the TN content in the water of the tidal creek and sediments around the tidal creek in the YRD. The highest TN content was found in sediments of the tidal flats near the Yellow River estuary [30].
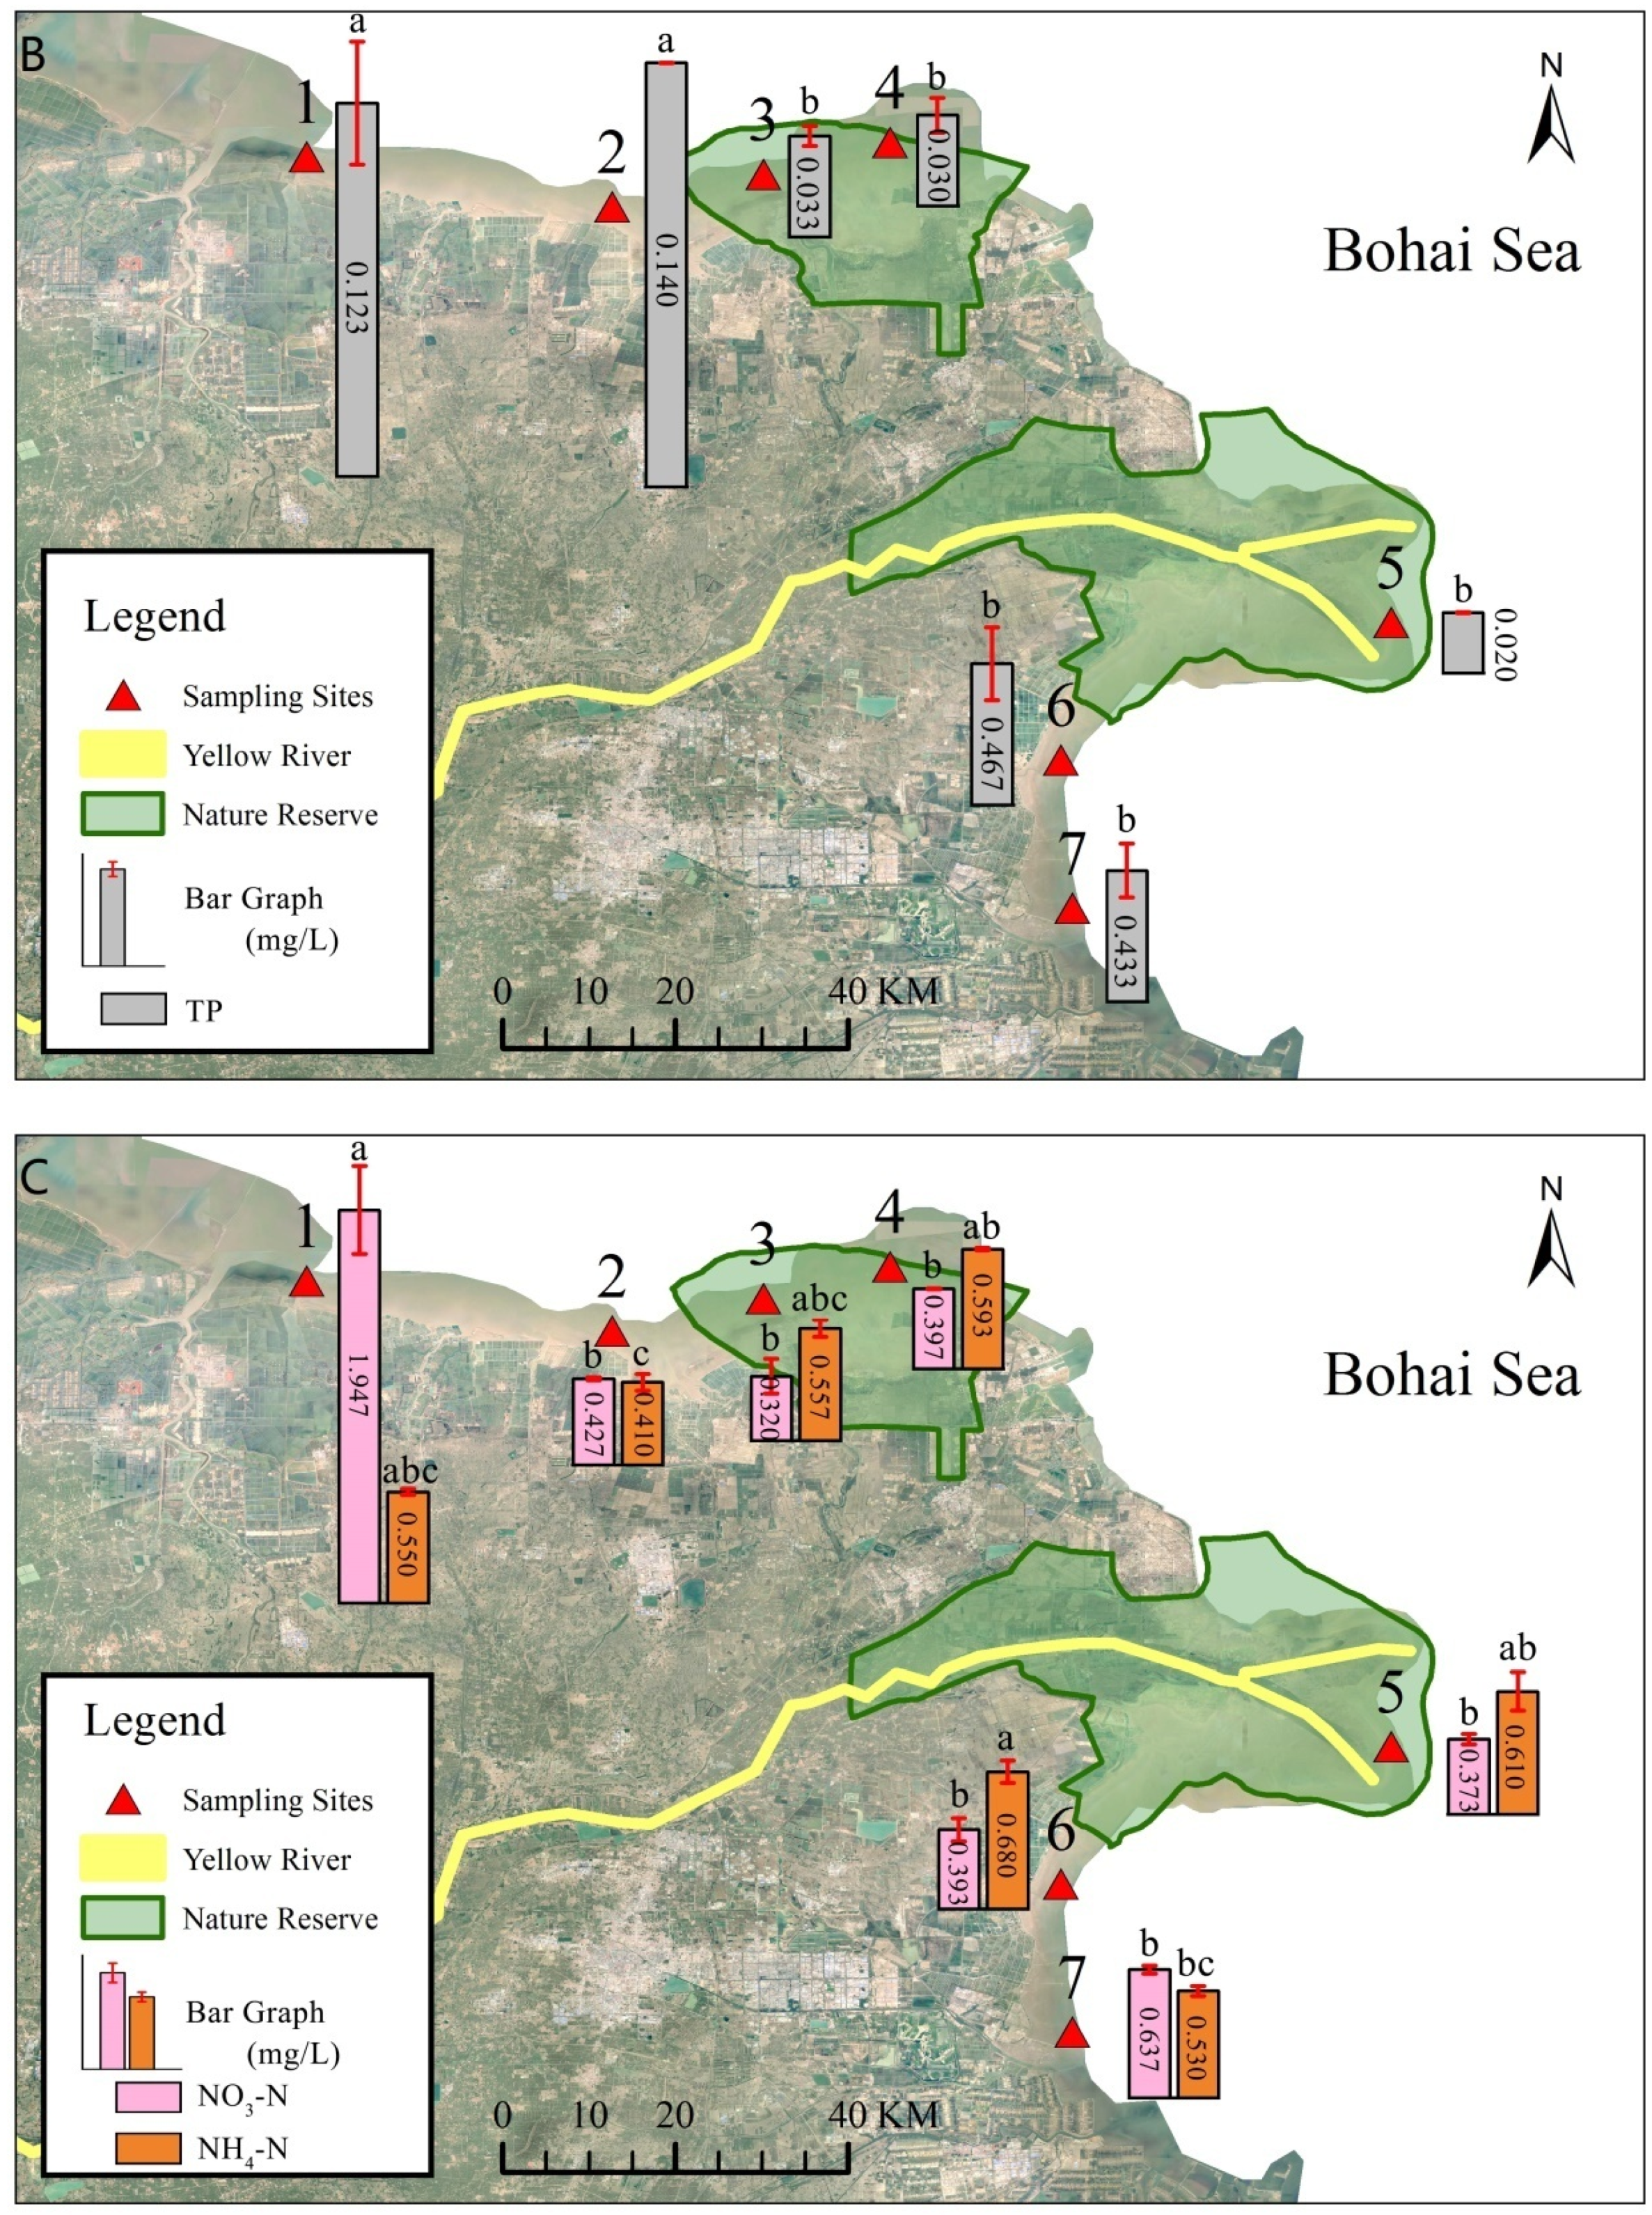
The TP concentration in the water of the tidal creek at all sample sites ranged from 0.02 to 0.14 mg L−1, with an average of 0.06 mg L−1. There were significant differences in the TP concentration among the different sample sites (F = 24.164, p < 0.001). The TP concentration in the water of the tidal creek at Sample Site 2 was the highest, and that at Sample Site 5 was the lowest (Figure 2B), which was lower than the TP concentration in the Yellow River estuary (0.04 mg L−1) [31]. The TP content in the water of sample sites in the SYNR was lower than that of the sample sites outside the SYNR (Figure 2B). This was similar to the spatial distribution of the TN content in sediments around the tidal creek in the YRD [30].
The concentration of NO3--N in the water samples of the 7 sample sites ranged from 0.32 to 1.95 mg L−1, with an average of 0.64 mg L−1. Compared with other research results, the average concentration of NO3-N in the tidal creek water in this study was lower than that in the eight rivers of the YRD in Laizhou Bay (before rainfall, the average NO3-N content was 1.37 mg L−1; the average content after rainfall is 1.47 mg L−1) [11]. There were significant differences in the NO3-N concentration among different sample sites (F = 40.558, p < 0.001). Comparing the NO3-N concentration in the water samples from the 7 sample sites, the concentration in Sample Site 1 was the highest, while that in Sample Site 3 was the lowest (Figure 2C). The NO3-N content of the water samples from the SYNR was lower than that of Sample Sites 1, 2, and 7 outside the SYNR (Figure 2C). This was different from the spatial distribution of the NO3-N content in the sediments around the tidal creek of the YRD, such as the NO3-N content in the sediments inside the SYNR was higher than that of Sample Sites 6 and 7 outside the SYNR [30].
The concentration of NH4+-N in the tidal creek water of the 7 sample sites ranged from 0.41 to 0.68 mg L−1 (mean: 0.56 mg L−1). There were significant differences in NH4+-N concentration among different sample sites (F = 2.919, p < 0.05). The NH4+-N content in the tidal creek water in Sample Site 6 was the highest, and that in the tidal creek water in Sample Site 2 was the lowest in the YRD (Figure 2C).
The results of this study were compared with the previous research results on nitrogen and phosphorus in the water of the YRD or the estuary of the Yellow River (Table 7). The results showed that N and P in the coastal tidal flat water of the YRD may mainly come from local land sources. More attention should be paid to the control of nitrogen content than phosphorus content in the coastal tidal flats of the YRD.

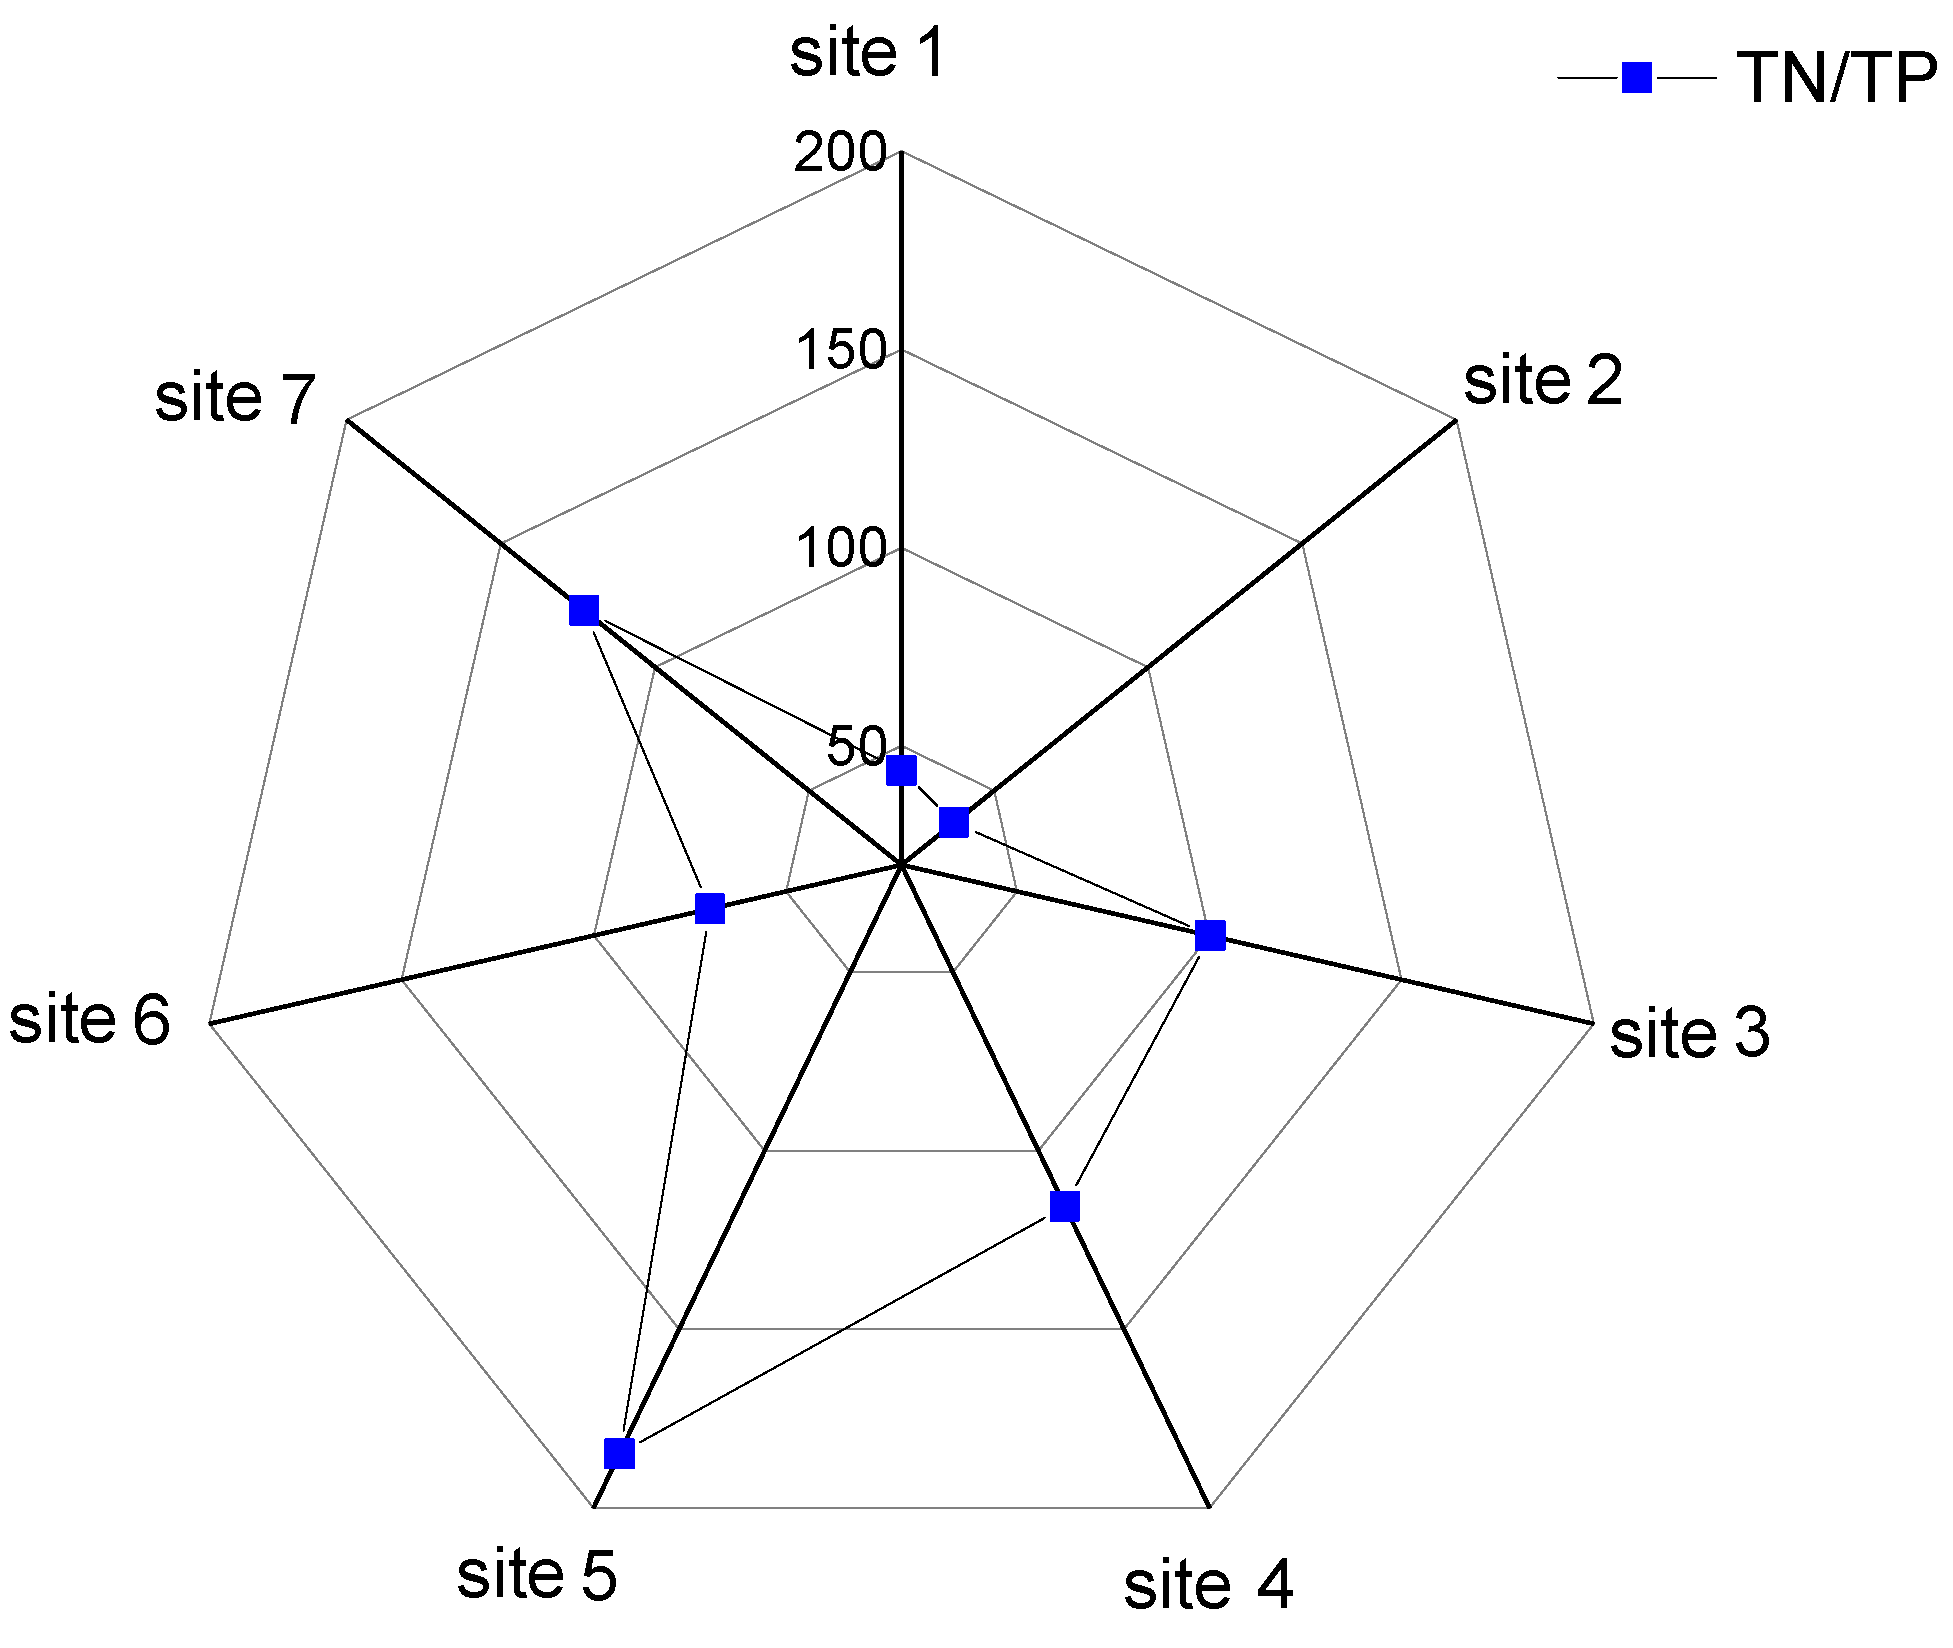
3.2. TN/TP Mass Ratio

P and N are the primary limiting nutrients for the production of aquatic algae and also the important factors affecting water eutrophication [34]. The TN/TP mass ratio, as an important factor, affects the explosive growth of algae and is an important indicator of the production cycle and quantity of planktonic algae in water. The TN/TP mass ratio varies from 37 to 185 (mean: 96) in the tidal creek water of the 7 sample sites of the YRD. The TN/TP mass ratio (mean: 134) of Sample Sites 3, 4, and 5 in the tidal creek water inside the SYNR was higher than that (mean: 68) of Sample Sites 1, 2, 6, and 7 outside the SYNR. It is noteworthy that the TN/TP mass ratio in the water of Sample Site 5 was the highest in the sample sites of the YRD (Figure 3). Compared with previous research results (Table 7), the TN/TP mass ratio in the water of the YRD has increased over the past decade.
Potential eutrophication evaluation analysis (Table 1) [26] showed that the tidal creek water of the seven sample sites in the YRD was in phosphorus-restricted potential eutrophication state. When the ratio was between 10 and 25, there was a linear correlation between N and P concentration and algae growth, which was suitable for algae growth and prone to eutrophication [35]. In recent years, eutrophication was a serious environmental problem in the Bohai Sea [36], so the Chinese government has pushed the Action Plan for the Environmental Comprehensive Management and Control of the Bohai Sea (https://www.mee.gov.cn/xxgk2018/xxgk/xxgk15/201812/t20181211_684274.html, accessed on 11 December 2018). When controlling nitrogen source input, the coastal tidal creek water of the YRD, the TN/TP mass ratio should also be concerned to prevent the ratio in water from reaching the eutrophication critical point.

3.3. Spatial Distribution of Heavy Metals

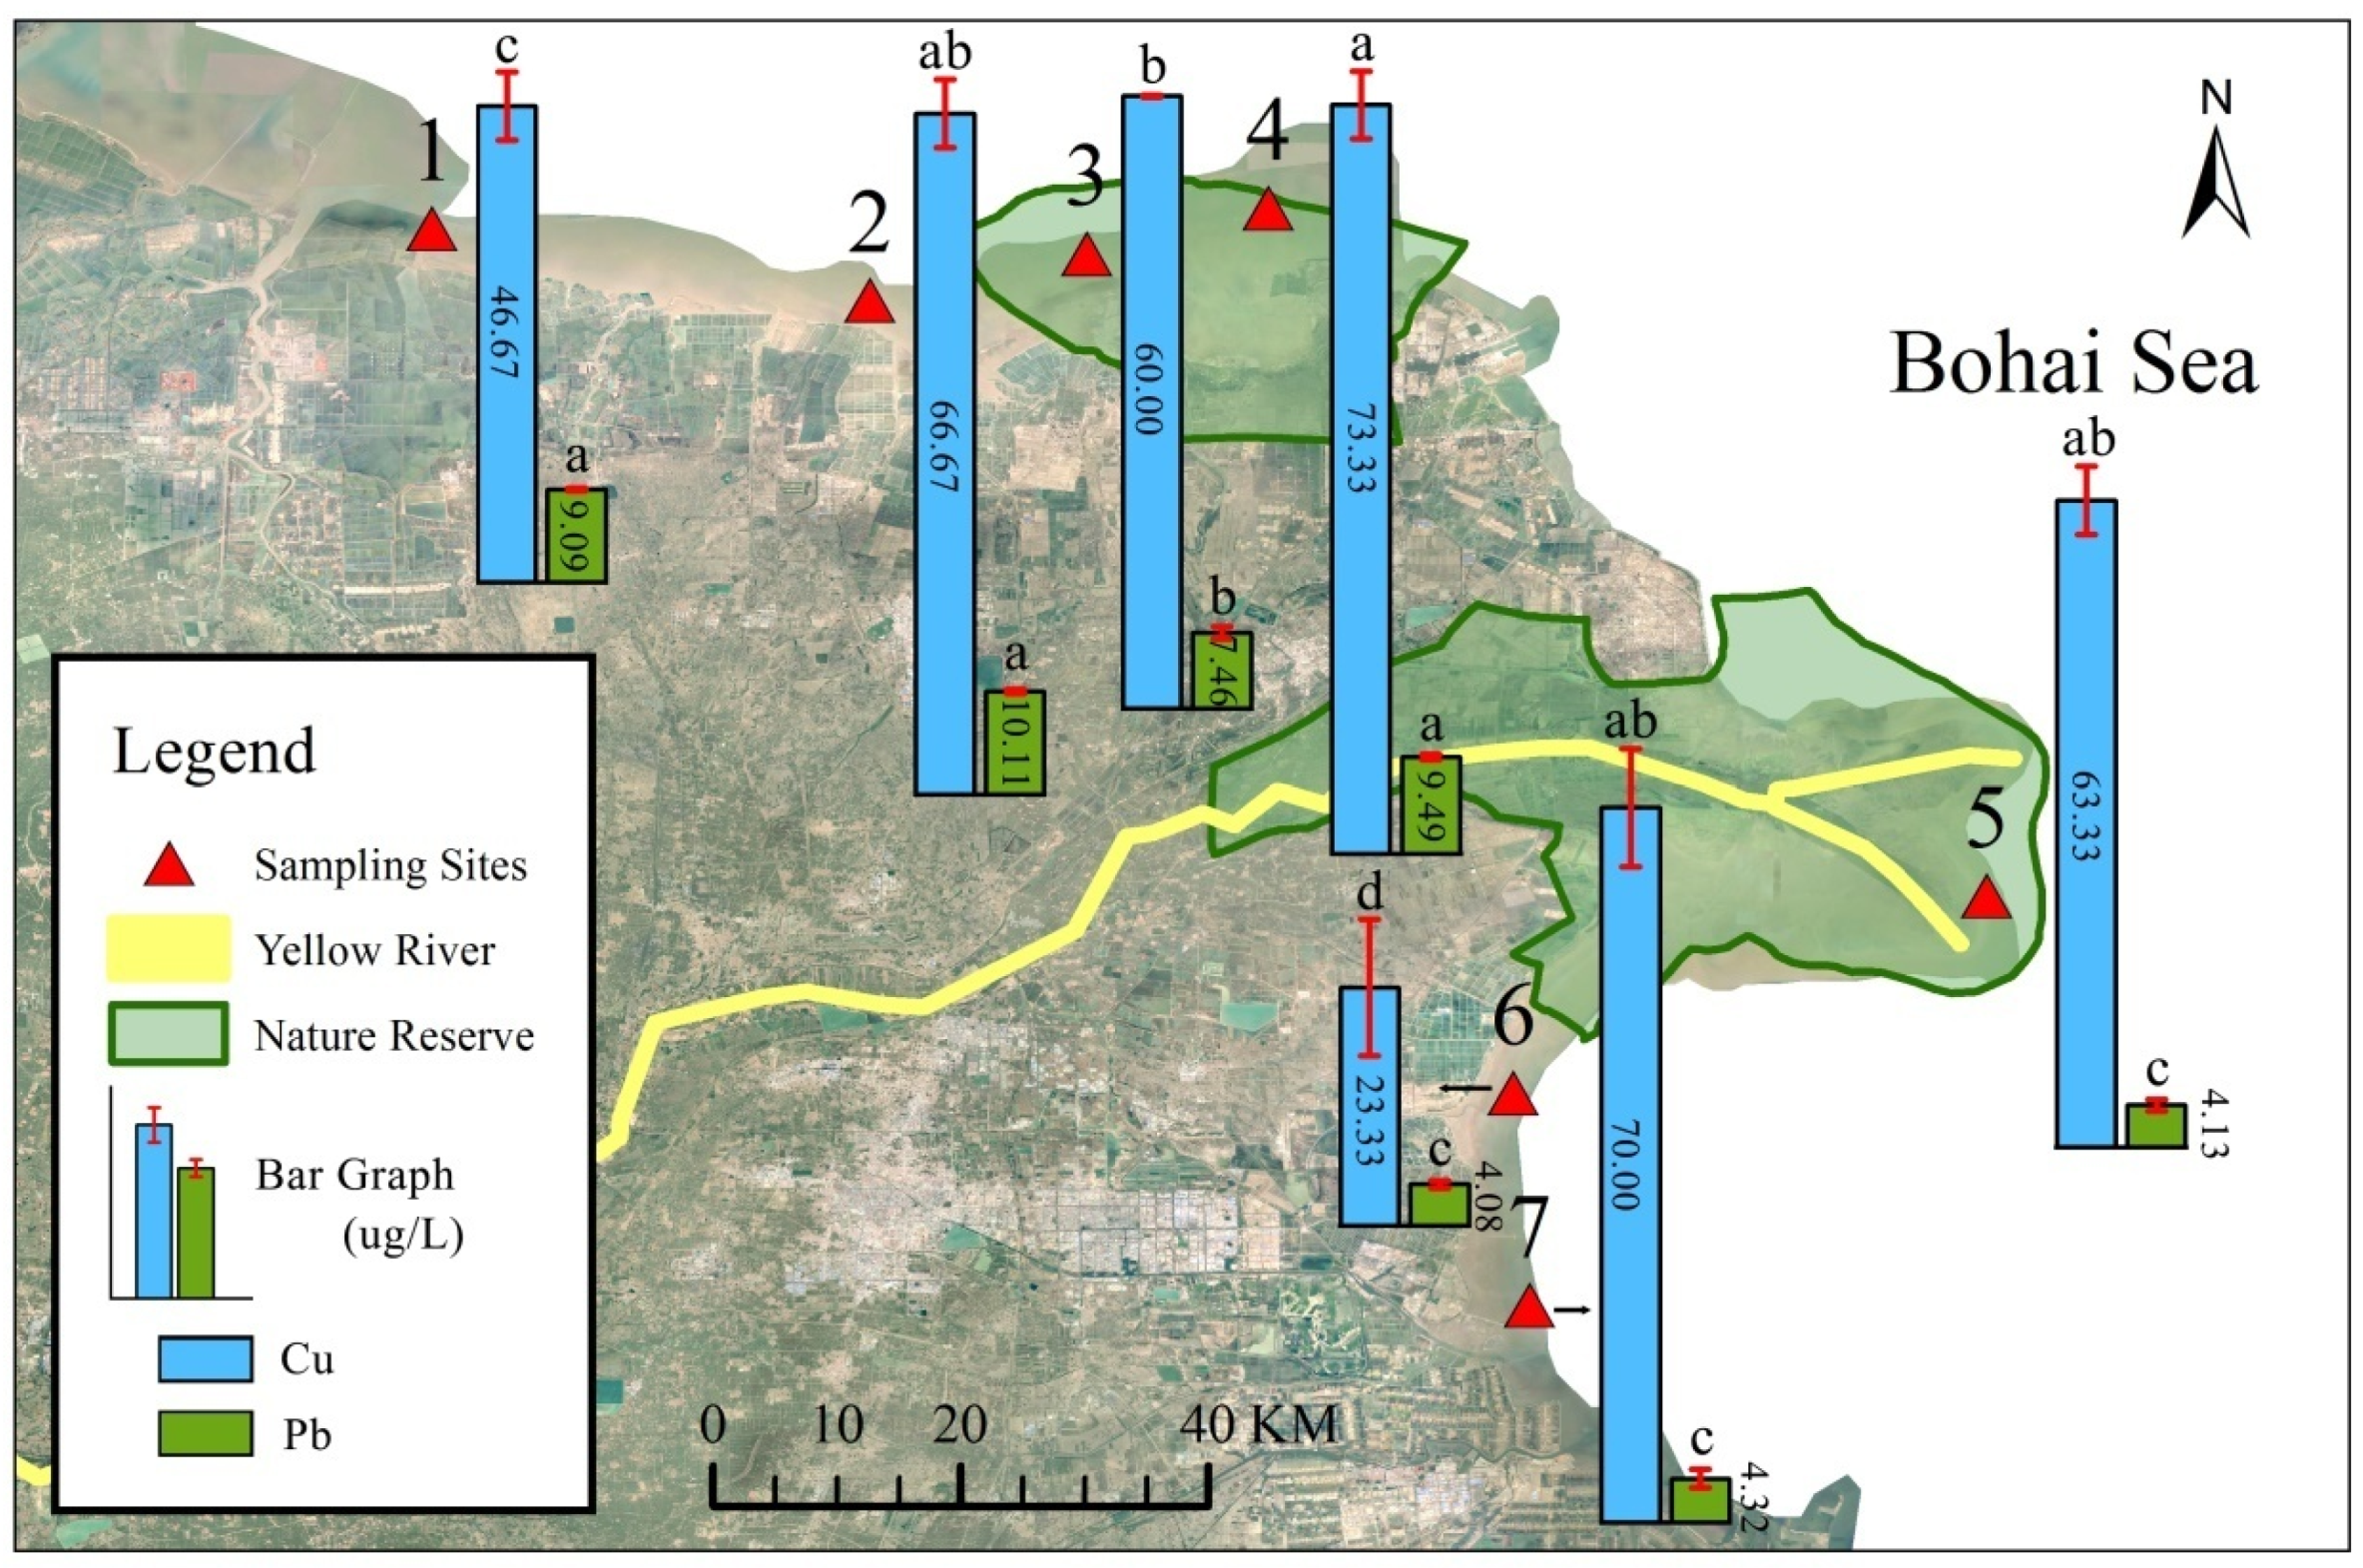
The average concentration of Cu in the tidal creek water of the 7 sample sites was 60.00 µg L−1, the average concentration of Pb was 6.96 µg L−1, and the average concentrations of As and Cd in the water of the 7 sample sites were less than 0.50 µg L−1 and 0.09 µg L−1 in the YRD, respectively. The order of the average concentration of Cu, Pb, Cd, and As in the tidal creek water was Cu > Pb > Cd > As, which was similar to the order in the tidal flat sediments around the tidal creek [15]. In the SYNR, the average concentrations of Cu and Pb in the tidal creek water were 65.56 µg L−1 and 7.03 µg L−1, respectively; outside the SYNR, the average concentrations of Cu and Pb in the tidal creek water were 59.16 µg L−1 and 6.90 µg L−1, respectively. Compared with the concentrations of heavy metals in the rivers, estuaries, and coastal waters around the Bohai Sea, Bohai Bay, and Laizhou Bay (Table 8), the concentrations of Cu and Pb decreased from the inland waters to the sea. Therefore, it was inferred that Cu and Pb in the water of the tidal creek in the YRD mainly came from land. The average concentration of As in the water of the coastal tidal creek of the YRD was lower than that in the Bohai Sea and coastal Bohai Sea, while the average concentration of Cd was close to that in the Bohai Sea and coastal Bohai Sea (Table 8). Therefore, it was inferred that As and Cd in the coastal tidal creek water of the YRD were affected by both marine and land pressures.
One-way ANOVA showed that there were significant differences in Cu (F = 17.333, p < 0.001) and Pb (F = 28.772, 
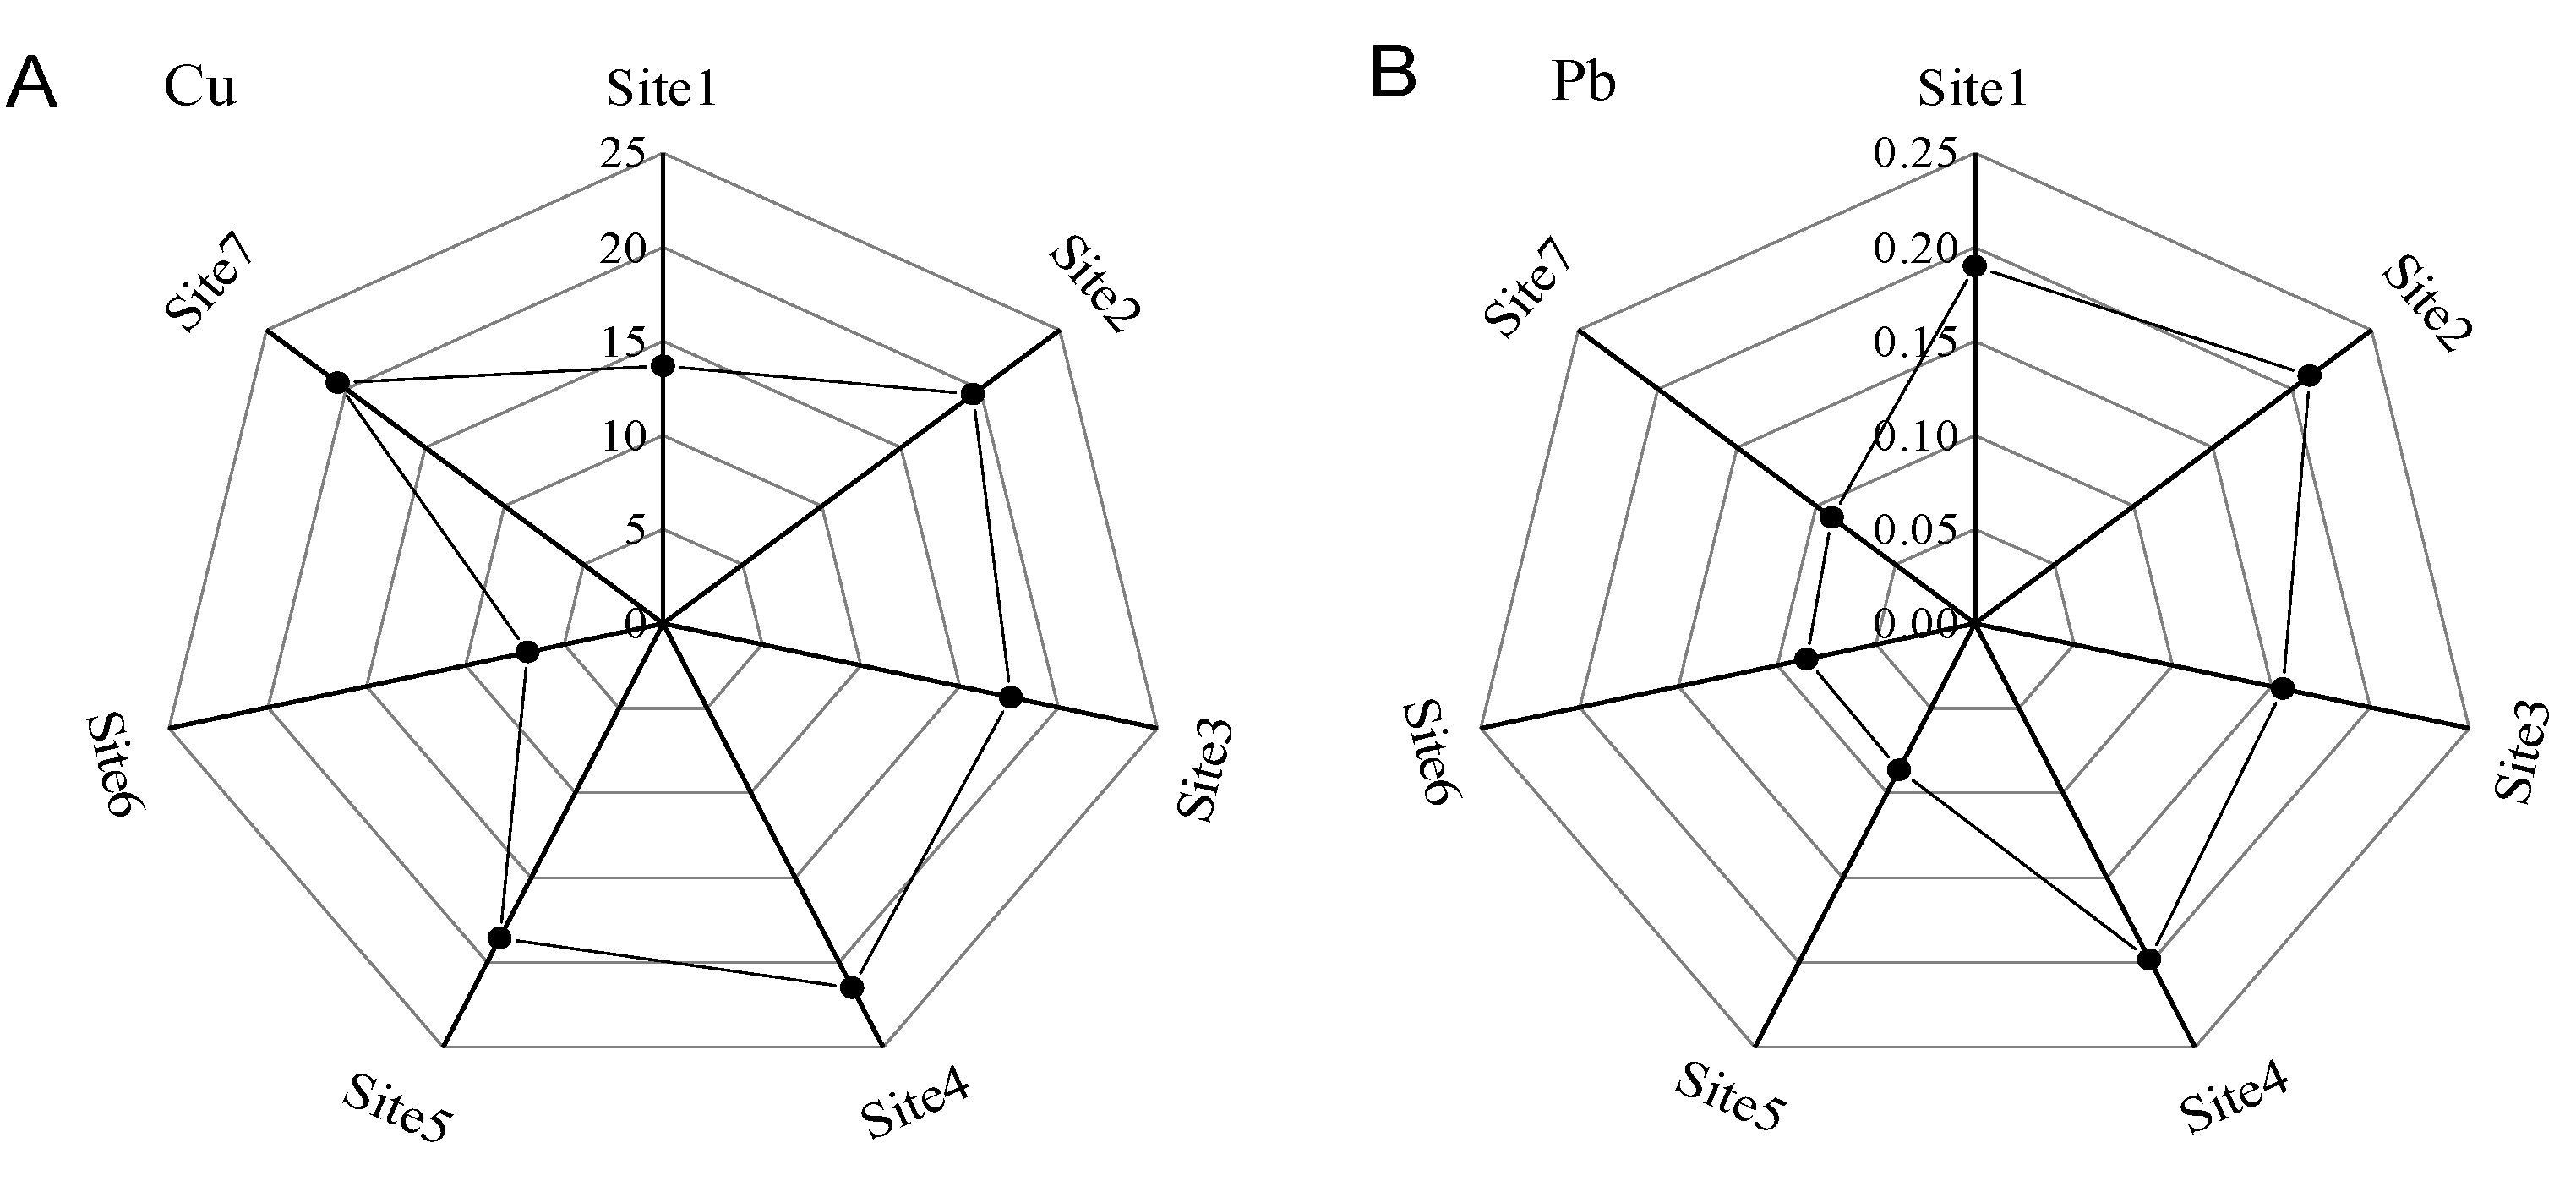
p < 0.001) in the tidal creek water in the different sample sites. As the contents of Cd and As in the tidal creek water of the different sample sites were below the detection limit, the contents of these two metals in the tidal creek water of the different sample sites were not analyzed by ANOVA. The spatial distribution characteristics of Cu and Pb concentrations in the tidal creek water of the different sample sites were different (Figure 4). The concentration of Cu was the lowest in the water of Sample Site 6 and was significantly lower than that of other sample sites (Figure 4). The spatial distribution characteristics of Cu concentration in the water of the seven sample sites were similar to that in the sediment around the tidal creek in the YRD [15]. This may be related to the relatively long-term and stable pressure of Cu pollution on the water of the coastal tidal creek and the sediment of the coastal tidal flats.
The spatial distribution of Pb concentration in the water of the coastal tidal creek was higher in the north and lower in the south in the YRD (Figure 4). Previous studies have shown that Pb in the sediments of the Yellow River estuary and its northwest coastal area was dominated by anthropogenic sources, while Pb in the sediments of the coastal area south of the Yellow River estuary was affected by both natural and anthropogenic sources [42,43]. Although Pb pollution sources were different in different areas of the YRD, there was no significant difference in Pb content in the sediments of the coastal tidal flats of Bohai Bay and Laizhou Bay [15]. The results of this study show that the Pb concentration in the water of the coastal tidal creek of the YRD was different. Meanwhile, according to Table 4, the source of Pb in the water in the northern tidal flat of the YRD was probably mainly from the rivers or near the shore, which caused Pb pollution pressure may be greater than that from the Yellow River to tidal creek water in the YRD. The Pb pollution pressure of the tidal creek water of Bohai Bay in the north of the YRD may be increasing, which deserves further attention.

3.4. Ecological Risk of Heavy Metals

3.4.1. Potential Ecological Risk Index Method (RI)

The results of ecological risk assessment of heavy metals showed that Cu ( E r i = 31) and Pb ( E r i = 17) of the tidal creek water in the seven sample sites in the YRD were all low risk. However, the ecological risk index ( E r i ) of Cu and Pb in the tidal creek water of different sample sites was different (Figure 5). The E r i of Cu in the water of Sample Sites 3, 4, and 5 inside the SYNR was of medium risk, while the E r i of Cu in the water of sample sites outside the SYNR was of low risk (Figure 5A). The E r i of Pd in the tidal creek water in Sample Site 4 was of moderate risk, while that in other sites was of low risk (Figure 5B).
The potential ecological risk index (RI) of Cu and Pb in the coastal tidal creek water of the 7 sample sites of the YRD ranged from 4 to 121 (mean value: 48), indicating low risk (Figure 5C). The RI of Cu and Pb in the water of sample sites in the SYNR was higher than that of other sample sites outside the SYNR. Although the ecological risk of heavy metals in the tidal creek water of the YRD was low, it was worth paying attention to Cu in the coastal tidal creek of the YRD, especially Cu pollution in the water of the coastal tidal creek of the SYNR.

3.4.2. Risk Quotient (RQ)

The SSD curves of Cu and Pb in the water of the coastal tidal creek of the YRD are shown in Figure 6. Cu had greater toxicity to aquatic organisms, so it was necessary to keep the Cu concentration in the water below 6.83 µg L−1 in order to protect 95% of aquatic organisms (Table 9). The average concentration of Cu in the tidal creek water was 60.00 µg L−1, nearly 9 times higher than this threshold, which was at a high ecological risk level and will greatly adversely affect aquatic organisms. The aquatic organisms have low sensitivity to Pb, and the short-term water quality standard for the protection of Pb in the tidal creek water of the YRD was 47.88 µg L−1 (Table 9). Wang et al. showed that the short-term water quality standard for Pb in freshwater in China was 63.92 µg L−1 [44]. The concentration of Pb in this study did not exceed the standard. Compared with Cu, Pb has a low level of ecological risk. Therefore, there were differences in the prevention and control of heavy metal pollution in the tidal creek water of the YRD. In the YRD, attention should be paid to the prevention and control of Cu pollution in the water of the coastal tidal creek.
The Cu concentration in the water of different sample sites had exceeded its water ecological risk threshold. The RQ of Cu in each site was at a high ecological risk level and had potential harm to aquatic organisms (Figure 7A). Among the seven sample sites, the RQ of Cu at Sample Site 4 was the highest. However, the RQ of Pb of the sample sites located near and south of the Yellow River Estuary was at a low ecological risk level, and that of the other sample sites was at a moderate ecological risk level (Figure 7B). High-intensity human activities were an important factor for the high ecological risk of Cu pollution in the water of the coastal tidal creek of the YRD. The pollution status of Pb was lower than that of Cu, while it should also be paid attention to it will amplify the risk due to biological enrichment.
There is uncertainty in the characterization of water ecological risk, which is related to a variety of environmental factors and human factors, including sample collection and analysis errors. Migrating waterbirds arrive in the YRD every October. Therefore, this study carried out a tidal creek water survey in September 2017 to analyze bird habitat quality at that time. Thus, these results only represent the ecological risk during the survey period because of sampling time limitations. Sampling should be carried out several times to fully analyze and understand the ecological risks of N, P, and heavy metals in the tidal creek water of the study area.

3.5. Correlation Analysis

Correlation analysis showed that the TN concentration was significantly positively correlated with the TP concentration and the NO3-N concentration, while the TN concentration was significantly negatively correlated with the NH4+-N concentration, pH, and the water temperature. The TP concentration was positively correlated with the concentration of TN, NO3-N, and Pb and negatively correlated with the NH4+-N concentration, the ORP, the TDS, and the water temperature; the concentration of Cu was positively correlated with the TDS and negatively correlated with the concentration of NH4+-N and the pH in the tidal creek water (Table 10). The concentration of Pb had a significantly positive correlation with TP and a significant negative correlation with the NH4+-N concentration and the water temperature (Table 10). The results showed that TN, TP, and NO3-N sources of the tidal creek water were similar, and Pb and TP sources of the tidal creek water were similar.
The concentrations of TN, TP, Cu, and Pb in the tidal creek water of the YRD were mainly affected by the pH, TDS, and water temperature. The pH value was one of the important environmental factors affecting the content of heavy metals in seawater [45]. Correlation analysis results (Table 10) showed that the pH was significantly negatively correlated with the Cu concentrations in the water and negatively correlated with the Pb concentration in the water. With the increase in the pH of the coastal tidal creek water in the YRD, the concentrations of Cu and Pb decreased, which was similar to the research results in the Bohai Sea and Yellow Sea [37]. With the increase in the TDS in the tidal creek water of the YRD, the concentration of TP in the water decreased, while the concentration of Cu in the water increased in the tidal creek water (Table 10). The higher the water temperature was, the lower the concentration of TN, TP, and Pb. With the increase in water temperature, the concentrations of TN, TP, and Pb in the water decreased (Table 10).

3.6. Water Quality Analysis

According to the China National Marine Water Quality Standard (GB3097-1997) (Table 2), the concentrations of Cd and As in the water of all the samples in the YRD reached Grade I, and pH values reached Grades I and II, while the average concentration of Cu reached Grades III and IV, and the concentration of Pb reached Grade III. There were differences in the water quality of the tidal creeks between different sample sites. The Cu concentrations in the water of Sample Site 6 met Grade I, while that in the other sample sites all met Grades III and IV (Figure 5). The Pb concentrations in the water of Sample Sites 2 and 4 were in Grade III, and the other sample sites were in Grade II. The sample sites in Bohai Bay in the north of the YRD may be more influenced by the proximity of Dongying ports and economic development zones. The significant difference of Cu concentration in the water between Sample Sites 6 and 7 in Laizhou Bay in the south of the YRD may be because Sample Site 7 was closer to a copper enterprise and Guangli Port.
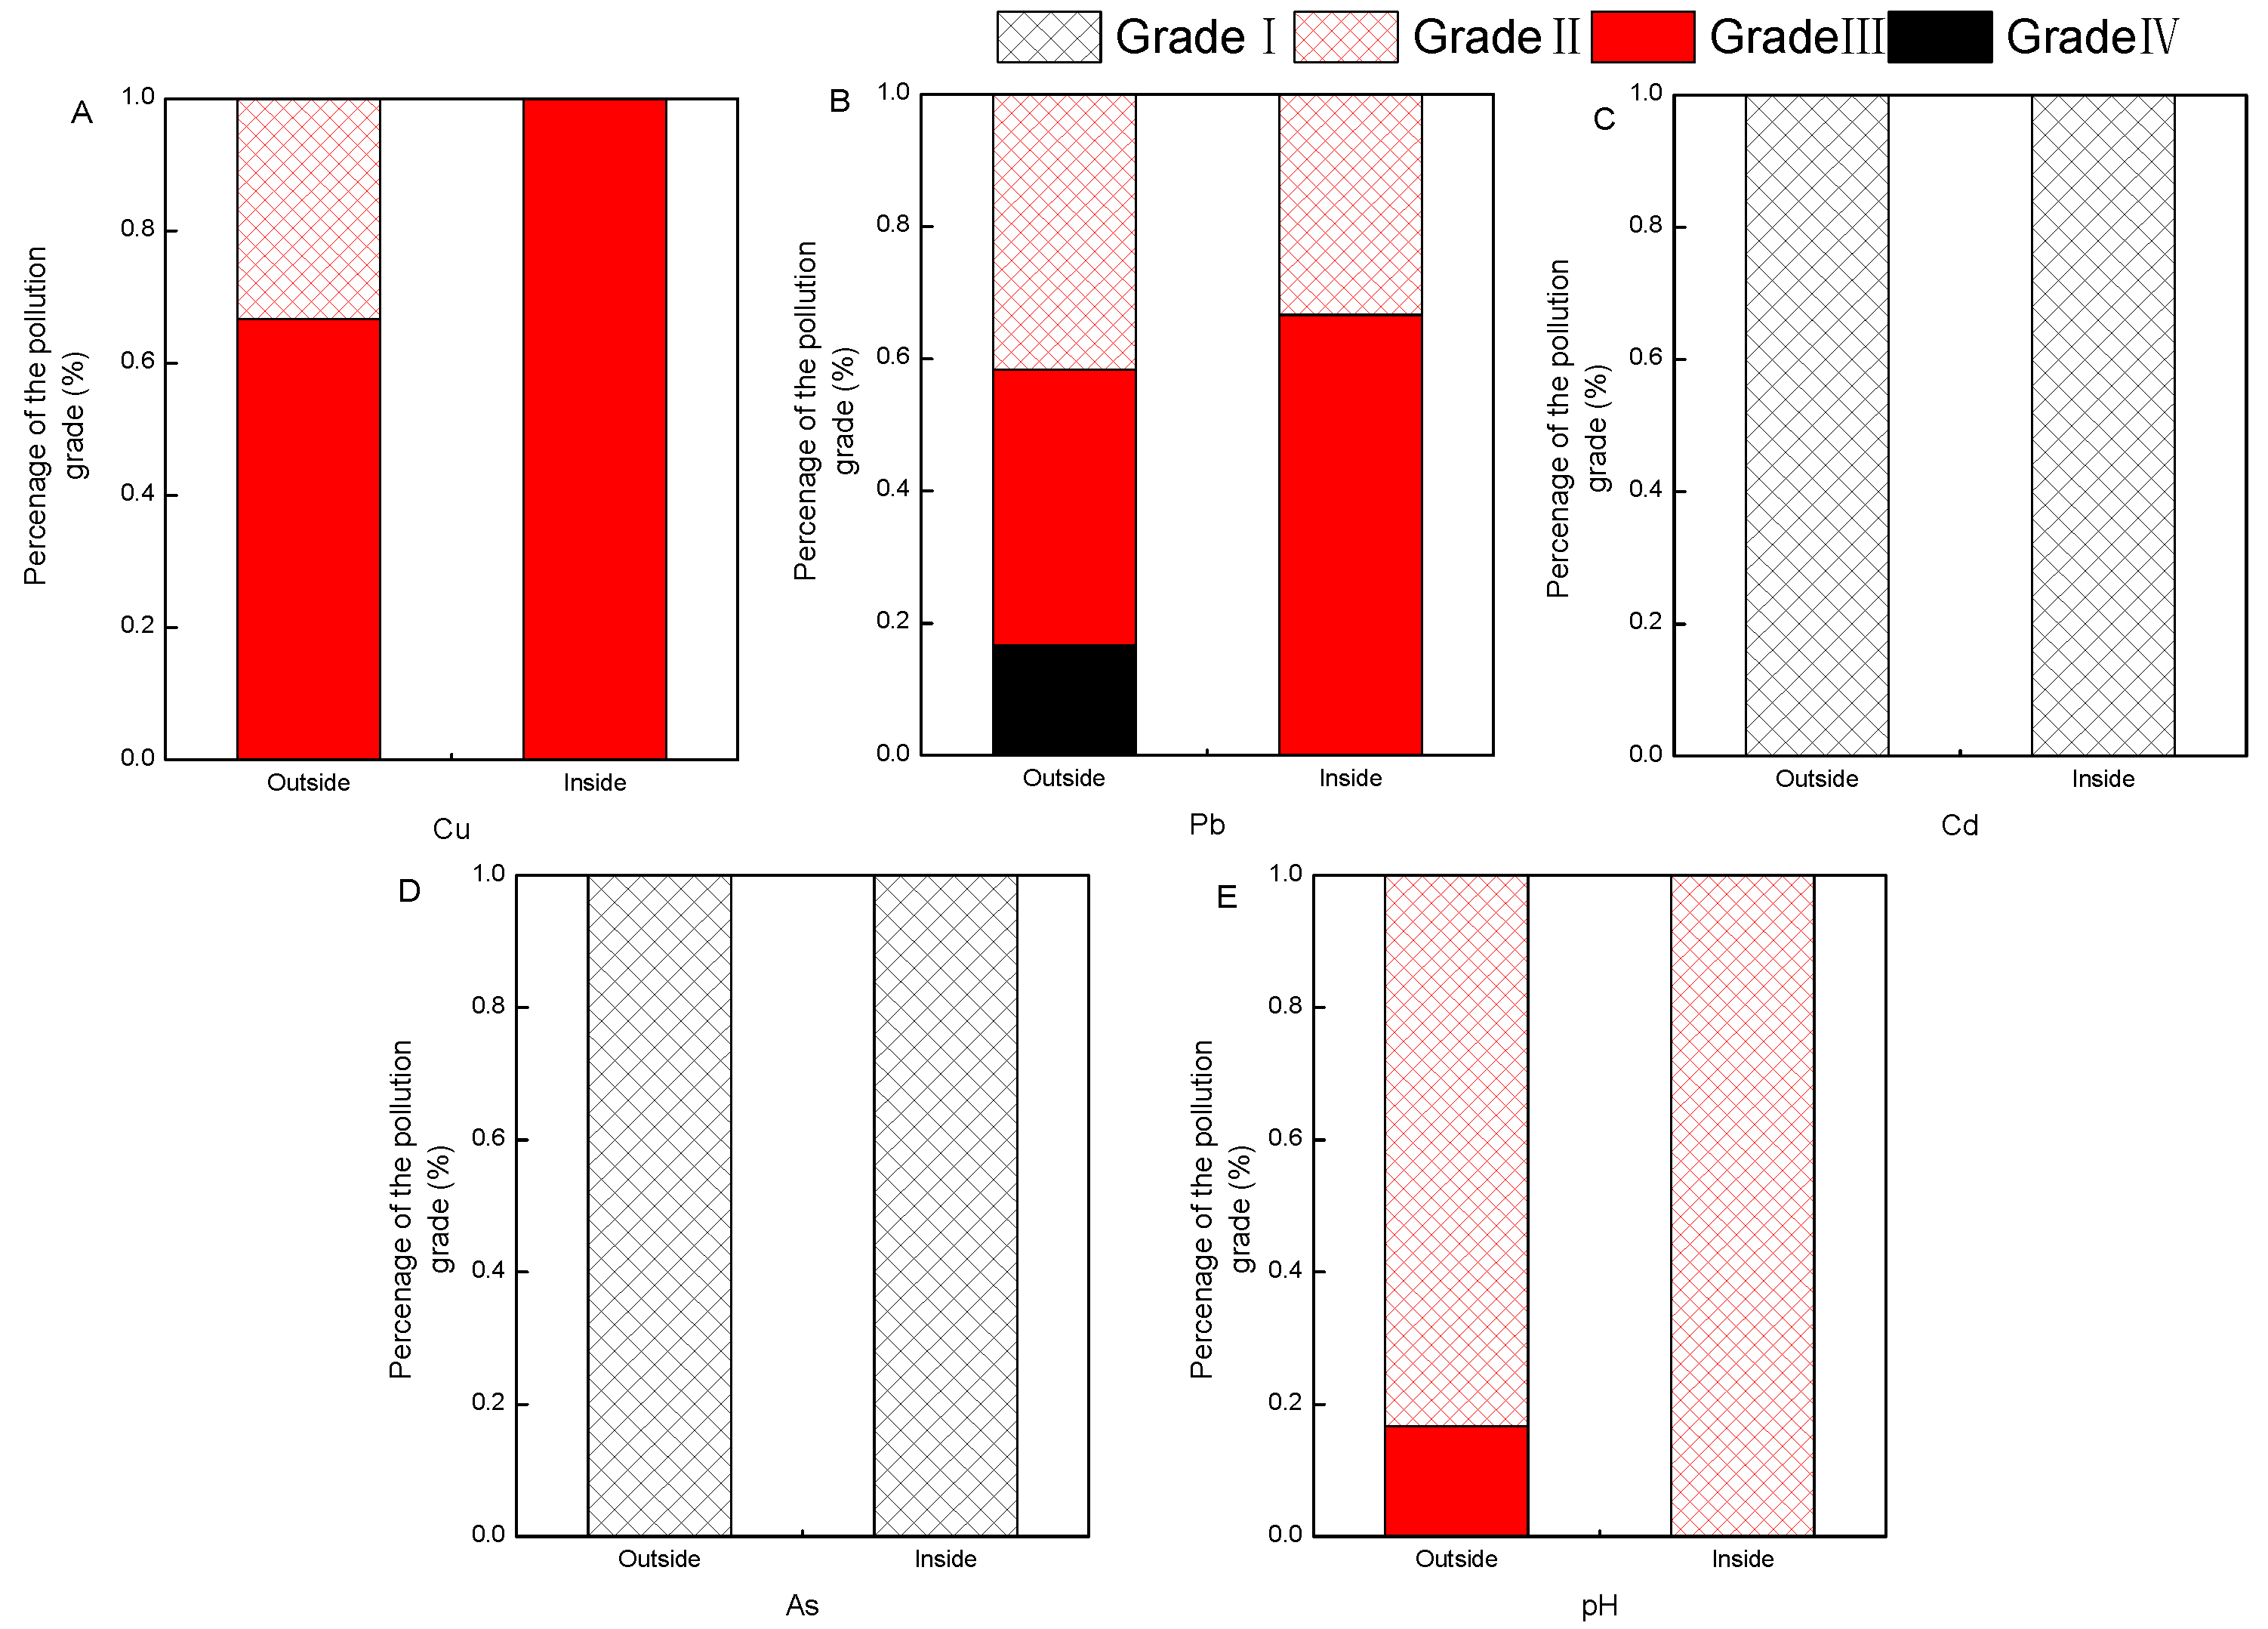
Water quality of collected tidal creek inside and outside the SYNR was analyzed based on the SF method; the water quality of the tidal creek inside and outside the SYNR belongs to Grade IV. The Cu concentrations in the water samples taken from the SYNR were all in Grades III and IV, while 33% of the water samples taken from outside the SYNR reached Grade II, and 67% of the water samples were in Grades III and IV (Figure 8A). The Pb concentrations in 33% of all the water samples from the tidal creek reached Grade II, and 33% of all the water samples from the tidal creek reached Grade III in the SYNR. The Pb concentrations in 42% of all the water samples from the tidal creek reached Grade II, 42% of all the water samples the from the tidal creek reached Grade III, and 17% of all the water samples from the tidal creek reached Grade IV outside the SYNR (Figure 8B). In all the water samples of the tidal creek in the SYNR, the pH of 100% samples reached Grade II, while the pH of 83% samples reached Grade II, and 17% samples reached Grade III, in all the water samples of the tidal creek outside the SYNR. Therefore, Cu in the tidal creek water of the SYNR was the key prevention and control target.

4. Conclusions

This study provided valuable evidence on the concentrations, spatial distribution, ecological risk assessment of nutrients and four heavy metals, and water quality in the water of the coastal tidal creek in the YRD, China. The average concentrations of TN, TP, NH4+-N, NO3-N, Cu, and Pb in the tidal creek water were 4.24 mg L−1, 0.06 mg L−1, 0.64 mg L−1, 0.56 mg L−1, 60.00 µg L−1, and 6.96 µg L−1, respectively; the concentration of As and Cd in the water of all sample sites was less than 0.50 µg L−1 and 0.09 µg L−1, respectively. The concentrations of TN, TP, and NH4+-N in the tidal creek water in the SYNR were lower than that outside the SYNR, while the concentrations of NO33-N had no obvious trend. The spatial distribution characteristics of different heavy metal contents in the tidal creek water were different. Along the coastline from northwest to southeast in the YRD, the Cu content of water in different sample sites increased, decreased, and then increased. The Pb content in the tidal creek water was significantly higher in the north of the YRD than that near and to the south of the Yellow River estuary.
The TN/TP mass ratio of the tidal creek water in the sample sites of the YRD all belonged to the potential phosphorus-restricted eutrophication state. The RI result indicated that Cu and Pb in the tidal creek water were at low ecological risk, while the RQ results showed that Cu in the water of the coastal tidal creek was at a high ecological risk level and had potential harm to aquatic organisms. In particular, the E r i of Cu in the water of the coastal tidal creek was of medium ecological risk in the SYNR. It was worth paying attention to Cu in the coastal tidal creek in the SYNR. Correlation analysis showed that TN, TP, and NO3-N sources were similar, and Pb and TP sources were similar. TDS, pH, and water temperature, as the important factors, affected the concentrations of TN, TP, Cu, and Pb in the tidal creek water of the YRD. According to the China National Seawater Quality Standard (GB3097-1997), the concentrations of Cd and As in the water of all the samples in the YRD reached Grade I, and the pH reached Grades I and II, while the concentration of Cu reached Grades III and IV, and the concentration of Pb reached Grade III. The SF method result indicated the water quality of the tidal creek inside and outside the SYNR belongs to Grade IV. In particular, Cu in the tidal creek water was the key prevention and control target to improve water quality in the SYNR.

Author Contributions

Conceptualization, Y.Q. and J.L.; methodology, Y.Q.; software, Y.Q., Y.Z., and G.F.; validation, Y.Q.; formal analysis, Y.Q.; investigation, Y.Q., G.F., and S.Z.; resources, J.L., X.G., and C.Z.; data curation, Y.Q.; writing—original draft preparation, Y.Q.; writing—review and editing, Y.Q.; visualization, Y.Q. and G.F.; supervision, and project administration, Y.Q. and C.Z.; funding acquisition, Y.Q. All authors have read and agreed to the published version of the manuscript.

Funding

This research was funded by Budget Surplus of Central Financial Science and Technology Plan: 2021-JY-05; the National Key Research and Development Program of China: 2017YFC0506200.

Data Availability Statement

The data presented in this study are available on request from the corresponding authors.

Conflicts of Interest

The authors declare no conflict of interest.

References

  1. Elturk, M.; Abdullah, R.; Zakaria, R.M.; Abu Bakar, N.K. Heavy metal contamination in mangrove sediments in Klang estuary, Malaysia: Implication of risk assessment. Estuar. Coast. Shelf Sci. 2019, 226, 106266. [Google Scholar] [CrossRef]
  2. Wang, X.; Xiao, X.; Zou, Z.; Chen, B.; Ma, J.; Dong, J.; Doughty, R.B.; Zhong, Q.; Qin, Y.; Dai, S.; et al. Tracking annual changes of coastal tidal flats in China during 1986–2016 through analyses of Landsat images with Google Earth Engine. Remote Sens. Environ. 2018, 238, 110987. [Google Scholar] [CrossRef] [PubMed]
  3. Wang, M.; Qi, S.; Zhang, X. Wetland loss and degradation in the Yellow River Delta, Shandong Province of China. Environ. Earth Sci. 2011, 67, 185–188. [Google Scholar] [CrossRef]
  4. Wang, C.; Du, J.; Gao, X.; Duan, Y.; Sheng, Y. Chemical characterization of naturally weathered oil residues in the sediment from Yellow River Delta, China. Mar. Pollut. Bull. 2011, 62, 2469–2475. [Google Scholar] [CrossRef]
  5. Sarmiento, G.N.R.; Sarmiento, N.V.R.; Delrieux, C.A.; Perillo, G.M. Morphological characterization of ponds and tidal courses in coastal wetlands using Google Earth imagery. Estuar. Coast. Shelf Sci. 2020, 246, 107041. [Google Scholar] [CrossRef]
  6. Depkin, F.C.; Estep, L.K.; Bryan, A.L.; Eldridge, C.S.; Brisbin, I.L. Comparison of wood stork foraging success and behavior in selected tidal and non-tidal habitats. Wilson Bull. 2005, 117, 386–389. [Google Scholar] [CrossRef]
  7. Fan, Y.; Zhou, D.; Ke, Y.; Wang, Y.; Wang, Q.; Zhang, L. Quantifying the Correlated Spatial Distributions between Tidal Creeks and Coastal Wetland Vegetation in the Yellow River Estuary. Wetlands 2020, 40, 2701–2711. [Google Scholar] [CrossRef]
  8. Zhu, M.C.; Cao, M.C.; Wang, Z.; Xu, H.G.; Wu, Y.; Zhao, J. Fuzzy Evaluation of Waterfowl Habitat Suitability at the Yellow River Delta Nature Reserve. J. Huazhong Normal Univ. 2015, 49, 287–294. [Google Scholar]
  9. Miao, X.Y.; Hao, Y.P.; Zhang, F.W.; Zou, S.Z.; Ye, S.Y.; Xie, Z.Q. Spatial distribution of heavy metals and their potential sources in the soil of Yellow River Delta: A traditional oil field in China. Environ. Geochem. Health 2020, 42, 709. [Google Scholar] [CrossRef] [Green Version]
  10. Yang, Y.W.; Sun, F.F.; Wang, S.S.; Zheng, M.Y.; Chen, J.F.; Tang, M.Z. Spatial Distribution Characteristics and Ecological risk Assessment of Heavy Metals in Surface Soils of The Yellow River Delta. Fresenius Environ. Bull. 2020, 29, 11317–11328. [Google Scholar]
  11. Xie, H.; Huang, C.; Li, J.; Zhang, Y.; Xu, X.; Liu, D.; Ouyang, Z. Strong Precipitation and Human Activity Spur Rapid Nitrate Deposition in Estuarine Delta: Multi-Isotope and Auxiliary Data Evidence. Int. J. Environ. Res. Public Health 2021, 18, 6221. [Google Scholar] [CrossRef] [PubMed]
  12. Sun, Z.; Mou, X.; Tong, C.; Wang, C.; Xie, Z.; Song, H.; Sun, W.; Lv, Y. Spatial variations and bioaccumulation of heavy metals in intertidal zone of the Yellow River estuary, China. CATENA 2015, 126, 43–52. [Google Scholar] [CrossRef]
  13. Yao, X.; Xiao, R.; Ma, Z.; Xie, Y.; Zhang, M.; Yu, F.-H. Distribution and contamination assessment of heavy metals in soils from tidal flat, oil exploitation zone and restored wetland in the Yellow River Estuary. Wetlands 2015, 36, 153–165. [Google Scholar] [CrossRef]
  14. Zhang, G.L.; Bai, J.H.; Zhao, Q.Q.; Lu, Q.Q.; Jia, J.; Wen, X.J. Heavy metals in wetland soils along a wetland-forming chrono-sequence in the Yellow River Delta of China: Levels, sources and toxic risks. Ecol. Indic. 2016, 69, 331–339. [Google Scholar] [CrossRef] [Green Version]
  15. Qi, Y.; Li, J.S.; Ma, Y.W.; He, J.; Fu, G.; Shen, Q.; Zhao, C.Y.; Cao, M. Distribution and risk assessment of heavy metals of surface sediments in intertidal flatsof the Yellow River Delta, China. Res. Environ. Sci. 2020, 33, 1488–1496. [Google Scholar]
  16. Fang, X.; Peng, B.; Wang, X.; Song, Z.; Zhou, D.; Wang, Q.; Qin, Z.; Tan, C. Distribution, contamination and source identification of heavy metals in bed sediments from the lower reaches of the Xiangjiang River in Hunan province, China. Sci. Total Environ. 2019, 689, 557–570. [Google Scholar] [CrossRef]
  17. Chen, R.; Chen, H.; Song, L.; Yao, Z.; Meng, F.; Teng, Y. Characterization and source apportionment of heavy metals in the sediments of Lake Tai (China) and its surrounding soils. Sci. Total Environ. 2019, 694, 133819. [Google Scholar] [CrossRef]
  18. Ali, H.; Khan, E.; Ilahi, I. Environmental Chemistry and Ecotoxicology of Hazardous Heavy Metals: Environmental Persistence, Toxicity, and Bioaccumulation. J. Chem. 2019, 2019, 6730305. [Google Scholar] [CrossRef] [Green Version]
  19. Xie, Z.; Zhao, G.; Sun, Z.; Liu, J. Comparison of arsenic and heavy metals contamination between existing wetlands and wetlands created by river diversion in the Yellow River estuary, China. Environ. Earth Sci. 2014, 72, 1667–1681. [Google Scholar] [CrossRef] [Green Version]
  20. Hossein, D.; Parvin, F.; Mehdi, M.; Faramarz, M. Preliminary Assessment of Heavy Metal Contamination in Water and Wastewater from Asaluyeh Port (Persian Gulf). Iran. J. Sci. Technol. Sci. 2017, 41, 363–373. [Google Scholar]
  21. Diaz, R.J.; Rosenberg, R. Spreading Dead Zones and Consequences for Marine Ecosystems. Science 2008, 321, 926–929. [Google Scholar] [CrossRef] [PubMed]
  22. Conley, D.J.; Paerl, H.W.; Howarth, R.W.; Boesch, D.F.; Seitzinger, S.P.; Havens, K.E.; Lancelot, C.; Likens, G.E. Ecology Controlling Eutrophication: Nitrogen and Phosphorus. Science 2009, 323, 1014–1015. [Google Scholar] [CrossRef]
  23. Li, X.; Hou, X.; Song, Y.; Shan, K.; Zhu, S.; Yu, X.; Mo, X. Assessing Changes of Habitat Quality for Shorebirds in Stopover Sites: A Case Study in Yellow River Delta, China. Wetlands 2018, 39, 67–77. [Google Scholar] [CrossRef]
  24. Yang, Y.; Li, J.; Zhang, F.; Sun, F.; Chen, J.; Tang, M. Impact of heavy metals on Ciconia boyciana feathers and Larus saundersi egg shells in the Yellow River delta estuary. RSC Adv. 2020, 10, 39396–39405. [Google Scholar] [CrossRef]
  25. Guo, W.D.; Zhang, X.M.; Yang, Y.P.; Hu, M.H. Potential eutrophication assessment for Chinese Coastal Waters. J. Oceanogr. Taiwan Strait. 1998, 1, 64–70. [Google Scholar]
  26. Zhang, L.; Cao, W.; Ma, Y.-Q.; Han, C.-N.; Qin, Y.-W.; Zhao, Y.-M.; Liu, Z.-C.; Yang, C.-C. Distribution of Nitrogen and Phosphorus in the Tidal Reach and Estuary of the Daliao River and Analysis of Potential Eutrophication. Huan Jing Ke Xue Huanjing Kexue 2016, 37, 1677–1684. [Google Scholar] [PubMed]
  27. Han, D.; Cheng, J.; Hu, X.; Jiang, Z.; Mo, L.; Xu, H.; Ma, Y.; Chen, X.; Wang, H. Spatial distribution, risk assessment and source identification of heavy metals in sediments of the Yangtze River Estuary, China. Mar. Pollut. Bull. 2016, 115, 141–148. [Google Scholar] [CrossRef]
  28. Hakanson, L. An ecological risk index for aquatic pollution-control-asedimentological approach. Water Res. 1980, 14, 975–1001. [Google Scholar] [CrossRef]
  29. Razak, M.R.; Aris, A.Z.; Zakaria, N.A.C.; Wee, S.Y.; Ismail, N.A.H. Accumulation and risk assessment of heavy metals em-ploying species sensitivity distributions in Linggi River, Negeri Sembilan, Malaysia. Ecotoxicol. Environ. Saf. 2021, 211, 111905. [Google Scholar] [CrossRef]
  30. Fu, G.; Qi, Y.; Li, J.; Zhao, C.; He, J.; Ma, Y.; Zhu, J. Spatial Distributions of Nitrogen and Phosphorus in Surface Sediments in Intertidal Flats of the Yellow River Delta, China. Water 2021, 13, 2899. [Google Scholar] [CrossRef]
  31. Tong, Y.; Zhao, Y.; Zhen, G.; Chi, J.; Liu, X.; Lu, Y.; Wang, X.; Yao, R.; Chen, J.; Zhang, W. Nutrient Loads Flowing into Coastal Waters from the Main Rivers of China (2006–2012). Sci. Rep. 2015, 5, 16678. [Google Scholar] [CrossRef] [PubMed]
  32. Sun, D.; Duan, D.X.; Liu, H.C.; Zhang, J.L.; Wang, Z.Z.; Chen, J.P.; Chen, S.J.; Du, X.H.; Gong, J.X. Investigation and Study on Fishery Aquatic Environments in the Yellow River Estuary. Adv. Mar. Sci. 2010, 28, 229–236. [Google Scholar]
  33. Liu, F.; Dong, G.C.; Qin, Y.G.; Liu, C.; Zhu, S.W. Investigation on Water Pollution of Four Rivers in Coastal Wetland of Yellow River Estuary. J. Anhui Agri. Sci. 2012, 40, 441–444. [Google Scholar]
  34. Smith, V.H. The nitrogen and phosphorus dependence of algal biomass in lakes: An empirical and theoretical analysis1. Limnol. Oceanogr. 1982, 27, 1101–1111. [Google Scholar] [CrossRef]
  35. Luo, G.Y.; Kang, K.; Zhu, L. Relationship between the Period and Quantity of Algae Peodution and TN/TP in water. J. Chongqing Univ. 2007, 30, 142–146. [Google Scholar]
  36. Song, N.; Wang, N.; Wu, N.; Lin, W. Temporal and spatial distribution of harmful algal blooms in the Bohai Sea during 1952~2016 based on GIS. China Environ. Sci. 2018, 38, 1142–1148. [Google Scholar]
  37. Tian, K.; Wu, Q.M.; Liu, P.; Hu, W.Y.; Huang, B.; Shi, B.; Zhou, Y.Q.; Kwon, B.O.; Choi, K.; Ryu, J.; et al. Eco-logical risk assessment of heavy metals in sediments and water from the coastal areas of the Bohai Sea and the Yellow Sea. Environ. Int. 2020, 136, 105512. [Google Scholar] [CrossRef]
  38. Lin, H.; Li, H.; Yang, X.; Xu, Z.; Tong, Y.; Yu, X. Comprehensive Investigation and Assessment of Nutrient and Heavy Metal Contamination in the Surface Water of Coastal Bohai Sea in China. J. Ocean Univ. China 2020, 19, 843–852. [Google Scholar] [CrossRef]
  39. Peng, S. The nutrient, total petroleum hydrocarbon and heavy metal contents inthe seawater of Bohai Bay, China: Tem-poral-spatial variations, sources, pollution statuses, and ecological risks. Mar. Pollut. Bull. 2015, 95, 445–451. [Google Scholar] [CrossRef]
  40. Zhang, D.; Pei, S.; Duan, G.; Feng, X.; Zhang, Y.; Wu, J. The Pollution Level, Spatial and Temporal Distribution Trend and Risk Assessment of Heavy Metals in Bohai Sea of China. J. Coast. Res. 2020, 115, 354–360. [Google Scholar] [CrossRef]
  41. Lu, D.W.; Zheng, B.; Fang, Y.; Shen, G.; Liu, H.J. Distribution and pollution assessment of trace metals inseawater and sediment in Laizhou Bay. China J. Oceanol. Limn. 2015, 33, 1053–1061. [Google Scholar] [CrossRef]
  42. Hu, N.-J.; Huang, P.; Liu, J.-H.; Shi, X.-F.; Ma, D.-Y.; Zhu, A.-M.; Zhang, J.; Zhang, H.; He, L.-H. Tracking lead origin in the Yellow River Estuary and nearby Bohai Sea based on its isotopic composition. Estuar. Coast. Shelf Sci. 2015, 163, 99–107. [Google Scholar] [CrossRef]
  43. Liu, M.; Fan, D.J.; Zheng, S.W.; Tian, Y.; Zhang, A.B. Tracking Lead Origins in the Central Bohai Sea Based on Stable Lead Isotone Composition. Haiyang Xuebao 2016, 38, 36–47. [Google Scholar]
  44. Wang, F.; Liao, J.; Mao, D.; Sun, C.; Yang, S.; Zhou, J.; Liu, H.; Gao, S.; Li, M. Aquatic Quality Criteria and Ecological Risk Assessment for Lead in Typical Waters of China. Asian J. Ecotoxicol. 2017, 12, 434–445. [Google Scholar]
  45. Zhang, A.G.; Wang, L.L.; Zhao, S.L.; Yang, X.L.; Zhao, Q.; Zhang, X.H.; Yuan, X.T. Heavy metals in seawater and sediments from the northern LiaodongBay of China: Levels, distribution and potential risks. Reg. Stud. Mar. Sci. 2017, 11, 32–42. [Google Scholar] [CrossRef]
Figure 1. Location of sample sites in the study area. (a). Location of the study area; (b). Location of the samples sites.
Water 14 00713 g001
Figure 2. TN (A), TP (B), NO3-N and NH4+-N (C) concentrations in the water of tidal creek at 7 sample sites. (a–c) Significant differences in N and P concentration among sample sites (p < 0.05).
Water 14 00713 g002aWater 14 00713 g002b
Figure 3. TN/TP mass ratios in tidal creek water of 7 sample sites.
Water 14 00713 g003
Figure 4. Cu and Pb concentrations in the water of tidal creek at 7 sample sites. (a–c) Significant differences in Cu and Pb concentrations among sample sites (p < 0.05).
Water 14 00713 g004
Figure 5. The E r i and RI of heavy metals in the water of coastal tidal creek at 7 sample sites of the YRD. (A): The E r i of Cu in the water; (B): The E_r^i of Pb in the water; (C): The RI of Cu in the water.
Water 14 00713 g005aWater 14 00713 g005b
Figure 6. SSD of Cu and Pb.
Water 14 00713 g006
Figure 7. RQ of Cu (A) and Pb (B) in different sample sites.
Water 14 00713 g007
Figure 8. Comparison of the pollution status of tidal creek water inside and outside Shandong Yellow River Delta National Nature Reserve. (A): The percentage of water samples with different grades of Cu pollution; (B): The percentage of water samples with different grades of Pb pollution; (C): The percentage of water samples with different grades of Cd pollution; (D): The percentage of water samples with different grades of As pollution; (E): The percentage of water samples with different grades of pH.
Water 14 00713 g008
Table 1. Classification of potential eutrophication levels.
GradeEutrophication LevelsInorganic Nitrogen Content (mg L−1)Labile Phosphate
(mg L−1)
N/P Mass Ratio
IOligotrophication<0.20<0.038–30
IIModerate trophication0.20–0.300.03–0.0458–30
IIIEutrophication>0.30>0.0458–30
IVPP-limited moderate trophication0.20–0.30->30
VPModerate P-limited potential eutrophication>0.30-30–60
VIPP-limited potential eutrophication>0.30->60
IVNN-limited moderate trophication-0.03–0.045<8
VNModerate N-limited potential eutrophication->0.0454–8
VINN-limited potential eutrophication->0.045<4
Table 2. Heavy metal concentration standard in China National Seawater Quality Standard (GB3097-1997).
Grade *CdAsPbCupH
(mg L−1)
Grade I≤0.001≤0.020≤0.001≤0.0057.8–8.5
Grade II≤0.005≤0.030≤0.005≤0.0107.8–8.5
Grade III≤0.010≤0.050≤0.010≤0.0506.8–8.8
Grade IV≤0.010≤0.050≤0.050≤0.0506.8–8.8
* Grade I refers to the fairly clean seawater for mariculture, nature reserve, and endangered species reserve. Grade II refers to the clean seawater for marine aquiculture and human recreation leisure activities. Grade III refers to the seawater for industry and tourism sites; Grade IV refers to the seawater for seaports and sea development operations.
Table 3. Metal toxicity coefficient table.
Heavy MetalCdAsPbCu
Toxicity coefficient301055
Table 4. Classification of E r i and RI.
E r i Ecological RiskRIEcological Risk
E r i ≤ 40Low ecological riskRI ≤ 150Low ecological risk
40 < E r i ≤ 80Moderate ecological risk150 < RI ≤ 300Moderate ecological risk
80< E r i ≤160Considerable ecological risk300 < RI ≤ 600Considerable ecological risk
160 < E r i ≤320High ecological risk600 < RIHigh ecological risk
320 < E r i Very high ecological risk--
Table 5. Risk classification of RQ.
Risk LevelRQ
No risk<0.01
Low risk0.01–0.1
Medium risk0.1–1
High risk≥1
Table 6. Statistical values of Cu and Pb toxicity data.
MetalsSpecies GroupsNumber of SpeciesRange of Toxicity Value (μg L−1)Distribution Type
CuFish (69), crustaceans (17), invertebrates (8), algae (4), amphibians (14), worms (10)1221.98–258853.00Logarithmic normal
PbFish (16), crustaceans (6), invertebrates (6), algae (1), worms (2)31262.58–1508009.00Logarithmic normal
Table 7. Comparison of N and P in the water of YRD and its coastal water.
Study AreaSampling DateAverage Concentration/(mg L−1)TN/TPReference
TNNH4+-NNO3-NTP
Coastal tidal creeks near the Yellow River Estuary20173.690.610.370.02185This study
Coastal tidal creeks in the YRD20174.240.560.640.0658This study
The Yellow River Estuary20080.37–0.540.04–0.050.13–0.280.02–0.03-[32]
Guangli River, Shenxiangou River, Tiao River, and Chao River in the YRD200911.653.410.490.4924[33]
Guangli River, Shenxiangou River, Tiao River, and Chao River in the YRD20107.665.540.640.4019[33]
The Yellow River Estuary20120.950.40-0.0424[31]
Table 8. Comparison of the heavy metal concentration in water of the Bohai Sea and surrounding the Bohai Sea.
Study AreaSampling TimeAverage Concentration/(µg L−1)Reference
CuCdPbAs
Coastal tidal creeks in YRD201760.00<0.506.96<0.09This study
Estuary and coastal waters around Bohai Sea2018101.740.3847.0064.01[37]
Coastal Bohai Sea20172.240.241.101.96[38]
Seawater of Bohai Bay2007–20120.16–7.170.02–0.680.17–9.550.25–4.02[39]
Seawater in the Yellow River Estuary20171.830.141.341.18[38]
The Yellow River Estuary20171.700.151.501.00[40]
Seawater of Laizhou Bay20172.740.200.942.25[38]
Seawater of Laizhou Bay201015.880.280.881.40[41]
Table 9. HC5 and RQ of Cu and Pb.
MetalsCuPb
HC56.8395.77
PNEC3.4147.88
RQ16.90 0.15
Table 10. Pearson correlation coefficients for nitrogen, phosphorus, heavy metals, and physical and chemical indexes of tidal creek water.
TNTPNO3-NNH4+-NCuPbpHORPTDS
TP0.634 **1
NO3-N0.542 *0.533 *1
NH4+-N−0.574 **−0.518 *−0.1081
Cu0.3580.007−0.040−0.502 *1
Pb0.3020.571 **0.268−0.456 *0.4161
pH−0.475 *−0.0800.0260.536 *−0.879 **−0.2411
ORP−0.252−0.433 *−0.554 **0.041−0.076−0.1610.1111
TDS0.000−0.578 **−0.535 *−0.0990.634 **−0.178−0.605 **0.546 *1
Temperature−0.739 **−0.853 **−0.558 **0.559 **−0.291−0.598 **0.2790.447 *0.340
Note: * represents correlation significance, ns: not significant; * p < 0.05; ** p < 0.01.
Publisher’s Note: MDPI stays neutral with regard to jurisdictional claims in published maps and institutional affiliations.

