
Experimental Outdoor Public Lighting Installation Powered by a Hydraulic Turbine Installed in the Municipal Water Supply Network


Proyectos de Ingeniería, Department de Expresión Gráfica Diseño y Proyectos, Universidad de Málaga, 29071 Malaga, Spain
*
Author to whom correspondence should be addressed.
Water 2022, 14(5), 710; https://doi.org/10.3390/w14050710
Submission received: 26 October 2021
/
Revised: 18 February 2022
/
Accepted: 21 February 2022
/
Published: 23 February 2022
(This article belongs to the Special Issue Efficient Water and Energy Management in Urban Water Systems)
Abstract
:Sustainability and energy prices make the use of energy obtained from renewable sources on an urban scale and for isolated local facilities necessary for municipal authorities. Moreover, when the demand of energy is at night, as for street lighting installations, the use of accumulative systems is necessary, which means a major drawback due to a short lifetime expectancy and high cost. The use of batteries can require more than 70% of the budget of these lighting systems and has a critical impact in the project. The problem to solve is finding different renewable energy sources that can produce energy throughout the day, especially during the night, at the same time at which it is consumed. As one of the competences of municipal authorities is water supply networks, this paper analyzes the use of energy recovery turbines within these installations as an alternative to photovoltaic generators. To study the viability and effectiveness of this alternative, the water flows available in the network of a medium-size municipality were monitored and analyzed in depth to assess the amount of recoverable energy. In addition, an energy recovery turbine (ERT) station was set up, installing a bypass around one of the pressure-reducing valves (PRV) of the installation where energy is dissipated without practical use. The results obtained imply that the system proposed has economical and technical viability, is reliable and guarantees full service in all the seasons’ conditions. Moreover, the needs of the energy storage capacity are much lower (~8%) than with solar panels.
1. Introduction
Energy is one of the main issues discussed worldwide, mainly due to the concerns regarding climate change and the regulatory compliance in terms of greenhouse gases emissions. The continued concerns of the population over energy price increases and climate change issues have led towards a need for alternative and new energy sources.
The spread of renewable energy technologies and the need to improve energy efficiency are considered, nowadays, major priorities to be addressed by governments in order to achieve such long-term sustainable objectives. For example, the roadmap of the European Commission to transform the energy production and the economy into a low-carbon model by 2050 was developed in this context [1,2]. This declaration of intentions reflects the need to develop actions to make the European economy more climate-friendly, allowing the reduction of carbon dioxide emissions by 40%, the increase in energy efficiency by 27% and the rise of Renewable Energy Systems (RES)-based energy consumption by 27% before 2030. [3]. However, CO2 emissions increased worldwide by 1.6% in 2017 and about 2.7% in 2018 [4].
More recent strategic policies and regulations dealing with market liberalization and decarbonization plans, such as the European Directives contained in the recent EU Clean Energy for All Europeans Package energy rulebook [5], are seeking to promote new roles for citizens and local governments in the management of self-produced renewable energy [6]. These strategies need to be linked to an increase in multidisciplinary efficiency techniques and technologies being introduced in the consumption market [7].
As considered by the previous referenced authors, the intended objectives will be possible only if significant changes in territorial and environmental legislation planning are promoted. This must be done not only by encouraging the reduction of the absolute energy consumption values, but also through the implementation of technological advances and the increase of the energy efficiency of all the processes involved. In this sense, a discourse to connect the municipal role for energy generation and consumption transitions in a decentralized context is being developed worldwide [8,9,10].
Local authorities can contribute to the goal of CO2 emission reductions by investing in local renewable electricity generation installations, improving the energy efficiency of their owned installations or recovering energy that is being wasted within them [11]. Under these premises, a rising number of municipalities worldwide are striving for energy self-sufficiency, considered as the capability to cover their energy needs, as much as possible, using local energy sources. This is being done by shifting towards a more distributed energy supply scenario against the extended principle of an energy system based on a centralized energy supply driven by large organizations [12].
From an economic point of view, this understanding allows municipalities to achieve their own objectives for economic development while they decrease their dependency on energy distribution companies and seek more affordable costs for this resource. Moreover, these policies also have implications for ecological and social factors that influence local government decision-making patterns to shape the transition of the energy system towards a more sustainable scenario.
This transition is encouraging research on decentralized energy supply systems, and many developed solutions are often based on renewable energy technologies [13]. Some options may be conducted through large investments in energy plants dedicated to generating energy locally under municipal business models with the structure of cooperatives or similar [14]. However, there are other alternatives, such as the implementation of small-scale distributed energy generation systems for auto-consumption in specific infrastructures. These alternatives can be implemented by all types of municipalities to help increase the energy self-sufficiency of their territories [15,16].
According to the literature, smart renewable energy systems applied at the Urban Level include:
- Solar Thermal: Solar collectors on the rooftops of municipal buildings, swimming pool facilities, sport buildings and schools, including both flat-plate and parabolic solar collectors [19].
- Wind Energy: Promotion of locally owned wind turbines [20].
- Hydroelectric Power: Mini-hydroelectric plants constructed on municipal waterworks where rivers are available. This solution, however, is encountering social rejection due to the associated negative environmental impacts [21].
- Combined Heat and Power: Simultaneous production of heat and power in cogeneration plants and biomass-based combined heat and power plants [23].
- Waste Management: Upholding the need for separate waste collection to increase the recycling of municipal solid waste and the use of organic waste for biogas production. Wastewater Treatment Plants (WWTPs) provide bioenergy based on cooking fats and oils, road grit and nutrients such as carbon, nitrogen and phosphorous [24,25].
- Water Distribution Management: The potential for energy recovery exists at any point within a water distribution system where the mechanical energy of excess water pressure can be converted into electrical energy. This energy conversion decreases the average operating pressure within a system, which, in turn, reduces water losses from leakages in the system [26].
This paper studies and tests a technical proposal within this last dimension of recovering energy from urban water supply and distribution systems, where an excess of pressure requires its dissipation, and using that, in an efficient way, in other municipal installations. This energy is commonly dissipated using pressure-reducing valves (PRV) that adapt the arrival pressure of the water to the end-point requirements (consumption, intermediate storage, etc.) to avoid the deterioration of the elements that make up these end-point devices [27]. The energy recovery and pressure adaptation must be carried out without altering the conditions of the water supply to the population, such as the pressure and flow required. From the beginning of the last decade, a large number of previous research works have presented studies related to PRV replacement or their combination with energy recovery devices that address different implementation architectures and different efficiency and reliability analyses, showing an improvement of performance with time [26,28,29,30,31,32,33,34,35,36,37,38,39,40]. However, the relevance and overall performance of these installations are also linked to the use that is executed of the energy generated. In these cases, requirements of large energy storage or transportation may generate a source of significant losses in efficiency.
In this work, a novel case study was explored to evaluate the technical, economic and environmental viability of electricity generation with Energy Recovery Turbines (ERT) to power a specific facility within the same municipal context, the outdoor public lighting installation. An appropriate location of the ERT, within an existing drinking water distribution network, and its sizing were chosen based on maximizing the recovered energy and enabling a more resilient network infrastructure.
This study also considered the analysis of scheduling the flow of liquid to synchronize the water displacement required from the reservoirs of the water distribution network with the periods where energy was required in the connected load, as indicated by Telci and Aral [41]. In our case, the generation of energy at night was maximized without altering the normal operation of the installation due to the nature of the installation that was powered. Thus, it could be used at the same time as it was generated, minimizing the need of storage to power an outdoor public lighting installation. Overall, this is an innovative global approach to the topic of energy recovery from water distribution networks with ERTs, involving the generation equipment but also the scheduling of the water flowing in the network toward the ERT to synchronize the energy generation with its demand from the light points, which had not been sufficiently developed in the scientific literature. This coordination capability existing between the energy recovery for water distribution networks and outdoor lighting is still a field of study undeveloped in the literature compared to the extensive research on the use of wind and solar generators for autonomous luminaires, which alone cannot guarantee service reliability.
Based on different designs (Pelton, Francis, Kaplan, Banki, Turgo, etc.), hydraulic turbines are built to produce large amounts of energy, such as hundreds or thousands of kilowatts. However, as stated by Alberizzi et al., “the main drawbacks of micro-hydropower projects with traditional turbines are their initial capital cost (which can reach about 25% of the installation one), the maintenance costs and the availability of spare parts” [42]. Other technologies have allowed the appearance of so-called hydraulic micro turbines or, similarly, Pump as Turbines (PATs). Because of their internal design, these devices allow for capturing of the hydraulic energy of the water through a reverse rotational movement to convert it into electrical energy. The interest in PATs is based on “their capability to operate under operating conditions that conventional hydraulic turbines can barely cover (i.e., flow rates ranging from 10 to 1800 m3/h and a head ranging from 10 to 100 m)” [43]. Other main advantages of using PATs compared to conventional turbines is their low cost, since they take advantage of the massive production of pumps worldwide and allow a wide range of hydraulic solutions to be offered [44]. Moreover, PATs do not require qualified operators, and the reduction of efficiency with respect to traditional or specific turbines is compensated by the lower installation and maintenance costs [45].
On the other hand, PATs have suffered from a lack of performance information provided by the manufacturers, who do not usually test their machines in reverse mode [46]. Many researchers have tried different PAT efficiency prediction methods in vain, as their predicted results never got validated through experimentation (±20% errors) and could not cover the wide range of possible pump operating conditions when working in reverse mode [47]. In these cases, the assessment of the PAT’s performance in real flow and pressure conditions needed to be analyzed in each installation [45].
Furthermore, “the installation and the control strategy of a PAT must consider the variability of both the pressure and flow rates, which continuously change in a water distribution network” [43]. A priori, PATs lack hydraulic regulation control, and they need constant operating conditions to work properly. Different flow rate regulation control methods can be applied in order to guarantee adequate working conditions. As upstream pressure depends on the flow-rate pattern, to assure that backpressure remains almost constant according to the user demand, the PATs can be installed in series downstream of a PRV or in parallel using a bypass line with its own PRV. In these cases, mechanical devices, such as automated valves and hydraulic bypass ducts (hydraulic regulation), are needed [6]. In addition to hydraulic–electric regulation or, as a substitute, electric regulation, it is possible to consider a variable rotational speed control of the PAT by means of a frequency inverter or similar [6]. At the present time, the increasing demand on these kinds of equipment has resulted in the fact that several companies specialized in this market have standardized their products for this purpose, and they control the load variations through electronic control architectures that complement the installation of their equipment [39].
Nowadays, about 21% of the electricity generated on the planet is consumed to generate light: 18% in indoor and 3% in outdoor environments [48]. In Europe, it is estimated that cities need to spend, on average, 40% of their budget to pay for this energy [49].
Solar PV lighting is a major alternative to reduce these electricity expenses, and installations with this technology are being widely promoted and developed. The global solar street-lighting market size was valued at $5.7 billion, with sales of 1,545,900 lighting units in 2019, and it is projected to witness a sustained increase of 9.4% during the forecast period of 2020–2030. Furthermore, in 2019, this standalone category witnessed the fastest growth in the solar street-lighting market, and it is expected to maintain its pace over the forecast period [50].
Large solar street-lighting projects are being implemented in developing countries such as India (in December 2018, the second phase of the Atal Jyoti Yojana (AJAY) program was launched to provide the financing and installation of over 3 million solar streetlights around the country [51]) or Benin (in November 2019, the French company Fonroche Éclairage was selected to supply and install solar street lamps in several localities of the country, with an estimated value of US $24.2 million). However, the major investors in this technology are the developed countries: USA, Europe and, mainly, countries of the Asia Pacific Region (APAC). According to the International Energy Agency (IEA), in 2019, China was the largest market in the APAC region for the implementation of solar lighting system solutions and accounted for a 42.8% share in the total global solar PV capacity [52]. All those countries have large drinkable water distribution networks.
Thus, and for that same purpose, the energy generation from water pressure waste and consumption can be located very close to lighting facilities and used to power them in a different but even more sustainable way. This is because they share locations in the streets of the municipality, and the energy generation can be programmed at the time when it is needed overnight by adequately shifting the recharge periods of municipal deposits. This eliminates the need to store the energy that is generated, or at least a major part of it, before using it. Thus, this approach can solve the main drawback of the most widespread choice to combine renewable energy and lighting, that is, the PV luminaires. In this case, all the energy used to run the installation needs to be stored in batteries, as it is generated and consumed at opposite moments of the day. In one autonomous lighting installation placed on latitudes over the tropics, batteries could cost about 70% of the total budget of the installation, and they were the required element with the lowest lifetime expectation [53].
In decentralized energy recovery systems from water installations, other recent and emerging technologies toward energy storage are being developed based on Compressed Air Energy Storage, such as micro-CAES or TI-CAES. They solve several major drawbacks of batteries, such as durability, and might provide more economic solutions due to a modular design and lower operating costs [54,55]. However, as indicated previously, it is intended that, in the solution here studied, the energy storage systems become minimal and its weight of relevance is reduced significantly.
Another major point of analysis concerns the reliability of the service of the lighting installations, which is the other important disadvantage of the autonomous PV luminaires [56]. While the appearance of several rainy days or cloudy weather will diminish the lighting output or even the shutdown of the luminaires, the systems based on ERT in water networks should prove to be more reliable and stable, as the consumption of drinkable water by the population is found to be sustained in all the seasons of the year.
2. Materials and Methods
An experimental study was performed by means of an installation, with civil works, of an ERT placed in parallel with a PRV within the water network of the municipality of Cártama, Málaga (Spain) [36°44′59.47″ N and 4°35′36.76″ W]. This municipality is located in a valley in the basin of a river flanked by two moderate geographical reliefs (mountains) on its lateral slopes that generate geographical unevenness of a certain value in its territory. This has an influence on its water distribution network, as the difference in height between the main reservoir and several water consumption locations generates a significant potential energy, which was the one to be recovered. The results obtained can be extrapolated to any other municipality with similar topographic conditions and including a difference in height between water deposits (principal and train reservoirs) to make the scheduled daily distribution of water possible. This is a very common scenario not only in our specific region (south of Spain, Europe) [57] but in any place where regular mountain ranges and rivers are found nearby municipalities.
The installation was monitored initially for 12 months to evaluate the energy available in this municipal water distribution network between the principal deposit and a train reservoir throughout an entire calendar year, obtaining energy generation values and assessing the strengths and weaknesses of the system.
2.1. Description of the Drinking Water Distribution Network
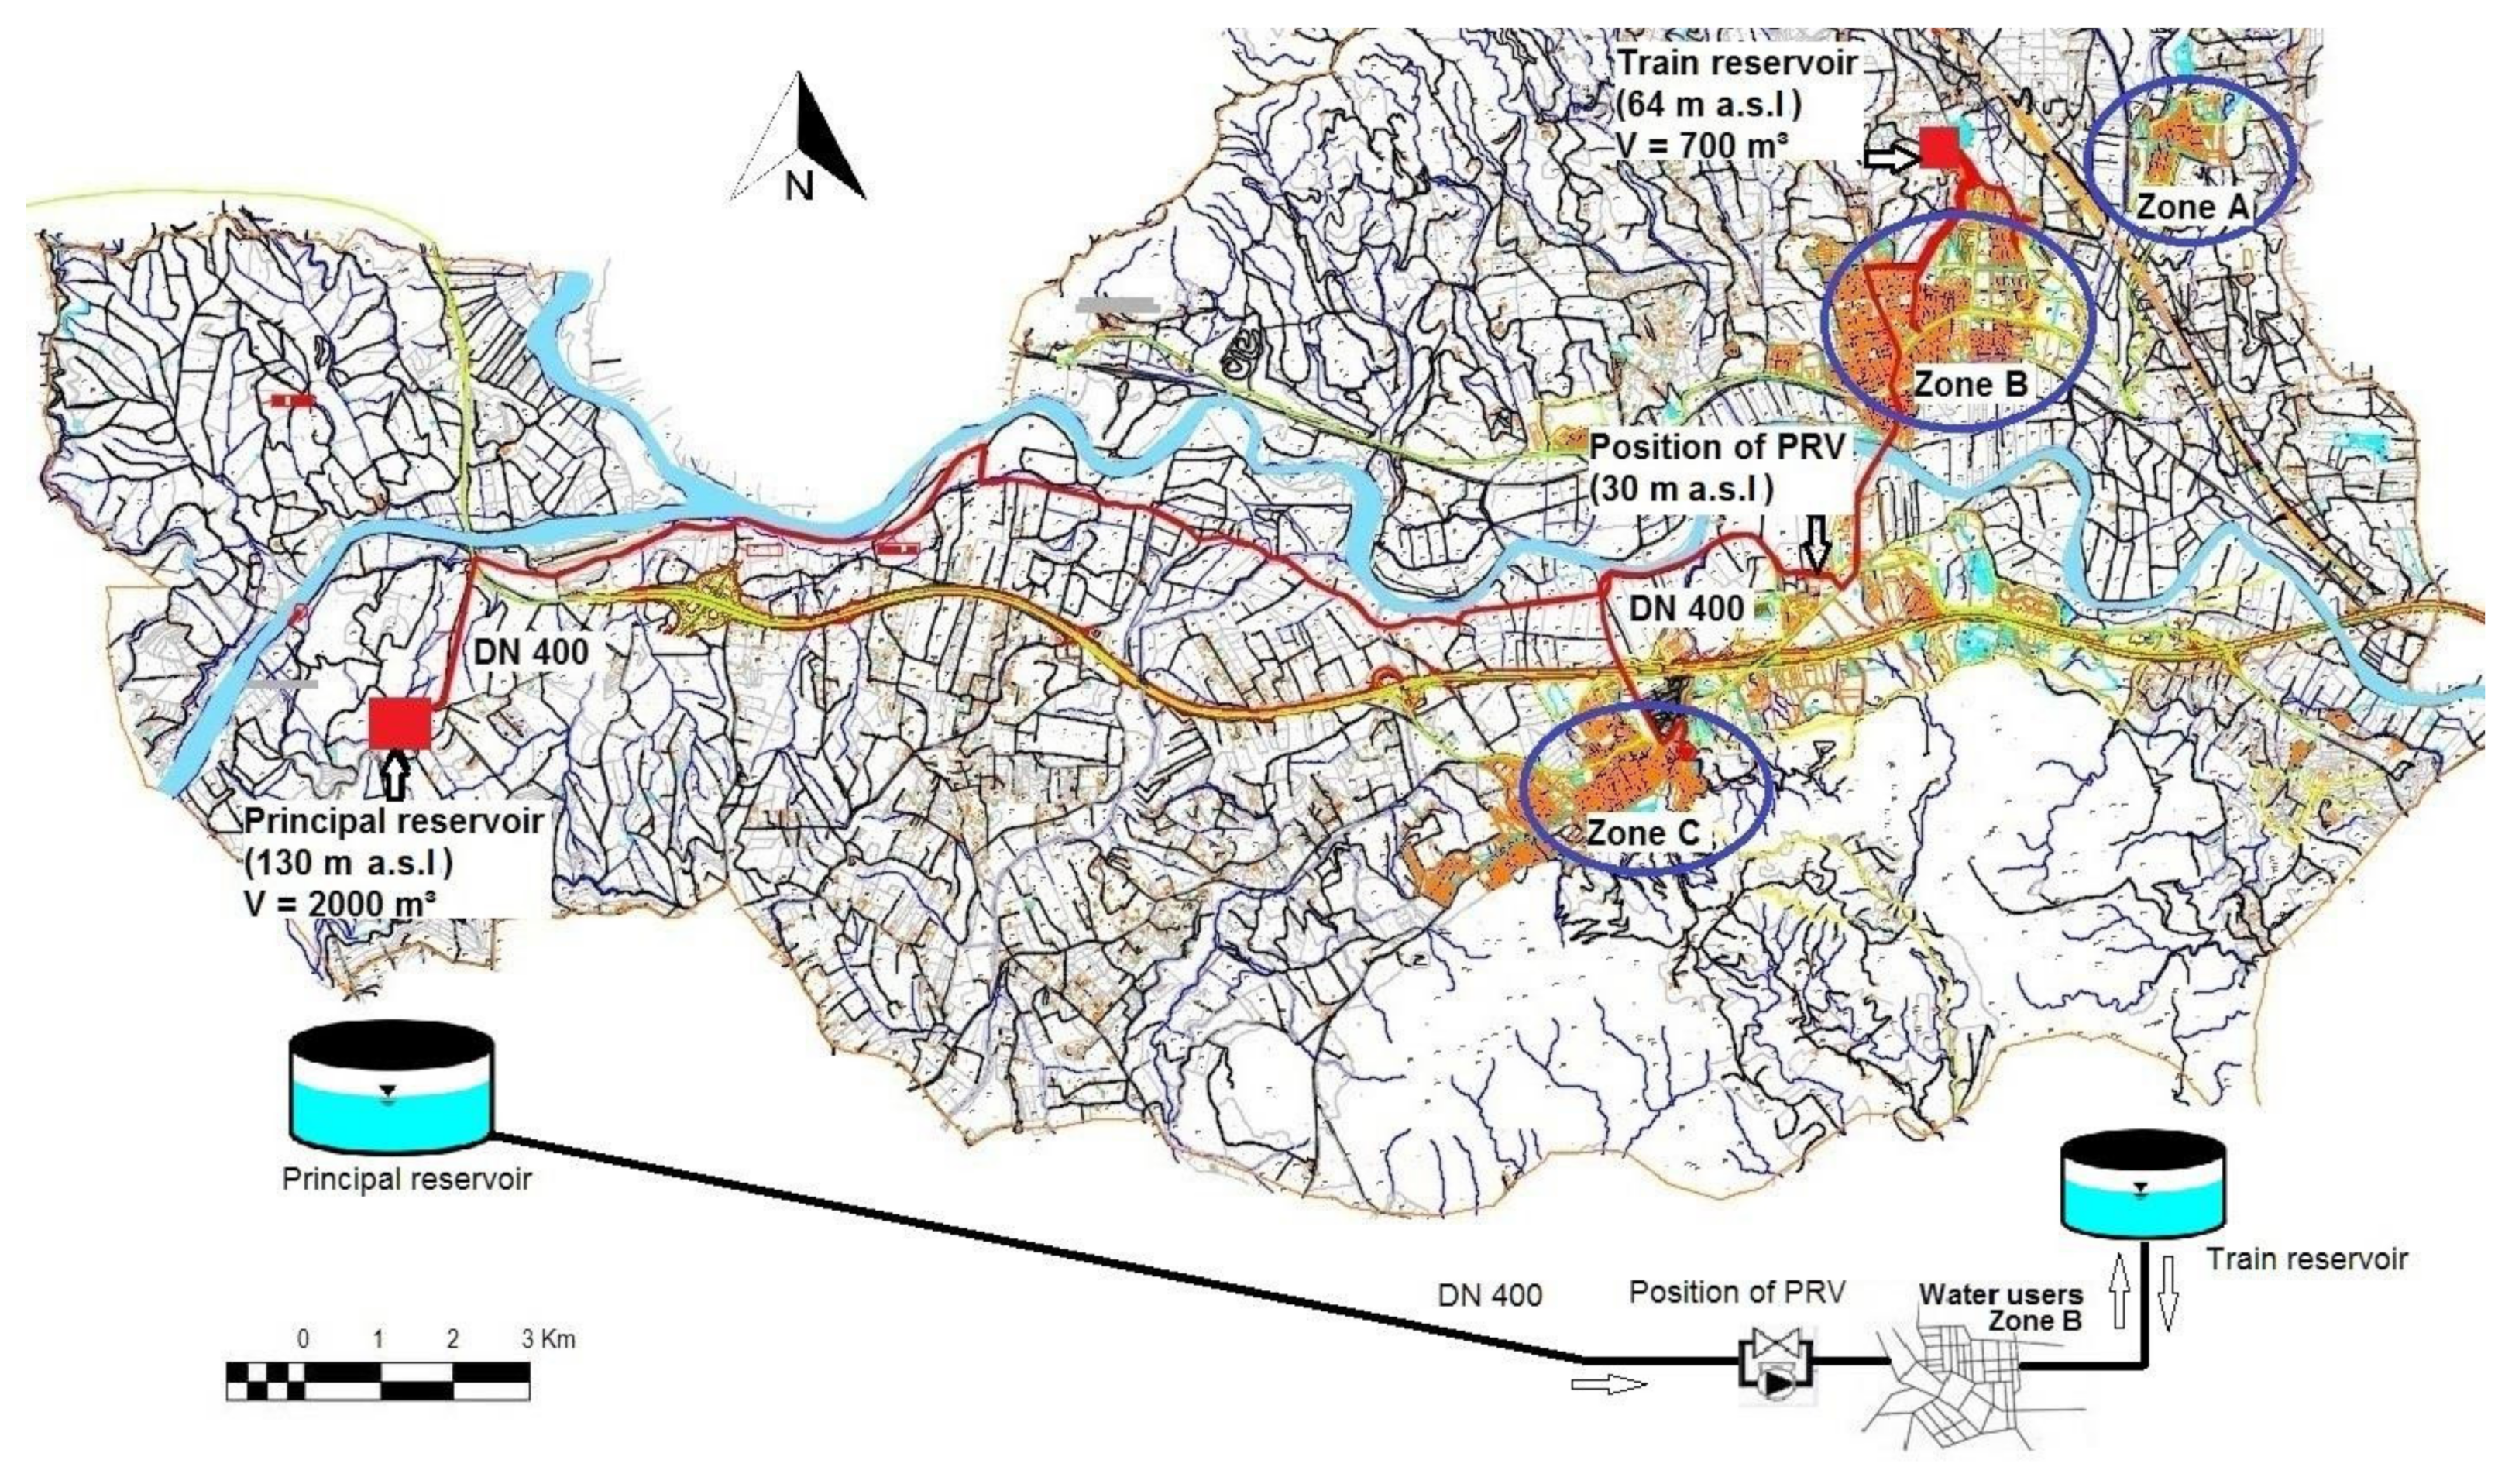
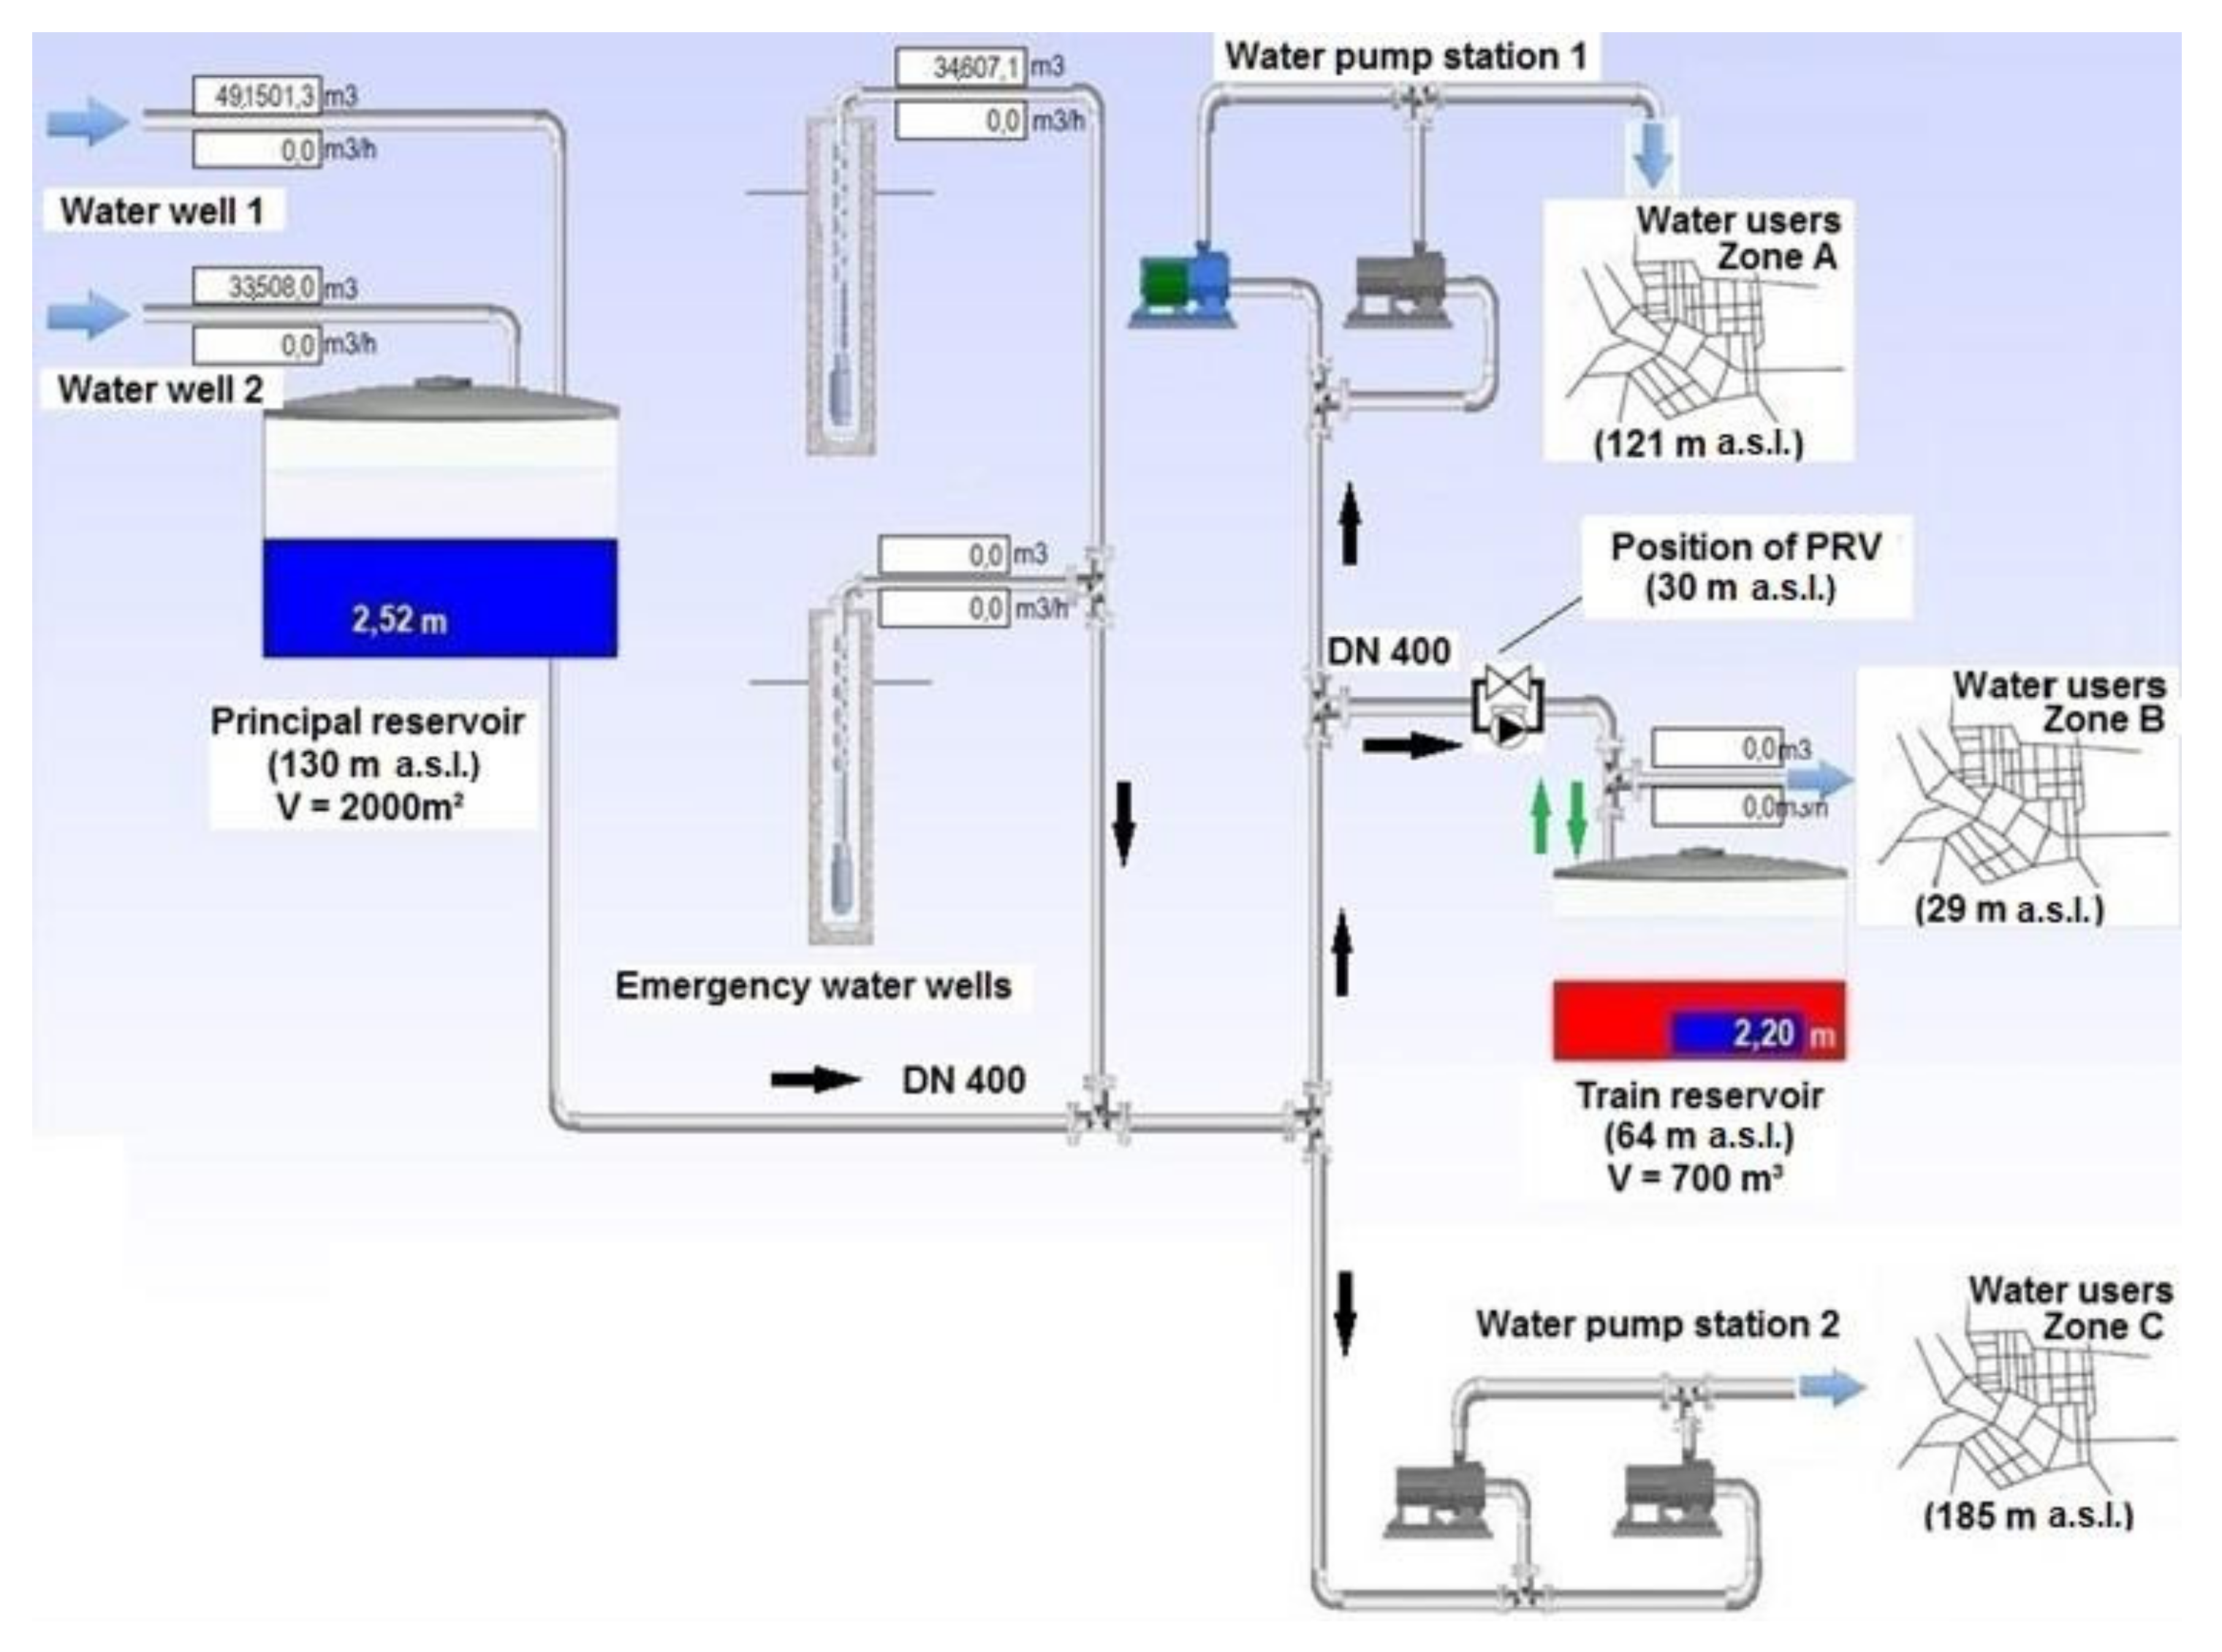
The municipal drinking water distribution network is described in Figure 1 and Figure 2. Figure 1 details the location of its main elements, and Figure 2 presents its synoptic scheme. The installation was constituted by a main deposit (principal reservoir), located at a height of 130 m a.s.l (above sea level), and a main distribution artery of ductile iron class K9, with a cylindrical section of 400 mm in diameter. This principal reservoir has a capacity of 2000 m3 and was filled with water from two wells located on the banks of the river that runs through the municipality. In addition, the system has two additional emergency wells, which could be set into operation with pumps when the water level of this deposit reached an established minimum set point level.
The water consumers were directly supplied from the main artery. They were grouped into 3 scattered population zones: A, B and C. Zones A and C are in an elevated position from the river bed, so it was necessary to use mid-line pumping stations to guarantee the pressure and flow required, despite the height of the principal tank. Zone B, however, is at the lowest height of the installation, and, in this case, a PRV was needed to ensure that high pressures were not reached downstream. In this case, the PRV installed was configured to generate a pressure drop of ΔH = 20 mH20.
In addition, at the backend of zone B, there is a train reservoir with a water capacity of 700 m3, located at a height of 64 m a.s.l. This tank was filled in an automated way based on its water levels, which were monitored in real time, prioritizing the distribution of water during the night period. In general, it has been found that this is the working set up of most installations in which pumping stations are required to extract water from wells or to supply high areas while using electricity tariffs with reduced costs in night hours. Likewise, it was emptied mainly during daytime when the peak demand sections are found in the consumption of the population, and, in case of necessity, it should also have had the possibility of driving water during the daytime.
2.2. Design Premise and Optimal Location of the ERT
The location of the ERT had to allow electrical energy to be obtained during the longest possible operating time. It was decided to take advantage of one existing PRV in the main artery of the system that directly supplied the tailings tank in the population area of zone B (see water distribution scheme in Figure 2) for two reasons: to minimize the civil works and infrastructure to carry out the study and because of the availability of access to several public lighting lines in the vicinity.
Having a train reservoir guaranteed the continuity of water flow during the night period, when the energy to supply the luminaires was needed. The flow that circulated prior to the installation of the ERT was monitored and assessed. It was verified that water flowed without interruptions 24 h a day through the PVR, and, because of the installation’s control mode, it reached its maximum values at night. In this way, even without modifications in the current programming of the distribution system, the maximum power generation period already occurred during the dark, which reduced the battery capacity needed for energy storage and, therefore, the global economic cost of the installation compared with photovoltaic installations [53].
2.3. Description of the Experiment Station
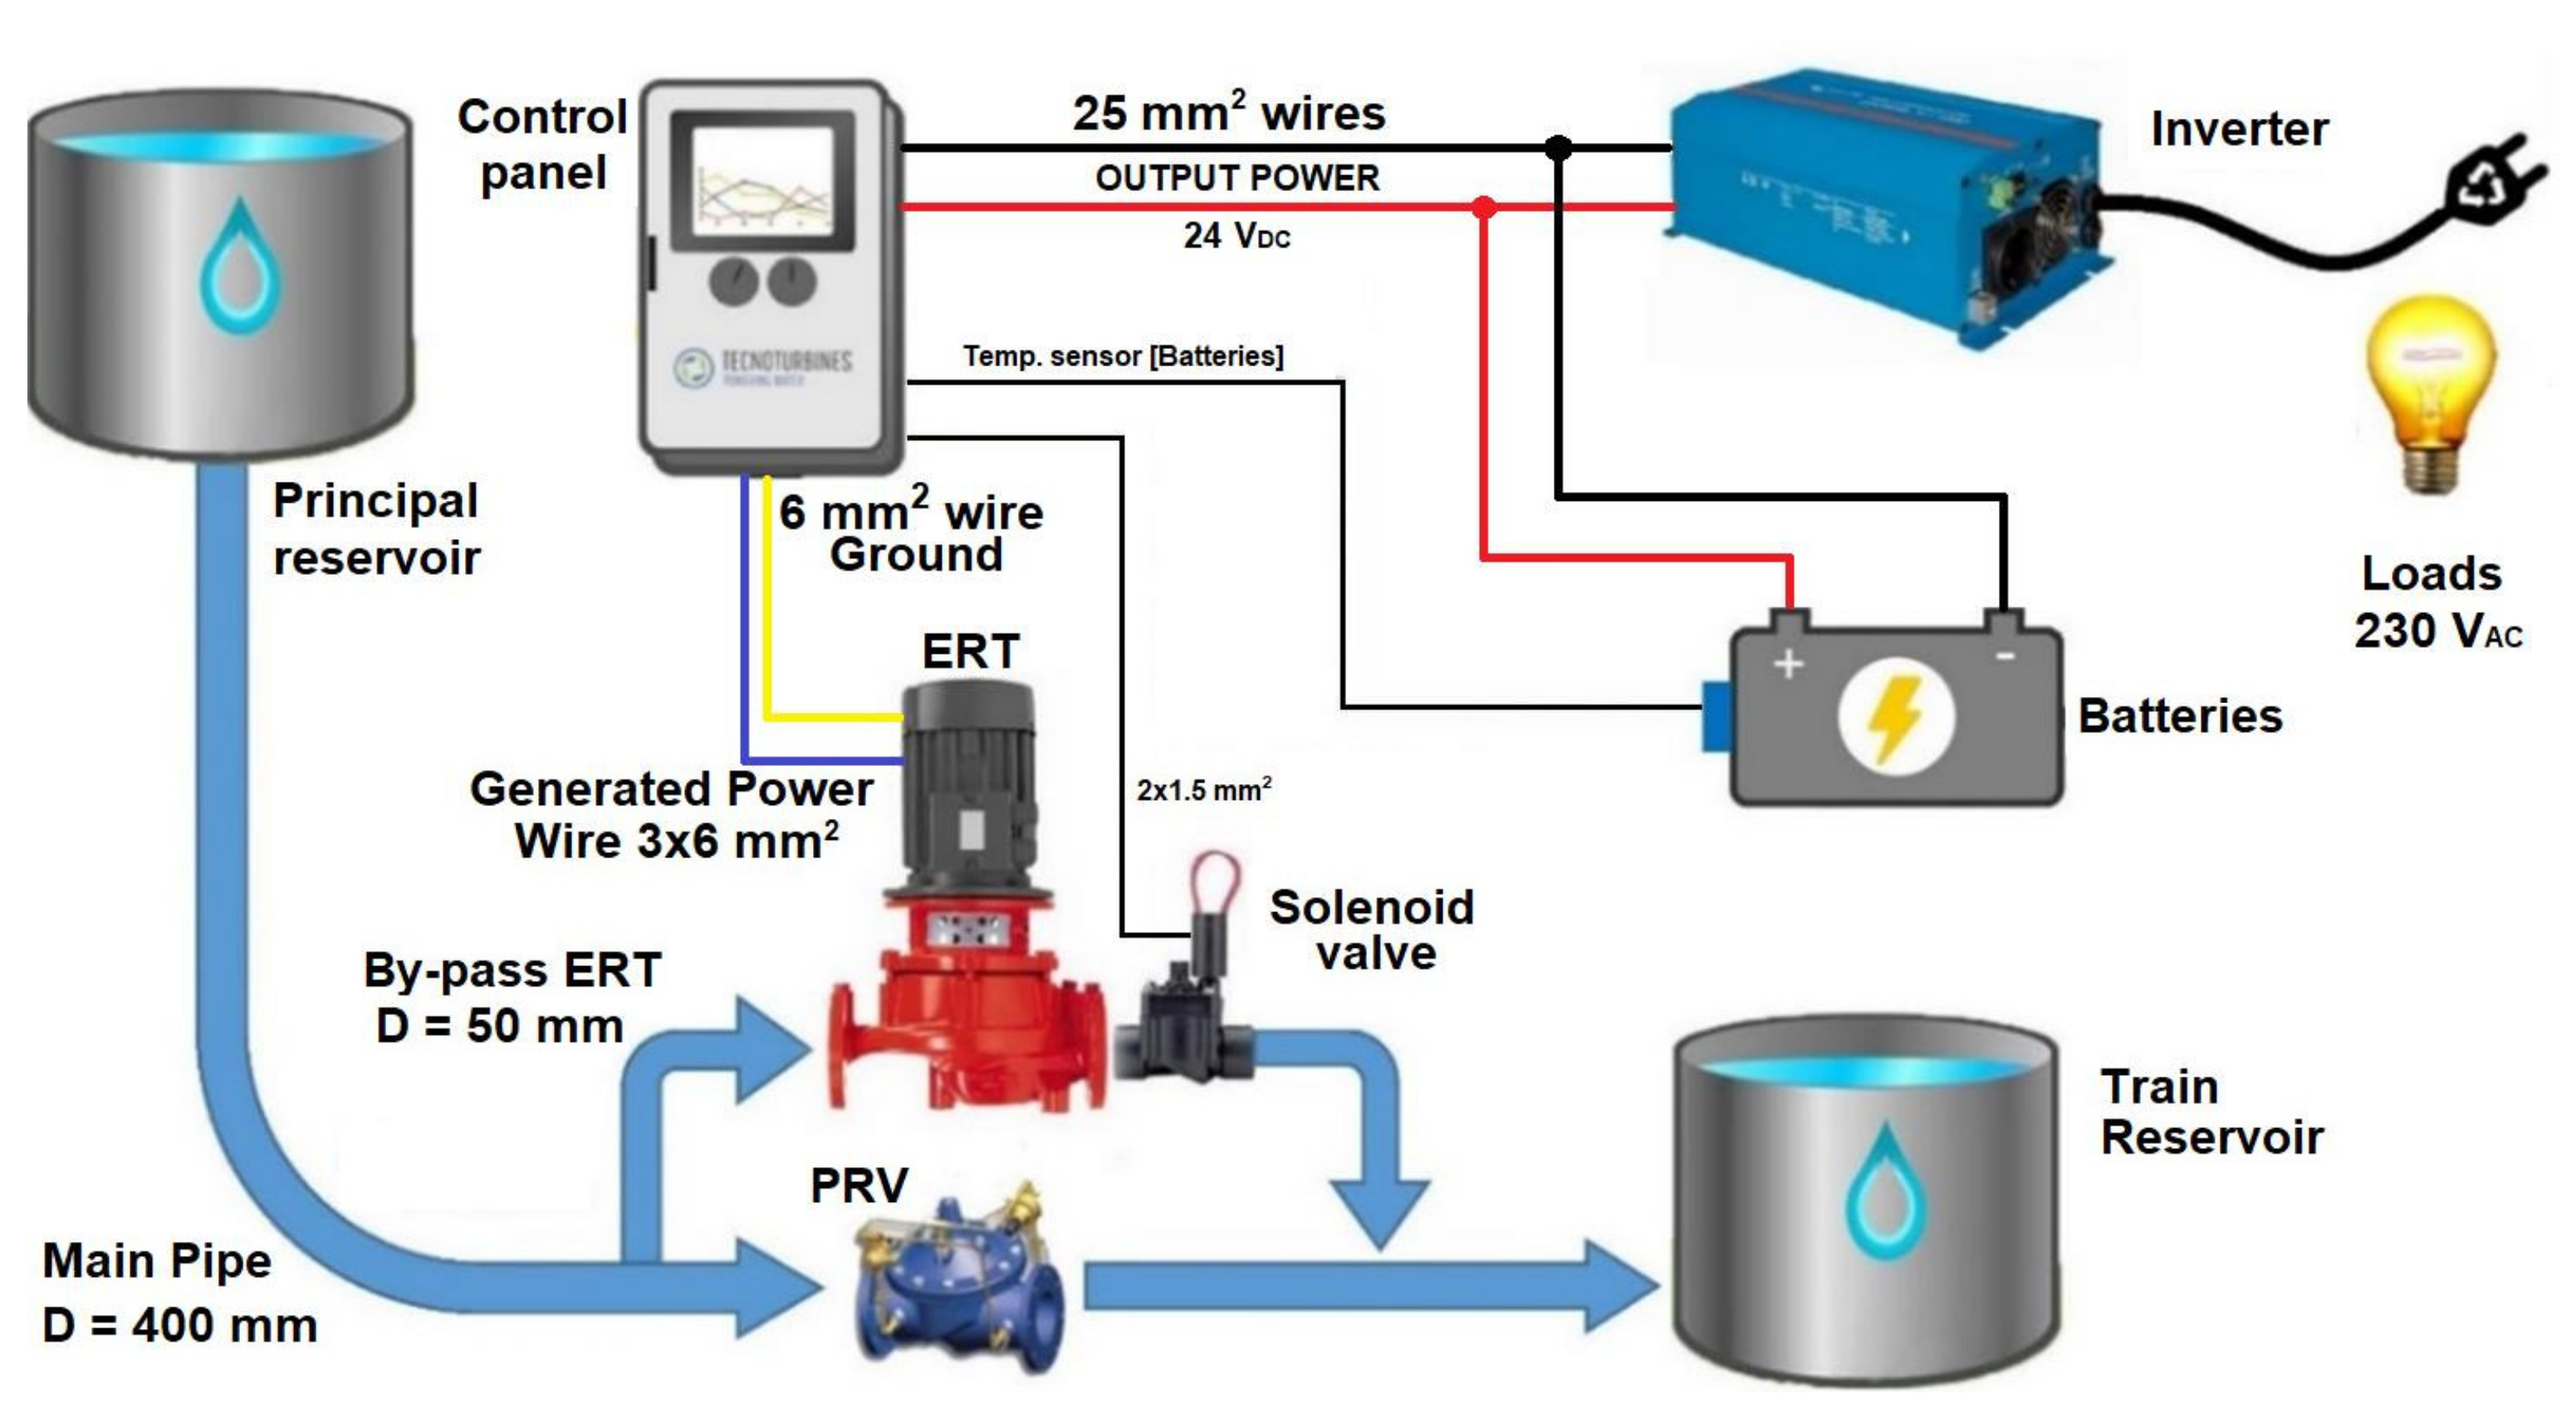
The ERT station was developed using a micro turbine unit (PAT Model: 050-B0; Manufacturer: Tecnoturbines S.L.) and control valves and sensors that were installed in bypass mode with the PRV selected to divert part of the total water flow towards the turbine. It was designed in such a way that a possible breakage or malfunction of the experimental installation would not harm the functionality or block the water supply service to the population. The ERT mounted in this study was of a smaller nominal power with respect to the maximum equipment possible to recover the available energy from the network. Thus, the entire water flow of the pipe did not circulate through the generator. The aim was to draw preliminary conclusions without the need for very large economic investments, both in civil works and in equipment. The scheme of the generated installation is presented in Figure 3.
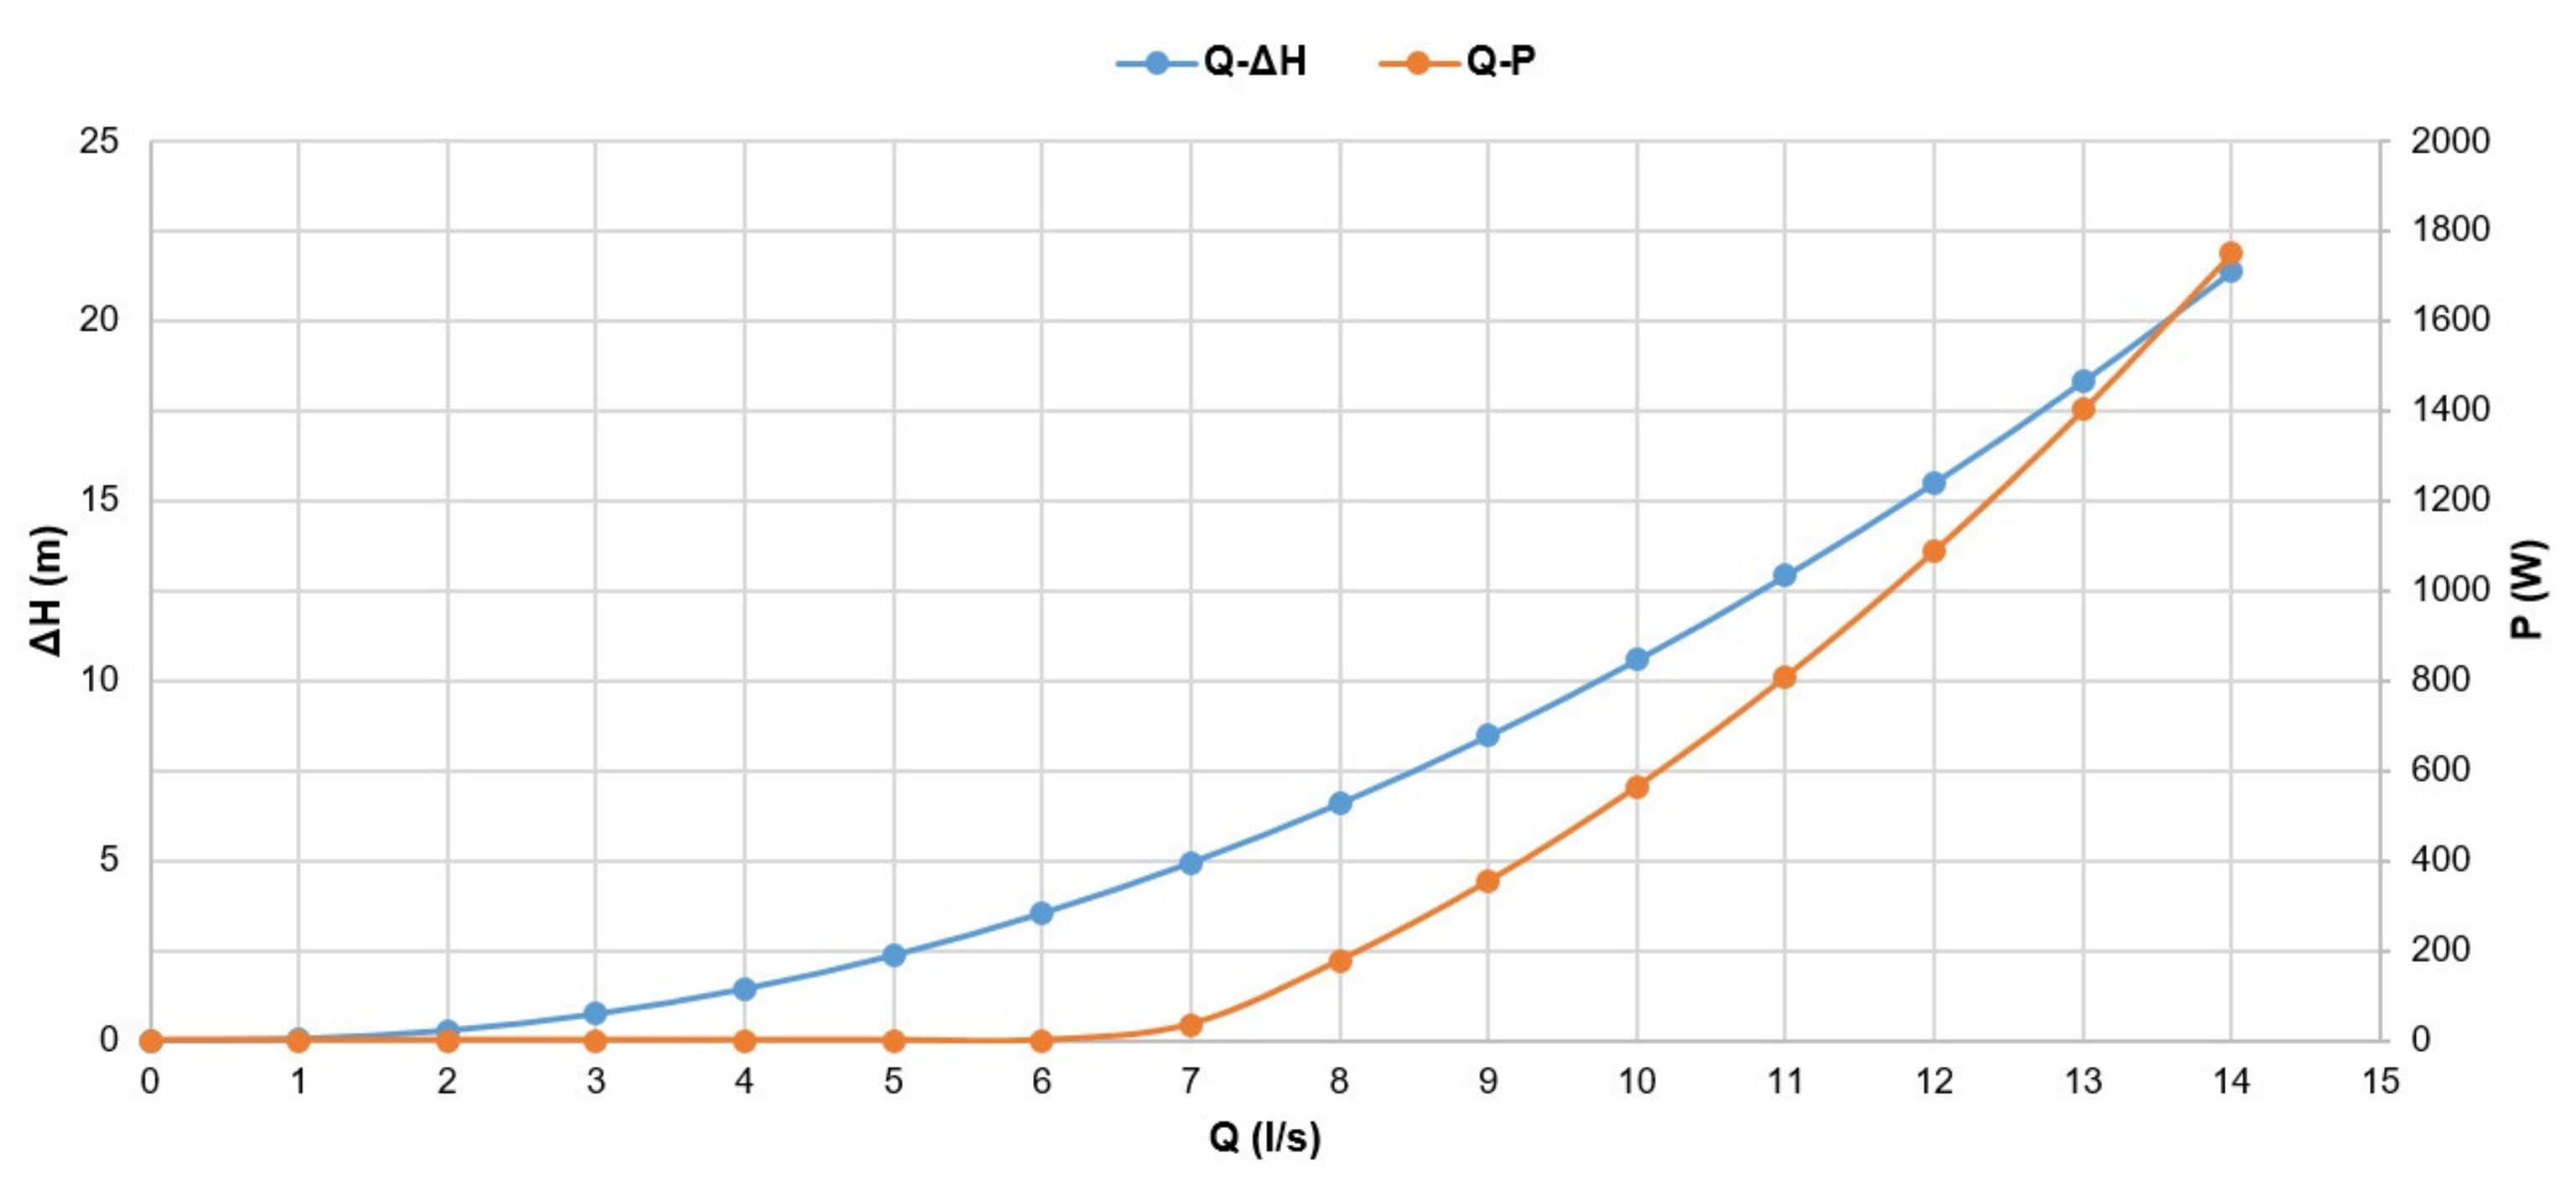
A vertical axis hydraulic PAT design was selected. It included two inlet/outlet DN50 flange connections with a maximum allowed pressure of 16 bar. The equipment was design to work in turbine mode, with an electronic control attached to regulate the system based on the electric output generated. The nominal operating point was achieved with a flow rate of 13.5 L/s and a pressure drop of 20.00 mH20. At this working point, it would supply 1.60 kW of theoretical nominal power. The characteristic curves of the equipment, working as a turbine, are presented in Figure 4.
Two shut-off ball valves (to facilitate the installation and maintenance), two pressure sensors, one flow rate sensor and a 3″ solenoid valve were mounted on the bypass. The last element allowed the flow that goes through the turbine to be increased or reduced remotely, depending on the signal received from the regulator or controller unit of the installation.
In a separate compartment, to keep it isolated from possible leaks or water ingress, the following elements were installed:
- One battery bank with a nominal voltage of 24 VDC and a capacity of 220 Ah. It combined 2 units of 12 VDC 220 Ah deep-cycle, maintenance-free AGM blocks connected in series. The energy produced during the day was stored in this equipment.
- A 230 VAC/50 Hz single-phase inverter. It allowed the energy generated or stored to be used to feed a conventional lighting electrical distribution network.
- A control center integrated in a 600 mm × 600 mm × 210 mm IP66 metal box, which included:
- ⚬
- A battery charge regulator, which was responsible for protecting the batteries from deep discharge, if necessary, by disconnecting the load. In addition, it was able to send a signal to the solenoid valve to regulate the flow that circulated through the ERT when the battery bank was charged and there was no consumption at that time.
- ⚬
- A gear indicator pilot and a run/stop/auto-operating mode selector.
Figure 5 presents the location of the PRV and all the construction elements developed to install the ERT with its complements and control panel. Figure 6 shows the interconnection diagram of the energy generation equipment and the management and storage elements of the system. Finally, Figure 7 shows, in detail, the physical arrangement of the components integrated in the experimental installation. The technical specifications and the financial budget of each element are shown in Table 1.
2.4. Measurement System: Equipment
A Nemos LP GPRS battery-powered data logger by Microcom with GPRS communication was used for data collection. It had eight digital inputs, four analog inputs (configurable as 0–5 VDC, 0–10 VDC or 4/20 mA standards) and four low-voltage power outputs at 12/24 VDC to supply analog or digital probes and sensors.
The following metering elements were connected to this controller:
- Two pressure transducers placed at the inlet and outlet of the turbine to measure the net pressure drop in the turbine in real time;
- One pulse counter (10 L/pulse) to measure the flow driven through the turbine;
- One power meter using a 4/20 mA current sensor to know the electric power that was being generated.
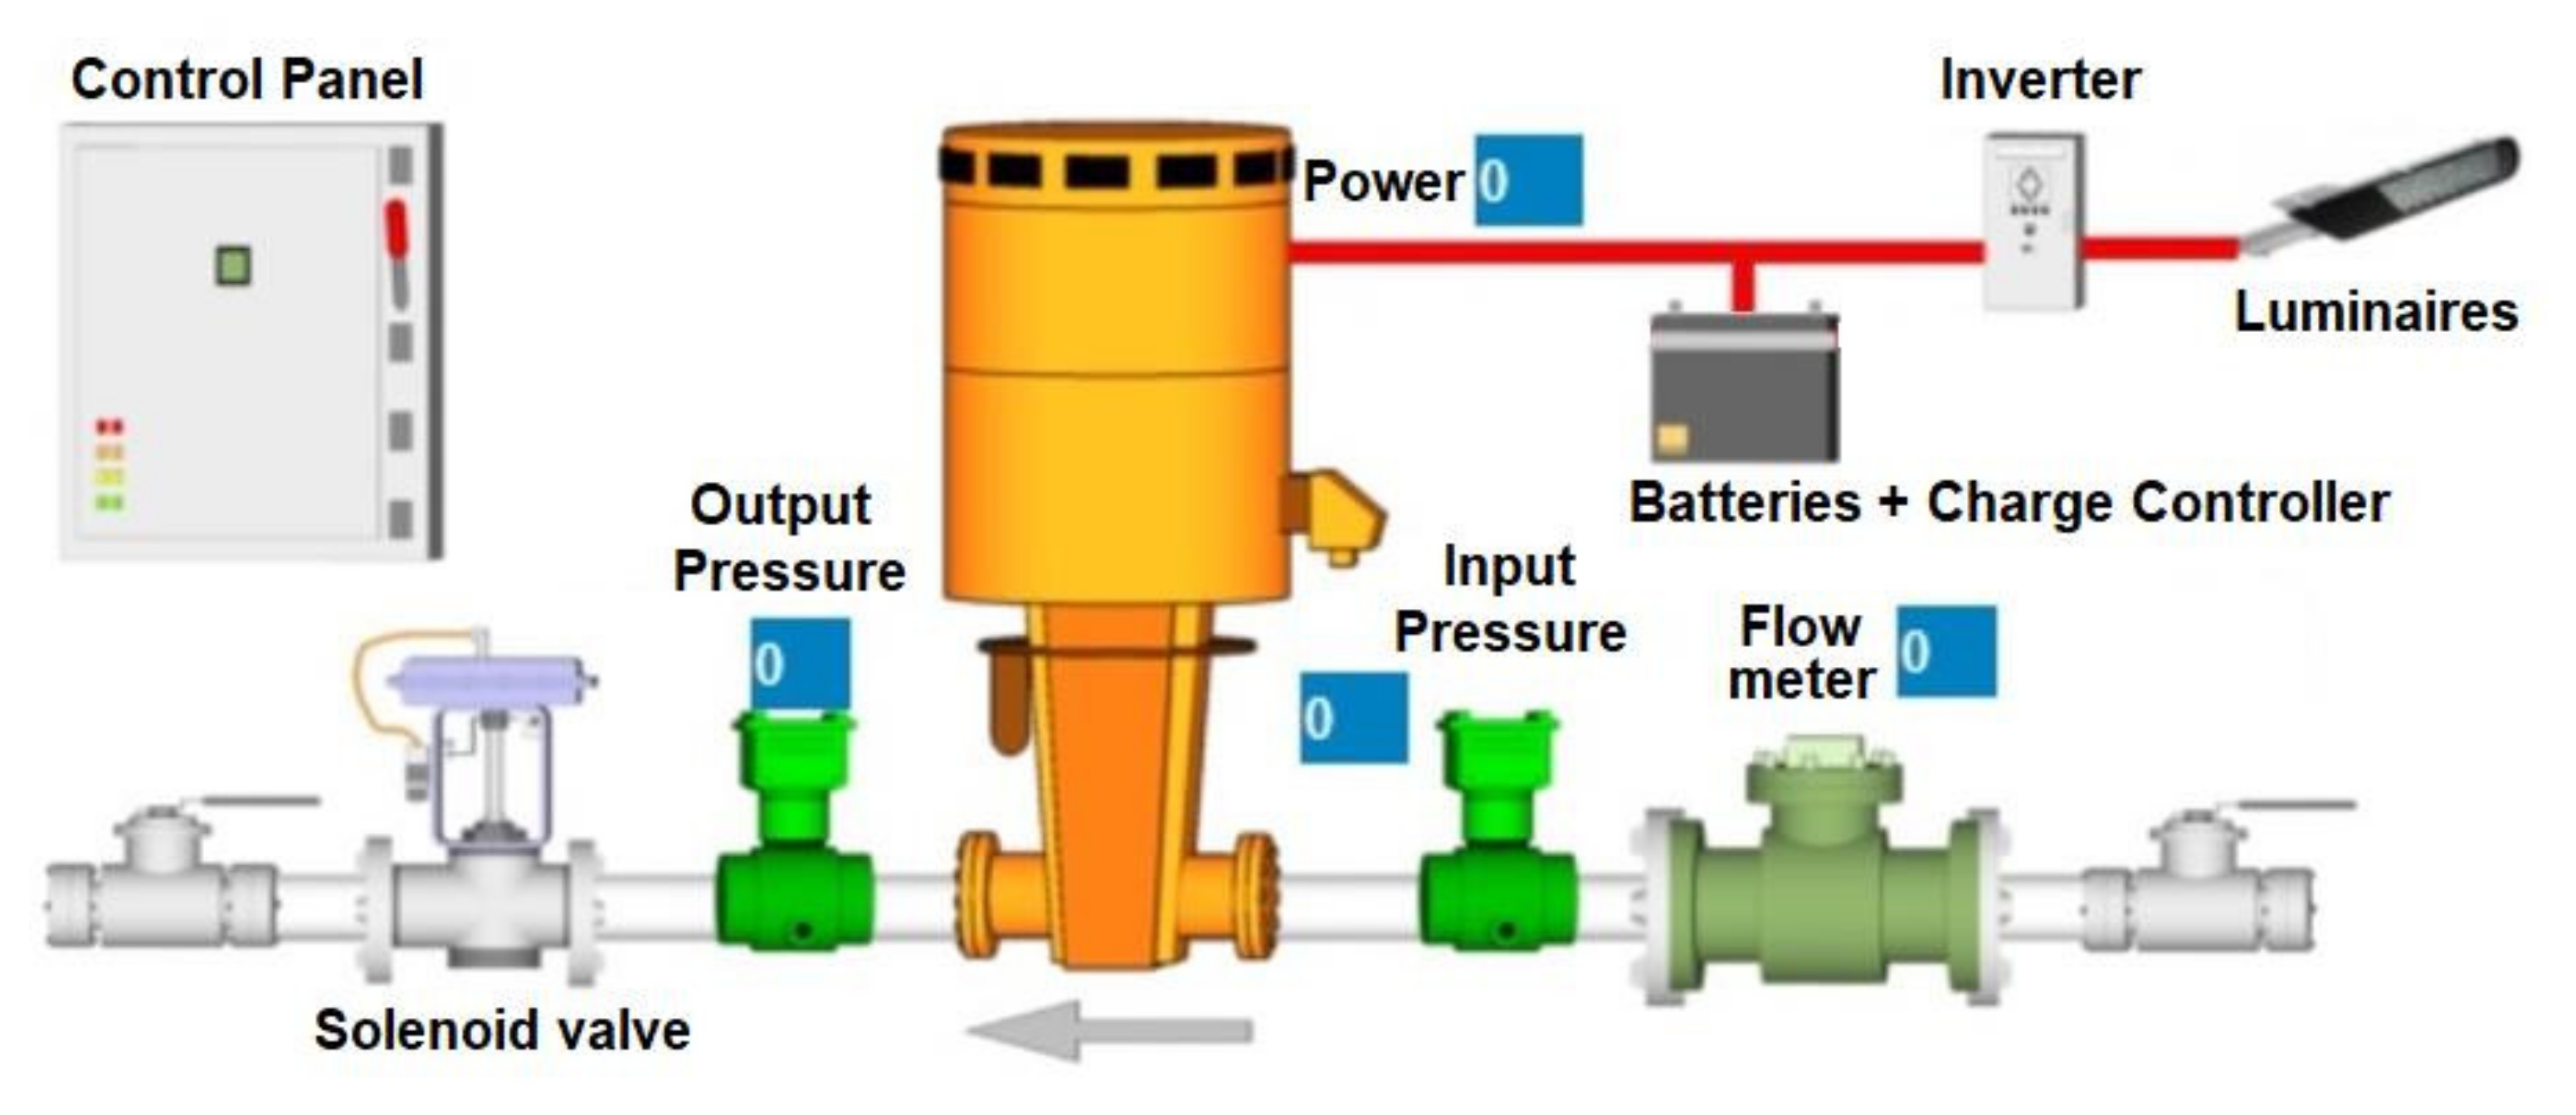
The “Zeus Synoptic Builder” web app was used to supervise the Nemos LP station from a web browser. Figure 8 includes a diagram of the ERT system, as shown in the visual interface of this platform, which includes all the previous elements described.
The technical specifications and the financial budget of each component are shown in Table 2.
2.5. Description of the Public Lighting Installation Used as a Load
An independent public lighting power line was connected to the inverter of the installation. This included 10 LED luminaires, with each of them having a nominal consumption of 40 W. These kinds of lighting equipment did not include any type of automated scheduled dimming system; thus, the load was constant, and an equal consumption pattern could be considered during the entire time of use throughout the night.
3. Results
This section shows the values obtained from the experimental study that was carried out. The power generation capacity of the water distribution network was a fluctuating aspect, both seasonally and day by day. It depended on the consumption of water in the area by its population. In the next section, the water flow values found in an annual study carried out with the installation are presented.
3.1. Measurements of the Circulating Flow under Study
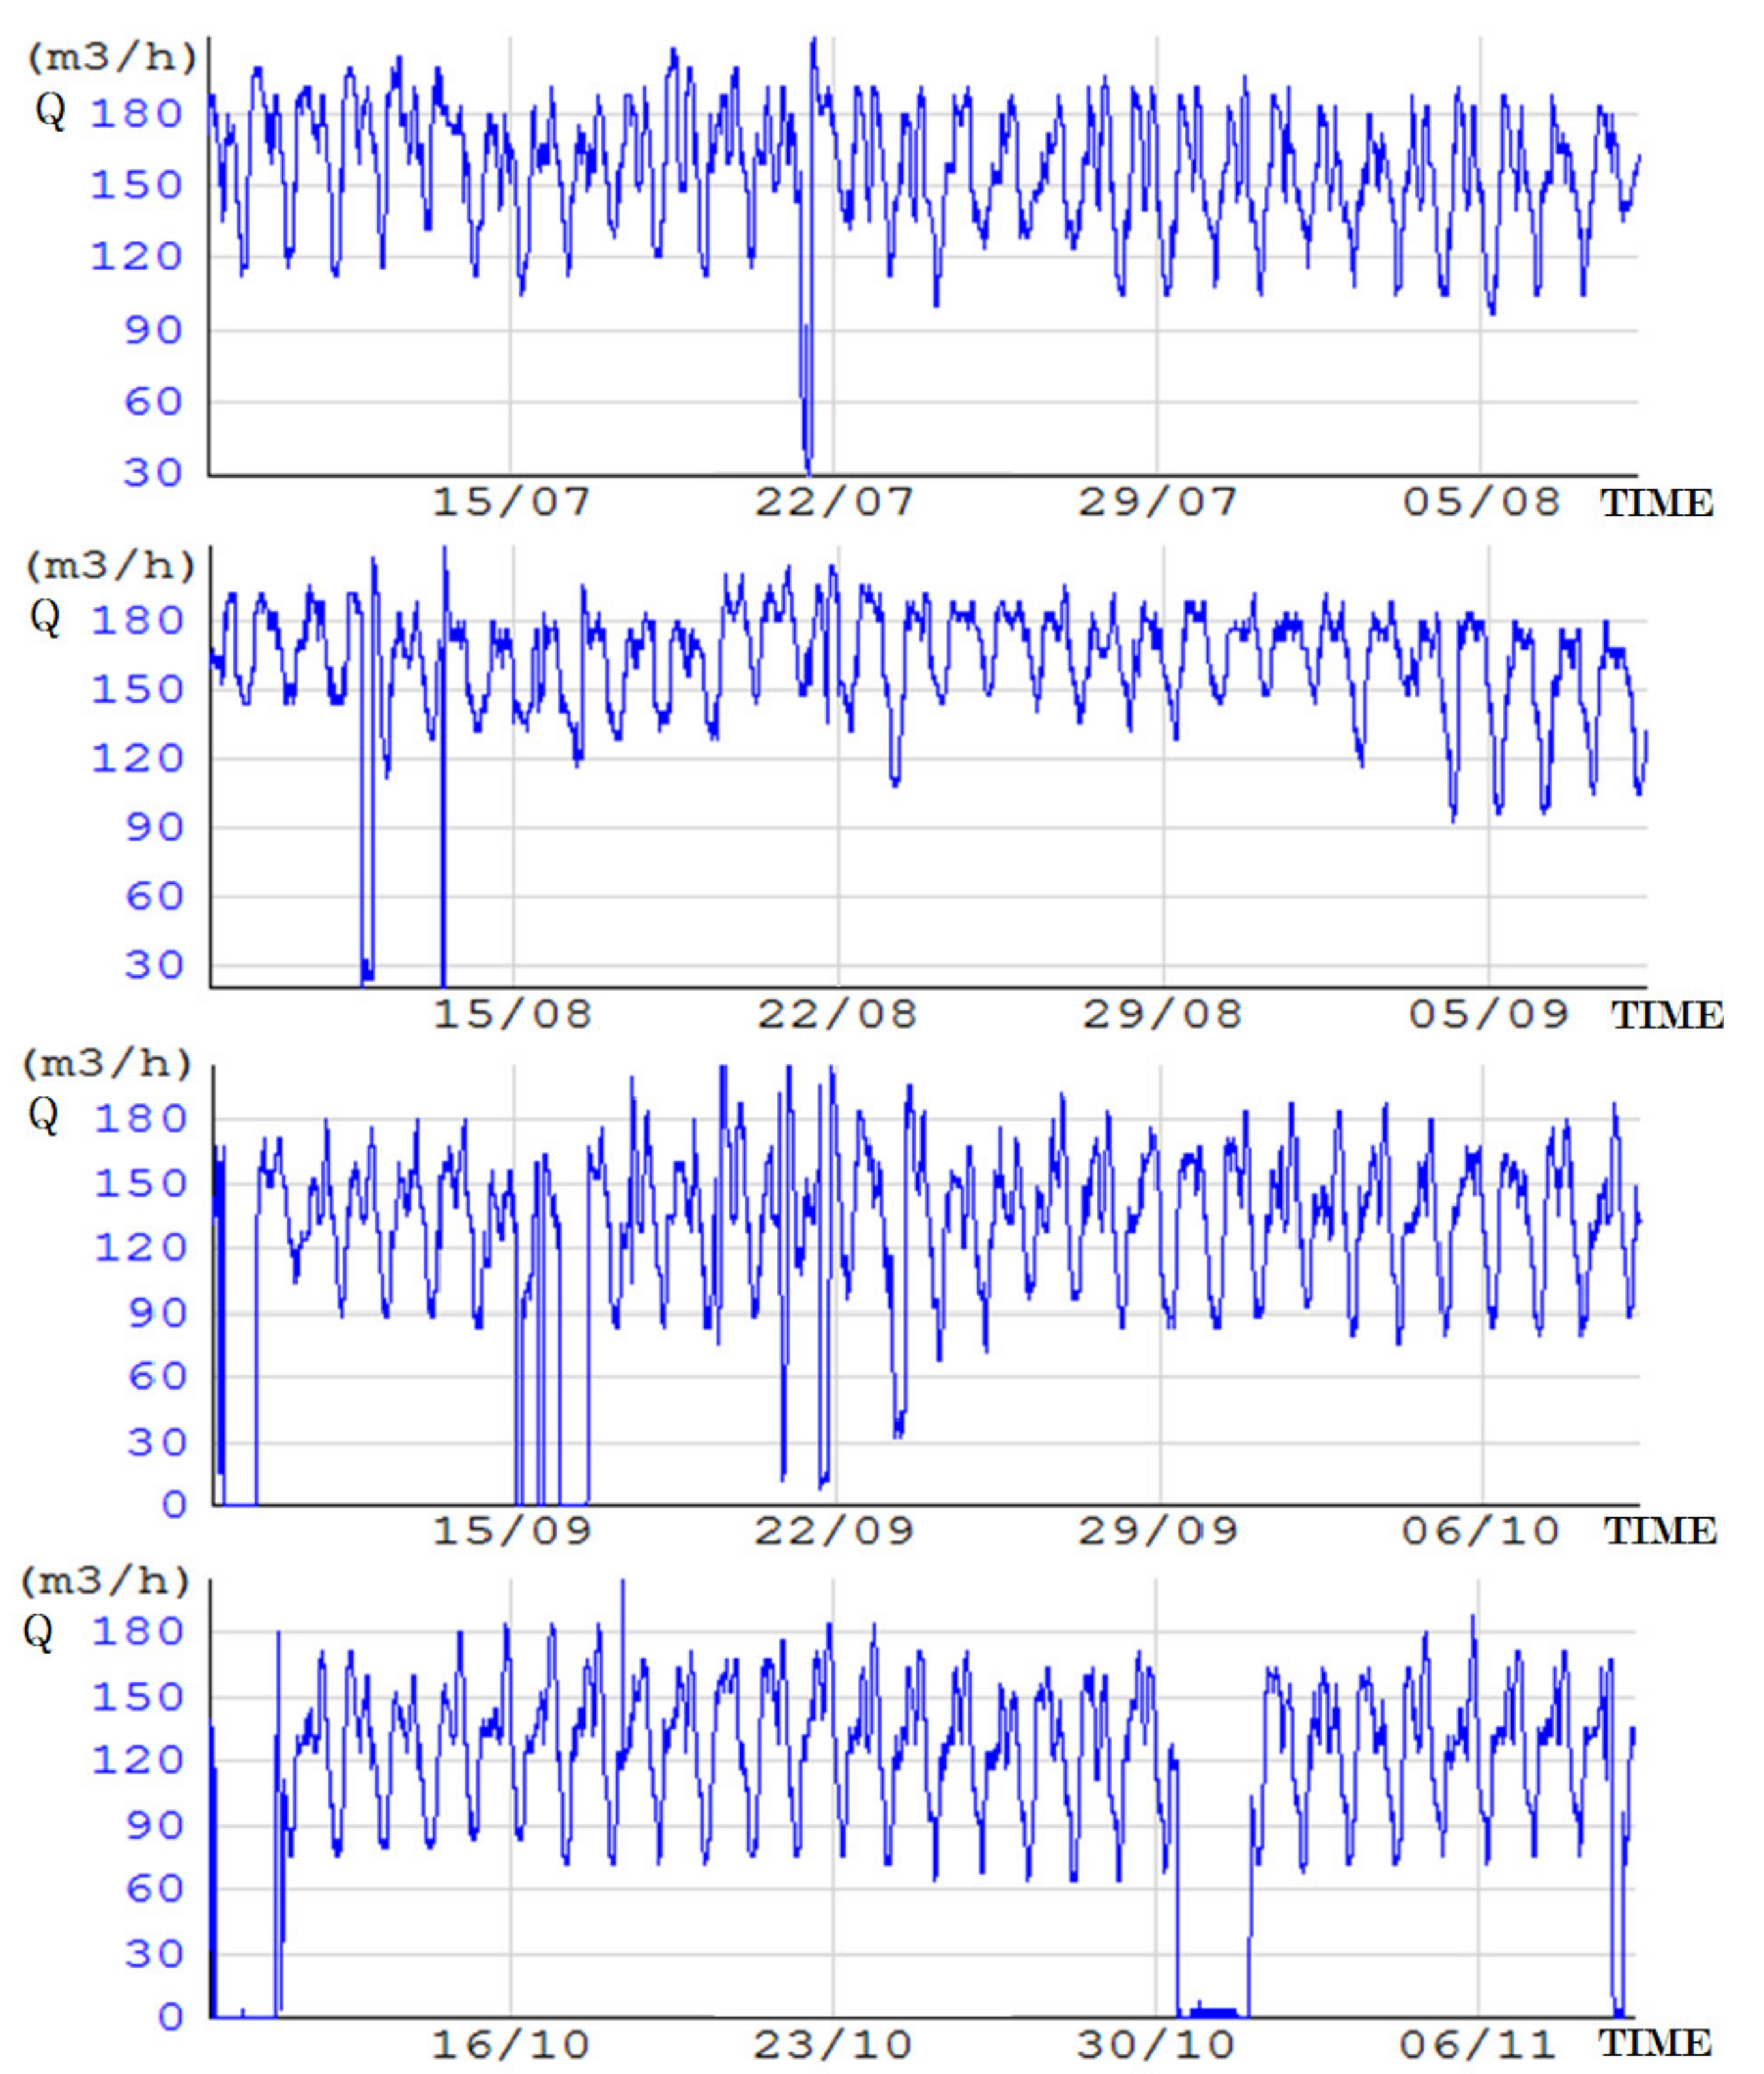
The water flow carried by the main artery of the network where the PRV was located (and in which the bypass was subsequently carried out with the installation of the ERT) was monitored throughout a year. The curves given in Figure 9 and Figure 10 show how the water consumption cycle was periodic, repeated every day in a similar way and very consistently throughout the year.
There was a rise of water consumption in the months of summer, with the absolute maximum values achieved in August (+15% over the year average). The lower values were found, on the contrary, in the winter months, with the minimum in January, but with a smaller difference compared to the annual monthly average (−7%). In general, the average flow value of the installation could be represented using September (+1% over the year average) as the reference month.
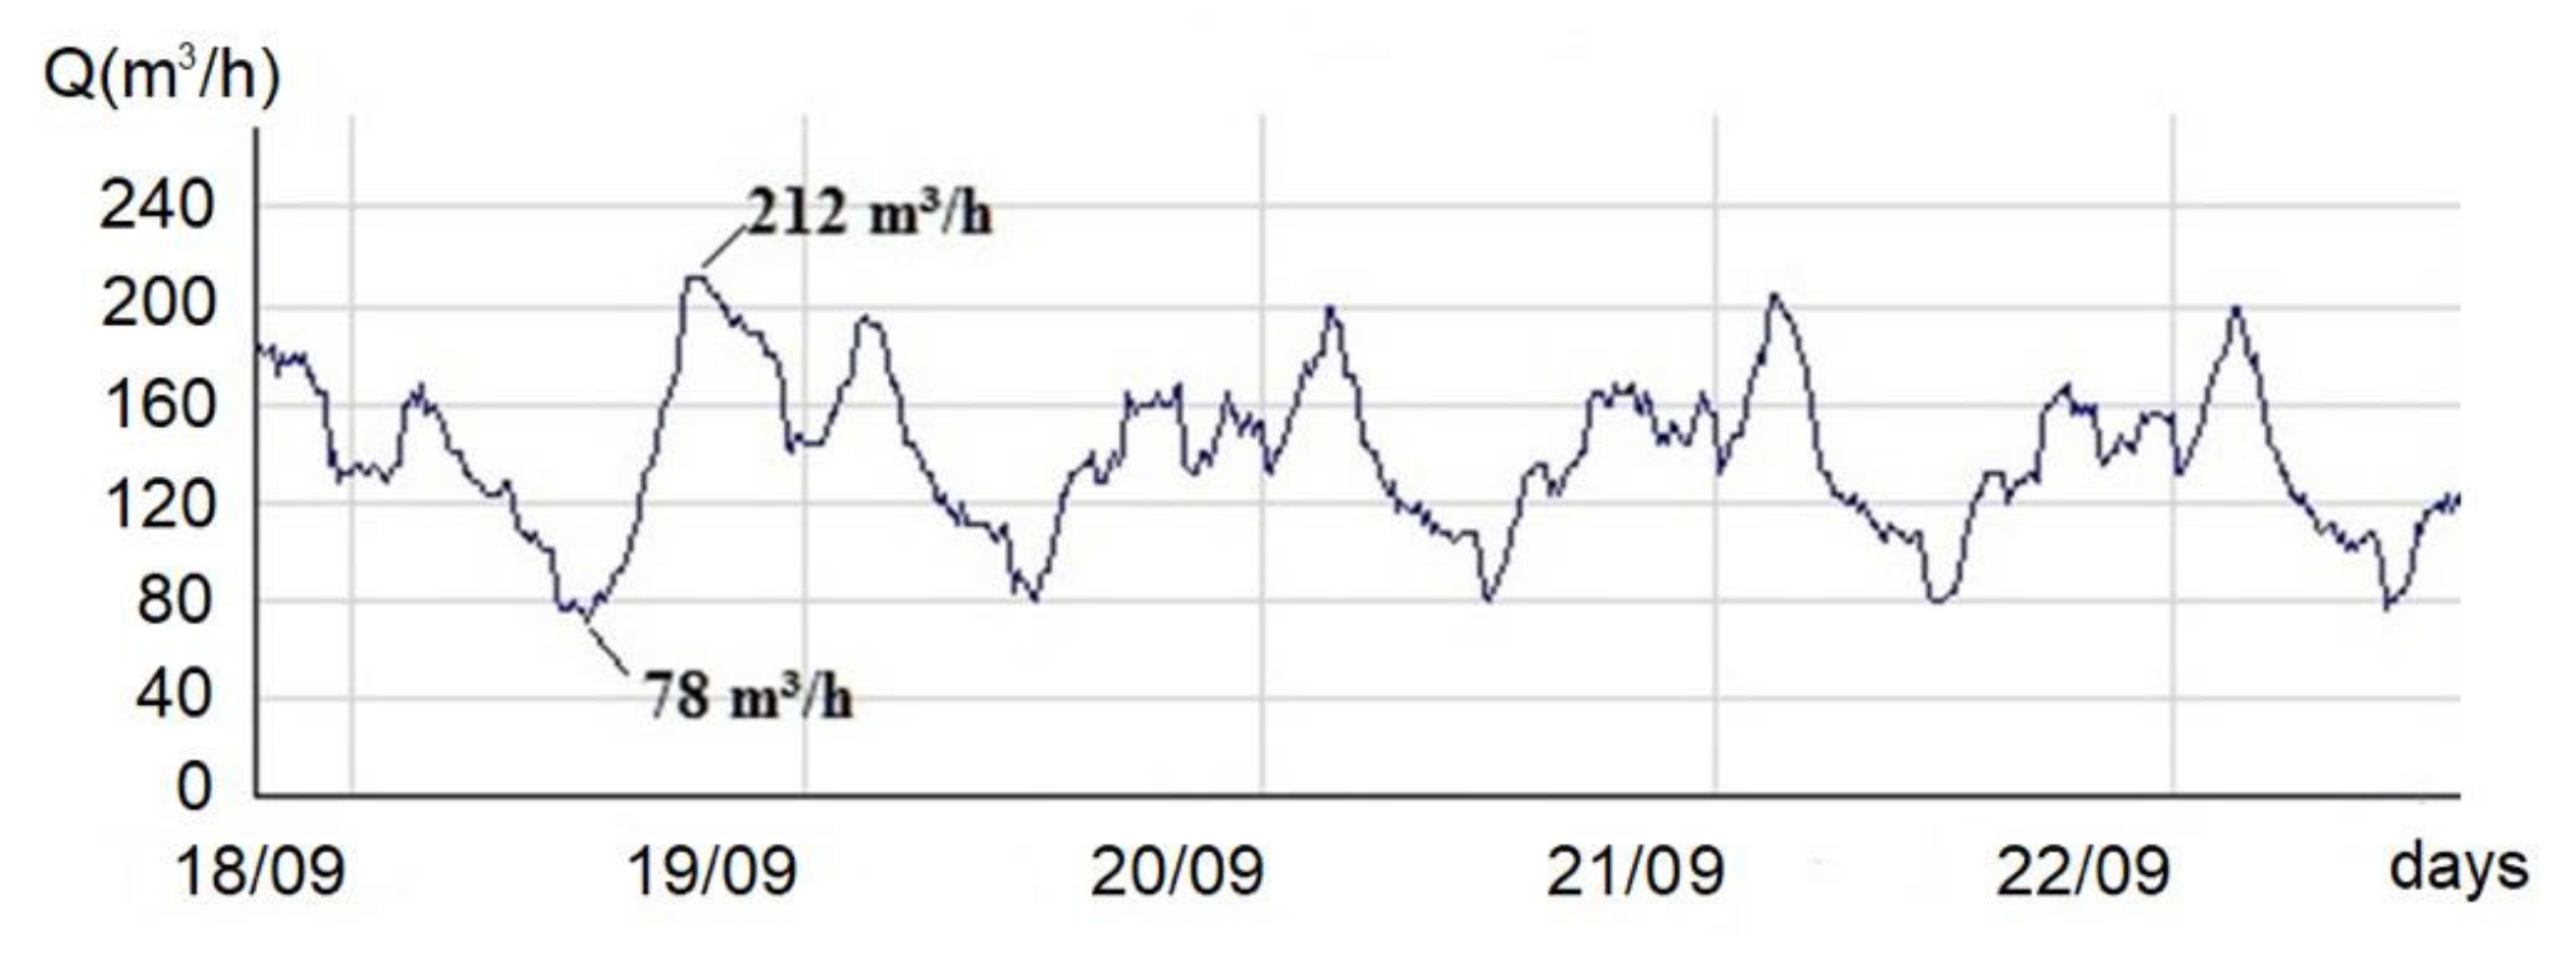
For simplicity, specifically, only the water flows measured between July and October are represented in Figure 9, including the monthly maximum (August) and mean (September). In detail, for the entire reference month, the maximum water flow value was 212 m3/h, and the minimum value was 78 m3/h, as represented in Figure 10. These two figures allowed it to be affirmed that any energy recovery installation using ERTs can be planned, considering that a permanent flow is guaranteed in the pipeline. Moreover, this movement of water always will be increased during the night period as will be detailed in the next section of this chapter.
3.2. Working Conditions of the ERT
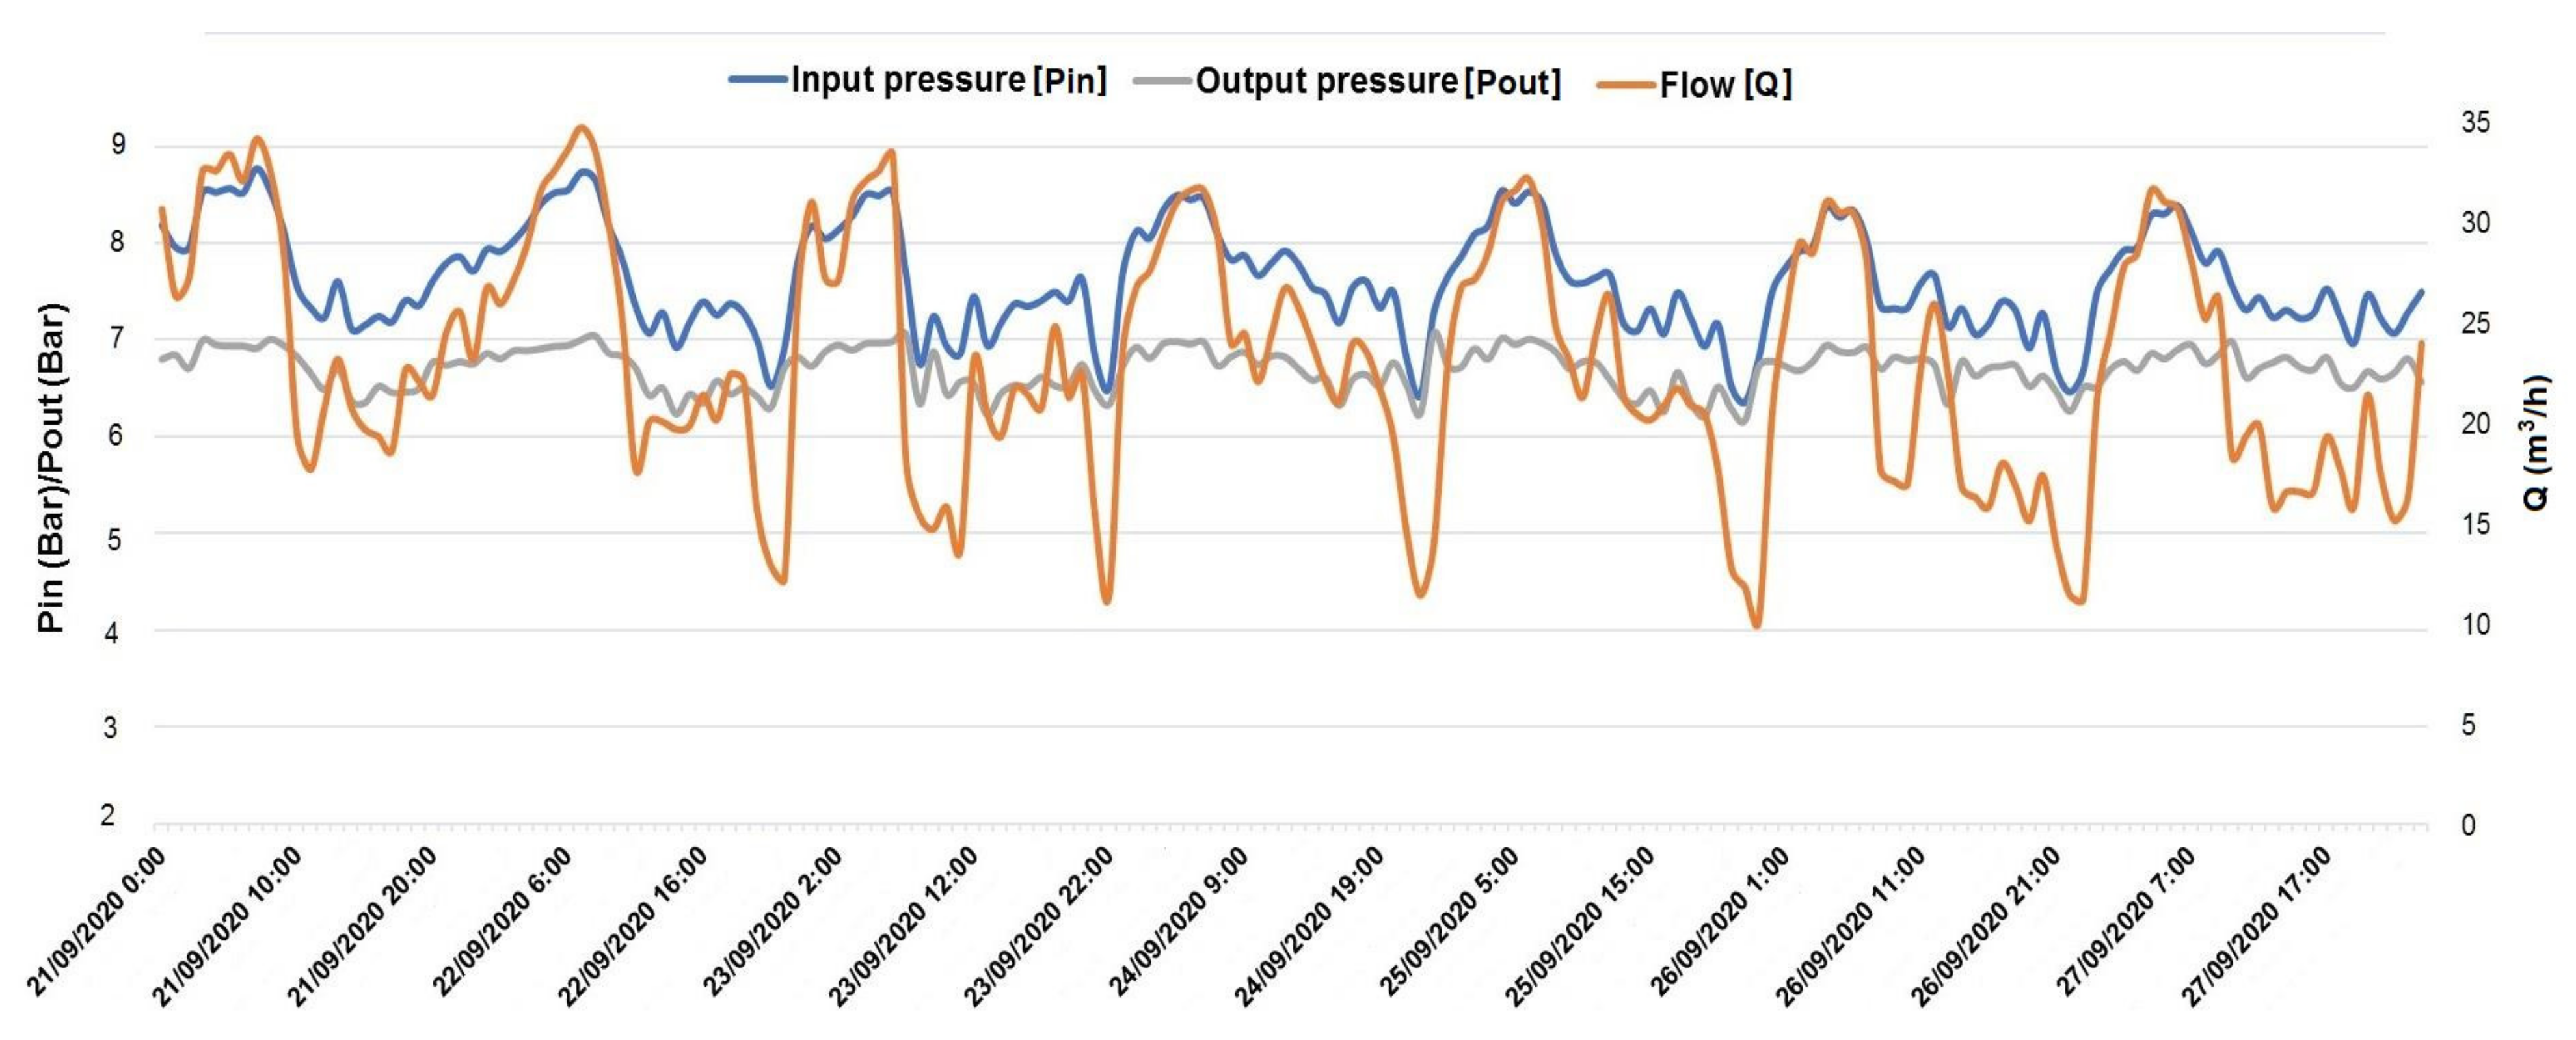
Figure 11 was constructed with the data obtained during the characterization period, referring to a typical average week, where it was possible to observe the variations in the inlet and outlet pressures and the flow that circulated through the ERT.
It can be seen that the effective water flow running through the turbine ranged between 3.0 L/s and 10.0 L/s. These values were always lower than the nominal flow rate of the hydraulic ERT used (13.5 L/s). The generator was installed in a bypass with the PRV, using a 50 mm diameter pipeline, and this is significantly smaller than the section of the main pipe, with a diameter of 400 mm. This water flowing for energy recovery could be adjusted by increasing the diameter of the bypass; however, the experiment was carried out in this way to interfere as little as possible with the reliability and quality of the water supply service to the population.
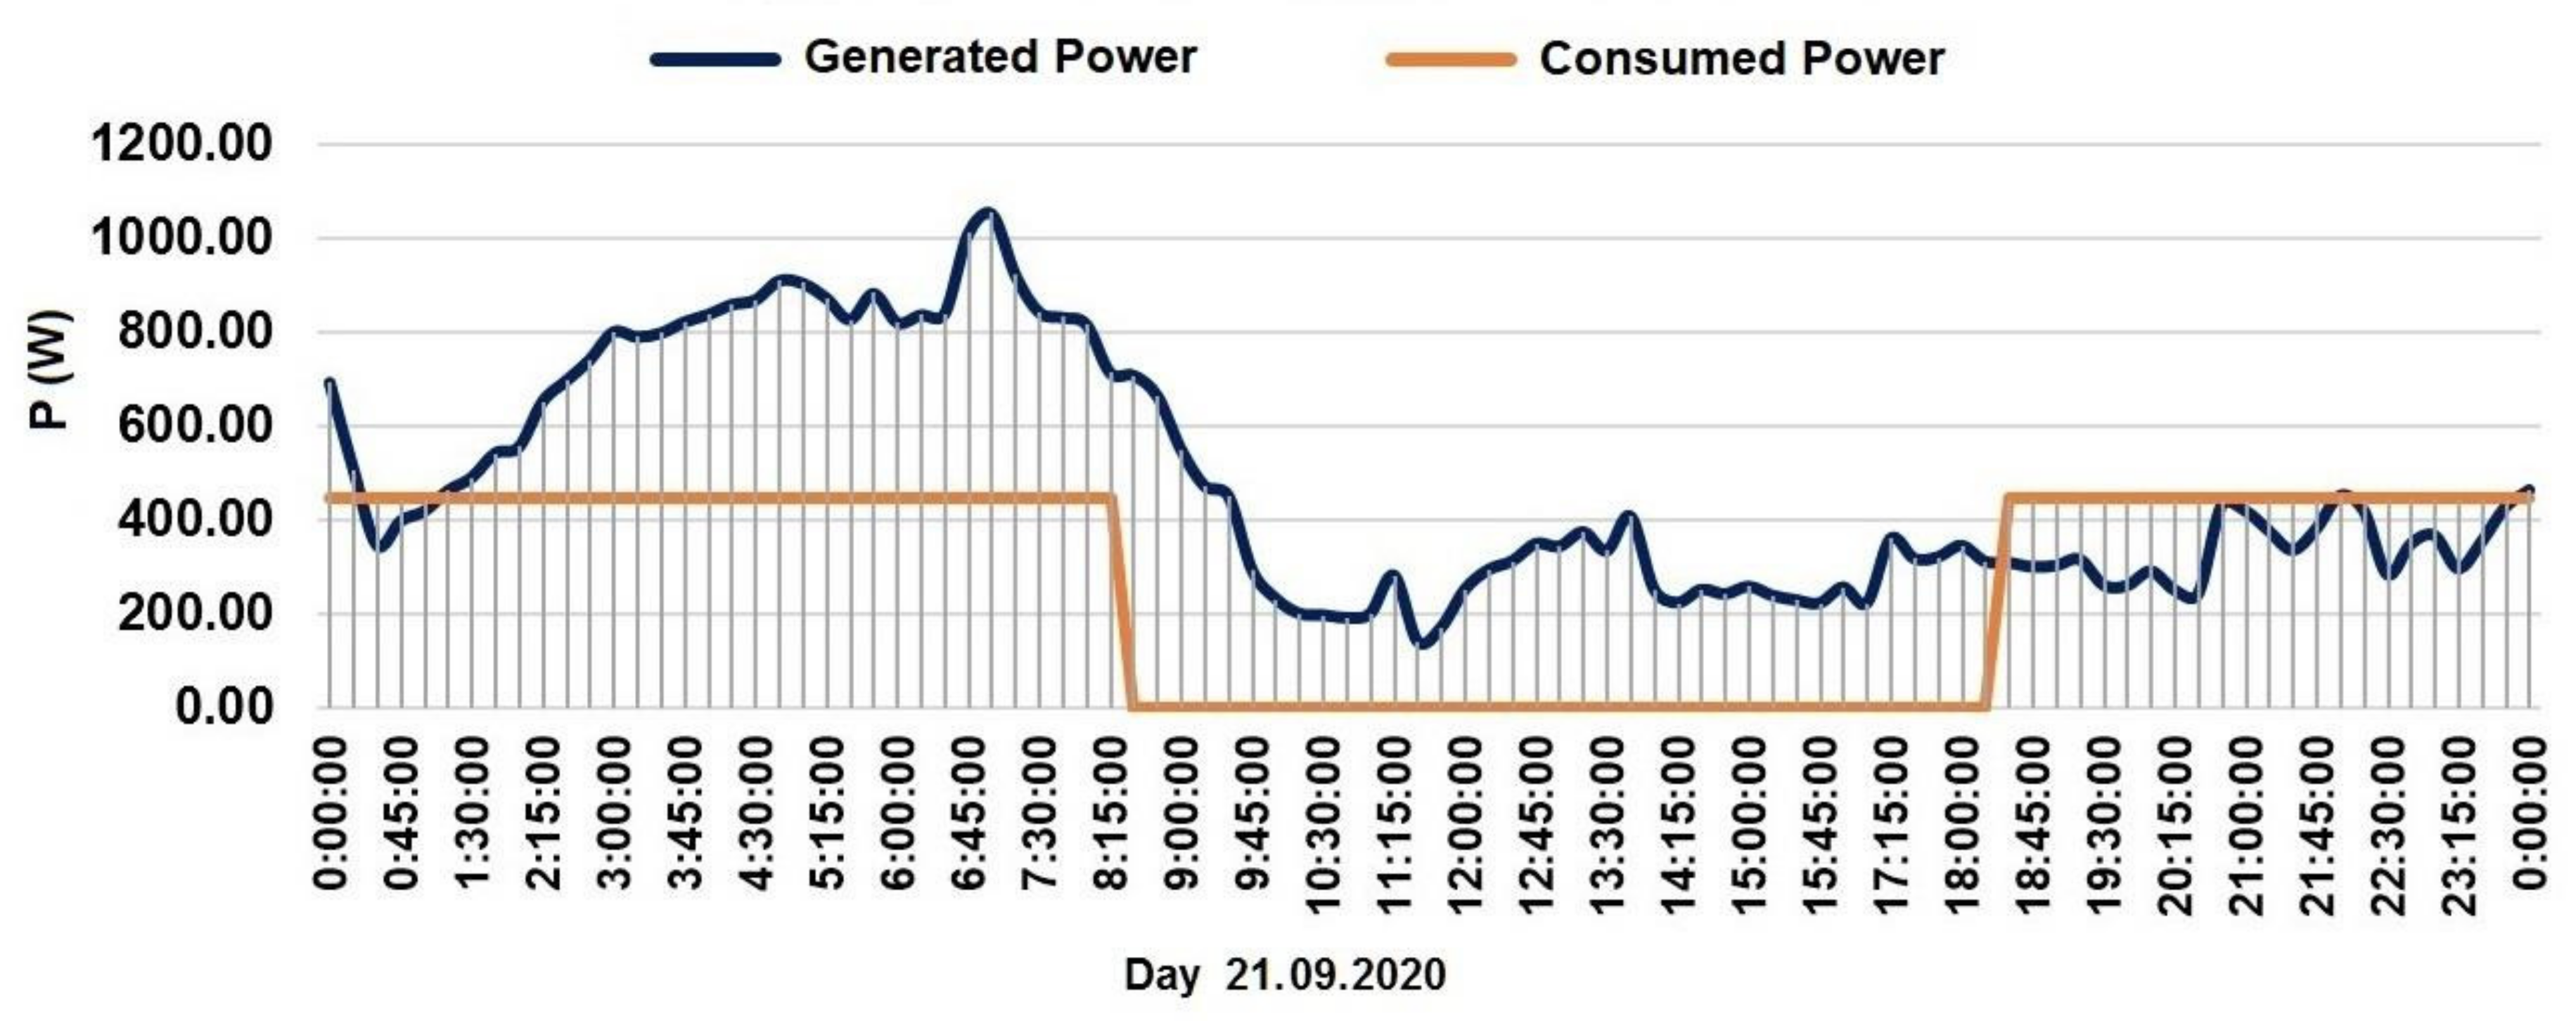
The information obtained allowed the energy produced in each period of time to be presented. These values could be analyzed and compared with the energy consumption requirements of the lighting installation. For the chosen reference day, the total energy produced amounted to 11,176.81 W·h/d. On the other hand, the total energy consumed by the proposed installation was 6333.33 W·h/d (see Figure 12). These data were the basis of the calculation to establish the capacity of the batteries necessary for the installation, which is presented in the next chapter.
4. Discussion
Based on the data generated, the average operation values of the water distribution network were established as those measured on 21 September, 2020. Under this premise of evaluation, the following aspects of the experiment will be discussed: the energy conversion efficiency achieved and evaluation of the suitability of the experimental installation; calculation of the maximum load that can be powered with reliability under the premises of this work and the required battery capacity; the comparison of the proposed installation with its equivalent powered using PV modules, paying particular attention to the additional needs of the energy storage capacity to provide service assurance and the associated costs involved and, finally, the results of extrapolating all the energy that could be recovered from the water distribution facility if the total flow from the main pipeline is derived from the PRV and driven into the ERT.
The calculations carried out for the evaluation and sizing of the energy recovery installation were made using a daily period of use of the luminaires of 14.5 h. This is slightly more than the length of the longest night during the winter solstice at the study location (worst case). In this way, a case with a higher energy requirement for the whole year was analyzed. The total effective consumption measured at the output of the inverter from the lighting installation was 440.42 W.
4.1. Energy Conversion Efficiency
The energy produced by the installation could be directly measured, but it could also be obtained using Equation (1), introducing the working parameters but also the performance factors of the system.
P = η (ρ g ΔH) Q
- P: Generated power [W]
- ΔH: Pressure jump in the turbine or pressure drop in the PVR [m]
- Q: Water flow through the turbine [m3/s]
- η: Global system performance. η = ηelectric × ηhydraulic
- ρ: Water density: 1000 [kg/m3]
- g: Gravity: 9.81 [m/s2]
The manufacturer of the ERT used indicates that, working on nominal conditions, its electrical performance is 85% and its hydraulic performance is 70%. The overall theoretical performance ratio is the product of these two values, which results in 59.5%. Considering the instantaneous values of power generation measures introduced in this equation, along with their related working parameters, the average real value of the overall performance obtained for the date of reference was 58%. This value is lower but close enough to the theoretical value, considering that the ERT was working with a water flow lower than the nominal value of the turbine.
4.2. Maximum Load to Be Powered and Optimized Battery Capacity
To establish the maximum number of luminaires that could be powered with a given ERT installation, it was necessary to know the maximum energy that could be generated with the daily flow of water. Afterwards, the necessary energy storage capacity to (a) transfer all the daily production to the night period, (b) store the excess punctual energy if the generation overpasses the consumption in any specific moment and (c) complement any situation when the energy demand is higher than the production will be obtained. These three situations can be observed in Figure 13.
With the information obtained from Figure 13, equating the area of the energy produced with the power demanded multiplied by a period of 14 h 30 min (which was the maximum operating period of the lighting installation to make a conservative calculation design for the worst-case scenario), an equivalent value of the average generated power per hour of use could be obtained. In our case, the value obtained was 770.81 W (See Equation (2)), taking into account that the lighting loads were a constant value.
ΣEgenerated = Pload max × tnight → Pload max = 11,176.81 W·h/14.5 h = 770.81 W
At this point, the calculation of the capacity of the necessary battery rack could be performed. The necessity to establish a net balance of the total consumptions and generation capability in the system to have energy available for the total requirement of the luminaires during their lighting period was taken into account. To perform this calculation, a graphical method based on the calculation of storage volumes was used. The accumulated energy consumed and generated over time in the calculation period are detailed in a graph, and all the points of a maximum deficit and maximum energy surplus were established. The storage volume isw the sum of the absolute values of all of these maximums, according to Equation (3) [58]. In this study, due to the consumption and generation models, only two maximums (1 deficit and 1 surplus) were found, and the capacity value obtained was 138.32 Ah, as can be seen in Figure 14. A bigger capacity of 220.0 Ah was installed in our experiment in order to work with a sufficient margin of safety (+60%) for low energy generation days and to use standardized commercial battery models. A breakdown of the system due to a lack of energy was never recorded in the installation with this set up during a control period of 12 months of the system in operation.
4.3. Comparison with the Requirements of a Stand-Alone PV Installation
In this chapter, the necessary energy storage capacity for the same installation, in which, instead of using an ERT to fulfill its consumption needs, the municipal entity opted to use a set of photovoltaic generators with an equivalent power instead, was established in order to compare the different resulting requirements.
The mechanism used was based on the calculation of the total energy needs of the loads of the installation and then establishing the number of PV panels and battery cells with the capacity to maintain a full operation for a number of days of autonomy, determined by the seasonal conditions required in design. At our location, 3 days of autonomy ensured a sufficient minimum of service reliability, considering possible weather adversities [59].
The calculation data, the reference equations and the results obtained, considering that all of the energy consumed needed to be stored previously, were as follows:
Ploads = 770.81 W; tloads = 14.50 h/d; Vstorage = 24 VDC; ηinverter = 0.9; ηwires = 0.98; ηbatteries = 0.9
Econsumed = (Ploads × tloads/Vstorage) × ηinverter = (770.81 W × 14.5 h/24 VDC) × 0.9 = 517.44 Ah/d
Ecorrected = Econsumed/(ηwires × ηbatteries) = 517.44 Ah/d/(0.98 × 0.90) = 586.67 Ah/d
Battery Capacity = (N° of days × Ecorrected)/(Max depth of discharge × Tcorrection factor)
Battery Capacity = (3 d × 586.67 Ah/d)/(0.85 × 0.80) = 2588.24 Ah
Thus, with PV generators and the design criteria indicated, 12 identical parallel branches of two battery modules of 12 VDC and C220 Ah connected in series were required, which made a total of 24 modules. Table 3 compares the storage capacity needs of each of these two solutions and calculates the budget difference for the same execution objective. The cost of batteries in the case of the PV generator (€9840.00) was exceeded by itself, without taking into account the rest of the required costs involved (photovoltaic panels, inverters, control, etc.), the complete cost of installing of the ERT option as detailed in Table 1 (€6609.41) and the monitoring and control station architecture detailed in Table 2 (€866.35). It is also relevant that the lifetime expectation of the batteries was much lower so that the values of the rest of the elements of the installation and replacement costs must also be considered when establishing the total, long-term, required budget, including the maintenance requirements of the facility.
On the other hand, the difference of costs between PV and ERT energy generators is also relevant. According to the data provided by the National Meteorological Agency of Spain (AEMET) [60], the total annual average irradiance for our location is 5.45 hsun-peak/d. However, the solar collection value for the most unfavorable month (December) was a total irradiance of 2.36 hsun-peak/d. To have a complete guarantee of service, the number of PV modules must be calculated using this second value.
If it is considered, a 190 Wp 24 VDC PV module has maximum power point conditions of Imax = 5.20 ADC and Vmax = 36.60 VDC. The design current of the generator must be the energy required divided by the average solar collection value for the month of December in the geographical location (Design current = 586.67 Ah/d; 2.36 hsun-peak; d = 249.02 ADC). The total amount of modules of this type that are needed could be calculated by dividing the design current between its maximum power point current value (Imax) as follows:
N°modules = 249.02 ADC/5.20 ADC = 47.88 → 48 modules
Based on a price of each module of €121.00, the total cost of the PV generator system was €5808.00. This amount is more than double the cost of the equivalent vertical axis hydraulic turbine (€2173.14), as indicated in Table 1.
4.4. Data Extrapolation Using the Totel Energy Recovery Capacity of the Water Network under Study
During the experiment, both the model of the hydraulic turbine used in the installation as well as the diameter of the bypass pipe were not sized to obtain the maximum energy from the system, in order to not affect the water network operation service and to keep its execution budget within certain margins. However, it has helped to verify that it is a viable and robust system to obtain electrical energy to power a public lighting network.
Based on the data obtained, an extrapolation was made to capture the ERT installation with which the maximum amount of electrical energy can be recovered. To carry out this process, the following considerations were applied:
- Use the full mean water flow of the main pipe where the PVR is installed (400 mm diameter section) from the data measured for the month of September.
- Choose ERT equipment appropriated for this amount of flow, which works with optimum performance with a pressure drop of ΔH = 20 mH2O. This means a turbine with a Pnominal equal to 6.00 kW.
- Evaluate the maximum recoverable energy and estimate the installation costs.
- Extract civil and construction work costs from public databases for construction.
- Include a 3.33-year period of renewal of the batteries. This is the estimated battery duration with adequate working conditions for this equipment, according to its technical specifications and the level of use planned.
- Annual maintenance costs are based on the experience of the technicians of the municipality related to the general maintenance cost of their installations involving sensors and electronic control units. This would cover the replacement of small pieces and labor work costs.
- Obtaining the resulting payback and Internal Rate of Return for 10 years (IRR) of the expected inversion is needed.
The results of this extrapolation are presented in Table 4.
5. Conclusions
In this work, different alternatives used to reduce the energy footprint of municipalities, based on the implementation of renewable energy generation or recovery systems, have been listed.
Among the possible proposals, the recovery of the energy that is lost in the PRV of water supply networks stands out. This option falls within the competences of municipal authorities and adjusts, in a very adequate way, the format and the time of generation and consumption of energy, which is the supply of the luminaires that belong to the outdoors public lighting installation.
To demonstrate and assess the viability and effectiveness of this alternative, the water flows available in the network of a municipality were monitored and analyzed in depth for more than one year to assess the amount of recoverable energy. In addition, an ERT station that made a bypass of one of the PRVs of the installation was set up. It was accompanied by a control system, a battery module and an inverter to feed an electric line of luminaires. The experimental implementation showed that little physical installation space is required and that it is easy to carry out the required civil work. This paper offers an economic valuation of all the work consignments required.
This methodology is optimally adapted to sections of the water supply networks where train reservoirs are used, since they guarantee a significant water flow and continuous movement of liquid that allow power to be generated 24 h a day without cyclical dead periods, except for possible failures of the general water network. In addition, it is also possible to concentrate most of the water transportation, and thus the energy generation, in a programmed way during the night while it is needed by the outdoor lighting installation. Moreover, other complementary energy costs related to the operation of the water network are minimized in the same period, as possible pumping needs in other points are the same.
All these possibilities significantly reduce the need for energy storage devices with an ERT system, which requires, comparatively, 1200% less energy storage capacity than an equivalent solution based on PV generators. This implies consequent large economic budget reductions, achieving viable solutions with payback periods lower than 4 years.
From the point of view of sustainability, the proposed system recovers energy with more than 58% efficiency from a source that is being totally wasted on a recurring basis in most water installations around the world, creating a renewable source that is very constant, reliable and, a priori, inexhaustible.
The system has been operating for 12 months without presenting any downtime, due to neither component failure nor a lack of energy to meet the demand of the line of luminaires involved in the test. Thus, this long-term study has generated evidence of the technical and economic viability and the reliability of the implementation of ERTs. Besides this, the procedure developed provides municipal and water utility managers with a better-informed basis for pressure management and energy recovery decision making.
Author Contributions
All the authors collaborated on the experimental study and the paper development. A.O.-M. designed the study, established the parameters to be assessed, prepared the experimental setup and carried out the experimentations. A.G.-C. carried out the literature review, developed the measurement system and completed the paper writing. Finally, J.R.A.-D. developed the design of the experimental installation and contributed to its assembly, analyzed the data obtained and drafted and reviewed the paper writing. All authors have read and agreed to the published version of the manuscript.
Funding
This research was funded by the Universidad de Málaga, through its Own Research and Transfer Plan: E3. Prototype or proof of concept aids. Grant number E3/03/16.
Institutional Review Board Statement
Not applicable.
Informed Consent Statement
Not applicable.
Data Availability Statement
No more data were created or analyzed in this study other than that previously presented. Data sharing is not applicable to this article.
Acknowledgments
The authors would like to express their gratitude to the City Council of Cártama that offered the location for the installation of the study.
Conflicts of Interest
The authors declare no conflict of interest. The funders had no role in the design of the study; in the collection, analyses or interpretation of data; in the writing of the manuscript or in the decision to publish the results.
References
- European Commission. Energy Roadmap 2050; Publications Office of the European Union: Luxembourg, 2012; ISBN 978-92-79-21798-2. [Google Scholar] [CrossRef]
- Dupont, C.; Oberthür, S. Chapter 20: The European Union. In Research Handbook on Climate Governance; Bäckstrand, K., Lövbrand, E., Eds.; Edward Elgar Publishing: Cheltenham, UK, 2015; pp. 224–236. [Google Scholar] [CrossRef]
- Ceglia, F.; Esposito, P.; Marrasso, E.; Sasso, M. From smart energy community to smart energy municipalities: Literature review, agendas and pathways. J. Clean. Prod. 2020, 254, 120118. [Google Scholar] [CrossRef]
- De Coninck, H.; Revi, A.; Babiker, M.; Bertoldi, P.; Buckeridge, M.; Cartwright, A.; Dong, W.; Ford, J.; Fuss, S.; Hourcade, J.C.; et al. Strengthening and Implementing the Global Response. In Global Warming of 1.5 °C. An IPCC Special; MassonDelmotte, V., Zhai, P., Pörtner, H.O., Roberts, D., Skea, J., Shukla, P.R., Pirani, A., Moufouma-Okia, W., Péan, C., Pidcock, R., Connors, S., et al., Eds.; Intergovernmental Panel on Climate Change: Geneva, Switzerland, 2018; pp. 313–443. [Google Scholar]
- European Commission. Clean Energy for all Europeans Package. 2019. Available online: https://ec.europa.eu/energy/topics/energy-strategy/clean-energy-all-europeans_en (accessed on 19 August 2021).
- Ghiani, E.; Giordano, A.; Nieddu, A.; Rosetti, L.; Pilo, F. Planning of a smart local energy community: The case of Berchidda municipality (Italy). Energies 2019, 12, 4629. [Google Scholar] [CrossRef] [Green Version]
- Baleta, J.; Mikulčić, H.; Klemeš, J.J.; Urbaniec, K.; Duić, N. Integration of energy, water and environmental systems for a sustainable development. J. Clean. Prod. 2019, 215, 1424–1436. [Google Scholar] [CrossRef]
- Ruggiero, S.; Varho, V.; Rikkonen, P. Transition to distributed energy generation in Finland: Prospects and barriers. Energy Policy 2015, 86, 433–443. [Google Scholar] [CrossRef]
- Blanchet, T. Struggle over energy transition in Berlin: How do grassroots initiatives affect local energy policy-making? Energy Policy 2015, 78, 246–254. [Google Scholar] [CrossRef]
- Hoicka, C.E.; Conroy, J.; Berka, A.L. Reconfiguring actors and infrastructure in city renewable energy transitions: A regional perspective. Energy Policy 2021, 158, 112544. [Google Scholar] [CrossRef]
- Gutberlet, J. Waste to energy, wasting resources and livelihoods. In Integrated Waste Management; Sunil-Kumar, S., Ed.; IntechOpen: London, UK, 2011; Volume 1, pp. 219–236. [Google Scholar] [CrossRef]
- Engelken, M.; Römer, B.; Drescher, M.; Welpe, I. Transforming the energy system: Why municipalities strive for energy self-sufficiency. Energy Policy 2016, 98, 365–377. [Google Scholar] [CrossRef]
- Müller, M.O.; Stämpfli, A.; Dold, U.; Hammer, T. Energy autarky: A conceptual framework for sustainable regional development. Energy Policy 2011, 39, 5800–5810. [Google Scholar] [CrossRef]
- Koirala, B.P.; Koliou, E.; Friege, J.; Hakvoort, R.A.; Herder, P.M. Energetic communities for community energy: A review of key issues and trends shaping integrated community energy systems. Renew. Sust. Energ. Rev. 2016, 56, 722–744. [Google Scholar] [CrossRef] [Green Version]
- Kona, A.; Bertoldi, P.; Kılkış, Ş. Covenant of mayors: Local energy generation, methodology, policies and good practice examples. Energies 2019, 12, 985. [Google Scholar] [CrossRef] [Green Version]
- Suwa, A. Renewable energy and regional value: Identifying value added of public power producer and suppliers in japan. Fin. Res. Lett. 2020, 37, 101365. [Google Scholar] [CrossRef]
- Numbi, B.P.; Malinga, S.J. Optimal energy cost and economic analysis of a residential grid-interactive solar PV system-case of eThekwini municipality in South Africa. Appl. Energy 2017, 186, 28–45. [Google Scholar] [CrossRef]
- Prina, M.G.; Cozzini, M.; Garegnani, G.; Moser, D.; Oberegger, U.F.; Vaccaro, R.; Sparber, W. Smart energy systems applied at urban level: The case of the municipality of Bressanone-Brixen. Int. J. Sustain. Energy Plan. Manag. 2016, 10, 33–52. [Google Scholar] [CrossRef]
- Azevêdo, V.W.B.; Candeias, A.L.B.; Tiba, C. Location study of solar thermal power plant in the state of Pernambuco using geoprocessing technologies and multiple-criteria analysis. Energies 2017, 10, 1042. [Google Scholar] [CrossRef] [Green Version]
- Østergaard, P.A.; Mathiesen, B.V.; Möller, B.; Lund, H. A renewable energy scenario for Aalborg Municipality based on low-temperature geothermal heat, wind power and biomass. Energy 2010, 35, 4892–4901. [Google Scholar] [CrossRef]
- Magnani, N. Beyond NIMBY: Mobilization against mini-hydroelectric power in the Italian alps. Mt. Res. Dev. 2020, 40, 31–36. [Google Scholar] [CrossRef]
- Weinand, J.M.; McKenna, R.; Kleinebrahm, M.; Mainzer, K. Assessing the contribution of simultaneous heat and power generation from geothermal plants in off-grid municipalities. Appl. Energy 2019, 255, 113824. [Google Scholar] [CrossRef]
- Beiron, J.; Normann, F.; Johnsson, F. A Case Study of the Potential for CCS in Swedish Combined Heat and Power Plants. In Proceedings of the 15th Greenhouse Gas Control Technologies Conference, Lyon, France, 15–18 March 2021; Available online: https://ssrn.com/abstract=3811373 (accessed on 18 February 2022).
- Kollmann, R.; Neugebauer, G.; Kretschmer, F.; Truger, B.; Kindermann, H.; Stoeglehner, G.; Narodoslawsky, M. Renewable energy from wastewater-Practical aspects of integrating a wastewater treatment plant into local energy supply concepts. J. Clean. Prod. 2017, 155, 119–129. [Google Scholar] [CrossRef]
- Cudjoe, D.; Han, M.S. Economic and environmental assessment of landfill gas electricity generation in urban districts of Beijing municipality. Sustain. Prod. Consum. 2020, 23, 128–137. [Google Scholar] [CrossRef]
- Pérez-Sánchez, M.; Sánchez-Romero, F.J.; Ramos, H.M.; López-Jiménez, P.A. Energy recovery in existing water networks: Towards greater sustainability. Water 2017, 9, 97. [Google Scholar] [CrossRef] [Green Version]
- Corcoran, L.; Coughland, P.; McNabola, A. Energy recovery potential using micro hydropower in water supply networks in the UK and Ireland. Water Sci. Tech. Water Supply 2013, 13, 552–560. [Google Scholar] [CrossRef]
- Carravetta, A.; Del Giudice, G.; Fecarotta, O.; Ramos, H.M. PAT design strategy for energy recovery in water distribution networks by electrical regulation. Energies 2013, 6, 411–424. [Google Scholar] [CrossRef] [Green Version]
- McNabola, A.; Coughlan, P.; Corcoran, L.; Power, C.; Prysor Williams, A.; Harris, I.; Gallagher, J.; Styles, D. Energy recovery in the water industry using micro-hydropower: An opportunity to improve sustainability. Water Policy 2014, 16, 168–183. [Google Scholar] [CrossRef]
- Carravetta, A.; Fecarotta, O.; Del Giudice, G.; Ramos, H. Energy recovery in water systems by PATs: A comparisons among the different installation schemes. Procedia Eng. 2014, 70, 275–284. [Google Scholar] [CrossRef] [Green Version]
- Su, P.A.; Karney, B. Micro hydroelectric energy recovery in municipal water systems: A case study for Vancouver. Urban Water J. 2015, 12, 678–690. [Google Scholar] [CrossRef]
- Samora, I.; Manso, P.; Franca, M.J.; Schleiss, A.J.; Ramos, H.M. Energy recovery using micro-hydropower technology in water supply systems: The case study of the city of Fribourg. Water 2016, 8, 344. [Google Scholar] [CrossRef] [Green Version]
- Patelis, M.; Kanakoudis, V.; Gonelas, K. Pressure management and energy recovery capabilities using PATs. Procedia Eng. 2016, 162, 503–510. [Google Scholar] [CrossRef]
- Lydon, T.; Coughlan, P.; McNabola, A. Pressure management and energy recovery in water distribution networks: Development of design and selection methodologies using three pump-as-turbine case studies. Renew. Energy 2017, 114, 1038–1050. [Google Scholar] [CrossRef]
- Lima, G.M.; Brentan, B.M.; Luvizotto, E., Jr. Optimal design of water supply networks using an energy recovery approach. Renew. Energy 2018, 117, 404–413. [Google Scholar] [CrossRef]
- Carravetta, A.; Fecarotta, O.; Ramos, H. A new low-cost installation scheme of PATs for pico-hydropower to recover energy in residential areas. Renew. Energy 2018, 125, 1003–1014. [Google Scholar] [CrossRef]
- Fernández-García, I.; Ferras, D.; Mc Nabola, A. Potential of energy recovery and water saving using micro-hydropower in rural water distribution networks. J. Water Resour. Plan. Manag.-ASCE 2019, 145, 05019001. [Google Scholar] [CrossRef]
- Bonthuys, G.J.; Van Dijk, M.; Cavazzini, G. Energy recovery and leakage-reduction optimization of water distribution systems using hydro turbines. J. Water Resour. Plan. Manag. ASCE 2020, 146, 04020026. [Google Scholar] [CrossRef]
- Novara, D.; McNabola, A. Design and Year-Long Performance Evaluation of a Pump as Turbine (PAT) Pico-Hydropower Energy Recovery Device in a Water Network. Water 2021, 13, 3014. [Google Scholar] [CrossRef]
- Mesquita, A.L.A.; Blanco, C.J.C. Pump-as-turbine for energy recovery in municipal water supply networks. A review. J. Braz. Soc. Mech. Sci. Eng. 2021, 43, 489. [Google Scholar] [CrossRef]
- Telci, I.T.; Aral, M.M. Optimal energy recovery from water distribution systems using smart operation scheduling. Water 2018, 10, 1464. [Google Scholar] [CrossRef] [Green Version]
- Alberizzi, J.C.; Renzi, M.; Nigro, A.; Rossi, M. Study of a Pump-as-Turbine (PaT) speed control for a Water Distribution Network (WDN) in South-Tyrol subjected to high variable water flow rates. Energy Procedia 2018, 148, 226–233. [Google Scholar] [CrossRef]
- Stefanizzi, M.; Capurso, T.; Balacco, G.; Binetti, M.; Camporeale, S.M.; Torresi, M. Selection, control and techno-economic feasibility of Pumps as Turbines in Water Distribution Networks. Renew. Energy 2020, 162, 1292–1306. [Google Scholar] [CrossRef]
- Satish, D.; Doshi, A.; Bade, M. Review on Pump as Turbine Application in Water Distribution Networks for Power Generation. In AIP Conference Proceedings; AIP Publishing LLC: Melville, NY, USA, 2021; Volume 2341, p. 030035. [Google Scholar] [CrossRef]
- Fontanella, S.; Fecarotta, O.; Molino, B.; Cozzolino, L.; Della Morte, R. A Performance Prediction Model for Pumps as Turbines (PATs). Water 2020, 12, 1175. [Google Scholar] [CrossRef] [Green Version]
- Balacco, G.; Binetti, M.; Capurso, T.; Stefanizzi, M.; Torresi, M.; Piccinni, A.F. Pump as Turbine for the Energy Recovery in a Water Distribution Network: Two Italian (Apulian) Case Studies. Environ. Sci. Proc. 2020, 2, 1. [Google Scholar] [CrossRef]
- Binama, M.; Su, W.T.; Li, X.B.; Li, F.C.; Wei, X.Z.; An, S. Investigation on pump as turbine (PAT) technical aspects for micro hydropower schemes: A state-of-the-art review. Renew. Sust. Energ. Rev. 2017, 79, 148–179. [Google Scholar] [CrossRef]
- Montoya, F.G.; Peña-García, A.; Juaidi, A.; Manzano-Agugliaro, F. Indoor Lighting Techniques: An Overview of Evolution and New Trends for Energy Saving. Energy Build. 2017, 140, 50–60. [Google Scholar] [CrossRef]
- Sei-Ping, F.; Weddell, A.S.; Merrett, G.V.; White, N.M. Energy-Neutral Solar-Powered Street Lighting with Predictive and Adaptive Behaviour. In Proceedings of the 2nd International Workshop on Energy Neutral Sensing Systems, New York, NY, USA, 30 May 2018; pp. 13–18. [Google Scholar]
- Prescient & Strategic Intelligence Private Limited. Solar Street Lighting Market; Report Code: SE11228; Prescient & Strategic Intelligence Private Limited: Delhi, India, 2020. [Google Scholar]
- MNRE (Ministry of New and Renewable Energy). Launch of Atal Jyoti Yojana (AJAY): Phase II; NO 32/30/2018-SPV; Lodhi Road; Goberment of India: New Delhi, India, 2018. Available online: https://mnre.gov.in/img/documents/uploads/file_f-1583485483869.pdf (accessed on 16 February 2022).
- Solar Power Europe. Global Market Outlook For Solar Power 2021—2025; Solar Power Europe: Brussels, Belgium, 2021; ISBN 9789464073492. [Google Scholar]
- Ocana-Miguel, A.; Andres-Diaz, J.R.; Navarrete-de Galvez, E.; Gago-Calderon, A. Adaptation of an Insulated Centralized Photovoltaic Outdoor Lighting Installation with Electronic Control System to Improve Service Guarantee in Tropical Latitudes. Sustainability 2021, 13, 1925. [Google Scholar] [CrossRef]
- Tallini, A.; Vallati, A.; Cedola, L. Applications of micro-CAES systems: Energy and economic analysis. Energy Procedia 2015, 82, 797–804. [Google Scholar] [CrossRef] [Green Version]
- Besharat, M.; Dadfar, A.; Viseu, M.T.; Brunone, B.; Ramos, H.M. Transient-flow induced compressed air energy storage (TI-CAES) system towards new energy concept. Water 2020, 12, 601. [Google Scholar] [CrossRef] [Green Version]
- Hernández-Callejo, L.; Gallardo-Saavedra, S.; Alonso-Gómez, V. A review of photovoltaic systems: Design, operation and maintenance. Sol. Energy 2019, 188, 426–440. [Google Scholar] [CrossRef]
- Rodríguez-Pérez, Á.M.; Pérez-Calañas, C.; Pulido-Calvo, I. Energy Recovery in Pressurized Hydraulic Networks. Water Resour Manag. 2021, 35, 1977–1990. [Google Scholar] [CrossRef]
- Rippl, W. The Capacity of Storage-Reservoirs for Water Supply. In Minutes of the Proceedings of the Institution of Civil Engineers; Thomas Telford-ICE Virtual Library: London, UK, 1883; Volume 71, pp. 270–278. ISSN 1753-7843. [Google Scholar]
- Solar Energy International. Photovoltaics: Design and Installation Manual; New Society Publishers: Gabriola Island, BC, Canada, 2004; ISBN1 9781550924046. Available online: https://www.solarpowereurope.org/wp-content/uploads/2021/07/SolarPower-Europe_Global-Market-Outlook-for-Solar-2021-2025_V1.pdf (accessed on 18 February 2022)ISBN2 9781550924046.
- Sancho Ávila, J.M.; Riesco Martín, J.; Jiménez Alonso, C.; Sánchez de Cos, M.D.C.; Montero Cadalso, J.; López Bartolomé, M. Atlas de Radiación Solar en España Utilizando datos del SAF de Clima de EUMETSAT. AEMET. 2012. Available online: http://www.aemet.es/documentos/es/serviciosclimaticos/datosclimatologicos/atlas_radiacion_solar/atlas_de_radiacion_24042012.pdf (accessed on 18 February 2022).
Figure 1.
Geographical distribution of the drinking water network in Cártama (Spain).

Figure 2.
Synoptic diagram of the drinking water distribution network in Cártama (Spain).

Figure 3.
Schematic of the ERT bypass installed on the existing PRV.

Figure 4.
Characteristic curves of the operation of the micro turbine 050-B0 obtained on a test bench by the manufacturer (Tecnoturbines S.L.).
Figure 4.
Characteristic curves of the operation of the micro turbine 050-B0 obtained on a test bench by the manufacturer (Tecnoturbines S.L.).

Figure 5.
Experimental system site. The three main compartments are detailed. Reducing valve (bottom left); ERT (top left) and energy storage and control panel (right).
Figure 5.
Experimental system site. The three main compartments are detailed. Reducing valve (bottom left); ERT (top left) and energy storage and control panel (right).

Figure 6.
Electro-hydraulic assembly diagram of the ERT in the water network and its connections.

Figure 7.
Detailed image of the components of the executed installation. (Left) The sequence of the ERT, sensors and control elements. (Right) Components of the control panel, batteries and inverter.
Figure 7.
Detailed image of the components of the executed installation. (Left) The sequence of the ERT, sensors and control elements. (Right) Components of the control panel, batteries and inverter.

Figure 8.
Visual diagram of the energy recovery installation monitoring system.

Figure 9.
Water flow curves measured in the PRV during the months between July (top), August (second from the top), September (third the from top) and October (bottom).
Figure 9.
Water flow curves measured in the PRV during the months between July (top), August (second from the top), September (third the from top) and October (bottom).

Figure 10.
Detail of the maximum fluctuation of the flows measured in the PRV pipeline during the month of September (reference month; +1% over the year average).
Figure 10.
Detail of the maximum fluctuation of the flows measured in the PRV pipeline during the month of September (reference month; +1% over the year average).

Figure 11.
Water flows circulating in the ERT pipeline in the month of September.

Figure 12.
Energy produced and consumed (with a theoretical consumption of 14.5 h of lighting operation, with the longest night of the year as a worst-case scenario) on an average day of September.
Figure 12.
Energy produced and consumed (with a theoretical consumption of 14.5 h of lighting operation, with the longest night of the year as a worst-case scenario) on an average day of September.

Figure 13.
Energy produced and consumed on the average generation day and a calculation of the transposition of all the energy generated to the nighttime hours of use of the luminaires.
Figure 13.
Energy produced and consumed on the average generation day and a calculation of the transposition of all the energy generated to the nighttime hours of use of the luminaires.

Figure 14.
Net available energy balance (generated vs. consumed) and the contribution of supplement energy stored in batteries to ensure that the balance was always positive.
Figure 14.
Net available energy balance (generated vs. consumed) and the contribution of supplement energy stored in batteries to ensure that the balance was always positive.


Table 1.
Technical parameters and cost of the equipment used in the energy generator system.
| Vertical Axis Hydraulic Turbine (×1) | |
|---|---|
| Model and Manufacturer | 050-B0//Tecnoturbines S.L. |
| Nominal power | 1.6 kW |
| Inlet and outlet diameter | 50 mm |
| Body and impeller material | Gray iron castings |
| Flow rate and nominal pressure | 13.5 L/s//20.0 mH2O |
| Efficiency generator | 85% |
| Price per unit | €2173.14 |
| Battery Module (×2) | |
| Model and Manufacturer | Meba-12/20//Bornay |
| Technology | AGM |
| Nominal voltage | 12 VDC |
| Nominal Capacity (C10) | 220 Ah |
| Useful Capacity (80% discharge) | 176 Ah |
| Price per unit | €410.00 |
| ERT Control Panel (×1) | |
| Model and Manufacturer | SN HE 000//Tecnoturbines S.L. |
| Maximum voltage Battery voltage | 3 × 142 VDC 24 VDC |
| Maximum battery current | 100 A |
| Price per unit | €2583.04 |
| Inverter (×1) | |
| Model and Manufacturer | Phoenix 24/1600//Victron Energy |
| Input voltage | 24 VDC (Range 19–33 VDC) |
| Output voltage | 230 VAC-50 Hz |
| AC power output | 1300 W @25 °C/1200 W @40 °C |
| Conversion efficiency | 94% |
| Price per unit | €813.00 |
| Solenoide Valve (×1) | |
| Model and Manufacturer | GGG40//Hidroconta |
| Input voltage | 12 VDC |
| Nominal pressure | 0.16 Pa |
| Price per unit | €220.23 |
Table 2.
Technical parameters and cost of the equipment used for data collection in this study.
| Datalogger (×1) | |
|---|---|
| Model and Manufacturer | Nemos LP GPRS//Microcom |
| Input power | 5–15 VDC (40 mA) |
| Communications Digital//Analog inputs Memory | Siemens MC55 i GSM Modem 8//4 Flash 256 kB |
| Price per unit | €399.00 |
| Water Meter (×1) | |
| Model and Manufacturer | WT//Conthidra S.L. |
| Nominal diameter | 50 mm |
| Maximum//minimum flow | 50 m3/h//1 m3/h |
| Permanent flow Pulse factor | 40 m3/h 10 L/impulse |
| Price per unit | €204.55 |
| Current Sensor Transformer (×1) | |
| Model and Manufacturer | AMPER 0//Remberg |
| Input voltage | 24 VDC (Range 11–35 VDC) |
| Measurement range | 0//50 ADC |
| Output signal | 4–20 mA |
| Price per unit | €32.80 |
| Pressure Transducer (×2) | |
| Model and Manufacturer | MBS 3000//Danfoss |
| Input voltage | 9–32 VDC |
| Measurement range | 0–16 Bar |
| Output signal | 4–20 mA |
| Price per unit | €115.00 |
Table 3.
Economic savings in energy storage capacity costs for equivalent ERT and PV generators for public lighting installations.
Table 3.
Economic savings in energy storage capacity costs for equivalent ERT and PV generators for public lighting installations.
| Energy Generation System. | Energy Storage Requirements (24 VDC) | Battery Modules C220 Ah (12 VDC) | Total Cost of Batteries |
|---|---|---|---|
| ERT | 138.32 Ah | 2 Units | €820.00 |
| PV modules | 2588.24 Ah * | 24 Units | €9840.00 |
| Economic savings | €9020.00 | ||
* Capacity required to operate for three days without energy generation. Considering Load = 770.81 W; Daily operation time: 14.5 h; Battery Price (1 module C220 Ah 12 VDC): €410.
Table 4.
Development of an ERT installation to recover all the dissipated energy in the PRV of the studied water network.
Table 4.
Development of an ERT installation to recover all the dissipated energy in the PRV of the studied water network.
| Initial Investment | |
|---|---|
| Equipment (ERT generator + batteries + control box and taxes) | €8800.00 |
| Hydraulic installation | €1500.00 |
| Electric connection | €1200.00 |
| Civil works | €5000.00 |
| Commissioning | €1000.00 |
| Technical-Economic Data | |
| Nominal generation power | 6.00 kW |
| Production (hours per year) | 8322.00 h |
| Annual produced energy | 49,932.00 kW h |
| Energy price (AC grid) | €0.13/kW h |
| Annual savings (Electricity) | €6491.16 |
| Renewal period of the batteries | 3.33 years |
| Annual maintenance cost | €390.00 |
| Project Profitability | |
| Annual increase of the prices (average) | 2% |
| Payback | 3.79 year |
| Internal Rate of Return (10 years) | 24% |
Publisher’s Note: MDPI stays neutral with regard to jurisdictional claims in published maps and institutional affiliations. |
© 2022 by the authors. Licensee MDPI, Basel, Switzerland. This article is an open access article distributed under the terms and conditions of the Creative Commons Attribution (CC BY) license (https://creativecommons.org/licenses/by/4.0/).
Share and Cite
MDPI and ACS Style
Ocana-Miguel, A.; Gago-Calderon, A.; Andres-Diaz, J.R. Experimental Outdoor Public Lighting Installation Powered by a Hydraulic Turbine Installed in the Municipal Water Supply Network. Water 2022, 14, 710. https://doi.org/10.3390/w14050710
AMA Style
Ocana-Miguel A, Gago-Calderon A, Andres-Diaz JR. Experimental Outdoor Public Lighting Installation Powered by a Hydraulic Turbine Installed in the Municipal Water Supply Network. Water. 2022; 14(5):710. https://doi.org/10.3390/w14050710
Chicago/Turabian StyleOcana-Miguel, Antonio, Alfonso Gago-Calderon, and Jose Ramon Andres-Diaz. 2022. "Experimental Outdoor Public Lighting Installation Powered by a Hydraulic Turbine Installed in the Municipal Water Supply Network" Water 14, no. 5: 710. https://doi.org/10.3390/w14050710
Note that from the first issue of 2016, this journal uses article numbers instead of page numbers. See further details here.