Article

Physical Clogging Characteristics and Water Quality Variations by Injecting Secondary Effluent into Porous Media: A Laboratory Column Study

1
Key Laboratory of Songliao Aquatic Environment, Ministry of Education, School of Municipal and Environmental Engineering, Jilin Jianzhu University, Changchun 130118, China
2
School of Environment, Northeast Normal University, Changchun 130117, China
*
Author to whom correspondence should be addressed.
Water 2022, 14(5), 701; https://doi.org/10.3390/w14050701
Submission received: 22 November 2021 / Revised: 19 February 2022 / Accepted: 21 February 2022 / Published: 23 February 2022
(This article belongs to the Section Hydrogeology)

Abstract

:
Artificial recharge engineering has been widely used to solve the water resource crisis. However, there are still some safety hazards regarding reclaimed water quality. Here, chlorinated secondary effluent (SE) was injected into saturated porous media composed of high–purity quartz sands. The column experiment was conducted and modeled through a developed numerical model to predict the evolution of physical clogging. Some representative inorganic and organic indicators were measured both at different times and in different column sections. The study showed that the relative hydraulic conductivity (K/K0) decreased significantly by approximately 63.5% in 40 h. Especially for the first 3 cm of the column, the clogging was the most serious, with a decrease of approximately 85.8%. The porous media has a certain degree of filtration effect on turbidity, TOC, protein (Pr) and polysaccharide (PS) but has slight removal for other water quality indicators. Pr is the main component of the intercepted TOC, and its content is higher than that of Ps. Moreover, the inorganic and organic parameter variations along the column further verified that the organic floc particles were mainly retained in the first 3 cm. The 3D excitation/emission matrix (3DEEM) fluorescence spectra illustrated that the humic acids and fulvic acids were easy to release and that their injection may be harmful to groundwater quality. The study will lay a theoretical foundation and provide a guiding scheme for optimizing China’s reclaimed water reuse technology, ensuring the safety of reclaimed water quality.

1. Introduction

Recently, there have been increasing demands for artificial recharge to meet the challenge of the water resource crisis. This technology can not only supplement groundwater resources but also improve recharge water quality through soil aquifer treatment systems [1]. A variety of water types can be used as the recharge water source, including surface waters from rivers and lakes, stormwater and treated sewage [2,3]. Considering that the rain rarely falls in some regions, treated wastewater effluent from the wastewater treatment plant (WWTP) becomes the main water source for a wide variety of applications, especially for recycling and reuse [4,5]. Especially in many developing countries, primary effluent is directly injected into soil aquifer treatment for wastewater treatment and reuse [6]. Limited to the existing water quality standards for groundwater recharge, the biggest problem during injection is clogging, especially physical clogging [7,8,9]. Physical clogging would inevitably lead to changes in some water quality indicators, resulting in potential risks to the soil aquifer system and underground water environment. Physical clogging may change the pore seepage characteristics of the porous media, thus affecting the transport and fate of solutes or particles [10,11,12]. Therefore, fully understanding the evolution of physical clogging and the corresponding changes in some representative water quality indicators during recharge is the theoretical basis for preventing water pollution risks.
The essence of physical clogging is mainly caused by the transport and deposition of particles. There has been some research exploring the clogging mechanism and the according influence factors intervening in the transport and fate of micro/nanoscale particles [13,14,15]. The transport mechanism of particles includes interception, diffusion and sedimentation processes, which are similar to deep bed filtration [16,17]. Particle retention is mainly influenced by straining, gravity and buoyancy, hydrodynamics and physicochemical interaction [18,19,20]. Particle transport and deposition kinetics are strongly dependent on a range of factors including particle concentration [21], particle size [22] and density [23], temperature [24], hydraulic operating conditions [25], flow velocity and solution chemistry (ionic strength, pH) [26,27]. Under chemically unfavorable attachment conditions, hydrodynamic forces will impact the attachment efficiency. Hence, the attachment of particles to the collectors in the secondary minimum is a function of hydrodynamics and solution chemistry [28,29]. Meanwhile, we also determined that the deposition morphology of particles has an important influence on physical clogging [30,31]. These studies provide a more theoretical basis for preventing physical clogging and improving the water quality standards for underground recharge.
For treated wastewater from WWTP, primary effluent causes a rapid clogging due to high suspended particles concentration [6]. The secondary effluent (SE) or tertiary effluent (TE) still has the characteristics of high turbidity, high salinity and a high content of dissolved organic matter (DOM), which often cannot meet the requirements of some specific reuse purposes. In particular, the environmental behavior of DOM in reclaimed water during underground storage has always been the focus in the field. Some research has shown that DOM was mainly retained on the surface of soils, and DOM concentrations exhibited an exponential decline throughout the unsaturated vadose zone, in which biodegradation was considered to be the main removal mechanism [32,33]. Moreover, the soluble microbial products (SMPs) in the effluent were always ignored, which mainly comprised protein, polysaccharide and humic acids, and it has been reported that protein can promote the growth of microbial biofilm, even causing a risk of biological clogging [34]. Therefore, it is necessary to understand the migration and deposition process of SMPs during physical clogging. The solution of scientific problems can help break through the bottleneck of the water quality safety guarantee of underground reclaimed water storage.
In this paper, the laboratory column experiment was used to simulate the physical clogging process of chlorinated SE during injection. Through the one–dimension column simulation, combined with a set of analytical equations that have been used in previous studies, the temporal and spatial variations of the relative hydraulic conductivity (K/K0) were modeled. Meanwhile, the water quality variations, including some inorganic and organic indicators, at the input and output ends were measured at different time periods, and the vertical changes in different sections along the column were examined. The study observes the development trend of some organic and inorganic indicators, which can be used for the water quality risk analysis of recharge projects. The expected results will help gain a deep understanding of the formation mechanism of groundwater particulate clogging and reduce the pollution risk of particulate pollutants in reclaimed water to underground aquifers.

2. Materials and Methods

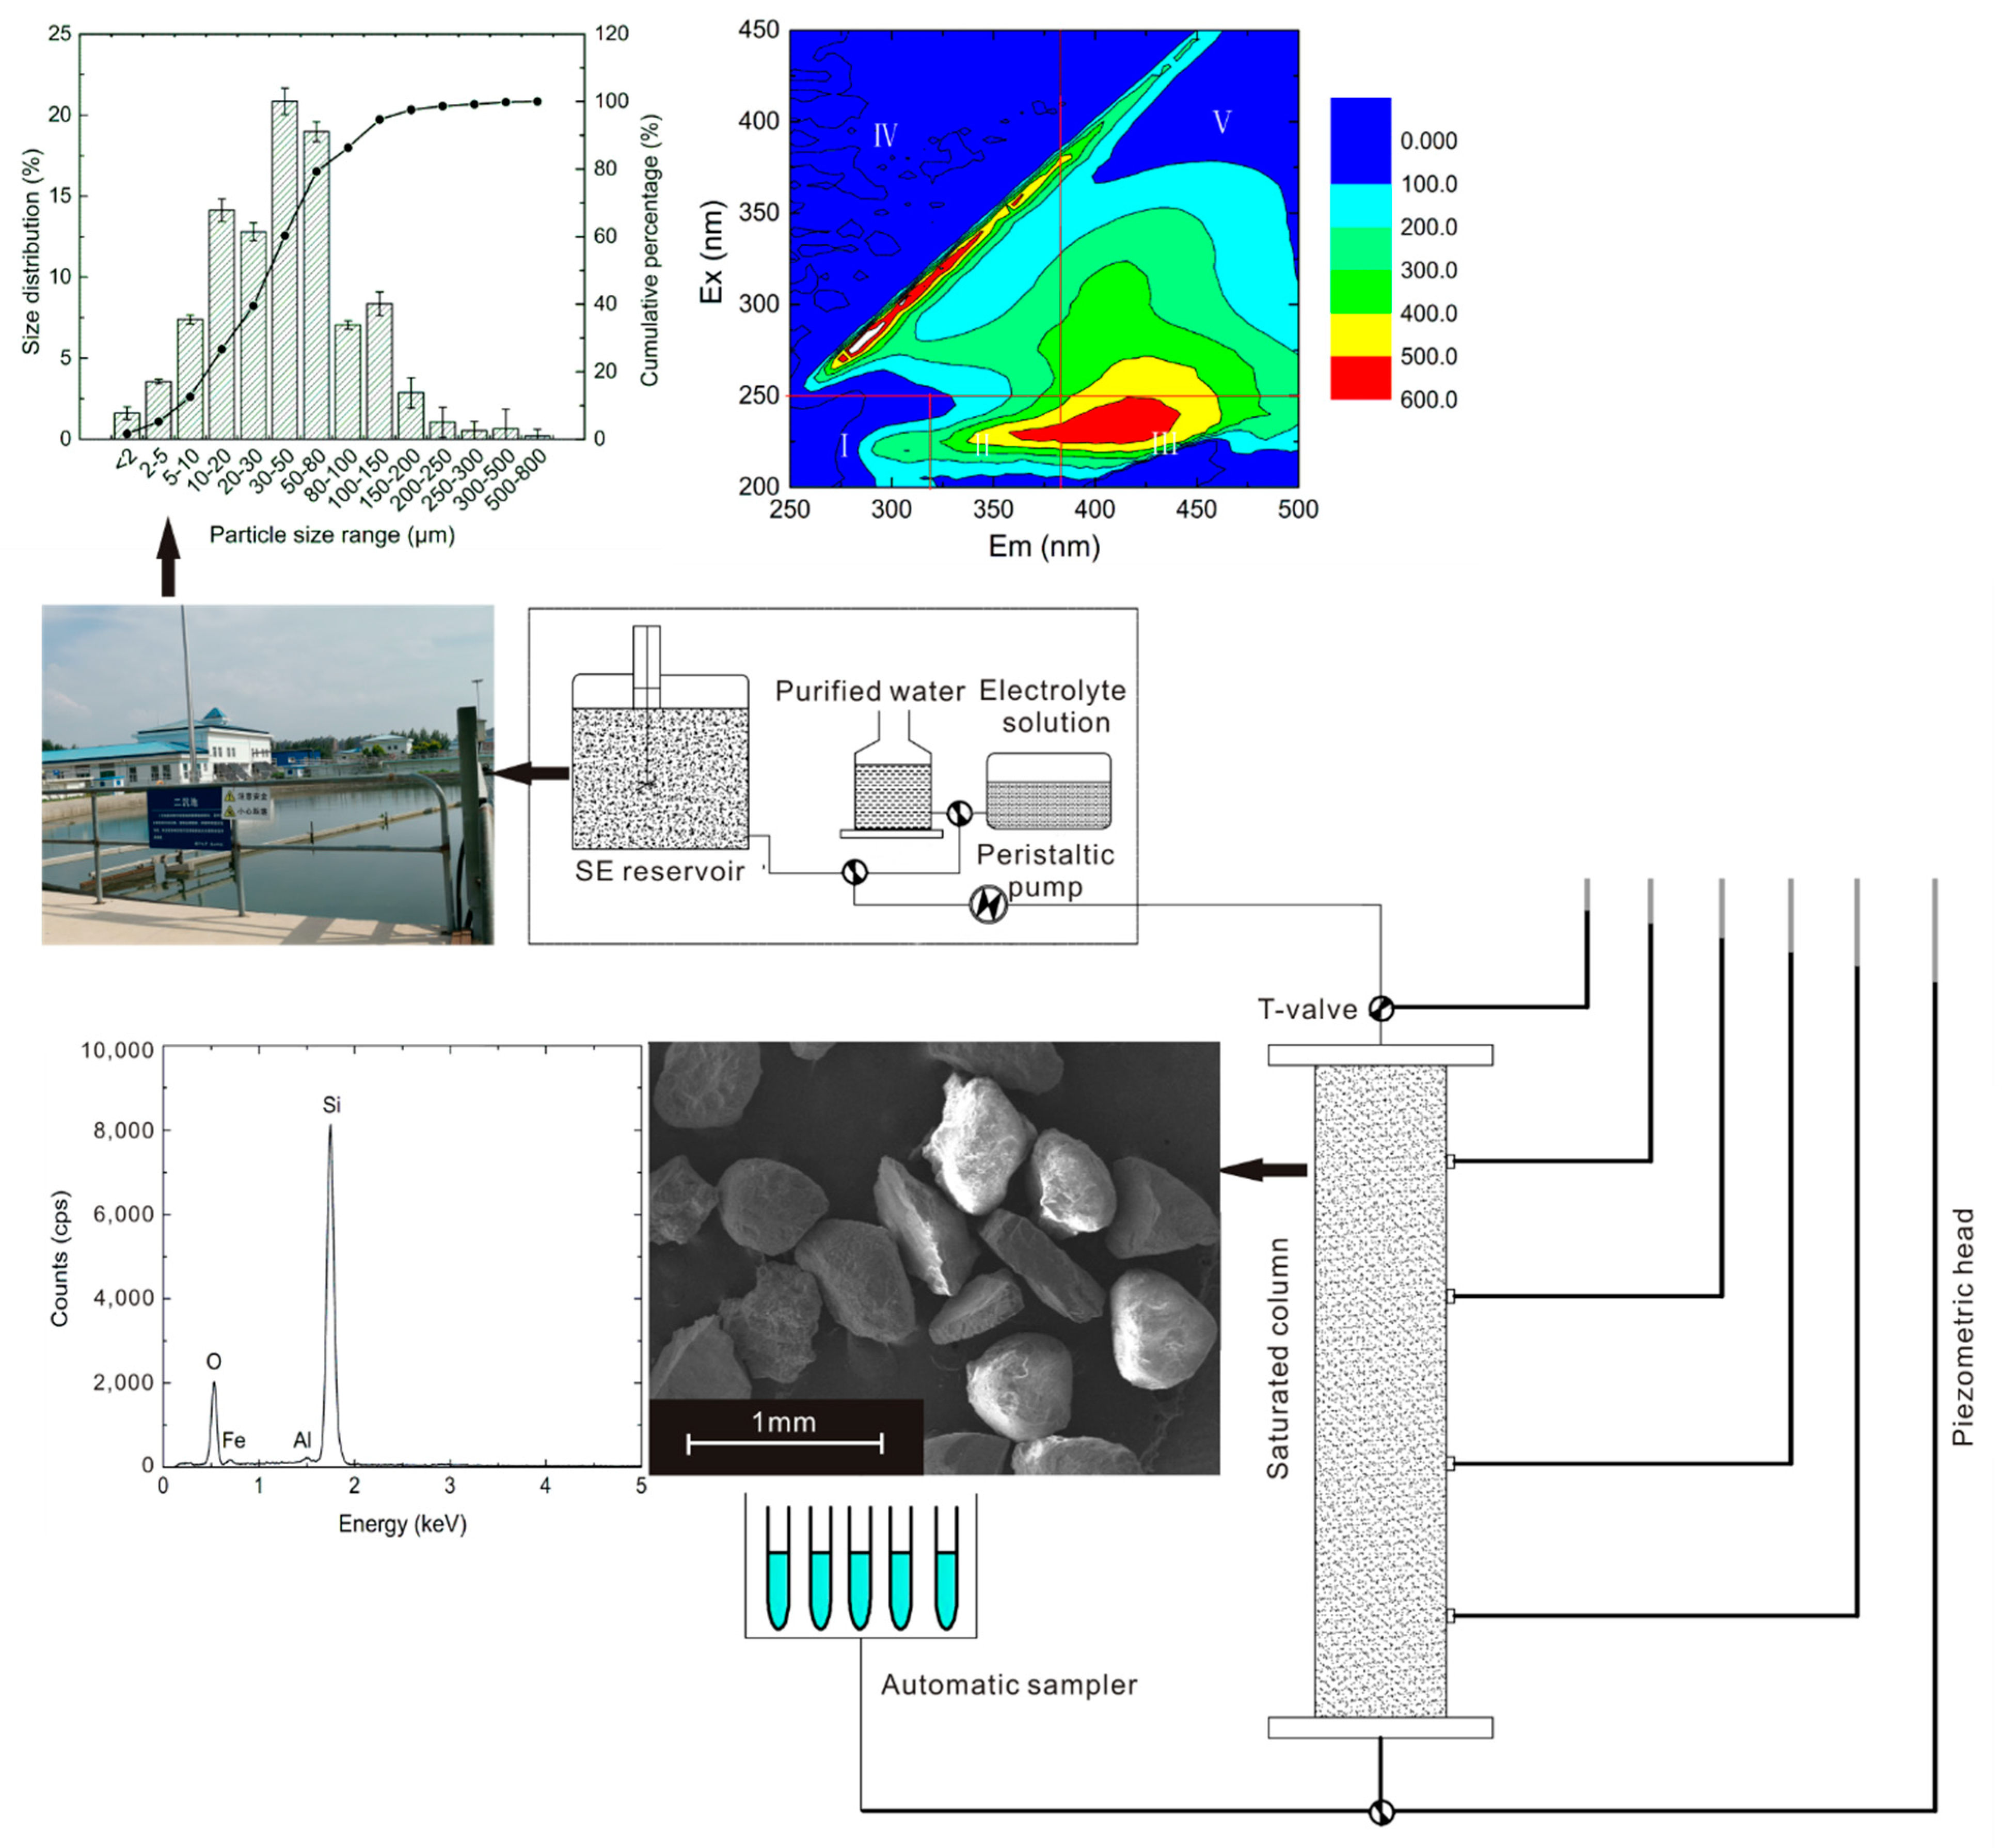
2.1. Secondary Effluent and Porous Media

The SE used in the experiment was obtained from WWTP in Changchun, China. A certain amount of sodium hypochlorite was added into the SE to prevent biological clogging. The chlorinated SE was injected into the cylindrical column. The main properties of the recharge water are shown in Table 1 and Figure 1. Figure 1 also shows the size distribution and cumulative percentage of chlorinated SE. A three–dimensional excitation–emission matrix (3DEEM) fluorescence spectra (LS–55, PerkinElmer, USA) representing fluorescence intensity versus the excitation wavelength (Ex) and the emission wavelength (Em) was obtained to evaluate the fluorescence properties and the structure of DOM [3,35,36]. Ex ranged from 200 to 450 nm, while Em ranged from 250 to 500 nm. The pH, turbidity and salinity of the obtained water samples were determined. TOC was tested by titration to ensure the accuracy of the analysis results. For the determination of other indexes, all of the water samples were filtered with a 0.45 μm filter membrane. Polysaccharide (Ps) and protein (Pr) contents were determined using the phenol–sulfuric acid method and the Bradford method, respectively [37].
Quartz sands, ranging in size from 0.45 to 0.65 mm, were used as the porous media. The sands were mainly composed of SiO2 (98.79%), containing a trace of impurities (Al2O3 0.91% and Fe2O3 0.3%). The sands were thoroughly washed several times using tap water, soaked circularly by nitric acid and sodium hydroxide and cleaned with deionized (DI) water until the pH was neutral; then, they were dried at 80 °C [30]. The clean sands were stored and used.

2.2. Column Experiment

The sands were wet–packed into the column (3 cm diameter and 21 cm length). The packed media had a porosity of 0.34 ± 0.004. Then, 100–mesh stainless–steel screens were placed at the column outlet to prevent the loss of the sands. The suspensions were injected into the column in a downward orientation at a given flow velocity of 2.04 m/h. Before the suspension was injected and purified water was injected to wash the column, the background electrolyte solution was injected to equilibrate the porous media. During the column experiment, the suspension was continuously stirred by an agitator for 40 h. The one–dimension sand column system was used to simulate the artificial recharge. The parameters such as column size, injection time and flow velocity in the experiment were set based on the empirical values from some previous research on clogging [8,22,38,39]. After the experiment, the column was dissected into 21 segments. The saturated sands were carefully excavated for the analysis of various concentration indexes. The graphical scheme of the study design is shown in Figure 2.

2.3. Darcy’s Law

Darcy’s law describes the linear relationship between the water seepage velocity and hydraulic gradient in saturated sands.
ν = k i
i = Δ H L
where L is the length of the seepage path, ΔH is the head loss along L, K is the hydraulic conductivity and i is the hydraulic gradient, that is, the head loss on the unit seepage path.

3. Results and Discussion

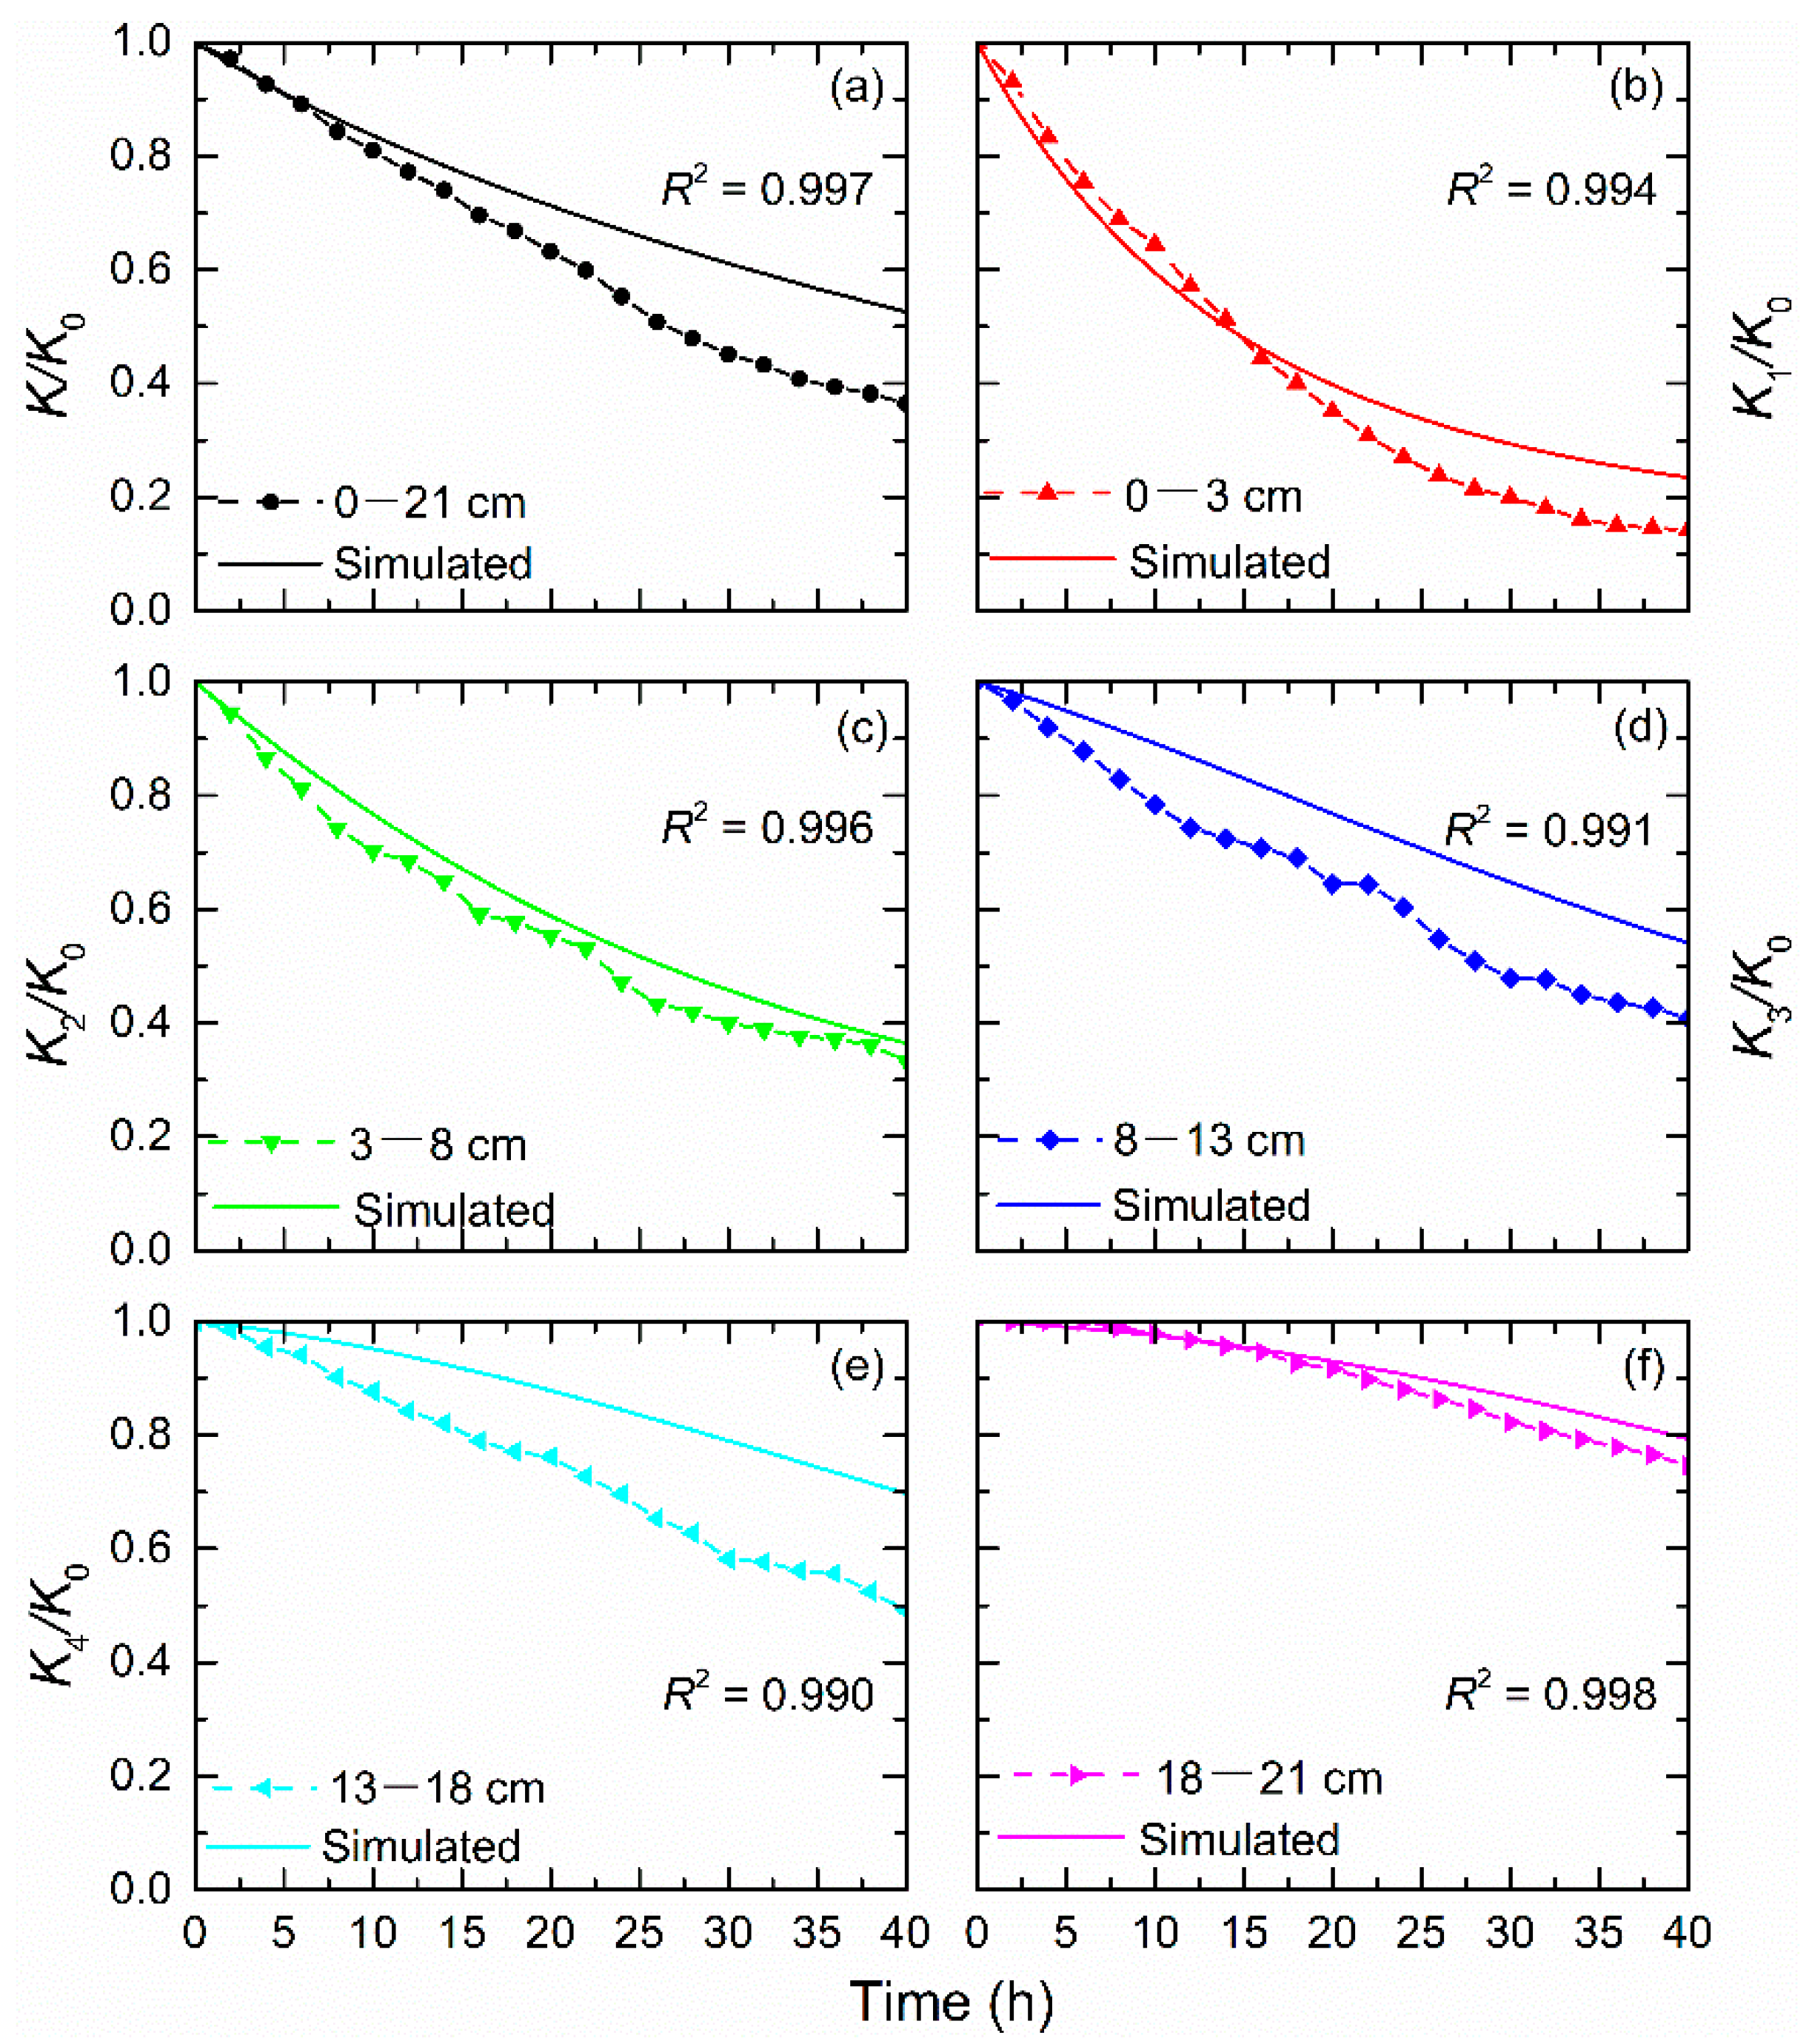
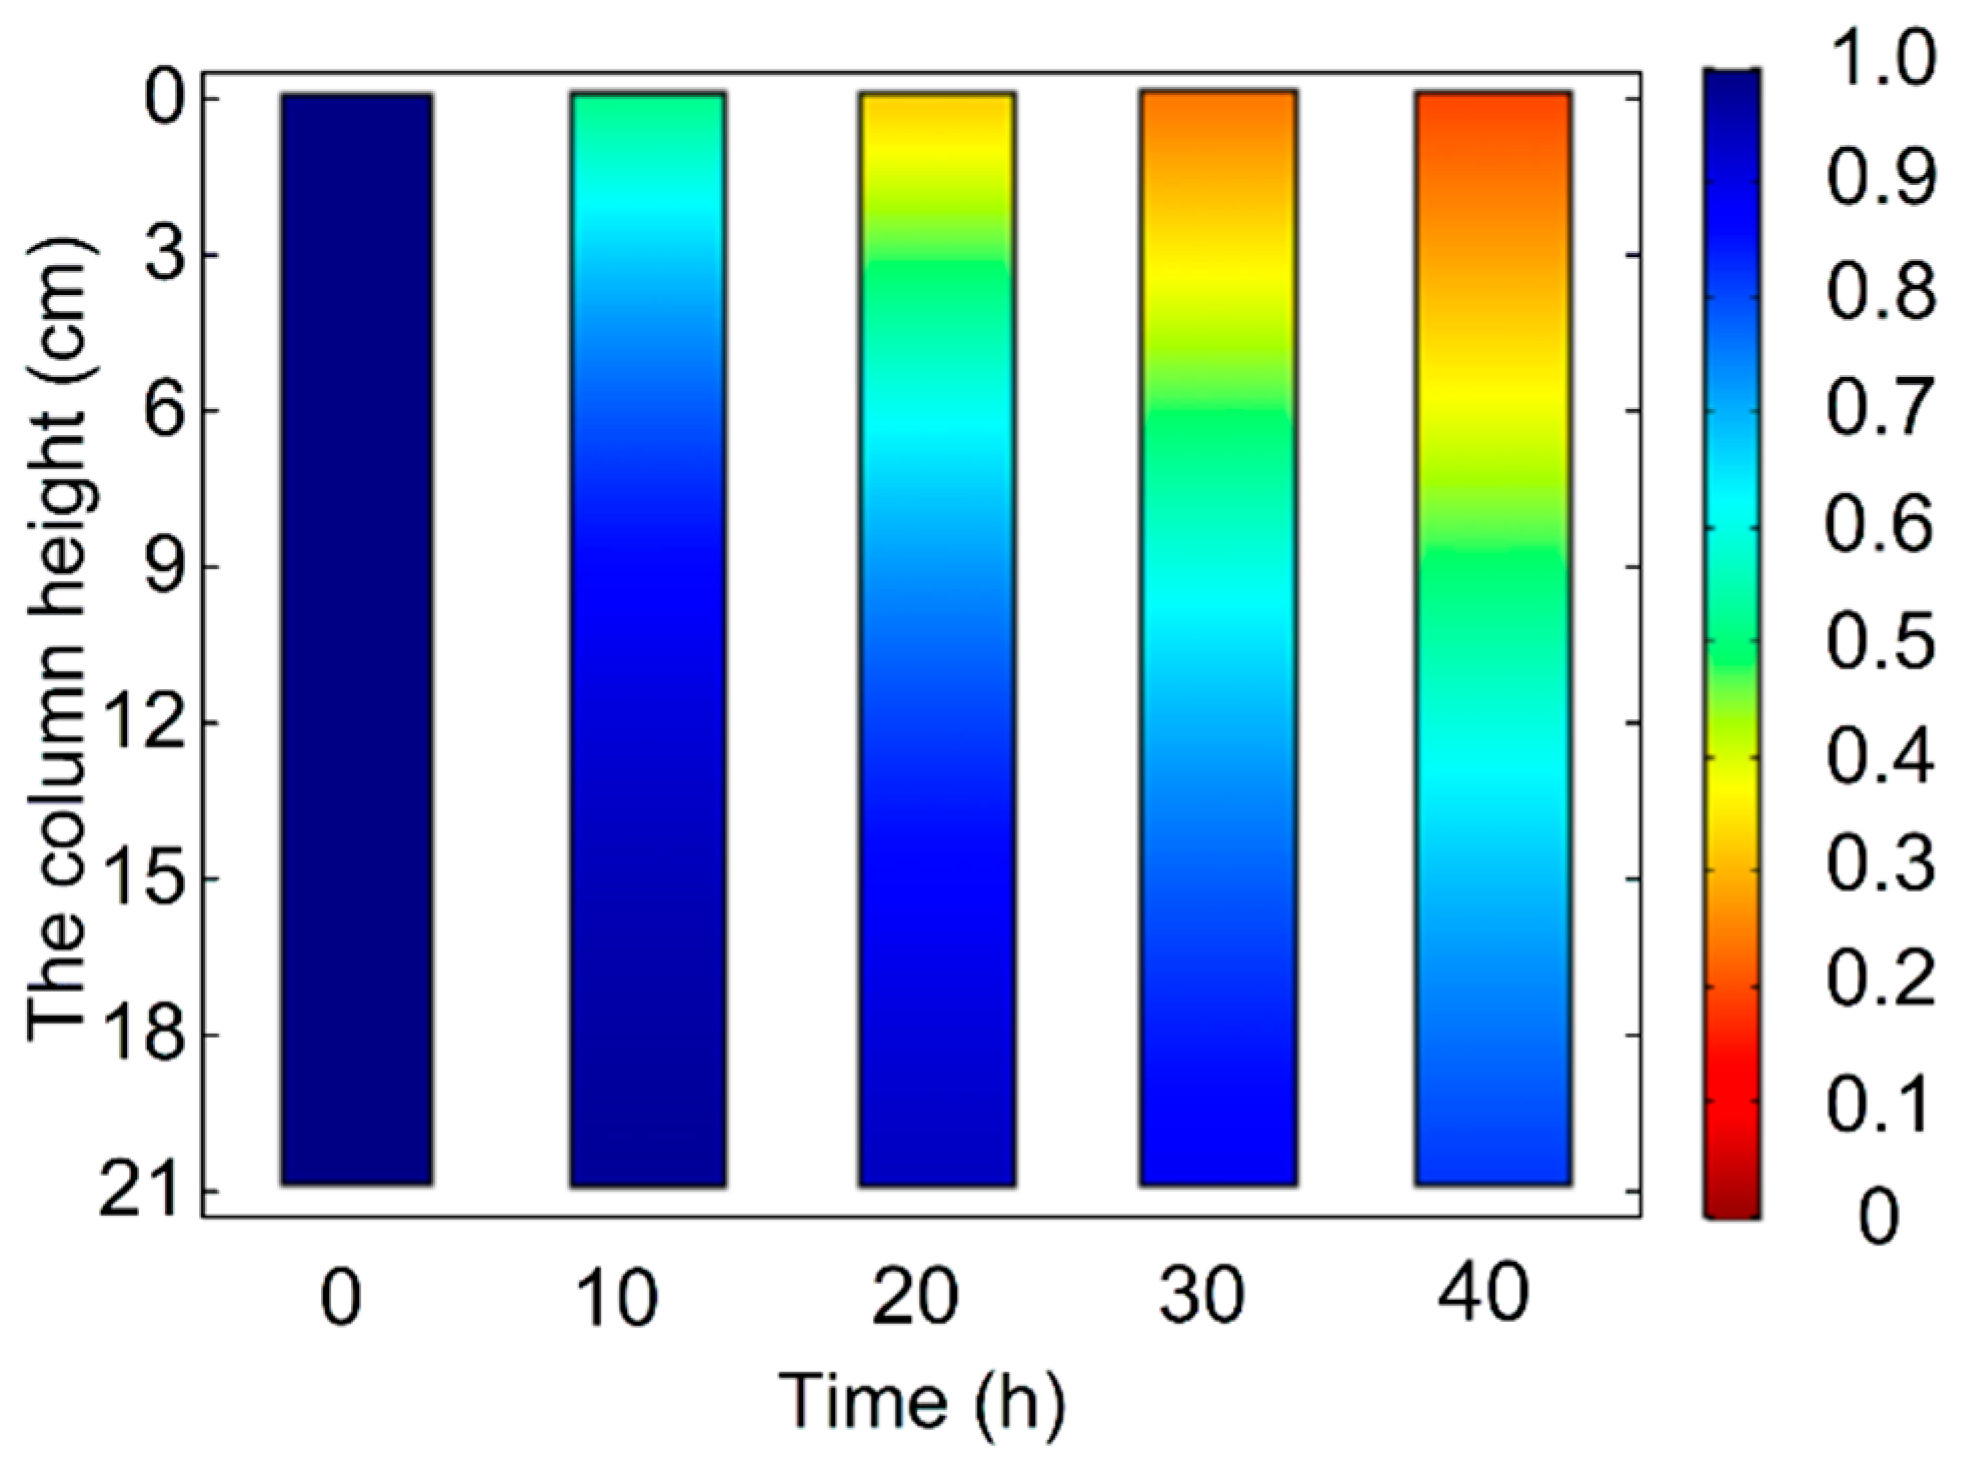
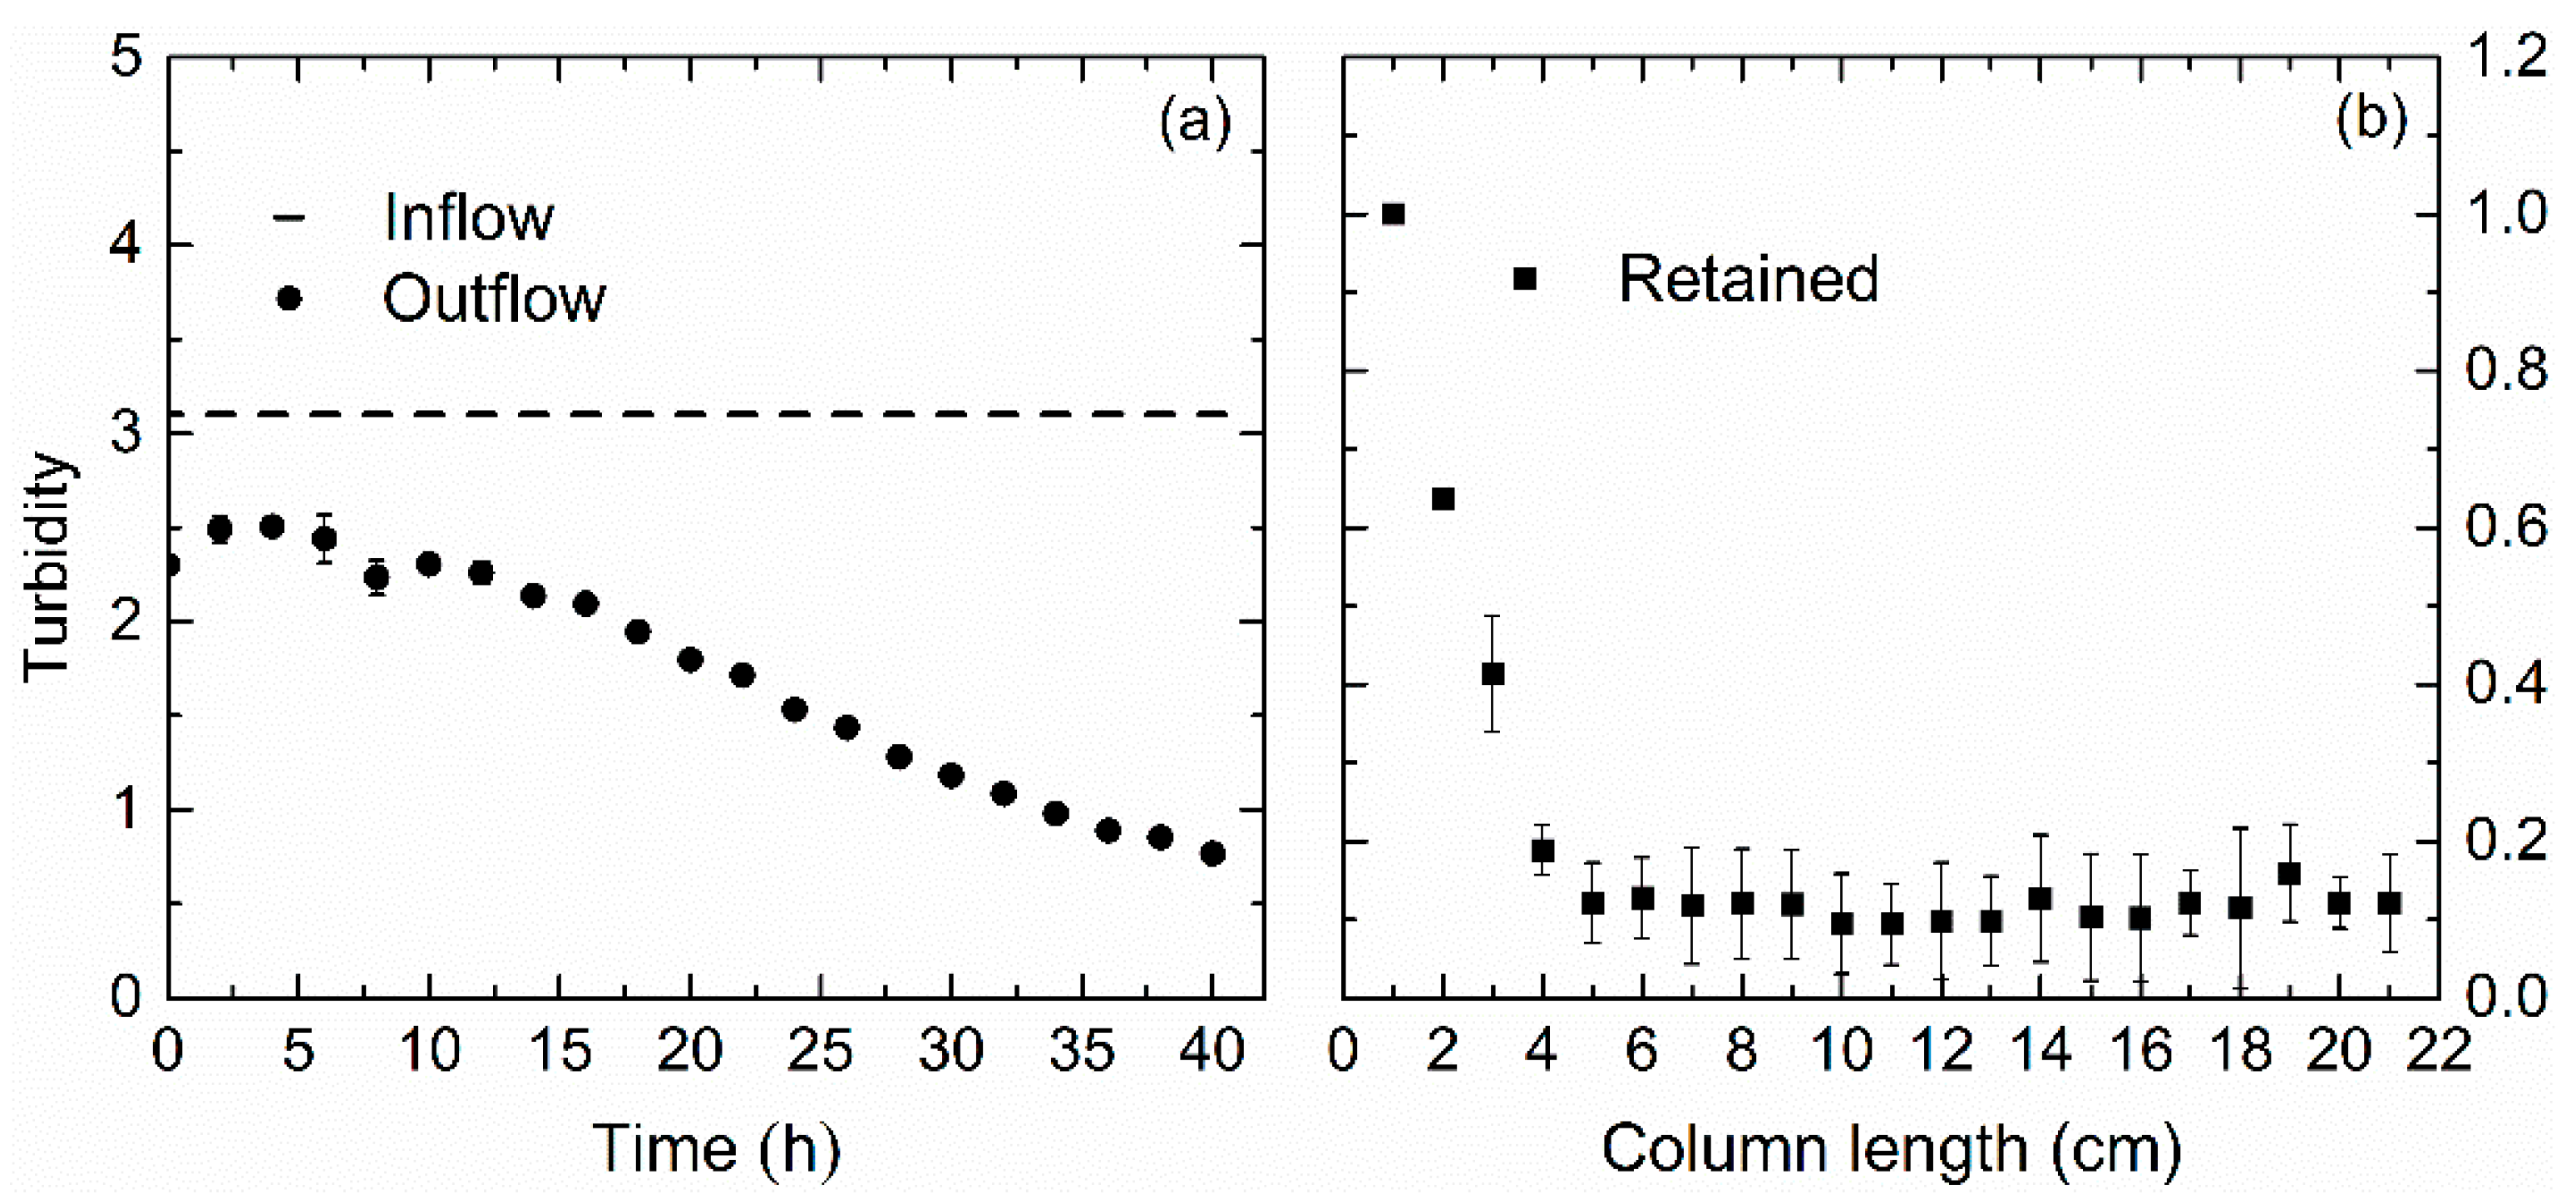
3.1. Physical Clogging

A numerical model for quantifying and simulating the physical clogging process needs to be verified based on the one–dimension laboratory column experiment to further realize the prediction of physical clogging in a large–scale site. The model has been published in our previous research [31]. For the whole column, the experiment result shows that K/K0 decreased to 52.6%, while K/K0 decreased to 36.5% in the model during 40 h injection (Figure 3a). There was a good correlation between the experimental and simulated values (R2 = 0.997). Ki/K0 (i = 1, 2, 3, 4, 5) in the five sections is shown in Figure 3b–f. The experiment results show that Ki/K0 (i = 1, 2, 3, 4, 5) decreased by 76.5%, 63.5%, 45.9%, 30.3% and 20.7%, respectively. The correlation coefficients between the experimental and simulated values for Ki/K0 (i = 1, 2, 3, 4, 5) were all greater than 0.99. The simulation results show again that the model parameter settings in previous research are reasonable.
The overall clogging extended into the deeper layer gradually over time. After 40 h, serious clogging mainly occurred in the first 3 cm of the column due to the deposition of floc particles (Figure 4). Using the similar numerical model method, Lu et al. [40] and Zheng et al. [41] have simulated and predicted the physical clogging risk during artificial recharge with storm water.

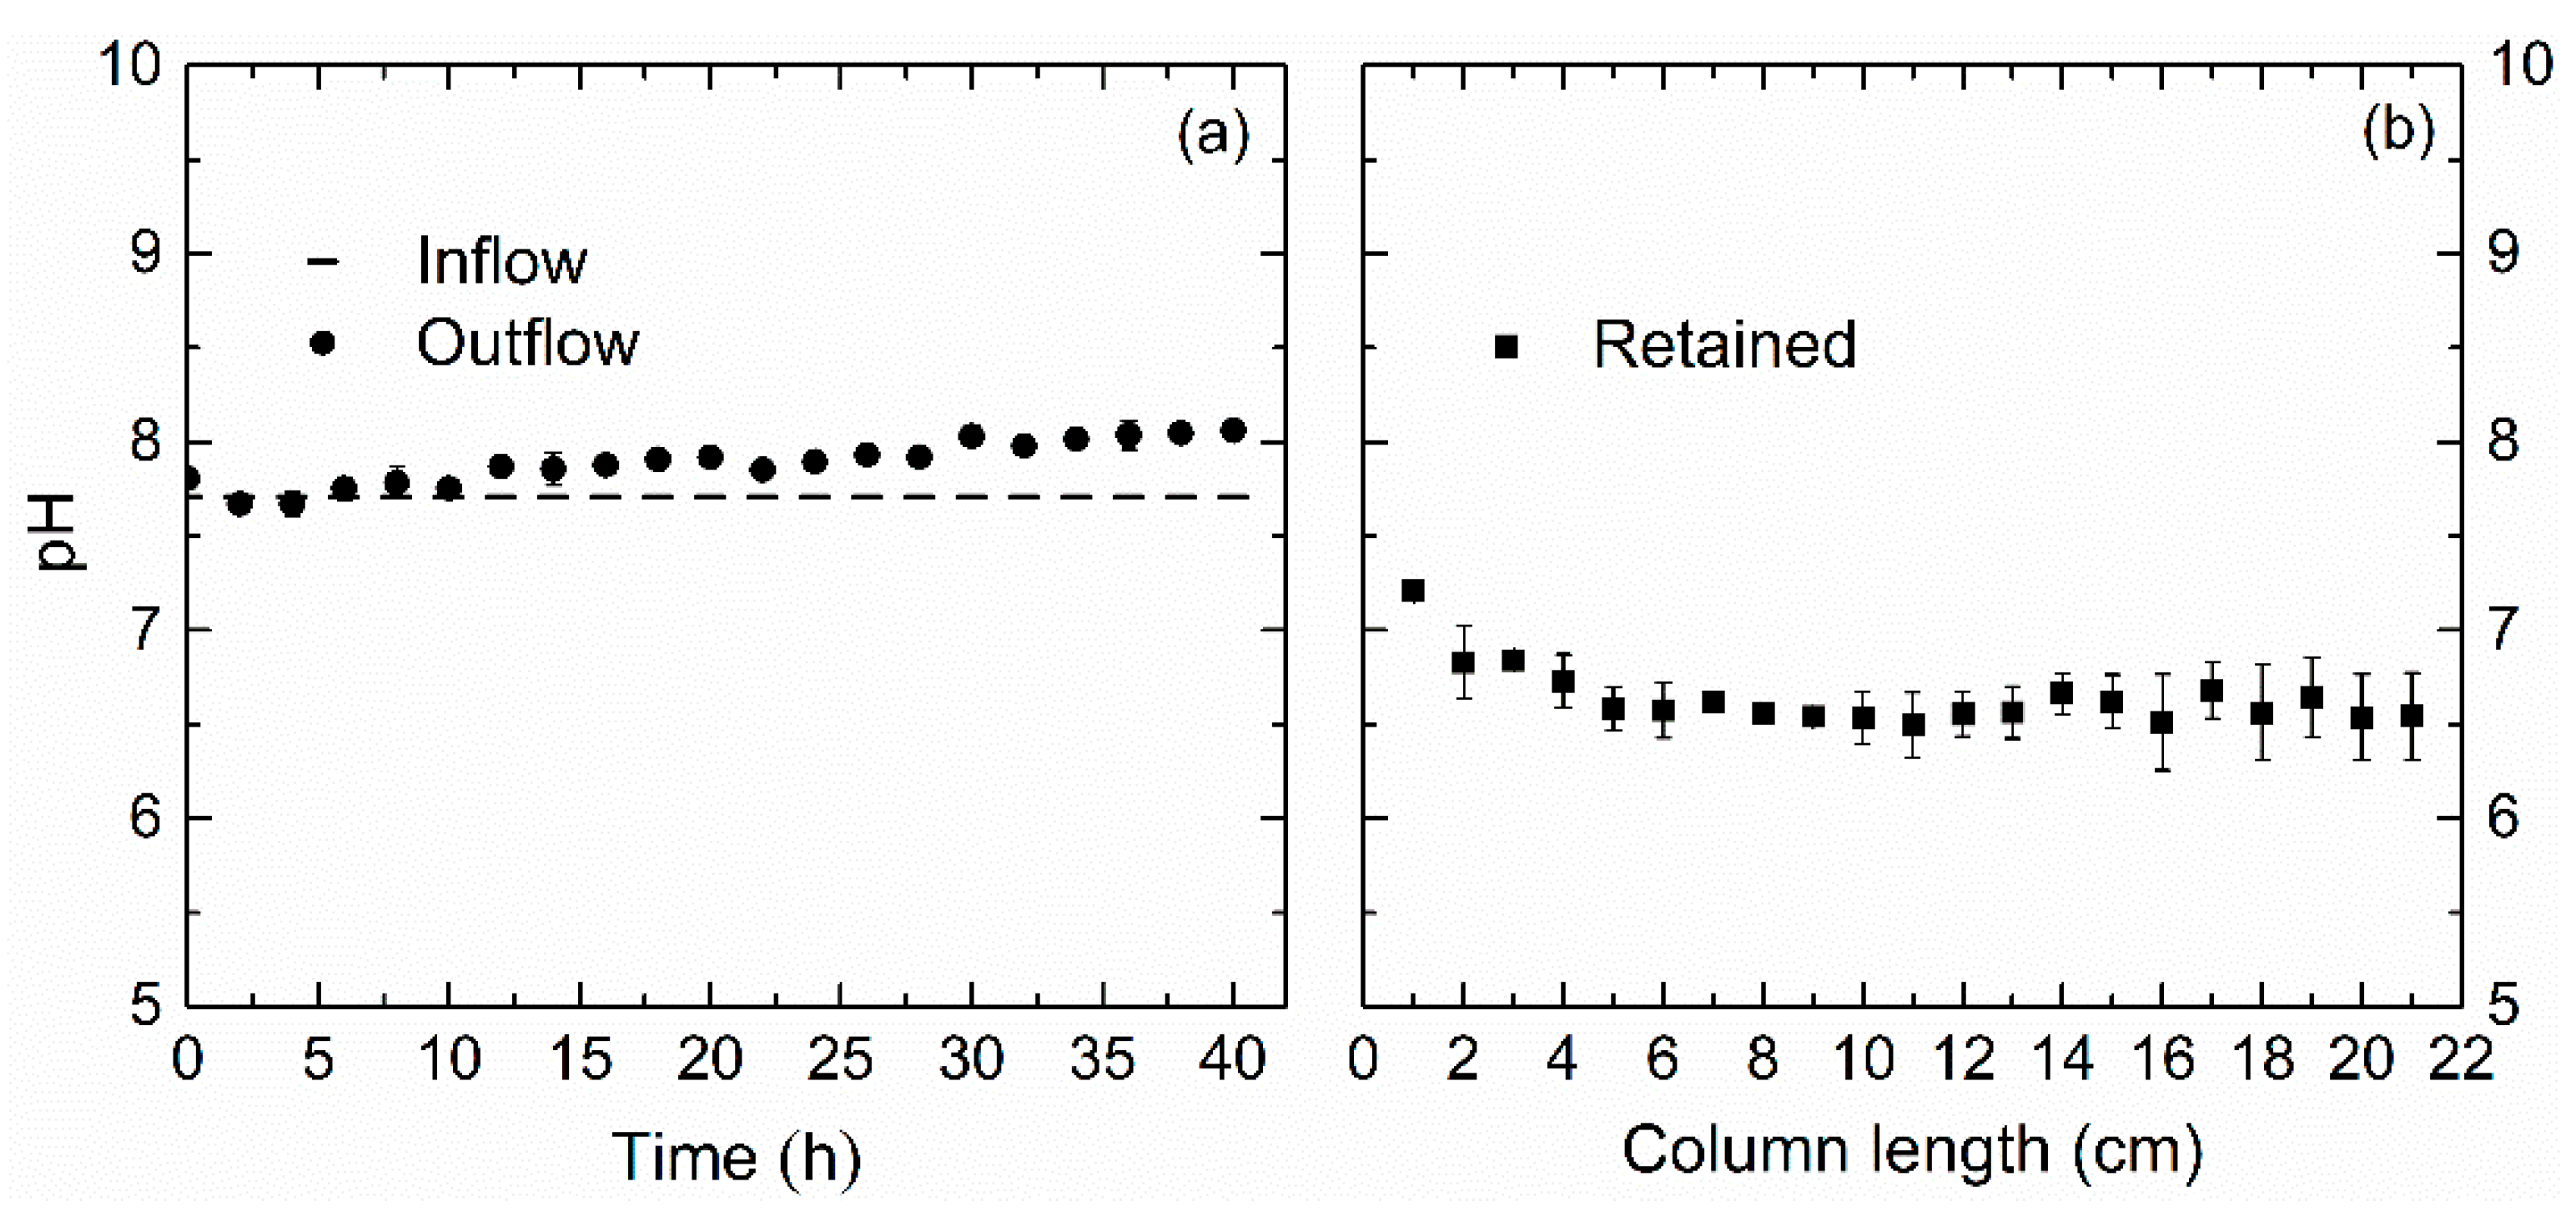
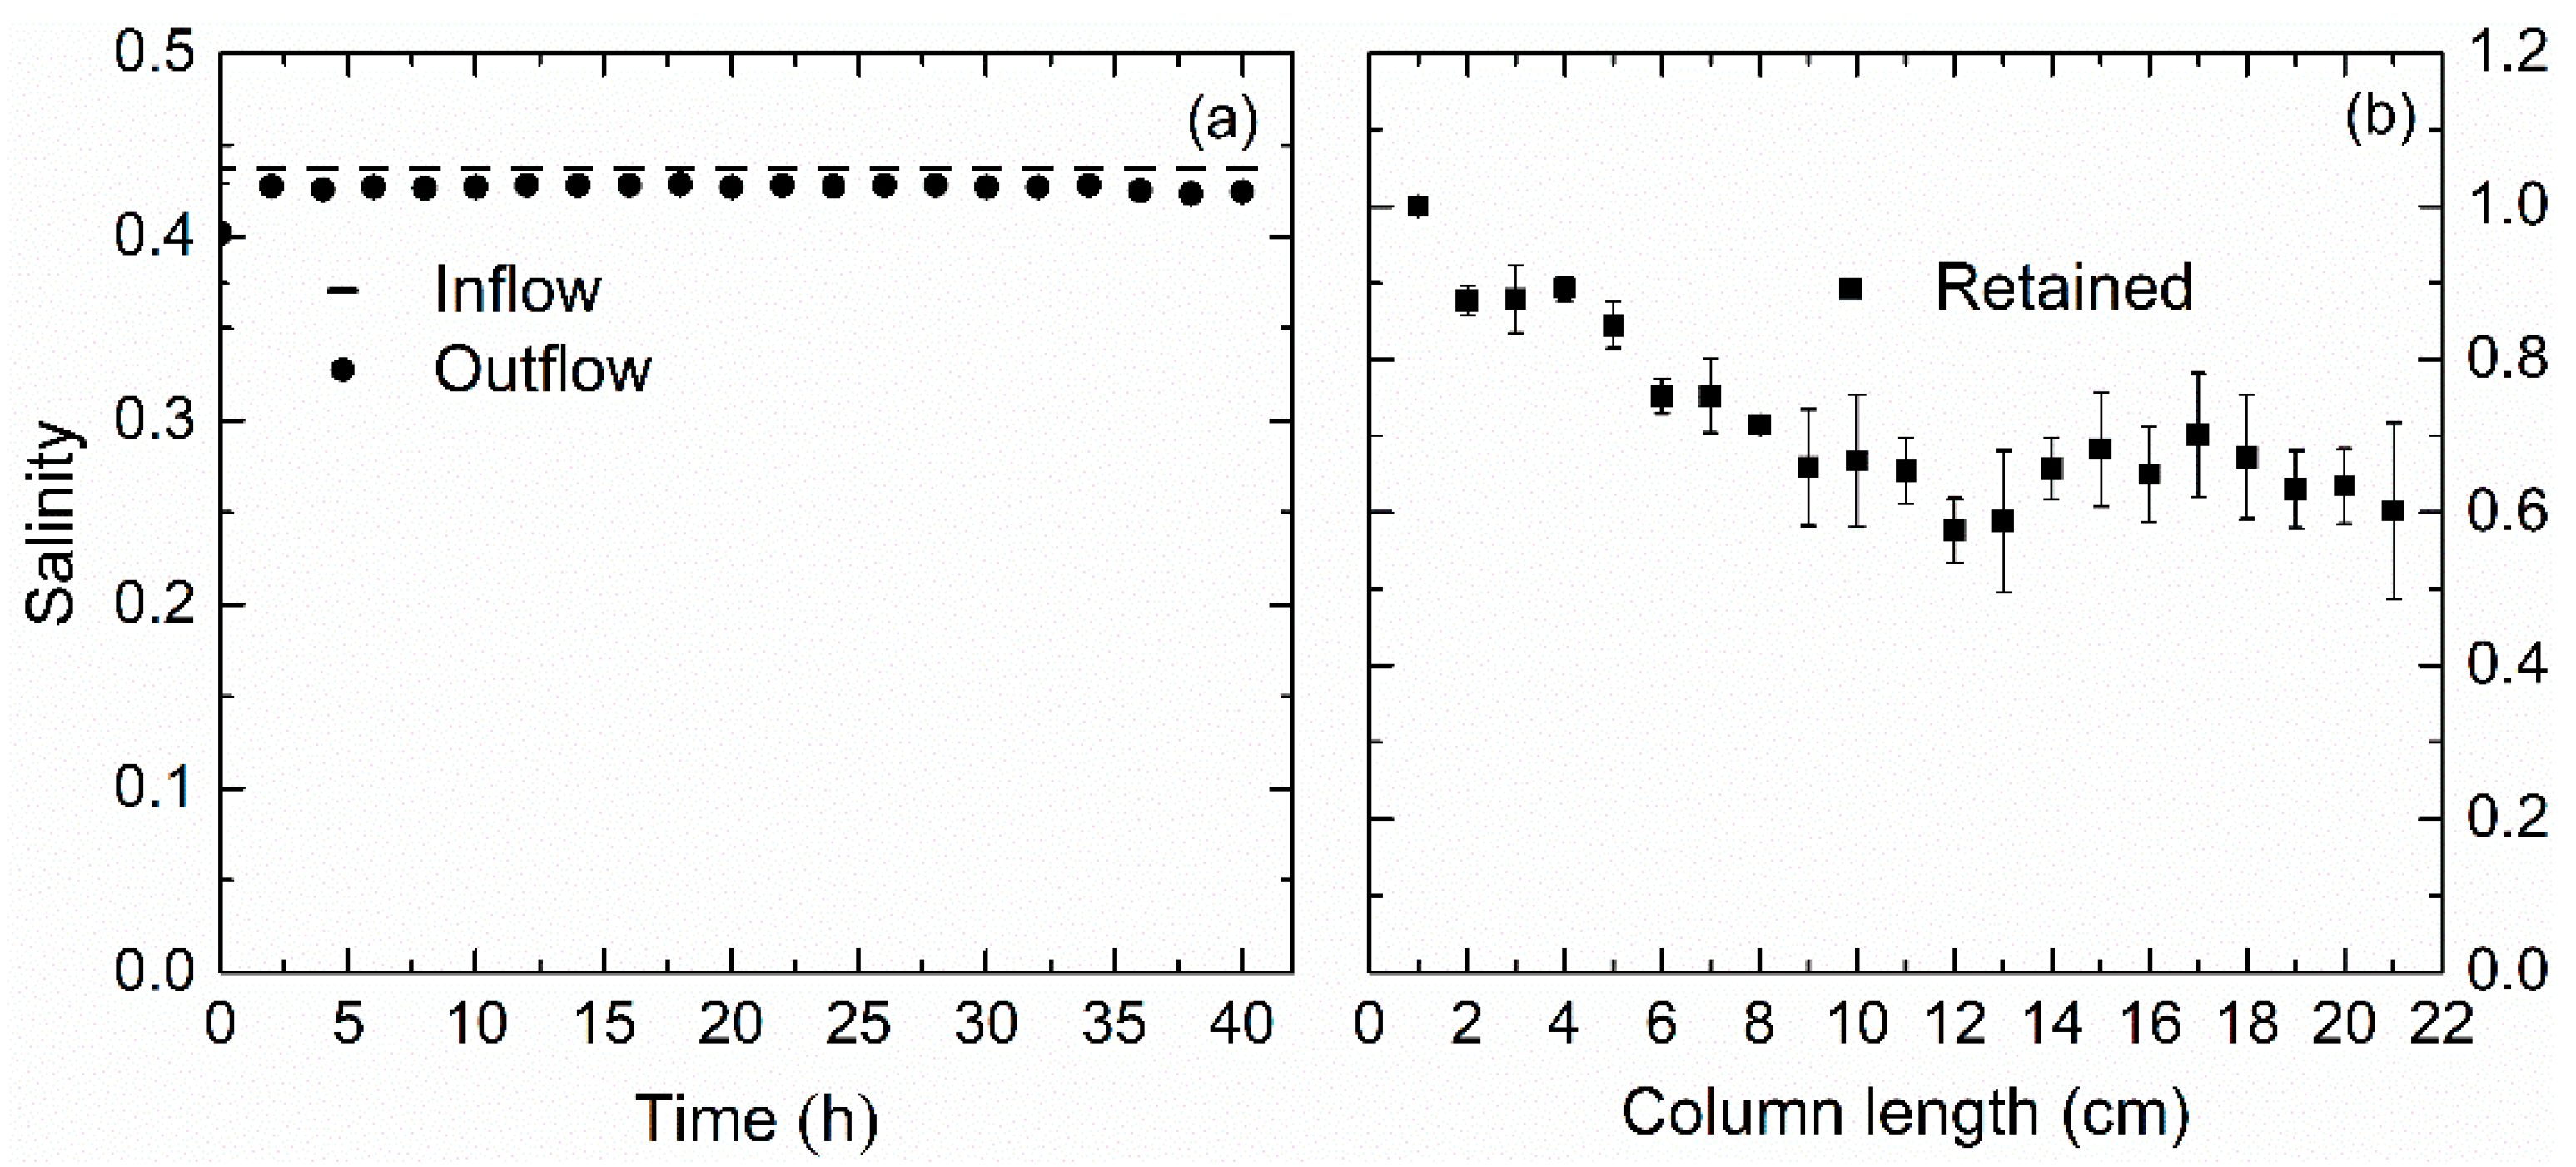
3.2. Variation of Inorganic Indicators

Studies have shown that some certain water quality indicators (such as TOC, TSS, salinity, pH and temperature) have significant impact on the clogging degree [42,43]. Turbidimeter is usually used as a surrogate for TSS, due to its cost–effective and convenient advantage. Turbidity (unit: NTU) represents the degree to which infrared light is scattered or absorbed by suspended solids in water. Moreover, the variations of particle size, shape, composition and settling velocity have significant influence on the turbidity values [30]. Therefore, the turbidity value can be used to characterize the physicochemical and optical characteristics of the suspension. In the study, we chose pH, turbidity and salinity as the representatives of inorganic indicators, the temporal and spatial variations of which were measured.
Figure 5 shows the pH changes at the time and space. The pH values of effluent gradually increased during reinjection, ranging from 7.81 ± 0.01 at 0 h to 8.06 ± 0.01 at 40 h (Figure 5a). In our experiment, quartz sand collectors are negatively charged at pH 6.47± 0.04. Quartz sand collectors are composed of a large number of silicon hydroxyl groups (SiO) [44]. Positively charged molecules or particles can be retained in the column through adsorption, hydration and pore blockage [45]. It has been reported that injecting treated wastewater can increase the alkalinity of the porous media in most cases [43]. After injection, pH values ranged from 7.21 ± 0.01 to 6.51 ± 0.25 along the column length (Figure 5b). Especially for the first 3 cm, the pH values were the highest, which were 7.21 ± 0.01, 6.83 ± 0.20 and 6.84 ± 0.03, respectively. The pH values in other sections increased slightly. The data result is reasonable. This trend can be also attributed to the increase of organic matter and bicarbonate salts to sand collectors [46].
Figure 6a shows that effluent turbidity changed as a function of time. Turbidity rapidly declined with time from 2.30 ± 0.04 NTU at 0 h to 0.77 ± 0.02 NTU at 40 h. In fact, this is a filtration process. During the initial stage, the floc particles in the influent can pass through the pores in porous media, so the filtration efficiency is low. With the progress of the filtration process, floc particle deposition significantly reduces the porosity of the porous media. The deposited particles can act as the collectors, and the removal efficiency would be gradually improved through ripening [47,48]. As shown in Figure 6b, turbidity changes along the column length also show that most of the interception occurred in the first 3 cm. The results are consistent with some previous research, indicating that physical clogging primarily happened in the inlet end of the column (0–3 cm) [8,11,49]. It should be noted that we calculated the turbidity values per unit mass of quartz sands in order to accurately reflect the particle retention in different sections. The results are shown in proportion based on the turbidity value of the first layer. The following data results were calculated in the same way (Figure 7b, Figure 8b, Figure 9b and Figure 10).
Salinity is an important factor which affects the particle release and infiltration rate during artificial recharge [39,43]. Salinity is the total amount of dissolved ions in water, mainly containing potassium, sodium, calcium, magnesium, bicarbonate, carbonate, chloride and sulfate. In our study, we also observed salinity changes with time and space. In fact, this reflects the removal of inorganic cation and anion during physical clogging. Figure 7a shows that salinity changes slightly during 40 h injection. Moreover, salinity changes along the column also present a gradual downward trend, which is similar to the retention trend of floc particles (Figure 7b).

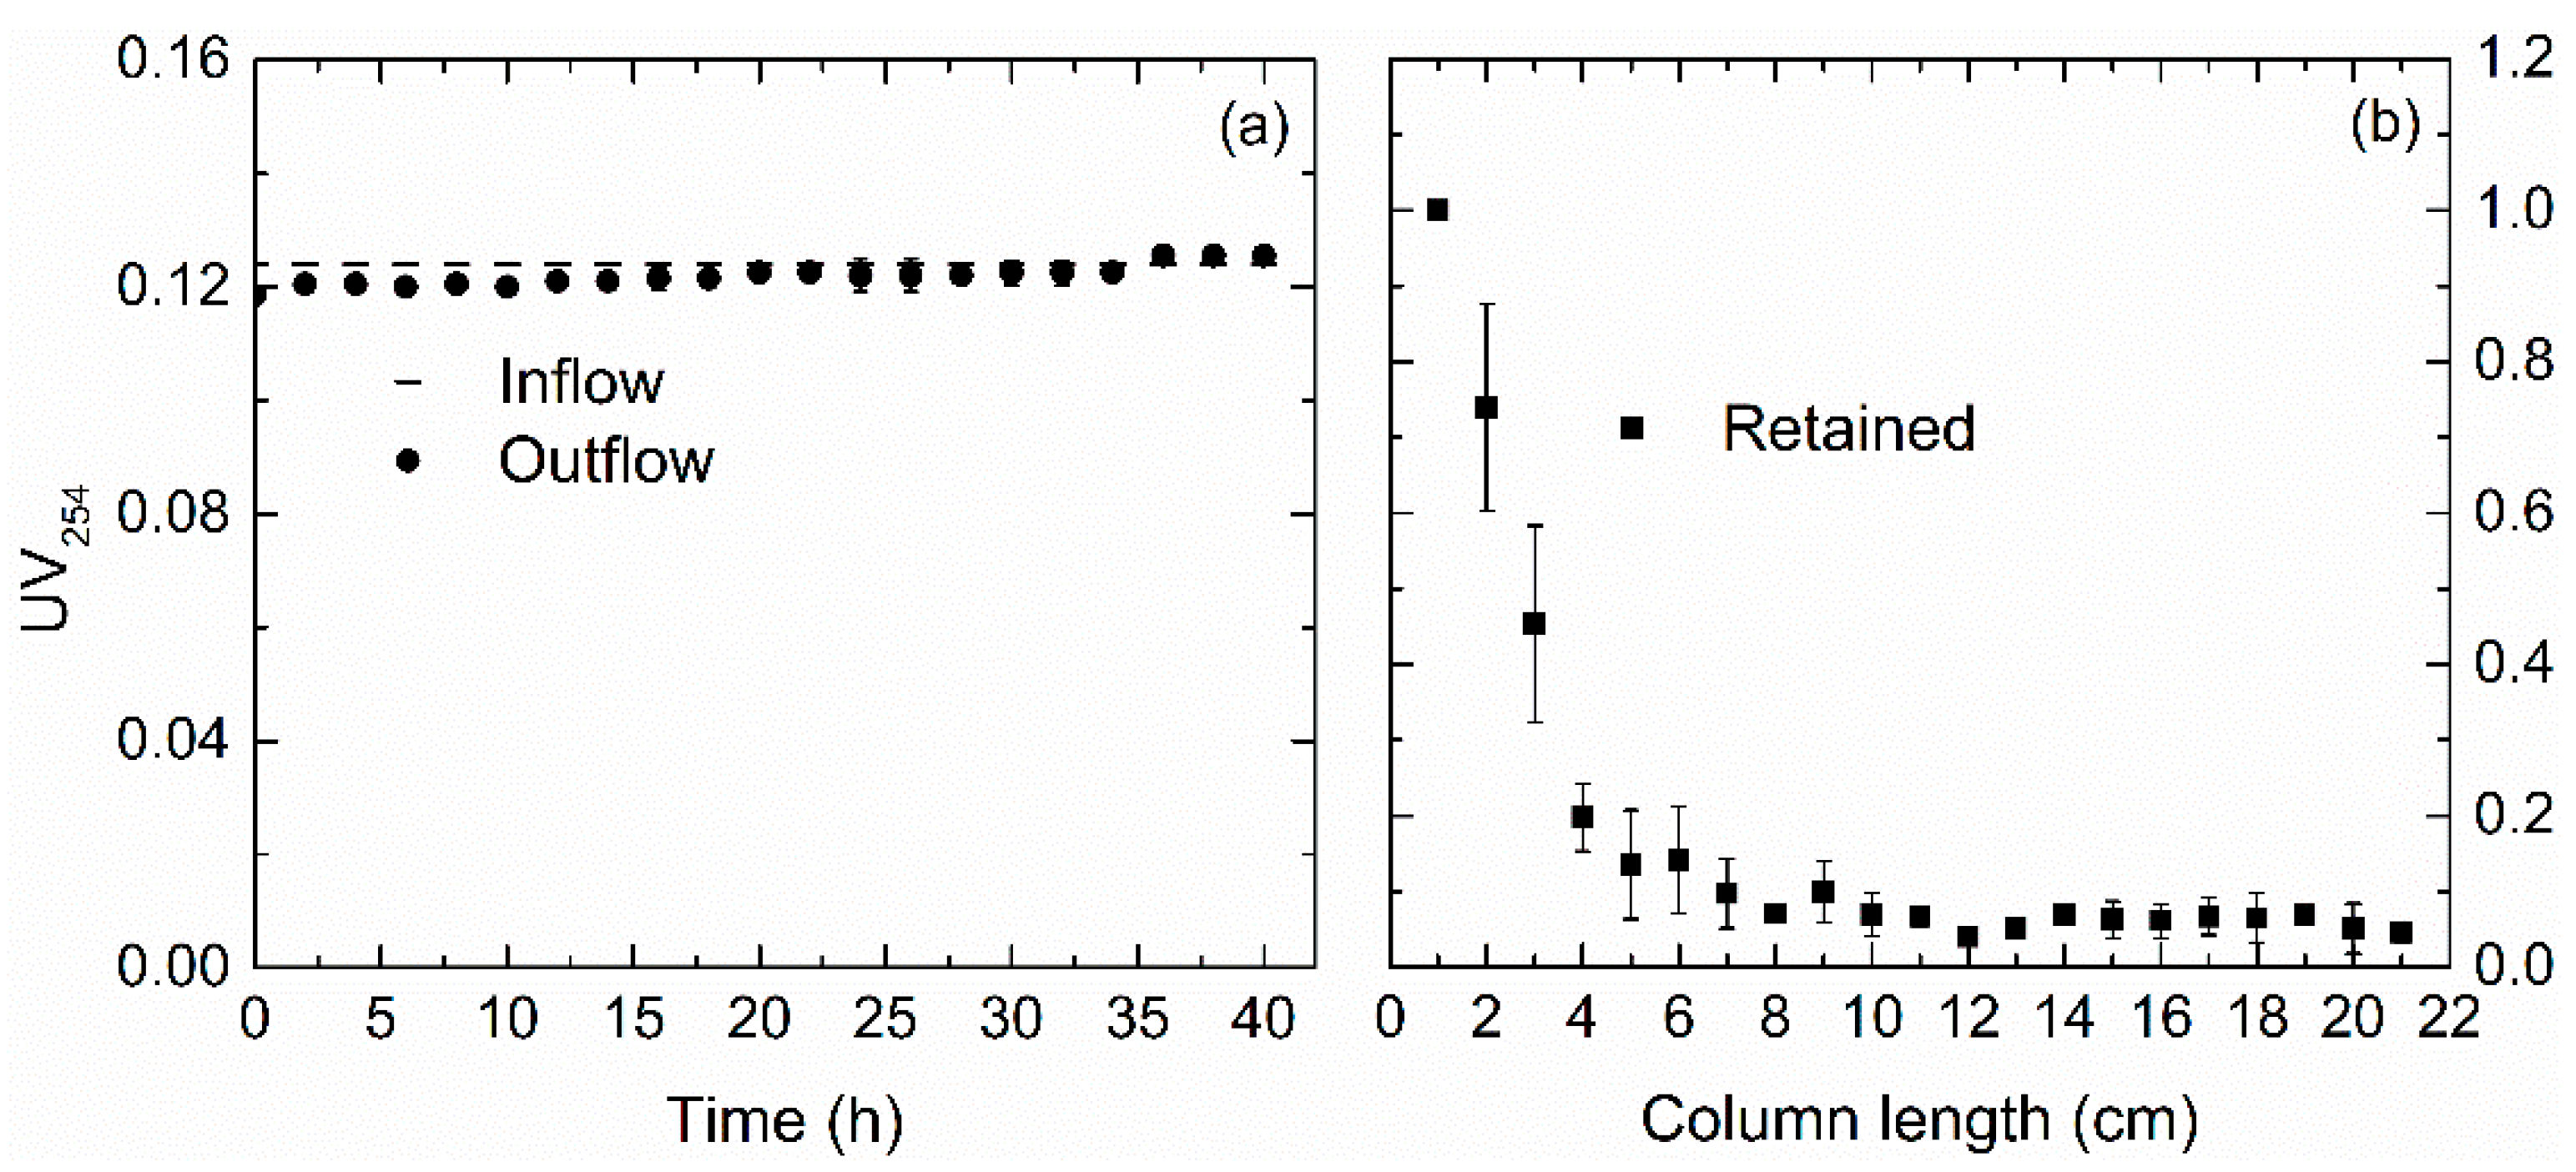
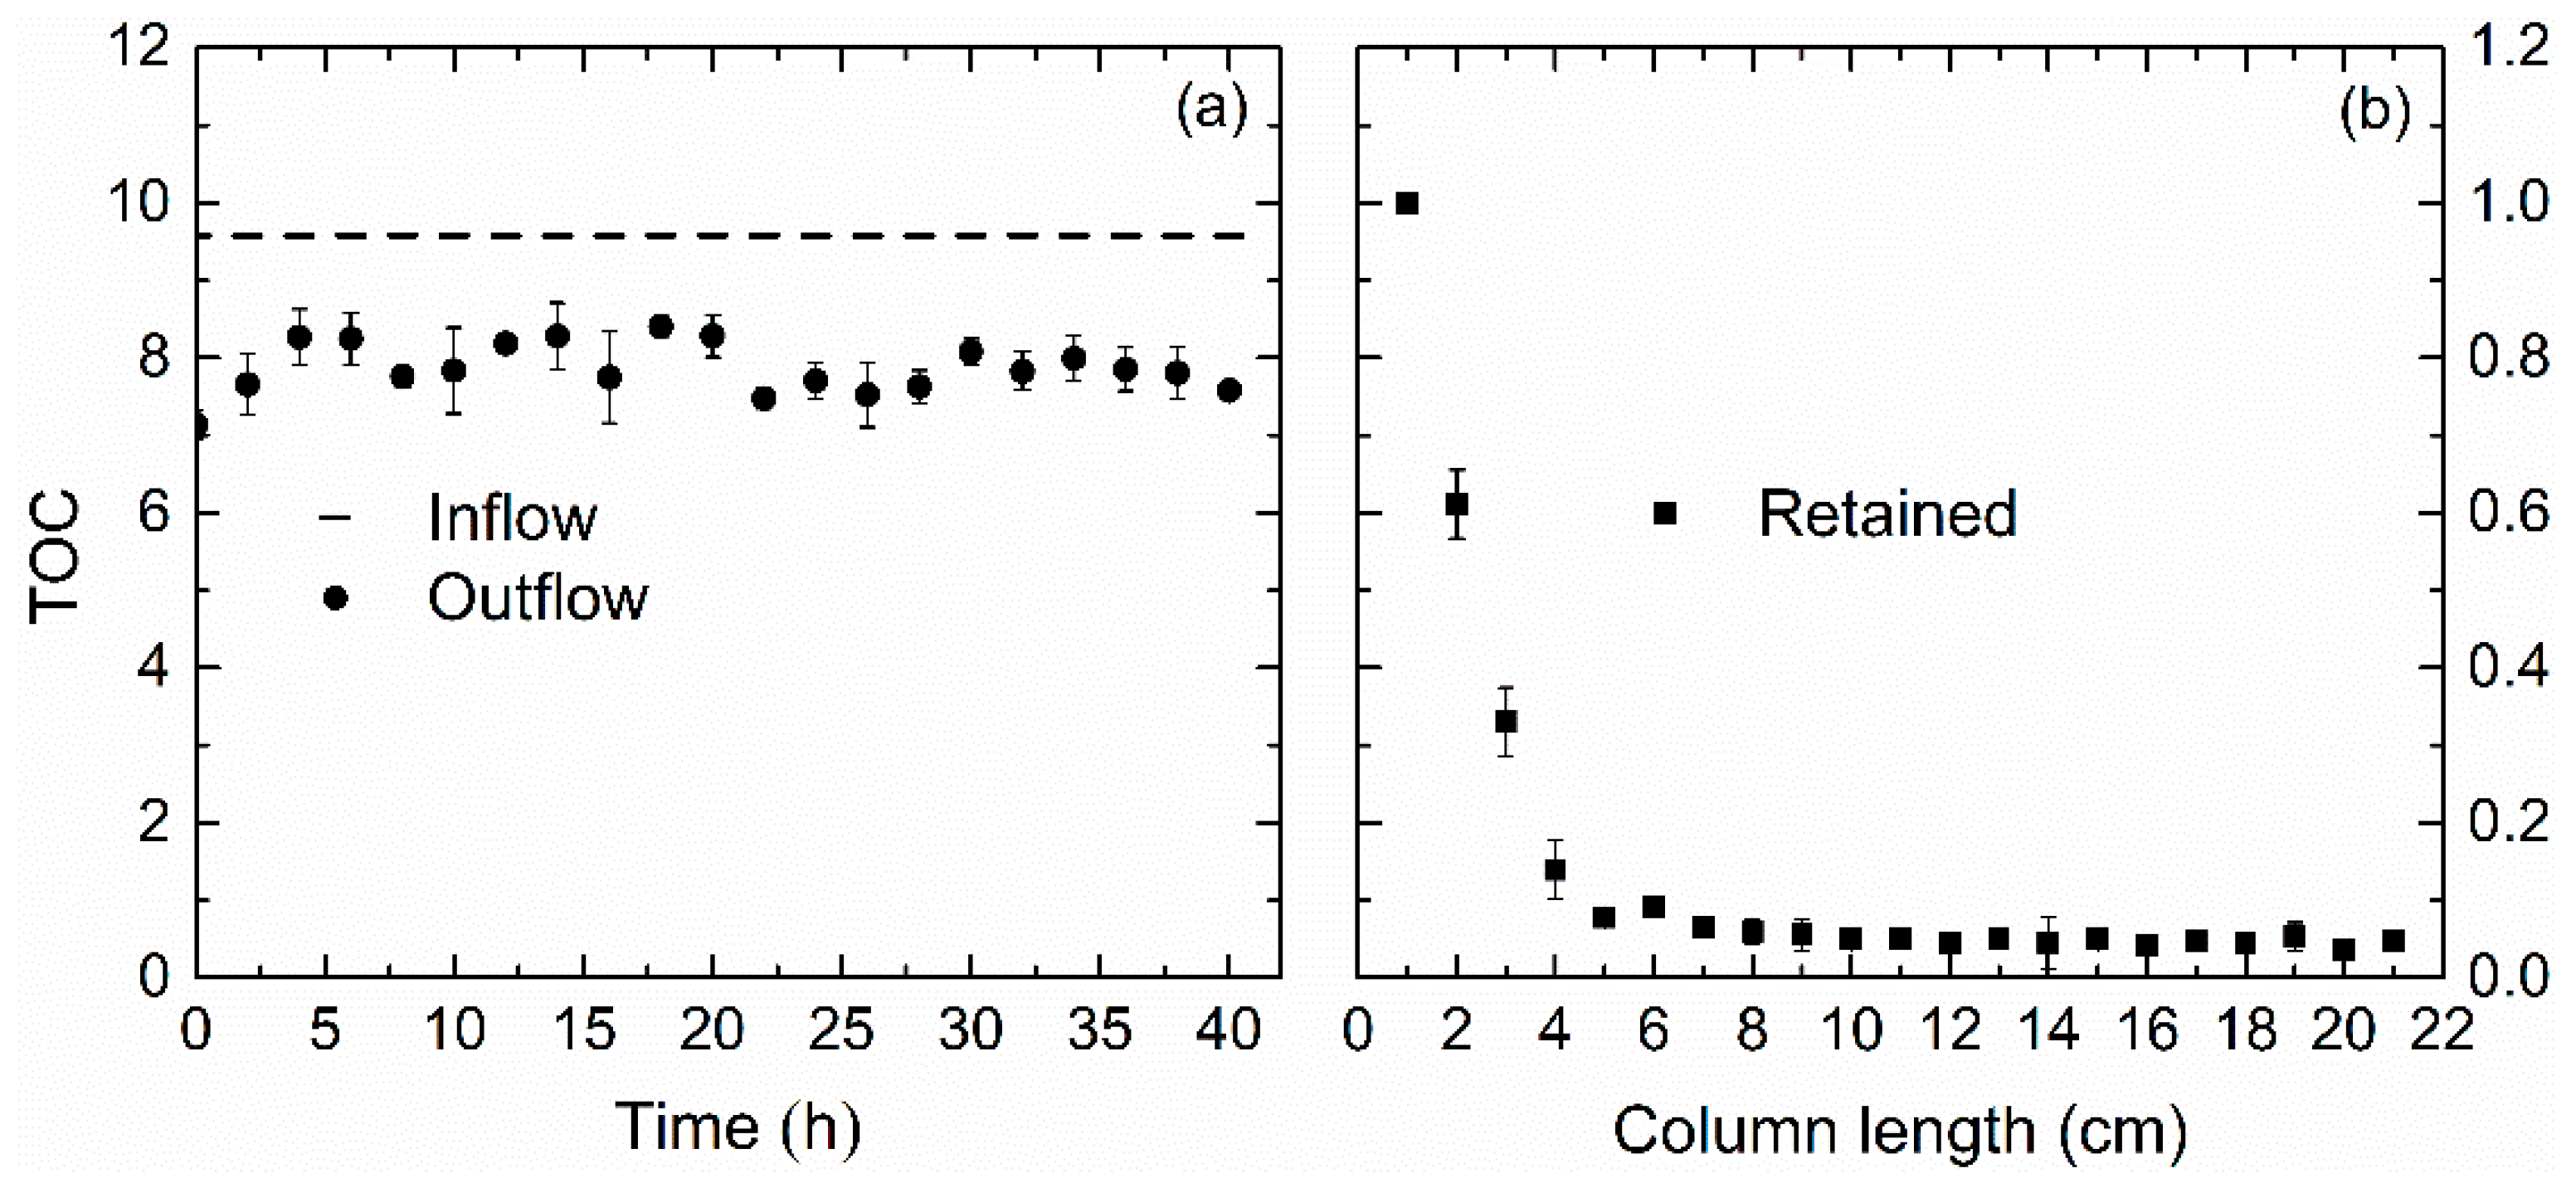
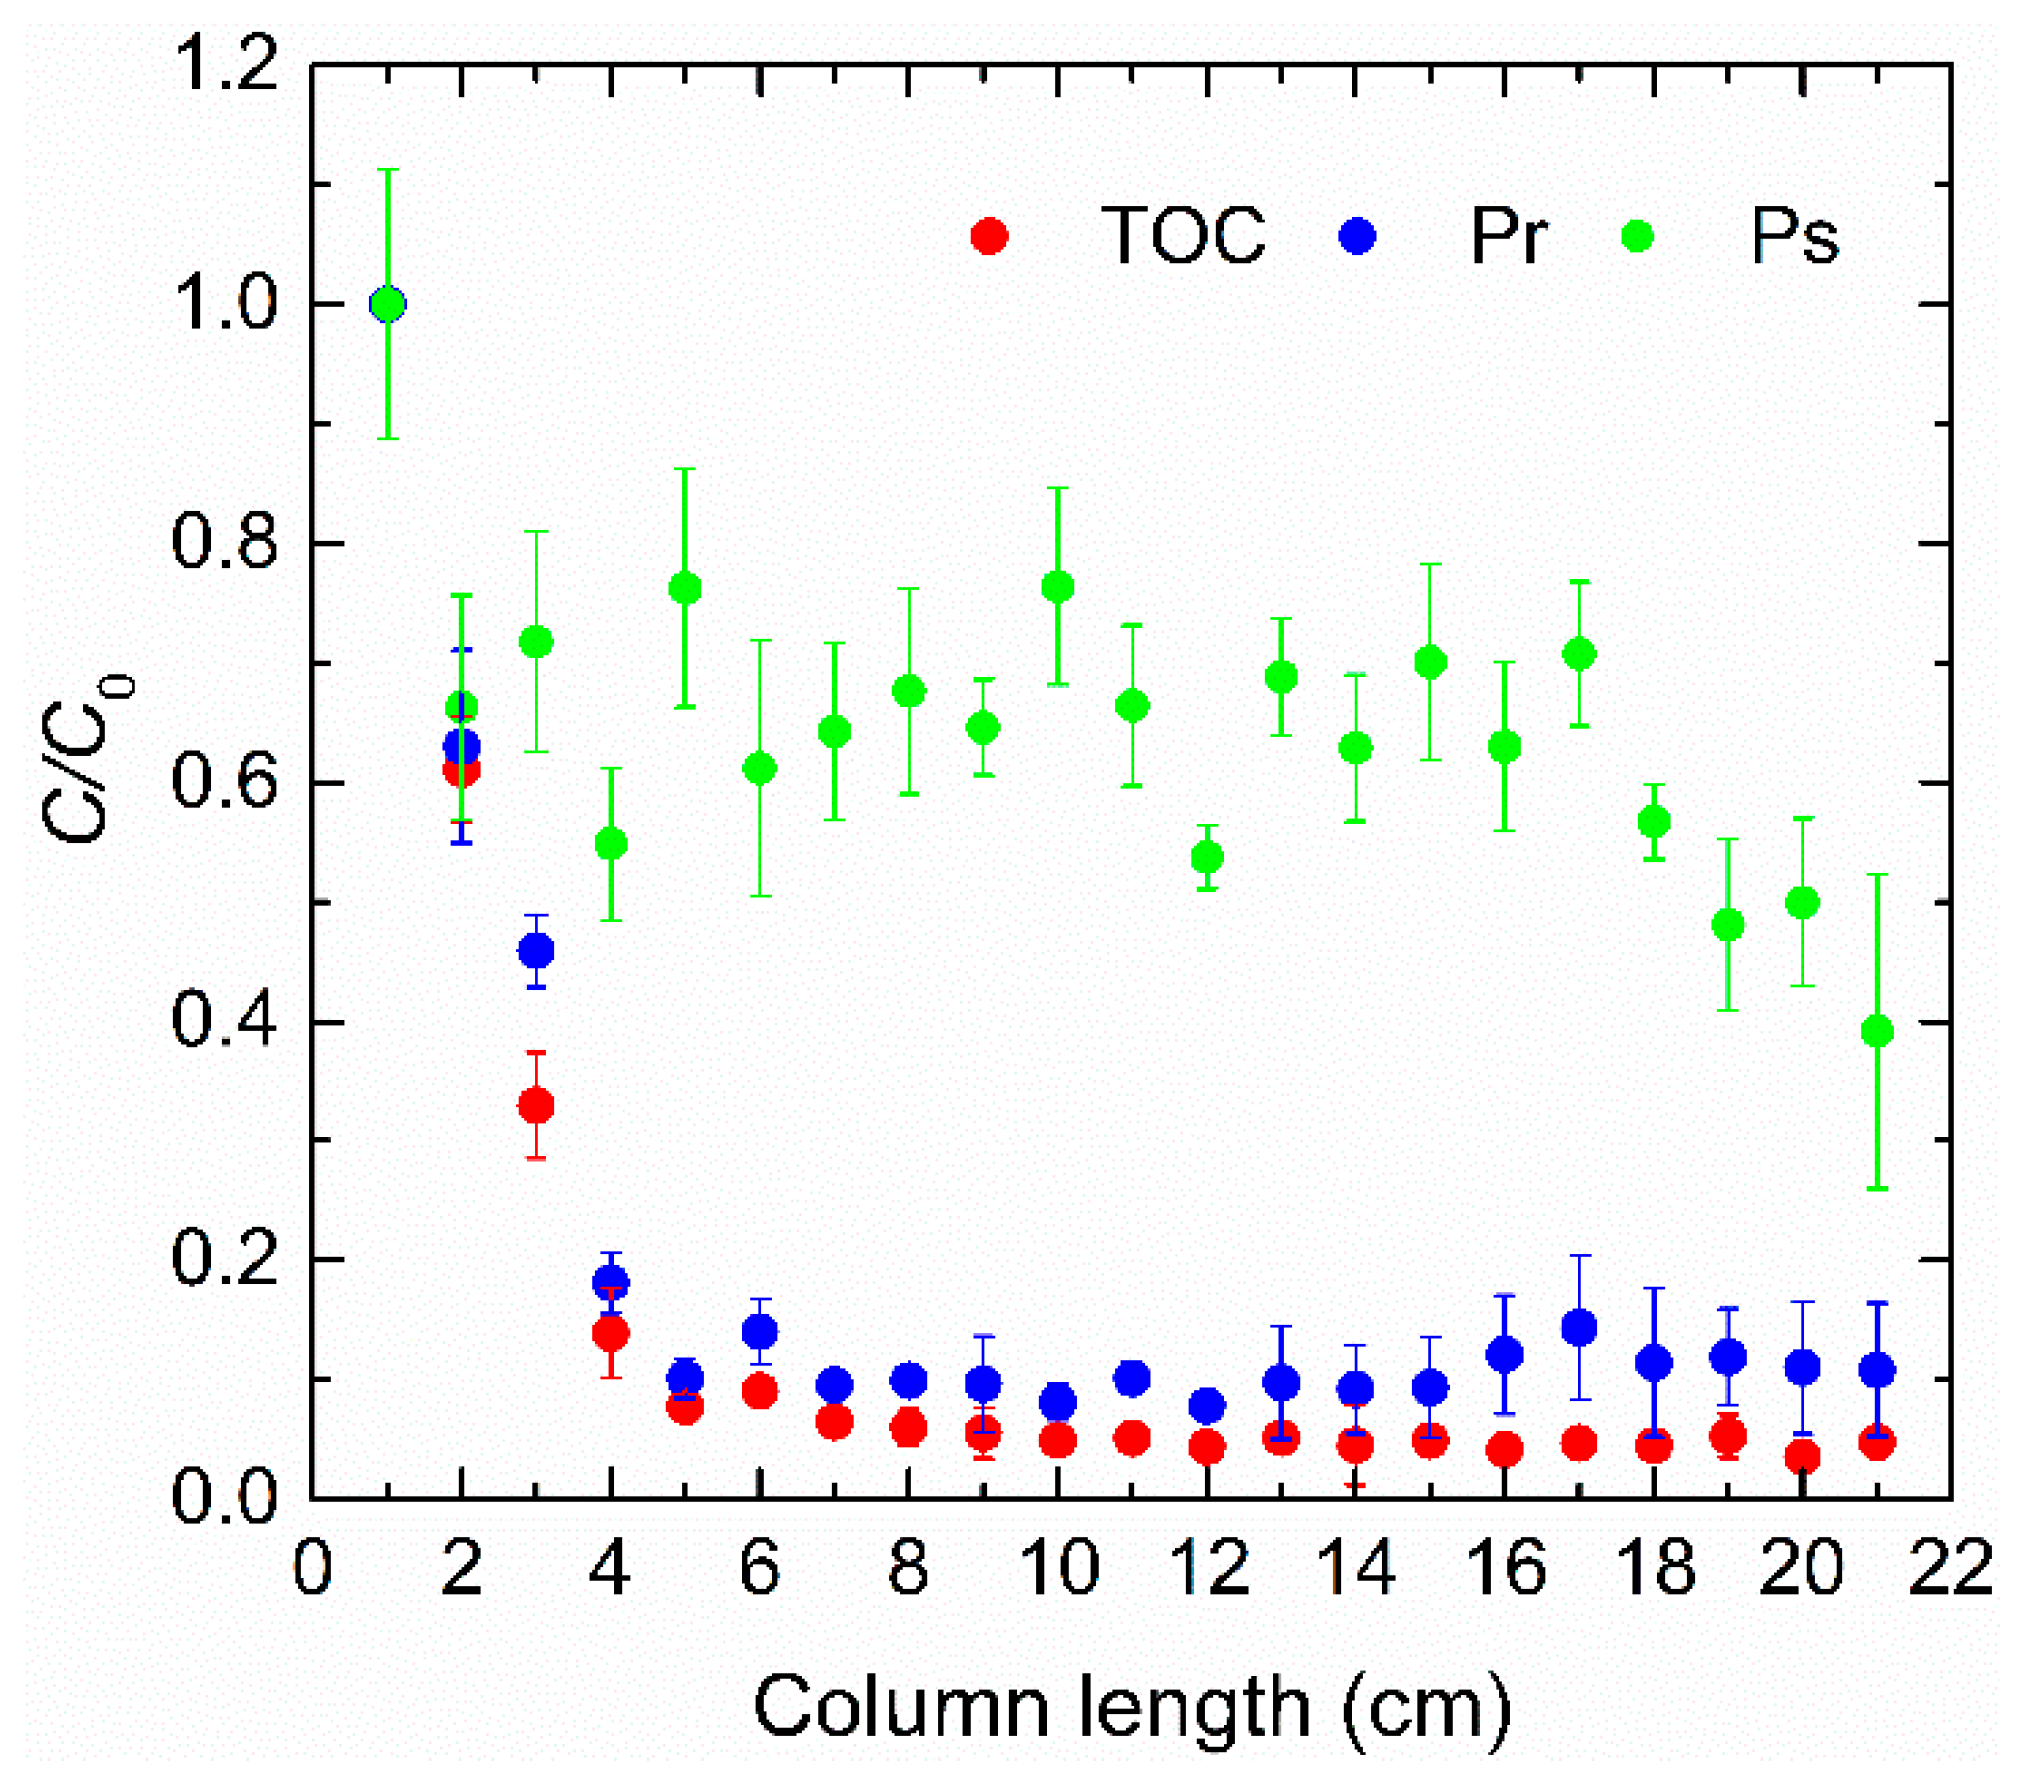
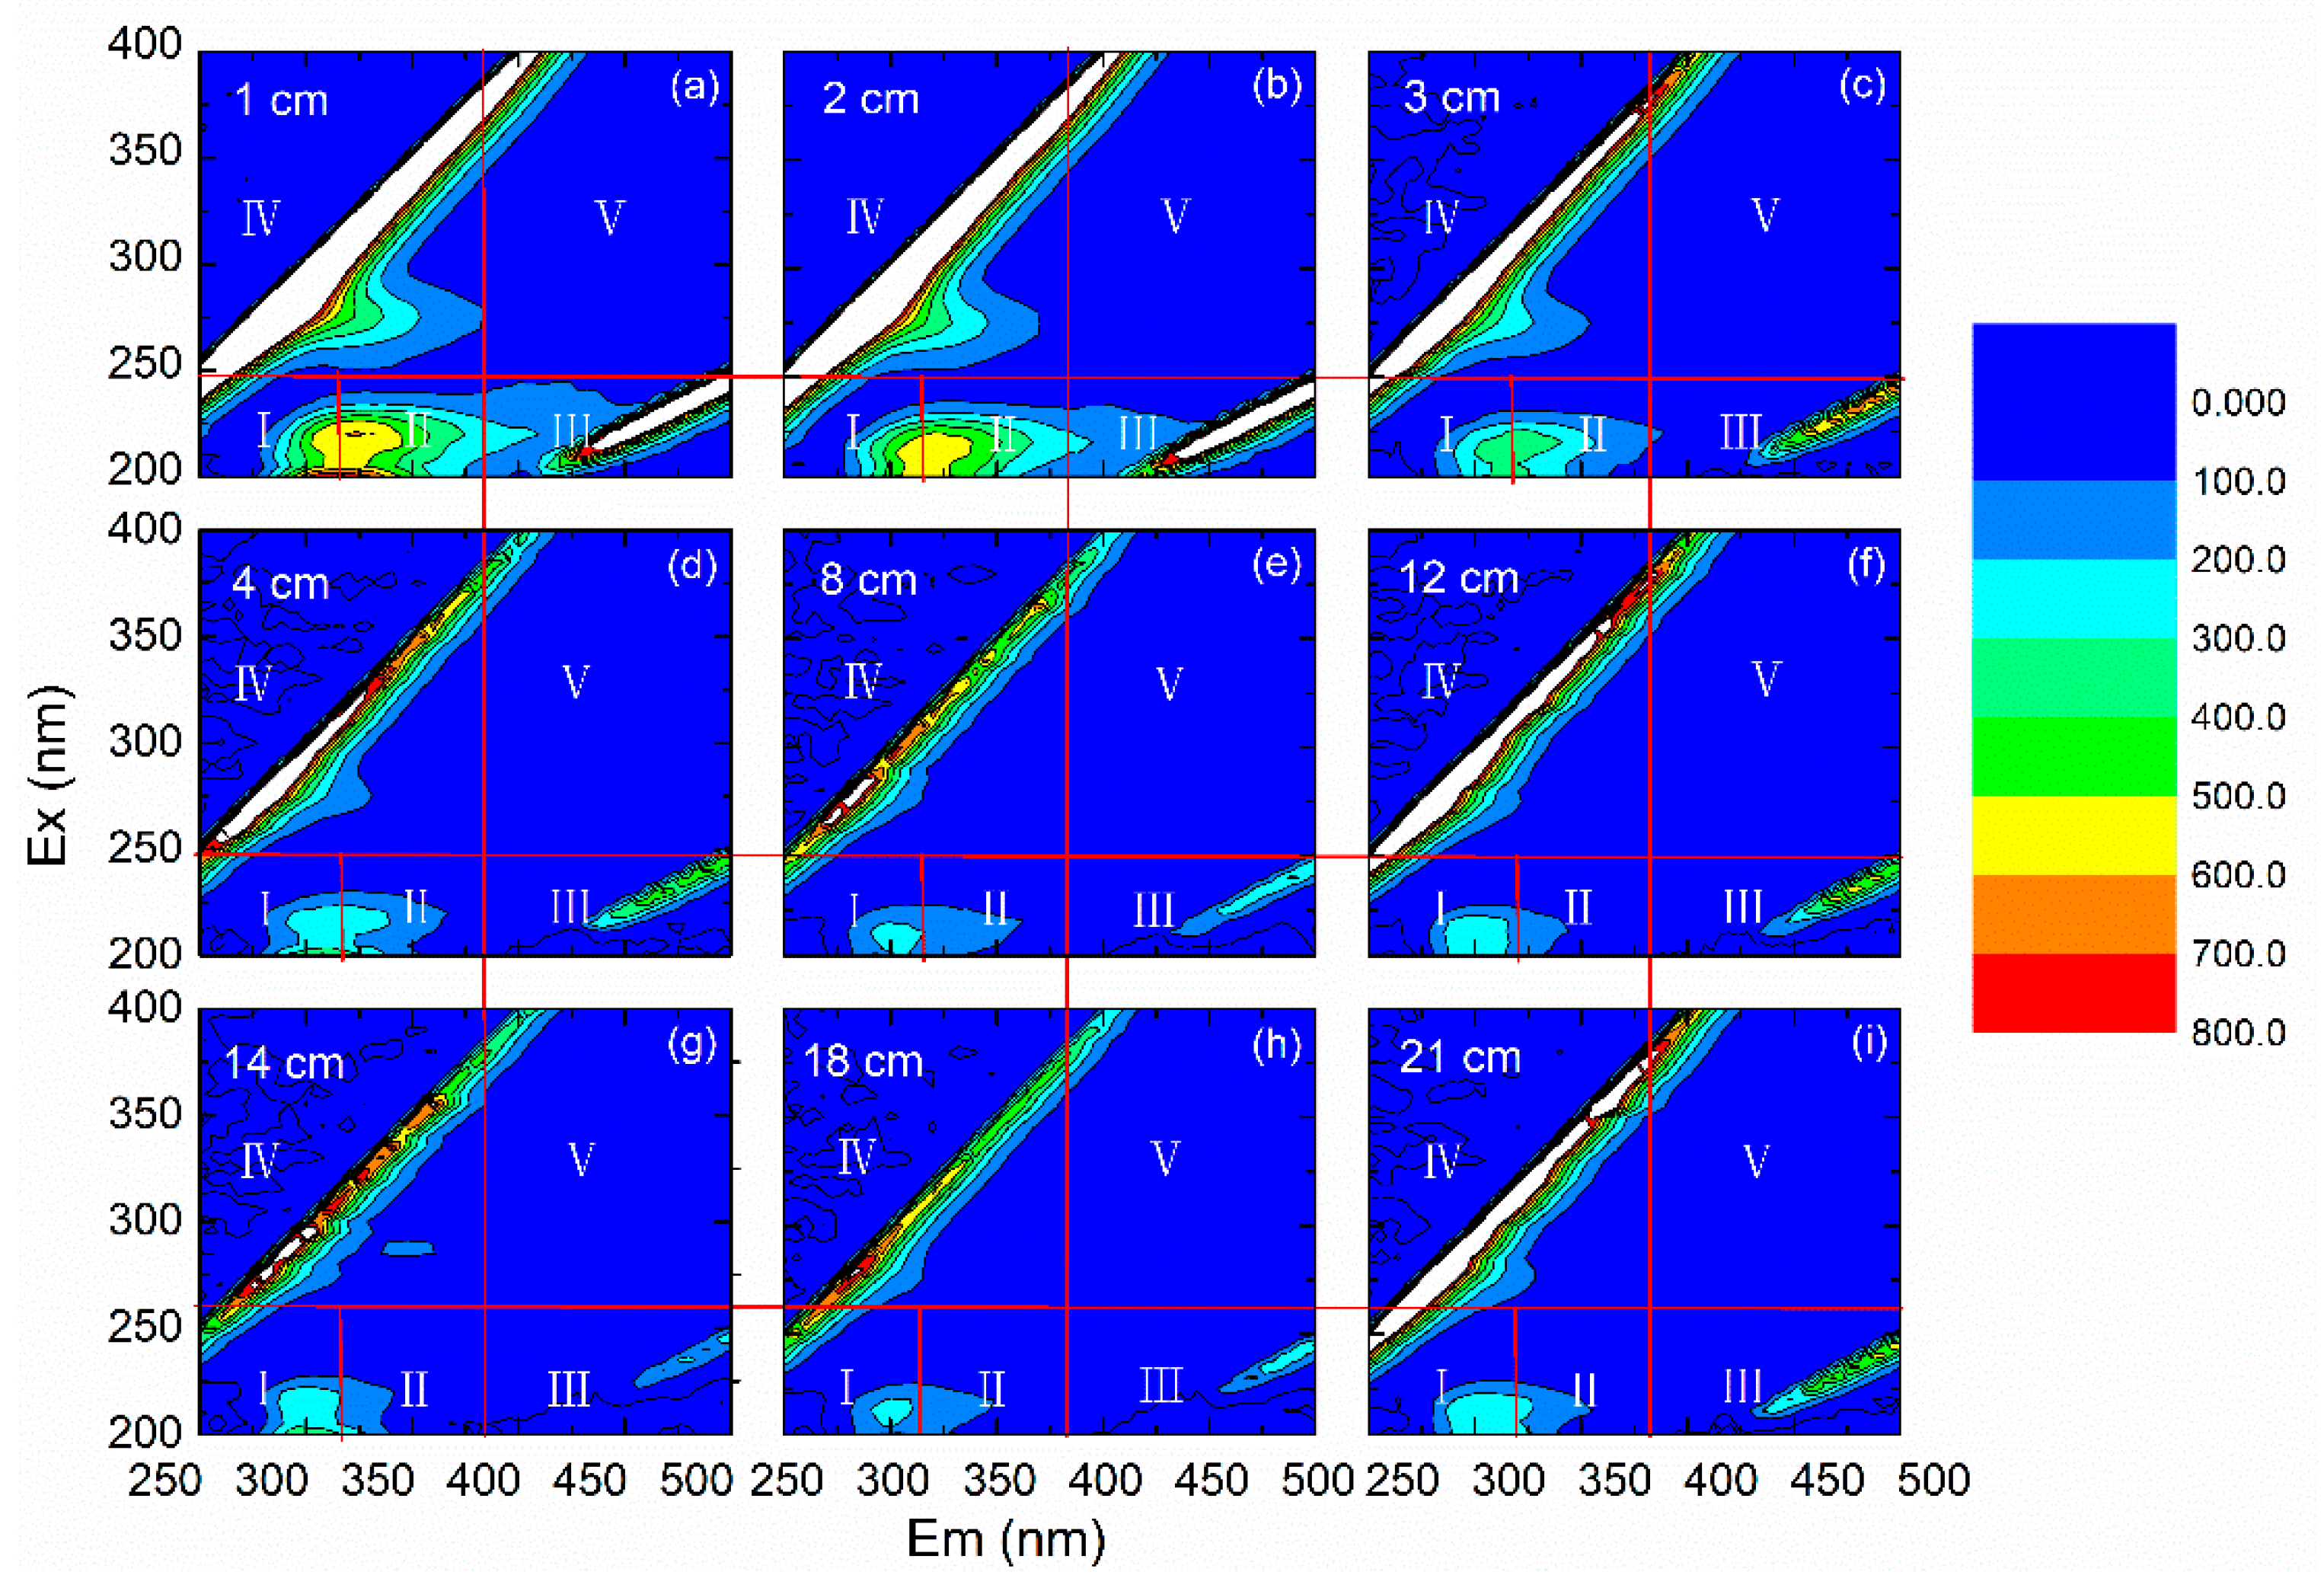
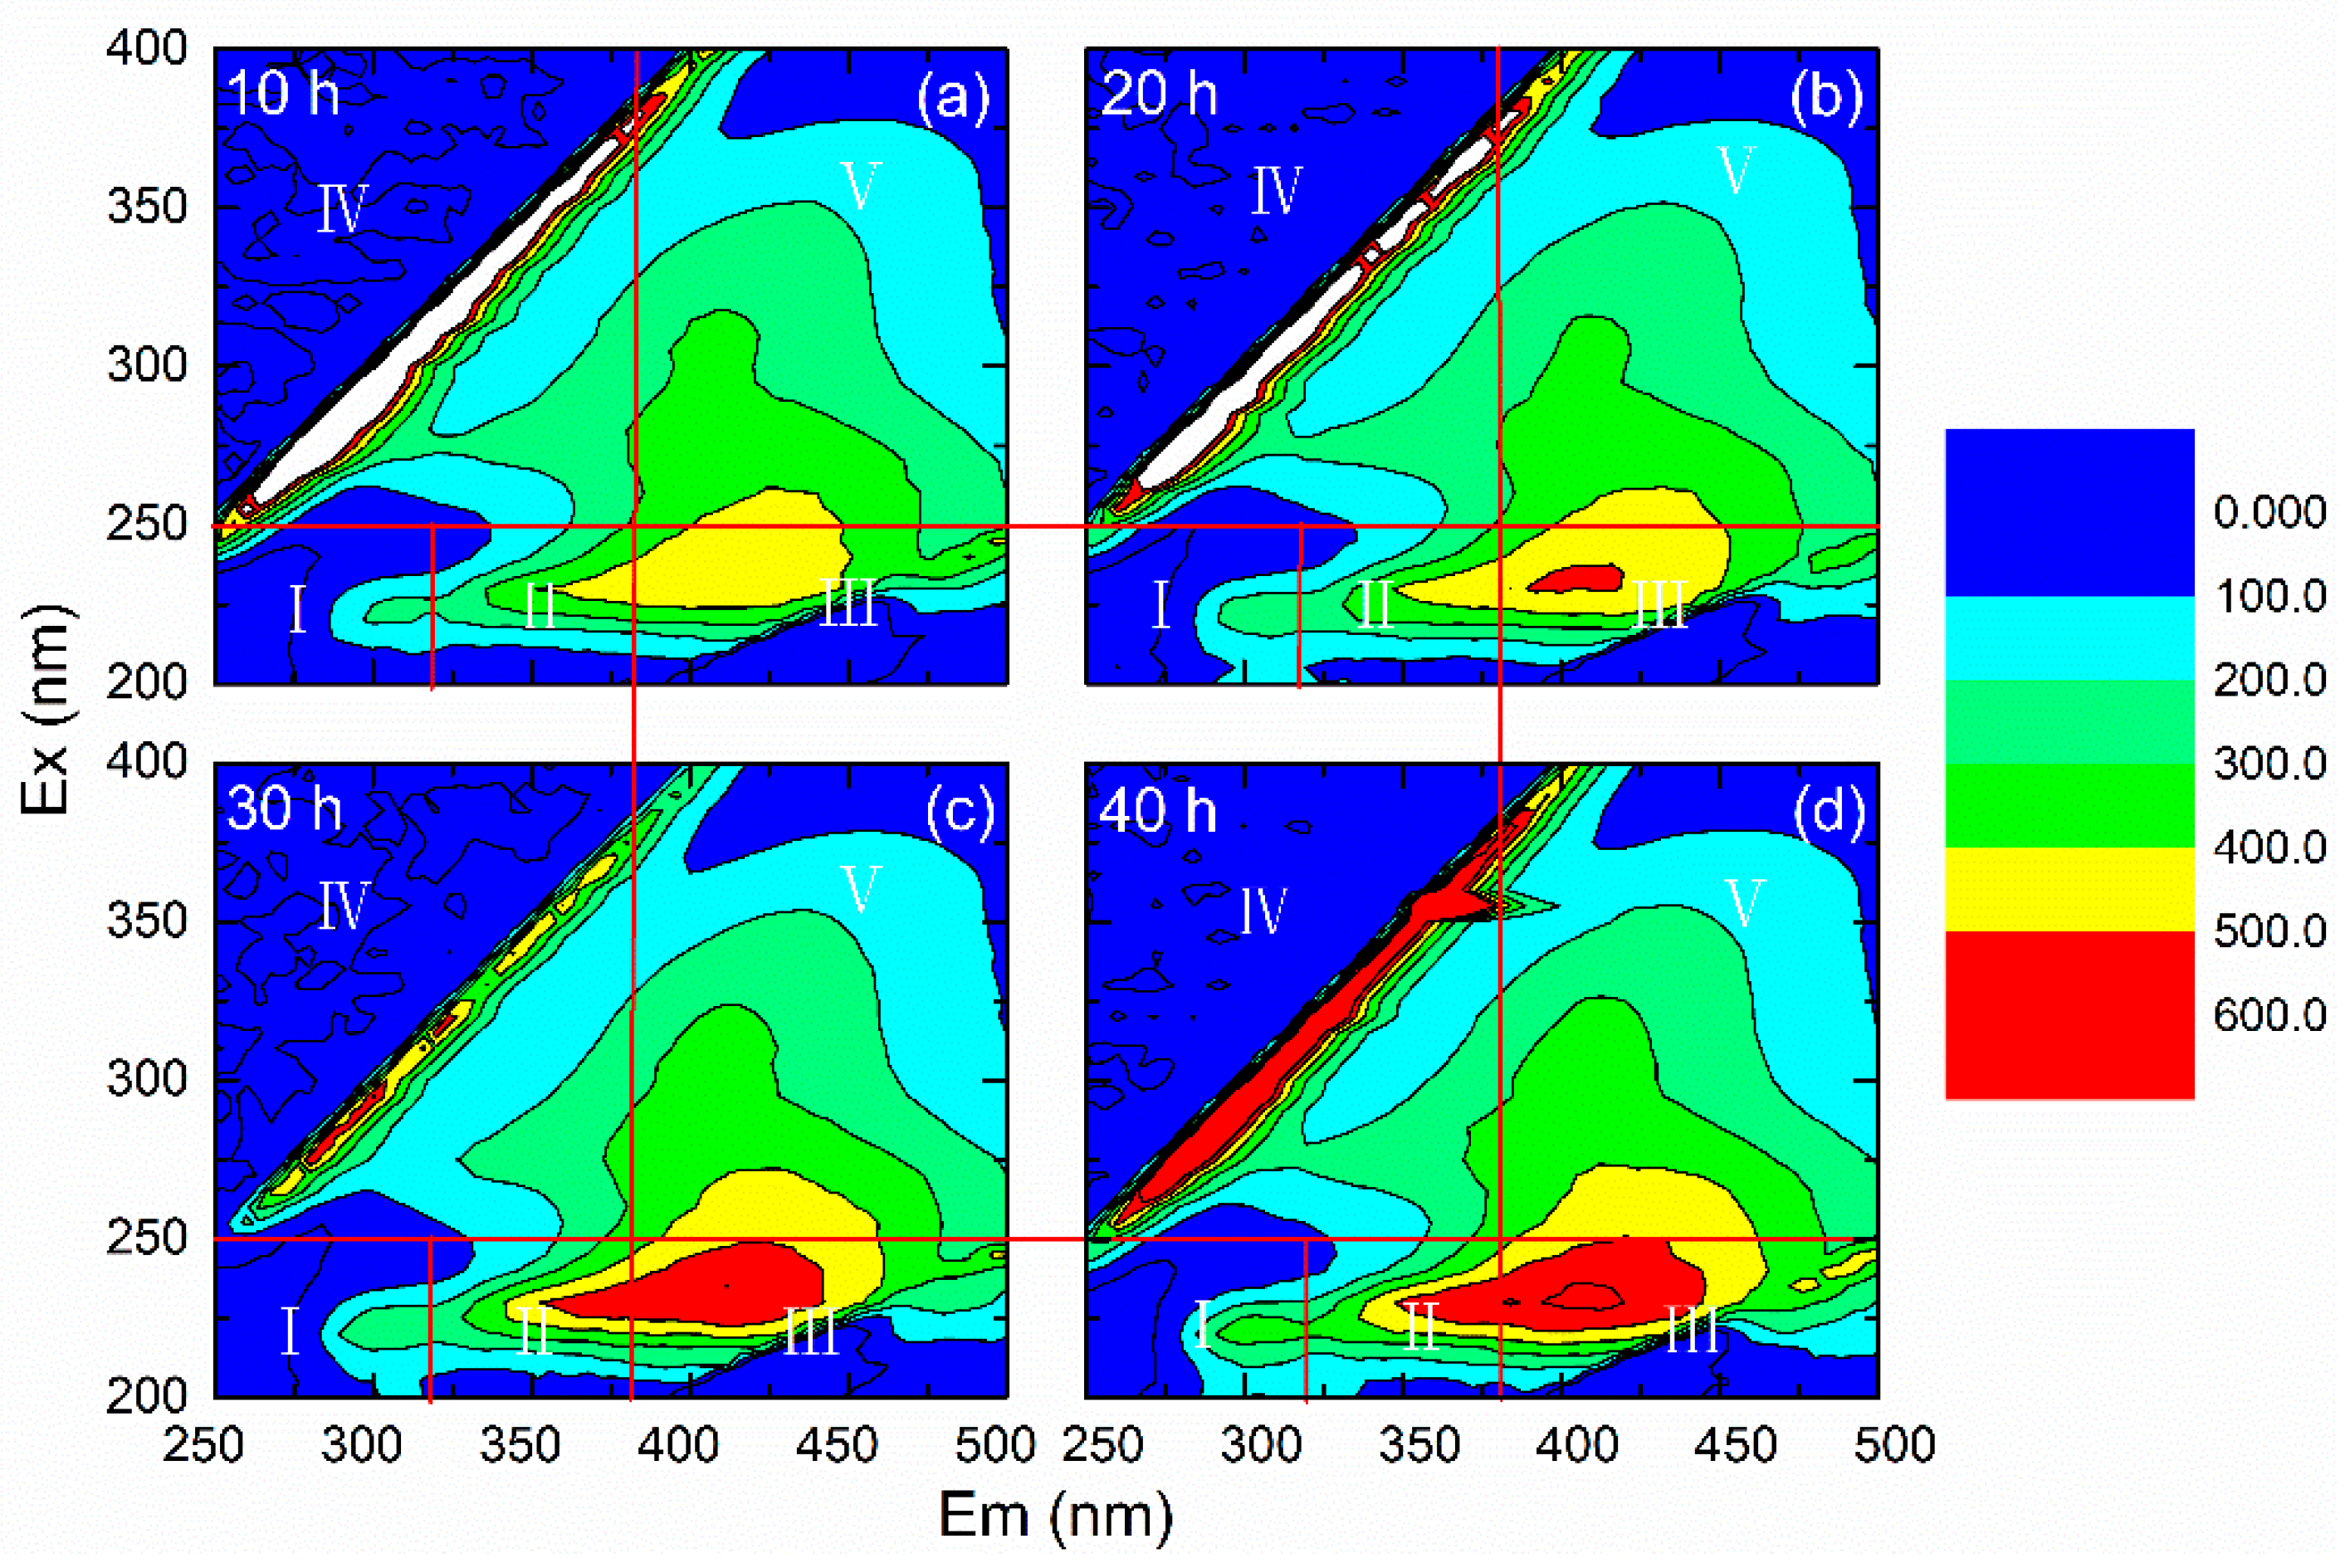
3.3. Variation of Organic Indicators

The refractory organic matters in SE are mainly phenols, aromatics, polycyclic aromatic hydrocarbons and other substances with a benzene ring and conjugated bond structure. UV254 can effectively characterize the concentration of these substances. Figure 8 shows UV254 changes at different times and along the column length. This shows that the column also had a certain removal effect on macromolecules or organics that were difficult to biodegrade, which can be characterized by UV254. The removal of organic matter during reinjection mainly occurred at 3 cm surface depth and decreased with the increase in soil depth (Figure 8b).
The TOC is a common organic matter control index, which represents the content of almost all of the organic matter in water. The inflow TOC concentration is 9.58 ± 0.50 mg/L, and the outflow concentration ranges from 7.71 ± 0.23 mg/L to 8.28 ± 0.28 mg/L. The interception ratio for TOC is less than 20% (Figure 9a). For organic floc particles, although the number of deposited organic particles was small, it was mainly concentrated on the surface (Figure 9b). The TOC concentration decreased exponentially with an increase in depth, which is consistent with other researchers’ reports [50].
DOM in the SE is not only related to the composition and properties of organic matter in the influent but also includes dissolved microbial metabolites produced in the process of biochemical treatment. DOM in the secondary effluent is mainly composed of humus, proteins, polysaccharides, lipids and small molecular amino acids and other complex organic matters [51]. The presence of DOM can severely restrict the safe wastewater reuse [52]. The representative substances of DOM, Pr and Ps were determined. From Figure 10, it can be seen that the trend of the TOC retention ratio along the column was similar to that of the Pr retention ratio along the column. Both of them were intercepted in the first 3 cm of the column, and the interception in the rear part of the column was very small (almost 0). The content of Pr decreased from 4.33 ± 0.81 mg/g at 1 cm, 2.70 ± 0.16 mg/g at 2 cm and 1.98 ± 0.24 mg/g at 3 cm to 0.49 ± 0.03 mg/g at 21 cm. Regarding the retention proportion curve of Ps along the column, it can be seen that there was no gradual reduction in the retention proportion trend of Ps along the column. The content of PS shows no significant change from 2.27 ± 0.26 mg/g at 1 cm, 1.51 ± 0.21 mg/g at 2 cm and 1.63 ± 0.21 mg/g at 3 cm to 0.89 ± 0.30 mg/g at 21 cm. The correlation between TOC, Pr and Ps was analyzed by SPSS software. The results obtained by the Spearman correlation method show that the correlation between TOC and Pr was significant (p = 0.036 < 0.05), and the correlation between TOC and Ps was not significant (p = 0.067 > 0.05). This shows that both Pr and Ps were greatly intercepted in the column. Pr is the main component of the intercepted TOC, and its content is higher than that of Ps. This indicated that it would provide a sufficient carbon source and nutrients for microorganisms, which may further increase the risk of biological clogging.
3DEEM fluorescence peaks can be used to reveal humic–like, tyrosine–like, tryptophan–like and phenol–like compounds [36]. In fact, each 3DEEM was divided into five different regions. Regions I and II (Ex < 250 nm, Em < 380 nm) represent some aromatic proteins, such as tyrosine/tryptophan; Region III (Ex < 250 nm, Em > 380 nm) represents fulvic acids; Region IV (Ex 250–280 nm, Em < 380 nm) represents soluble microbial byproduct–like material; Region V (Ex > 280 nm, Em > 380 nm) represents humic acid–like organics [12,35]. Therefore, through the 3DEEM spectra analysis, the trend of the retained and efflux organic substances could be obtained. We concluded that the content of protein organic matter intercepted at the first 3 cm was high, and the other layers decreased with the increase in depth. The proportions of humic acids and fulvic acids were very small and could be ignored. This is mainly due to the fact that humic acids are easily soluble in alkaline solutions, and fulvic acids are soluble in both alkaline and acidic solutions. Since the pH in the effluent gradually increased, it is concluded that the trapped humic acids and fulvic acids were easy to lease and flowed out. As shown in Figure 11, we found that the removal rate of hydrophilic and low molecular material such as proteins, amino acids and polysaccharides was the highest.
As shown in Figure 12, 3DEEM spectra of four different times were selected for comparison. A high–concentration soluble microbial byproduct was included in reclaimed water, which indicated that most substances were biomass–associated products resulting from cell lysis and hydrolysis [34]. Figure 10 shows that some amino acids, proteins and soluble microbial byproduct–like materials in the effluent decreased regularly, while the fulvic acid– and humic acid–like organics increased with time. Therefore, the attachment of Pr and the dissolution of humic acids and fulvic acids occurred in the column experiment. The trends became gradually more obvious. Up to 40 h, the concentration of DOM in the effluent was very high. This indicated that the interception capacity for DOM during single physical clogging was poor, although serious clogging degree occurred.
In our study, in order to simulate numerically the occurrence and development process of physical clogging and eliminate the influence of complex water rock interaction for porous media grains on recharge water quality, we selected pure quartz sands for column experiment. Therefore, the developed system cannot demonstrate the temporal and spatial evolution of physical clogging and water quality indicators in the actual soil aquifer system well. Moreover, some researchers have proposed to treat the wastewater to drinking water level; this will be very costly. In fact, clogging has a positive effect on the improvement of recharge water quality. Therefore, for different recharge water sources, we need to develop a specific guideline to define the relationship between reducing the risk of clogging and improving water quality in future.

4. Conclusions

Either for theoretical research or engineering practice, clogging and water quality changes are the two key scientific problems of artificial recharge. Both of the problems decided the technical and economic viability of the artificial recharge project. In this study, the risk of physical clogging and the corresponding changes of water quality indicators induced by injecting chlorinated SE were examined through a lab–scale column experiment. Physical clogging of the sand column is attributed to the deposition of the floc particles, which leads to an approximately 63.5% decrease in K/K0. The most serious clogging occurred in the first 3 cm, with a decrease of approximately 85.8% in K/K0. The porous media used in the system only has a certain degree of filtration effect on turbidity, TOC, Pr and Ps. For example, the removal ratio for TOC is less than 20%. We can speculate that the recharge water quality will lead to serious pollution in the subsurface environment. Therefore, this study has certain scientific value and practical significance for optimizing the quality standard of reclaimed water. The solution to scientific problems can have a positive effect on breaking through the bottleneck of the water quality safety guarantee of reclaimed water for artificial recharge. Nevertheless, how to evaluate and predict the pollution and clogging risks for different recharge water quality still requires further study.

Author Contributions

Y.W., W.F. and M.H. conceived and designed the experiments; Y.W. and W.A. executed the experiments and measured the data; Y.W. and Y.X. analyzed the data and wrote the paper; Y.X. and Z.Z. revised the manuscript. All authors have read and agreed to the published version of the manuscript.

Funding

This work was funded by the National Natural Science Foundation of China, grant numbers 51808255, 52100041 and 52000085, and the Jilin Province Education Department Science and Technology Research Project, grant numbers JJKH20200292KJ and JJKH20210305KJ.

Data Availability Statement

Not applicable.

Acknowledgments

We sincerely thank Key Laboratory of Songliao Aquatic Environment, Ministry of Education, Jilin Jianzhu University and School of Environment, Northeast Normal University for providing the experimental site.

Conflicts of Interest

The authors declare no conflict of interest.

References

  1. Lakretz, A.; Mamane, H.; Cikurel, H.; Avisar, D.; Gelman, E.; Zucker, I. The role of soil aquifer treatment (SAT) for effective removal of organic matter, trace organic compounds and microorganisms from secondary effluents pre-treated by ozone. Ozone Sci. Eng. 2017, 39, 385–394. [Google Scholar] [CrossRef]
  2. Dillon, P. Future management of aquifer recharge. Hydrogeol. J. 2005, 13, 313–316. [Google Scholar] [CrossRef]
  3. Fan, W.; Li, Q.; Huo, M.; Wang, X.; Lin, S. Transport of bacterial cell (E. coli) from different recharge water resources in porous media during simulated artificial groundwater recharge. Front. Env. Sci. Eng. 2020, 14, 63. [Google Scholar] [CrossRef]
  4. Wei, L.; Qin, K.; Zhao, Q.; Wang, K.; Kabutey, F.T.; Cui, F. Utilization of artificial recharged effluent for irrigation: Pollutants’ removal and risk assessment. J. Water Reuse Desal. 2017, 7, 77–87. [Google Scholar] [CrossRef] [Green Version]
  5. Tanttu, U.; Jokela, P. Sustainable drinking water quality improvement by managed aquifer recharge in Tuusula region, Finland. Sustain. Water Resour. Manag. 2018, 4, 225–235. [Google Scholar] [CrossRef]
  6. Sharma, S.K.; Hussen, M.; Amy, G. Soil aquifer treatment using advanced primary effluent. Water Sci. Technol. 2011, 64, 640–646. [Google Scholar] [CrossRef]
  7. Dillon, P.J.; Hickinbotham, M.R.; Pavelic, P. Review of International Experience in Injecting Water into Aquifers for Storage and Reuse; Institution of Engineers, Australia: Barton, Australia, 1994. [Google Scholar]
  8. Rinck-Pfeiffer, S.; Ragusa, S.; Sztajnbok, P.; Vandevelde, T. Interrelationships between biological, chemical, and physical processes as an analog to clogging in aquifer storage and recovery (ASR) wells. Water Res. 2000, 34, 2110–2118. [Google Scholar] [CrossRef]
  9. Du, X.; Fang, Y.; Wang, Z.; Hou, J.; Ye, X. The prediction methods for potential suspended solids clogging types during managed aquifer recharge. Water 2014, 6, 961–975. [Google Scholar] [CrossRef] [Green Version]
  10. Vanderzalm, J.L.; La Salle, C.L.G.; Dillon, P.J. Fate of organic matter during aquifer storage and recovery (ASR) of reclaimed water in a carbonate aquifer. Appl. Geochem. 2006, 21, 1204–1215. [Google Scholar] [CrossRef]
  11. Pavelic, P.; Dillon, P.J.; Barry, K.E.; Vanderzalm, J.L.; Correll, R.L.; Rinck-Pfeiffer, S.M. Water quality effects on clogging rates during reclaimed water ASR in a carbonate aquifer. J. Hydrol. 2007, 334, 1–16. [Google Scholar] [CrossRef]
  12. Zhang, H.; Huo, M.; Fan, W.; Zhu, S.; Lu, Y.; Xiong, H.; Geng, W.; Dong, L. Water quality variation and hydrogeochemical evolution during artificial groundwater recharge with reclaimed water: Laboratory experimental and numerical simulation study. Arab. J. Geosci. 2018, 11, 1–16. [Google Scholar] [CrossRef]
  13. Bradford, S.A.; Yates, S.R.; Bettahar, M.; Simunek, J. Physical factors affecting the transport and fate of colloids in saturated porous media. Water Resour. Res. 2002, 38, 63-1–63-12. [Google Scholar] [CrossRef] [Green Version]
  14. Jeong, H.Y.; Jun, S.C.; Cheon, J.Y.; Park, M. A review on clogging mechanisms and managements in aquifer storage and recovery (ASR) applications. Geosci. J. 2018, 22, 667–679. [Google Scholar] [CrossRef]
  15. Bai, H.; Chen, J.; Hu, Y.; Wang, G.; Liu, W.; Lamy, E. Biocolloid transport and deposition in porous media: A review. Korean J. Chem. Eng. 2022, 39, 38–57. [Google Scholar] [CrossRef]
  16. Zamani, A.; Maini, B. Flow of dispersed particles through porous media-deep bed filtration. J. Pet. Sci. Eng. 2009, 69, 71–88. [Google Scholar] [CrossRef]
  17. Fan, W.; Jiang, X.H.; Yang, W.; Geng, Z.; Huo, M.X.; Liu, Z.M.; Zhou, H. Transport of graphene oxide in saturated porous media: Effect of cation composition in mixed Na-Ca electrolyte systems. Sci. Total Environ. 2015, 511, 509–515. [Google Scholar] [CrossRef]
  18. Mays, D.C.; Hunt, J.R. Hydrodynamic aspects of particle clogging in porous media. Environ. Sci. Technol. 2005, 39, 577–584. [Google Scholar] [CrossRef] [Green Version]
  19. Bradford, S.A.; Torkzaban, S.; Walker, S.L. Coupling of physical and chemical mechanisms of colloid straining in saturated porous media. Water Res. 2007, 41, 3012–3024. [Google Scholar] [CrossRef]
  20. Bennacer, L.; Ahfir, N.D.; Alem, A.; Wang, H.Q. Coupled effects of ionic strength, particle size, and flow velocity on transport and deposition of suspended particles in saturated porous media. Transp. Porous Media 2017, 118, 251–269. [Google Scholar] [CrossRef]
  21. Bradford, S.A.; Kim, H.N.; Haznedaroglu, B.Z.; Torkzaban, S.; Walker, S.L. Coupled factors influencing concentration-dependent colloid transport and retention in saturated porous media. Environ. Sci. Technol. 2009, 43, 6996–7002. [Google Scholar] [CrossRef]
  22. Bennacer, L.; Ahfir, N.D.; Bouanani, A.; Alem, A.; Wang, H. Suspended particles transport and deposition in saturated granular porous medium: Particle size effects. Transp. Porous Media 2013, 100, 377–392. [Google Scholar] [CrossRef]
  23. Cui, X.; Liu, Q.; Zhang, C. Detachment characteristics of deposited particles in porous medium: Experimentation and modeling. Transp. Porous Media 2017, 119, 633–647. [Google Scholar] [CrossRef]
  24. Bai, B.; Long, F.; Rao, D.; Xu, T. The effect of temperature on the seepage transport of suspended particles in a porous medium. Hydrol. Processes 2016, 31, 382–393. [Google Scholar] [CrossRef]
  25. Alem, A.; Ahfir, N.D.; Elkawafi, A.; Wang, H. Hydraulic operating conditions and particle concentration effects on physical clogging of a porous medium. Transp. Porous Media 2015, 106, 303–321. [Google Scholar] [CrossRef]
  26. Mesticou, Z.; Kacem, M.; Dubujet, P. Influence of ionic strength and flow rate on silt particle deposition and release in saturated porous medium: Experiment and modeling. Transp. Porous Media 2014, 103, 1–24. [Google Scholar] [CrossRef]
  27. Torkzaban, S.; Bradford, S.A.; Vanderzalm, J.L.; Patterson, B.M.; Harris, B.; Prommer, H. Colloid release and clogging in porous media: Effects of solution ionic strength and flow velocity. J. Contam. Hydrol. 2015, 181, 161–171. [Google Scholar] [CrossRef] [PubMed] [Green Version]
  28. Torkzaban, S.; Bradford, S.A.; Walker, S.L. Resolving the coupled effects of hydrodynamics and DLVO forces on colloid attachment in porous media. Langmuir 2007, 23, 9652–9660. [Google Scholar] [CrossRef]
  29. Wu, L.; Gao, B.; Munoz-Carpena, R.; Pachepsky, Y.A. Single Collector attachment efficiency of colloid capture by a cylindrical collector in laminar overland flow. Environ. Sci. Technol. 2012, 46, 8878–8886. [Google Scholar] [CrossRef]
  30. Wang, Y.; Huo, M.; Li, Q.; Fan, W.; Yang, J.; Cui, X. Comparison of clogging induced by organic and inorganic suspended particles in a porous medium: Implications for choosing physical clogging indicators. J. Soils Sediments 2018, 18, 2980–2994. [Google Scholar] [CrossRef]
  31. Xie, Y.; Wang, Y.; Huo, M.; Geng, Z.; Fan, W. Risk of physical clogging induced by low-density suspended particles during managed aquifer recharge with reclaimed water: Evidences from laboratory experiments and numerical modeling. Environ. Res. 2020, 186, 109527. [Google Scholar] [CrossRef]
  32. Westerhoff, P.; Pinney, M. Dissolved organic carbon transformations during laboratory-scale groundwater recharge using lagoon-treated wastewater. Waste Manag. 2000, 20, 75–83. [Google Scholar] [CrossRef]
  33. Xue, S.; Zhao, Q.L.; Wei, L.L.; Wang, L.N. Reduction of dissolved organic matter and trihalomethane formation potential during laboratory-scale soil-aquifer treatment. Water Environ. J. 2008, 22, 148–154. [Google Scholar] [CrossRef]
  34. Cui, X.; Chen, C.; Liu, Y.; Zhou, D.; Liu, M. Exogenous refractory protein enhances biofilm formation by altering the quorum sensing system: A potential hazard of soluble microbial proteins from WWTP effluent. Sci. Total Environ. 2019, 667, 384–389. [Google Scholar] [CrossRef] [PubMed]
  35. Chen, W.; Westerhoff, P.; Leenheer, J.A.; Booksh, K. Fluorescence excitation-emission matrix regional integration to quantify spectra for dissolved organic matter. Environ. Sci. Technol. 2003, 37, 5701–5710. [Google Scholar] [CrossRef] [PubMed]
  36. Hao, R.; Ren, H.; Li, J.; Ma, Z.; Wan, H.; Zheng, X.; Cheng, S. Use of three-dimensional excitation and emission matrix fluorescence spectroscopy for predicting the disinfection by-product formation potential of reclaimed water. Water Res. 2012, 46, 5765–5776. [Google Scholar] [CrossRef] [PubMed]
  37. Li, Q.; Yang, J.; Fan, W.; Zhou, D.; Wang, X.; Zhang, L.; Huo, M.; Crittenden, J.C. Different transport behaviors of Bacillus subtilis cells and spores in saturated porous media: Implications for contamination risks associated with bacterial sporulation in aquifer. Colloid Surf. B 2018, 162, 35–42. [Google Scholar] [CrossRef] [PubMed]
  38. Du, X.; Ye, X.; Zhang, X. Clogging of saturated porous media by silt-sized suspended solids under varying physical conditions during managed aquifer recharge. Hydrol. Processes 2018, 32, 2254–2262. [Google Scholar] [CrossRef]
  39. Zhou, J.; Zheng, X.; Flury, M.; Lin, G. Permeability changes during remediation of an aquifer affected by sea-water intrusion: A laboratory column study. J. Hydrol. 2009, 376, 557–566. [Google Scholar] [CrossRef]
  40. Lu, Y.; Du, X.; Chi, B.; Yang, Y.; Fan, W. Numerical modelling of physical clogging during groundwater artificial recharge. IAHS-AISH Publ. 2011, 341, 121–126. [Google Scholar]
  41. Zheng, X.L.; Shan, B.B.; Chen, L.; Sun, Y.W.; Zhang, S.H. Attachment-detachment dynamics of suspended particle in porous media: Experiment and modeling. J. Hydrol. 2014, 511, 199–204. [Google Scholar] [CrossRef]
  42. Bouwer, H. Artificial recharge of groundwater: Hydrogeology and engineering. Hydrogeol. J. 2002, 10, 121–142. [Google Scholar] [CrossRef] [Green Version]
  43. Abdalrahman, G.A.; Lai, S.H.; Snounu, I.; Kumar, P.; Sefelnasr, A.; Sherif, M.; El-shafie, A. Review on wastewater treatment ponds clogging under artificial recharge: Impacting factors and future modelling. J. Water Process Eng. 2021, 40, 101848. [Google Scholar] [CrossRef]
  44. Duval, Y.; Mielczarski, J.A.; Pokrovsky, O.S.; Mielczarski, E.; Ehrhardt, J.J. Evidence of the existence of three types of species at the quartz− aqueous solution interface at pH 0−10: XPS surface group quantification and surface complexation modeling. J. Phys. Chem. B 2002, 106, 2937–2945. [Google Scholar] [CrossRef]
  45. Hu, E.; Zhao, X.; Pan, S.; Ye, Z.; He, F. Sorption of non-ionic aromatic organics to mineral micropores: Interactive effect of cation hydration and mineral charge density. Environ. Sci. Technol. 2019, 53, 3067–3077. [Google Scholar] [CrossRef] [PubMed]
  46. Mulidzi, A.R.; Clarke, C.E.; Myburgh, P.A. Effect of irrigation with diluted winery wastewater on cations and pH in four differently textured soils. S. Afr. J. Enol. Vitic. 2015, 36, 402–412. [Google Scholar] [CrossRef] [Green Version]
  47. Amirtharajah, A. Some theoretical and conceptual views of filtration. J. AWWA 1988, 80, 36–46. [Google Scholar] [CrossRef]
  48. Darby, J.L.; Lawler, D.F. Ripening in depth filtration: Effect of particle size on removal and head loss. Environ. Sci. Technol. 1990, 24, 1069–1079. [Google Scholar] [CrossRef]
  49. Page, D.; Vanderzalm, J.; Miotliński, K.; Barry, K.; Dillon, P.; Lawrie, K.; Brodie, R.S. Determining treatment requirements for turbid river water to avoid clogging of aquifer storage and recovery wells in siliceous alluvium. Water Res. 2014, 66, 99–110. [Google Scholar] [CrossRef]
  50. Lindroos, A.J.; Kitunen, V.; Derome, J.; Helmisaari, H.S. Changes in dissolved organic carbon during artificial recharge of groundwater in a forested esker in Southern Finland. Water Res. 2002, 36, 4951–4958. [Google Scholar] [CrossRef]
  51. Wei, L.L.; Zhao, Q.L.; Xue, S.; Chang, C.C.; Tang, F.; Liang, G.L.; Jia, T. Reduction of trihalomethane precursors of dissolved organic matter in the secondary effluent by advanced treatment processes. J. Hazard. Mater. 2009, 169, 1012–1021. [Google Scholar] [CrossRef]
  52. Michael-Kordatou, I.; Michael, C.; Duan, X.; He, X.; Dionysiou, D.D.; Mills, M.A.; Fatta-Kassinos, D. Dissolved effluent organic matter: Characteristics and potential implications in wastewater treatment and reuse applications. Water Res. 2015, 77, 213–248. [Google Scholar] [CrossRef] [PubMed]
Figure 1. The description of the column experiment and the analysis of samples.
Water 14 00701 g001
Figure 2. The graphical scheme of the study design.
Water 14 00701 g002
Figure 3. The experimental and simulated values of K/K0 and Ki/K0 (i = 1, 2, 3, 4, 5) as a function of time in different sections: (a) 0–21 cm; (b) 0–3 cm; (c) 3–8 cm; (d) 8–13 cm; (e) 13–18 cm; (f) 18–21 cm.
Water 14 00701 g003
Figure 4. The spatial distributions of K/K0 at different times (0, 10, 20, 30, 40 h).
Water 14 00701 g004
Figure 5. (a) pH changes at different times; (b) pH changes along the column length.
Water 14 00701 g005
Figure 6. (a) Turbidity changes at different times; (b) turbidity changes along the column length.
Water 14 00701 g006
Figure 7. (a) Salinity changes at different times; (b) salinity changes along the column length.
Water 14 00701 g007
Figure 8. (a) UV254 changes at different times; (b) UV254 changes along the column length.
Water 14 00701 g008
Figure 9. (a) TOC changes at different times; (b) TOC changes along the column length.
Water 14 00701 g009
Figure 10. Retention ratio of TOC, Pr and Ps along the column length.
Water 14 00701 g010
Figure 11. 3DEEM spectra changes in components of DOM at different sections of the column: (a) 1 cm; (b) 2 cm; (c) 3 cm; (d) 4 cm; (e) 8 cm; (f) 12 cm; (g) 14 cm; (h) 18 cm; (i) 21 cm.
Water 14 00701 g011
Figure 12. 3DEEM distribution of retained organic matters at different times along the column: (a) 10 h; (b) 20 h; (c) 30 h; (d) 40 h.
Water 14 00701 g012
Table 1. The main properties of the chlorinated secondary effluent.
Main Water Quality Parameters of Chlorinated SE
pH7.71 ± 0.02Salinity (psu)0.44 ± 0.00
Na+ (mg/L)57.41 ± 1.23SS (mg/L)10.53 ± 1.30
K+ (mg/L)10.87 ± 0.01NTU1.85 ± 0.06
Mg2+ (mg/L)10.22 ± 0.14IS (mM)9.46
Ca2+ (mg/L)55.18 ± 1.02TOC (mg/L)9.58 ± 0.50
Al3+ (mg/L)0.03 ± 0.00TN (mg/L)10.67 ± 0.05
Cl (mg/L)184.78 ± 7.78TP (mg/L)0.04 ± 0.00
NO2 (mg/L)0.01 ± 0.00Ps (mg/L)2.79 ± 0.16
NO3 (mg/L)7.76 ± 0.20Pr (mg/L)7.68 ± 1.10
SO42− (mg/L)10.99 ± 1.23UV2540.11 ± 0.00
HCO3 (mg/L)190.03 ± 0.41
Publisher’s Note: MDPI stays neutral with regard to jurisdictional claims in published maps and institutional affiliations.

