Article

Diurnal Evapotranspiration and Its Controlling Factors of Alpine Ecosystems during the Growing Season in Northeast Qinghai-Tibet Plateau

1
State Key Laboratory of Earth Surface Processes and Resource Ecology, Beijing Normal University, Beijing 100875, China
2
School of Natural Resources, Faculty of Geographical Science, Beijing Normal University, Beijing 100875, China
3
Key Laboratory of Tibetan Plateau Land Surface Processes and Ecological Conservation, Ministry of Education, Qinghai Normal University, Xining 810016, China
4
Academy of Plateau Science and Sustainability, Qinghai Normal University, Xining 810016, China
*
Author to whom correspondence should be addressed.
Water 2022, 14(5), 700; https://doi.org/10.3390/w14050700
Submission received: 22 December 2021 / Revised: 19 February 2022 / Accepted: 21 February 2022 / Published: 23 February 2022
(This article belongs to the Special Issue Advances in Studies on Ecohydrological Processes in the Arid Area)

Abstract

:
It is generally believed that evapotranspiration at night is too miniscule to be considered. Thus, few studies focus on the nocturnal evapotranspiration (ETN) in alpine region. In this study, based on the half-hour eddy and meteorological data of the growing season (from May to September) in 2019, we quantified the ETN of alpine desert (AD), alpine meadow (AM), alpine meadow steppe (AMS), and alpine steppe (AS) in the Qinghai Lake Basin and clarified the different response of evapotranspiration to climate variables in daytime and nighttime with the variation of elevation. The results show that: (1) ETN accounts for 9.88~15.08% of total daily evapotranspiration and is relatively higher in AMS (15.08%) and AD (12.13%); (2) in the daytime, net radiation (Rn), temperature difference (TD), vapor pressure difference (VPD), and soil moisture have remarkable influence on evapotranspiration, and Rn and VPD are more important at high altitudes, while TD is the main factor at low altitudes; (3) in the nighttime, VPD and wind speed (WS) control ETN at high altitudes, and TD and WS drive ETN at low altitudes. Our results are of great significance in understanding ETN in the alpine regions and provide reference for further improving in the evapotranspiration estimation model.

1. Introduction

Evapotranspiration (ET), as one of the key and complex links in the process of hydrological cycle and energy cycle, is an active factor affecting regional hydrology, climate, and soil [1]. Defined as the total water vapor flux transported to the atmosphere by vegetation and ground, ET mainly includes the soil evaporation and vegetation transpiration [2]. Soil evaporation is the process of soil water rising from the soil surface into the atmosphere, which is mainly affected by solar radiation, temperature, relative humidity (RH), wind speed (WS), and soil texture. Transpiration of vegetation is the main cause of water loss in vegetation, which is related to photosynthesis and respiration of vegetation [3,4]. Due to the lack of effective observations, traditional studies widely concluded that stomata of most plants were completely closed, and transpiration was impossible after sunset because of the absence of solar radiation for driving transpiration at night. Thus, water loss from the ground into the atmosphere at night was often overlooked [5,6,7]. However, studies have shown that nocturnal transpiration is possible and has been measured in both woody and herbaceous plants [8,9,10,11]. Actually, the nocturnal ET (ETN) includes soil evaporation and plant transpiration as that in the daytime. Increasing evidences indicated that incomplete stomatal closure exists, and the subsequent transpiration overnight is very common, which would result in 10~15% of daytime plant water loss at night [12]. Moreover, water loss at night can even reach 25~30% in deserts and savannas [13,14]. For soil evaporation, driven by the reduction of land surface temperature (cold end) and increase in the surface soil water tension, which means a lower soil water potential, unsaturated soil water migrates from the warm deep (soil inside) to the cold end (land surface) [15]. Thus, evaporation could occur at the night, while the soil temperature is low. Therefore, ETN plays an important role in the quantification of ET, whose neglect would lead to the underestimation of ecosystem evaporation [16,17].
The intensity of regional ET is affected by plant growth conditions (leaf area index), sources (soil moisture), and energy driving force (solar radiation) [3,4,18]. Since there is no solar radiation at night, the main control factors of ET are different between day and night. Most studies have shown that the influencing factors of daily ET (ETD) mainly include air temperature (Ta), vapor pressure difference (VPD), and WS, while the driving factors of ETN are mainly controlled by VPD and ventilation conditions [19,20]. At present, there are few studies focusing on ETN and its influencing factors, especially alpine regions, which have intense solar radiation during the daytime and large temperature difference between day and night. The quantification in ETN and exploration of the potential mechanisms are urgent gaps in the study of the hydrological cycle and water budget of alpine ecosystem.
The Qinghai-Tibet Plateau has a unique alpine environment and various ecosystems, including alpine shrubs, alpine steppe, alpine meadow, and alpine desert, which makes it sensitive and vulnerable to climate change [21,22]. However, current studies related to ET mostly focus on forests [23,24], wetland [25], and farmland [26,27,28]. There are relatively few studies on ET in cold alpine ecosystems. In recent years, the climate of the Qinghai-Tibet Plateau has undergone great changes, altering the hydrological cycle and the energy cycle [29]. Although wind stilling could result in decrease in ET, the warming of Ta and land surface temperature and increase in ground-air temperature gradient [29], soil moisture, and vegetation density led to more evaporation on the Qinghai-Tibet Plateau [29,30,31]. For example, Yin et al. [32] reported that the actual ET over the Qinghai-Tibet Plateau increased at rate of 0.08 mm∙a−1 in the past 30 years by model simulation. However, most existing studies in ET are based on remote sensing inversion and model simulation, which have great uncertainty in regional upscaling [33,34], and remote sensing inversion can only be carried out on a coarse time scale and is restricted to quantify the diurnal variation of ET [35]. Therefore, the acquisition and analysis of multi-site and high-frequency observed data re very important in the study of regional ET. There are many methods to calculate ET based on fully physical models, semi-physical models, and black-box models [36,37]. The calculation methods are relatively reliable by fully physical models that account for mass and energy conservation principles [38]. Eddy covariance (EC) method is the most accurate observation method internationally recognized, with relatively large spatial representativeness, which has perfect theoretical verification and can continuously observe the actual ET at high frequency for a long time [39,40] and has been an ideal method to explore the characteristics and potential mechanisms of actual ET at different time scales [41,42,43]. It calculates ET through the observed latent heat flux by the EC, which is based on the mass and energy conservation principles [43]. However, in the alpine region, due to its harsh climate and environmental conditions, it is more difficult to install and maintain instruments, and observation stations are very scarce at the regional scale. Therefore, it is exigent to explore the changes and influencing factors of ET at different time scales in alpine regions through high-frequency observation of ET at multiple stations on the watershed scale.
Qinghai Lake Basin, with typical alpine ecosystems, is a representative alpine area of Qinghai-Tibet Plateau; thus, the study of ET of alpine ecosystems in the Qinghai Lake Basin is key to understanding the ET process of alpine ecosystems in the Qinghai-Tibet Plateau and is of great significance to the assessment of water resources in the Qinghai-Tibet Plateau. With typical fragile ecosystems, Qinghai Lake Basin is situated in the northeastern Qinghai-Tibet Plateau and is sensitive to climate change [44]. In recent years, the water level of Qinghai Lake continues to rise [45], and with the emergence of problems, such as soil erosion and grassland degradation, the water balance in the basin has always been a research focus. As an important component of water balance, ET has attracted more and more attention. Based on the half-hourly eddy covariance and micrometeorological data of alpine desert (AD), alpine meadow (AM), alpine meadow steppe (AMS), and alpine steppe (AS) of the growing season (from May to September) in 2019 over Qinghai Lake Basin, we aim to (1) quantify and compare the ET of the four typical alpine ecosystems during daytime and nighttime and (2) identify the influencing factors for ET during daytime and nighttime with the variation of elevation.

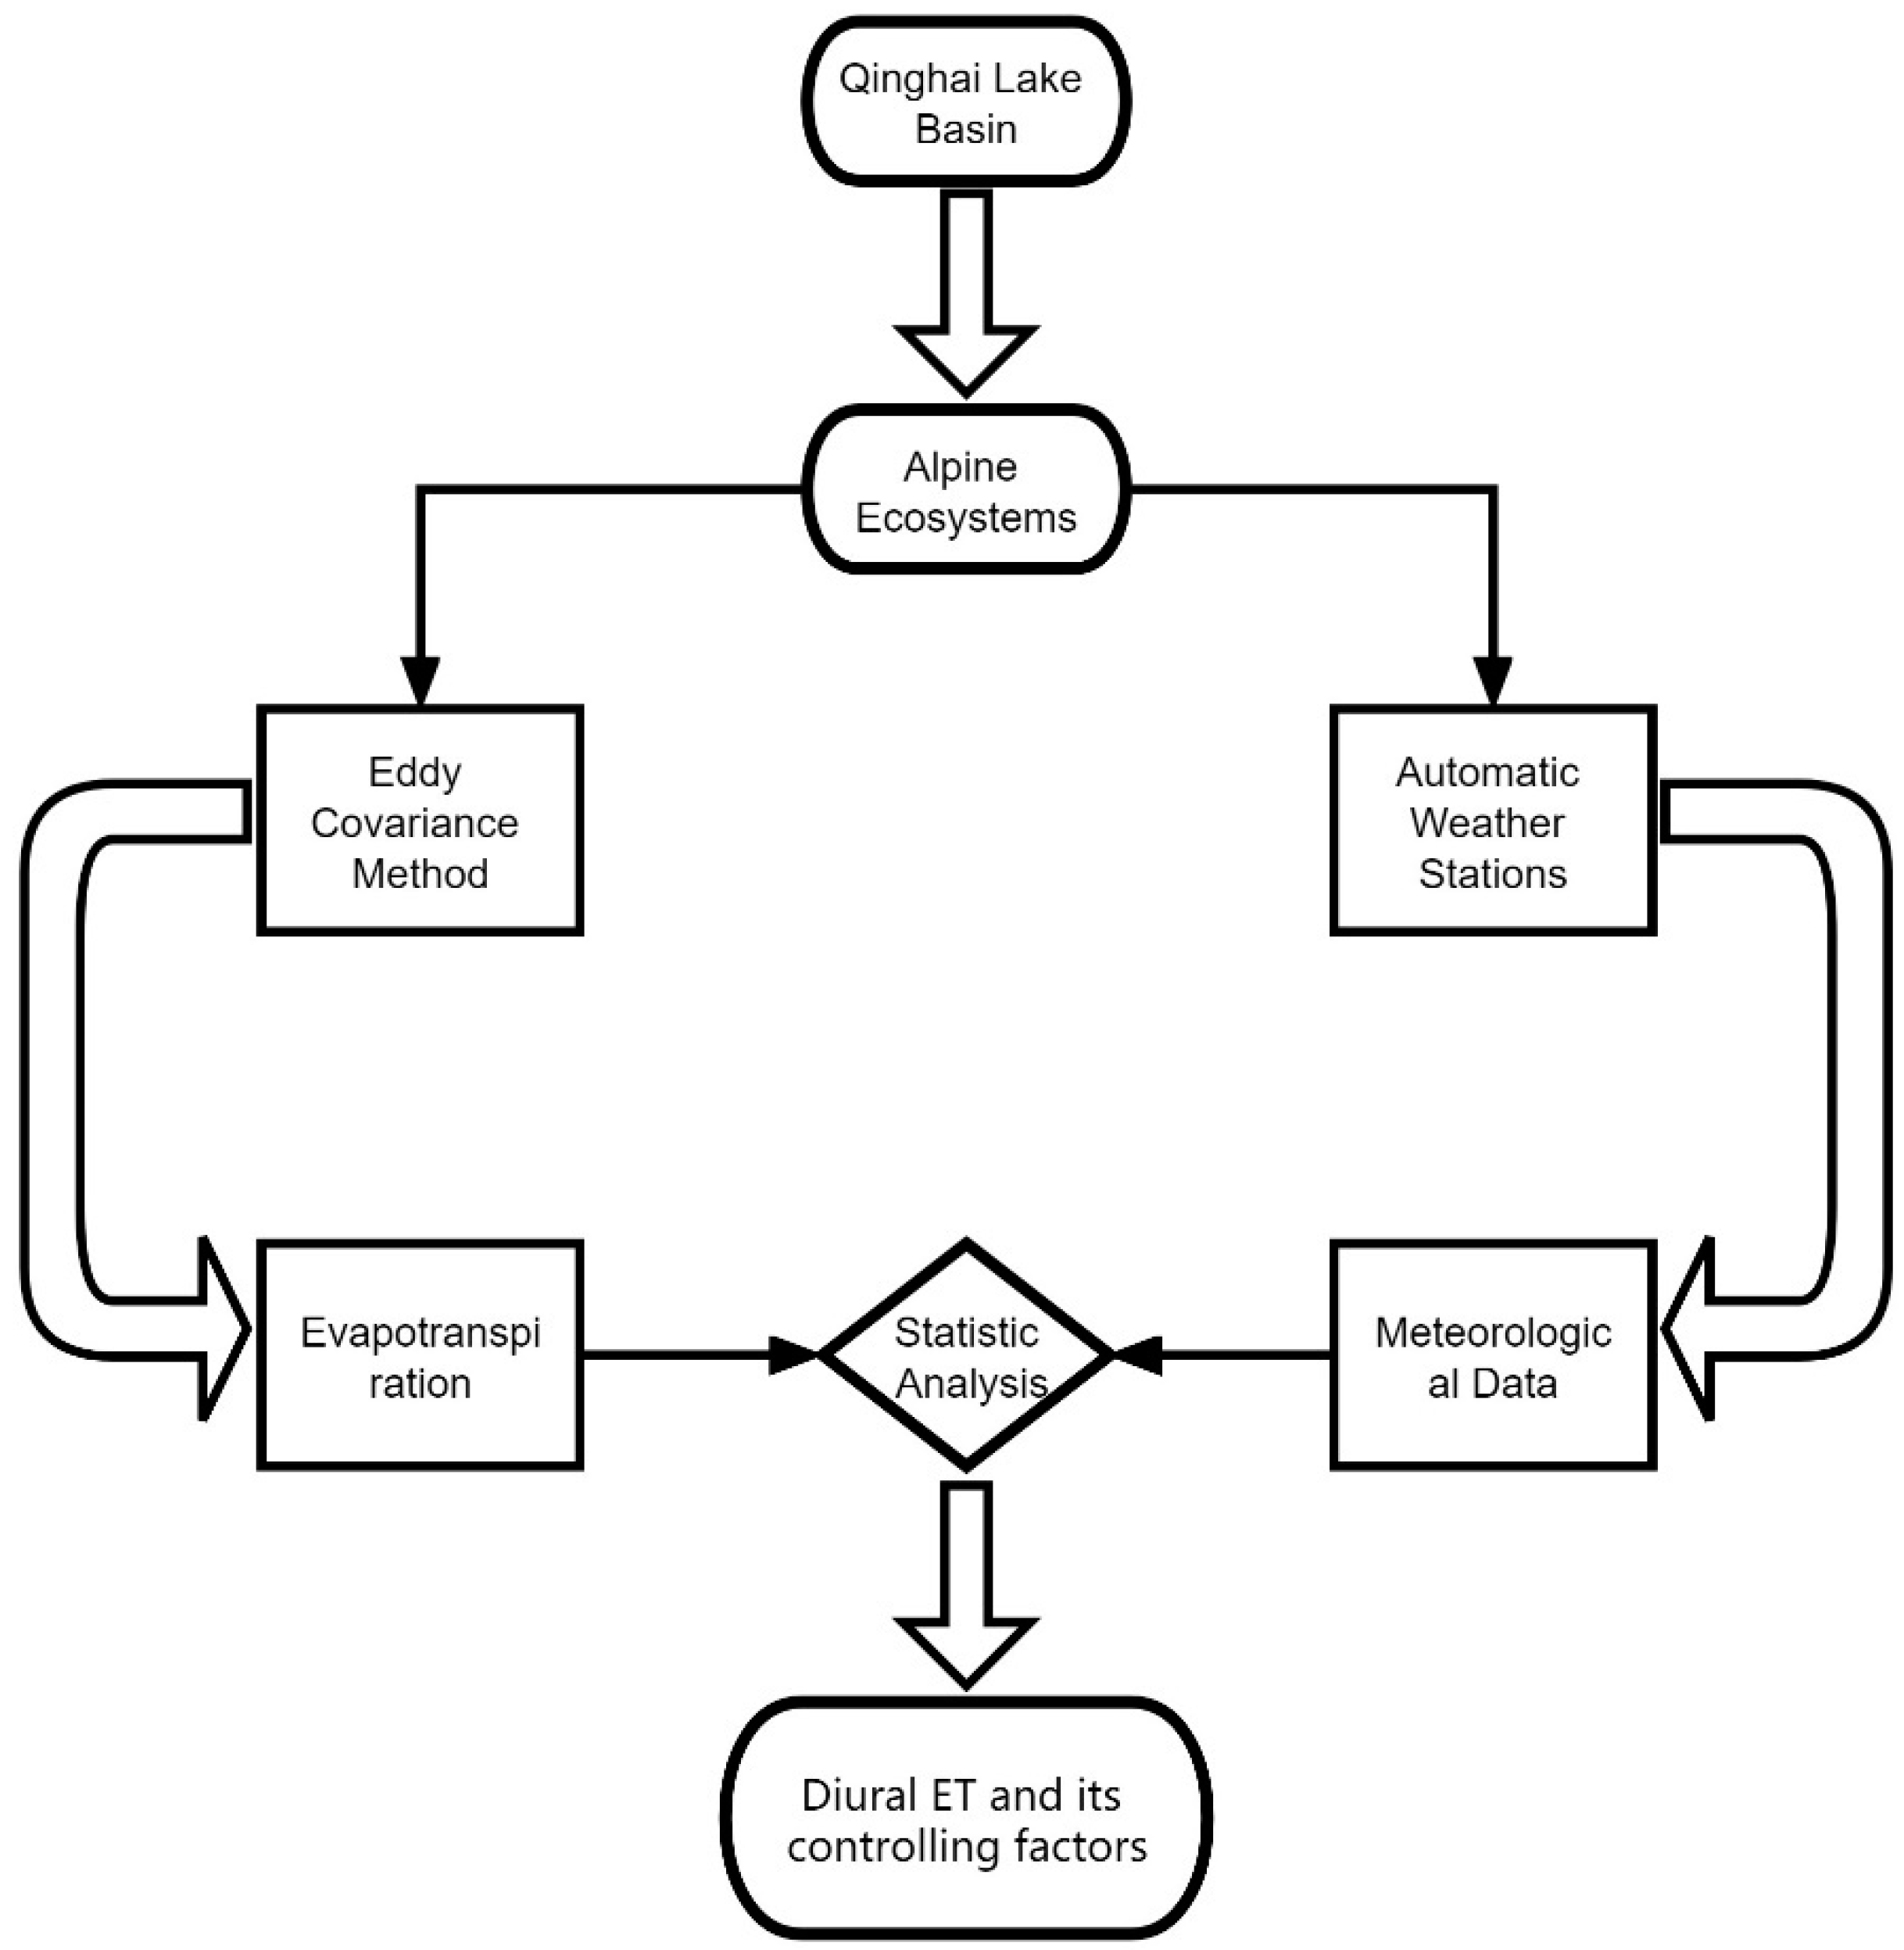
2. Materials and Methods

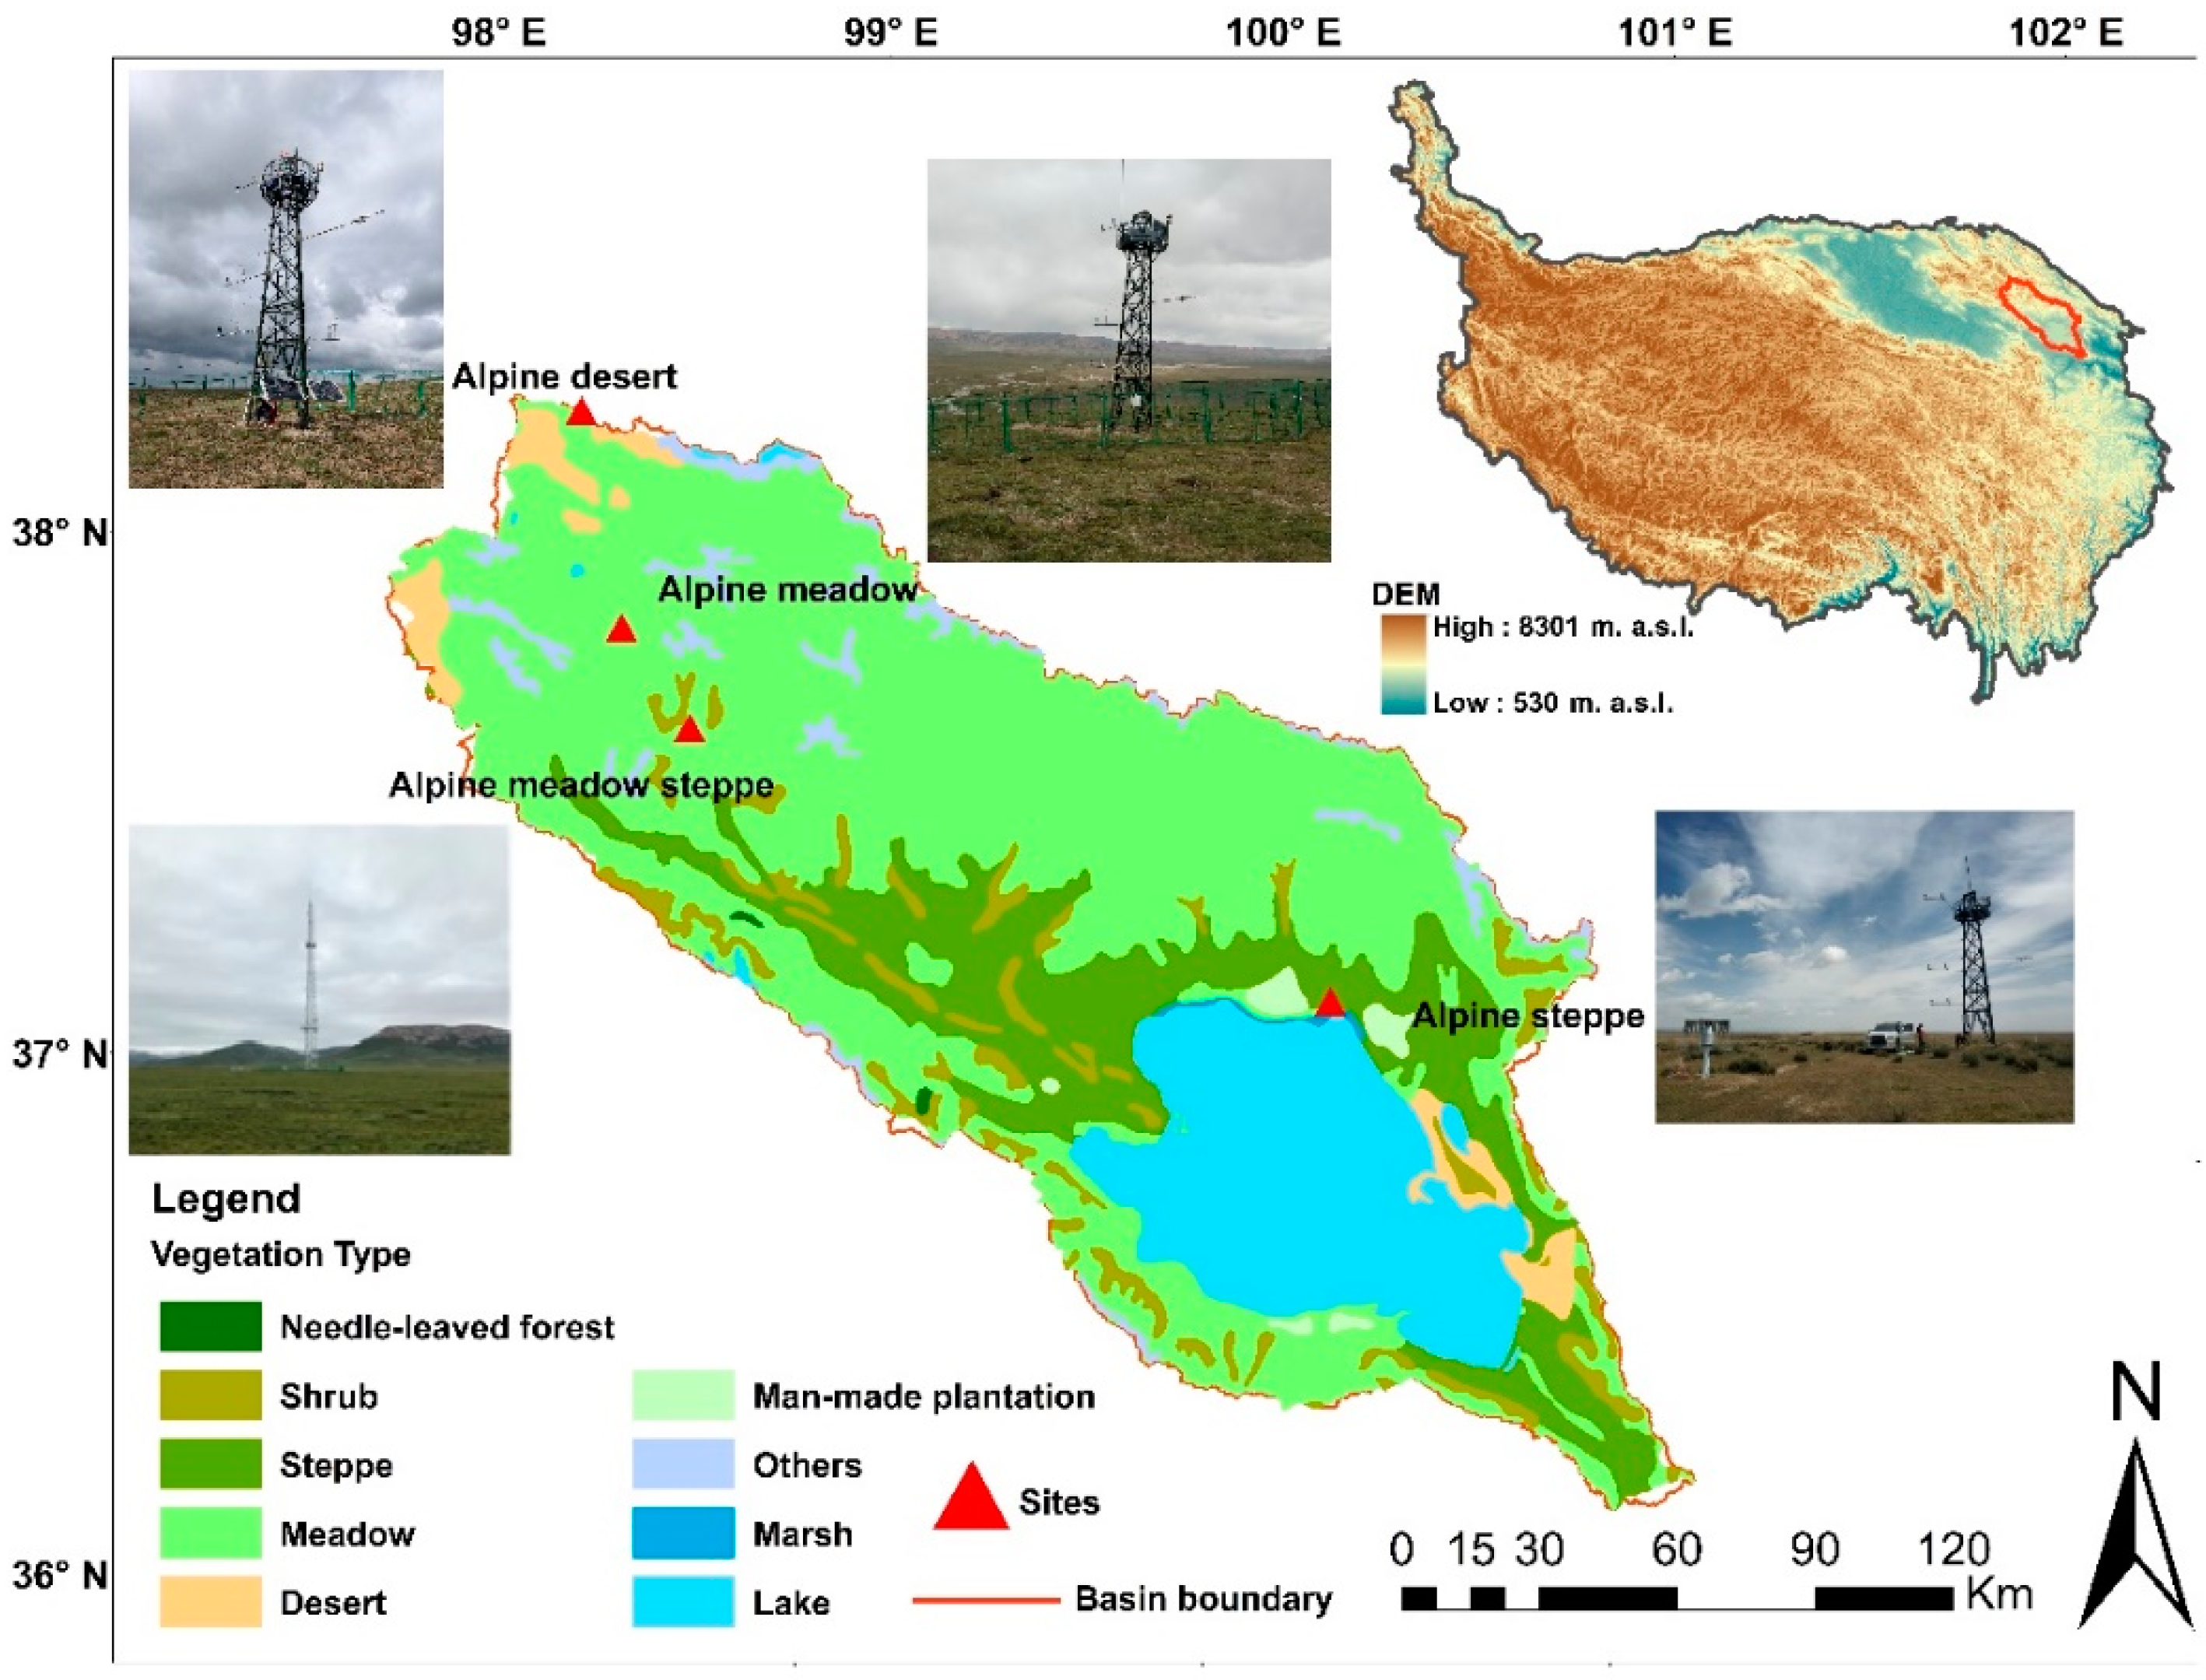
2.1. Site Description

Qinghai Lake Basin is located in the northeast of the Qinghai-Tibet Plateau (Figure 1) and lies in the high altitude, cold, and semiarid climate zone characterized by windy conditions, strong solar radiation, a large temperature difference between day and night, and rainfall that mainly occurs in summer. The mean annual Ta ranged from −1.34 °C to −0.1 °C and increased by 0.03 °C∙a−1 during 2001~2015 [44,46]. The mean annual precipitation and evaporation were about 400 and 1000 mm, respectively, and both of them happen mainly in the growing season from May to September (more than 85% and 60%, respectively) [44,47]. Four observation sites were selected in the Qinghai Lake Basin and detailed through information in Table 1, which were characterized by cold alpine ecosystems (AD, AM, AMS, and AS), respectively. They account for more than 75% of the total land area of the whole watershed [48,49].

2.2. Instrumentations

We built observation towers at four sites separately, with EC systems comprised of three-dimensional sonic anemometer (Model CSAT3 (Campbell Scientific Inc., Logan, UT, USA), Wind Master Pro (Gill Instrument Limited Hampshire, Lymington, UK)) and open-path infrared gas analyzer (Model EC150 (Campbell Scientific Inc., Logan, UT, USA), Li-7500 (Model Li-Cor, Lincoln, NE, USA)), installed 4.5 m above the ground. The data were collected at 10 Hz by CR1000X data loggers (Model Campbell Scientific Inc., Logan, UT, USA). The observation data of EC mainly include latent heat flux (LE), sensible heat flux (H) and net ecosystem exchange (NEE).
Observations of near-surface meteorological elements are measured by a set of automatic weather stations, including Ta and RH (Model HMP155, Vaisala Inc., Helsinki, Finland), WS (Model Windsonic, Gill Instrument Limited, Hampshire, UK), precipitation (Pre, Model T-200b, Geonor Inc., Oslo, Norway), land surface temperature and soil temperature (LST/Ts, Model 109, Campbell Scientific Inc., Logan, UT, USA), soil moisture (Ms, Model CS616, Campbell Scientific Inc., Logan, UT, USA), atmospheric radiation (CNR4, Zones Kipp & Zones B.V., Delft, The Netherlands), and soil heat flux (Gn, Model HFP01, Hukseflux, Delft, The Netherlands); where Ts and Ms are measured at 5-, 10-, 20-, and 40-cm soil depth, the AMS site only uses data of 20-cm layer due to probe damage, while the AS site does not use data of 40 cm. Atmospheric radiation observation includes upward and downward solar short-wave radiation and upward and downward long-wave radiation, which are used to calculate atmospheric net radiation. The data were processed by a CR1000X (Model Campbell Scientific Inc., Logan, UT, USA) and recorded every 10 min. Due to a failure of the solar power supply system, the AM site lacked effective EC observation data from 1 June to 30 June 2019. Since the changes of surface energy budget and ET during the growing season are mainly studied in this paper, the research results are basically not affected. EC system and automatic weather stations are powered by solar panels and batteries.

2.3. Data Processing

In this study, the half-hour turbulent flux was calculated, and the relevant flux was corrected according to the following steps: (1) The wild-point data were removed: before the flux was calculated, the original 10-Hz data were checked according to the method of Vickers and Mahrt [50], and the wild points that were far beyond the reasonable value or have obvious errors caused by instrument failure, weather influence, and random noise were eliminated. If the wild-point data in half an hour were greater than 10%, the flux in half an hour was regarded as vacant. (2) Coordinate rotation: a precondition for flux observation by EC is that the half-hour average value of vertical WS is zero, but this requirement cannot be met in actual observation due to terrain, instrument installation, and other factors. Therefore, the method of quadratic coordinate rotation was adopted to correct WS to meet the above conditions [51]. (3) Calculation of pulsation: the original data signal was split into mean value and pulsation term using linear detrending method. (4) Frequency attenuation correction: according to the method introduced by Moncrieff [52], the systematic error of this part was corrected. (5) Density change correction: the open-circuit CO2/H2O analyzer measures the density of gas rather than the molar mixing ratio. The density change of air will affect the measurement of actual flux. The method introduced by Webb [53] was adopted to correct this part of error. (6) Turbulent flux measurement and correction: the analytical model proposed by Kormann and Meixner [54] was used to analyze the flux contribution area and eliminate the flux whose contribution to flux was less than 80% in the sample area. All the above steps are realized in EddyPro 5.2.0 software (LI-Cor, Lincoln, NE, USA).
Quality control was carried out for the calculated half-hour average flux. Firstly, the one-hour flux records before and after precipitation and snowfall were excluded. Then, Steady State Test and Integral Turbulence Characteristics Test were performed on half-hour original data according to Foken and Wichura’s method [55]. Quality control was carried out on 10-min meteorological data obtained from AWS to ensure 144 data per day (every 10 min). In case of missing data, the value was set to null, and the time with repeated records was eliminated. Data obviously beyond the physical meaning or beyond the instrument range were deleted, and finally, we took the average value (except precipitation; in this case, we took the cumulative value) to get the data of half-an-hour scale.
In this study, the following methods were used to fill the vacancy flux data for estimation of the daily and monthly fluxes: for the vacancy less than or equal to 2 h, the linear difference was calculated according to the effective fluxes at both ends; a gap of more than 2 h was filled by mean diurnal variation with the observed mean value of 5 days in the same period before and after the neighboring period.

2.4. Energy Balance and Evapotranspiration Calculation

In the determination of ecosystem energy flux by using EC observation, the surface-energy balance formula can be expressed as Equation (1):
LE + H = RnGn
Rn = Rsd + RldRsuRlu
where LE is the latent heat flux (W∙m−2), H is the sensible heat flux (W∙m−2), Rn is net radiation (W∙m−2), and Gn is soil heat flux (W∙m−2); and Rsd, Rld, Rsu, and Rlu are downward shortwave radiation, downward longwave radiation, upward shortwave radiation, and upward longwave radiation, respectively.
In this study, ET was calculated by Equations (3) and (4):
λ = (2500.78 − 2.3601 × Ta) × 1000
ET = 3600 × LE
where λ is the latent heat of vaporization, Ta is air temperature (°C), and LE is latent heat (W∙m−2).
The percentage of ETN is calculated by dividing ETN by the total daily ET. Daytime (08:00–19:30) and nighttime (20:00–07:30) are divided according to Appel et al. [56]. The calculation of VPD is based on Equations (5) and (6) according to Wu et al. [57].
VPD = (1 − RH/100) × SVP
SVP = 610.7 × 10 7.5Ta/(237.3+Ta)
where RH is relative humidity, and SVP is the saturated vapor pressure for a given temperature (Ta).

2.5. Statistic Analysis

We chose energy balance closure analysis to evaluate the reliability of the observed data by EC method. Linear regression method was used to the closure analysis of turbulent flux (LE + H) and effective energy (RnGn) of the four ecosystems during the growing season from May to September in 2019. Additionally, data analysis was performed to assess the energy balance ratio (EBR) by Equation (7):
EBR = (LE + H)/(RnGn)
Sensitivity analysis investigates the effect of change of one factor on another by its definition [58]. The sensitivity coefficient stands for the regression coefficient of each variable, which means the amount of change in ET caused by the variation of per unit in the variable. To explore the influencing factor of these ecosystems, partial least squares regression was used to calculate the sensitivity coefficient and contribution of Rn, TD, Ts, -Pre, VPD, Ms, WS, and NEE (daily scale data) to ET in daytime and nighttime, respectively. Then, the relative contribution is calculated by Equation (8):
R C i = | R i | i = 1 n | R i | × 100 %
where Ri is amount to the sensitivity coefficient, i represents the number of influence factors, and RCi is the relative contribution of this impact factor.
The whole idea and methods of this study can be seen in Figure 2.

3. Results

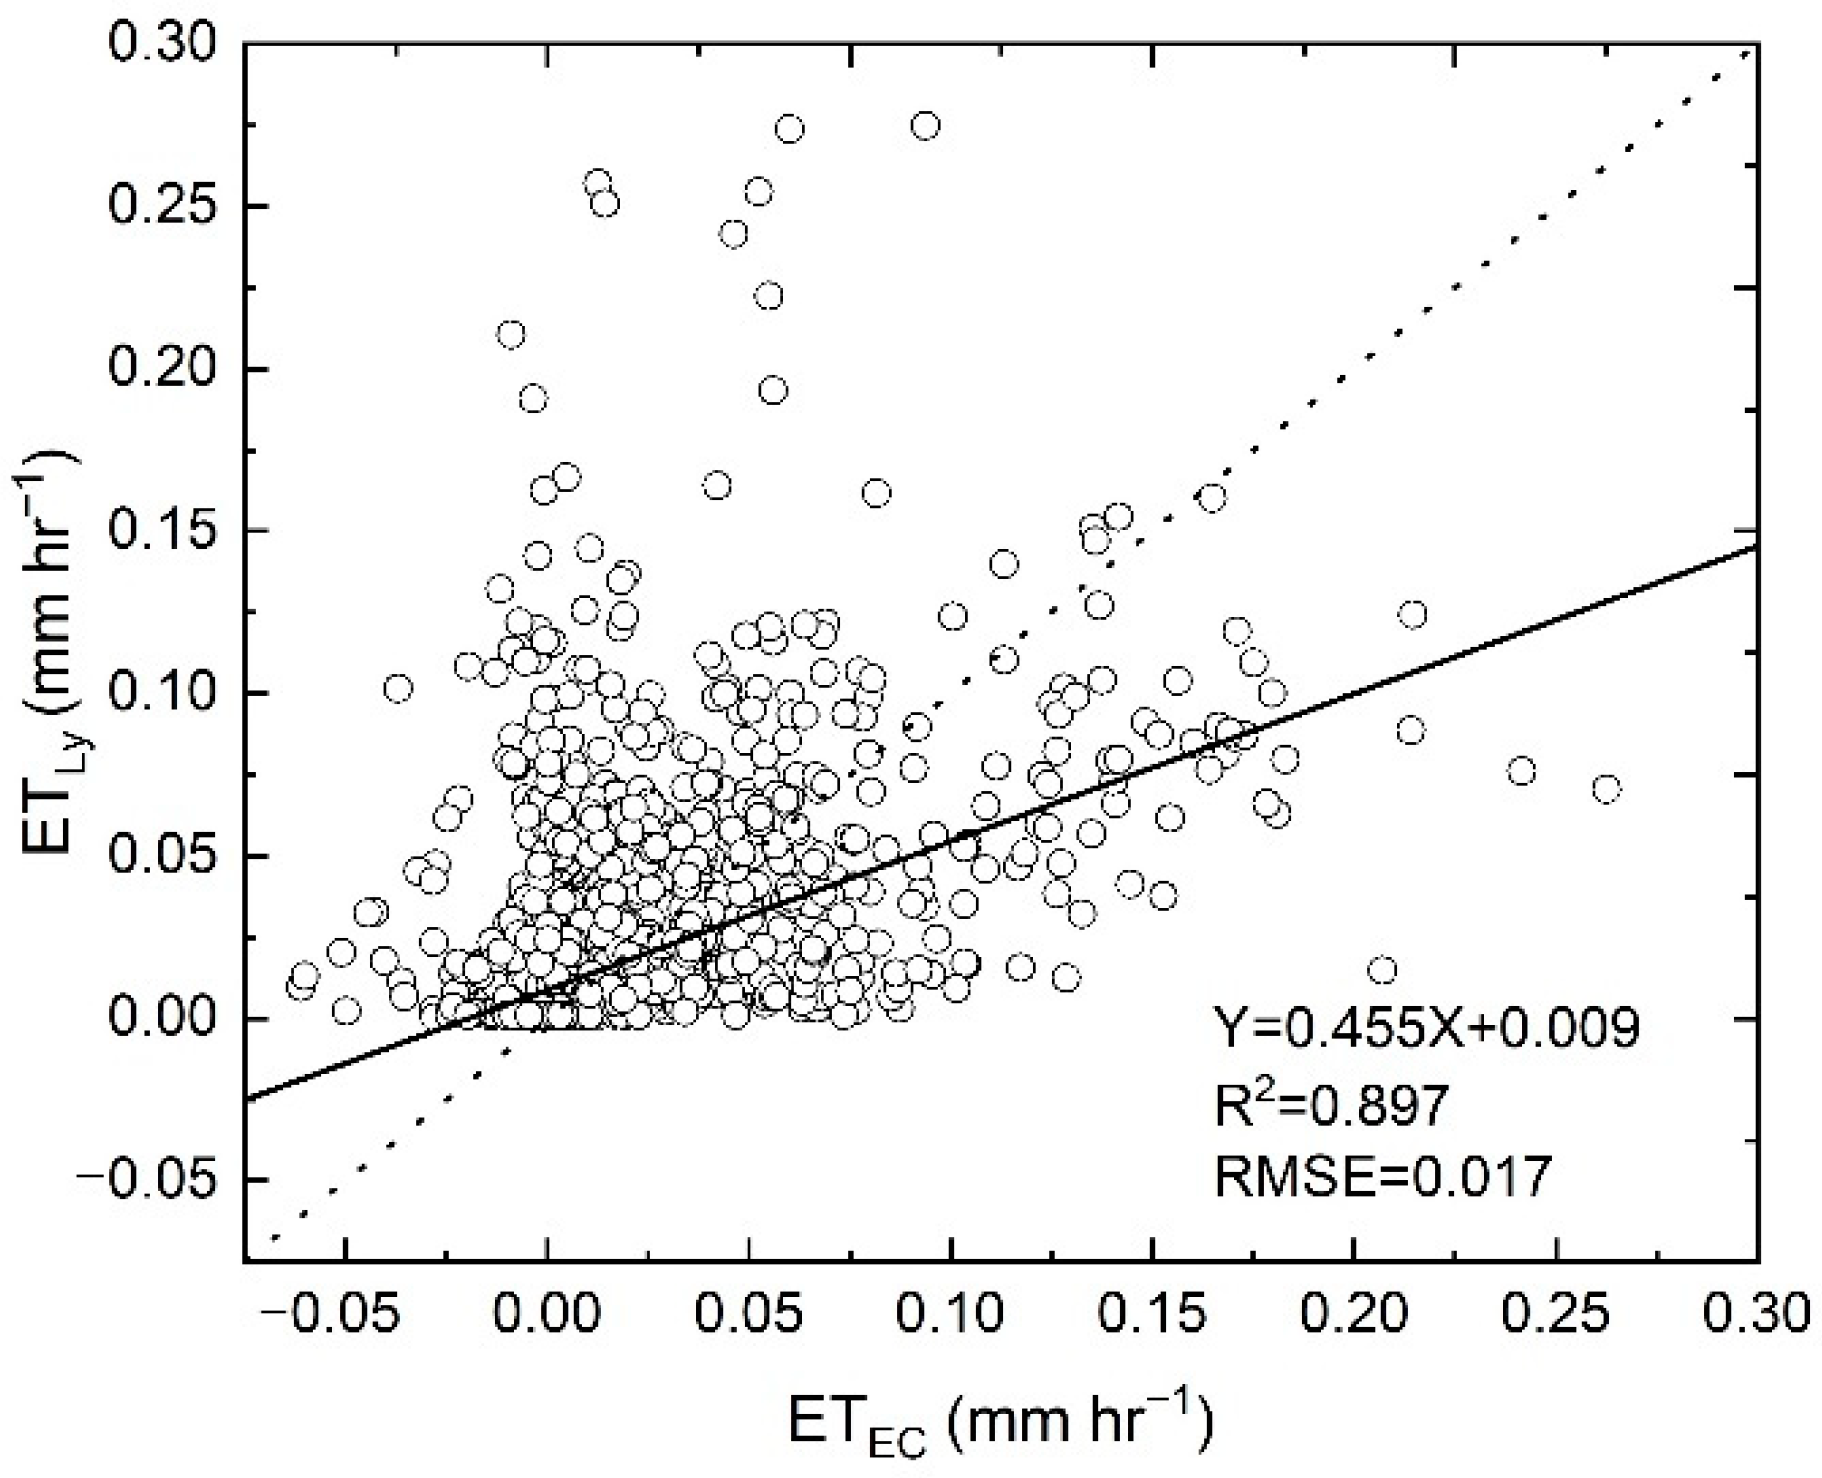
3.1. Energy Flux Closure

The average daily effective energy is 163.30 ± 67.60 W∙m2, 129.61 ± 49.98 W∙m2, 121.37 ± 51.25 W∙m2, and 158.20 ± 62.35 W∙m2 at AD, AM, AMS, and AS sites, respectively, while the average daily of the turbulent flux is 139.55 ± 51.98 W∙m2, 95.40 ± 38.88 W∙m2, 110.69 ± 38.80 W∙m2, and 156.98 ± 48.03 W∙m2 at AD, AM, AMS, and AS sites, respectively. Thus, the turbulent flux of all ecosystems was slightly lower than the effective energy, which indicated a 0.7~26.4% energy failure due to the instrumental measurement errors (Figure 3). Besides, linear regression coefficients of turbulent flux and effective energy shows EBR and R2 ranged from 0.53~0.66 (with an average of 0.59) and 0.40~0.62 (Figure 3). That is, the observed flux datasets in those four alpine ecosystems are valid.

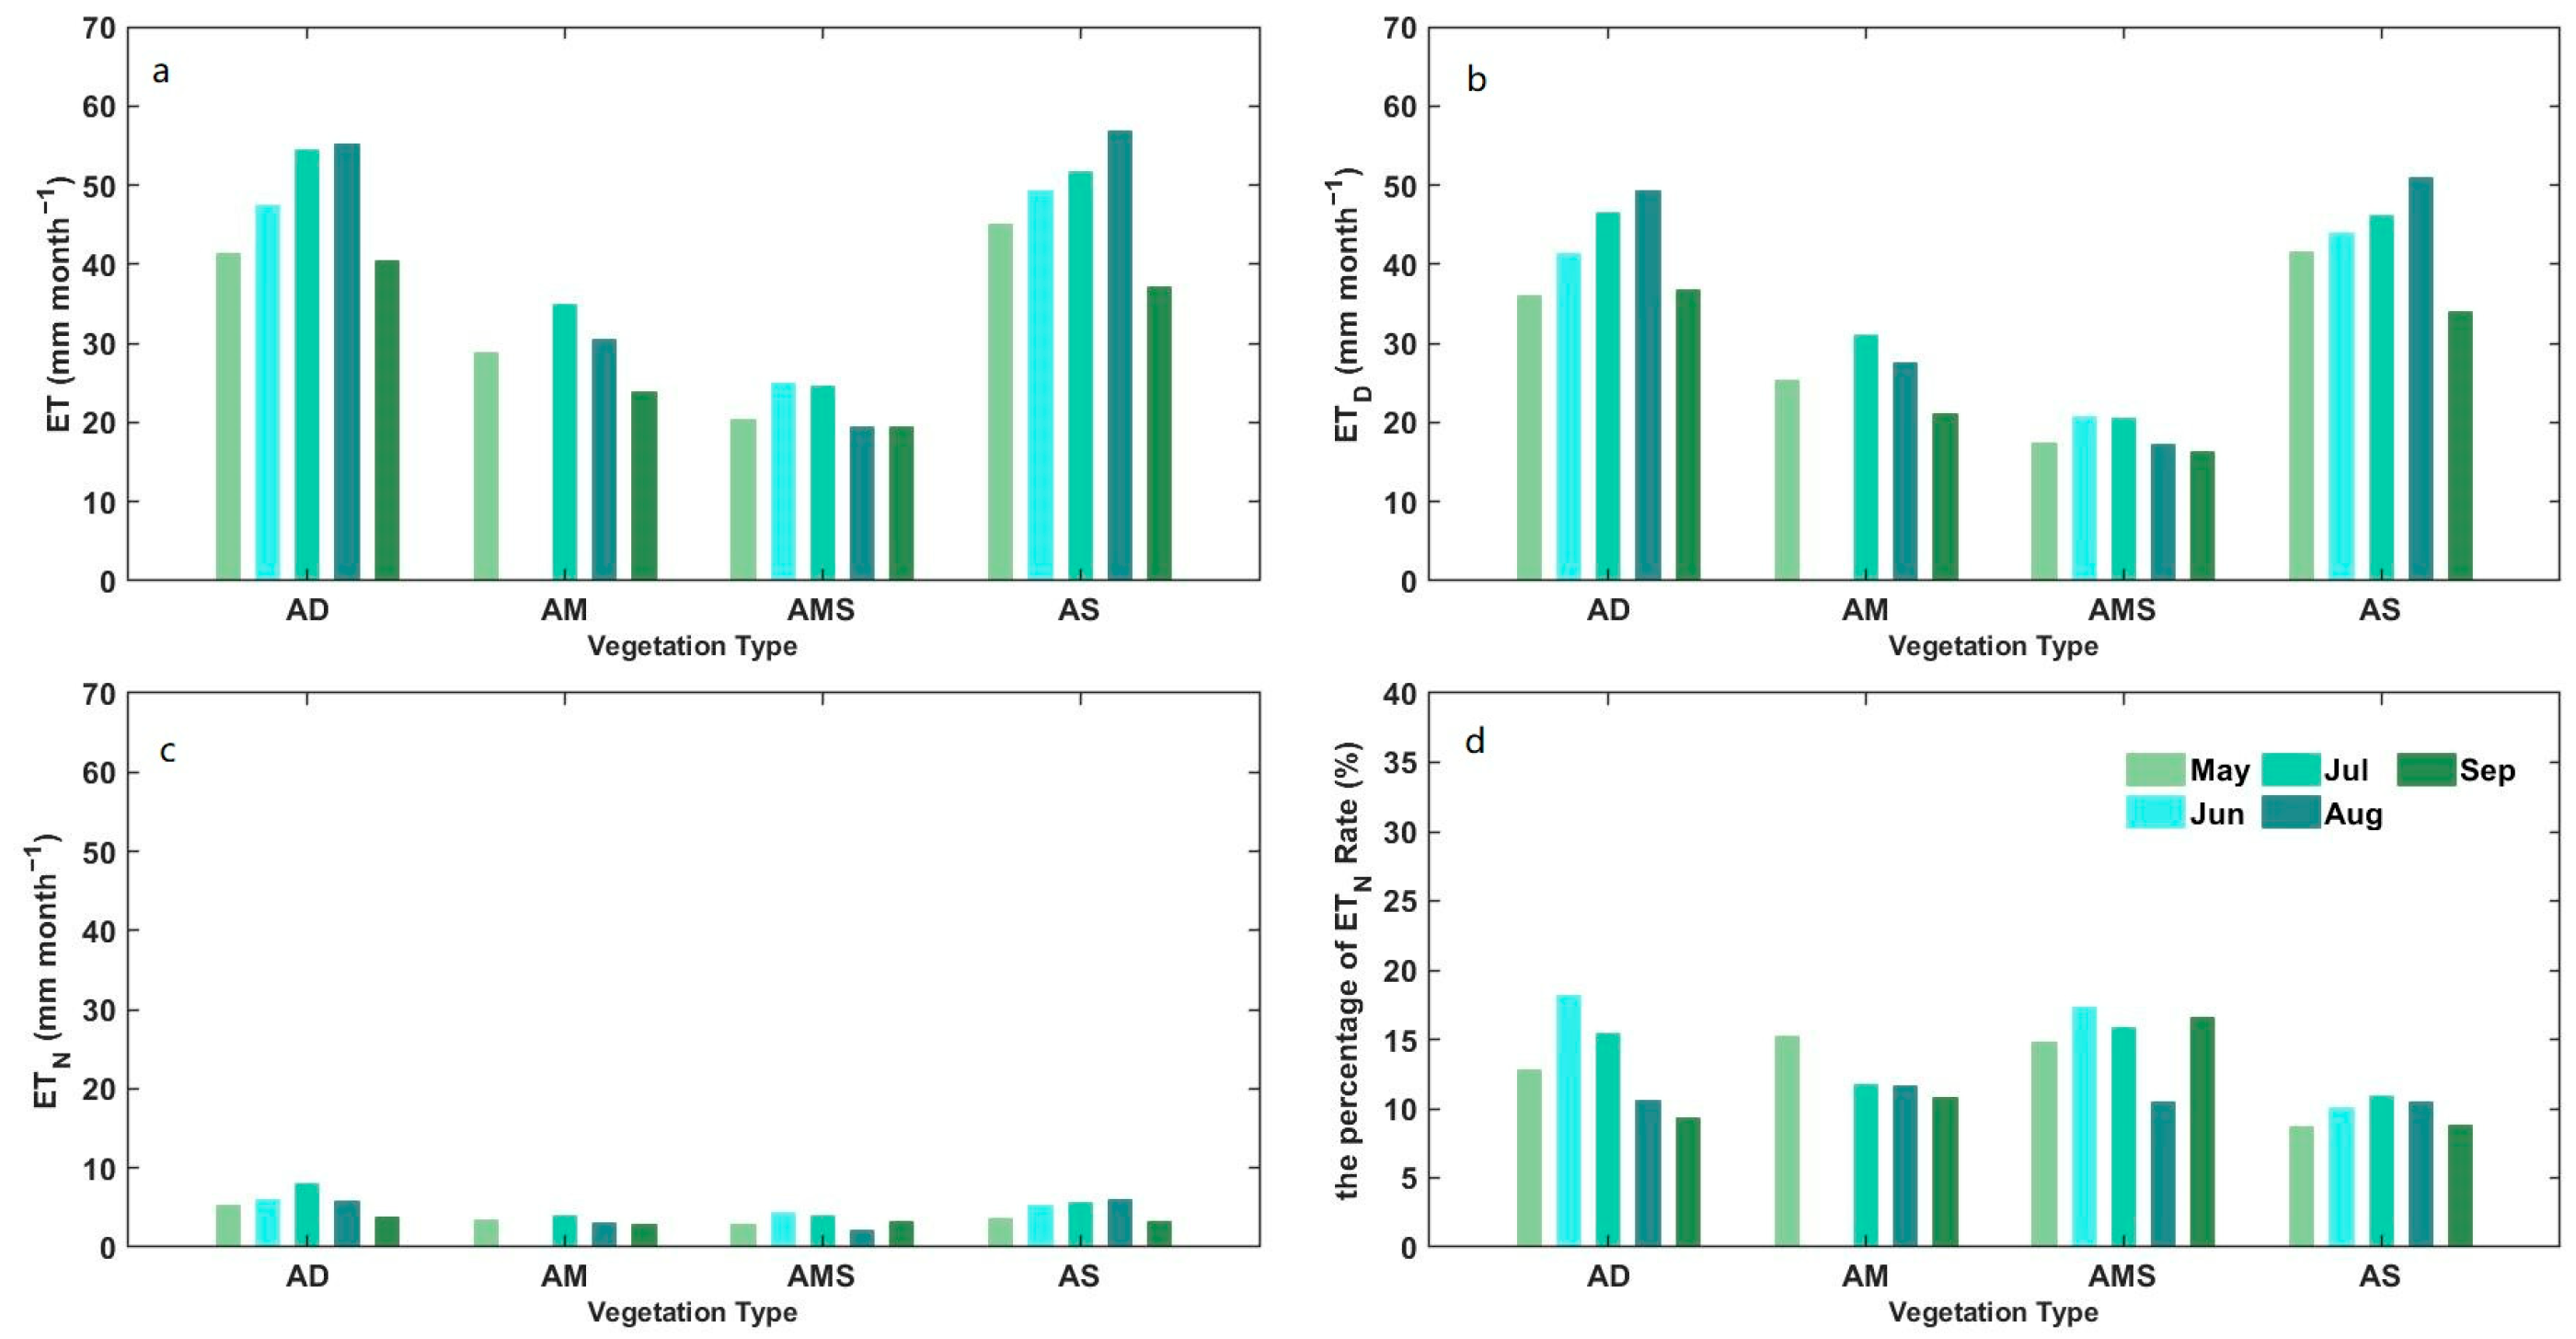
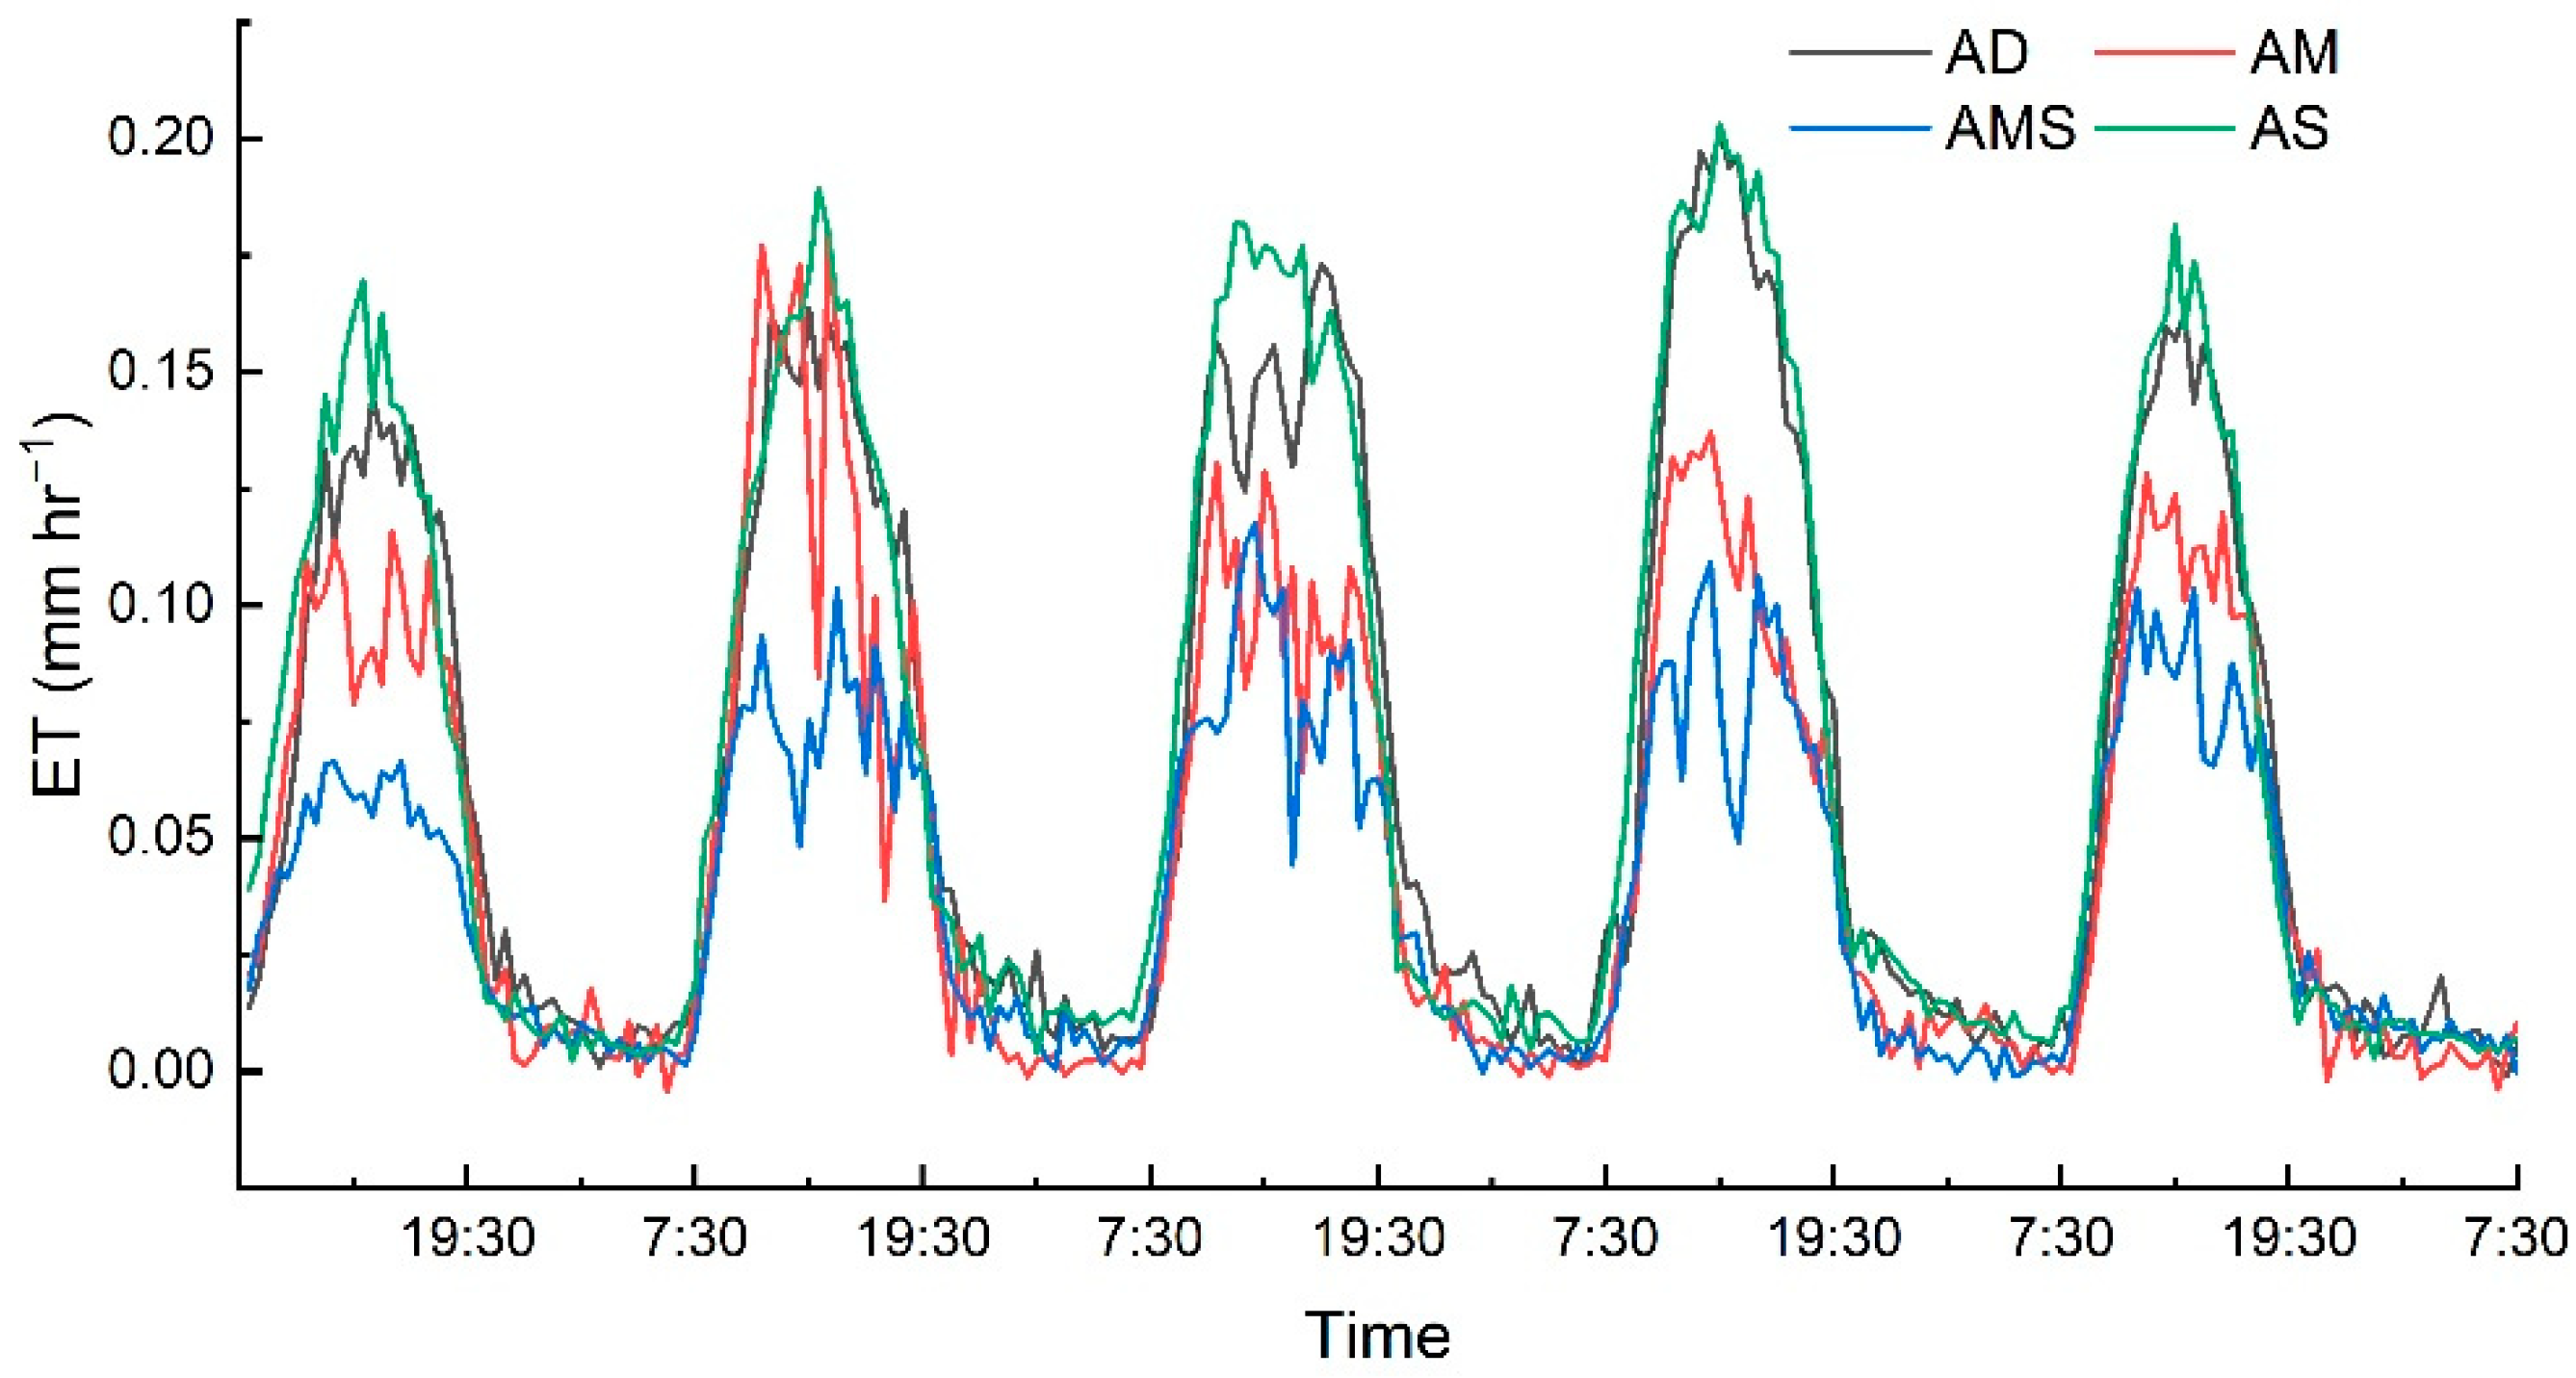
3.2. Evapotranspiration in Different Ecosystems

The cumulative ET during the growing season of 2019 is 238.91 mm, 118.11 mm, 108.70 mm, and 240.18 mm at AD, AM, AMS, and AS sites, respectively, showing the highest ET at AS site and the lowest ET at AMS site (Figure 4a). The cumulative ETN is 28.97 mm, 13.09 mm, 16.39 mm, and 23.73 mm at AD, AM, AMS, and AS sites (Figure 4c), respectively, accounting for 9.88~15.08% (12.13%, 11.08%, 15.08%, and 9.88% for AD, AM, AMS, and AS sites, respectively) of total ET during the growing season (Figure 4d) and showing an order of cumulative ETN at AD > AS > AMS > AM; however, the highest rate of ETN was shown at AMS site and the lowest rate of ETN at AMS site. Besides, the rate of ETN to ET variety by month shows a divergent change with monthly ET. The monthly ET increased to its peak in July and August for the four alpine ecosystems (among them, the peak ET of AS site mainly in August and others in July), while the rate of ETN to ET reached the peak in June for AD site (with a rate of 18.18%), May for AM site (with a rate of 15.20%), June and September for AMS site (with a rate of 17.28% and 16.58%), and July for AS site (with a rate of 10.93%), respectively (Figure 4d).

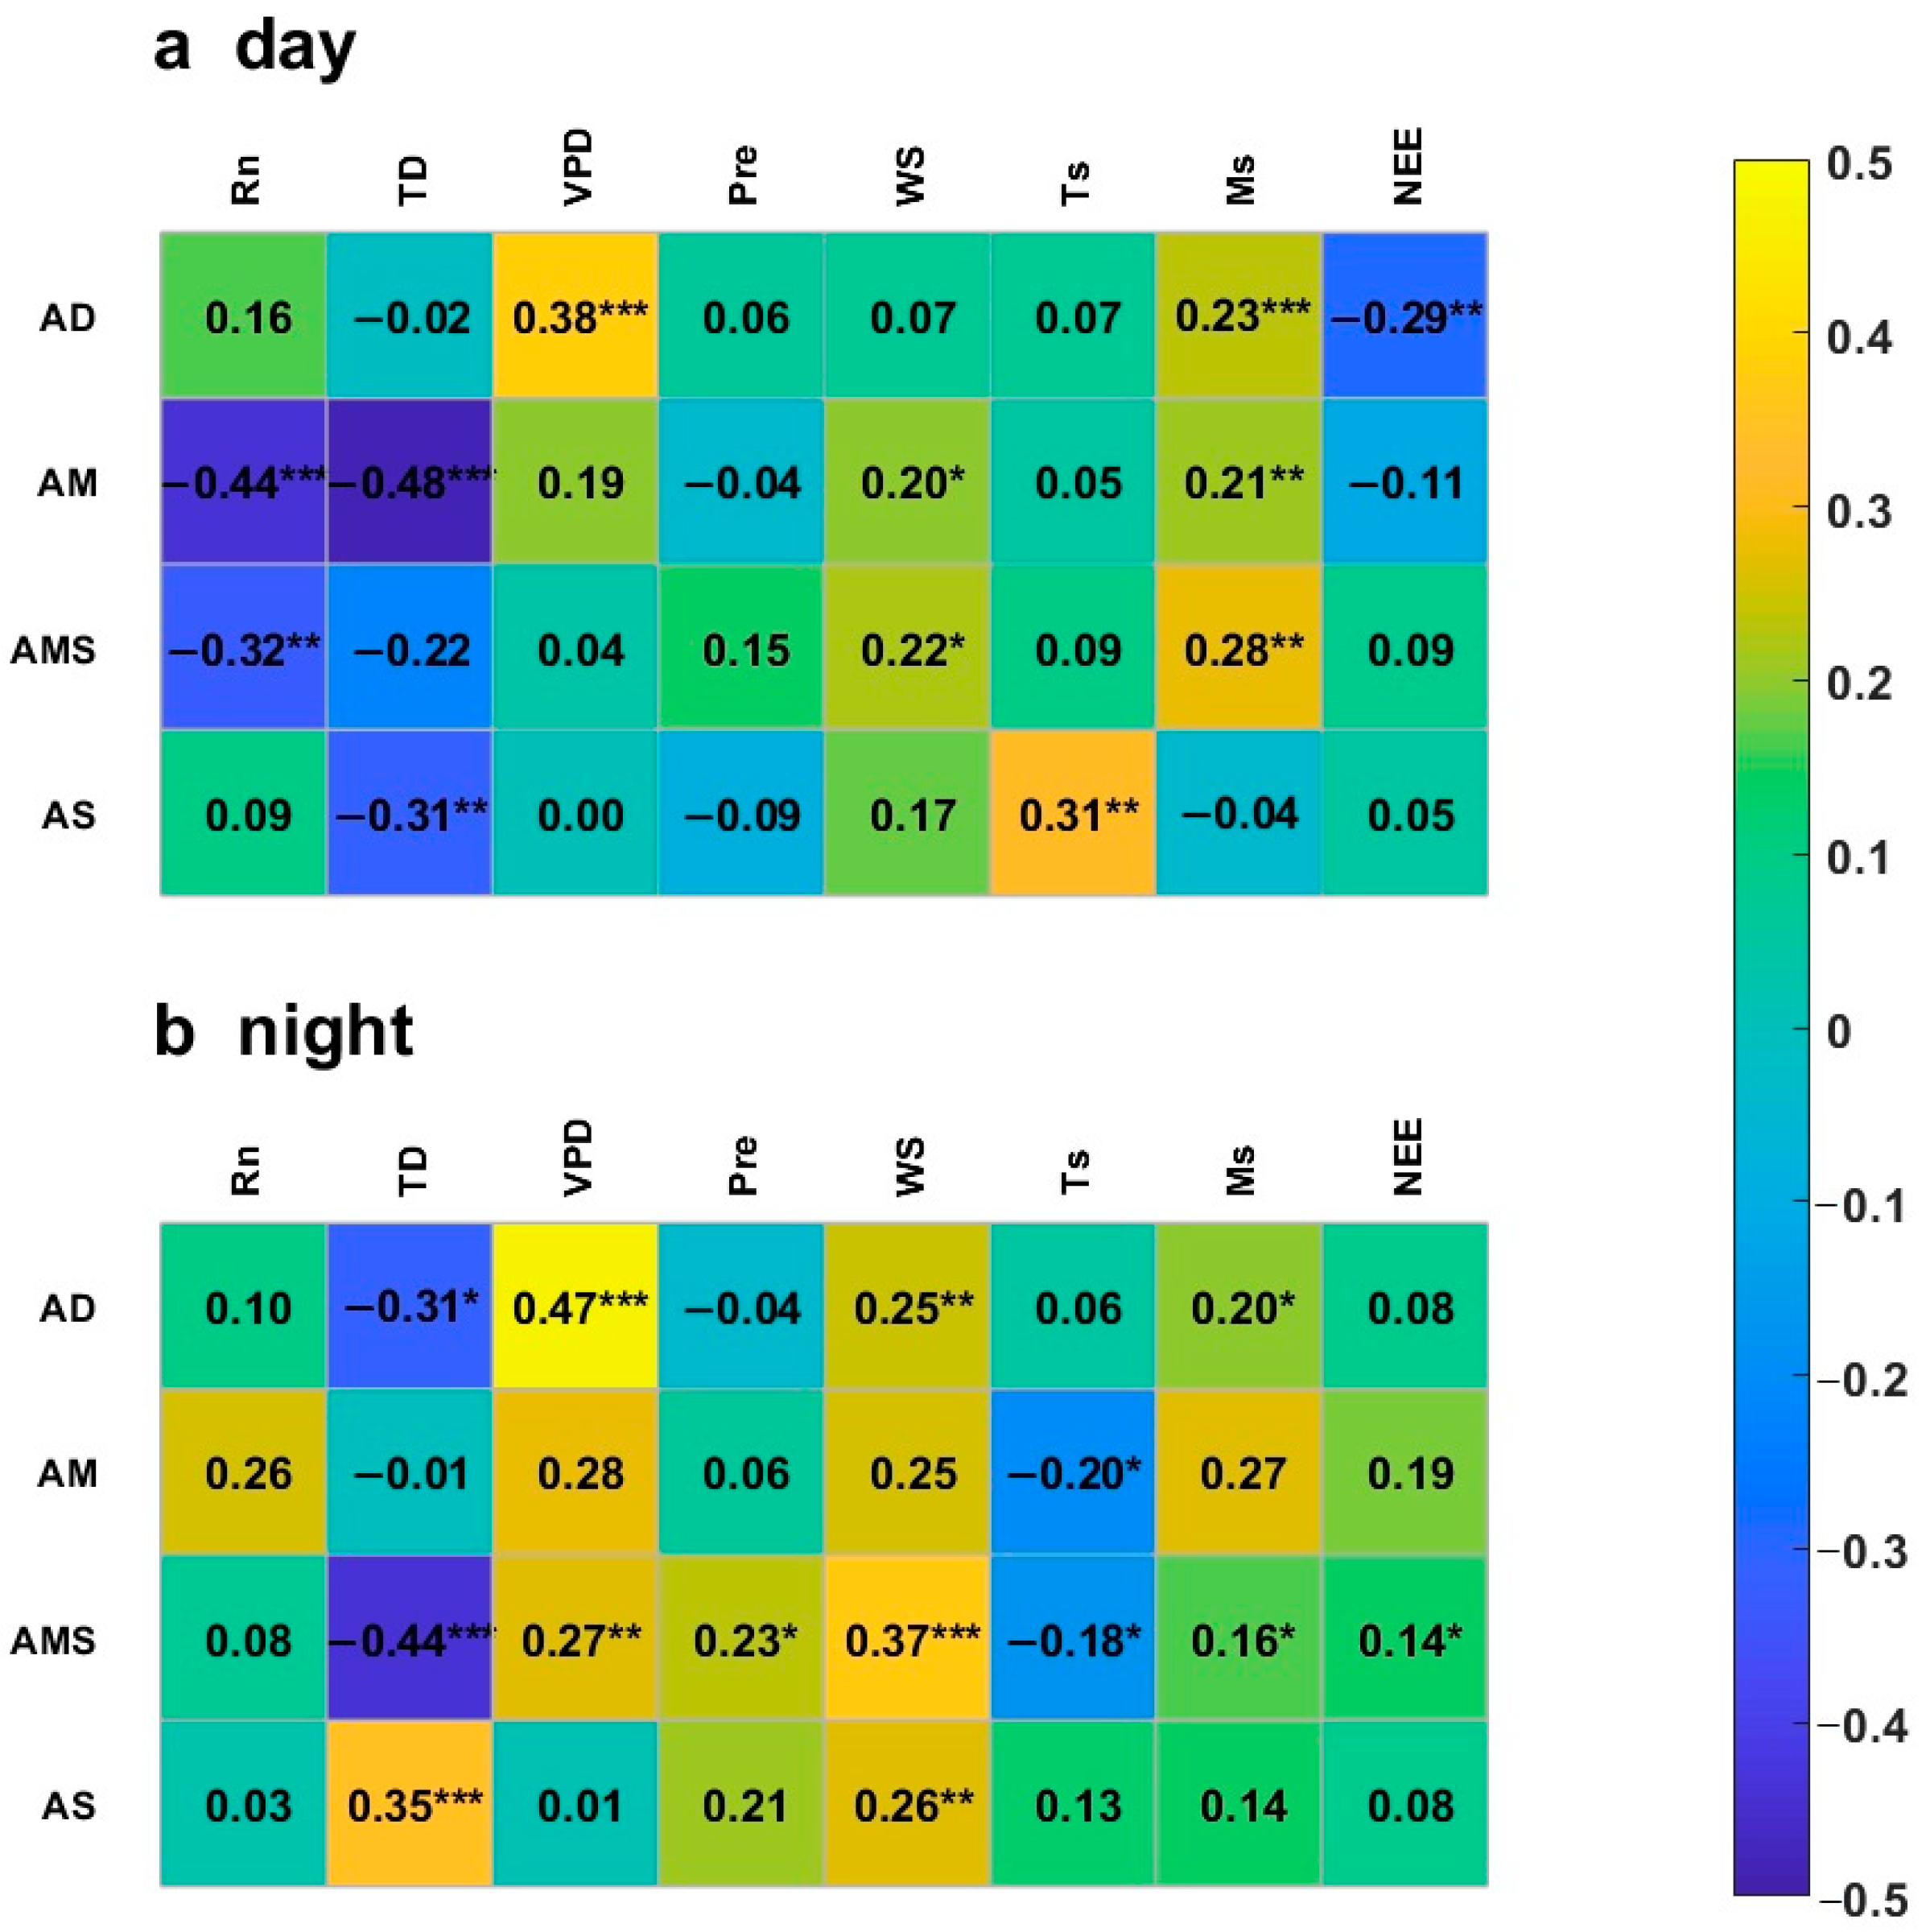
3.3. Influencing Factors for Evapotranspiration during Daytime and Nighttime

The controlling factors of ET during daytime and nighttime are different and vary among the four alpine ecosystems (Figure 5 and Figure 6). In the daytime, VPD (with a sensitivity coefficient of 0.38, p < 0.01), Ms (with a sensitivity coefficient of 0.23, p < 0.01), and vegetation growth (with a sensitivity coefficient of −0.29 between ETD and NEE, p < 0.05) prominently promote ETD at AD site (Figure 5a), and WS (with a sensitivity coefficient of 0.20 and 0.22 for AM and AMS sites, respectively, p < 0.01) and Ms (with a sensitivity coefficient of 0.21 and 0.28 for AM and AMS sites, respectively, p < 0.05) have a positive effect on ETD both at AM and AMS sites (Figure 5a), while Ts is the main effect on the increase of ETD at AS site (with a sensitivity coefficient of 0.31, p < 0.05). Meanwhile, Rn and TD have a negative effect on ETD at AM, AMS, and AS sites (Figure 5a). In the nighttime, the main influencing factors of ETN in the four ecosystems include TD, VPD, and WS (Figure 5b). Among them, TD has significant negative effect on ETN at AD site (with a sensitivity coefficient of −0.31, p < 0.01) and AMS site (with a sensitivity coefficient of −0.44, p < 0.05) but promotes ETN at AS site (with a sensitivity coefficient of 0.35, p < 0.01) (Figure 5b); VPD (with a sensitivity coefficient of 0.47 and 0.27 for AD and AMS sites, respectively, p < 0.05) and WS (with a sensitivity coefficient of 0.25 and 0.37 for AD and AMS sites, respectively, p < 0.05) have a positive effect on ETN both at AD and AMS sites in addition to the promoting of WS (with a sensitivity coefficient of 0.26, p < 0.05) on ETN at AS site (Figure 5b).
Besides, the relative contribution of the influencing factors of ET at high altitudes (AD and AM sites) and low altitude (AMS and AS sites) are calculated (Table 2). With a relative contribution over 15%, VPD (with a relative contribution of 20.30%), Rn (with a relative contribution of 19.15%), and Ms (with a relative contribution of 15.04%) are more important for controlling ETD in daytime, and VPD (with a relative contribution of 24.85%), WS (with a relative contribution of 16.54%), and Ms (with a relative contribution of 15.53%) would be the main factor of ETN in nighttime at high altitudes. While TD (with a relative contribution of 22.47%), Ts (with a relative contribution of 17.89%), WS (with a relative contribution of 15.82%), and Rn (with a relative contribution of 15.66%) have a sum of relative contribution of 71.84% on ETD in daytime, TD (with a relative contribution of 26.14%) and WS (with a relative contribution of 20.81%) have a sum of relative contribution of 46.95% on ETN in nighttime. That is, Rn, TD, VPD, and Ms have remarkable influence on ETD in daytime, and Rn and VPD are more important at high altitudes, while TD is the main factor at low altitudes. In the nighttime, VPD and WS controlled ETN at high altitudes, and TD and WS drove ETN at low altitudes.

4. Discussion

The evaluation of energy flux closure condition reflects the validity of EC observation to a certain extent [59,60]. Considering the instability of field observation, in general, the effect of eddy observation data is considered to be better than the EBR between turbulent flux, and effective flux is above 0.55 [61,62,63,64]. The slope of statistical regression of energy flux closure of all stations ranged from 0.53~0.66 in this study, which shows a bit lower slope. Different from other regions, the Qinghai-Tibet Plateau has high WS and wide temperature variation, which intensified the instability of EC observation [65,66]. By evaluating the energy closure of existing EC observations in China, Li et al. [67] suggested a lower acceptance coverage of the slope (0.55~0.99) in the Qinghai-Tibet Plateau.
ETN includes plant transpiration and soil evaporation as well as that in daytime [16,68]. However, high solar radiation leads to water loss at the daytime, while with the half-closed stomata of plants, WS is the main influencing factor of evaporation at night. Higher WS promotes the diffusion of water vapor molecules on the leaf surface and increases the VPD between the inside and outside of the leaf, thus promoting vegetation transpiration [7,8]. The incomplete closure of stomata on leaves would result in over 10% of daytime plant water loss at nighttime, and change of water potential caused by vertical soil temperature difference would lead to soil evaporation at night [12,15,69]. Thus, ETN could occur in the nighttime when there is no solar radiation, and the soil temperature is low. Furthermore, some studies have observed the ETN. For example, a study based on EC observation in United States showed that the average ETN percentages were 8.0% in broadleaf forest, 9.1% in pine plantation, and 8.0% in old field environments [7]. Similarly, Guo et al. [25] pointed out that the average annual ETN in shrubs in the arid region of northwest China was about 4% of the annual total ET during 2012–2014. Our observation results showed that evapotranspiration occupy 9.88~15.08% at night in the four stations, which is relatively higher than that above. That may be related to the fact that shrubs and trees are C4 plants whose metabolisms are inefficient in shady nighttime environments [12]. ET varies significantly with altitude in the basin [69,70,71]. Studies have shown that annual ET in alpine meadow reduced by 124.1 mm with an increase in elevation of 1000 m [49]. However, our result found growing season ET is higher at AS and AD than that at AM and AMS sites, which means no obvious trend of ET along with altitude. Different from the results on unified ecosystem, the discrepancy of microenvironment (such as species composition, hydrothermal conditions, and types and depth of frozen soil) would mean a different dominant factor of ET along with altitude [70,72]. Ma et al. [72] pointed out that the dominant factor of ET changed from water condition to temperature condition along with the altitude in the Qinghai Lake Basin, which means the main controlling factors of ET in the amount of a.l.s.<3560 m, 3650–3900 m, 3900–4350 m, and >4350 m are Ms, Ta, short-wave radiation, and Ta, respectively. However, apart from hydrothermal conditions, ET is also influenced by the boundary conditions between vegetation or soil surface and air, such as WS, VPD, and TD. Studies have shown that WS in arid and semi-arid areas of China shows a declining trend, and the declining WS will certainly weaken the local air flow, resulting in the decrease of ET [73,74]. In this study, the relative contribution of TD to ETD is 22.47% in daytime, the sum relative contribution of TD and WS to ETN is 46.95% in nighttime at low altitudes, the sum relative contribution of VPD and Rn to ETD is 39.45% in daytime, and the sum relative contribution of VPD and WS to ETN is 40.38% at high altitudes, which suggests that ET is affected not only by hydrothermal condition but also by the dynamic factors, such as VPD and WS, especially in the alpine region. As for the effect of vegetation cover on ET, Ta can regulate water and enzymatic activities in vegetation, which affects the evapotranspiration of vegetation [75]. The vegetation cover also prevents partial evaporation of soil water [76]. The dominant species in four alpine ecosystems are spaced regularly and low (the average height does not exceed 20 cm), but it still has an impact that cannot be ignored on ET. In this study, NEE has significant negative effect, which may be because the vegetation here needs more water on ETD at AD site (with a sensitivity coefficient of −0.29, p < 0.01) but promotes ETN because of more transpiration from the higher plants at AS site (with a sensitivity coefficient of 0.14, p < 0.05).
Calculating ET by the method of energy balance may have a large relative error widely ranging from 10~20% [74,77], and the error could be higher under dry air conditions with lower gas flux [78,79]. Thus, we compared the ET from lysimeter and EC at the same experimental site in the Qinghai Lake Basin (Figure 7). During 11 February to 10 April in 2021, the total ET, ETN, and the percentage of ETN recorded by lysimeter were 74.74 mm, 22.2 mm, and 21.38%, respectively, while the results of EC were 50.83 mm, 6.9 mm, and 13.91%, which are lower than that by lysimeter. With a relatively small space scale and higher time resolution, lysimeter is very sensitive to changes in weight, which would detect more elaborate ET processes and lead to a higher ET observation than that from EC, whose space scale is patch scale [80,81,82]. This suggests that the ETN was underestimated, and its ratio and a higher value could be more reasonable in the Qinghai Lake Basin.

5. Conclusions

In summary, based on the half-hour eddy and meteorological data of the growing season (from May to September) in 2019, the percentage of ETN accounts for 9.88~15.08% of ET, and ETN is relatively high with an order of AM (13.09 mm) < AMS (16.39 mm) < AS (23.73 mm) < AD (28.97 mm). VPD, Ms, and NEE have a positive effect on ETD at AD site; WS and Ms prominently promote ETD both at AM and AMS sites; and Ts is the main influencing factor of the increase of ETD at AS site. However, Rn and TD have a negative effect on ETD at AM, AMS, and AS sites. TD has a significant negative effect on ETN at AD and AMS sites but promotes ETN at AS site; VPD and WS has a positive effect on ETN both at AD and AMS sites in addition to the promotion of WS on ETN at AS site. With a relative contribution of 22.47%, TD is more important for controlling ETD in daytime, and the sum relative contribution of TD and WS to ETN is 46.95% in nighttime at low altitudes, while the sum relative contribution of VPD and Rn to ETD is 39.45% in daytime, and the sum relative contribution of VPD and WS to ETN is 40.38% at high altitudes. The findings of this study highlight the importance and significance of ETN, which should be considered in evapotranspiration models, and is of great significance to the assessment of regional hydrological cycle and water resources. In future research, ETN affected by water conditions or dynamic factors should not be ignored when estimating evapotranspiration of alpine ecosystems.

Author Contributions

Conceptualization, Q.L. and X.L.; methodology, F.S. and J.W.; validation, Q.L. and T.W.; investigation, F.Z.; data curation, F.S.; writing—original draft preparation, Q.L.; writing—review and editing, P.W. and Y.D.; supervision, X.L. All authors have read and agreed to the published version of the manuscript.

Funding

This research was funded by the National Natural Science Foundation of China (41971029), the Strategic Priority Research Program of the Chinese Academy of Sciences (Grant no. XDA20100102 and XDA20100101).

Institutional Review Board Statement

Not applicable.

Informed Consent Statement

Not applicable.

Data Availability Statement

The data presented in this study are not publicly available, but readers in need can contact with the corresponding author ([email protected]).

Conflicts of Interest

The authors declare no conflict of interest.

References

  1. Gu, L.; Hu, Z.; Yao, J.; Sun, G. Actual and Reference Evapotranspiration in a Cornfield in the Zhangye Oasis, Northwestern China. Water 2017, 9, 499. [Google Scholar] [CrossRef] [Green Version]
  2. Javadian, M.; Behrangi, A.; Smith, W.K.; Fisher, J.B. Global Trends in Evapotranspiration Dominated by Increases across Large Cropland Regions. Remote Sens. 2020, 12, 1221. [Google Scholar] [CrossRef] [Green Version]
  3. Mackay, D.S.; Ahl, D.E.; Ewers, B.E.; Gower, S.T.; Burrows, S.N.; Samanta, S.; Davis, K.J. Effects of aggregated classifications of forest composition on estimates of evapotranspiration in a northern Wisconsin forest. Glob. Chang. Biol. 2002, 8, 1253–1265. [Google Scholar] [CrossRef]
  4. Soppe, R.; Ayars, J. Characterizing ground water use by safflower using weighing lysimeters. Agric. Water Manag. 2003, 60, 59–71. [Google Scholar] [CrossRef]
  5. Iritz, Z.; Lindroth, A. Night-time evaporation from a short-rotation willow stand. J. Hydrol. 1994, 157, 235–245. [Google Scholar] [CrossRef]
  6. Monteith, J. Evaporation at night. Neth. J. Agric. Sci. 1956, 4, 34–38. [Google Scholar] [CrossRef]
  7. Novick, K.; Oren, R.; Stoy, P.; Siqueira, M.; Katul, G. Nocturnal evapotranspiration in eddy-covariance records from three co-located ecosystems in the Southeastern U.S.: Implications for annual fluxes. Agric. For. Meteorol. 2009, 149, 1491–1504. [Google Scholar] [CrossRef] [Green Version]
  8. Buckley, T.N.; Turnbull, T.L.; Pfautsch, S.; Adams, M.A. Nocturnal water loss in mature subalpine Eucalyptus delegatensistall open forests and adjacent E. pauciflora woodlands. Ecol. Evol. 2011, 1, 435–450. [Google Scholar] [CrossRef]
  9. Barbeta, A.; Ogaya, R.; Peñuelas, J. Comparative study of diurnal and nocturnal sap flow of Quercus ilex and Phillyrea latifolia in a Mediterranean holm oak forest in Prades (Catalonia, NE Spain). Trees 2012, 26, 1651–1659. [Google Scholar] [CrossRef]
  10. Montoro, A.; Mañas, F.; López-Urrea, R. Transpiration and evaporation of grapevine, two components related to irrigation strategy. Agric. Water Manag. 2016, 177, 193–200. [Google Scholar] [CrossRef]
  11. Ramírez, D.A.; Yactayo, W.; Rolando, J.L.; Quiroz, R. Correction to: Preliminary Evidence of Nocturnal Transpiration and Stomatal Conductance in Potato and their Interaction with Drought and Yield. Am. Potato J. 2017, 95, 139–143. [Google Scholar] [CrossRef] [Green Version]
  12. Caird, M.A.; Richards, J.H.; Donovan, L. Nighttime Stomatal Conductance and Transpiration in C3 and C4 Plants. Plant Physiol. 2007, 143, 4–10. [Google Scholar] [CrossRef] [PubMed] [Green Version]
  13. Bucci, S.J.; Scholz, F.G.; Goldstein, G.; Meinzer, F.; Hinojosa, J.A.; Hoffmann, W.A.; Franco, A. Processes preventing nocturnal equilibration between leaf and soil water potential in tropical savanna woody species. Tree Physiol. 2004, 24, 1119–1127. [Google Scholar] [CrossRef] [PubMed]
  14. Ogle, K.; Lucas, R.W.; Bentley, L.P.; Cable, J.M.; Barron-Gafford, G.A.; Griffith, A.; Ignace, D.; Jenerette, G.D.; Tyler, A.; Huxman, T.E.; et al. Differential daytime and night-time stomatal behavior in plants from North American deserts. New Phytol. 2012, 194, 464–476. [Google Scholar] [CrossRef]
  15. Milly, P.C.D. Moisture and heat transport in hysteretic, inhomogeneous porous media: A matric head-based formulation and a numerical model. Water Resour. Res. 1982, 18, 489–498. [Google Scholar] [CrossRef]
  16. Balugani, E.; Lubczynski, M.; van der Tol, C.; Metselaar, K. Testing three approaches to estimate soil evaporation through a dry soil layer in a semi-arid area. J. Hydrol. 2018, 567, 405–419. [Google Scholar] [CrossRef]
  17. Meng, Y.; He, Z.; Liu, B.; Chen, L.; Lin, P.; Luo, W. Soil Salinity and Moisture Control the Processes of Soil Nitrification and Denitrification in a Riparian Wetlands in an Extremely Arid Regions in Northwestern China. Water 2020, 12, 2815. [Google Scholar] [CrossRef]
  18. Brown, C.; Devitt, D.; Morris, R. Water Use and Physiological Response of Tall Fescue Turf to Water Deficit Irrigation in an Arid Environment. HortScience 2004, 39, 388–393. [Google Scholar] [CrossRef] [Green Version]
  19. Zhang, W.; Chen, S.; Chen, J.; Wei, L.; Han, X.; Lin, G. Biophysical regulations of carbon fluxes of a steppe and a cultivated cropland in semiarid Inner Mongolia. Agric. For. Meteorol. 2007, 146, 216–229. [Google Scholar] [CrossRef]
  20. Li, X.W.; Zhou, J.L.; Jin, M.G.; Liu, Y.F.; Li, Q. Experiments on Evaporation of High-TDS Phreatic Water in an Arid Area. Adv. Mater. Res. 2012, 446–449, 2815–2823. [Google Scholar] [CrossRef]
  21. Rebetez, M.; Reinhard, M. Monthly air temperature trends in Switzerland 1901–2000 and 1975–2004. Theor. Appl. Climatol. 2007, 91, 27–34. [Google Scholar] [CrossRef] [Green Version]
  22. Williams, M.W.; Losleben, M.V.; Hamann, H.B. Alpine Areas in the Colorado Front Range as Monitors of Climate Change and Ecosystem Response. Geogr. Rev. 2002, 92, 180–191. [Google Scholar] [CrossRef]
  23. Christopher, T.A.; Goodburn, J.M. The Effects of Spatial Patterns on the Accuracy of Forest Vegetation Simulator (FVS) Estimates of Forest Canopy Cover. West. J. Appl. For. 2008, 23, 5–11. [Google Scholar] [CrossRef] [Green Version]
  24. Tie, Q.; Hu, H.; Tian, F.; Holbrook, N.M. Comparing different methods for determining forest evapotranspiration and its components at multiple temporal scales. Sci. Total Environ. 2018, 633, 12–29. [Google Scholar] [CrossRef] [PubMed]
  25. Guo, Y.; Song, C.; Zhang, J.; Wang, L.; Sun, L. Influence of wetland reclamation on land-surface energy exchange and evapotranspiration in the Sanjiang plain, Northeast China. Agric. For. Meteorol. 2021, 296, 108214. [Google Scholar] [CrossRef]
  26. Zhang, Z.; Li, X.; Liu, L.; Wang, Y.; Li, Y. Influence of mulched drip irrigation on landscape scale evapotranspiration from farmland in an arid area. Agric. Water Manag. 2020, 230, 105953. [Google Scholar] [CrossRef]
  27. Mostafa, H.; El-Nady, R.; Awad, M.; El-Ansary, M. Drip irrigation management for wheat under clay soil in arid conditions. Ecol. Eng. 2018, 121, 35–43. [Google Scholar] [CrossRef]
  28. Wang, F.; Liang, W.; Fu, B.; Jin, Z.; Yan, J.; Zhang, W.; Fu, S.; Yan, N. Changes of cropland evapotranspiration and its driving factors on the loess plateau of China. Sci. Total Environ. 2020, 728, 138582. [Google Scholar] [CrossRef]
  29. Yang, K.; Wu, H.; Qin, J.; Lin, C.; Tang, W.; Chen, Y. Recent climate changes over the Tibetan Plateau and their impacts on energy and water cycle: A review. Glob. Planet. Chang. 2014, 112, 79–91. [Google Scholar] [CrossRef]
  30. Zhong, L.; Ma, Y.; Salama, M.S.; Su, Z. Assessment of vegetation dynamics and their response to variations in precipitation and temperature in the Tibetan Plateau. Clim. Chang. 2010, 103, 519–535. [Google Scholar] [CrossRef]
  31. Zhang, R.; Zuo, Z. Impact of Spring Soil Moisture on Surface Energy Balance and Summer Monsoon Circulation over East Asia and Precipitation in East China. J. Clim. 2011, 24, 3309–3322. [Google Scholar] [CrossRef]
  32. Yin, Y.; Wu, S.; Zhao, D.; Zheng, D.; Pan, T. Modeled effects of climate change on actual evapotranspiration in different eco-geographical regions in the Tibetan Plateau. J. Geogr. Sci. 2013, 23, 195–207. [Google Scholar] [CrossRef]
  33. Guerschman, J.P.; Van Dijk, A.I.J.M.; Mattersdorf, G.; Beringer, J.; Hutley, L.B.; Leuning, R.; Pipunic, R.C.; Sherman, B.S. Scaling of potential evapotranspiration with MODIS data reproduces flux observations and catchment water balance observations across Australia. J. Hydrol. 2009, 369, 107–119. [Google Scholar] [CrossRef]
  34. Koppa, A.; Alam, S.; Miralles, D.G.; Gebremichael, M. Budyko-Based Long-Term Water and Energy Balance Closure in Global Watersheds From Earth Observations. Water Resour. Res. 2021, 57, e2020WR028658. [Google Scholar] [CrossRef] [PubMed]
  35. McCabe, M.F.; Miralles, D.G.; Holmes, T.R.; Fisher, J.B. Advances in the Remote Sensing of Terrestrial Evaporation. Remote Sens. 2019, 11, 1138. [Google Scholar] [CrossRef] [Green Version]
  36. Srivastava, A.; Sahoo, B.; Raghuwanshi, N.S.; Singh, R. Evaluation of Variable-Infiltration Capacity Model and MODIS-Terra Satellite-Derived Grid-Scale Evapotranspiration Estimates in a River Basin with Tropical Monsoon-Type Climatology. J. Irrig. Drain. Eng. 2017, 143, 04017028. [Google Scholar] [CrossRef] [Green Version]
  37. Douglas, E.M.; Jacobs, J.M.; Sumner, D.M.; Ray, R.L. A comparison of models for estimating potential evapotranspiration for Florida land cover types. J. Hydrol. 2009, 373, 366–376. [Google Scholar] [CrossRef]
  38. Federer, C.A.; Vörösmarty, C.; Fekete, B. Intercomparison of Methods for Calculating Potential Evaporation in Regional and Global Water Balance Models. Water Resour. Res. 1996, 32, 2315–2321. [Google Scholar] [CrossRef]
  39. Wilson, K.B.; Hanson, P.J.; Mulholland, P.J.; Baldocchi, D.D.; Wullschleger, S.D. A comparison of methods for determining forest evapotranspiration and its components: Sap-flow, soil water budget, eddy covariance and catchment water balance. Agric. For. Meteorol. 2001, 106, 153–168. [Google Scholar] [CrossRef]
  40. Hicks, B.B.; Baldocchi, D.D. Measurement of Fluxes over Land: Capabilities, Origins, and Remaining Challenges. Bound. Layer Meteorol. 2020, 177, 365–394. [Google Scholar] [CrossRef]
  41. Cheng, L.; Xu, Z.; Wang, D.; Cai, X. Assessing interannual variability of evapotranspiration at the catchment scale using satellite-based evapotranspiration data sets. Water Resour. Res. 2011, 47, 09509. [Google Scholar] [CrossRef] [Green Version]
  42. Chai, R.; Sun, S.; Chen, H.; Zhou, S. Changes in reference evapotranspiration over China during 1960–2012: Attributions and relationships with atmospheric circulation. Hydrol. Process. 2018, 32, 3032–3048. [Google Scholar] [CrossRef] [Green Version]
  43. Sun, X.; Zou, C.B.; Wilcox, B.; Stebler, E. Effect of Vegetation on the Energy Balance and Evapotranspiration in Tallgrass Prairie: A Paired Study Using the Eddy-Covariance Method. Bound. Layer Meteorol. 2018, 170, 127–160. [Google Scholar] [CrossRef]
  44. Li, X.; Yang, X.; Ma, Y.; Hu, G.; Hu, X.; Wu, X.; Wang, P.; Huang, Y.; Cui, B.; Wei, J. Qinghai Lake Basin Critical Zone Observatory on the Qinghai-Tibet Plateau. Vadose Zone J. 2018, 17, 1–11. [Google Scholar] [CrossRef]
  45. Huang, C.; Lai, Z.; Liu, X.; Madsen, D. Lake-level history of Qinghai Lake on the NE Tibetan Plateau and its implications for Asian monsoon pattern—A review. Quat. Sci. Rev. 2021, 273, 107258. [Google Scholar] [CrossRef]
  46. Wang, Z.; Cao, S.; Cao, G.; Lan, Y. Effects of vegetation phenology on vegetation productivity in the Qinghai Lake Basin of the Northeastern Qinghai–Tibet Plateau. Arab. J. Geosci. 2021, 14, 1–15. [Google Scholar] [CrossRef]
  47. Duan, H.; Xue, X.; Wang, T.; Kang, W.; Liao, J.; Liu, S. Spatial and Temporal Differences in Alpine Meadow, Alpine Steppe and All Vegetation of the Qinghai-Tibetan Plateau and Their Responses to Climate Change. Remote Sens. 2021, 13, 669. [Google Scholar] [CrossRef]
  48. Zhang, S.-Y.; Li, X.-Y. Soil moisture and temperature dynamics in typical alpine ecosystems: A continuous multi-depth measurements-based analysis from the Qinghai-Tibet Plateau, China. Hydrol. Res. 2018, 49, 194–209. [Google Scholar] [CrossRef]
  49. Cao, S.; Cao, G.; Han, G.; Wu, F.; Lan, Y. Comparison of evapotranspiration between two alpine type wetland ecosystems in Qinghai lake basin of Qinghai-Tibet Plateau. Ecohydrol. Hydrobiol. 2020, 20, 215–229. [Google Scholar] [CrossRef]
  50. Vickers, D.; Mahrt, L. Quality control and flux sampling problems for tower and aircraft data. J. Atmos. Ocean. Tech. 1997, 14, 512–526. [Google Scholar] [CrossRef]
  51. Mason, P. Atmospheric boundary layer flows: Their structure and measurement. Bound. Layer Meteorol. 1995, 72, 213–214. [Google Scholar] [CrossRef]
  52. Moncrieff, J.; Massheder, J.; de Bruin, H.; Elbers, J.; Friborg, T.; Heusinkveld, B.; Kabat, P.; Scott, S.; Soegaard, H.; Verhoef, A. A system to measure surface fluxes of momentum, sensible heat, water vapour and carbon dioxide. J. Hydrol. 1997, 188–189, 589–611. [Google Scholar] [CrossRef]
  53. Webb, E.K.; Pearman, G.I.; Leuning, R. Correction of flux measurements for density effects due to heat and water vapour transfer. Q. J. R. Meteorol. Soc. 1980, 106, 85–100. [Google Scholar] [CrossRef]
  54. Kormann, R.; Meixner, F.X. An Analytical Footprint Model For Non-Neutral Stratification. Bound. Layer Meteorol. 2001, 99, 207–224. [Google Scholar] [CrossRef]
  55. Foken, T.; Wichura, B. Tools for quality assessment of surface-based flux measurements. Agric. For. Meteorol. 1996, 78, 83–105. [Google Scholar] [CrossRef]
  56. Appel, K.W.; Chemel, C.; Roselle, S.; Francis, X.V.; Hu, R.-M.; Sokhi, R.S.; Rao, S.; Galmarini, S. Examination of the Community Multiscale Air Quality (CMAQ) model performance over the North American and European domains. Atmos. Environ. 2012, 53, 142–155. [Google Scholar] [CrossRef] [Green Version]
  57. Wu, X.; Liu, H.; Li, X.; Ciais, P.; Babst, F.; Guo, W.; Zhang, C.; Magliulo, V.; Pavelka, M.; Liu, S.; et al. Differentiating drought legacy effects on vegetation growth over the temperate Northern Hemisphere. Glob. Chang. Biol. 2018, 24, 504–516. [Google Scholar] [CrossRef]
  58. McCuen, R.H. A sensitivity and error analysis cf procedures used for estimating evaporation. JAWRA J. Am. Water Resour. Assoc. 1974, 10, 486–497. [Google Scholar] [CrossRef]
  59. Eder, F.; De Roo, F.; Kohnert, K.; Desjardins, R.L.; Schmid, H.P.; Mauder, M. Evaluation of Two Energy Balance Closure Parametrizations. Bound. Layer Meteorol. 2014, 151, 195–219. [Google Scholar] [CrossRef]
  60. Sun, X.-M.; Zhu, Z.-L.; Wen, X.-F.; Yuan, G.-F.; Yu, G.-R. The impact of averaging period on eddy fluxes observed at China FLUX sites. Agric. For. Meteorol. 2006, 137, 188–193. [Google Scholar] [CrossRef] [Green Version]
  61. Yu, G.-R.; Wen, X.-F.; Sun, X.-M.; Tanner, B.D.; Lee, X.; Chen, J.-Y. Overview of China FLUX and evaluation of its eddy covariance measurement. Agric. For. Meteorol. 2006, 137, 125–137. [Google Scholar] [CrossRef]
  62. Shi, T.; Guan, D.; Wang, A.; Wu, J.; Jin, C.; Han, S. Comparison of three models to estimate evapotranspiration for a temperate mixed forest. Hydrol. Process. 2008, 22, 3431–3443. [Google Scholar] [CrossRef]
  63. Wu, J.; Jing, Y.; Guan, D.; Yang, H.; Niu, L.; Wang, A.; Yuan, F.; Jin, C. Controls of evapotranspiration during the short dry season in a temperate mixed forest in Northeast China. Ecohydrology 2012, 6, 775–782. [Google Scholar] [CrossRef]
  64. Yan, C.; Zhao, W.; Wang, Y.; Yang, Q.; Zhang, Q.; Qiu, G.Y. Effects of forest evapotranspiration on soil water budget and energy flux partitioning in a subalpine valley of China. Agric. For. Meteorol. 2017, 246, 207–217. [Google Scholar] [CrossRef]
  65. Xin, Y.-F.; Chen, F.; Zhao, P.; Barlage, M.; Blanken, P.; Chen, Y.-L.; Chen, B.; Wang, Y.-J. Surface energy balance closure at ten sites over the Tibetan plateau. Agric. For. Meteorol. 2018, 259, 317–328. [Google Scholar] [CrossRef]
  66. Wang, K.C.; Dickinson, R.E. A review of global terrestrial evapotranspiration: Observation, modeling, climatology, and climatic variability. Rev. Geophys. 2012, 50, RG2005. [Google Scholar] [CrossRef]
  67. Li, M.; Babel, W.; Chen, X.; Zhang, L.; Sun, F.; Wang, B.; Ma, Y.; Hu, Z.; Foken, T. A 3-year dataset of sensible and latent heat fluxes from the Tibetan Plateau, derived using eddy covariance measurements. Theor. Appl. Climatol. 2015, 122, 457–469. [Google Scholar] [CrossRef] [Green Version]
  68. Montoro, A.; Torija, I.; Mañas, F.; López-Urrea, R. Lysimeter measurements of nocturnal and diurnal grapevine transpiration: Effect of soil water content, and phenology. Agric. Water Manag. 2020, 229, 105882. [Google Scholar] [CrossRef]
  69. Li, H.-J.; Yan, J.-X.; Yue, X.-F.; Wang, M.-B. Significance of soil temperature and moisture for soil respiration in a Chinese mountain area. Agric. For. Meteorol. 2008, 148, 490–503. [Google Scholar] [CrossRef]
  70. Goulden, M.L.; Bales, R.C. Mountain runoff vulnerability to increased evapotranspiration with vegetation expansion. Proc. Natl. Acad. Sci. USA 2014, 111, 14071–14075. [Google Scholar] [CrossRef] [Green Version]
  71. Cao, S.; Cao, G.; Chen, K.; Han, G.; Liu, Y.; Yang, Y.; Li, X. Characteristics of CO2, water vapor, and energy exchanges at a headwater wetland ecosystem of the Qinghai Lake. Can. J. Soil Sci. 2019, 99, 227–243. [Google Scholar] [CrossRef]
  72. Ma, Y.-J.; Li, X.-Y.; Liu, L.; Yang, X.-F.; Wu, X.-C.; Wang, P.; Lin, H.; Zhang, G.-H.; Miao, C.-Y. Evapotranspiration and its dominant controls along an elevation gradient in the Qinghai Lake watershed, northeast Qinghai-Tibet Plateau. J. Hydrol. 2019, 575, 257–268. [Google Scholar] [CrossRef]
  73. Shi, Z.; Xu, L.; Yang, X.; Guo, H.; Dong, L.; Song, A.; Zhang, X.; Shan, N. Trends in reference evapotranspiration and its attribution over the past 50 years in the Loess Plateau, China: Implications for ecological projects and agricultural production. Stoch. Environ. Res. Risk A 2017, 31, 257–273. [Google Scholar] [CrossRef]
  74. Irmak, S. Dynamics of Nocturnal, Daytime, and Sum-of-Hourly Evapotranspiration and Other Surface Energy Fluxes over Nonstressed Maize Canopy. J. Irrig. Drain. Eng. 2011, 137, 475–490. [Google Scholar] [CrossRef]
  75. Zhang, P.; Cai, Y.; Yang, W.; Yi, Y.; Yang, Z.; Fu, Q. Multiple spatiotemporal patterns of vegetation coverage and its relationship with climatic factors in a large dam-reservoir-river system. Ecol. Eng. 2019, 138, 188–199. [Google Scholar] [CrossRef]
  76. Wang, Y.; Liu, Y.; Jin, J. Contrast Effects of Vegetation Cover Change on Evapotranspiration during a Revegetation Period in the Poyang Lake Basin, China. Forests 2018, 9, 217. [Google Scholar] [CrossRef] [Green Version]
  77. Stannard, D.I.; Blanford, J.H.; Kustas, W.P.; Nichols, W.D.; Amer, S.A.; Schmugge, T.J.; Weltz, M.A. Interpretation of surface flux measurements in heterogeneous terrain during the Monsoon ‘90 experiment. Water Resour. Res. 1994, 30, 1227–1239. [Google Scholar] [CrossRef]
  78. Mahrt, L. Flux Sampling Errors for Aircraft and Towers. J. Atmos. Ocean. Technol. 1998, 15, 416–429. [Google Scholar] [CrossRef]
  79. Moore, K.E.; Fitzjarrald, D.R.; Sakai, R.K.; Goulden, M.L.; Munger, J.W.; Wofsy, S.C. Seasonal Variation in Radiative and Turbulent Exchange at a Deciduous Forest in Central Massachusetts. J. Appl. Meteorol. Clim. 1996, 35, 122–134. [Google Scholar] [CrossRef] [Green Version]
  80. De Dios, V.R.; Roy, J.; Ferrio, J.P.; Alday, J.G.; Landais, D.; Milcu, A.; Gessler, A. Processes driving nocturnal transpiration and implications for estimating land evapotranspiration. Sci. Rep. UK 2015, 5, 1–8. [Google Scholar] [CrossRef]
  81. Han, Y.; Zhang, L.; Wang, C.; Yuan, J.; Wei, H. Dynamic characteristics and influencing factors of actual evapotranspiration in cold wetland. South North. Water Transf. Water Sci. Technol. 2018, 16, 28–34. [Google Scholar] [CrossRef]
  82. Oishi, A.C.; Oren, R.; Stoy, P.C. Estimating components of forest evapotranspiration: A footprint approach for scaling sap flux measurements. Agric. For. Meteorol. 2008, 148, 1719–1732. [Google Scholar] [CrossRef] [Green Version]
Figure 1. Location of Qinghai Lake Basin and observation sites.
Water 14 00700 g001
Figure 2. The flowchart of this study. Based on the half-hourly eddy covariance and micrometeorological data of four alpine ecosystems of the growing season (from May to September) in 2019 over Qinghai Lake Basin, their diurnal ET is quantified, and their influencing factors are identified during daytime and nighttime by statistical analysis method.
Water 14 00700 g002
Figure 3. Energy balance closure of observation data at (a) alpine desert, (b) alpine meadow, (c) alpine meadow steppe, and (d) alpine steppe.
Water 14 00700 g003
Figure 4. Monthly variation of (a) cumulative evapotranspiration (ET), (b) cumulative evapotranspiration in daytime (ETD), (c) cumulative nocturnal evapotranspiration (ETN), and (d) the percentage of ETN to ET of alpine ecosystems in the Qinghai Lake Basin during the growing season (from May to September) in 2019.
Water 14 00700 g004
Figure 5. The sensitivity coefficient between daytime (a) and nighttime (b) climate factors and evapotranspiration at alpine desert (AD), alpine meadow (AM), alpine meadow steppe (AMS), and alpine steppe (AS) in the Qinghai Lake Basin. Rn, TD, VPD, Pre, WS, Ts, Ms, and NEE are the net radiation, temperature difference (TaLST), vapor pressure difference, precipitation, wind speed, soil temperature, soil moisture, and net ecosystem exchange. *, **, and *** represent statistical significance at the p < 0.05, p < 0.01, and p < 0.001 levels, respectively.
Water 14 00700 g005
Figure 6. Diurnal variation of evapotranspiration of alpine desert (AD), alpine meadow (AM), alpine meadow steppe (AMS), and alpine steppe (AS) from May to September in 2019 in the Qinghai Lake Basin.
Water 14 00700 g006
Figure 7. Comparison of evapotranspiration data measured by eddy covariance (ETEC) and lysimeter observation (ETly) at the same site in the Qinghai Lake Basin from 11 February to 10 April 2021.
Water 14 00700 g007
Table 1. Information regarding location, altitude, soil, and vegetation in four ecosystems. The soil was classified according to the Chinese soil taxonomy.
EcosystemGeographical
Coordination
Altitude
/m. a.s.l.
Soil TypePlant Species
Alpine Desert38°17′55.77″ N, 98°16′10.97″ E4211Haplic Cryo-sod SoilRhodiola tangutica
Alpine Meadow37°53′12.75″ N, 98°24′28.21″ E3974Mat Cryo-sod SoilKobresia humilis
Alpine Meadow Steppe37°42′10.30″ N, 98°35′38.10″ E3718Mat Cryo-sod SoilKobresia humilis;Stipa purpurea
Alpine Steppe37°14′49.00″ N, 100°14′8.99″ E3205Cal-Ustic IsohumisolsAchnatherum splendens
Table 2. The relative contribution (%) of each impact factor in daytime and nighttime at high and low altitudes.
AreaTimeRnTDVPDPreTsMsWSNEE
high altitudes
(>3800 m)
Daytime19.1514.5620.303.684.2115.048.6814.38
Nighttime11.8010.6524.853.178.5515.5316.548.91
low altitudes
(<3800 m)
Daytime15.6622.471.509.1217.8911.8315.825.71
Nighttime3.1926.147.7114.8610.239.9920.817.08
Rn, TD, VPD, Pre, WS, Ts, Ms, and NEE are net radiation, temperature difference (Ta − LST), vapor pressure difference, precipitation, wind speed, soil temperature, soil moisture, and net ecosystem exchange, respectively.
Publisher’s Note: MDPI stays neutral with regard to jurisdictional claims in published maps and institutional affiliations.

