
Characterizing Compost Rate Effects on Stormwater Runoff and Vegetation Establishment


Department of Crop and Soil Sciences, North Carolina State University, Raleigh, NC 27607, USA
*
Author to whom correspondence should be addressed.
Water 2022, 14(5), 696; https://doi.org/10.3390/w14050696
Submission received: 24 January 2022
/
Revised: 16 February 2022
/
Accepted: 18 February 2022
/
Published: 23 February 2022
(This article belongs to the Special Issue Hydrologic and Water Quality Performance of Stormwater Best Management Practices)
Abstract
:Urban development exposes and compacts the subsoil, resulting in reduced infiltration, which often leads to problems with establishing vegetation, increased erosion, and increased runoff volumes. Compost incorporation into these soils can potentially enhance soil physical properties, vegetation establishment, and pollutant removal. The goal of this field study was to determine the efficacy of compost as a soil improvement measure to reduce runoff volume, improve runoff quality, and increase vegetation establishment on a disturbed sandy clay subsoil representing post-development conditions. Two sources of compost were tested: (1) a certified yard waste product at 10%, 30%, and 50% by volume, and (2) an uncertified yard waste product at 30% by volume, both compared to a tilled, no-compost control. Treatment plots were established at Lake Wheeler Road Field Laboratory in Raleigh, NC, and observed for one year. Tilling alone may have been sufficient to reduce runoff quantity as few differences were found between tilled and compost amended plots. Runoff water quality also did not differ according to compost addition. However, the certified compost increased biomass production proportionally to the amount added and compared to the uncertified compost at the same rate. The improved vegetation establishment with compost is important for long-term erosion control and ecosystem services. The results of this study suggest (1) tilling is a viable option to achieve high infiltration rates and reduce runoff volumes, (2) compost incorporation does not reduce nor improve water quality, and (3) compost may yield more robust vegetation establishment.
1. Introduction
Urban development can result in highly disturbed areas in which soil is severely compacted [1,2]. Soil can be compacted intentionally to increase soil strength or unintentionally from heavy equipment traffic. Topsoil is often removed during the construction process resulting in a nutrient poor subsoil exposed at the soil surface. Thus, development affects both soil physical properties and vegetation establishment [3,4]. Many studies have reported that compacted soils have reduced porosity [5,6,7], infiltration rate [8,9,10,11], and vegetation establishment [11,12,13], which, in turn, leads to increased runoff and erosion [3,14]. Runoff from compacted soils are often directed into overloaded stormwater systems and streams channels [14].
Establishing vegetation helps to create pathways in the soil for infiltration, which is necessary for erosion and sediment control [4,11,15]. One method of improving the soil environment is to till or incorporate compost into the compacted subsoils. Incorporating compost can increase the porosity and infiltration rate, while compost additionally provides essential plant nutrients to the nutrient-depleted subsoil [3,4]. Compost can also remove pollutants from the infiltrating stormwater, resulting in cleaner runoff [16,17]. These beneficial effects are interactive and are attributed to the amount of compost applied and the amount of organic matter (OM) in the compost feedstock.
The hydrological response to compost incorporation in compacted soils has been variable, with compost incorporation increasing infiltration at some sites while tilling without adding compost was sufficient to improve infiltration at others [10,11,18,19]. Logsdon et al. [10] observed that compost incorporation improved infiltration compared to a no compost control and a compost blanket up to four years after compost application. Conversely, Mohammadshirazi et al. [11] found that compost incorporation and tilling the soil resulted in the same infiltration two years after compost application. However, both compost incorporation and tilling increased infiltration compared to a compacted soil with no compost. Many studies on compost incorporation have only examined one compost application rate and one source of compost [8,9,10,11,18,20]. The addition of compost to soils may have a range of effects on soil function due to the complexity of the soil’s and compost’s physical, chemical, and biological properties [19,20].
In addition to providing essential plant nutrients, compost can also be a source of nutrients and metals in runoff, depending on hydrologic conditions, the compost feedstock, and the compost maturity [21,22,23]. When compost is used on roadsides to filter stormwater, there is the potential for compost to alter the nutrient and metal export concentration and patterns. As compost incorporation in degraded urban soils becomes an increasingly popular approach for soil improvement, it is important to understand how compost incorporation and stormwater interact, so it can be used as an effective stormwater control measure (SCM).
The purpose of this study was to determine the potential of compost incorporation to reduce runoff volume, improve runoff quality for ecological reasons, and increase vegetation establishment in a sandy clay soil over the course of a growing season. Compost incorporation at rates of 0%, 10%, 30%, and 50% compost by volume, and including two sources of compost, were tested at field scale in the Piedmont region of North Carolina, USA. Runoff was sampled after each natural storm event. Specifically, we determined whether compost incorporation would (1) change runoff volume or infiltration rate (IR) compared to a tilled control, (2) alter dissolved pollutant concentrations and export patterns in runoff, and (3) change biomass production. We hypothesized that compost incorporation will improve soil physical properties and increase vegetation establishment, resulting in increased IR, reduced runoff volumes, reduced sediment loads, and reduced pollutant transport. We additionally hypothesized that, as the rate of compost application increases, there will be further improvements to the three parameters mentioned above.
2. Materials and Methods
2.1. Site Description and Treatments
The field study was conducted at the Lake Wheeler Road Field Laboratory, Raleigh, NC, USA, in the Piedmont region of North Carolina. Plots were established in May of 2020. The site was located on a grassed slope mapped as Cecil (fine, kaolinitic, thermic Typic Kanhapludults) [24]. The site was intended to mimic post-development soil conditions (e.g., along a roadside) within the region; the Cecil soil series is mapped on approximately 2.3 million hectares within the southeastern USA. The topsoil and vegetation were removed to expose the subsoil, and the area was graded to achieve a uniform surface with a slope of 5% to allow for some surface drainage. The subsoil was then tilled to approximately 15 cm depth using a rotary tiller. Each plot received fertilizer at a rate of 560 kg ha−1 and lime at a rate of 4483 kg ha−1. Fertilizer was a 10-20-20 blend of nitrogen (total nitrogen), phosphate (P2O5), and potassium (K2O), respectively, according to North Carolina Department of Transportation (NCDOT) guidelines for grass establishment [25]. Fertilizer and lime were mixed in during tillage. Particle size analysis was performed on the exposed subsoil using the hydrometer method [26] from composite samples (0–15 cm depth). The subsoil contained 52% sand, 12% silt, and 36% clay (sandy clay texture).
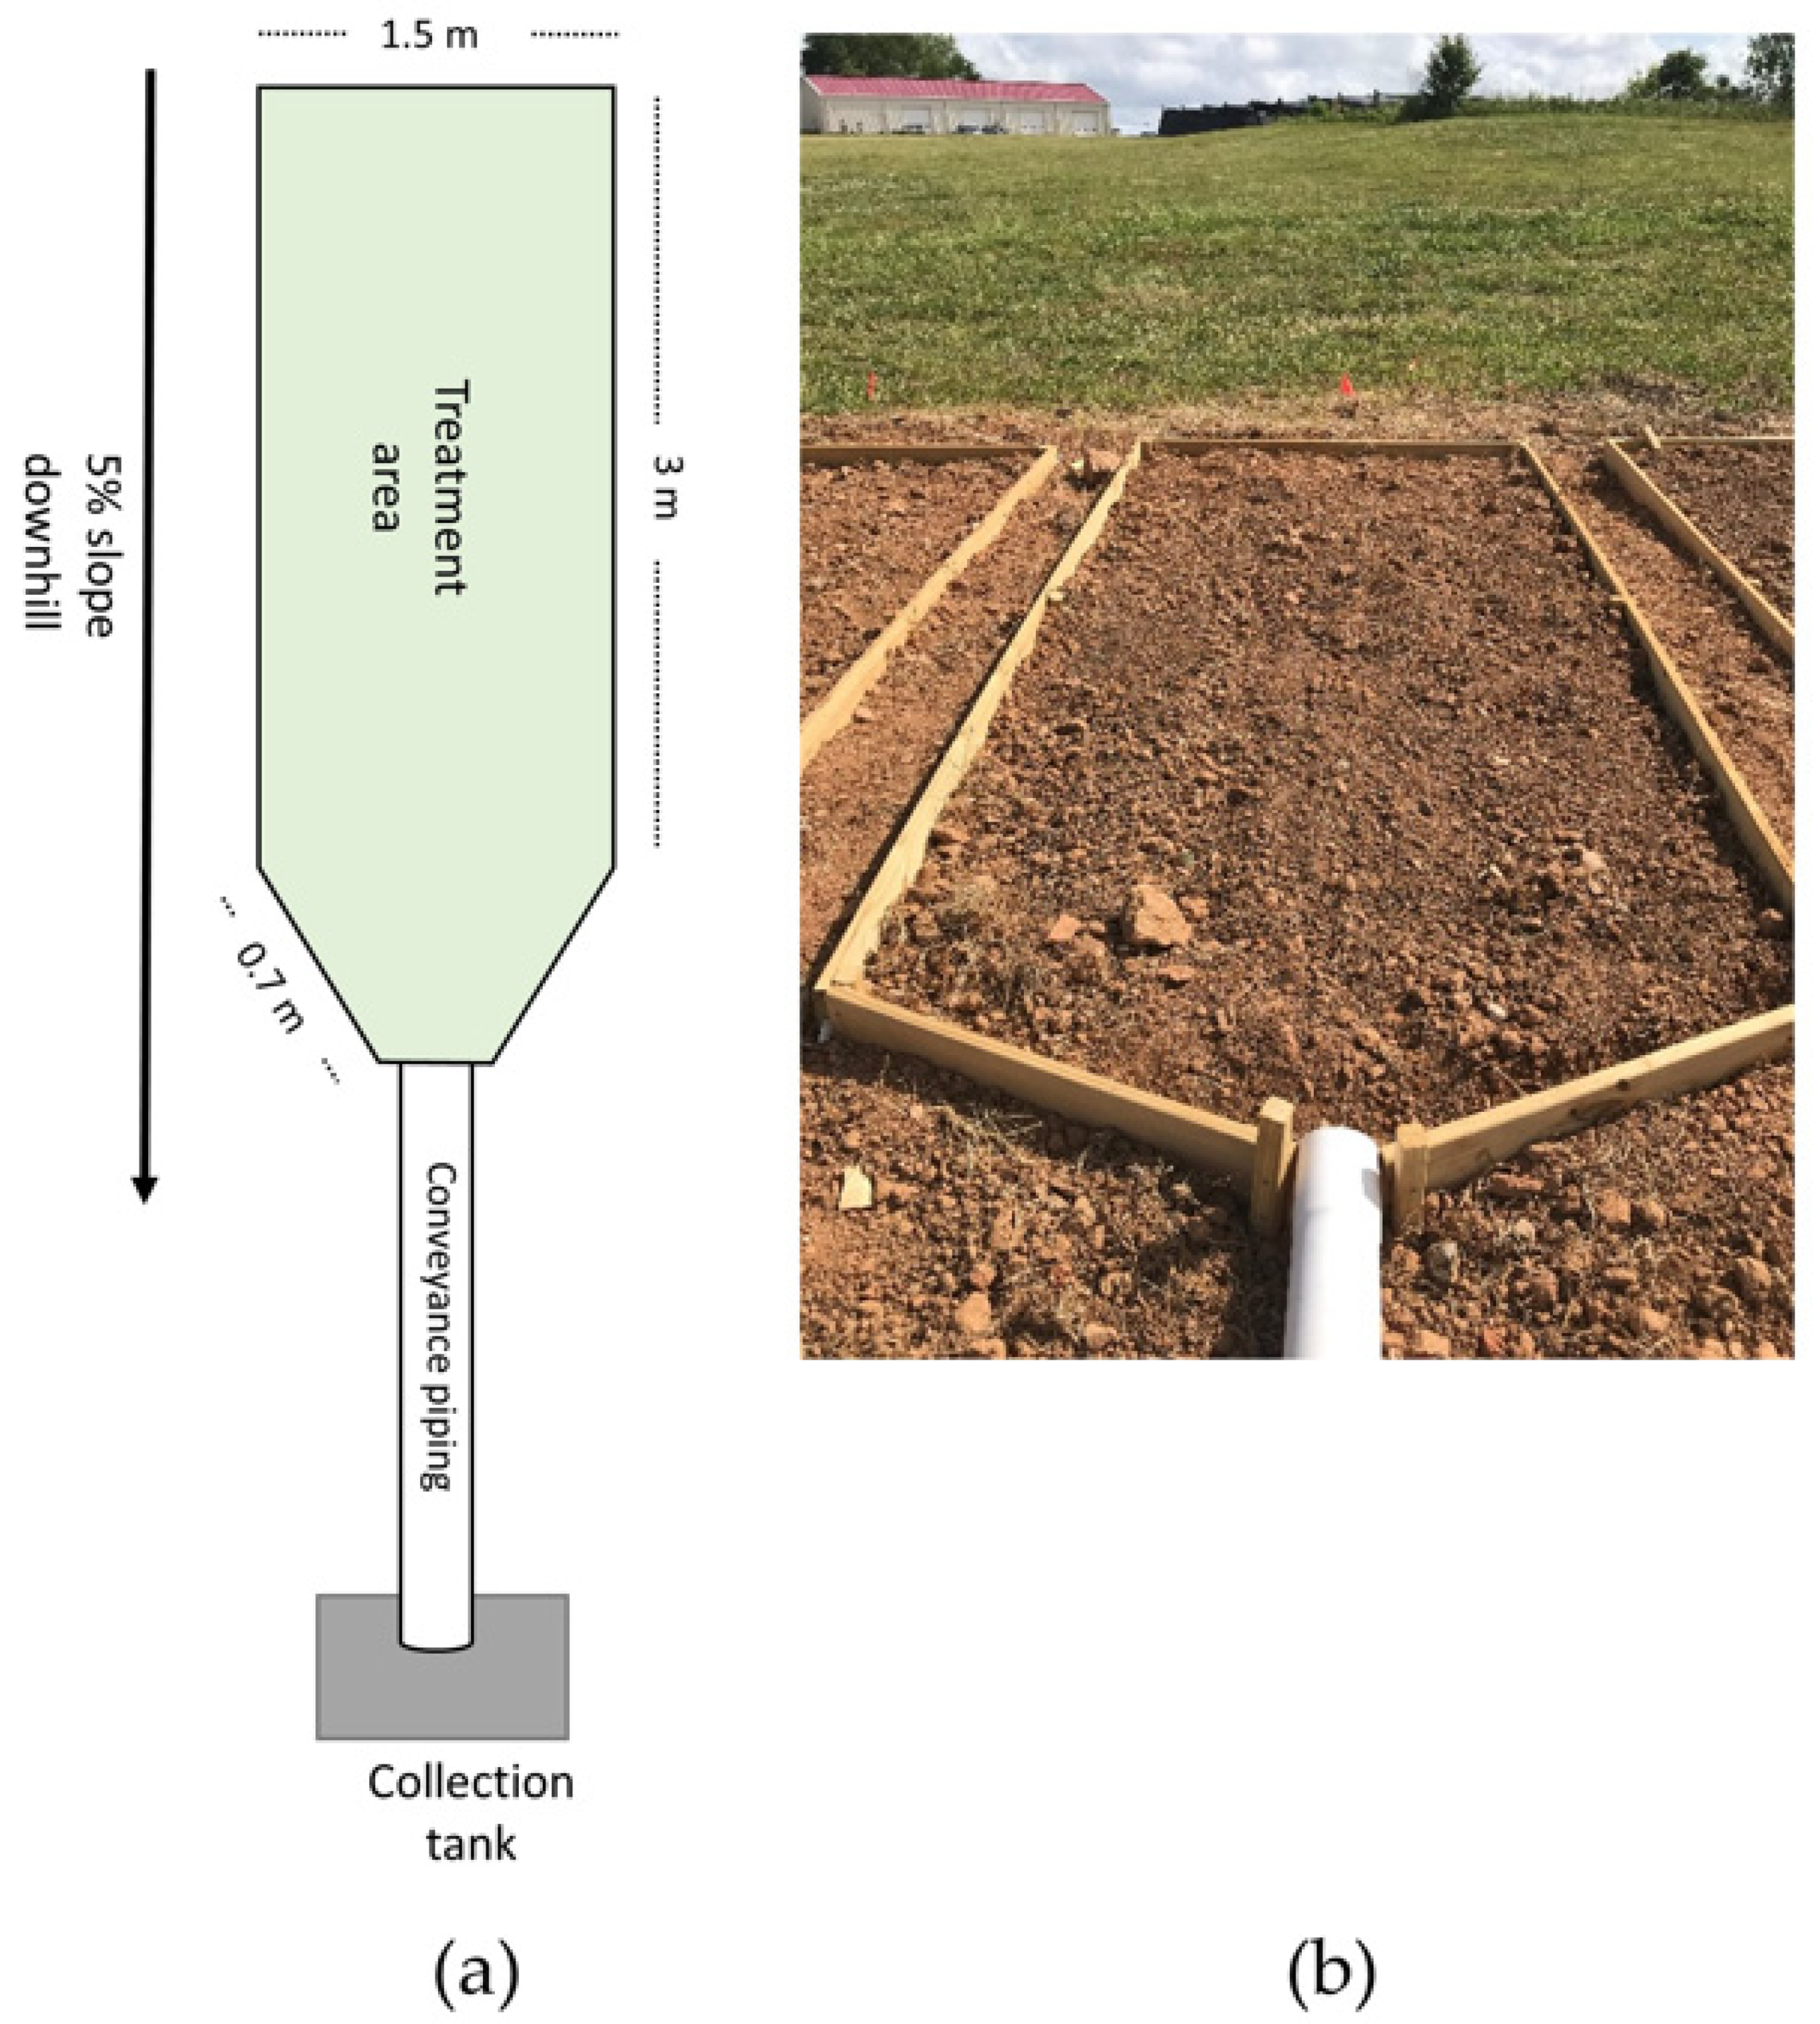
Plots were set up in a completely randomized block design, where each of the five treatments were replicated once in each of the four blocks. Individual plots were delineated with wooden boards (1.5 m wide by 3.0 m long by 0.3 m tall) with an isosceles triangle (0.7 m length of each wooden board) on the down slope end of the plot in order to funnel water to a collection point. Wooden boards were inserted about 5 cm into the soil (Figure 1). A PVC pipe was attached between the two equal sides of the triangle to direct runoff to a 114 L plastic tub. The edges and gaps were sealed with expanding foam (Great Stuff, Dow Chemical Company, Wilmington, IL, USA). Each tub was fitted with a lid to prevent direct precipitation inputs.
Compost was sourced from two manufactures: (1) McGill SportsTurf ® (New Hill, NC, USA) and (2) North Carolina State University (Raleigh, NC, USA). These compost sources were used to make soil–compost blends. The McGill compost was a blend of woody materials, yard waste, agricultural by-products, and food waste and is a Seal of Testing Assured (STA) certified compost by the US Composting Council. The North Carolina State University compost was a blend of woody materials, yard waste, and food waste and is uncertified. Yard waste can include leaves, plants, straw, and woody debris. A basic nutrient analysis of the soil and compost was conducted by Brookside Laboratories, Inc. (New Breman, OH, USA) (Table 1).
Compost was tilled into the top 15 cm of the soil. The McGill compost (certified compost) was incorporated at 10% (C10), 30% (C30), and 50% (C50) compost by volume. The North Carolina State University compost (uncertified compost) was incorporated at 30% (U30) compost by volume. There was also a tilled only control (0% compost). The compost rates were chosen because they are representative of a low, medium, and high compost rate observed in the literature [3,4]. All plots were seeded with a NCDOT seeding mix including tall fescue (Festuca arundinacea) at 84 kg ha−1 and hulled bermudagrass (Cynodon dactylon) at 28 kg ha−1 [25]. A single-net erosion control blanket (excelsior matting) was used to cover the plots after seeding and anchored with metal sod staples (Figure 2). Plots were re-seeded with the same seed mix and rates as above six months after site establishment to improve stand density.
2.2. Runoff Qualtity and Quality
Rainfall data were collected from a HOBO RX3000 Weather Station (Bourne, MA, USA) located 5 m from the plots. After each rain event, the runoff volumes were determined by recording the depths of water in the collection tubs for each plot and calculating the volumes from a calibration curve. Water within the tubs was mixed thoroughly to suspend sediments while 1 L subsamples were taken. These subsamples were analyzed for total suspended solids (TSS) and turbidity. Additionally, the first three storm events were analyzed for dissolved nutrients (ammonium [NH4+], nitrate [NO3−], and phosphate [PO4−3]) and heavy metals (copper [Cu], lead [Pb], and zinc [Zn]). The TSS was determined by filtration [27] using 90 mm glass fiber filters (ProWeight, Environmental Express, Mt. Pleasant, SC, USA). Turbidity was measured using a nephelometer (McVan Instruments, Victoria, Australia) according to the USEPA standard method 180.1 [28]. Nutrients were analyzed on a Lachat Quikchem® 8500 (Milwaukee, WI, USA), and heavy metals were analyzed on Perkin Elmer Elan DRCII inductively coupled plasma-mass spectrometer (Waltham, MA, USA) using standard methods [29]. Nutrient and heavy metal export was calculated from:
and scaled up to grams per hectare.
export = runoff volume × concentration
2.3. Vegetation Establishment
Grass biomass samples were collected, and mowing occurred 51 (Event 1), 71 (Event 2), 96 (Event 3), and 138 (Event 4) days after plots were established. Clippings from two randomly selected 20 × 50 cm rectangles were cut to 10 cm above the ground in accordance with NCDOT mowing guidelines [25]. Samples were placed in paper bags, dried at 65 °C for 48 h, and then weighed to determine above ground biomass. Individual plot biomass was estimated from the average of the two samples. Plots were mowed to 10 cm above the ground as recommended by the NCDOT [25].
2.4. Infiltration Rate and Bulk Density
Bulk density and IR measurements were taken 11 months after plot establishment in April 2021, and two samples were taken or measured per plot. Bulk density samples from the upper 10 cm of the soil were taken using a 6 cm diameter core sampler (AMS Inc., American Falls, ID, USA). The top 2.5 cm ring from each sample was discarded to avoid measuring any minor compaction caused by the sampler’s hammer driver. Bulk density samples were weighed, oven dried at 105 °C, and re-weighed to determine the water content and bulk density.
The constant head single-ring infiltrometer method was used to measure IR [30] with an 11 cm diameter ring inserted to a depth of 7.5 cm. A thin layer of gravel was placed on the soil surface to prevent altering the soil surface at the start of the infiltration process. A pressure head of 5 cm was established at the soil surface, and the rate of water flow from an attached supply reservoir was recorded over time intervals until three constant, consecutive readings were achieved, which typically took about 30 min. The IR was calculated from these data using the Reynolds and Elrick method [31].
2.5. Statistical Analysis
All statistical analyses were performed in R version 4.0.4 [32]. Storm events 9, 12, and 20, resulting from Hurricanes Isaias (152.4 mm rainfall), Kyle (147.0 mm rainfall), and Zeta (122.4 mm rainfall), respectively, were removed from the data set due to runoff collection bins overflowing. A linear mixed effect model was used to account for the special and temporal correlation resulting from the study design. Treatment was a fixed effect and plot within block as a random variable in order to account for differences among treatment blocks [33]. A one-way analysis of variance (ANOVA) with Tukey’s HSD pairwise comparison (ɑ = 0.05) was used to evaluate differences between treatments for runoff, IR, bulk density, water content, TSS, turbidity, nutrient loads, and heavy metal loads. For biomass, the data were not transformed, and the data were found to be described by a polynomial function. A one-way ANOVA was used to determine if there was any variation in biomass production by treatment (Tukey’s HSD test, ɑ = 0.05).
3. Results
3.1. Runoff Quantity
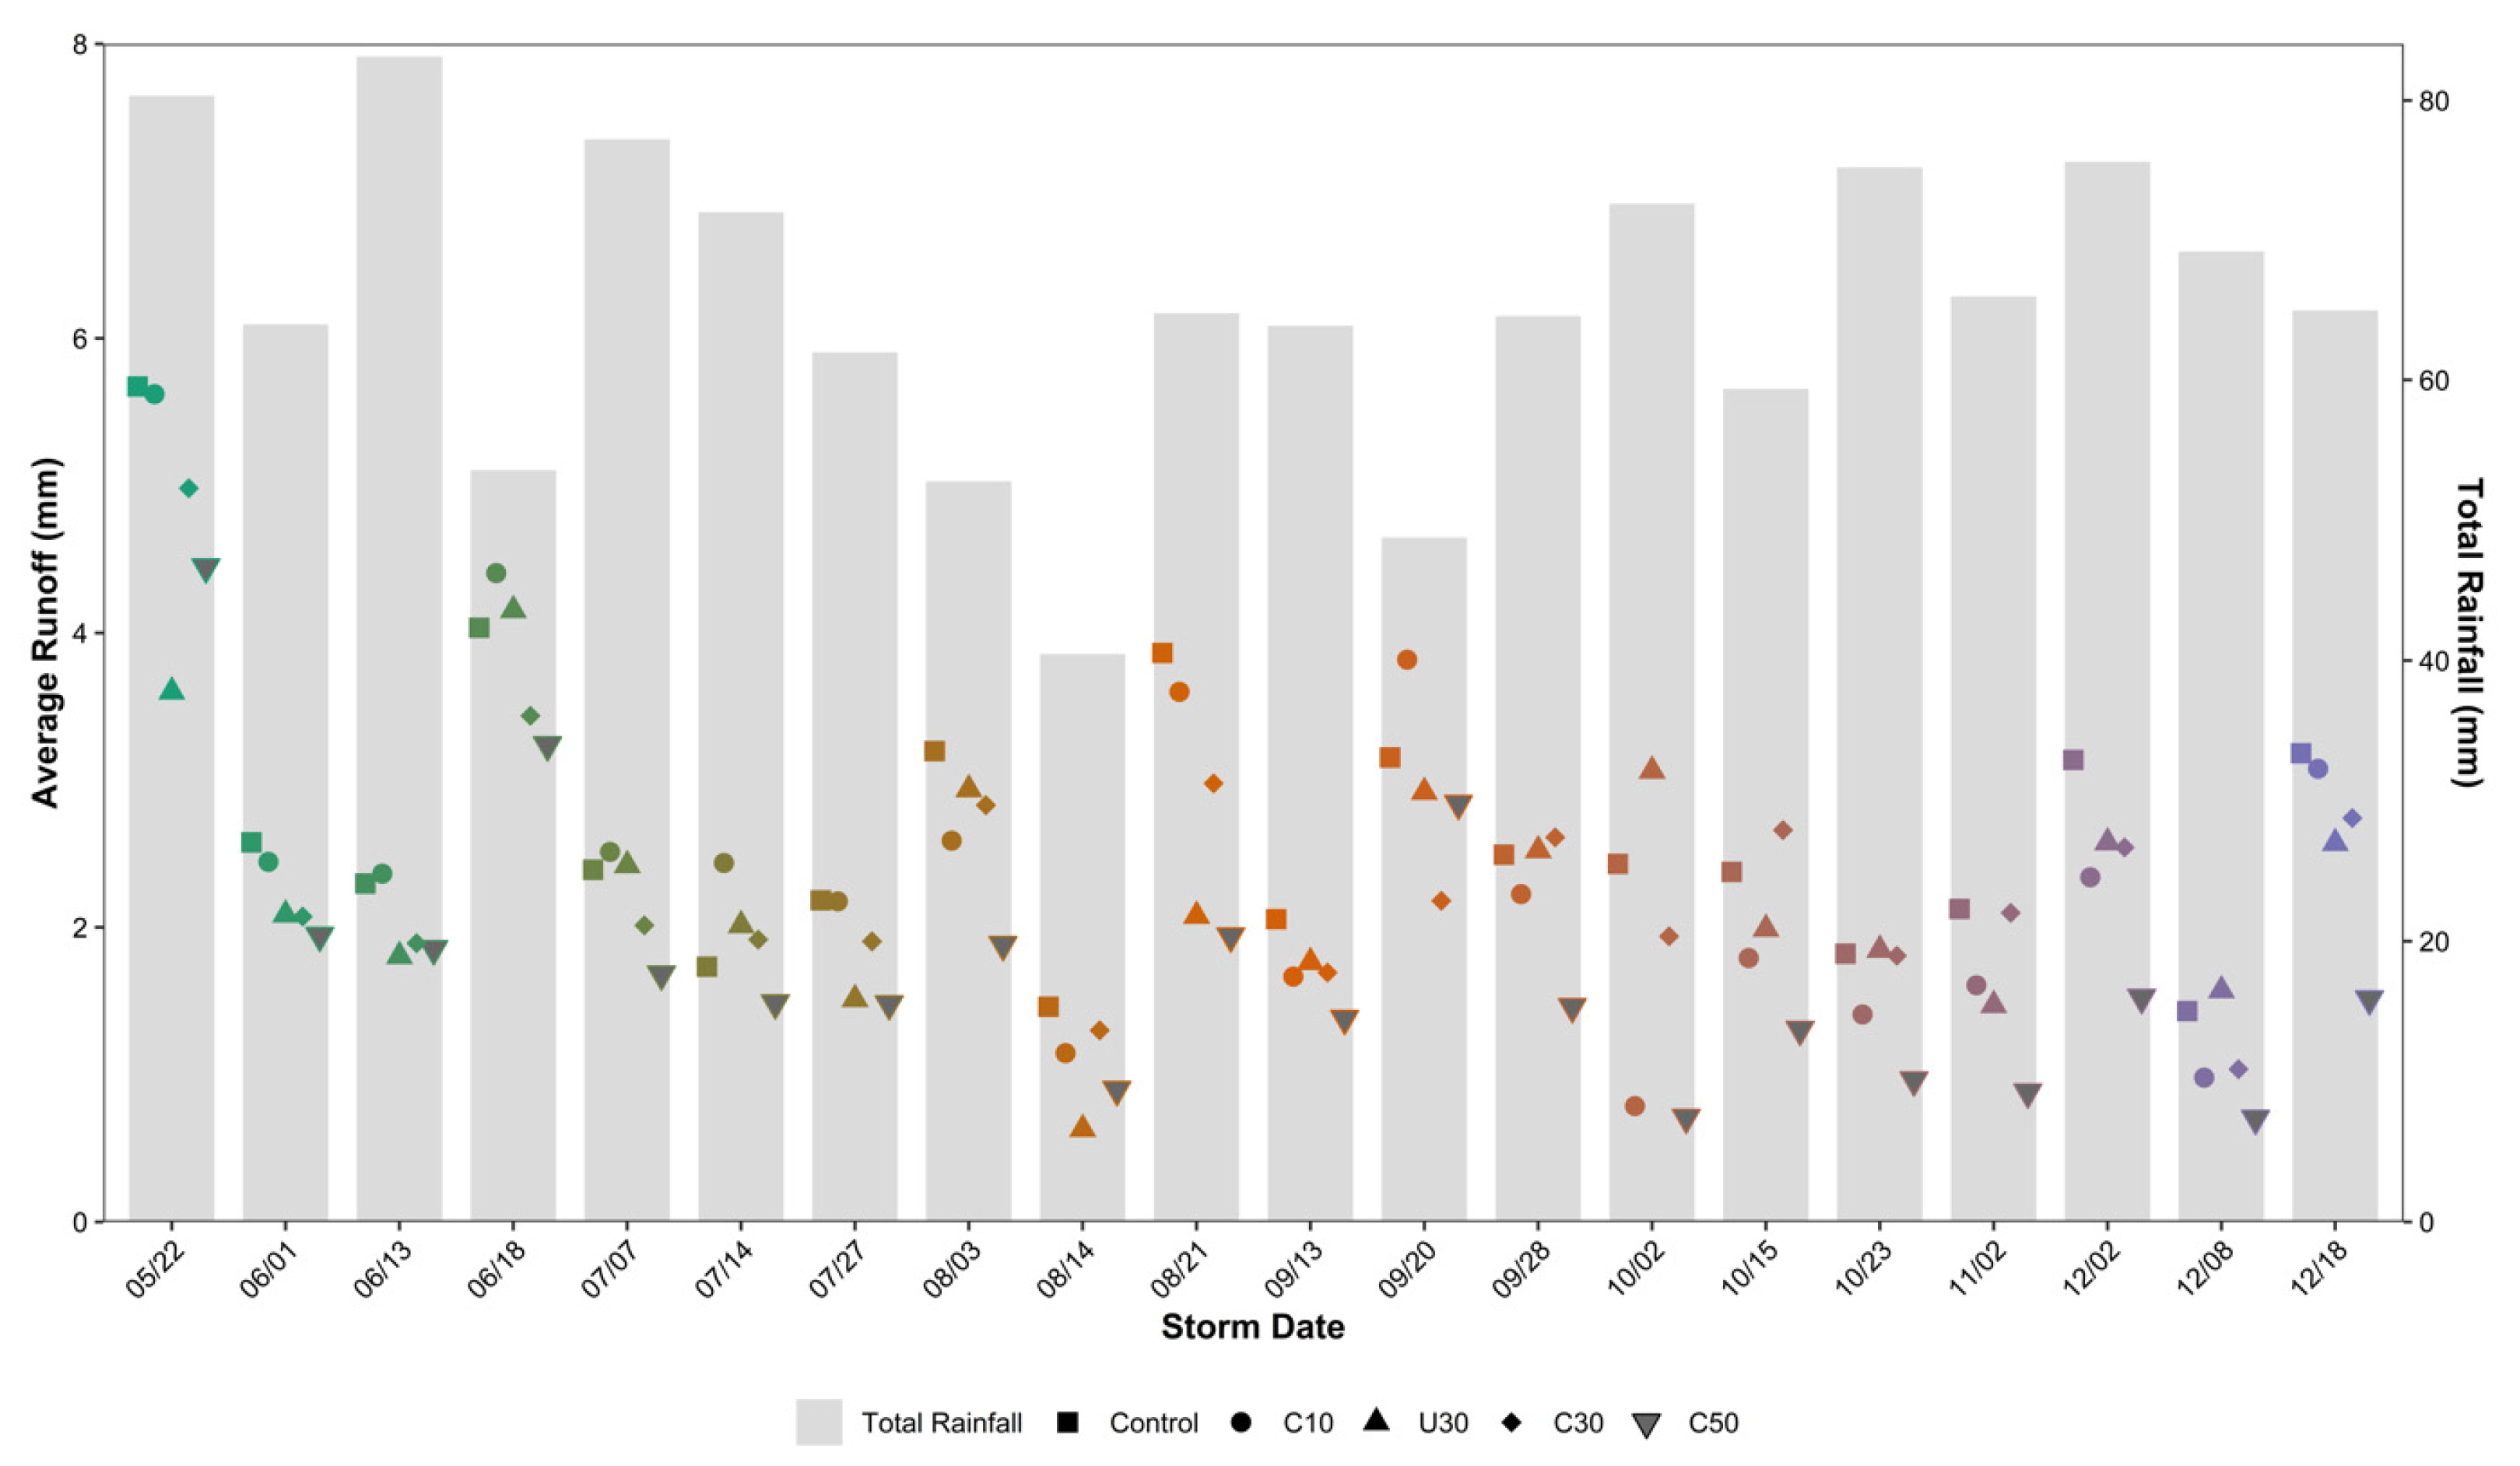
There were 23 storm events during the May 2020 to December 2020 observation period. Three of these storm events (9, 12, and 20) were removed; thus, 20 storm events were analyzed. Mean rainfall per storm event during the collection period was 57 mm (ranging from 39–82 mm), and mean rainfall intensity per storm event was 55 mm h−1 (ranging from 30–137 mm h−1). Across all treatment plots, runoff was significantly correlated with total rainfall (p < 0.01) and rainfall intensity (p < 0.05). The ANOVA showed there were no differences between treatments for each individual storm event (Figure 3). All treatments resulted in very low runoff (<10%) relative to rainfall for the 20 cumulative storm events.
3.2. Runoff Water Quality
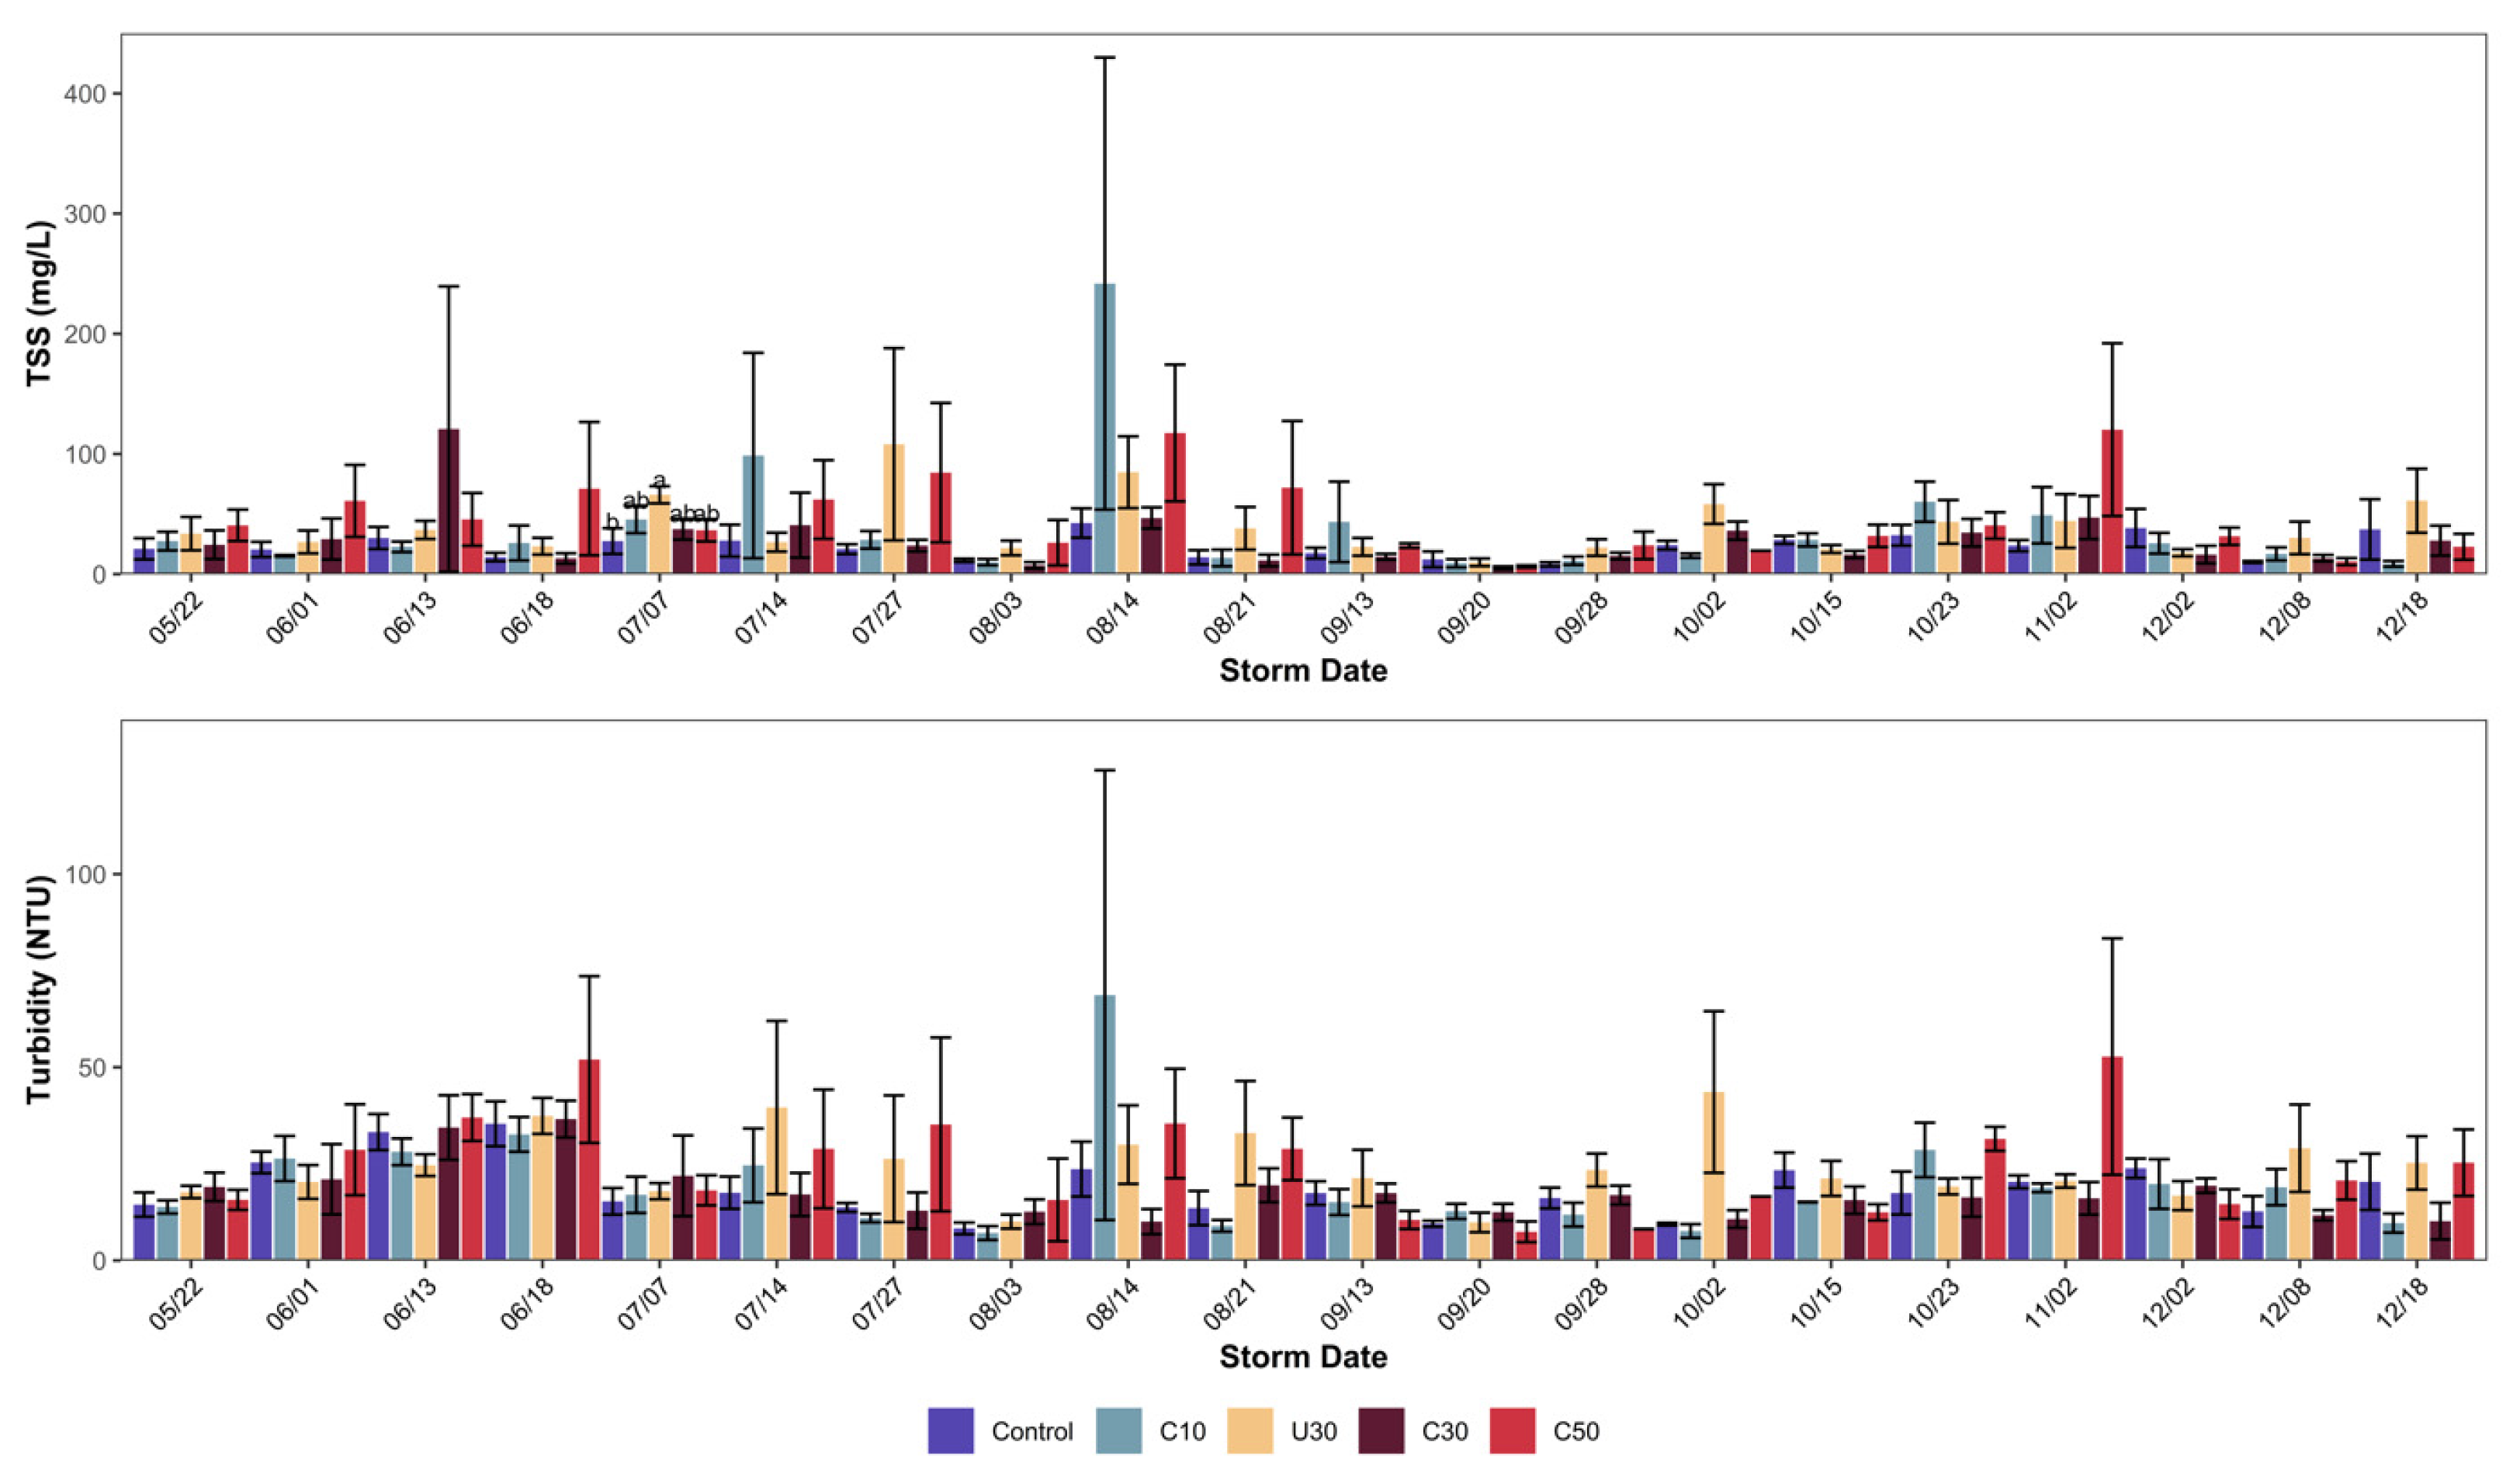
All storm event runoff water was analyzed for TSS and turbidity, and the first three storm events were analyzed for dissolved nutrients and heavy metals. There were no significant differences in turbidity, with an average value of 21 NTU (Figure 4). For TSS, one storm event, 7 July (Storm Event 5), resulted in significant differences, while no differences were found on any other storm dates (Figure 4). The U30 runoff resulted in higher TSS compared to the control, but the U30 was not different from the certified compost treatments. The TSS for storm events were significantly correlated with total rainfall (p < 0.05) and rainfall intensity (p < 0.001). In this study, the use of compost, up to 50% by volume, did not increase nor decrease the turbidity or TSS in runoff compared to the control.
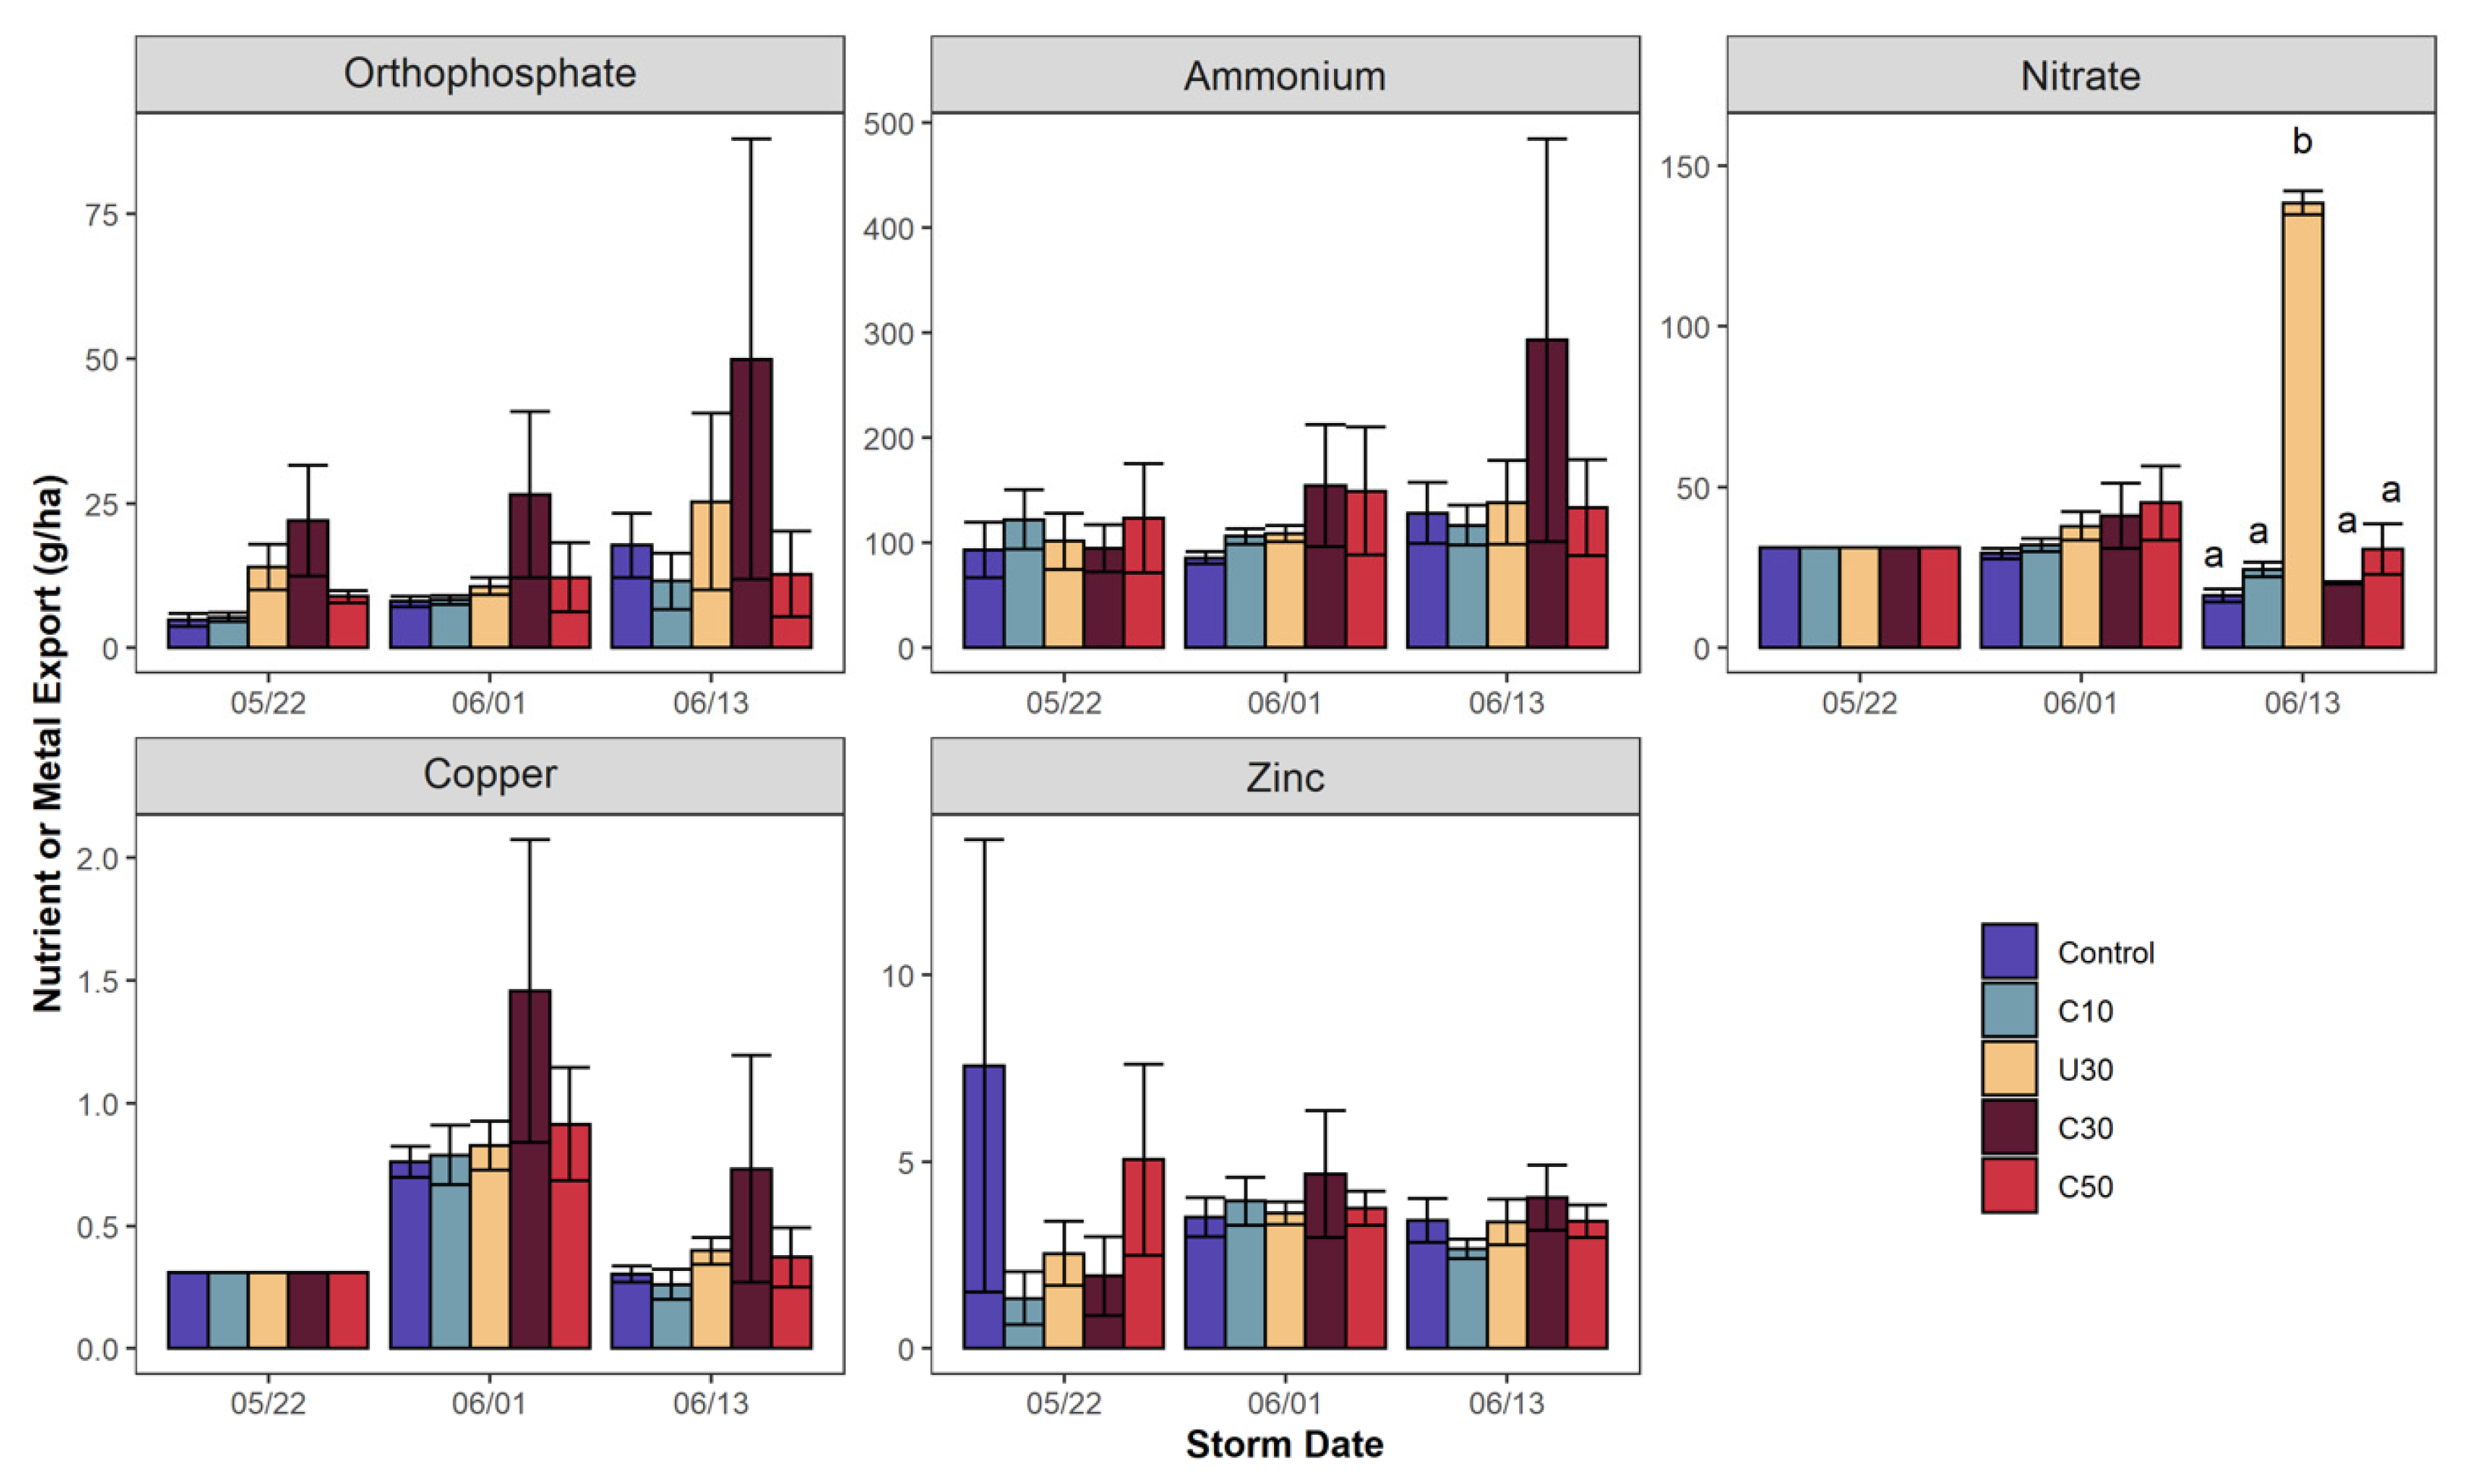
Patterns in dissolved nutrients and heavy metals were variable across storm events and among treatments. However, treatments followed relatively similar export patterns during each storm event. There were no differences in PO43− for any of the three storm events measured (Figure 5). There was a trend of increasing PO43− export with each storm event. There were no differences in NH4+ export. Nitrate export was relatively the same for all three storms, except the C30 treatment that produced highly variable export for Storm Event 3 (13 June). Nitrate was the only nutrient to have significant differences, and this was for Storm Event 3. The U30 runoff resulted in higher (p < 0.01) NO3− export (140 g ha−1) compared to all other treatments, which were less than 50 g ha−1 (Figure 5).
There were no differences in heavy metal export (Figure 5). Lead was below detection for all treatments and storm events (<4.2 μg L−1). Peak export of Cu was reported from Storm Event 2, and then decreased for the following storm event to values near Storm Event 1. The highest reported export value for Cu was the C30 treatment at Storm Event 2 (1 g ha−1) (Figure 5). The C30 treatment appears to produce the most variation as it did with PO43− and NH4+ export. Copper concentrations ranged from below detection to 2.0 µg L−1 (Table 2). Zinc had variable export for Storm Event 1 but appears to have steady export with the three measured storm events (Figure 5). The maximum Zn export was the control on Storm Event 1 at 7 g ha−1. Zinc concentrations ranged from 3.0 to 27.2 µg L−1 (Table 2).
3.3. Vegetation Establishment
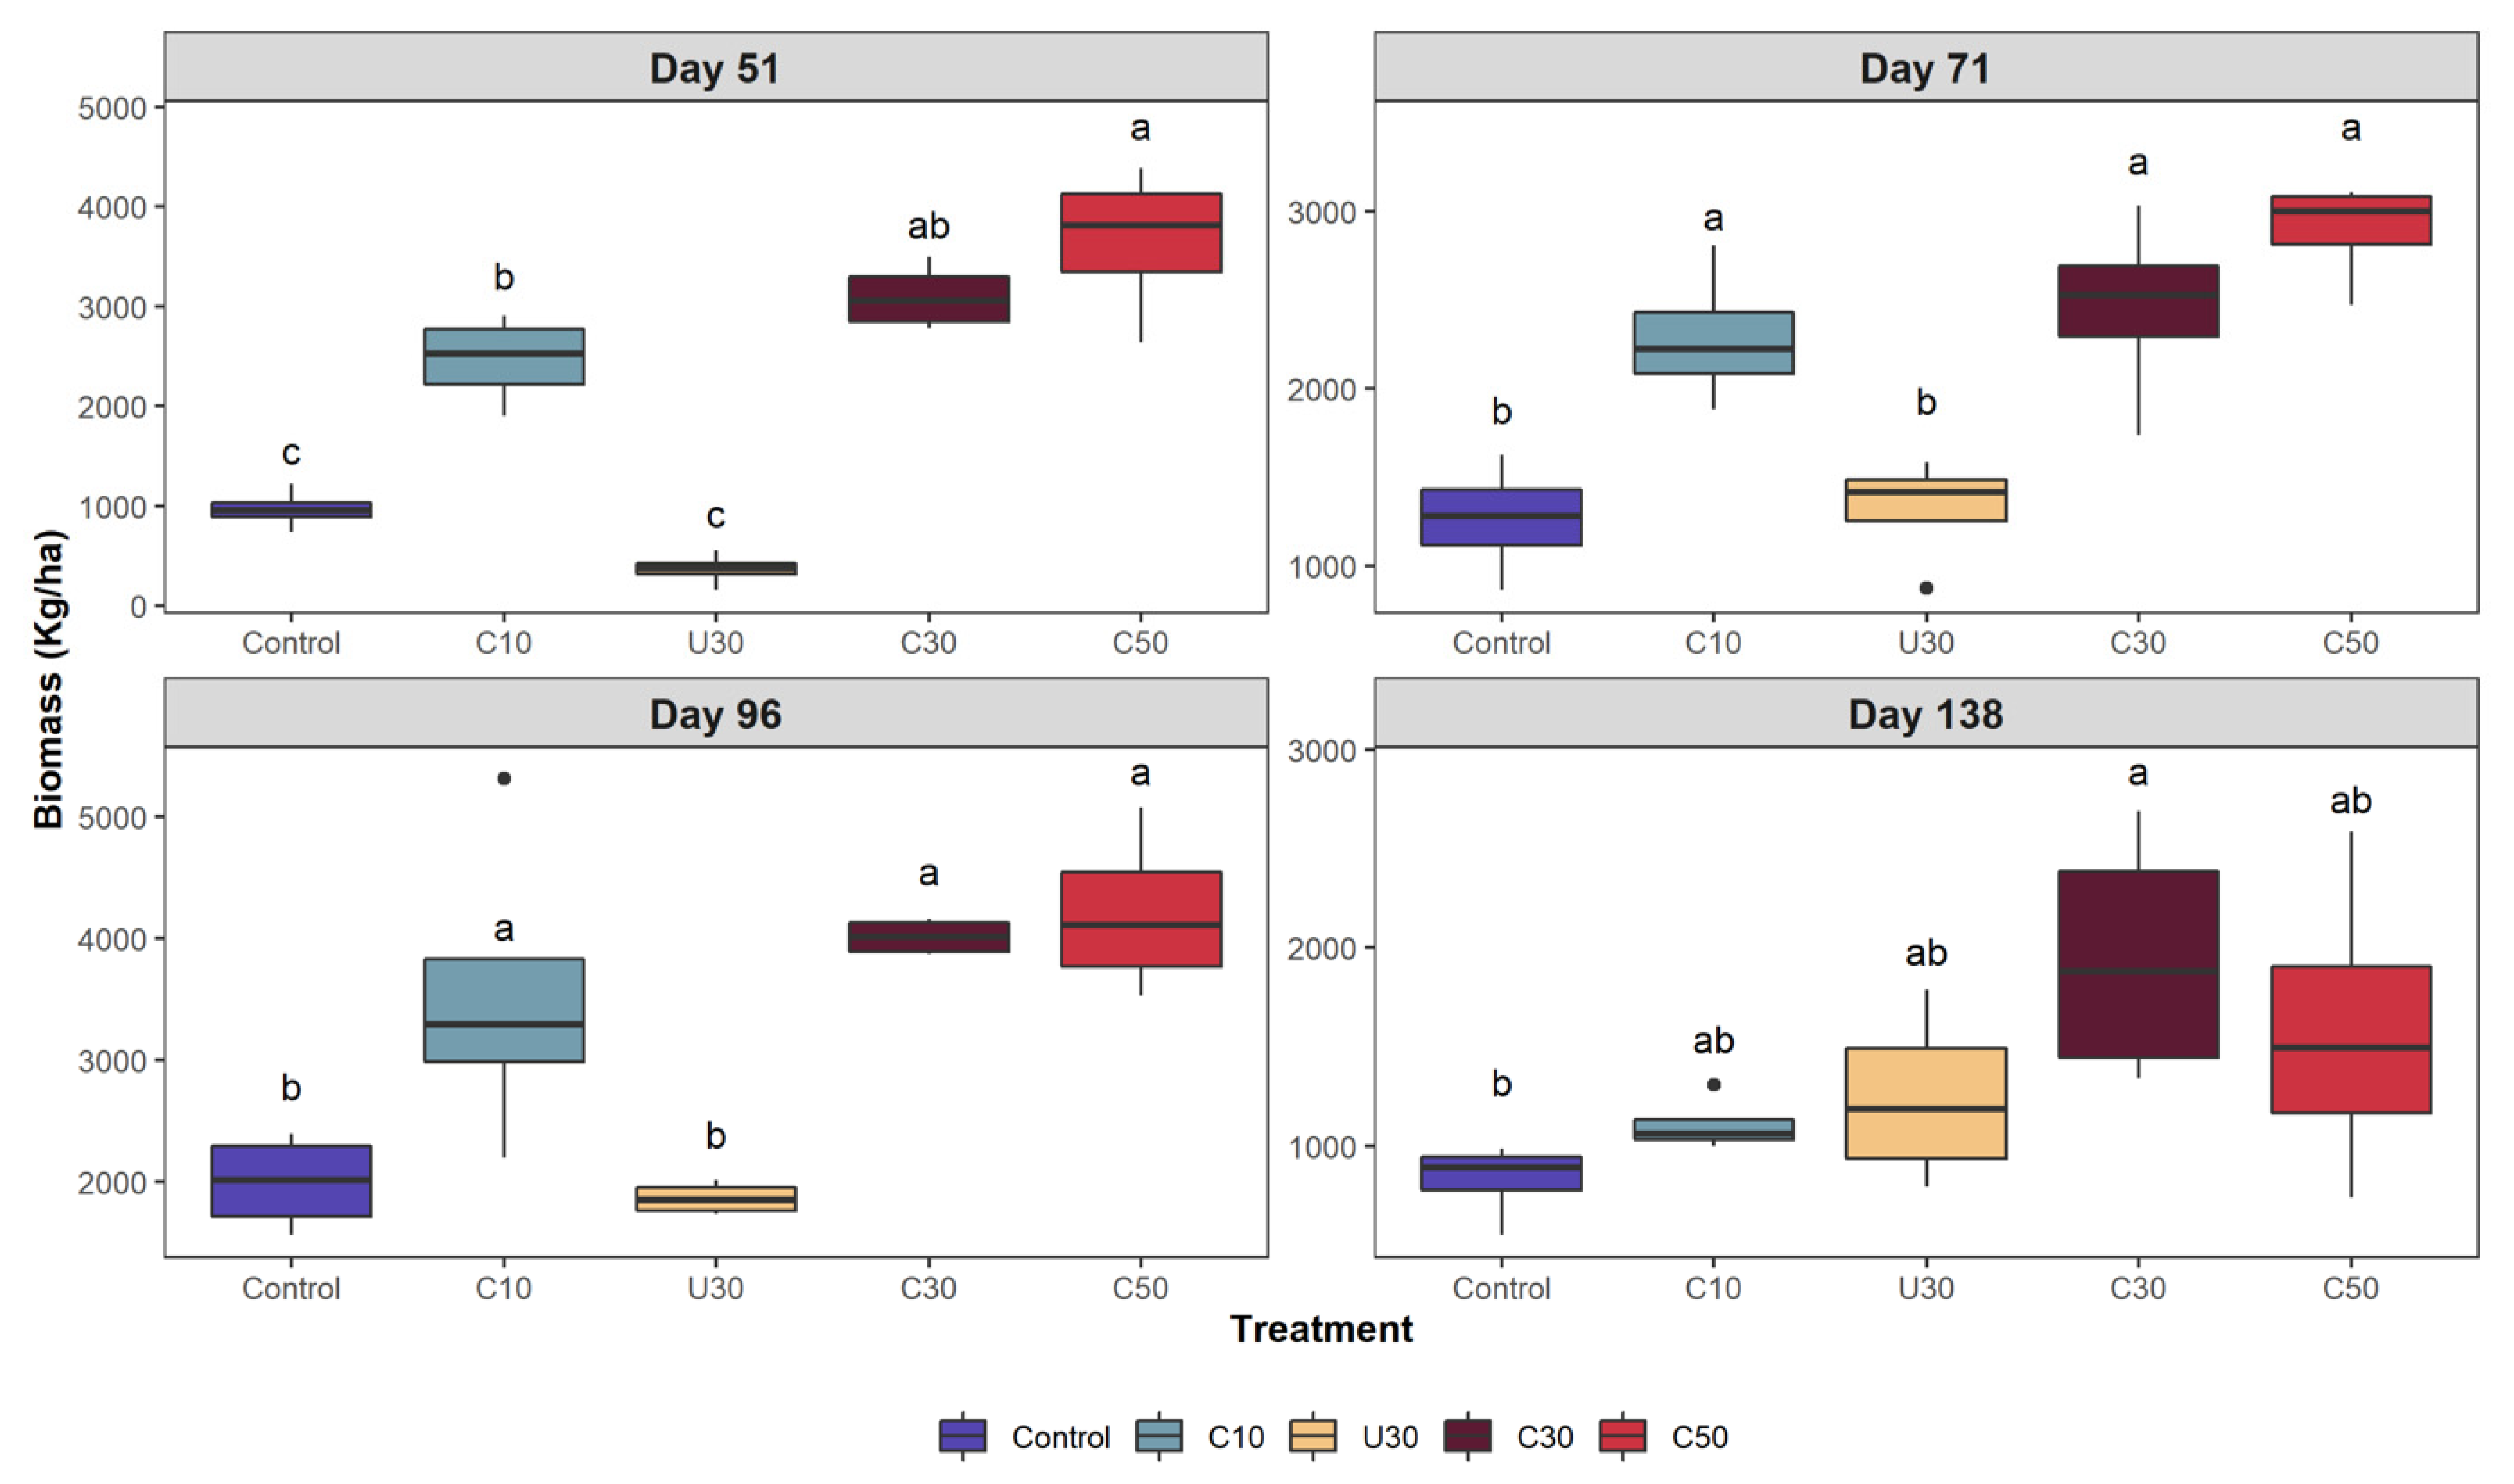
Biomass was collected four times during the field study, 51, 71, 96, and 138 days after plot establishment. At Day 51 (Event 1), the C50 treatment resulted in higher (p < 0.05) biomass compared to the control, U30, and C10 treatments, but was the same as C30 treatment (Figure 6). At Days 71 and 96 (Events 2 and 3), all certified compost treatments (C10, C30, C50) produced more (p < 0.05) biomass than the control and U30 treatment. By Day 138 (Event 4), the control resulted in lower biomass (p < 0.05) than the C30 treatment, but all other treatments were considered the same. Day 138 also had the most variation in biomass for U30, C30, and C50 treatments. This may be attributed to cooler fall temperatures and the volunteer vegetation (annual ryegrass) dying off in the treatment plots. For the cumulative biomass from all four sampling dates, the C50 treatment generated significantly more biomass followed by the C30, C10, control, and U30 treatments, respectively (Table 3). The certified compost resulted in greater biomass production compared to the uncertified compost. The C50 treatment produced more than double the biomass compared to the control and U30.
3.4. Bulk Density and Infiltration Rate
Eleven months after plot establishment, the control treatment resulted in lower water content (p < 0.01) and increased bulk density (p < 0.0001) compared to the compost incorporated treatments (Table 3). There were no differences in water content between compost treatments. The C50 treatment resulted in the lowest bulk density at 0.88 g cm−3, followed by the C30 (0.96 g cm−3), U30 (1.03 g cm−3), C10 (1.19 g cm−3), and the control (1.35 g cm−3). With each increase in compost application rate, there was a decrease in the bulk density (p < 0.05).
Compost incorporation significantly improved the IR to 36.0 to 67.9 cm h−1 compared to the tilled only control at 27.3 cm h−1 (Table 3). Mean rainfall and storm intensity from the 20 storm events were 5.66 cm and 5.47 cm h−1, respectively, and these values are smaller than the measured IR. This demonstrates that, while there are differences in IR between treatments, the rainfall and storm intensity were too small to capture the differences between treatments using observed runoff from natural events.
4. Discussion
4.1. Runoff Quantity
In all cases, runoff volume was less than 10% of total rainfall across the full length of the study. The soil texture at this site is a sandy clay with 52% sand. Tilling alone was enough to loosen the soil in order to achieve high infiltration rates for this sandy soil. Two field studies at this location that also had a sandy clay soil texture included a compacted control and a tilled control [11,18]. In both studies, infiltration with compost incorporation was significantly increased compared to the compacted control but not compared to the tilled control, which is similar to the pattern observed here with no difference between tillage and tillage with compost amendment. Both prior studies had a till depth of 30 cm, which was twice the depth the soil was tilled in this experiment. The amount of runoff relative to rainfall was similarly low to tillage in the previous studies.
4.2. Runoff Water Quality
The TSS values are generally lower than other studies monitoring TSS from roadway runoff with compost amendments [19,34]. The Environmental Protection Agency (EPA) has set guidelines for construction and development point source category for turbidity at 280 NTU [35]. All reported turbidity values are less than half of the EPA requirement. The average turbidity from this experiment (21 NTU) was also below the North Carolina Department of Environmental Quality (NCDEQ) surface water quality standards for aquatic life and secondary recreation for both freshwater (<50 NTU) and saltwater (<25 NTU) [36]. Runoff turbidity was much higher in a similar study at this site, possibly due to slower vegetation establishment in a fall establishment versus a spring establishment in this experiment [37]. However, the average turbidity reported here would be unsuitable for sensitive water bodies such as trout streams (<10 NTU) [36].
Dissolved nutrients and heavy metals were lower than other studies using compost on roadsides [10,19,34,38,39,40] and below the reported EPA national average [17]. The delay in the PO43− export from both soil and compost was also seen in other studies [19,34]. The pattern of Cu export was similar to the one observed by Rivers et al. [19]; they observed that Cu export temporarily increased before decreasing in the first few storm events. The Zn leaching pattern observed here mimics the pattern observed by Wissler et al. [40], where Zn levels are consistent over time. However, Rivers et al. [19] observed a flush of Zn in the first few storm events before it dramatically decreased. Additionally, there were few differences between treatments, suggesting that compost, at a rate of up to 50% by volume, might not increase nutrient and heavy metal loads in runoff. This field study demonstrated that compost did not decrease nor increase water quality in terms of turbidity, TSS, and dissolved nutrients and heavy metals.
4.3. Vegetation Establishment
A study using a mixed source compost in a sandy loam soil also found that biomass was significantly increased with both the 2.5 and 5.0 cm compost applications compared to the no compost control [12]. Their maximum reported biomass was 260 kg ha−1, which is drastically lower than any of the values reported in this study. The minimum value in this study was 367 kg ha−1 for U30 treatment on Day 51, and the maximum value was 4205 kg ha−1 for C50 treatment on Day 96 (Figure 6). Environmental factors as well as compost source could influence the differences for biomass produced. Another study found that compost increased vegetative cover compared to a no compost control at three of four field locations [11]. Other studies have reported better vegetation establishment in disturbed soils with compost amendments using a visual assessment [10,19].
Overall, all treatments in this study had dense vegetative coverage, largely composed of volunteer annual ryegrass. The certified compost produced more biomass compared to the uncertified compost and the control. The certified compost also led to increased biomass with increased rates of compost. The uncertified compost had higher levels of organic matter (79.7%) and carbon (30.4%), which led to a C/N ratio of 18.5 (Table 1). Higher C/N ratios are known to immobilize nitrogen, which can inhibit vegetation growth [41]. The C/N ratio of the certified compost was 12.2, which is within the ideal range for vegetation establishment [41].
4.4. Bulk Density and Infiltration Rate
The compost application rate did have an effect on bulk density and IR. Numerous studies have observed decreases in bulk density with compost incorporation [9,11,18,20] and with increasing compost rates [8]. For the certified compost, the 50% application rate resulted in higher IR compared to the 10% and 30% application rate. The U30 and C50 treatments resulted in the same IR (p < 0.05). The uncertified compost resembled a mulch with large pieces of woody debris present, while the certified compost was screened for finer particle size. The differences in particle sizes within the compost between the two sources could have cause the observed differences in IR. The IR values reported here are higher compared to other studies with compost incorporation in urban settings [11,13,18,19]. This field experiment also had better vegetation establishment compared to the studies mentioned above. It is possible that the strong vegetation establishment allowed for enhanced root growth and thus for a more rapid IR, as was also indicated in a previous study at this site [11,42].
5. Conclusions
The objective of this study was to determine the benefit of incorporating compost in disturbed soils for reducing runoff, improving water quality, and increasing biomass production. Tilling the soil may have been sufficient to loosen the soil and limit runoff, due to the lack of differences between treatments. Compost incorporation did not alter the sediment concentrations in runoff or dissolved nutrients and heavy metals. All water quality parameters measured were lower than similar studies incorporating compost in roadside soils. This may be due to the lower runoff volume and dense vegetation establishment observed in all treatment plots. The dense vegetation in the treatment plots could have led to higher water withdrawals and evapotranspiration during the growing season as well as improved soil structure from root growth. The strong vegetation establishment in the first month of the experiment may have also enhanced root channels in all treatments leading to the lack of differences in runoff quantity.
Certified compost did enhance biomass production, and higher rates of certified compost lead to more biomass production. The certified compost may have increase soil fertility leading to better vegetation establishment. The uncertified compost had a higher C/N ratio compared to the certified compost, which could have caused it to immobilize nutrients during vegetation establishment. Compost C/N ratio should be measured before application to make sure it falls within the ideal C/N rage for vegetation establishment. Federal and state regulations in the United States require soil to be vegetated prior to the end of construction, and compost incorporation prior to seeding has the potential to reduce the effects of compaction by decreasing the bulk density and increasing IR and vegetation establishment. The rate of vegetation establishment shortly after seeding may be an important factor in determining the effectiveness of compost incorporation. Sufficient vegetation establishment after soil disturbances may reduce the need for higher rates of compost or any compost at all, but compost clearly enhanced vegetation establishment and growth in this study. More experimentation is needed in different soils to develop standards for the use of tilling and tilling plus compost amendment on roadsides.
Author Contributions
Conceptualization, C.N.K., R.A.M. and J.L.H.; methodology, C.N.K., R.A.M. and J.L.H.; formal analysis, C.N.K.; investigation, C.N.K.; resources, R.A.M. and J.L.H.; data curation, C.N.K.; writing—original draft preparation, C.N.K.; writing—review and editing, R.A.M. and J.L.H.; supervision, R.A.M. and J.L.H.; project administration, R.A.M. and J.L.H.; funding acquisition, R.A.M. and J.L.H. All authors have read and agreed to the published version of the manuscript.
Funding
This research was funded by the North Carolina Department of Transportation, grant number RP 2019-06.
Data Availability Statement
The runoff data are available upon request from the corresponding author for all reasonable requests.
Acknowledgments
The authors appreciate the support of Adam Howard, Jamie Luther, Christopher Niewoehner, and Erin Rivers.
Conflicts of Interest
The authors declare no conflict of interest.
References
- Batey, T.; McKenzie, D.C. Soil compaction: Identification directly in the field. Soil Use Manag. 2006, 22, 123–131. [Google Scholar] [CrossRef]
- Olson, N.C.; Gulliver, J.S.; Nieber, J.L.; Kayhanian, M. Remediation to improve infiltration into compact soils. J. Environ. Manag. 2013, 117, 85–95. [Google Scholar] [CrossRef] [PubMed]
- Crogger, C.G. Potential compost benefits for restoration of soils disturbed by urban development. Compost Sci. Util. 2005, 13, 243–251. [Google Scholar] [CrossRef]
- Kranz, C.N.; McLaughlin, R.A.; Johnson, A.; Miller, G.; Heitman, J.L. The effects of compost incorporation on soil physical properties in urban soils—A concise review. J. Environ. Manag. 2020, 261, 110209. [Google Scholar] [CrossRef] [PubMed]
- Craul, P.J. Urban Soils: An Overview and Their Future in Landscape Below Ground; Wason, G.W., Neely, D., Eds.; International Society of Arboriculture: Savoy, IL, USA, 1994. [Google Scholar]
- Schafer-Landefeld, L.; Brandhuber, R.; Fenner, S.; Koch, H.-J.; Stockfisch, N. Effects of agricultural machinery with high axle load on soil properties of normally managed fields. Soil Tillage Res. 2004, 75, 75–86. [Google Scholar] [CrossRef]
- Shestak, C.J.; Busse, M.D. Compaction alters physical but not biological indices of soil health. Soil Sci. Soc. Am. J. 2005, 69, 236–246. [Google Scholar] [CrossRef] [Green Version]
- Agassi, M.; Hadas, A.; Benyamini, Y.; Levy, G.J.; Kautsky, L.; Avrahamov, L.; Zhevelev, H. Mulching effects of composted MSW on water percolation and compost degradation rate. Compost Sci. Util. 1998, 6, 34–41. [Google Scholar] [CrossRef]
- Crogger, C.; Hummel, R.; Hart, J.; Bary, A. Soil and redosier dogwood response to incorporated and surface-applied compost. Hortscience 2008, 43, 2143–2150. [Google Scholar] [CrossRef] [Green Version]
- Logsdon, S.D.; Sauer, P.A.; Shipitalo, M.J. Compost improves urban soil and water quality. J. Water Resour. Prot. 2017, 9, 345–357. [Google Scholar] [CrossRef] [Green Version]
- Mohammadshirazi, F.; McLaughlin, R.A.; Heitman, J.L.; Brown, V.K. A multi-year study of tillage and amendment effects on compacted soils. J. Environ. Manag. 2017, 203, 533–541. [Google Scholar] [CrossRef]
- Evanylo, G.K.; Porta, S.N.; Li, J.; Shan, D.; Goatley, J.M.; Maguire, R. Compost practices for improving soil properties and turfgrass establishment and quality on a disturbed urban soil. Compost Sci. Util. 2016, 24, 136–145. [Google Scholar] [CrossRef]
- Alshraah, S.H. Soil Tillage for Stormwater Infiltration: Effects of Amendments and Vegetation Type over Time. Ph.D. Thesis, North Carolina State University, Raleigh, NC, USA, 2020. [Google Scholar]
- Violin, C.R.; Cada, P.; Sudduth, E.B.; Hassett, B.A.; Penrose, D.L.; Bernhardt, E.S. Effects of urbanization and urban stream restoration on the physical and biological structure of stream ecosystems. Ecol. Appl. 2011, 21, 1932–1949. [Google Scholar] [CrossRef] [PubMed]
- Bartens, J.; Day, S.D.; Harris, J.R.; Dove, J.E.; Wynn, T.M. Can urban tree roots improve infiltration through compacted subsoils for stormwater management? J. Environ. Qual. 2008, 37, 2048–2057. [Google Scholar] [CrossRef] [PubMed] [Green Version]
- Hinman, C. Bioretention Soil Mix Review and Recommendations for Western Washington; Washington State University: Pullman, WA, USA, 2009; Available online: http://citeseerx.ist.psu.edu/viewdoc/download?doi=10.1.1.431.4124&rep=rep1&type=pdf (accessed on 7 November 2021).
- Pitt, R.; Lantrip, J.; Harrison, R.; Henry, C.L.; Xue, D. Infiltration through Disturbed Urban Soils and Compost-Amended Soil Effects on Runoff Quality and Quantity; USEPA Report 600/R-00/016, NTIS PB2000-102012; Government Printing Office: Washington, DC, USA, 1999.
- Mohammadshirazi, F.; Brown, V.K.; Heitman, J.L.; McLaughlin, R.A. Effects of tillage and compost amendment on infiltration in compacted soils. J. Soil Water Conserv. 2016, 71, 443–449. [Google Scholar] [CrossRef] [Green Version]
- Rivers, E.N.; Heitman, J.L.; Mclaughlin, R.A.; Howard, A.M. Reducing roadside runoff: Tillage and compost improve stormwater mitigation in urban soils. J. Environ. Manag. 2021, 280, 111731. [Google Scholar] [CrossRef]
- Curtis, M.J.; Claassen, V.P. Regenerating topsoil functionality in four drastically disturbed soil types by compost incorporation. Restor. Ecol. 2009, 17, 24–32. [Google Scholar] [CrossRef]
- Chahal, M.K.; Shi, Z.; Flury, M. Nutrient leaching and copper speciation in compost-amended bioretention systems. Sci. Total Environ. 2016, 556, 302–309. [Google Scholar] [CrossRef] [Green Version]
- Mullane, J.M.; Flury, M.; Iqbal, H.; Freeze, P.M.; Hinman, C. Intermittent rainstorm causes pulses of nitrogen, phosphorus, and copper in leachate from compost in bioretention systems. Sci. Total Environ. 2015, 537, 294–303. [Google Scholar] [CrossRef] [Green Version]
- Tirpak, R.; Nabiul Afrooz, A.R.M.; Winston, R.J.; Valenca, R.; Schiff, K.; Mohanty, S.K. Conventional and amended bioretention soil media for targeted pollutant treatment: A critical review to guide the state of practice. Water Res. 2021, 189, 116648. [Google Scholar] [CrossRef]
- USDA; NRCS. Web Soil Survey. 2016. Available online: https://websoilsurvey.sc.egov.usda.gov/ (accessed on 3 June 2020).
- NCDOT. Erosion and Sediment Control Guidelines. 2015. Available online: https://connect.ncdot.gov/resources/hydro/HSPDocuments/NCDOT_ESC_Manual_2015_.pdf (accessed on 12 April 2021).
- Gee, G.W.; Bauder, J.W. Particle-size analysis. In Methods of Soil Analysis: Part 1 Physical and Mineralogical Methods, 2nd ed.; Klute, A., Ed.; SSSA: Madison, WI, USA, 1986. [Google Scholar]
- Clesceri, L.S.; Greenberg, A.E.; Eaton, A.D. Standard Methods for the Examination of Water and Wastewater, 20th ed.; American Public Health Association, American Water Works Association, Water Environmental Federation: Washington, DC, USA, 1998; pp. 3-37–3-43. [Google Scholar]
- O’Dell, J.W. Method 180.1: Determination of Turbidity by Nephelometry; United Stated Environmental Protection Agency: Washington, DC, USA, 1993. Available online: https://www.epa.gov/sites/production/files/2015-08/documents/method_180-1_1993.pdf (accessed on 10 April 2021).
- Rice, E.W.; Baird, R.B.; Eaton, A.D.; Clesceri, L.S. Standard Methods for the Examination of Water and Wastewater; American Public Health Association: Washington, DC, USA, 2012; p. 541. [Google Scholar]
- Reynolds, W.D.; Elrick, D.E.; Youngs, E.G. Single-ring and double-ring or concentric-ring infiltrometers. In Methods of Soil Analysis: Part 4 Physical Methods; Dane, J.H., Topp, G.C., Eds.; SSSA: Madison, WI, USA, 2002. [Google Scholar]
- Reynolds, W.D.; Elrick, D.E. Ponded infiltration from a single ring: I. analysis of steady flow. Soil Sci. Soc. Am. J. 1990, 54, 1233–1241. [Google Scholar] [CrossRef]
- R Core Team. R: A Language and Environment for Statistical Computing; R Foundation for Statistical Computing: Vienna, Austria, 2021. [Google Scholar]
- Zuur, A.; Ieno, E.N.; Walker, N.; Saveliev, A.A.; Smith, G.M. Mixed Effects Models and Extensions in Ecology with R; Springer Science & Business Media: New York, NY, USA, 2009. [Google Scholar]
- Faucette, L.B.; Jordan, C.F.; Risse, L.M.; Cabrera, M.; Colman, D.C.; West, L.T. Evaluation of stormwater from compost and conventional erosion control practices in construction activities. J. Soil Water Conserv. 2005, 60, 288–297. [Google Scholar]
- U.S. EPA. Water: Monitoring and Assessment: 5.5 Turbidity; U.S. EPA: Washington, DC, USA, 2012.
- Surface Water Quality Standards, Criteria, and In-Stream Target Values; North Carolina Division of Water Resources: Raleigh, NC, USA,, 2019. Available online: https://deq.nc.gov/documents/nc-stdstable-06102019 (accessed on 29 May 2021).
- McLaughlin, R.A.; Brown, T.T. Performance of erosion control materials and polyacrylamide under field and rainfall simulator conditions. J. Am. Water Res. Assoc. 2006, 42, 675–684. [Google Scholar] [CrossRef]
- Kayhanian, M.; Suverkropp, C.; Ruby, A.; Tsay, K. Characterization and prediction of highway runoff constituent event mean concentration. J. Environ. Manag. 2007, 85, 279–295. [Google Scholar] [CrossRef] [PubMed]
- Winston, R.J.; Lauffer, M.S.; Narayanaswamy, K.; McDaniel, A.H.; Lipscomb, B.S.; Nice, A.J.; Hunt, W.F. Comparing bridge deck runoff and stormwater control measure quality in North Carolina. J. Environ. Eng. 2015, 141, 04014045. [Google Scholar] [CrossRef]
- Wissler, A.D.; Hunt, W.F.; McLaughlin, R.A. Hydrologic and water quality performance of two aging and unmaintained dry detention basins receiving highway stormwater runoff. J. Environ. Manag. 2020, 255, 109853. [Google Scholar] [CrossRef]
- Wortman, C.S.; Shapiro, C.A.; Tarkalson, D.D. Composting Manure and Other Organic Materials; University of Nebraska Lincoln Extension: Lincoln, NE, USA, 2006; Available online: https://extensionpublications.unl.edu/assets/pdf/g1315.pdf (accessed on 4 January 2022).
- Haynes, M.A.; McLaughlin, R.A.; Heitman, J.L. Comparison of methods to remediate compacted soils for infiltration and vegetative establishment. Open J. Soil Sci. 2013, 3, 225–234. [Google Scholar] [CrossRef] [Green Version]
Figure 1.
(a) Top view of site configuration showing connection between plot area and collection tank; (b) Plan view of site configuration before treatment application looking upslope.
Figure 1.
(a) Top view of site configuration showing connection between plot area and collection tank; (b) Plan view of site configuration before treatment application looking upslope.

Figure 2.
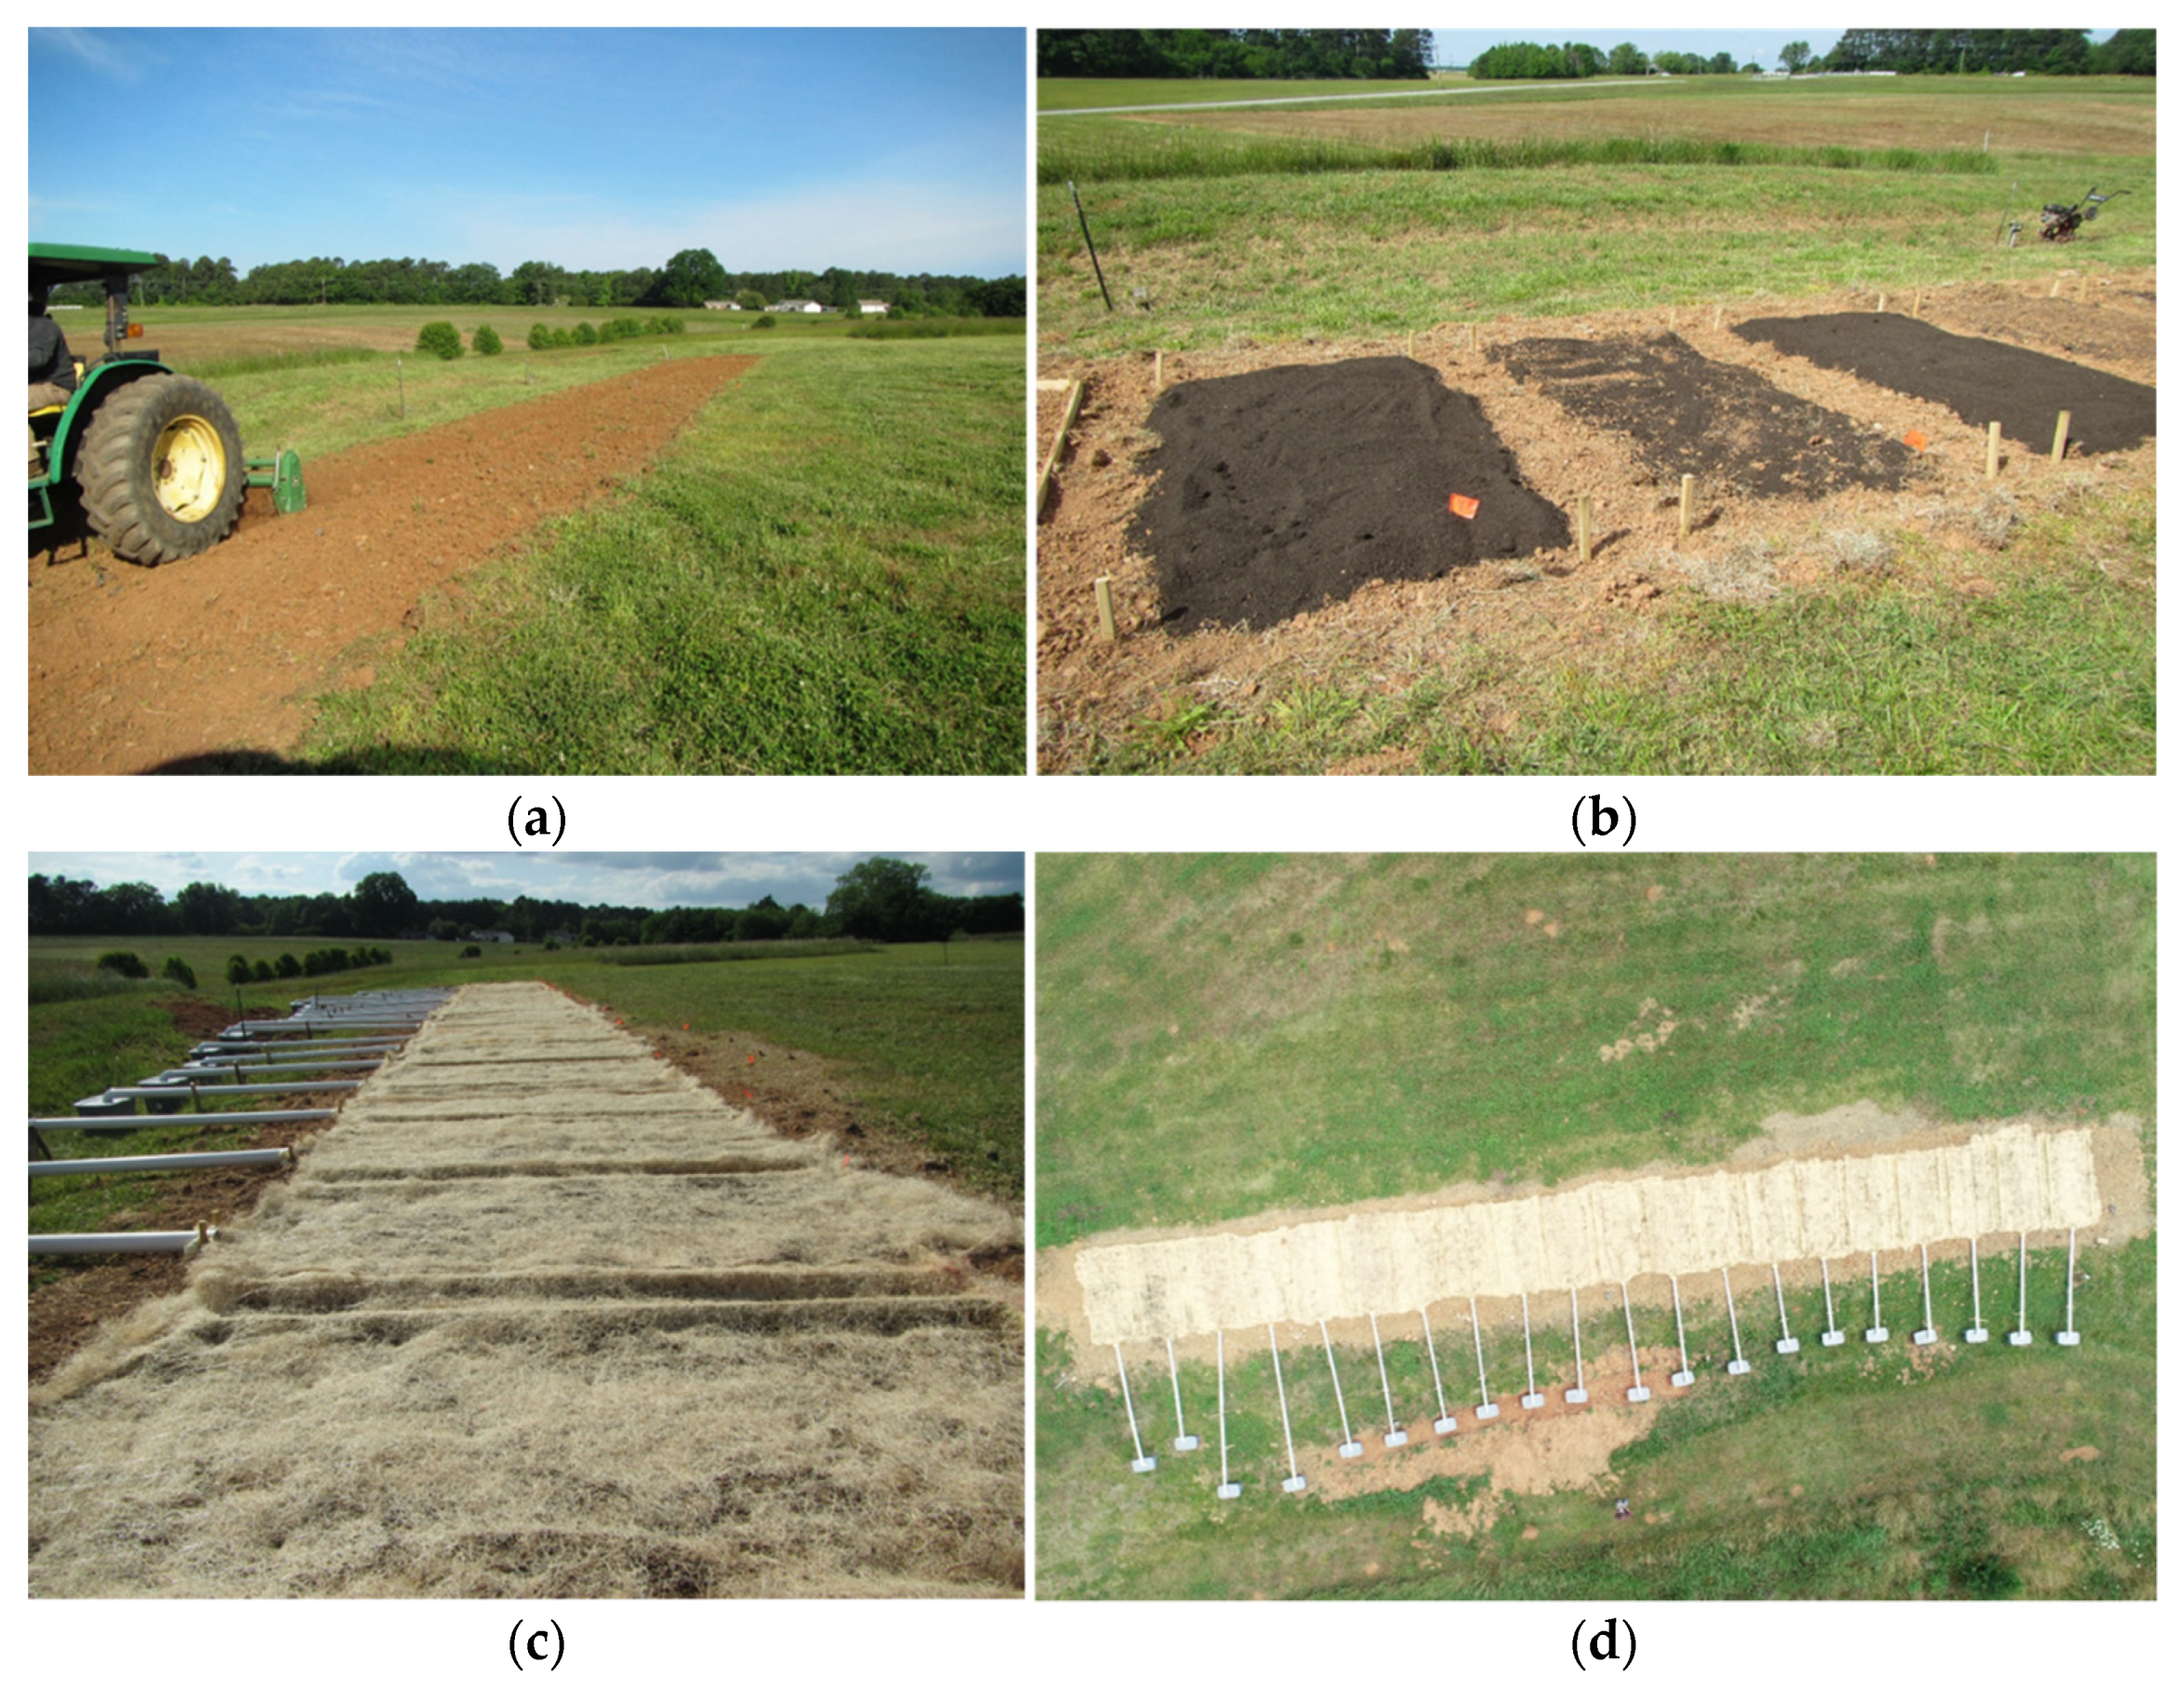
Site preparation evolution: (a) tilling treatment area; (b) compost addition to plots. From left to right: 50%, 10%, and 30% compost by volume; (c) side view of finished site preparation; (d) top view of finished site preparation.
Figure 2.
Site preparation evolution: (a) tilling treatment area; (b) compost addition to plots. From left to right: 50%, 10%, and 30% compost by volume; (c) side view of finished site preparation; (d) top view of finished site preparation.

Figure 3.
The symbols indicate the average runoff for each treatment from storm dates (mm/dd). The grey bars indicate the rainfall that occurred from each storm. Control: no compost. C10: 10% certified compost. U30: 30% uncertified compost. C30: 30% certified compost. C50: 50% certified compost.
Figure 3.
The symbols indicate the average runoff for each treatment from storm dates (mm/dd). The grey bars indicate the rainfall that occurred from each storm. Control: no compost. C10: 10% certified compost. U30: 30% uncertified compost. C30: 30% certified compost. C50: 50% certified compost.

Figure 4.
(top) Total suspended solids (TSS); (bottom) turbidity from runoff samples by storm date (mm/dd). Error bars ± 1SE, n = 4. Letters indicate significant differences between treatments by date (Tukey’s HSD Test, p < 0.05).
Figure 4.
(top) Total suspended solids (TSS); (bottom) turbidity from runoff samples by storm date (mm/dd). Error bars ± 1SE, n = 4. Letters indicate significant differences between treatments by date (Tukey’s HSD Test, p < 0.05).

Figure 5.
Nutrient and heavy metal export from plots for the first three storms. Error bars ± 1SE, n = 4. Letters indicate significant differences between treatments by date (Tukey’s HSD Test, p < 0.05).
Figure 5.
Nutrient and heavy metal export from plots for the first three storms. Error bars ± 1SE, n = 4. Letters indicate significant differences between treatments by date (Tukey’s HSD Test, p < 0.05).

Figure 6.
Average biomass (cut 10 cm above the soil) for treatments by days after seeding (51, 71, 96, and 138 days, respectively). Error bars ± 1SE, n = 8. Letters indicate significant differences between treatments by event (Tukey’s HSD Test, p < 0.05).
Figure 6.
Average biomass (cut 10 cm above the soil) for treatments by days after seeding (51, 71, 96, and 138 days, respectively). Error bars ± 1SE, n = 8. Letters indicate significant differences between treatments by event (Tukey’s HSD Test, p < 0.05).


Table 1.
Nutrient analysis of certified compost, uncertified compost, and the subsoil.
| Property | Certified Compost | Uncertified Compost | Subsoil |
|---|---|---|---|
| Organic Matter (%) | 26.7 | 79.7 | 1.6 |
| Carbon (%) | 17.7 | 30.4 | 0.7 |
| Total Nitrogen (%) | 1.45 | 1.64 | 0.06 |
| C/N Ratio | 12.2 | 18.5 | 11.7 |
| Total Phosphorus (%) | 0.32 | 0.19 | 0.07 |
| Total Potassium (%) | 0.37 | 0.48 | 0.16 |
| pH | 6.7 | 6.3 | 4.4 |
Table 2.
Water quality constituents (±SE) in runoff from control, certified 10% compost (C10), uncertified 30% compost (U30), certified 30% compost (C30), and certified 50% compost (C50) in plots during sampled storm events. All compost is percent by volume. N.D. is no detection. Detection limit was <0.1 mg L−1 for dissolved nutrients and <1.0 μg L−1 for dissolved metals. n = 4. Letters indicate significant differences between treatments (Tukey’s HSD Test, p < 0.05).
| PO43− | NO3− | NH4+ | Zn | Cu | |
|---|---|---|---|---|---|
| mg L−1 | ug L−1 | ||||
| Event 1: 22 May | |||||
| Control | 0.011 (0.002) | N.D. | 0.212 (0.06) | 17.040 (0.014) | N.D. |
| C10 | 0.012 (0.001) | N.D. | 0.278 (0.065) | 3.030 (0.000) | N.D. |
| U30 | 0.032 (0.001) | N.D. | 0.231 (0.061) | 6.730 (0.002) | N.D. |
| C30 | 0.050 (0.022) | N.D. | 0.216 (0.052) | 4.800 (0.002) | N.D. |
| C50 | 0.020 (0.002) | N.D. | 0.280 (0.119) | 11.990 (0.006) | N.D. |
| Event 2: 1 June | |||||
| Control | 0.046 (0.005) | 0.167 (0.009) | 0.488 (0.032) | 20.610 (0.002) | 4.350 (0.0357) |
| C10 | 0.047 (0.004) | 0.182 (0.011) | 0.606 (0.042) | 26.057 (0.004) | 4.500 (0.692) |
| U30 | 0.061 (0.009) | 0.216 (0.026) | 0.620 (0.038) | 21.720 (0.002) | 4.725 (0.562) |
| C30 | 0.151 (0.082) | 0.235 (0.059) | 0.883 (0.332) | 27.240 (0.010) | 8.325 (3.517) |
| C50 | 0.067 (0.034) | 0.257 (0.066) | 0.853 (0.349) | 21.970 (0.003) | 5.225 (1.321) |
| Event 3: 13 June | |||||
| Control | 0.117 (0.037) | 0.107 (0.013) a | 0.846 (0.193) | 27.057 (0.003) | 2.000 (0.227) |
| C10 | 0.076 (0.032) | 0.160 (0.015) a | 0.770 (0.126) | 16.380 (0.002) | 1.727 (0.407) |
| U30 | 0.167 (0.100) | 0.181 (0.024) b | 0.913 (0.229) | 22.057 (0.004) | 2.625 (0.359) |
| C30 | 0.329 (0.252) | 0.133 (0.003) a | 1.933 (1.267) | 26.550 (0.006) | 4.827 (3.051) |
| C50 | 0.084 (0.047) | 0.203 (0.051) a | 0.879 (0.301) | 22.480 (0.003) | 2.450 (0.798) |
Table 3.
Total biomass from all four sample dates (±SE), n = 16, and water content (±SE), bulk density (±SE), and infiltration rate (IR) (±SE) of treatment plots 11 months after establishment, n = 8. Letters indicate significant differences between treatments (Tukey’s HSD Test, p < 0.05).
Table 3.
Total biomass from all four sample dates (±SE), n = 16, and water content (±SE), bulk density (±SE), and infiltration rate (IR) (±SE) of treatment plots 11 months after establishment, n = 8. Letters indicate significant differences between treatments (Tukey’s HSD Test, p < 0.05).
| Treatment | Total Biomass (kg ha−1) | Water Content (%) | Bulk Density (g cm−3) | IR (cm h−1) |
|---|---|---|---|---|
| Control | 20,241 (247) d | 10.2 (0.3) b | 1.35 (0.03) a | 27.3 (4.2) c |
| C10 | 37,522 (507) c | 16.0 (3.8) a | 1.19 (0.04) b | 36.0 (2.7) b |
| U30 | 19,175 (284) d | 16.3 (0.9) a | 1.03 (0.04) c | 67.9 (13.5) a |
| C30 | 46,044 (415) b | 18.8 (0.7) a | 0.96 (0.03) c | 40.9 (4.7) b |
| C50 | 49,370 (545) a | 21.2 (1.0) a | 0.88 (0.03) d | 64.1 (8.4) a |
Publisher’s Note: MDPI stays neutral with regard to jurisdictional claims in published maps and institutional affiliations. |
© 2022 by the authors. Licensee MDPI, Basel, Switzerland. This article is an open access article distributed under the terms and conditions of the Creative Commons Attribution (CC BY) license (https://creativecommons.org/licenses/by/4.0/).
Share and Cite
MDPI and ACS Style
Kranz, C.N.; McLaughlin, R.A.; Heitman, J.L. Characterizing Compost Rate Effects on Stormwater Runoff and Vegetation Establishment. Water 2022, 14, 696. https://doi.org/10.3390/w14050696
AMA Style
Kranz CN, McLaughlin RA, Heitman JL. Characterizing Compost Rate Effects on Stormwater Runoff and Vegetation Establishment. Water. 2022; 14(5):696. https://doi.org/10.3390/w14050696
Chicago/Turabian StyleKranz, Christina N., Richard A. McLaughlin, and Joshua L. Heitman. 2022. "Characterizing Compost Rate Effects on Stormwater Runoff and Vegetation Establishment" Water 14, no. 5: 696. https://doi.org/10.3390/w14050696
Note that from the first issue of 2016, this journal uses article numbers instead of page numbers. See further details here.