
Future Changes in the Surface Water Balance over Western Canada Using the CanESM5 (CMIP6) Ensemble for the Shared Socioeconomic Pathways 5 Scenario


1
Prairie Adaptation Research Collaborative, University of Regina, Regina, SK S4S 0A2, Canada
2
International Arctic Research Center, Fairbanks, AK 99775, USA
3
Department of Geography and Environmental Studies, University of Regina, Regina, SK S4S 0A2, Canada
*
Author to whom correspondence should be addressed.
Water 2022, 14(5), 691; https://doi.org/10.3390/w14050691
Submission received: 12 January 2022
/
Revised: 17 February 2022
/
Accepted: 19 February 2022
/
Published: 22 February 2022
(This article belongs to the Section Water and Climate Change)
Abstract
:The Prairie provinces of Canada have about 80% of Canada’s agricultural land and contribute to more than 90% of the nation’s wheat and canola production. A future change in the surface water balance over this region could seriously affect Canada’s agro-economy. In this study, we examined 25 ensemble members of historical (1975 to 2005), near future (2021–2050), far future (2050–2080), and end of the century (2080–2100) simulations of the Canadian Earth System Model version 5 (CanESM5) from the Coupled Model Intercomparison Project Phase 6 (CMIP6). A comprehensive analysis of a new Net Water Balance Index (NWBI) indicates an increased growing season dryness despite increased total precipitation over the Prairie provinces. Evapotranspiration increases by 100–300 mm with a 10–20% increase in moisture loss due to transpiration. Total evaporation decreases by 15–20% as the fractional contribution of evaporation from soil decreases by 20–25%. Total evaporation from vegetation increases by 10–15%. These changes in the surface water balance suggest enhanced plant productivity when soil moisture is sufficient, but evaporative water loss that exceeds precipitation in most years.
1. Introduction
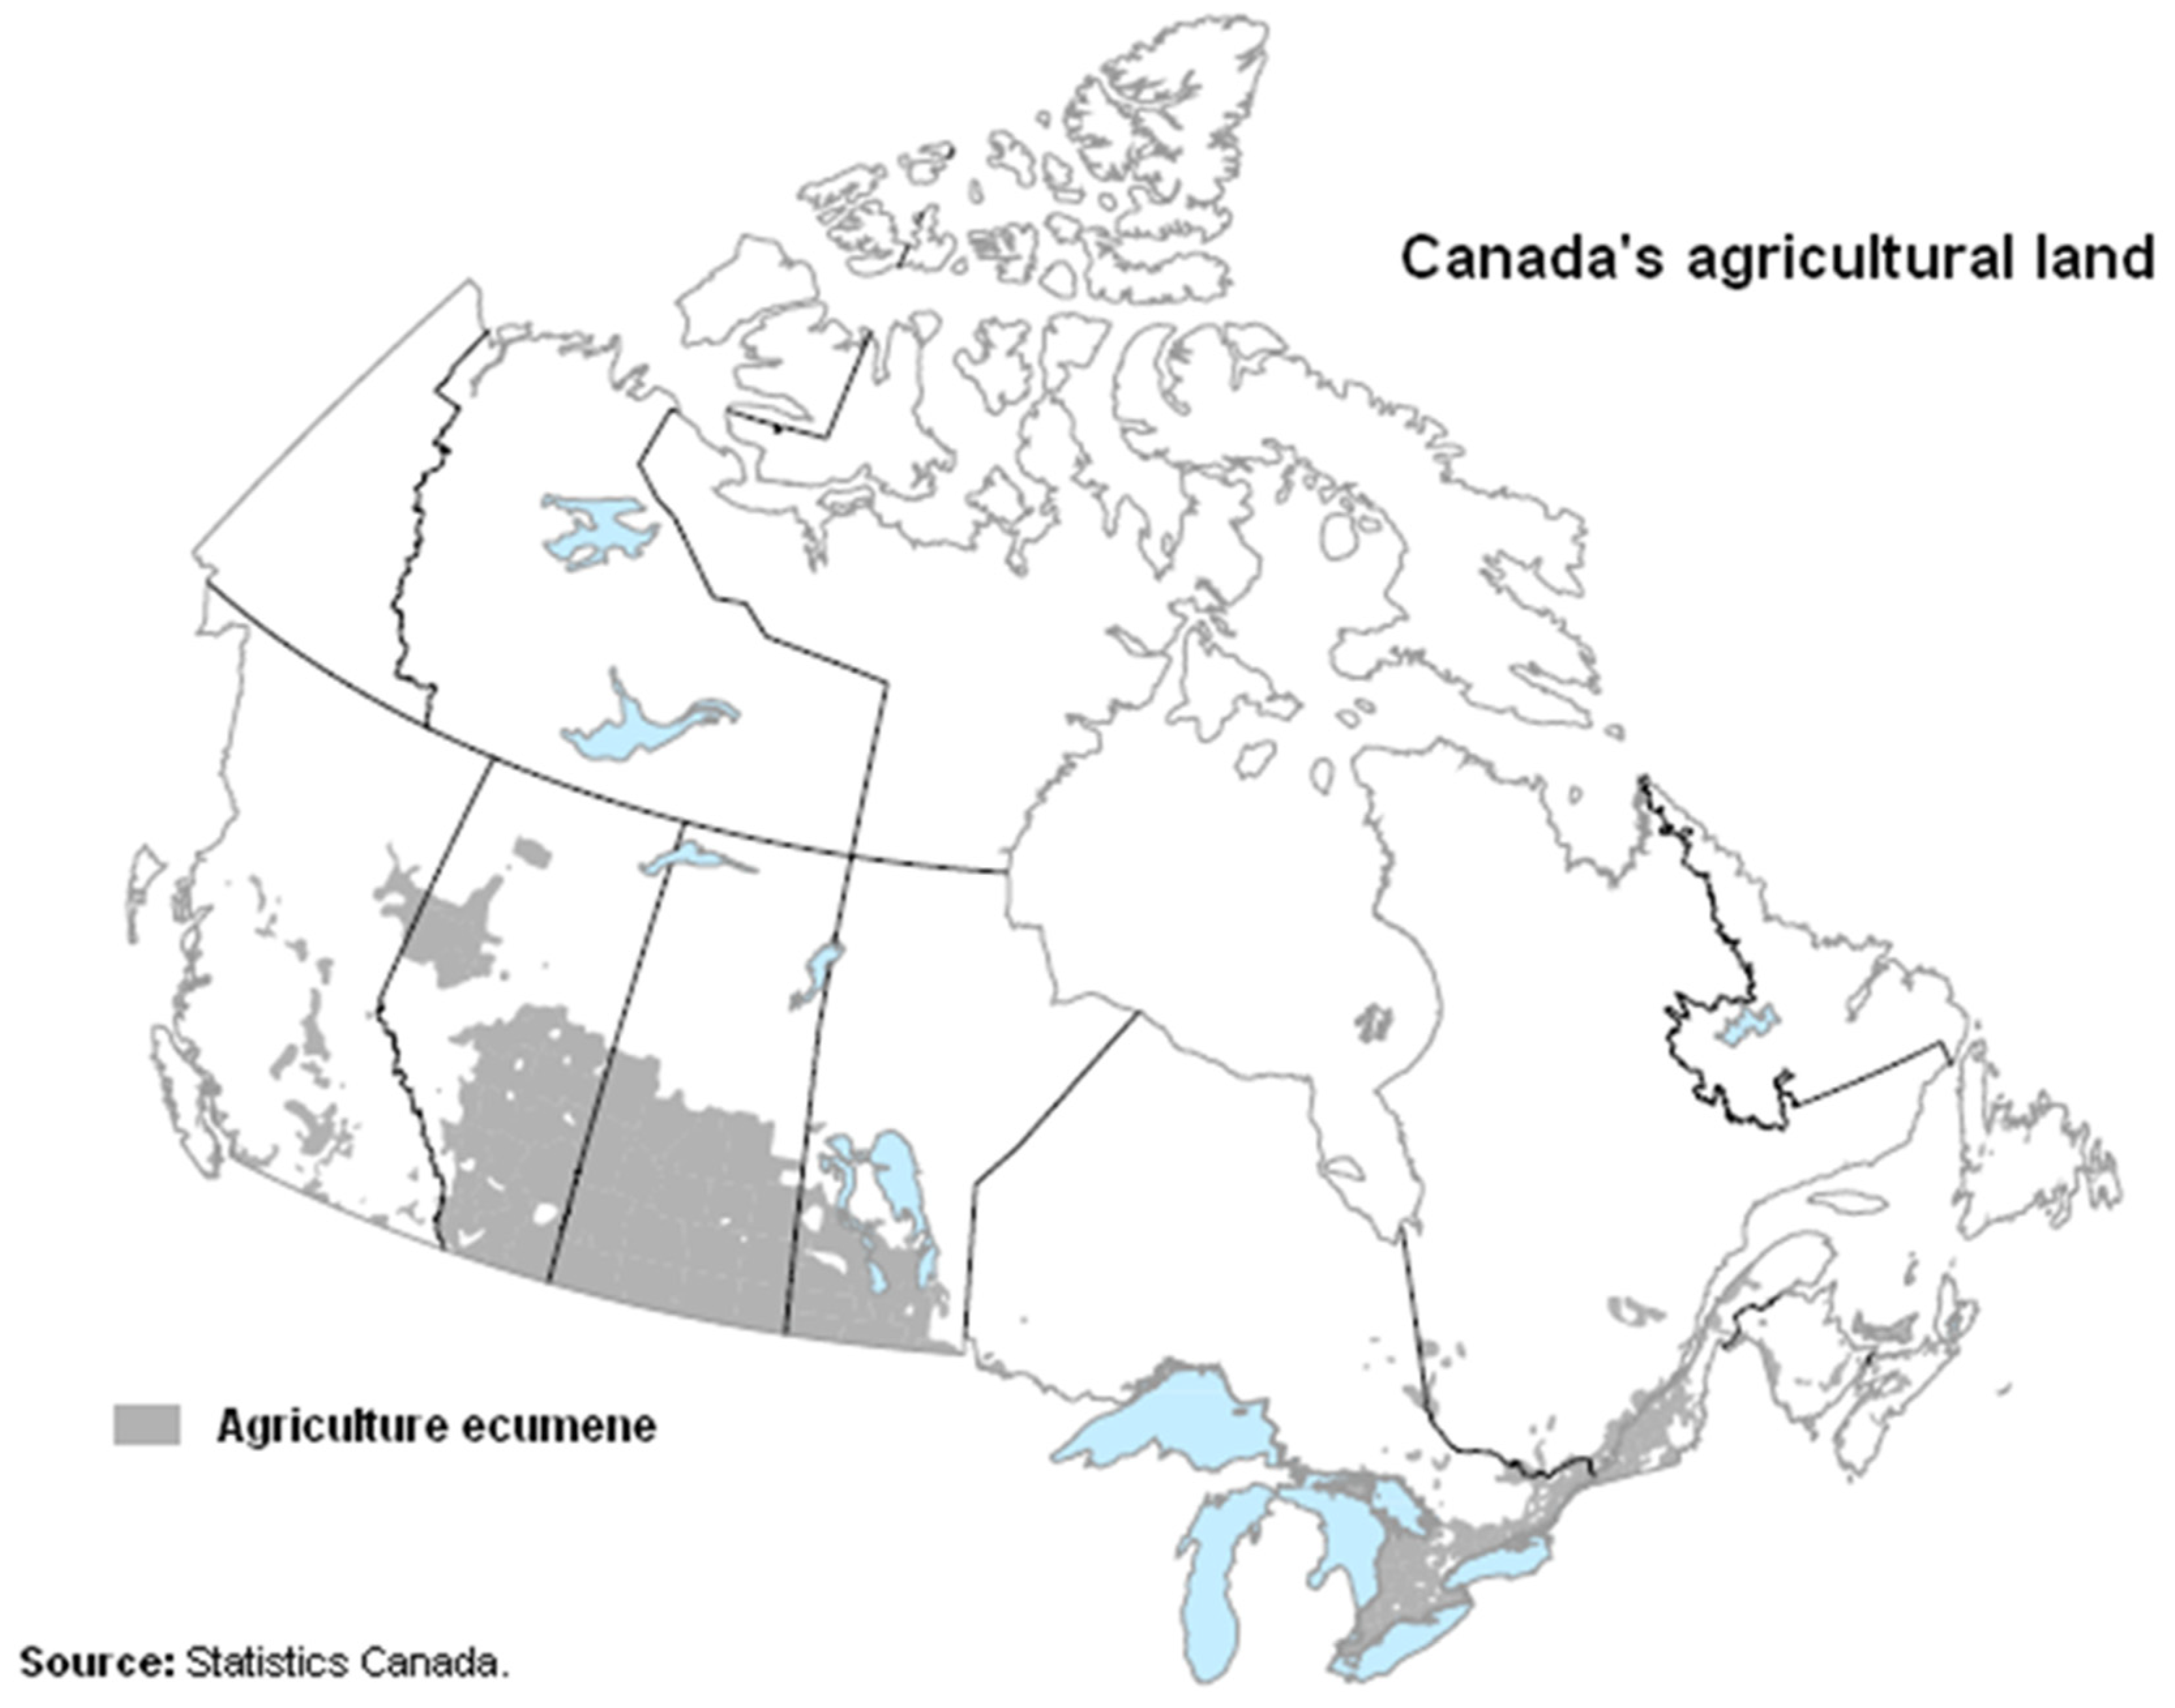
Climate change may have a severe effect on food production at mid and high latitudes (FAO, 2016), including Canada where more than 80% of the agricultural land is located in the Prairie Provinces (Figure 1) at latitudes of 49° to 54° N [1]. Considerable technological innovation and adaptation of farming methods transferred from more temperate climates have produced a commercially viable agricultural industry in this continental interior on the northern margin of the world’s agricultural ecumene. Canada is the world’s fifth-largest exporter of agricultural products. According to Farm Credit Canada (2019), it is among the four largest exporters of wheat and the world’s largest exporter of canola for human consumption. More than 90% of Canada’s wheat and canola production is in the Prairies provinces of Alberta, Saskatchewan, and Manitoba [1].
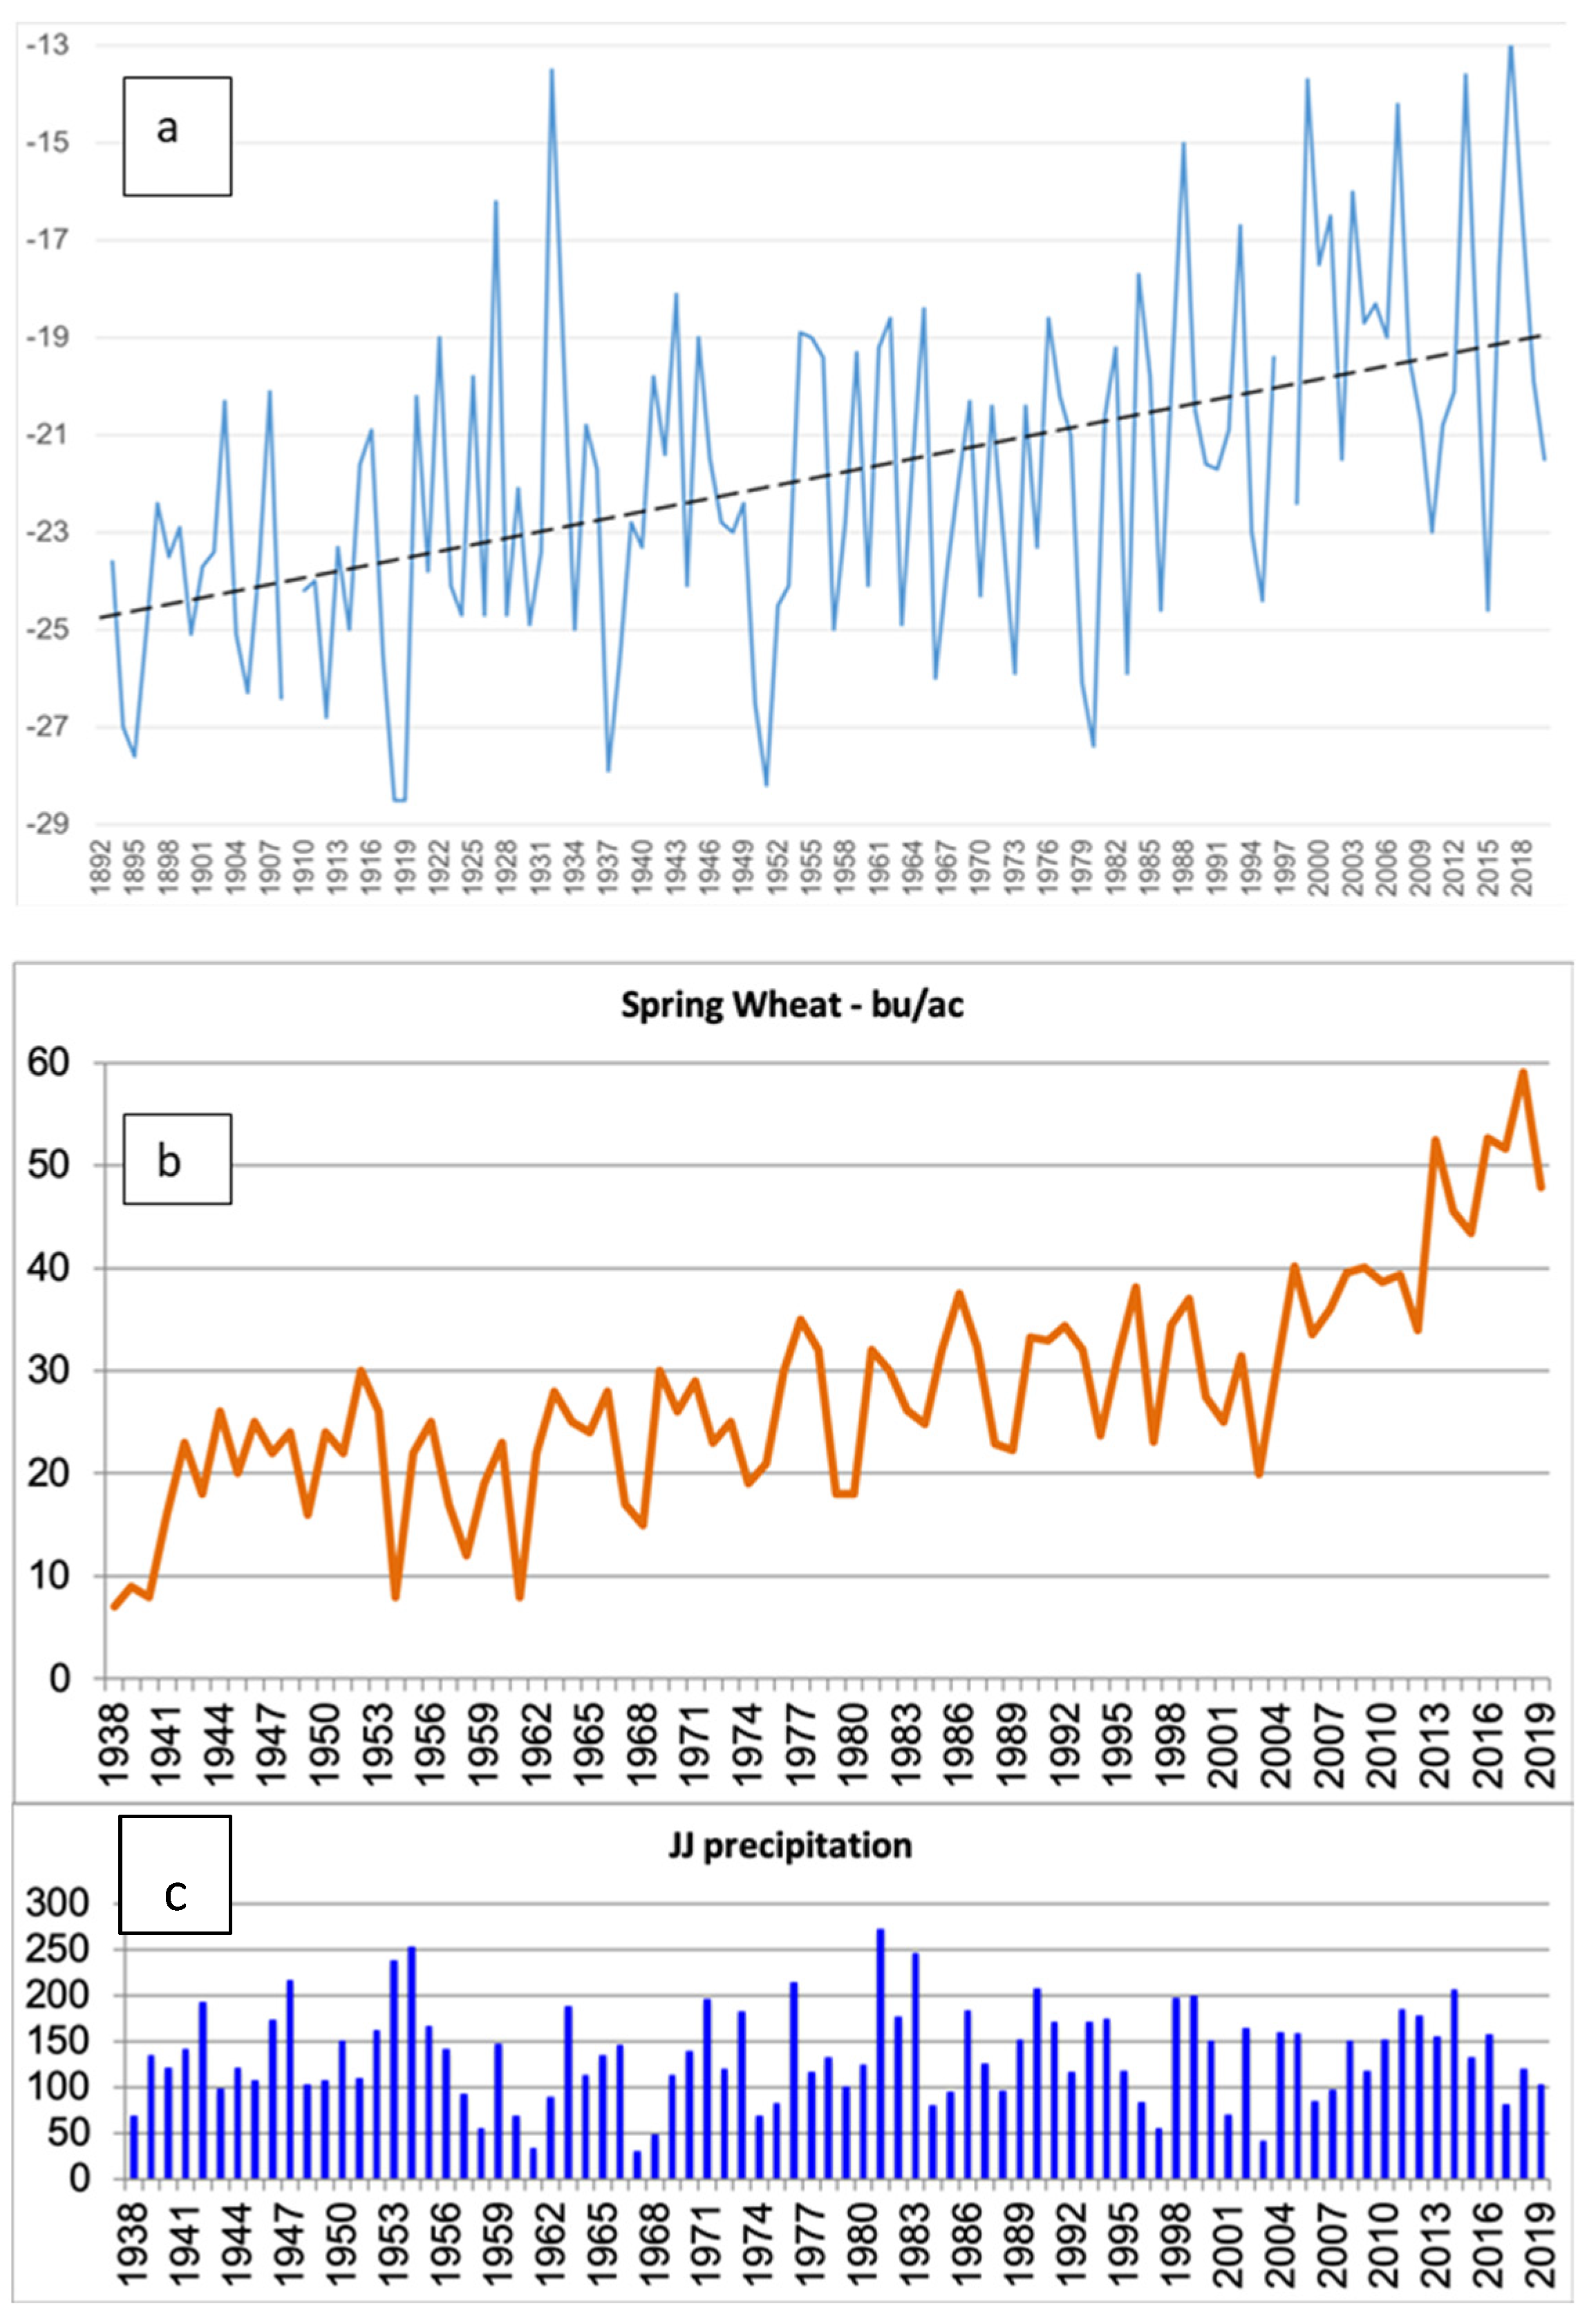
In recent decades, the rise in temperatures in Canada’s western interior has been 2–3 times the rate of global warming [2,3]. The strongest indicator of global climate change in this region is a dramatic increase in daily winter minimum temperature (Figure 2a). While there are adverse impacts of a warming winter (i.e., survival of new pests and disease vectors and less water stored as snow), a shorter cold season results in a longer growing season. The start/end of the growing season is defined in terms of six consecutive days with a daily mean temperature above/below 5° C. With a 10–15-day increase in the length of the growing season between 1948 and 2016, and higher spring and summer temperatures, there were about 95 more growing degree-days [4]. These trends in agro-climatic variables have coincided with an increase in crop yields in recent decades, although improved farming practices likely account for some of this higher crop productivity [5]. When [6,7,8] forced a crop model with climate projections, they found a significant mid- to late-century increase in wheat yields, but an equally large decline in yields of canola, which is more sensitive to heat and moisture stress than wheat.
Figure 2 illustrates the climate sensitivity of crop production in western Canada. It is a time series of the annual yield of spring wheat (bu/ac) from 1938 to 2019 in the Rural Municipality of Indian Head (Saskatchewan) and data from the weather station located at the town of Indian Head. Wheat yield has been trending upward, particularly in the last two decades. An increase of almost 6 °C in mean daily winter minimum temperature (Figure 2a) has translated into an approximately 15-day increase in the length of the frost-free season. The inter-annual variability in yield is correlated (r = 0.34; p < 0.01) with precipitation anomalies in the main growing season months of June and July. In Figure 2b, years of reduced wheat yield (e.g., 1961, 1988, and 2003) correspond to low total June–July precipitation in Figure 2c. Too much precipitation also limits crop production when low-lying farmland is underwater (e.g., 1953, 2014). Although crop germination and early stages of growth depend on over-winter soil water storage and spring snowmelt water, early summer rain is critical.
While the modeling and observation of weather and crop productivity in the Canadian Prairies suggest that crop yield and diversity are becoming less constrained by a short growing season, the availability of soil moisture is the ultimate constraint on rainfed crop production in the sub-humid northern Great Plains. Taking advantage of a warmer climate and the potential for higher crop yields will require adaptations of farming practice and technology to withstand drier conditions in mid to late summer and periodic droughts of greater severity than in the past.
Future changes in precipitation and evapotranspiration over western Canada depend on various factors and processes, which include large-scale atmosphere circulation, rising temperatures, shifts in mid-latitude storm tracks, teleconnections with sea surface temperature oscillations, and Arctic amplification. Previous studies have suggested an increase in precipitation and evapotranspiration in the Mackenzie and Saskatchewan River Basins of western Canada at the end of the century [9]. Climate model projections for this region consistently indicate decreased summer precipitation and a shorter winter and thus longer annual period of net positive evapotranspiration [3,10].
In this study, we analyzed future changes in precipitation, evaporation, and transpiration to understand the implications of these changes for future crop production in western Canada under the SSP 585 scenario of CMIP6. There has been no published research on the changes in the precipitation and evapotranspiration pattern in the warmer regime of the future scenario periods using the newly available CMIP6 results. We closely examine climate projections for the Canadian prairies using an array of ensemble members of CanESM5 from the CMIP6 SSP585 simulation. We analyze changes in the precipitation and evapotranspiration pattern over the Prairies and the rest of western Canada.
2. Methodology
The four provinces of western Canada—British Columbia, Alberta, Saskatchewan, and Manitoba—extend over 2.9 million sq km, or ~29% of Canada’s land area (Figure 1). In this study, we investigated the climatological changes in the water balance of this region at three periods in the future. We examined future and historical simulations from the Coupled Model Intercomparison Project (CMIP) Phase 6 [11], and specifically 25 ensemble members (r1i1p1f1 to r25i1p1f1) of the Canadian Earth System Model version 5 (CanESM5) [12]. The ensemble members have the same physics and same forcings but different initial conditions. Historical simulations are forced with various natural and anthropogenic external factors. CMIP6 model simulations use various future scenarios known as Shared Socio-Economic Pathways (SSPs) based on combined trends of social, economic, and environmental development [13,14] and radiative forcing similar to Representative Concentration Pathways (RCPs). This study focused on the SSP 585 scenario, which corresponds to RCP8.5 (i.e., radiative forcing of 8.5 Wm−2 by 2100). We examined several parameters including total amounts of precipitation, evaporation, transpiration, and evaporation from soil and vegetation. Monthly outputs of these variables were downloaded from the CMIP6 archive (esgf-node.llnl.gov, accessed on 12 November 2020). All the results give changes in the components of surface water balance for the warm season (April–October) and for four time slices: historical (1975 to 2005), near future (2021 to 2050), far future (2051 to 2080), and end of the century (2081 to 2100).
We defined a new Net Water Balance Index (NWBI) based on several hydroclimatic parameters to estimate and express the degree of dryness or wetness over various time intervals. The index was calculated by subtracting the total loss due to evapotranspiration (mm) from the total precipitation (mm) and then normalizing it by dividing it by the standard deviation of precipitation (mm).
Total evapotranspiration is the sum of transpiration, evaporation from soil and water bodies, and evaporation from vegetation. The advantage of the new index over the existing indices is that it does not require the calculation of potential evapotranspiration from radiation, daylight hours, minimum temperatures, and maximum temperatures. The evaporation and precipitation output from a climate model could be directly used to obtain an estimation of moisture loss. However, the omittance of the potential evaporation term could result in an underestimate of the effect of the daily temperature change on the dryness. The index used in this study is more comparable to SPI than to SPEI. There have been many studies using either SPI or SPEI to investigate the drought conditions over Canada in the future periods. Additionally, the index relies on an evapotranspiration algorithm embedded in the climate model, as opposed to a calculation based on data derived from the model for the variables in an ET index.
To enhance the statistical robustness of the results, a multi-ensemble mean method was employed. A mean of the multiple ensemble members from the same model offsets uncertainty due to the internal dynamics of the model.
3. Results
The 25 ensemble members start from different initial conditions but have the same boundary forcing and hence exhibit variability among themselves due primarily to the differences in internal model dynamics (Figure 3). In the historical period, the highest variance in total precipitation (mm) occurs over the Prairie region (10–15%), but, towards the end of the century, the west coast of Canada exhibits the most prominent variance (25–30%) along with a secondary high variance over the Canadian Prairies. The increased variance at the end of the century could be due to the enhanced uncertainty in the projections arising from the complex dynamics of the land–ocean boundary along the west coast. The high historical variance over the Prairie region reflects the mid-latitude continental climate and characteristic high inter-annual variability in the climate moisture index.
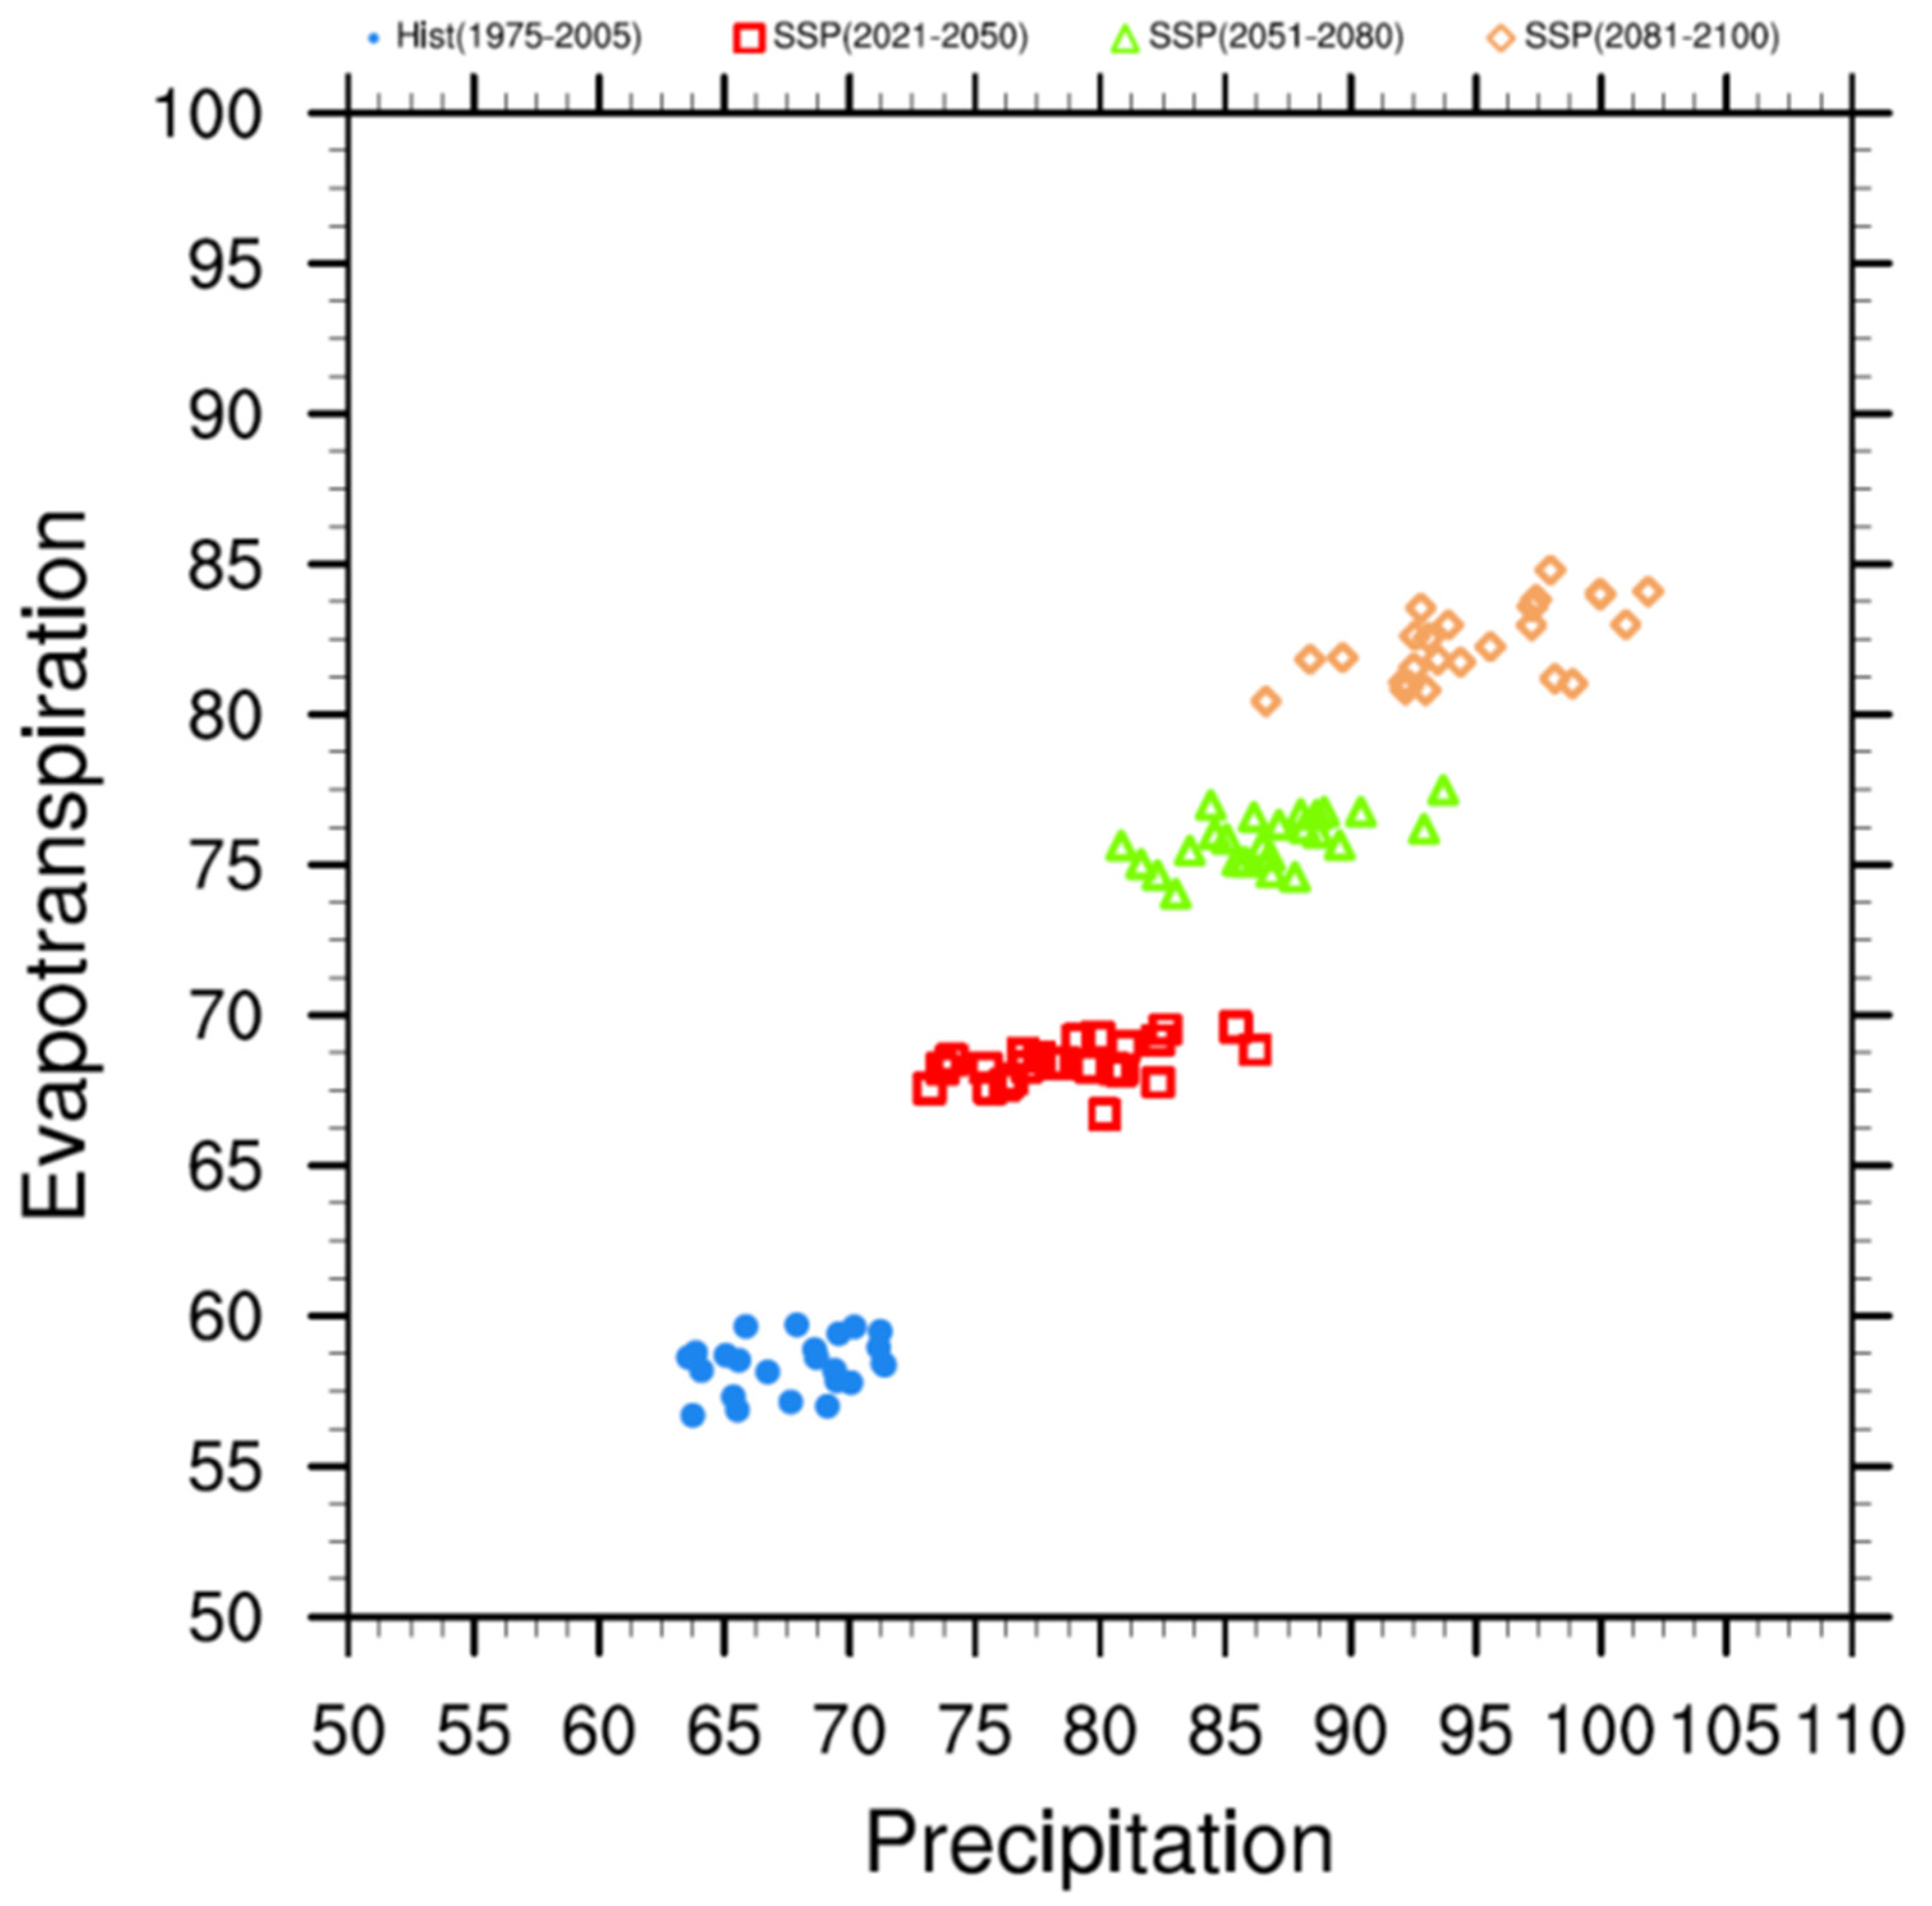
A scatter plot of total monthly evapotranspiration (mm) against total monthly precipitation (mm) shows that both variables have increasingly higher mean values for the historical and three future periods (Figure 4). The spread of the ensemble members is due to the internal variability in the model starting from different initial conditions. Thus, with each successive future period, the range of the precipitation and evapotranspiration among the ensemble members increases. The uncertainty of the projection increases with time, so the scatter plot for the end of the century shows the maximum spread. An 85–105 mm increase in total precipitation corresponds to an 80–90 mm increase in evapotranspiration at the end of the century for western Canada.
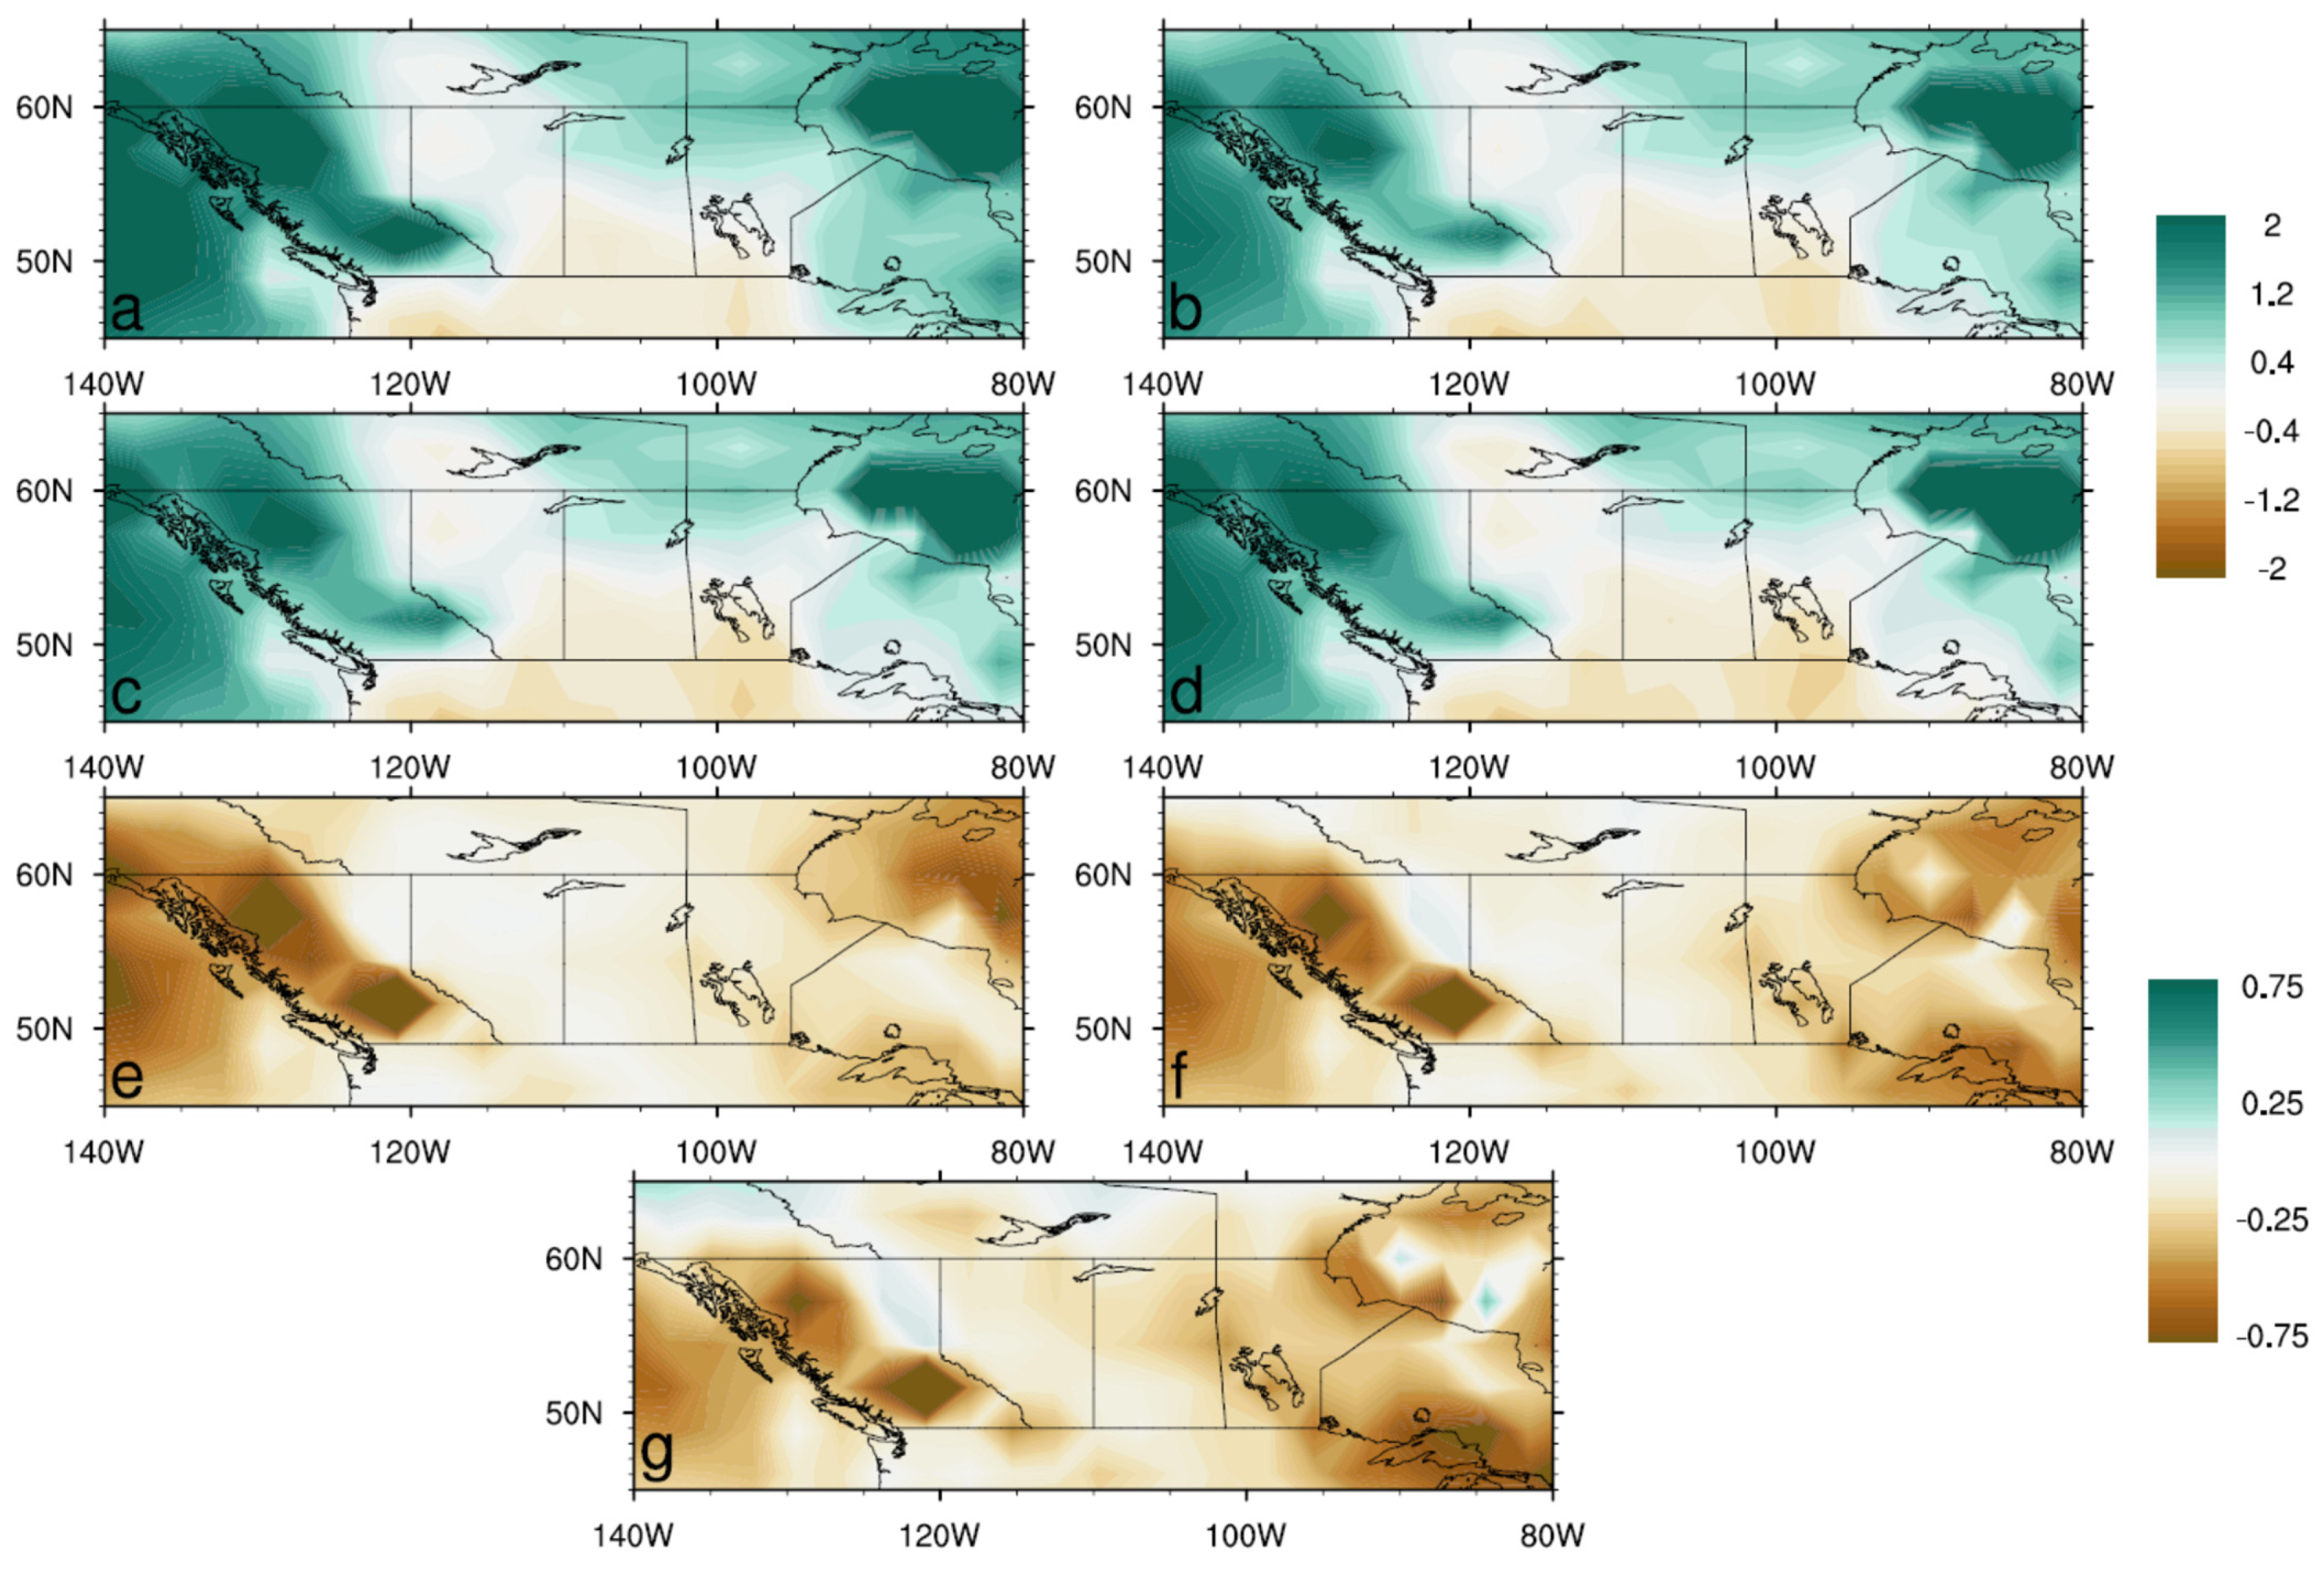
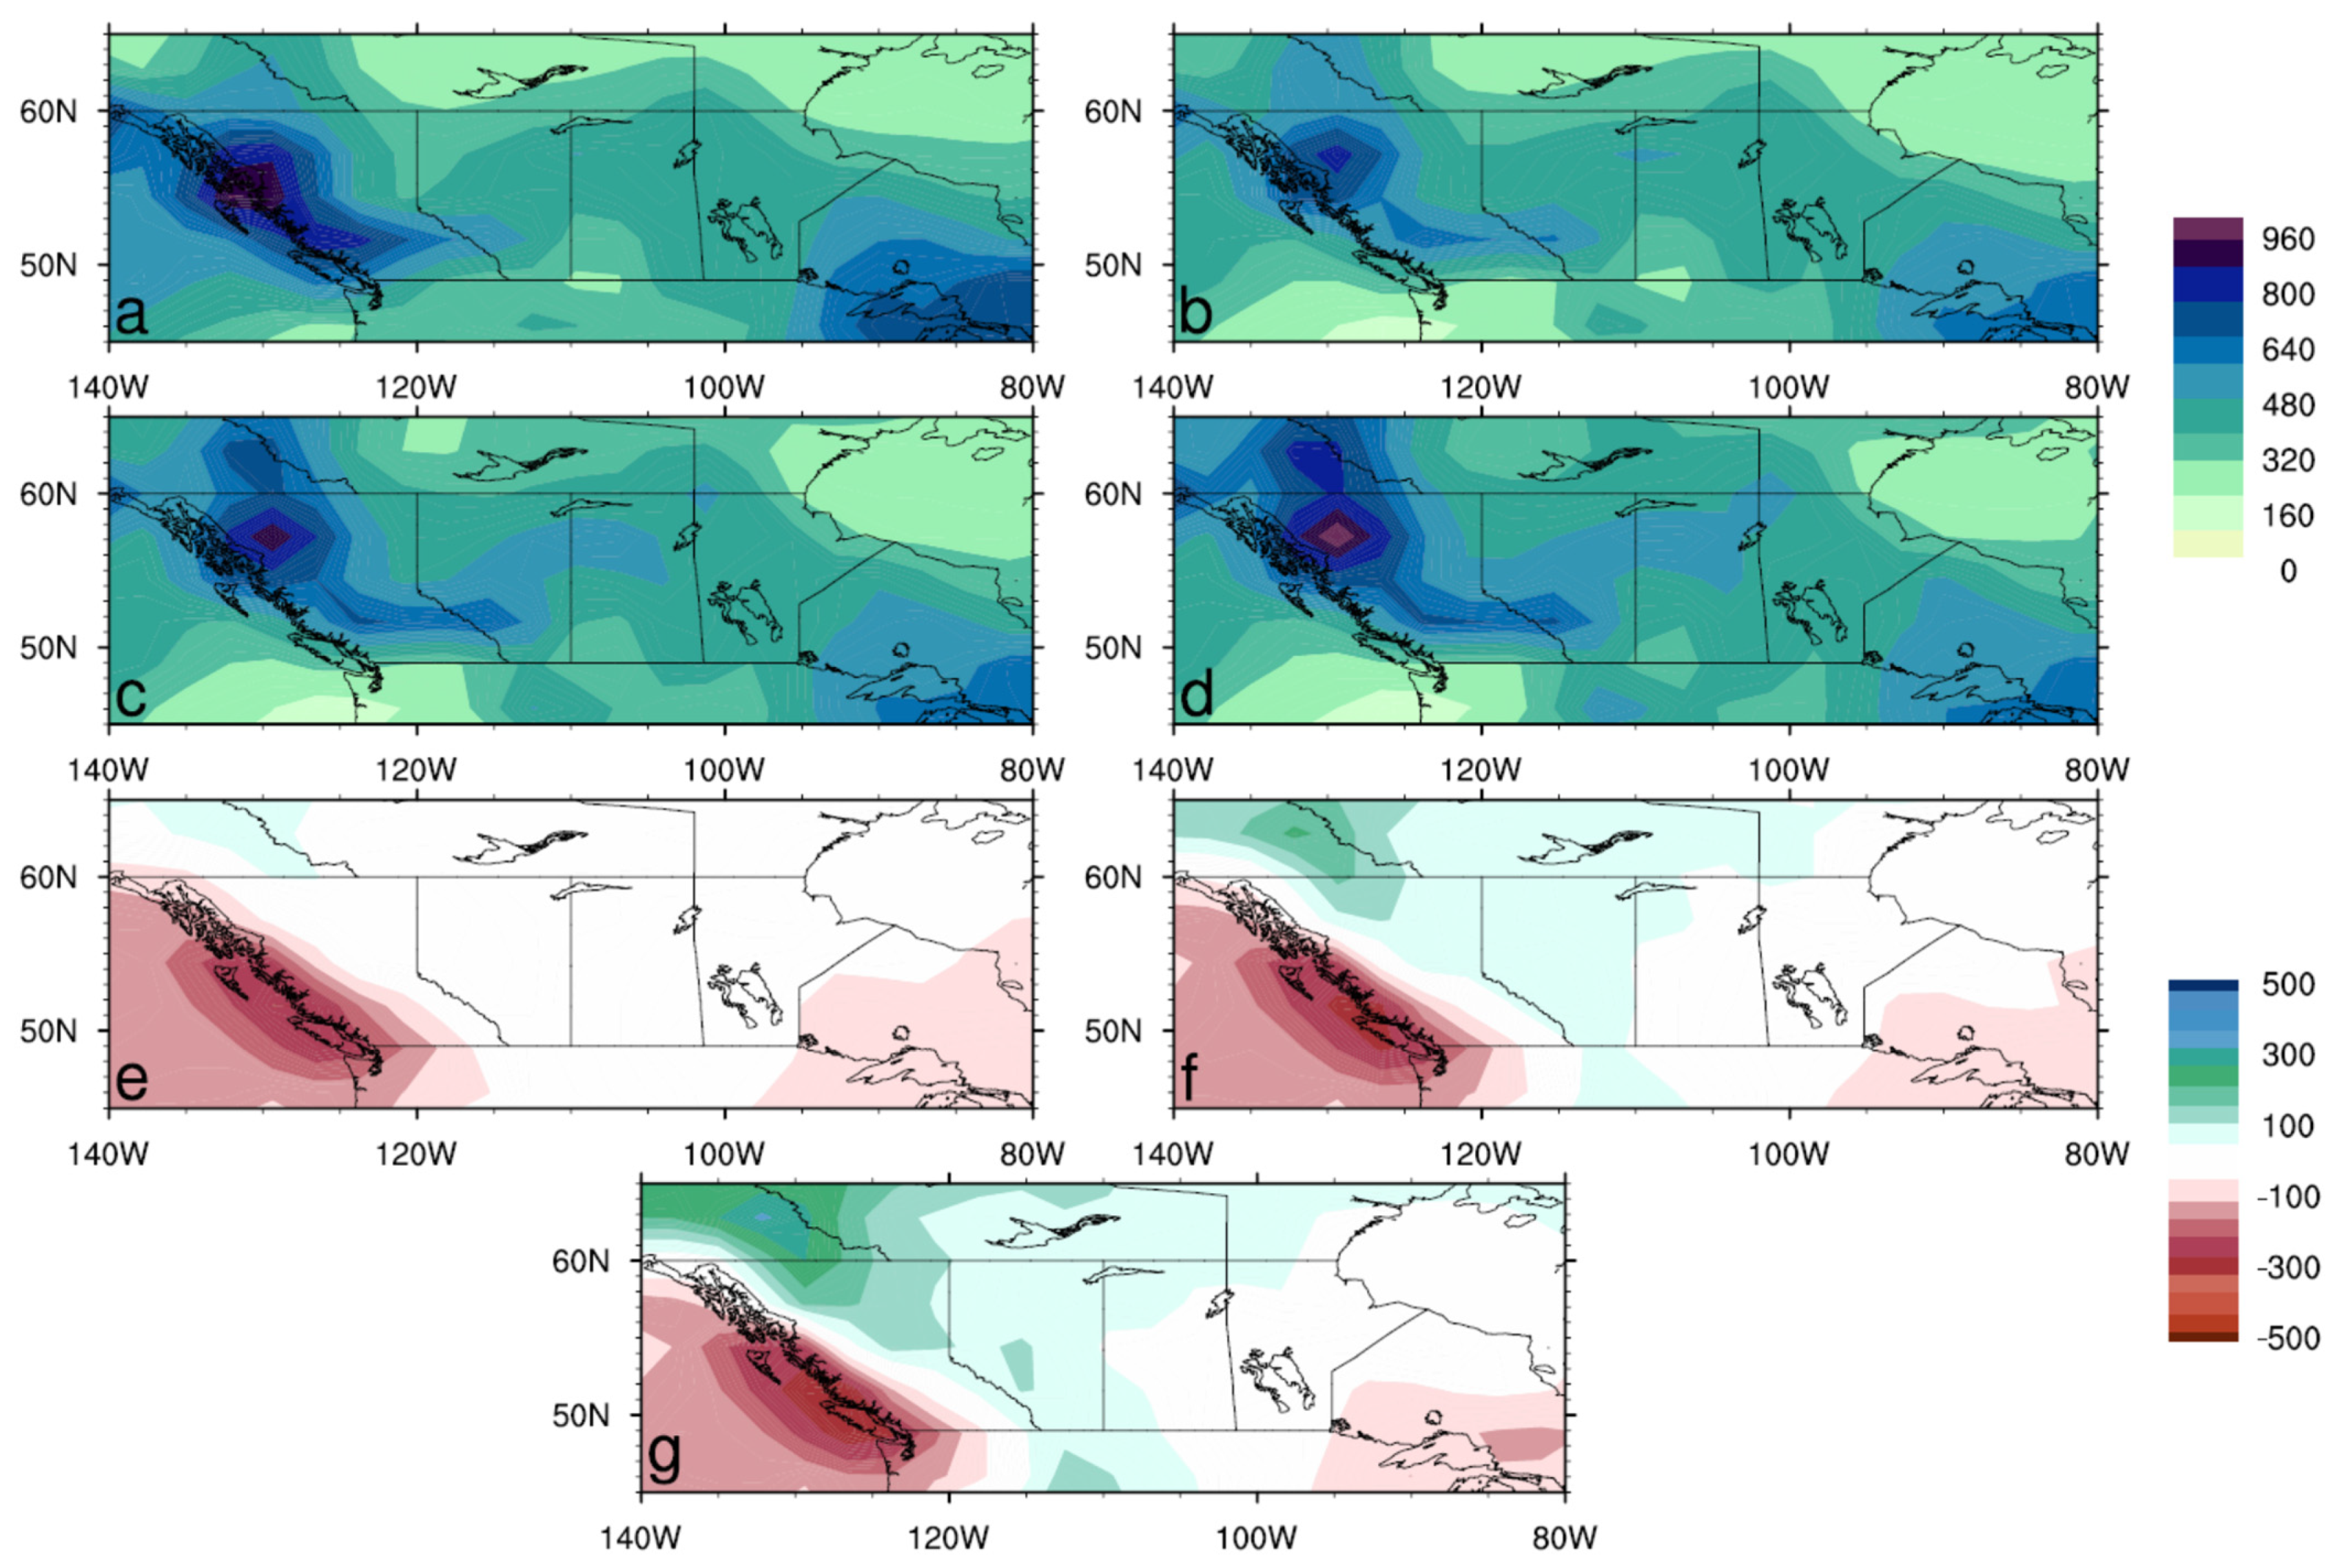
The monthly precipitation and evapotranspiration were used to derive the NWBI for the growing season and examine the future dryness or wetness in comparison to the historical baseline. The long-term monthly means of the NWBI in the near future show a consistent dryness along the west coast (Figure S1). For the same period, the summer is the driest for the Prairies with a slightly wet spring. This pattern of dryness (wetness) continues in the far future period and at the end of the century with July being prominently the driest month for all the regions (Figures S2 and S3). However, to simplify the results, we have taken the period from April to October as the growing season, and from now on, the results are shown for the entire growing season only. All the differences shown in this paper are defined with respect to the historical baseline (1975–2005). Figure 5 shows the ensemble mean NWBI for the historical, near future, far future, and the end of the century periods and the differences among the future projections and the historical period. Positive and negative values of the NWBI indicate surplus moisture and a moisture deficit, respectively. In all time periods (Figure 5a–d), the driest region includes the southern part of the Prairie provinces. In the near future, the historically wettest regions of British Columbia and Hudson Bay show a prominent decrease in wetness (Figure 5e). The dryness or less wetness further intensified later in the century. A study of the changes in the far future and the end of the century reveals a further decrease in the wetness over British Columbia and the overall dryness over the Canadian Prairies increases with the most noticeable increase in dryness centered over southern and northeast Manitoba, central Saskatchewan, and southern Alberta.
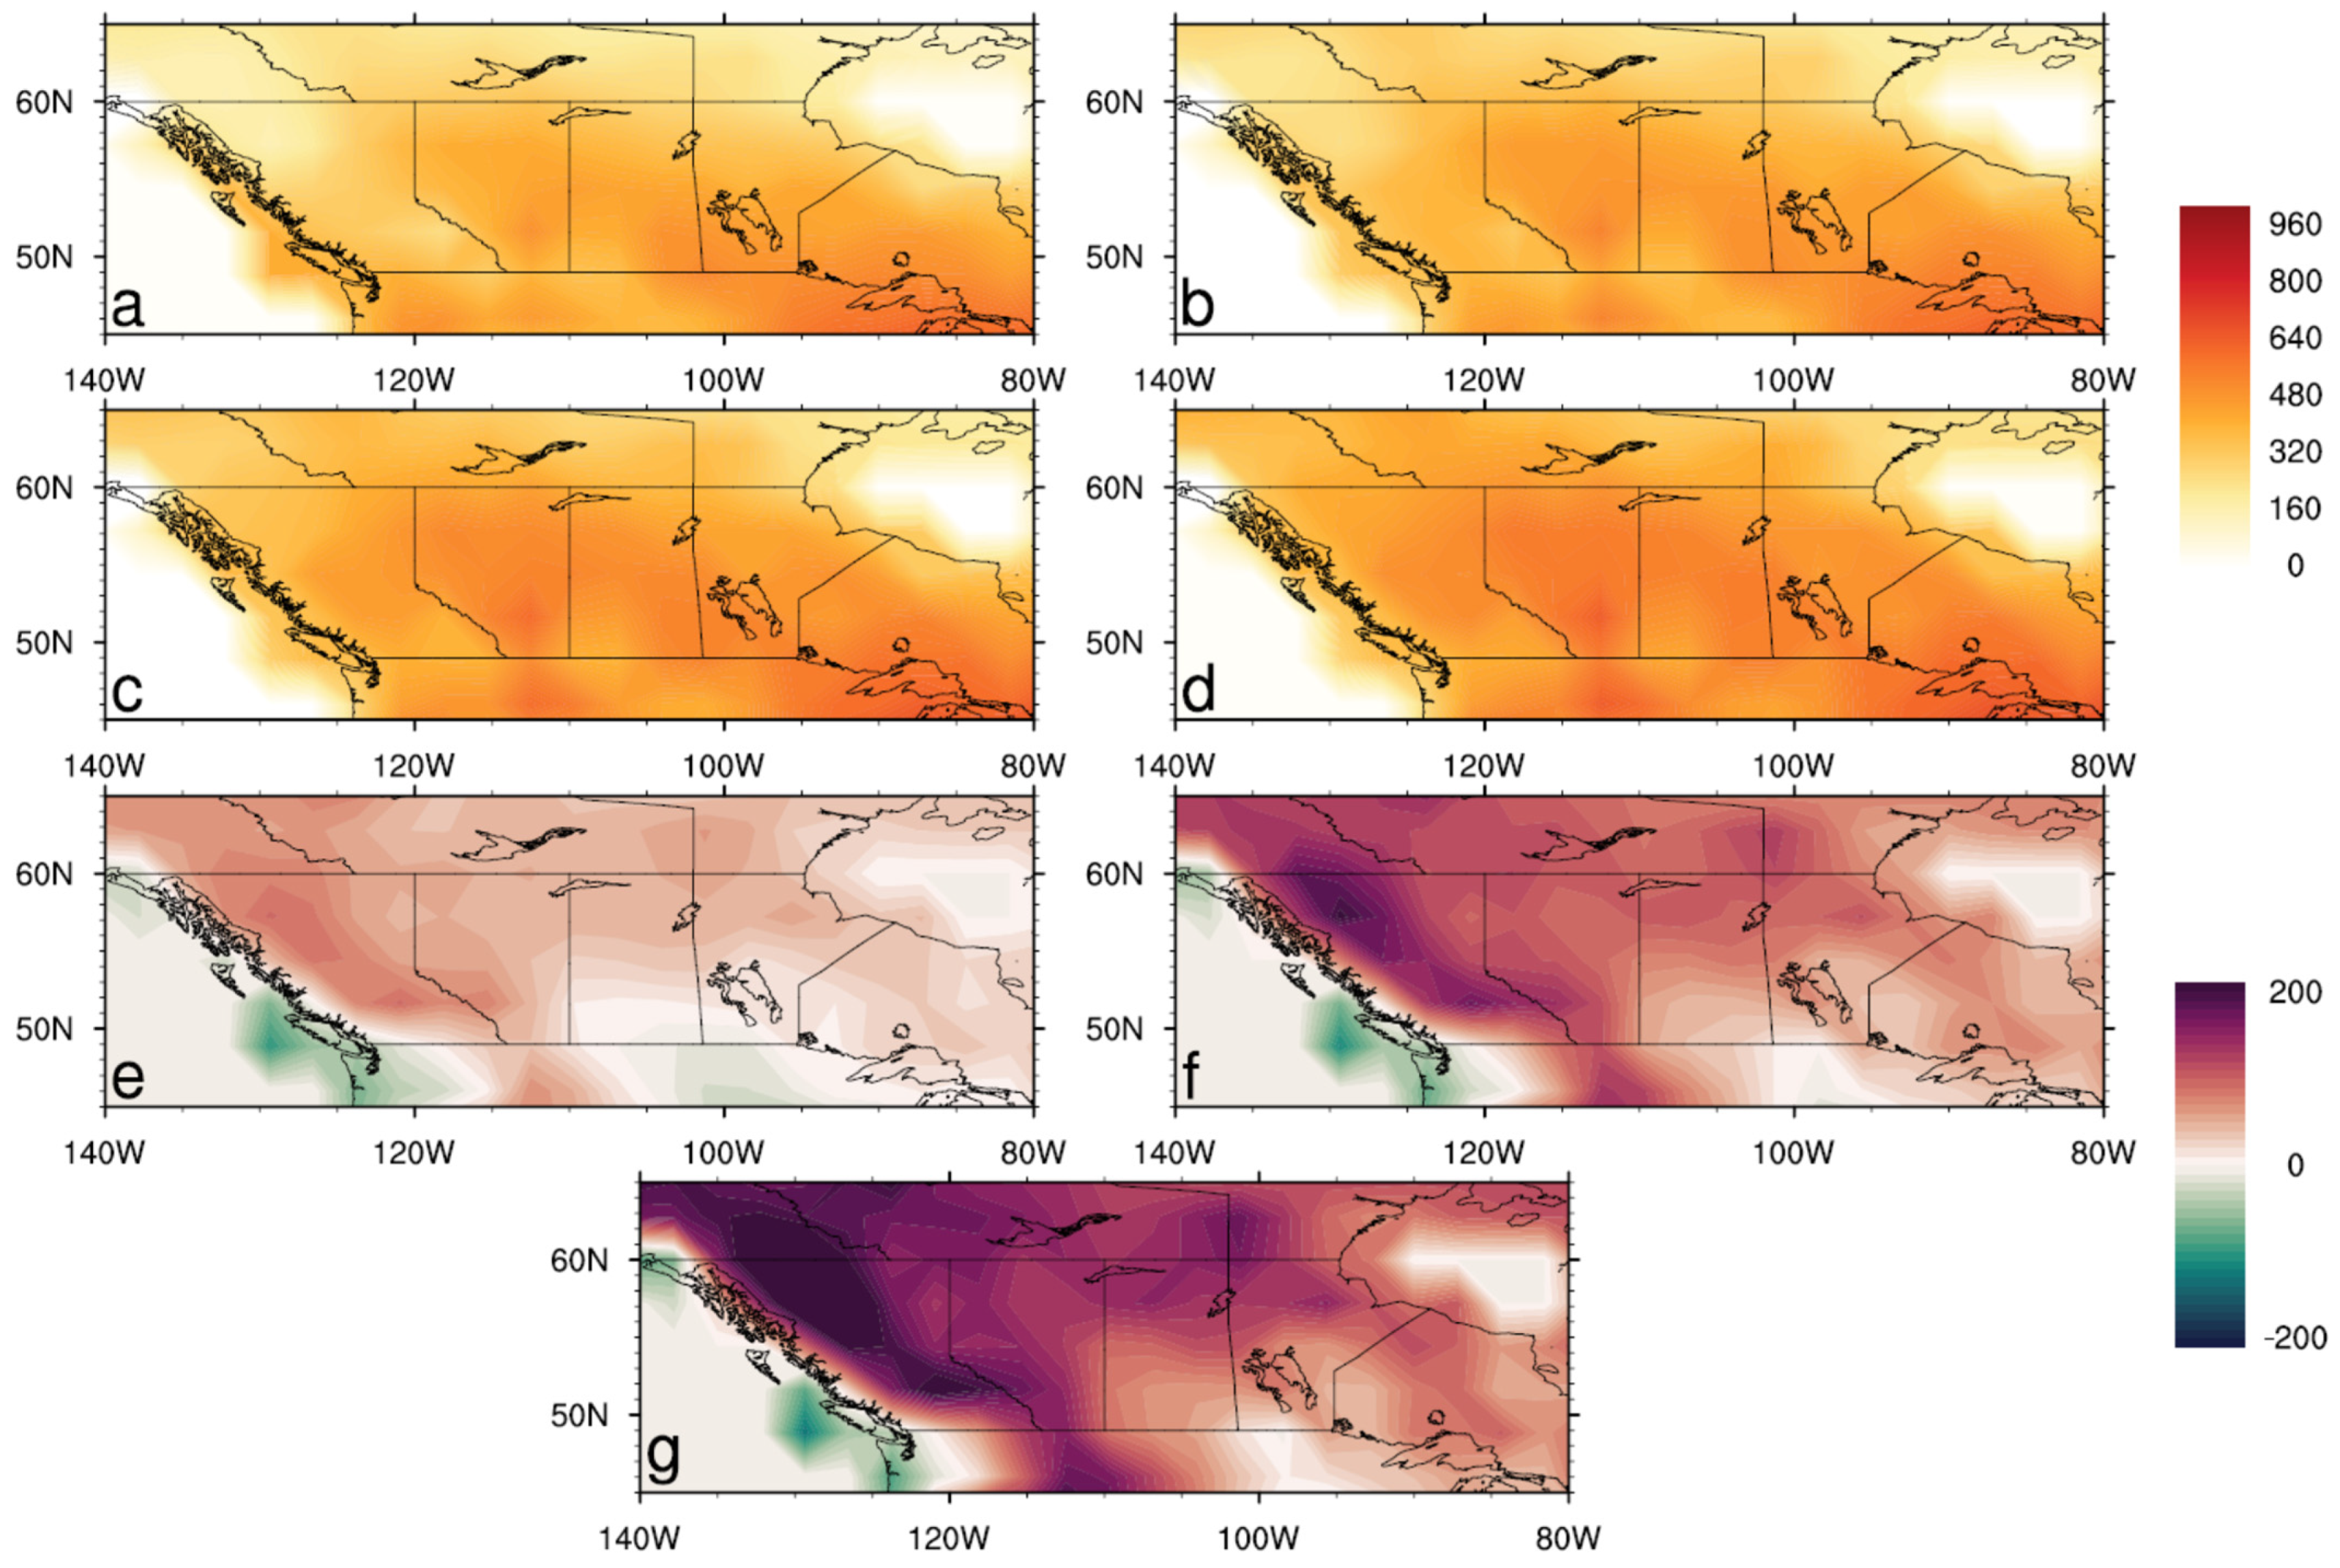
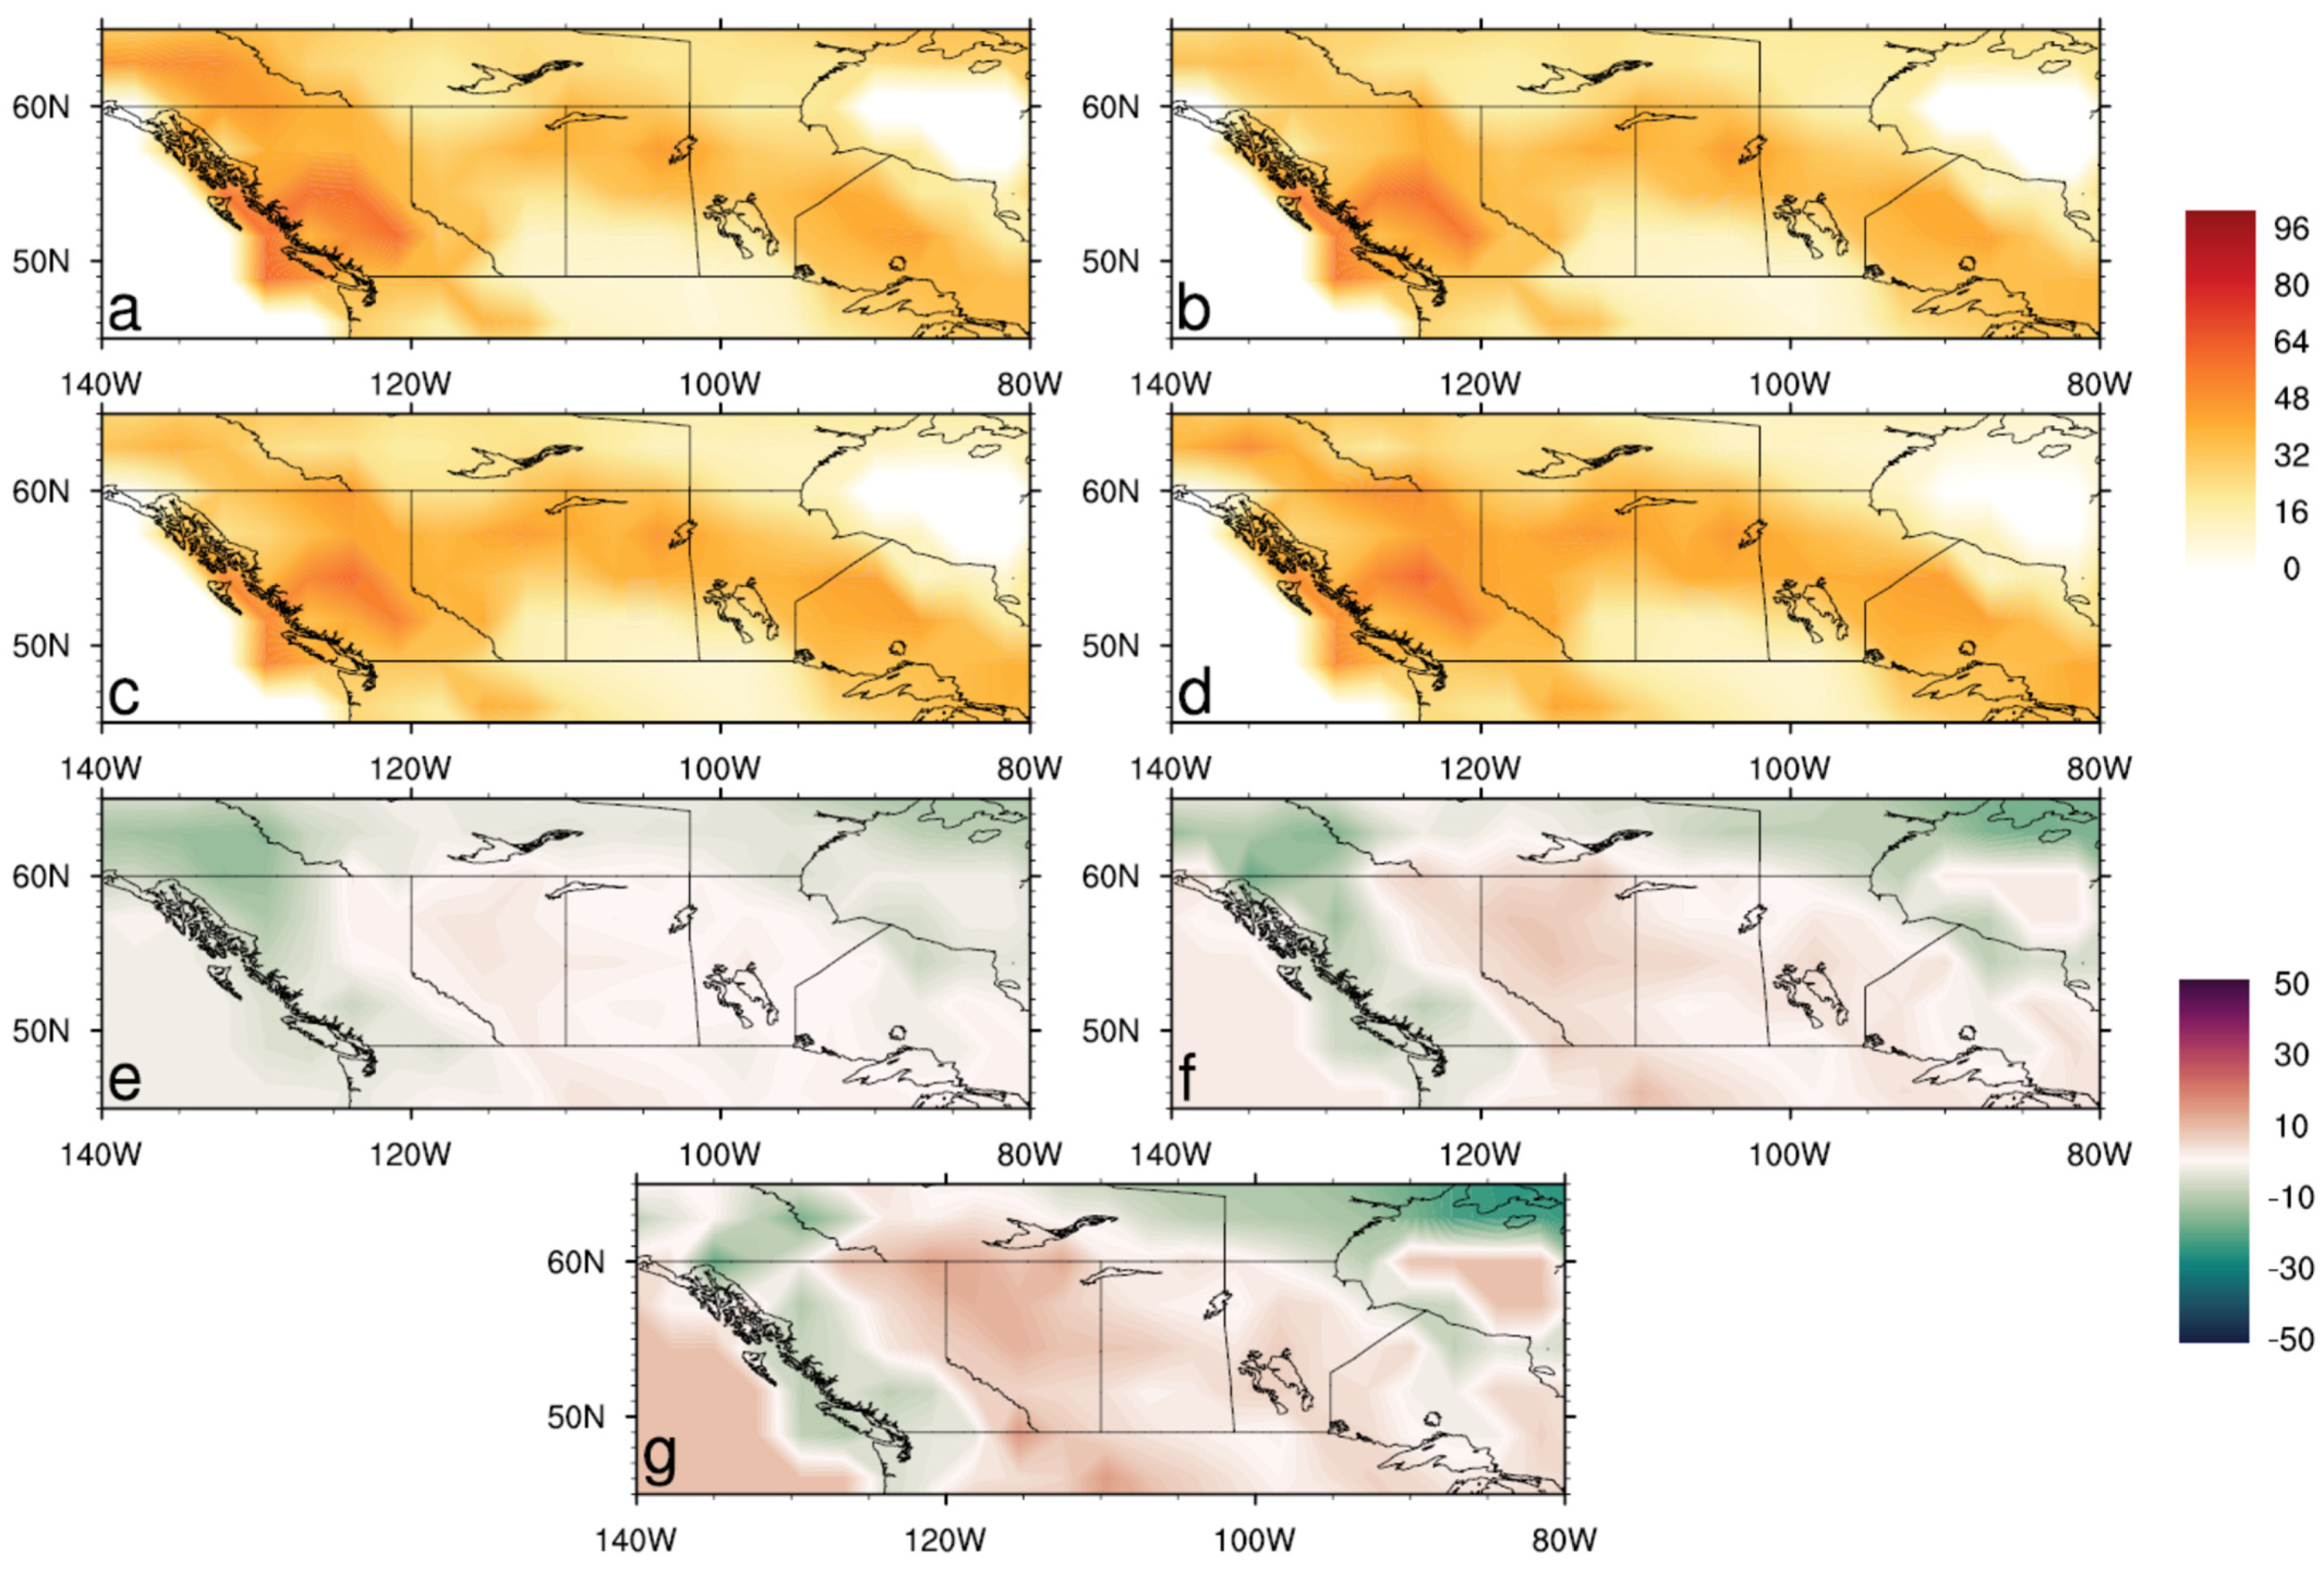
The increased dryness and reduced wetness could result from decreased precipitation, or increased evapotranspiration, or both. Thus, we further investigated the total growing season precipitation for each of the studied periods (Figure 6). The coastal regions of British Columbia receive 800–900 mm of precipitation between April and October in each time period (Figure 6a–d). However, as expected from the changes in the NWBI, the total precipitation decreases significantly in the wettest regions of British Columbia in the near future (Figure 6e). In contrast, the difference in total precipitation in the far future reveals an increase over northeastern British Columbia, southern Yukon, and the entire area of Alberta, along with a prominent decrease over the coastal regions of southern British Columbia by ~250 mm (Figure 6f). A comparison between the end of the century and the historical periods shows a similar pattern with a decrease in total precipitation along the southern coastal British Columbia and an increase in the precipitation over northeast British Columbia, southern Yukon, Alberta, and northwestern Saskatchewan ranging from 60 mm to 200 mm (Figure 6g). The changes in precipitation could be a result of the uncertainty in the intensity and location of the atmospheric river, which is the dominant mode of moisture transport across the Pacific into continental North America.
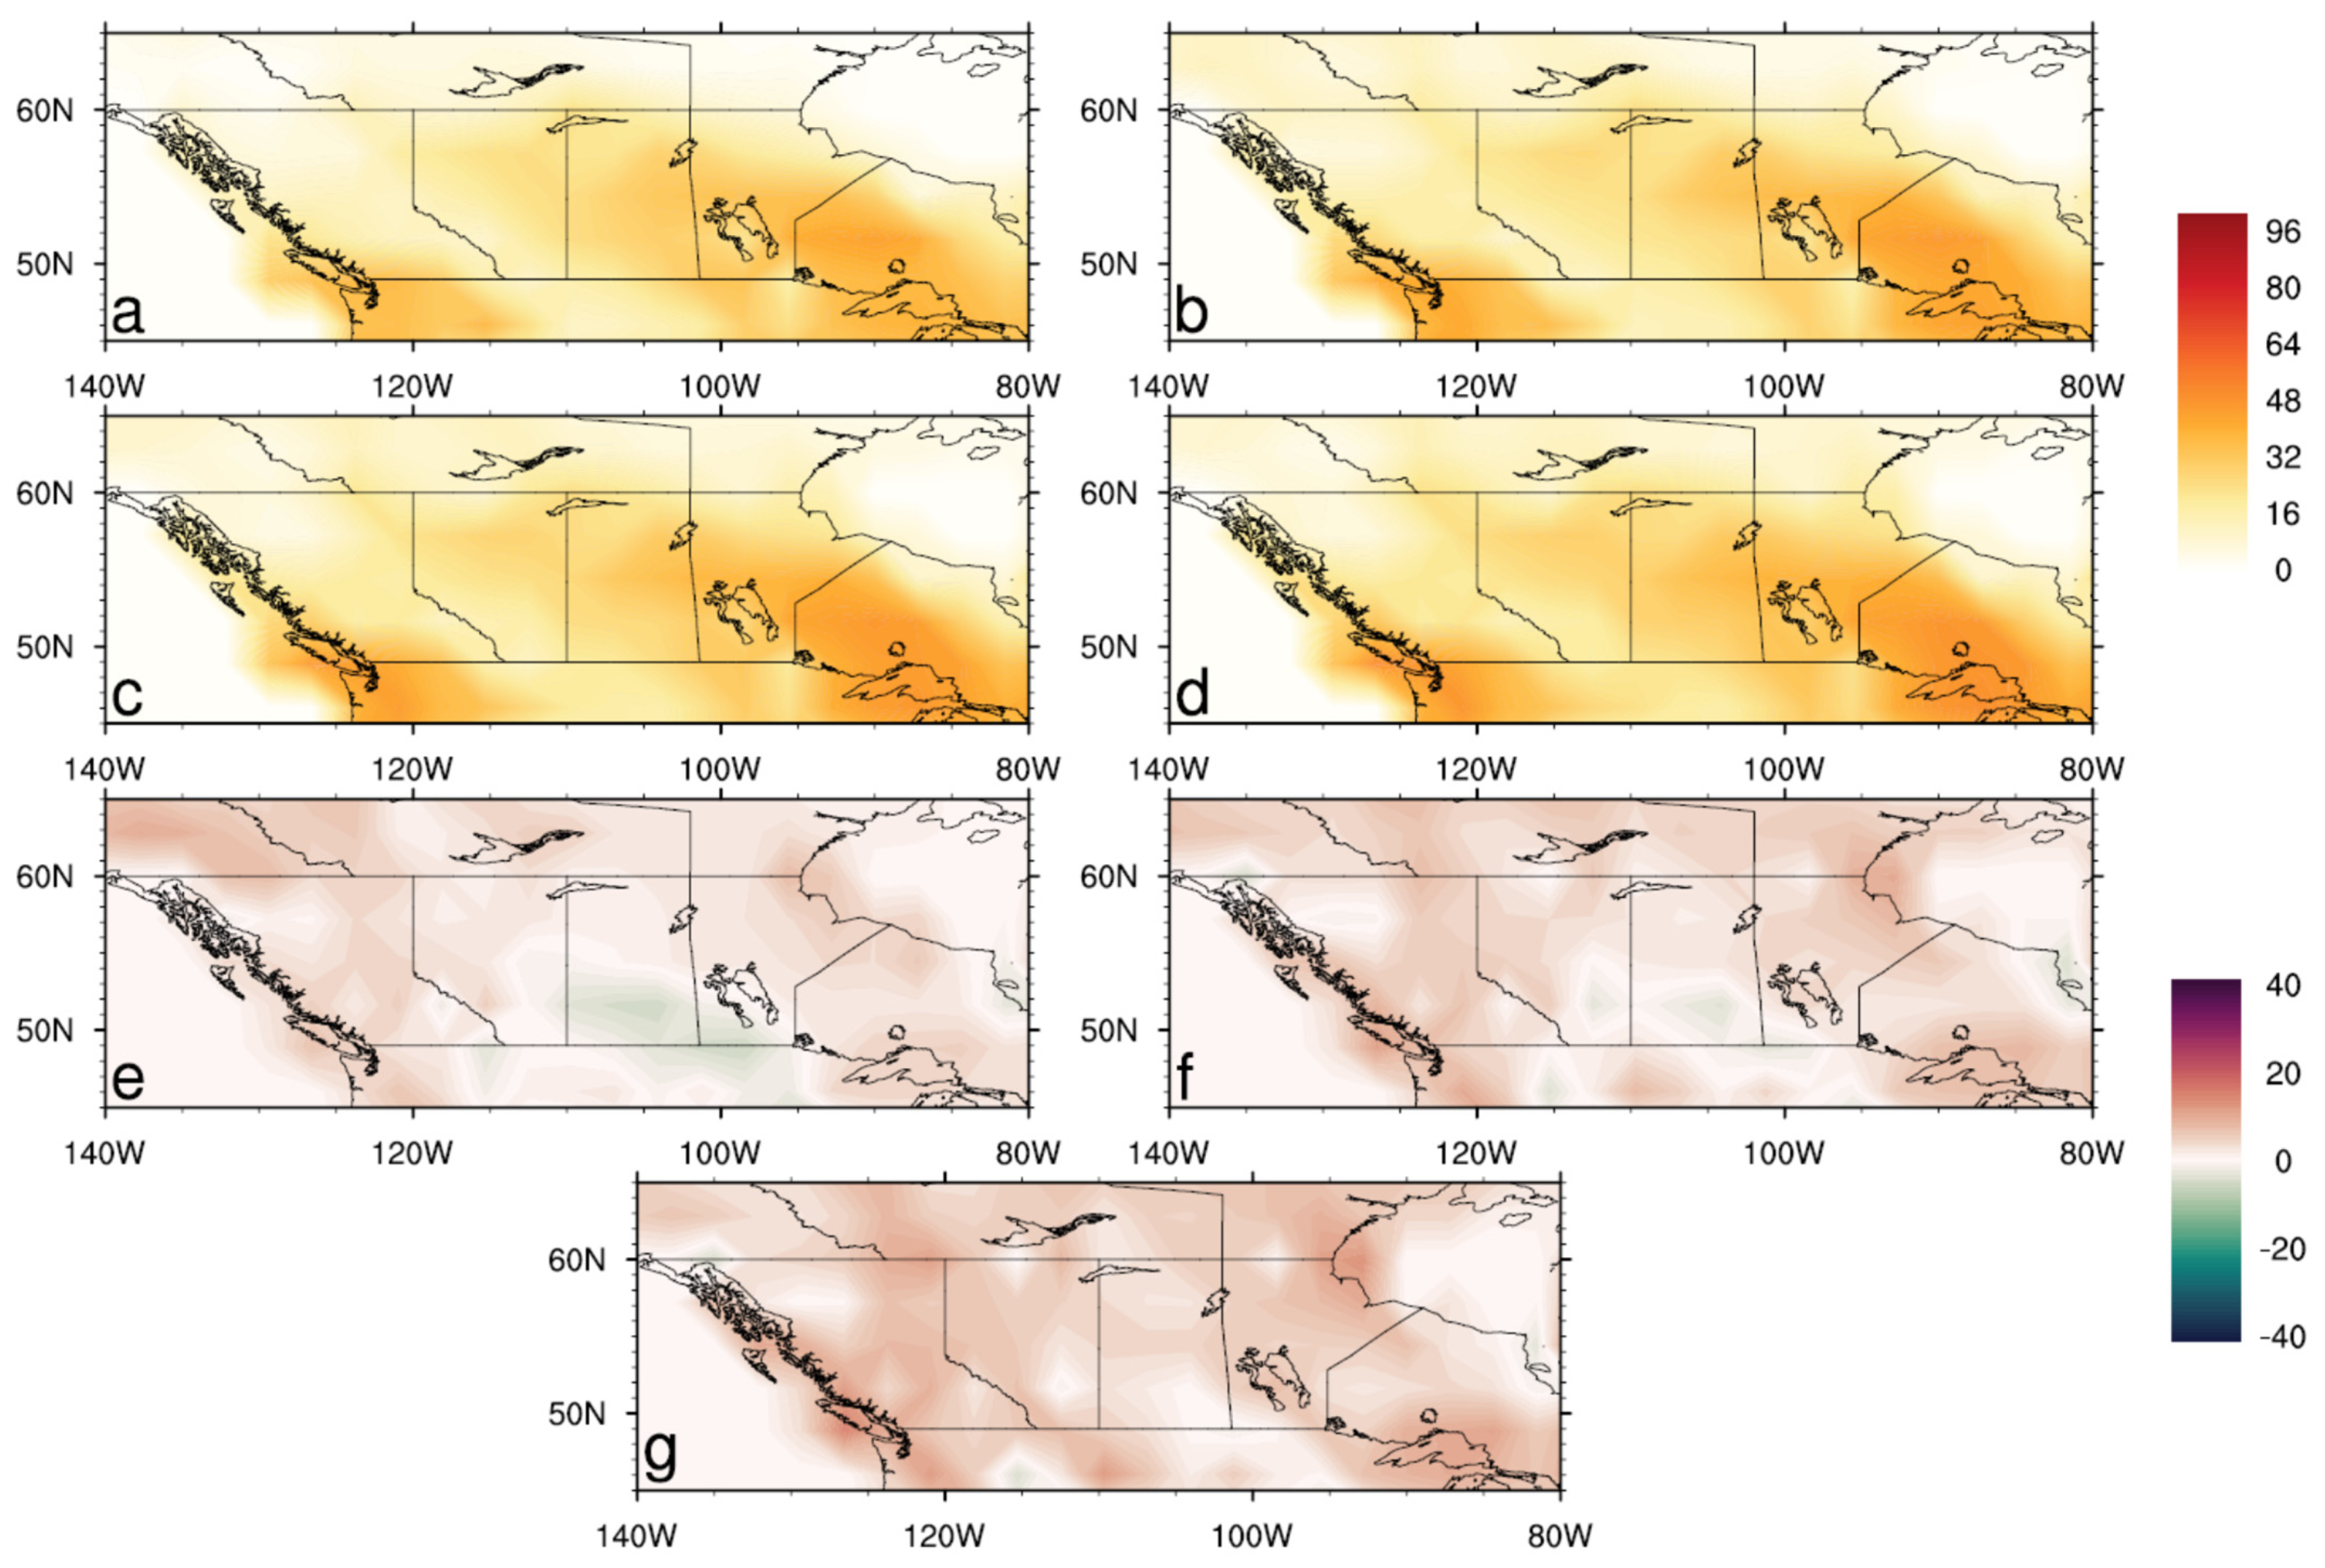
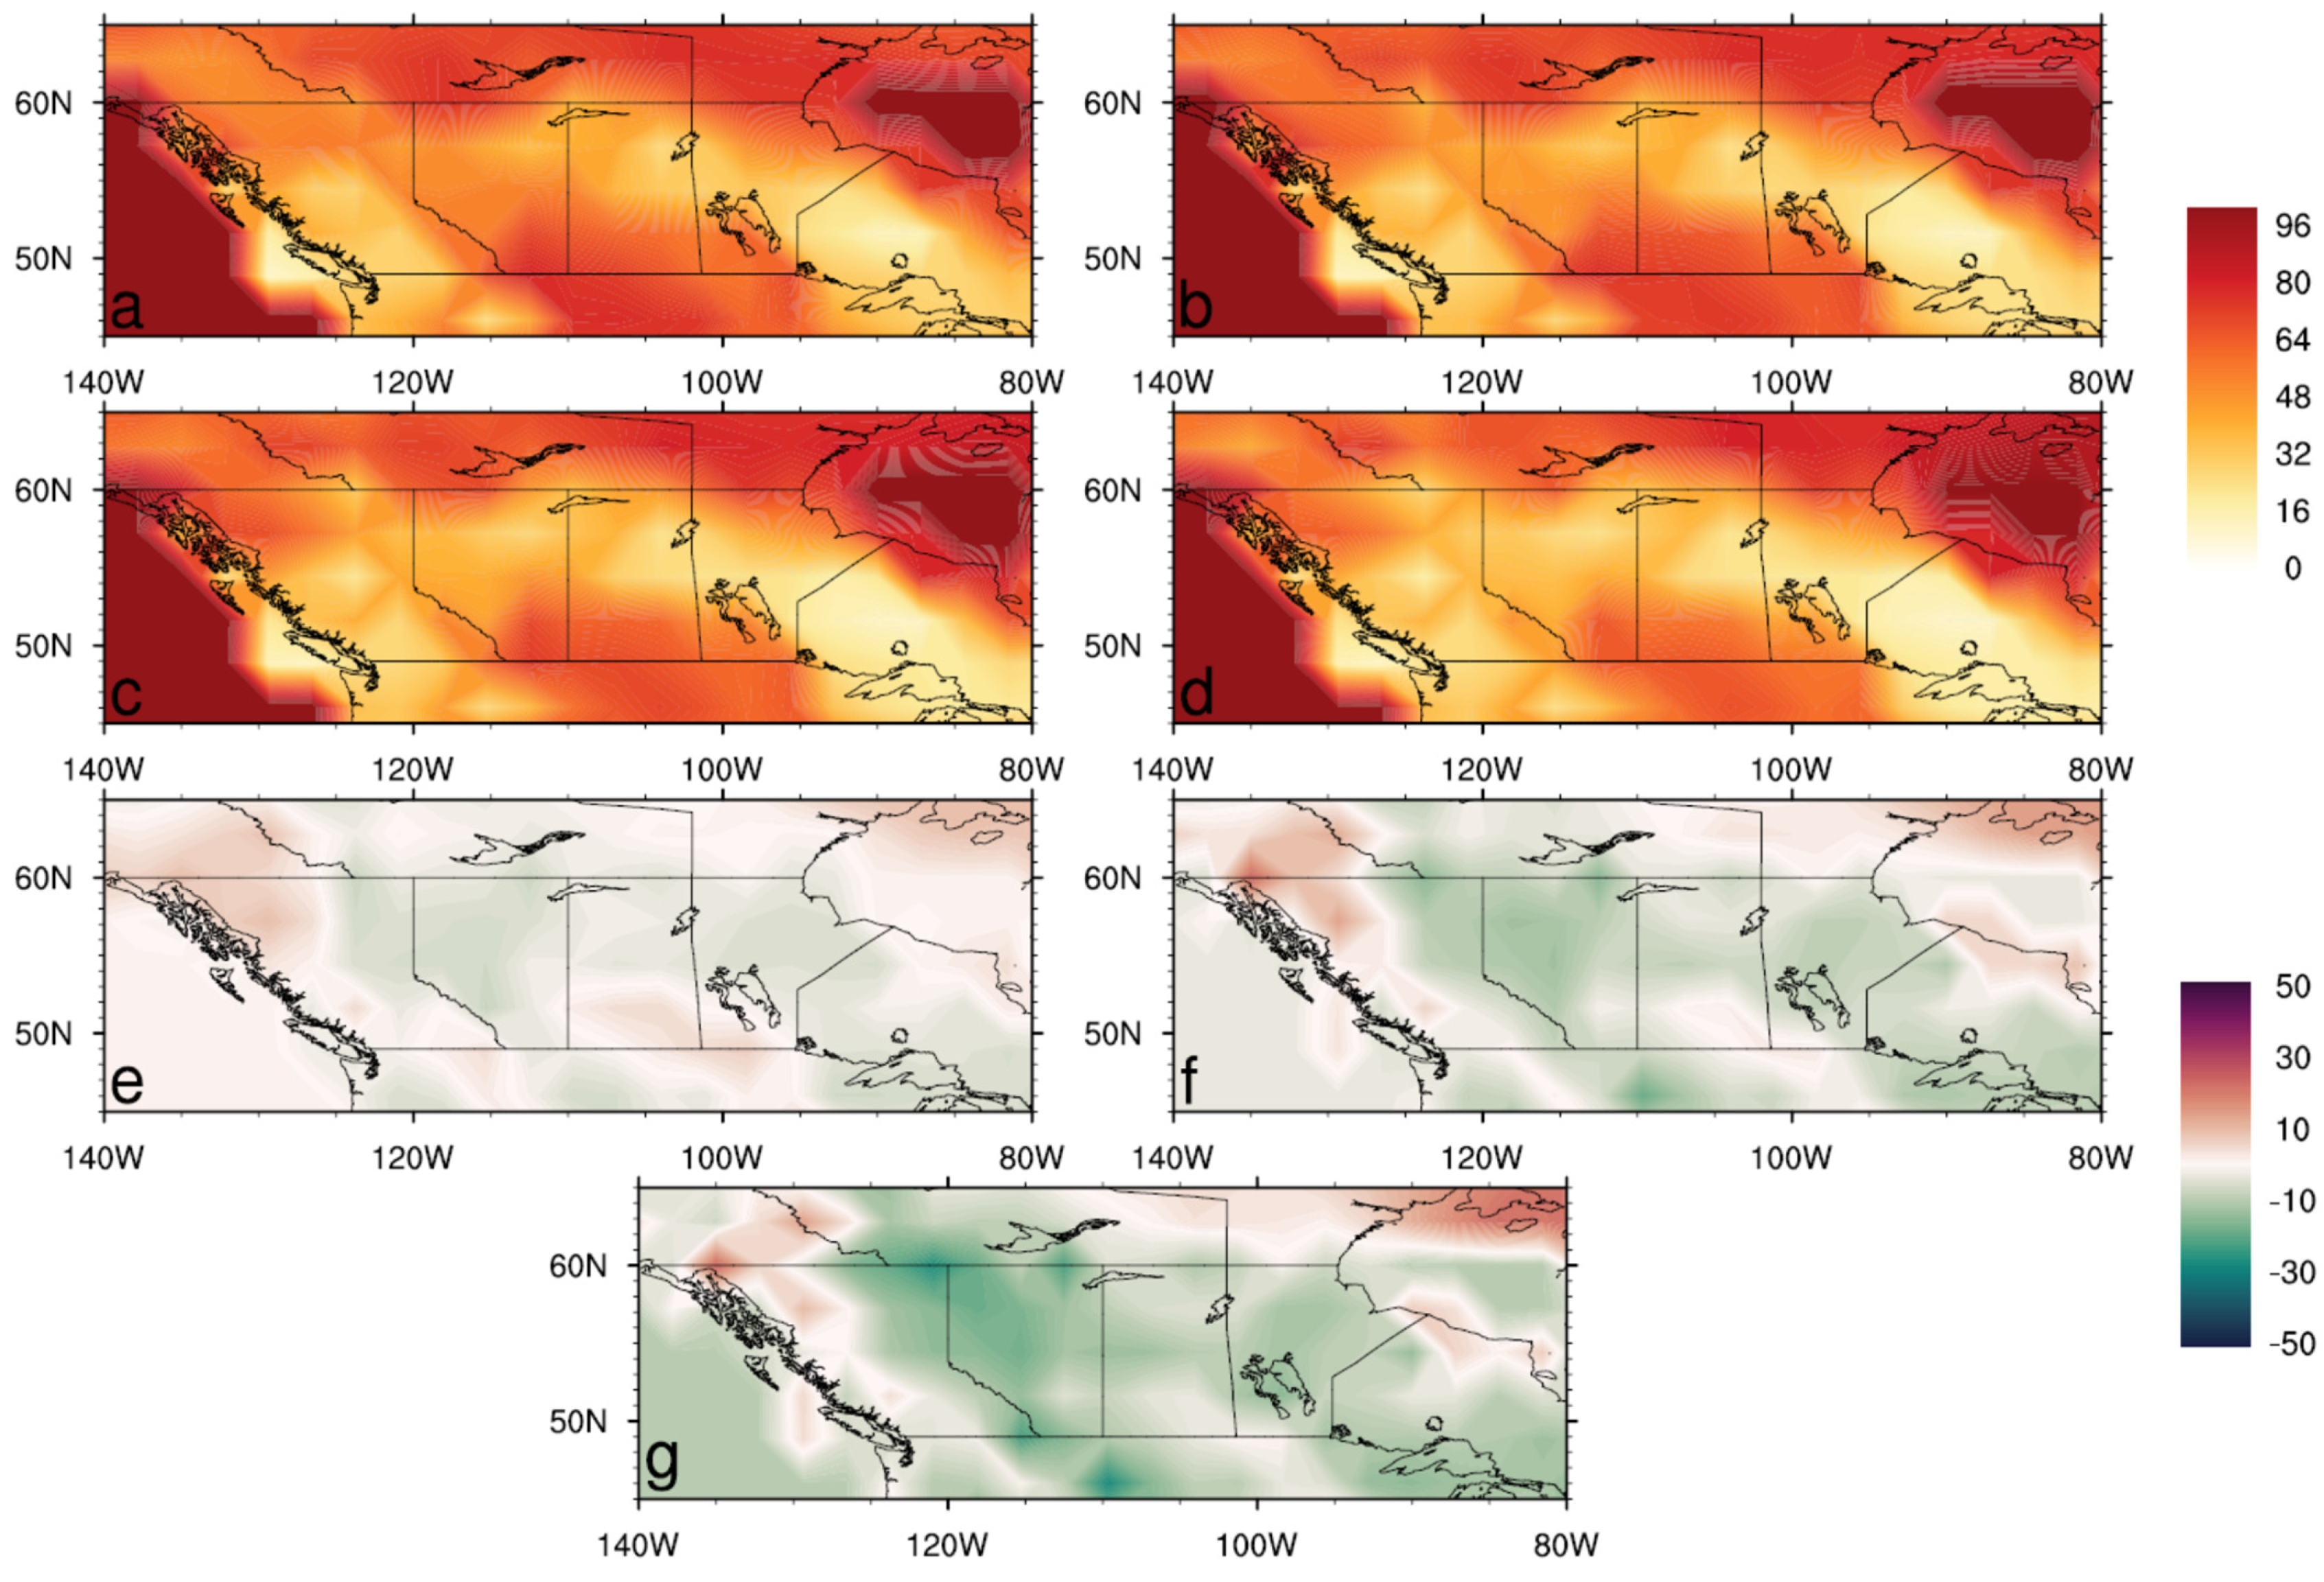
Under the influence of the warmer climate, the loss of moisture due to evapotranspiration is expected to intensify in future time periods. Figure 7a–d show that the evapotranspiration is highest over the entire southern part of the Prairie provinces. The southern part of the Prairie provinces is mostly semi-arid lands with high summer temperatures and persistent wind, which could account for this intense moisture loss due to the evapotranspiration in the growing season. A comparison between the near future and historical periods shows that the highest increase in evapotranspiration is over British Columbia, Alberta, northern Saskatchewan, and northern Manitoba (Figure 7e). The change in the far future shows a further increase in evapotranspiration over the entirety of western Canada, including British Columbia, the Prairie provinces, and the southern part of Yukon and the Northwest Territories (Figure 7f). At the end of the century (Figure 7g), the evapotranspiration is 100–300 mm more than its historical baseline.
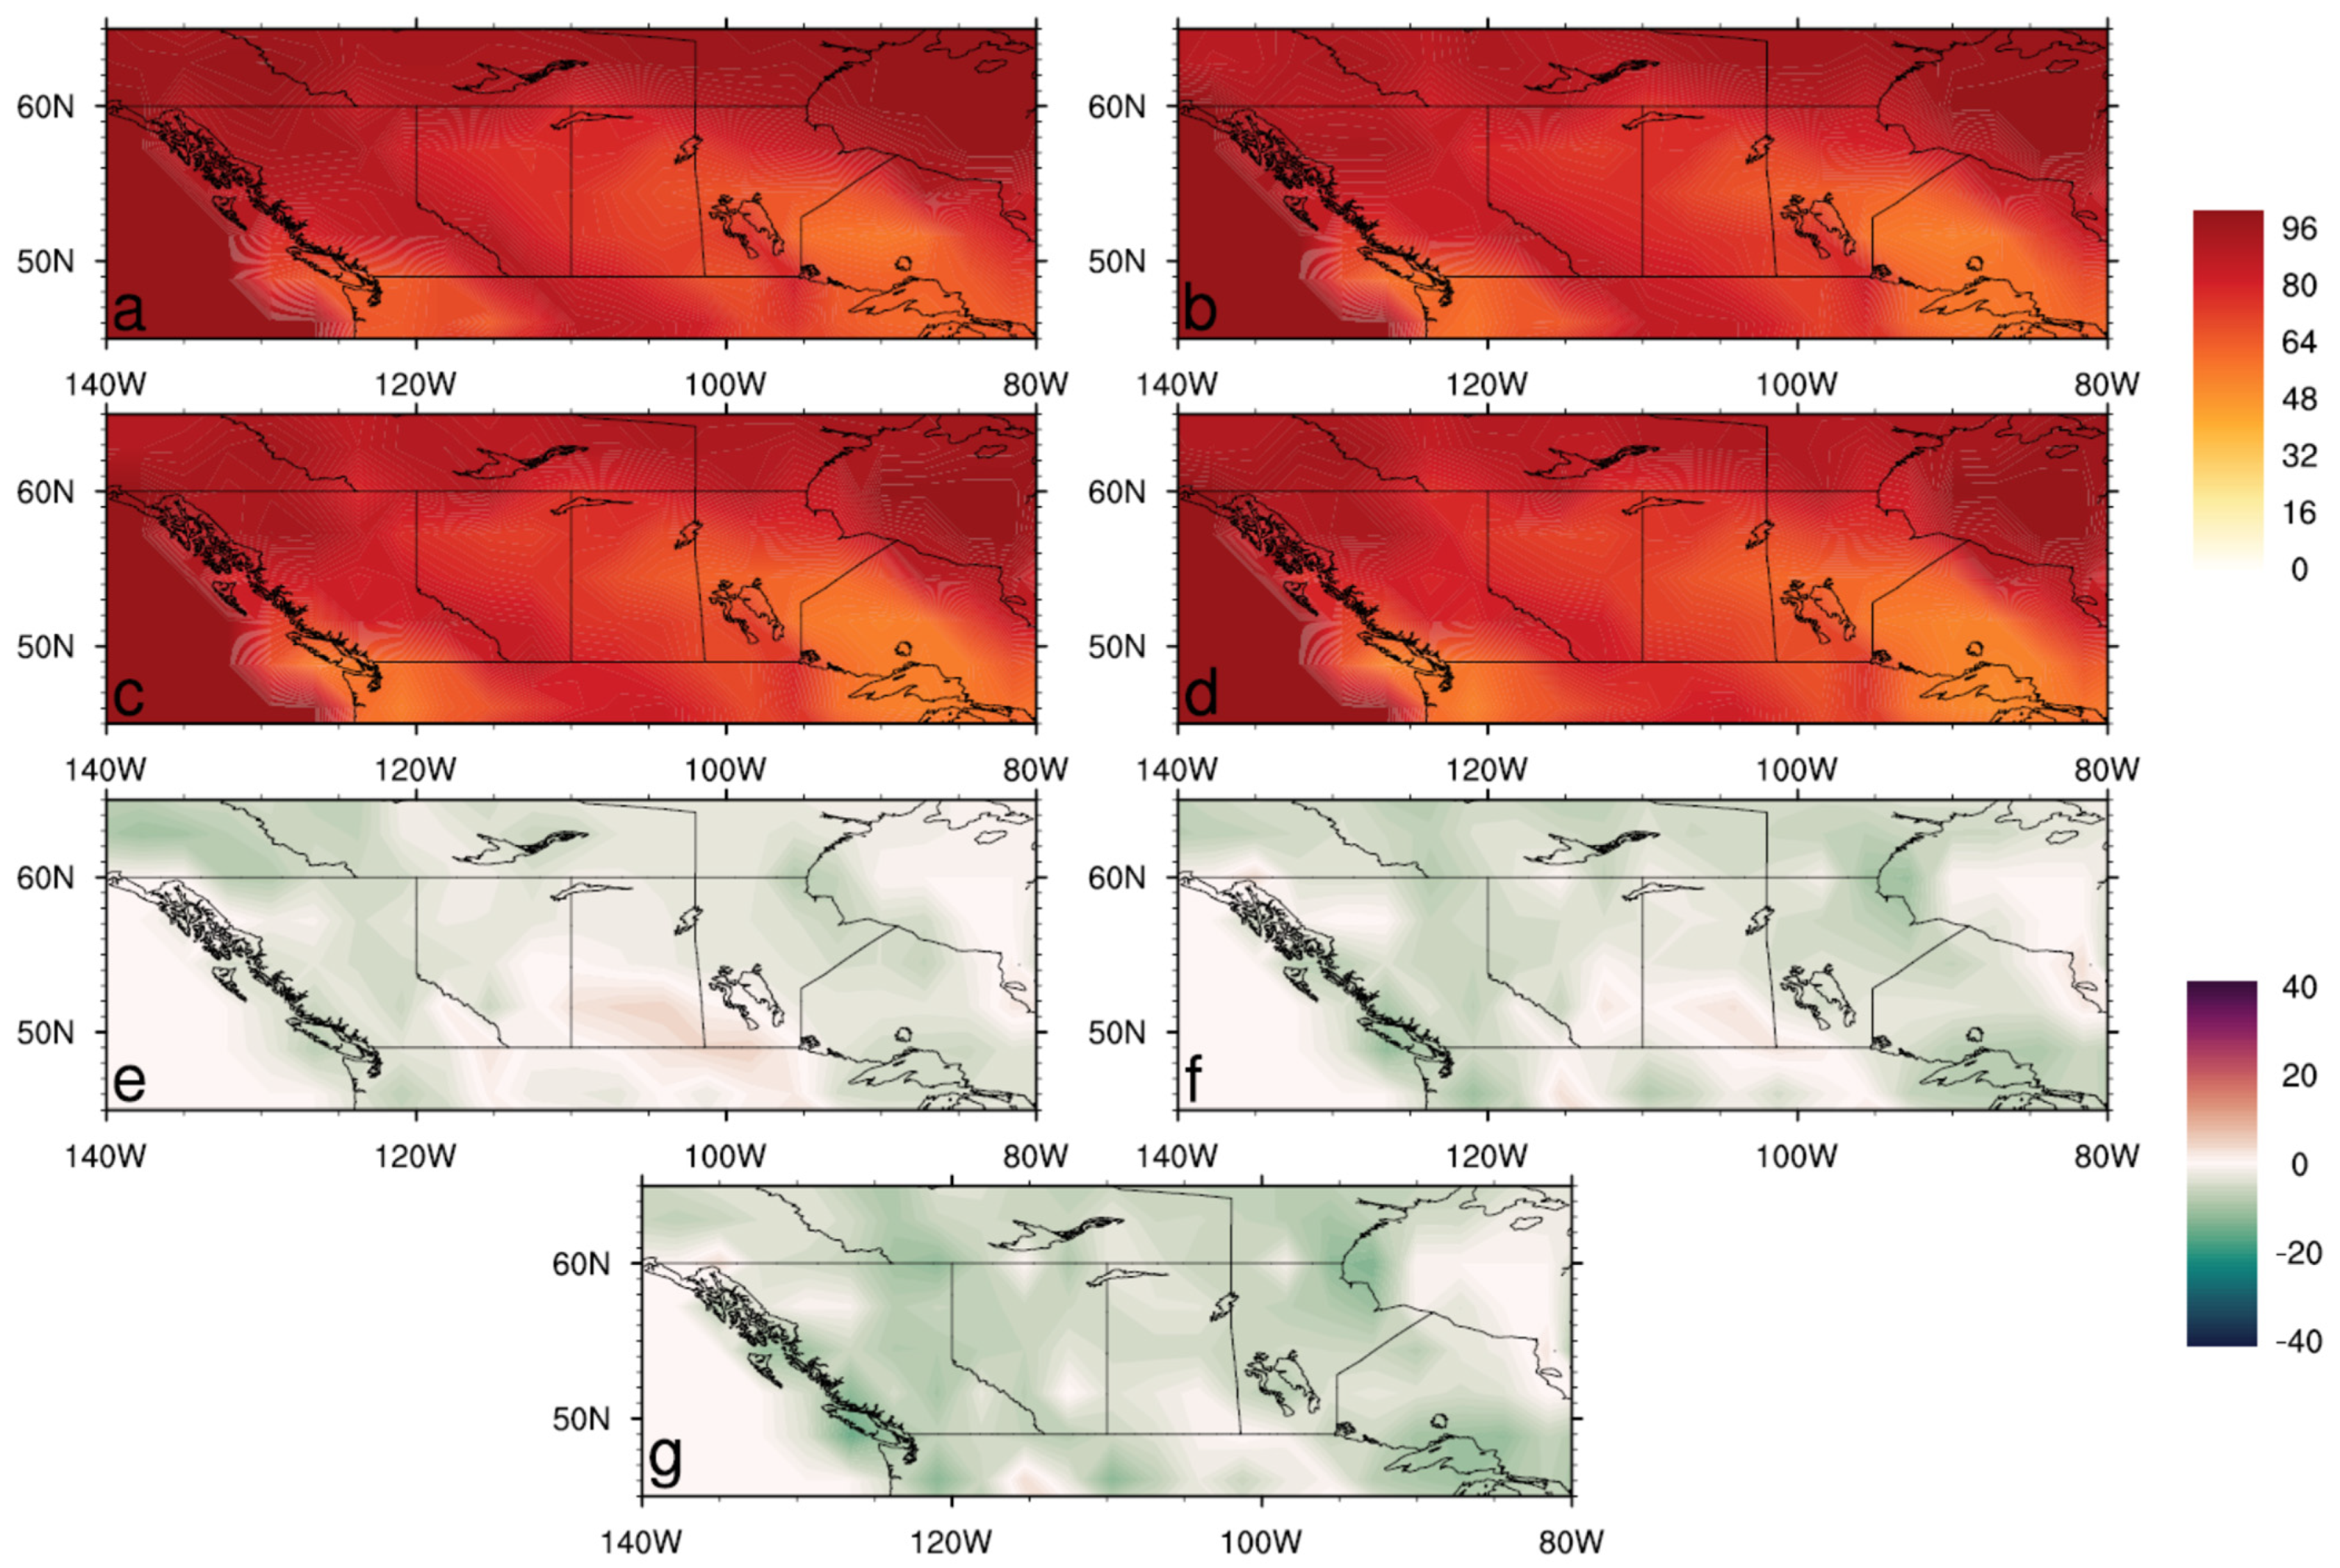
We examined changes in the individual fractional contribution (%) of evaporation and transpiration to the total loss of moisture due to total evapotranspiration. This analysis showed that 20–30% of the evapotranspiration is driven by transpiration in all the periods (Figure 8a–d). The transpiration is highest in the northern parts of the Prairie provinces and southern British Columbia due to the presence of the boreal and montane forests in those regions. In the near and far future, the fractional contribution of transpiration increases by 5–10% over the entirety of western Canada except in southern Saskatchewan, where there is a decrease in transpiration by 5–8% (Figure 8e–f). At the end of the century, there is a further 8–15% increase in the fractional contribution of transpiration over western Canada compared with the historical baseline period (Figure 8g). An investigation of the fractional contribution (%) of total evaporation revealed that it contributes 70–80% of the total evapotranspiration (Figure 9a–d), which makes it the primary driver of the moisture loss due to evapotranspiration in all the time periods. Total evaporation includes the evaporation from vegetation as well as soil. It is high over the agricultural lands and southern boreal forest of the Prairie provinces. In the near future, the fractional contribution of total evaporation shows a decrease by 5–8% over Alberta and British Columbia and a slight increase over southern Saskatchewan (Figure 9e). In the far future period, the fractional contribution of total evaporation diminishes further over Alberta, Manitoba, and British Columbia by 10–15% in comparison with the historical period (Figure 9f). At the end of the century, there is a 10–20% decrease in the fractional contribution of total evaporation throughout western Canada (Figure 9g) compared with the historical baseline.
A further comparative examination shows that evaporation from soil contributes 50–70% of the total evaporation over land, which includes water loss from the surface of lakes and water bodies (Figure 10a–d). The prairie region with a sub-humid climate has the most intense soil evaporation, corresponding to 65–70% of the total evaporation in all the time periods. In the near future, the fractional loss due to the evaporation from soil decreases by 5–10% over most of the interior of western Canada except over southern Saskatchewan, where it increases by 5–10% (Figure 10e). There is a further decrease by 10–20% from the historical baseline over western Canada in the far future (Figure 10f). At the end of the century, the fractional contribution of soil evaporation diminishes by 20–30% in comparison with the historical values (Figure 10g). The evaporation from vegetation constitutes 30–50% of the total evaporation (Figure 11a–d). It is at its maximum over the southern boreal forest of northern Alberta and Saskatchewan, and south-central British Columbia. In the near and far future, evaporation from vegetation increases by 5–10% over Alberta and central Saskatchewan (Figure 11e–f) but decreases by 10–15% over coastal British Columbia. At the end of the century, evaporation from vegetation increases by 5–15% compared with the historical baseline over northern Alberta, northern and central Saskatchewan, and eastern British Columbia (Figure 11g).
The future projections indicate that the loss of moisture driven by evaporation diminishes widely over western Canada excluding southern Saskatchewan. A further examination reveals that a weakening of the evaporative loss from the soil and land surface contributed to this overall decrease in the evaporation. However, moisture loss due to transpiration increases in the future periods. Thus, the increased transpiration due to the warm temperatures counteracts the increase in total precipitation in the growing period.
In SSP5 scenario, the total precipitation increases over western Canada except for the coastal regions of British Columbia. However, the warm climate in the future periods results in a vigorous loss of moisture due to evapotranspiration, which leads to an enhanced dryness throughout western Canada. A study of the fractional contribution of transpiration and evaporation reveals that enhanced transpiration invigorates the process of moisture loss due to evapotranspiration.
4. Conclusions
In this study, we examined future projections of the water balance for western Canada, which includes the Prairie provinces and British Columbia. We used 25 ensemble members of CanESM5 from the CMIP6 archive for historical simulations and future scenarios based on the emission pathway SSP5. We introduced a new Net Water Balance Index (NWBI) and examined the spatial distribution of the NWBI, and total amounts of precipitation, evaporation, transpiration, evaporation from the soil, and evaporation from vegetation for four different time periods: historical (1975–2005), near future (2021–2050), far future (2051–2080), and the end of the century (2081–2100). The main findings from this study can be summarized as follows:
- (1)
- Decreases in the NWBI indicate enhanced dryness over western Canada in all future periods;
- (2)
- Increased total evapotranspiration surpasses the increase in total precipitation by 100 mm to 300 mm resulting in more dryness;
- (3)
- Increased transpiration by 10–20% in the future in comparison with the historical baseline results in higher evapotranspiration;
- (4)
- Total evaporation decreases by 15–20% as the fractional contribution of evaporation from soil decreases by 20–25%; and
- (5)
- Total evaporation from vegetation increases by 10–15%.
Historically, coastal British Columbia is the wettest region of Canada, and the semi-arid to sub-humid southern Prairies are the driest major region. However, under the influence of a warming climate and changes in atmospheric circulation, future projections of the NWBI exhibit the most prominent decrease over coastal British Columbia and a moderate decrease over south-central Saskatchewan and southwestern Alberta, suggesting a less wet coastal British Columbia and more dry Prairies. The future projections under the SSP 585 scenario indicate an overall increase in precipitation in the warm season (April to October) in conjunction with a larger increase in moisture loss due to evapotranspiration resulting in enhanced dryness over western Canada. Evapotranspiration consists primarily of total evaporation with transpiration representing a comparatively smaller fraction. A larger part of the total evaporation consists of evaporation from the soil, lakes, rivers, and wetlands. In this study, a comparison of the changes in evaporation and transpiration in the near future, far future, and the end of the century reveals that the increase in evapotranspiration surpasses the increase in total precipitation in the growing season. This intensified evapotranspiration in the future is mainly due to enhanced transpiration and increased evaporation from vegetation, which corresponds well with the concept of increased greening of the Prairies in the future [15]. Thus, the projections of the dry (wet) conditions in the future using the newly implemented NWBI correspond well with previous studies.
The warmer future climate will influence the moisture flux from the Pacific Ocean by altering sea surface temperatures and atmospheric circulation. The atmospheric river, which is the primary driver of the west-to-east moisture transport, is likely to undergo a pattern shift resulting in a change in the total precipitation along the coastal regions of British Columbia and further inland [16,17]. The low-pressure systems from the Pacific embedded in the zonal wind bring moisture to the interior of western Canada, including the Prairies. A shift in this circulation pattern would result in changes in precipitation over the agricultural lands in the Prairie Provinces. Precipitation over the region is the primary agricultural water supply. Dryland farming dominates the agricultural landscape. The sources of irrigation water, the rivers fed by the melting of mountain glaciers and snowpacks, are exhibiting declining summer flow) [18,19]. The warmer climate further contributes to enhanced evapotranspiration, resulting in more vigorous moisture loss from soil and vegetation in the growing season, especially in the summer months. However, the increased precipitation could also result in more vegetation, which accounts for the enhanced transpiration and the increased evaporation from the vegetation. The enhanced evapotranspiration results in the formation of the clouds on hot days, causing more convective precipitation over the region locally [20,21]. The loss of moisture by evaporation from the soil also is reduced by denser vegetation cover. The lengthening of the warm growing season could also result in a larger crop yield in the agricultural zones of the Prairies in those years with sufficient soil moisture [22].
The increase in dryness in the future has significant implications for agriculture in western Canada and particularly the Prairie region, which is defined by a negative annual average water balance, and which accounts for more than 80% of the nation’s agricultural land. The agricultural sector will need to adapt to minimize the impacts of intense dry periods by storing extra water from increased precipitation. Efforts to expand the irrigated acreage could compensate for the enhanced moisture loss during the intensely warm and dry periods. This assumes adequate water supplies from rivers and reservoirs.
Supplementary Materials
The following supporting information can be downloaded at: https://www.mdpi.com/article/10.3390/w14050691/s1, Figure S1: Monthly NWBF change (Near Future–Historical); Figure S2: Monthly NWBF change (Far Future–Historical); Figure S3: Monthly NWBF (End of the Century–Historical).
Author Contributions
Conceptualization, S.B. and D.J.S.; methodology, S.B. and D.J.S.; software, S.B.; validation, S.B. and D.J.S.; formal analysis, S.B.; investigation, S.B. and D.J.S.; resources, D.J.S.; writing—original draft preparation, S.B.; writing—review and editing, D.J.S.; visualization, S.B.; supervision, D.J.S.; project administration, D.J.S. All authors have read and agreed to the published version of the manuscript.
Funding
This research received no external funding.
Data Availability Statement
No new data were created or analyzed in this study. Data sharing is not applicable to this study.
Acknowledgments
We acknowledge the World Climate Research Programme’s Working Group on Coupled Modelling, which is responsible for CMIP, and we thank the Canadian Centre for Climate Modelling and Analysis for producing and making available their CanESM5 output. For CMIP, the U.S. Department of Energy’s Program for Climate Model Diagnosis and Intercomparison provides coordinating support and led the development of software infrastructure in partnership with the Global Organization for Earth System Science Portals.
Conflicts of Interest
The authors declare no conflict of interest.
References
- Farm Credit Canada. 2019 Diversifying Canada’s Agriculture Exports; Farm Credit Canada: Regina, SK, Canada, 2019; 16 p, Available online: https://www.fcc-fac.ca/fcc/resources/trade-rankings-report-2019-e.pdf (accessed on 11 January 2022).
- Sauchyn, D.; Davidson, D.; Johnston, M. Prairie Provinces. In Chapter 4 in Canada in a Changing Climate: Regional Perspectives Report; Government of Canada: Ottawa, ON, Canada, 2017. [Google Scholar]
- Zhang, X.; Flato, G.; Kirchmeier-Young, M.; Vincent, L.A.; Wan, H.; Wang, X.; Rong, R.; Fyfe, J.C.; Li, G.; Kharin, V.V. Changes in temperature and precipitation across Canada. In Canada’s Changing Climate Report; Government of Canada: Ottawa, ON, Canada, 2019; pp. 112–193. Available online: https://www.nrcan.gc.ca/sites/www.nrcan.gc.ca/files/energy/Climate-change/pdf/CCCR_Chapter4-Temperature%20and%20Precipitation%20Across%20Canada.pdf (accessed on 11 January 2022).
- Gillet, N.; Flato, G.; Zhang, X.; Derksen, C.; Bonsal, B.; Greenan, B.; Bush, E.; Shepherd, M.; Peters, D.; Gilbert, D. Canada’s Changing Climate Report; Government of Canada: Ottawa, ON, Canada, 2019; ISBN 978-0-660-30222-5.
- Vincent, L.A.; Zhang, X.; Mekis, É.; Wan, H.; Bush, E.J. Changes in Canada’s Climate: Trends in Indices Based on Daily Temperature and Precipitation Data. Atmos. Ocean 2018, 56, 332–349. [Google Scholar] [CrossRef] [Green Version]
- Kerr, S.; Andreichuk, Y.; Sauchyn, D. Re-Evaluating the Climate Factor in Agricultural Land Assessment in a Changing Climate—Saskatchewan, Canada. Land 2019, 8, 49. [Google Scholar] [CrossRef] [Green Version]
- Qian, B.; Zhang, X.; Smith, W.; Grant, B.; Jing, Q.; Cannon, A.J.; Neilsen, D.; McConkey, B.; Li, G.; Bonsal, B.; et al. Climate change impacts on Canadian yields of spring wheat, canola and maize for global warming levels of 1.5 °C, 2.0 °C, 2.5 °C and 3.0 °C. Environ. Res. Lett. 2019, 14, 074005. [Google Scholar] [CrossRef]
- Qian, B.; Jing, Q.; Bélanger, G.; Shang, J.; Huffman, T.; Liu, J.; Hoogenboom, G. Simulated canola yield responses to climate change and adaptation in Canada. Agron. J. 2018, 110, 133–146. [Google Scholar] [CrossRef] [Green Version]
- Qian, B.; De Jong, R.; Huffman, T.; Wang, H.; Yang, J. Projecting yield changes of spring wheat under future climate scenarios on the Canadian Prairies. Theor. Appl. Climatol. 2016, 123, 651–669. [Google Scholar] [CrossRef]
- Kurkute, S.; Li, Z.; Li, Y.; Huo, F. Assessment and projection of the water budget over western Canada using convection-permitting weather research and forecasting simulations. Hydrol. Earth Syst. Sci. 2020, 24, 3677–3697. [Google Scholar] [CrossRef]
- Newton, B.W.; Farjad, B.; Orwin, J.F. Spatial and temporal shifts in historic and future temperature and precipitation patterns related to snow accumulation and melt regimes in Alberta, Canada. Water 2021, 13, 1013. [Google Scholar] [CrossRef]
- Eyring, V.; Bony, S.; Meehl, G.A.; Senior, C.A.; Stevens, B.; Stouffer, R.J.; Taylor, K.E. Overview of the Coupled Model Intercomparison Project Phase 6 (CMIP6) experimental design and organization. Geosci. Model Dev. 2016, 9, 1937–1958. [Google Scholar] [CrossRef] [Green Version]
- Swart, N.C.; Cole, J.N.S.; Kharin, V.V.; Lazare, M.; Scinocca, J.F.; Gillett, N.P.; Anstey, J.; Arora, V.; Christian, J.R.; Hanna, S.; et al. The Canadian Earth System Model version 5 (CanESM5.0.3). Geosci. Model Dev. 2019, 12, 4823–4873. [Google Scholar] [CrossRef] [Green Version]
- O’Neill, B.C.; Tebaldi, C.; Van Vuuren, D.P.; Eyring, V.; Friedlingstein, P.; Hurtt, G.; Knutti, R.; Kriegler, E.; Lamarque, J.F.; Lowe, J.; et al. The Scenario Model Intercomparison Project (ScenarioMIP) for CMIP6. Geosci. Model Dev. 2016, 9, 3461–3482. [Google Scholar] [CrossRef] [Green Version]
- Riahi, K.; van Vuuren, D.P.; Kriegler, E.; Edmonds, J.; O’Neill, B.C.; Fujimori, S.; Bauer, N.; Calvin, K.; Dellink, R.; Fricko, O.; et al. The Shared Socioeconomic Pathways and their energy, land use, and greenhouse gas emissions implications: An overview. Glob. Environ. Chang. 2017, 42, 153–168. [Google Scholar] [CrossRef] [Green Version]
- Sulla-Menashe, D.; Woodcock, C.E.; Friedl, M.A. Canadian boreal forest greening and browning trends: An analysis of biogeographic patterns and the relative roles of disturbance versus climate drivers. Environ. Res. Lett. 2018, 13, 014007. [Google Scholar] [CrossRef]
- Espinoza, V.; Waliser, D.E.; Guan, B.; Lavers, D.A.; Ralph, F.M. Global Analysis of Climate Change Projection Effects on Atmospheric Rivers. Geophys. Res. Lett. 2018, 45, 4299–4308. [Google Scholar] [CrossRef]
- Anis, M.R.; Sauchyn, D.J. Ensemble Projection of Future Climate and Surface Water Supplies in the North Saskatchewan River Basin above Edmonton, Alberta, Canada. Water 2021, 13, 2425. [Google Scholar] [CrossRef]
- Warner, M.D.; Mass, C.F. Changes in the climatology, structure, and seasonality of northeast pacific atmospheric rivers in CMIP5 climate simulations. J. Hydrometeorol. 2017, 18, 2131–2141. [Google Scholar] [CrossRef]
- Gameda, S.; Qian, B.; Campbell, C.A.; Desjardins, R.L. Climatic trends associated with summerfallow in the Canadian Prairies. Agric. For. Meteorol. 2007, 142, 170–185. [Google Scholar] [CrossRef]
- Betts, A.K.; Desjardins, R.; Worth, D.; Cerkowniak, D. Impact of land use change on the diurnal cycle climate of the Canadian Prairies. J. Geophys. Res. Atmos. 2013, 118, 11996–12011. [Google Scholar] [CrossRef]
- Li, G.; Zhang, X.; Cannon, A.J.; Murdock, T.; Sobie, S.; Zwiers, F.; Anderson, K.; Qian, B. Indices of Canada’s future climate for general and agricultural adaptation applications. Clim. Chang. 2018, 148, 249–263. [Google Scholar] [CrossRef] [Green Version]
Figure 1.
Canada’s agricultural ecumene. More than 80% is located in the Prairie Provinces. (Source: Statistics Canada).
Figure 1.
Canada’s agricultural ecumene. More than 80% is located in the Prairie Provinces. (Source: Statistics Canada).

Figure 2.
(a) Mean daily minimum winter temperature, Indian Head, 1892 to 2019; (b) Annual spring wheat yield (bu/ac); and (c) June–July precipitation, Indian Head (Saskatchewan), 1892 to 2019.
Figure 2.
(a) Mean daily minimum winter temperature, Indian Head, 1892 to 2019; (b) Annual spring wheat yield (bu/ac); and (c) June–July precipitation, Indian Head (Saskatchewan), 1892 to 2019.

Figure 3.
Spatial representation of the total variance (%) in total precipitation (mm) among the 25 ensemble members of CanESM5 from the CMIP6 SSP5 pathway. (a) Historical; (b) near future; (c) far future; (d) end of the century.
Figure 3.
Spatial representation of the total variance (%) in total precipitation (mm) among the 25 ensemble members of CanESM5 from the CMIP6 SSP5 pathway. (a) Historical; (b) near future; (c) far future; (d) end of the century.

Figure 4.
A scatter plot showing the total evapotranspiration (mm/month) against total precipitation (mm/month) for April–October, for each ensemble member. The differently colored symbols represent different time periods: the blue dot is historical, the red square is near future, the green triangle is far future, and the brown diamond is end of the century.

Figure 5.
Ensemble mean of the Net Water Balance Index (NWBI) for April–October calculated from 25 ensemble members of CanESM5. (a) Historical (1975–2005); (b) near future (2021–2050); (c) far future (2051–2080); (d) end of the century (1981–2100); (e) difference (b–a); (f) difference (c–a); (g) difference (d–a).

Figure 6.
Ensemble mean of total precipitation (mm) for April–October calculated from 25 ensemble members of CanESM5. (a) Historical (1975–2005); (b) near future (2021–2050); (c) far future (2051–2080); (d) end of the century (1981–2100); (e) difference (b–a); (f) difference (c–a); (g) difference (d–a).

Figure 7.
Ensemble mean of total evapotranspiration (mm) for April–October calculated from 25 ensemble members of CanESM5. (a) Historical (1975–2005); (b) near future (2021–2050); (c) far future (2051–2080); (d) end of the century (1981–2100); (e) difference (b–a); (f) difference (c–a); (g) difference (d–a).

Figure 8.
Ensemble mean of the fractional contribution of transpiration (%) to total evapotranspiration for April–October calculated from 25 ensemble members of CanESM5. (a) Historical (1975–2005); (b) near future (2021–2050); (c) far future (2051–2080); (d) end of the century (1981–2100); (e) difference (b–a); (f) difference (c–a); (g) difference (d–a).

Figure 9.
Ensemble mean of the fractional contribution of total evaporation (%) to total evapotranspiration for April–October calculated from 25 ensemble members of CanESM5. (a) Historical (1975–2005); (b) near future (2021–2050); (c) far future (2051–2080); (d) end of the century (1981–2100); (e) difference (b–a); (f) difference (c–a); (g) difference (d–a).

Figure 10.
Ensemble mean of the fractional contribution of total evaporation from soil (%) to total evaporation for April–October calculated from 25 ensemble members of CanESM5. (a) Historical (1975–2005); (b) near future (2021–2050); (c) far future (2051–2080); (d) end of the century (1981–2100); (e) difference (b–a); (f) difference (c–a); (g) difference (d–a).

Figure 11.
Ensemble mean of the fractional contribution of total evaporation from vegetation (%) to total evaporation for April–October calculated from 25 ensemble members of CanESM5. (a) Historical (1975–2005); (b) near future (2021–2050); (c) far future (2051–2080); (d) end of the century (1981–2100); (e) difference (b–a); (f) difference (c–a); (g) difference (d–a).

Publisher’s Note: MDPI stays neutral with regard to jurisdictional claims in published maps and institutional affiliations. |
© 2022 by the authors. Licensee MDPI, Basel, Switzerland. This article is an open access article distributed under the terms and conditions of the Creative Commons Attribution (CC BY) license (https://creativecommons.org/licenses/by/4.0/).
Share and Cite
MDPI and ACS Style
Basu, S.; Sauchyn, D.J. Future Changes in the Surface Water Balance over Western Canada Using the CanESM5 (CMIP6) Ensemble for the Shared Socioeconomic Pathways 5 Scenario. Water 2022, 14, 691. https://doi.org/10.3390/w14050691
AMA Style
Basu S, Sauchyn DJ. Future Changes in the Surface Water Balance over Western Canada Using the CanESM5 (CMIP6) Ensemble for the Shared Socioeconomic Pathways 5 Scenario. Water. 2022; 14(5):691. https://doi.org/10.3390/w14050691
Chicago/Turabian StyleBasu, Soumik, and David J. Sauchyn. 2022. "Future Changes in the Surface Water Balance over Western Canada Using the CanESM5 (CMIP6) Ensemble for the Shared Socioeconomic Pathways 5 Scenario" Water 14, no. 5: 691. https://doi.org/10.3390/w14050691
Note that from the first issue of 2016, this journal uses article numbers instead of page numbers. See further details here.