
A Novel Prediction and Planning Model for the Benefit of Irrigation Water Allocation Based on Deep Learning and Uncertain Programming


The State Key Laboratory for Manufacturing System Engineering, Xi’an Jiaotong University, Xi’an 710049, China
*
Author to whom correspondence should be addressed.
Water 2022, 14(5), 689; https://doi.org/10.3390/w14050689
Submission received: 16 January 2022
/
Revised: 11 February 2022
/
Accepted: 21 February 2022
/
Published: 22 February 2022
(This article belongs to the Special Issue Agricultural Water Saving: Advanced Technologies for Water Resources Efficient Utilization)
Abstract
:Due to population growth and human activities, water shortages have become an increasingly serious concern in the North China Plain, which has become the world’s largest underground water funnel. Because the yield per unit area, planting area of crops, and effective precipitation in the region are uncertain, it is not easy to plan the amount of irrigation water for crops. In order to improve the applicability of the uncertainty programming model, a hybrid LSTM-CPP-FPP-IPP model (long short-term memory, chance-constrained programming, fuzzy possibility programming, interval parameter programming) was developed to plan the irrigation water allocation of irrigation system under uncertainty. The LSTM (long short-term memory) model was used to predict crop yield per unit area, and CPP-FPP-IPP programming (chance-constrained programming, fuzzy possibility programming, interval parameter programming) was used to plan the crop area and the effective precipitation under uncertainty. The hybrid model was used for the crop production profit of winter wheat and summer corn in five cities in the North China Plain. The average absolute error between the model prediction value and the actual value of the yield per unit area of winter wheat and summer maize in four cities in 2020 was controlled within the range of 14.02 to 696.66 kg/hectare. It shows that the model can more accurately predict the yield per unit area of crops. The planning model for the benefit of irrigation water allocation generated three scenarios of rainfall level and four planting intentions, and compared the planned scenarios with the actual production benefits of the two crops in 2020. In a dry year, the possibility of planting areas for winter wheat and summer corn is optimized. Compared with the traditional deterministic planning method, the model takes into account the uncertain parameters, which helps decision makers seek better solutions under uncertain conditions.
1. Introduction
The North China Plain is the main grain producing area in China. At the same time, the contradiction between the demand for irrigation water and water supply in the area is most prominent. Because the continuing development of irrigated agriculture has caused the continued overexploitation of groundwater, the North China Plain has become the world’s largest underground water funnel, which has also led to land subsidence, saltwater intrusion, the shrinkage of rivers and wetlands, land degradation, and a series of ecological and environmental problems [1]. For regional agricultural irrigation water distribution, the main challenges in water resources allocation are the uncertainty of water supply caused by climate change, the lack of consideration about the dynamic allocation of water resources, and the lack of equitable water allocation, which may lead to intensified conflicts among the different sectors of water users [2].
Aiming at the problem of water resources conflict, extensive studies have been carried out on the optimal management of irrigation water resources. For example, Fu et al. [3] constructed a water resource allocation model based on game theory and multi-objective optimization and studied the differences between the two models. By comparing historical patterns of irrigation water requirements (IWRs) to rice planting records, Rivera et al. [4] presented an example of characterizing patterns in irrigation water requirements and quantifying the impact that shifting the planting date could have on reducing irrigation water demands. Feng et al. [5] established a multi-objective dynamic programming optimal water resources allocation model under uncertainties, which could be a resolution for water disputes as it addresses simultaneously economic, social and environmental benefits. The proposed model considers maximizing the minimum satisfaction degree of each water sector, maximizing the utilization efficiency of water resources in the basin, and maximizing economic benefits. Shen et al. [6] constructed a synergetic theory-based water resource allocation model by investigating the synergetic principle of each link in the allocation of water resources. The objective equation was established for determining the optimal comprehensive benefit of the composite system. In fact, the allocation of water resources involves many factors such as natural conditions, policies and regulations, and human activity. During the planning process, there are many independent and dependent variables of the system, and the relationship between variables is complicated.
Water planning and management programming that are effective for irrigation purposes are required to ensure sustainable agriculture. There are a few developed models that predict the suitability of water for irrigation purposes. Ali et al. [7] developed and evaluated eight machine learning (ML) models to numerically predict the quality of water irrigation parameters used for evaluating their suitability in agricultural purposes using electrical conductivity and pH as input variables in the semi-arid region of Bou Regreg in Morocco. Sundararajan et al. [8] proposed a more comprehensive and extensive review of machine learning techniques for drought forecasting, especially reviewing feature selection, feature extraction, and dimensionality reduction methods. Peng et al. [9] used the collected environmental data to build a water demand prediction model based on the back propagation (BP) neural network. Although drought, water quality and other factors were predicted using machine learning; the irrigation system in a whole city is complex and variable, and it is difficult to obtain all of the environmental information in developing countries as it is laborious and expensive. The aim of this study is to develop a prediction and planning model of the benefits of irrigation water allocation based on machine learning and uncertain programming; the key point of the study is the relationship between irrigation water consumption and production benefits under uncertain conditions.
In recent years, Li et al. [10] developed a multi-scale, multi-objective programming model for the simultaneous optimal allocation of irrigation water and cropland to balance conflicts between farmers’ income and the sustainable development of irrigation districts. Li et al. [11] developed a simulation-based optimization model for the spatiotemporal allocation of irrigation water, which integrated a distributed farmland water balance model for simulating hydrological processes in farmland and an optimization model to maximize irrigation and precipitation use efficiency. Hassan et al. [12] proposed a demand-driven allocation scheme for surface water coupled with an auction-based pricing mechanism. Imron et al. [13] used linear programming to optimize the allocation of irrigation water. However, the relationship between decision variables and the planning model was general very complex due to complicated processes of farmland water balance, crop growth and yield under different climate, soil, and irrigation conditions. Previous correlational studies either did not effectively handle the relationships between crop planting area and yield per unit in a large irrigation system, or ignored the interrelation of the benefits of irrigation water allocation and crop yield per unit. Uncertainty optimization methods such as interval planning, chance-constrained planning, fuzzy possibility planning, and secondary planning have provided a theoretical basis for solving uncertain parameters. Interval mathematical programming (IMP) is a promising method for addressing such an optimization framework by integrating the interval crop water production functions and other interval parameters or variables. Fuzzy mathematical programming can be effective for fuzzy uncertainties and constraint violation issues. Zhang et al. [14] proposed a nonlinear inexact two-stage management (NITM) model which was proposed for optimal agricultural irrigation water management problems under uncertainty conditions. Moreover, the model was derived from incorporating interval parameter programming (IPP), two-stage stochastic programming (TSP), and quadratic programming (QP) within the agricultural water management model. Zhang et al. [15] proposed an improved interval-based fuzzy credibility-constrained programming approach for supporting optimal irrigation water management under uncertainty. Cheng et al. [16] proposed an interval two-stage stochastic programming model and applied it to account for the impacts of agricultural water price reform and a water-saving technology subsidy in Heilongjiang Province, China. Gong et al. [17] proposed an inexact programming model for optimizing irrigation water resources based on crop water requirements in consideration of effective precipitation and uncertainty. Yao et al. [18] proposed robust programming for basin-level water allocation with uncertain water availability and a policy-driven scenario analysis. Xu et al. [19], using a combination of an interpretative structural model (ISM) and an analytical network process (ANP), developed a hierarchical structure model, that is, composed of direct factors, indirect factors, and basic factors. Li et al. [20] developed a risk-based interval-stochastic optimization modelling approach for agricultural water allocation in response to the complexity arising from uncertainties and risk in agricultural water management systems. Zhang et al. [21] developed a risk-averse stochastic quadratic model with recourse for supporting irrigation water management in uncertain and nonlinear environments. Cai et al. [22] developed an integrated prediction-optimization modeling approach for the coupled risk management of water and energy nexus systems.
Yield prediction is of great significance for yield mapping, crop market planning, crop insurance, and harvest management [23]. The crop yield processes and strategies vary with time, they are profoundly non-linear naturally, and are intricate due to the integration of a wide extent of correlated factors, characterized and impacted by non-arbitrate runs and external factors [24]. Based on the study of various survey papers, various deep learning, machine learning and ANN algorithms have been found in all of the crop predictions and have been implemented to predict yield forecasts. These algorithms have included regression tree, random forest, multivariate regression, association rule mining, convolutional neural networks, recurrent neural networks, deep fully connected neural networks, and long short-term memory (LSTM) [25,26,27]. There are several algorithms that may not be bound by biases or require a huge manual effort in label creation in order to derive the insights directly from the data, such as long short-term memory models, which are essentially designed to tackle the long-term correlation issue that exists in recurrent neural networks. Haider et al. and Alhnaity et al. [28] employed the LSTM to predict yield and plant growth variation across two different scenarios—tomato yield forecasting and Ficus benjamina stem growth—the results of which verify that those models achieve a satisfying performance in terms of forecasting.
In view of the regional characteristics and uncertainties in the planning of irrigation water allocation systems, it is not enough to only consider crop water consumption, crop yields and the benefits of water allocation. At present, there are few studies on the research of the benefits of irrigation allocation in a city based on uncertain programming and deep learning. In order to promote farmers’ income and the applicability of the uncertainty planning model, this study developed a novel prediction and planning model for the benefits of irrigation allocation (LSTM-CCP-FPP-IPP) based on deep learning and hybrid fuzzy uncertainty optimization methods, including interval planning, opportunity-constrained planning, deep learning technology, and the function of crop water production. The main contributions of this study are the following: (1) We developed and tested DL (LSTM) prediction models to predict crop yield per unit and growth in five cities of the North China Plain for (a) winter wheat and (b) summer corn. (2) We developed a novel model for planning irrigation water allocation based on deep learning and uncertain programming. The hybrid model is applied to five major grain-producing cities in the North China Plain, which can handle uncertainties expressed as fuzzy-boundary intervals and random variables. Major highlights of this study include using crop water production function as a connection and integrating the crop yield per unit prediction model with uncertain planning programming to allocate irrigation water to a city. The overview of the study area and framework of the prediction and planning model were in the second part. The LSTM prediction model and CCP-FFP-IPP planning programming and crop water production function are in the third part of this article. The study objective is discussed in the following section, and the last section of this article includes the result analysis and conclusions.
2. The Study System
2.1. Study Area
The North China Plain, one of the most important food production areas in China, is the key to ensuring food security and maintaining social stability. The high yields are maintained and increased over time through the large supplies of irrigation water. However, this intensive production has caused a rapid decline in groundwater levels, an increase in nitrate in groundwater, and other serious environmental consequences. At the same time, the North China Plain has an arid and semi-arid climate, with the precipitation from June to September accounting for about 65% to 85% of the annual precipitation, and the precipitation from March to June accounting for about 20% to 30% of the annual precipitation. The low precipitation and the inhomogeneity of the annual distribution do not meet the water demand of major food crops in the growth period, so irrigation water for food production in North China Plain is an important safeguard [29].
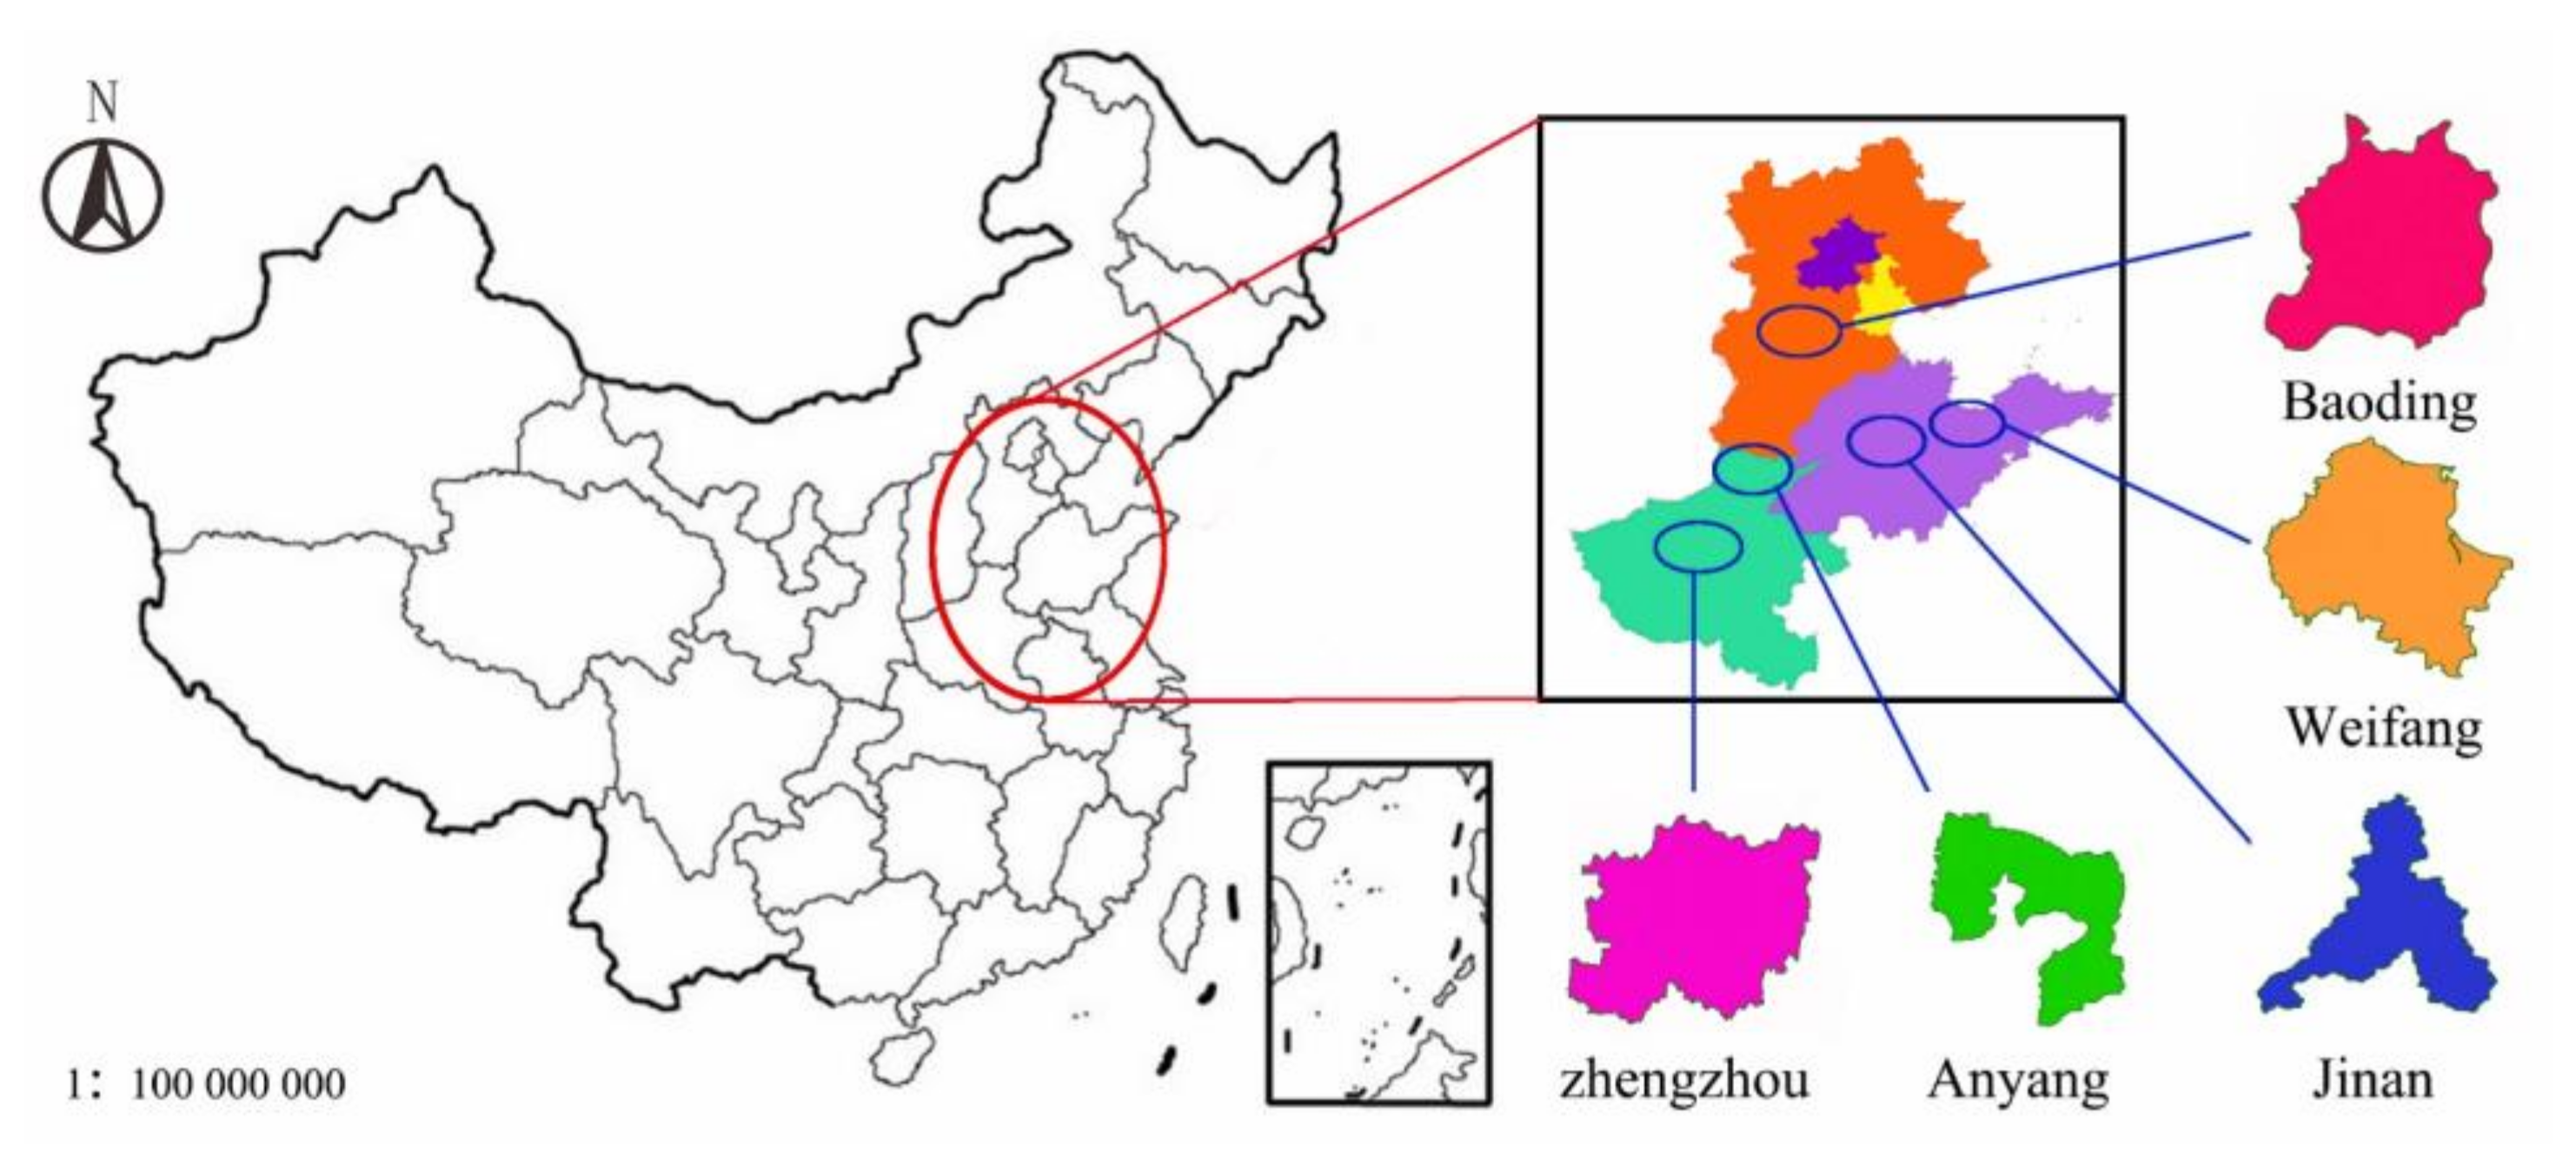
Winter wheat and summer corn are the main food crops grown in this area. This article selects five major food production cities as the study areas, including Anyang City, Henan Province, Zhengzhou City, Henan Province, Weifang City, Shandong Province, Jinan City, Shandong Province, and Baoding City, Hebei Province. Figure 1 shows the location of the studied cities in China. The geographic location and altitude information of these five cities are shown in Table 1. The table shows that the annual average temperature of the five study areas has little difference. Baoding City has the lowest average annual precipitation, and Weifang City has the highest annual average precipitation.
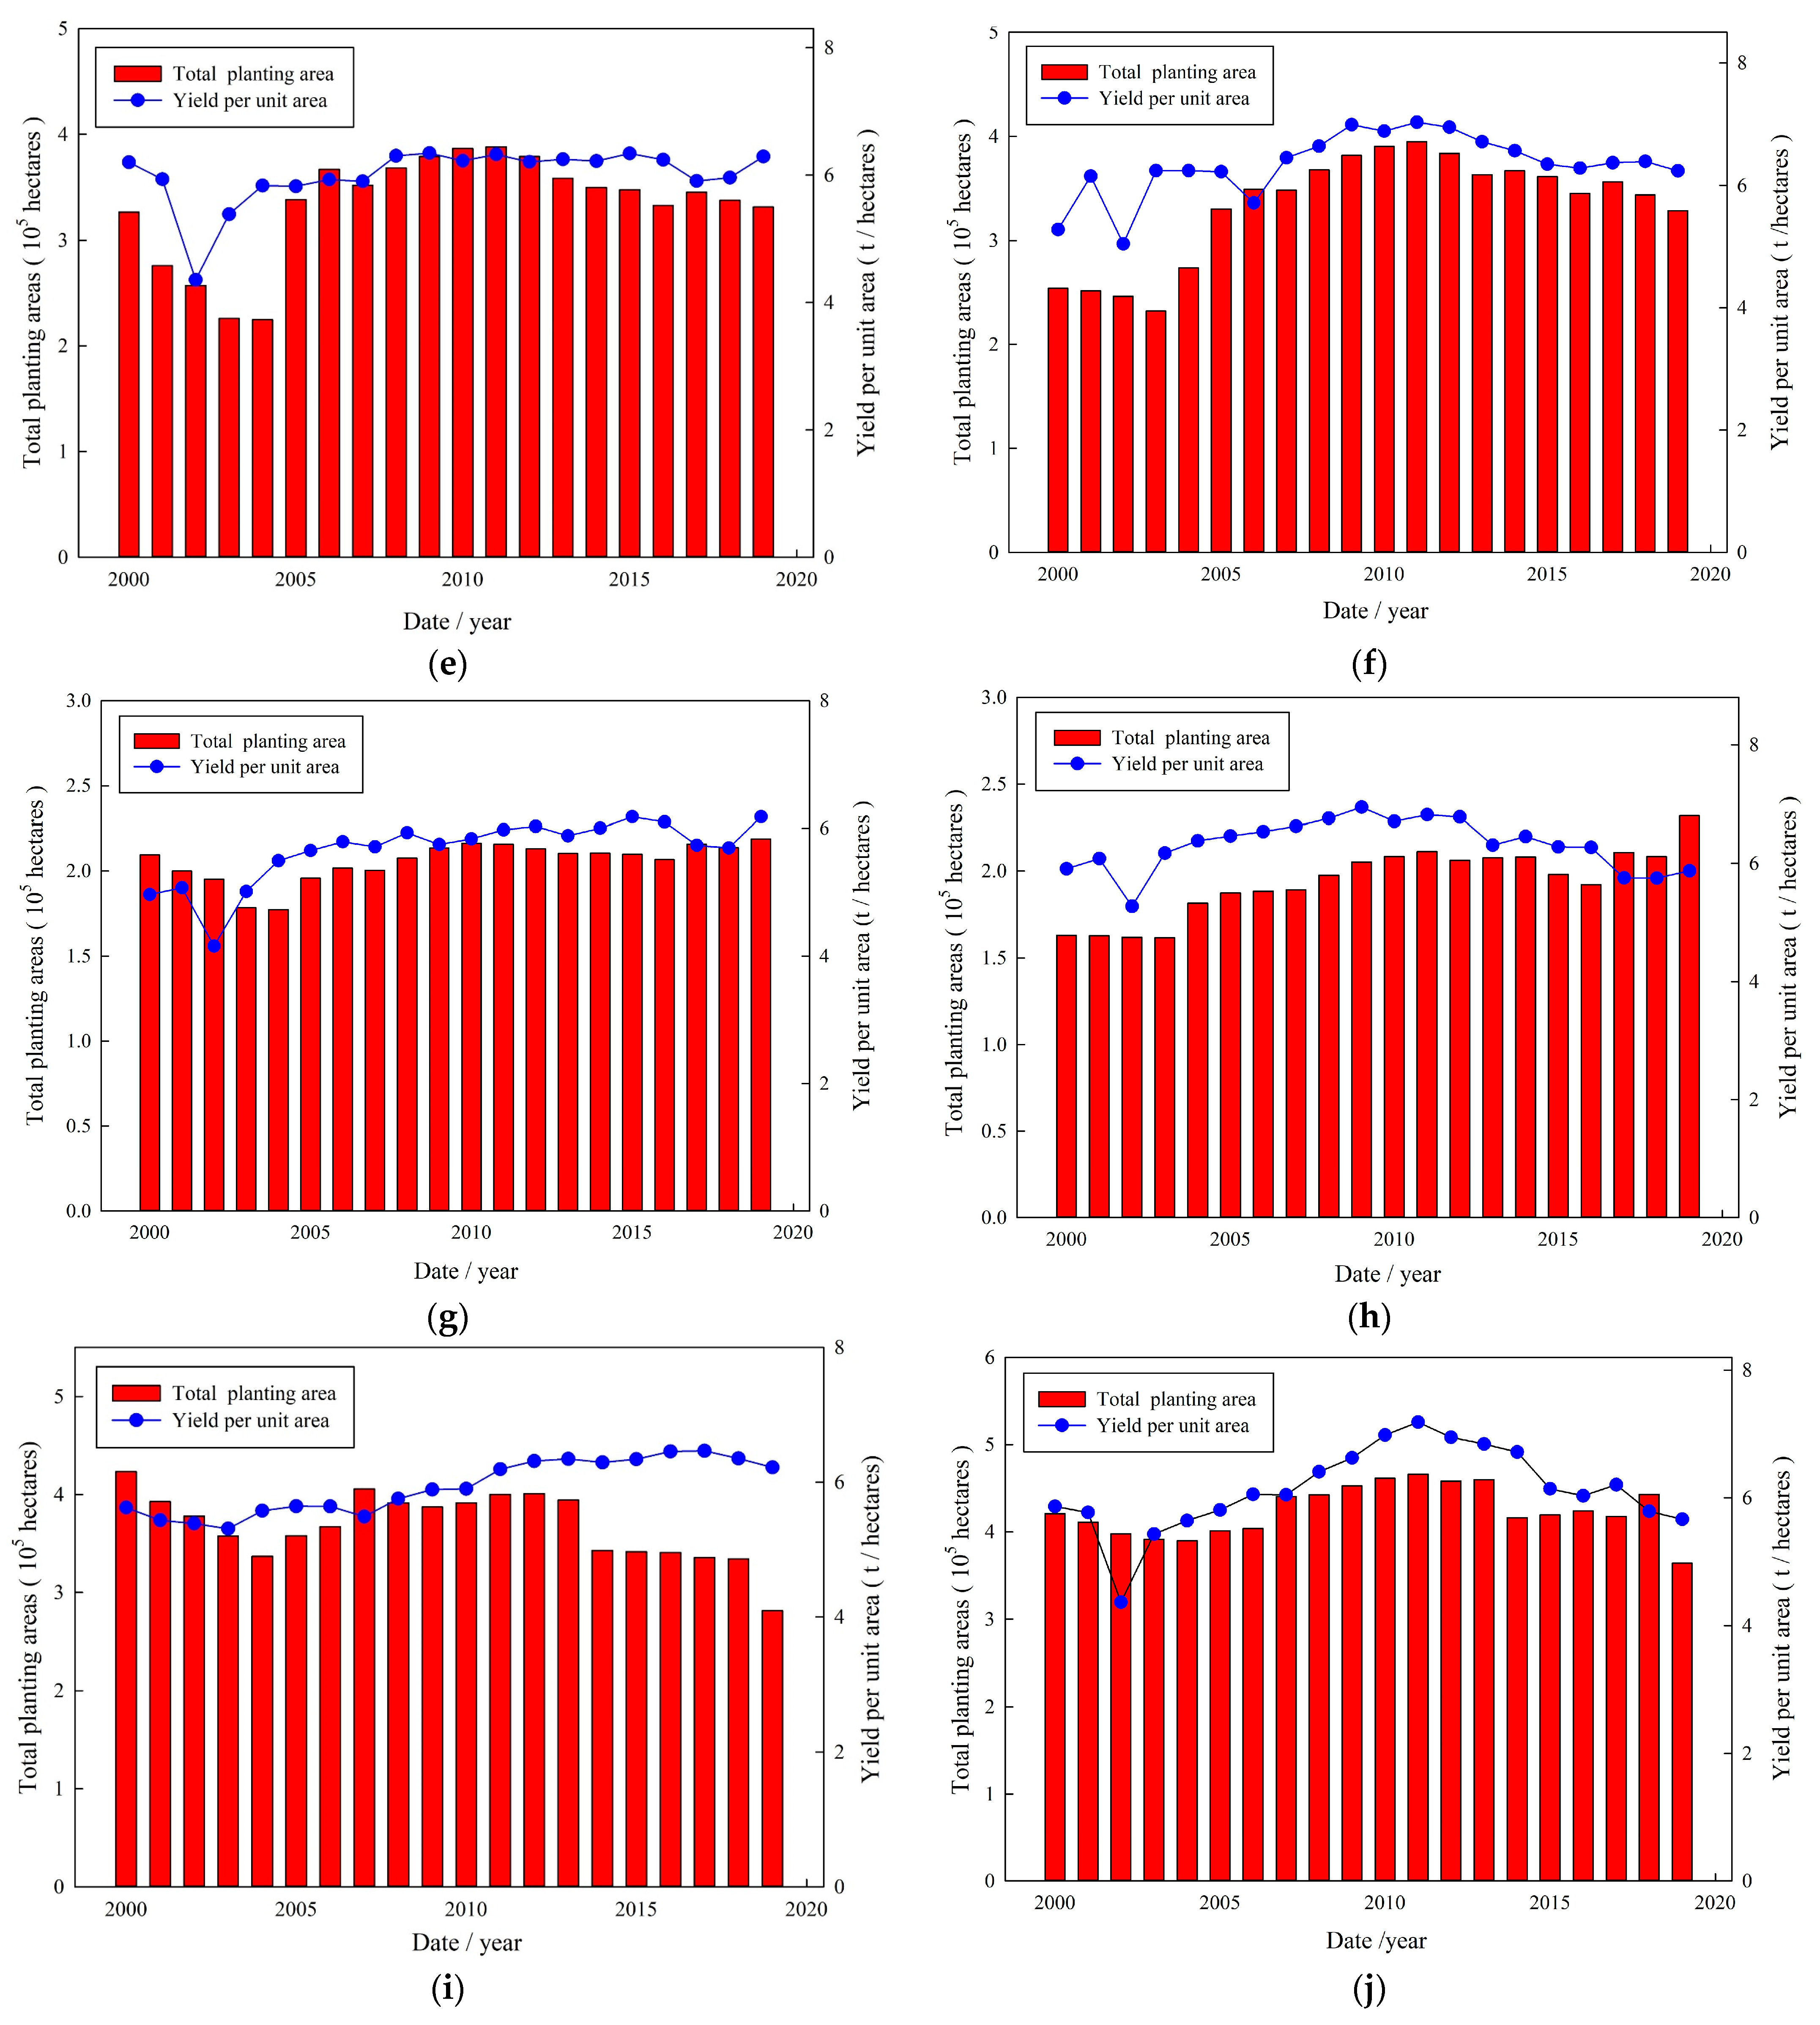
According to the Anyang, Zhengzhou, Weifang, Jinan, and Baoding Statistical Yearbook of the past twenty years [30,31,32,33,34], the data on the crop planting area and yield per unit area of winter wheat and summer maize in the five studied cities are shown in Figure 2. The figure shows that the yield per unit area of summer corn in Weifang and Baoding has shown a downward trend year by year; the yield per unit area of winter wheat in Weifang and Baoding City have been stable; and the yield per unit area of summer corn and winter wheat in Anyang, Zhengzhou, and Jinan have also been in a stable state. The numerical range of yield per unit area of winter wheat in the five cities is from 3.32 ton (1000 kg) per hectares to 6.78 ton per hectares, and the numerical range of yield per unit area of summer crops in the five cities is from 3.99 ton per hectares to 7.18 ton per hectares; this shows that the data of the yield per unit area of the two crops in the five cities have a relatively large range in the past 20 years. The regions with planting areas for winter wheat, ranked from high to low, are Baoding, Weifang, Anyang, Jinan and Zhengzhou, and the regions with planting areas for summer maize, ranked from high to low, are Baoding, Weifang, Anyang, Jinan and Zhengzhou.
The book “National Science and Technology Basic Work Special Projects Atlas of Growth Periods of Major Crops in China” [35] is a monograph that reflects the impact of large-scale climate change on the growth periods of major crops in the country and the characteristics of changes in the growth periods of major crops. In accordance with the book, the growth periods (daily numbers) of winter wheat and summer corn planted in the five study areas are shown in Table 2 and Table 3, respectively. Table 2 shows that the planting date, jointing date, flowering date, and harvest date for winter wheat in five studied cities were basically the same. Particularly, the sowing date, rejuvenation date, jointing date, flowering date, and harvest date in Baoding City were ten days later than the other four cities. It can be seen from Table 3 that the sowing and harvesting dates for summer corn in Weifang City and Baoding City were later than other cities, and the jointing dates and heading dates were basically the same in the five cities.
According to the growth dates and the daily ordinal numbers of winter wheat and summer maize in the five cities, the cumulative precipitation for each growth stage was calculated by summing the daily precipitation of each city, and the daily precipitation data of the five study cities from 1980 to 2019 were from the National Meteorological Science Data Center (http://data.cma.cn, accessed on 30 December 2019). The effective precipitation calculation method recommended by the United States Department of Agriculture Soil Conservation Service was used to calculate the effective precipitation [36]. The annual effective precipitation during the full growth period of winter wheat and summer maize in the five cities in the past 40 years is shown in Table 4. It can be seen from the table that the annual effective precipitation of the two crops in the full growth period were random, and the effective precipitation during the growth period of summer maize were all greater than the effective precipitation during the growth period of winter wheat in the five cities. The order of the average effective precipitation during the full growth period of winter wheat was as follows: Anyang City, Zhengzhou City, Jinan City, Baoding City, and Weifang City. The regions with the highest average effective precipitation during the full growth period of summer maize were Anyang City, Jinan City, Zhengzhou City, Weifang City, and Baoding City.
2.2. Prediction and Planning Model
The crop area, yield per unit area, the cost of irrigation water allocation, and the price of crop product are the main factors considered during irrigation water allocation, as crop area can indicate farmers’ willingness to plant this crop. Factors such as the prices of crop product, precipitation, irrigation water costs, natural disasters, and farmers’ willingness to plant can all lead to changes in crop area, so these factors are uncertain. Due to the limitation of effective arable land and climatic conditions, the crop planting area of winter wheat and summer maize in a city always varies within a certain range. The yield per unit area of crops is the main element to measure the benefits of irrigation water allocation. It is easily affected by multiple factors such as crop planting technology, the irrigation system, and field management. Due to the improvements in planting technology and at the management level, the yield per unit area of winter wheat and summer maize has time-series characteristics. At the same time, irrigation water sources for field crops can be divided into natural precipitation and artificial irrigation, and natural precipitation varies randomly. Therefore, not only the crop planting area should be considered when calculating water distribution costs, but the random characteristics of natural precipitation should be considered. The prices of international agricultural products are easily affected by the world trading market. Based on China’s policy of maintaining stable prices of major agricultural products, the purchase prices of agricultural products such as winter wheat and summer corn are basically stable, so the price of winter wheat and summer corn were considered constant.
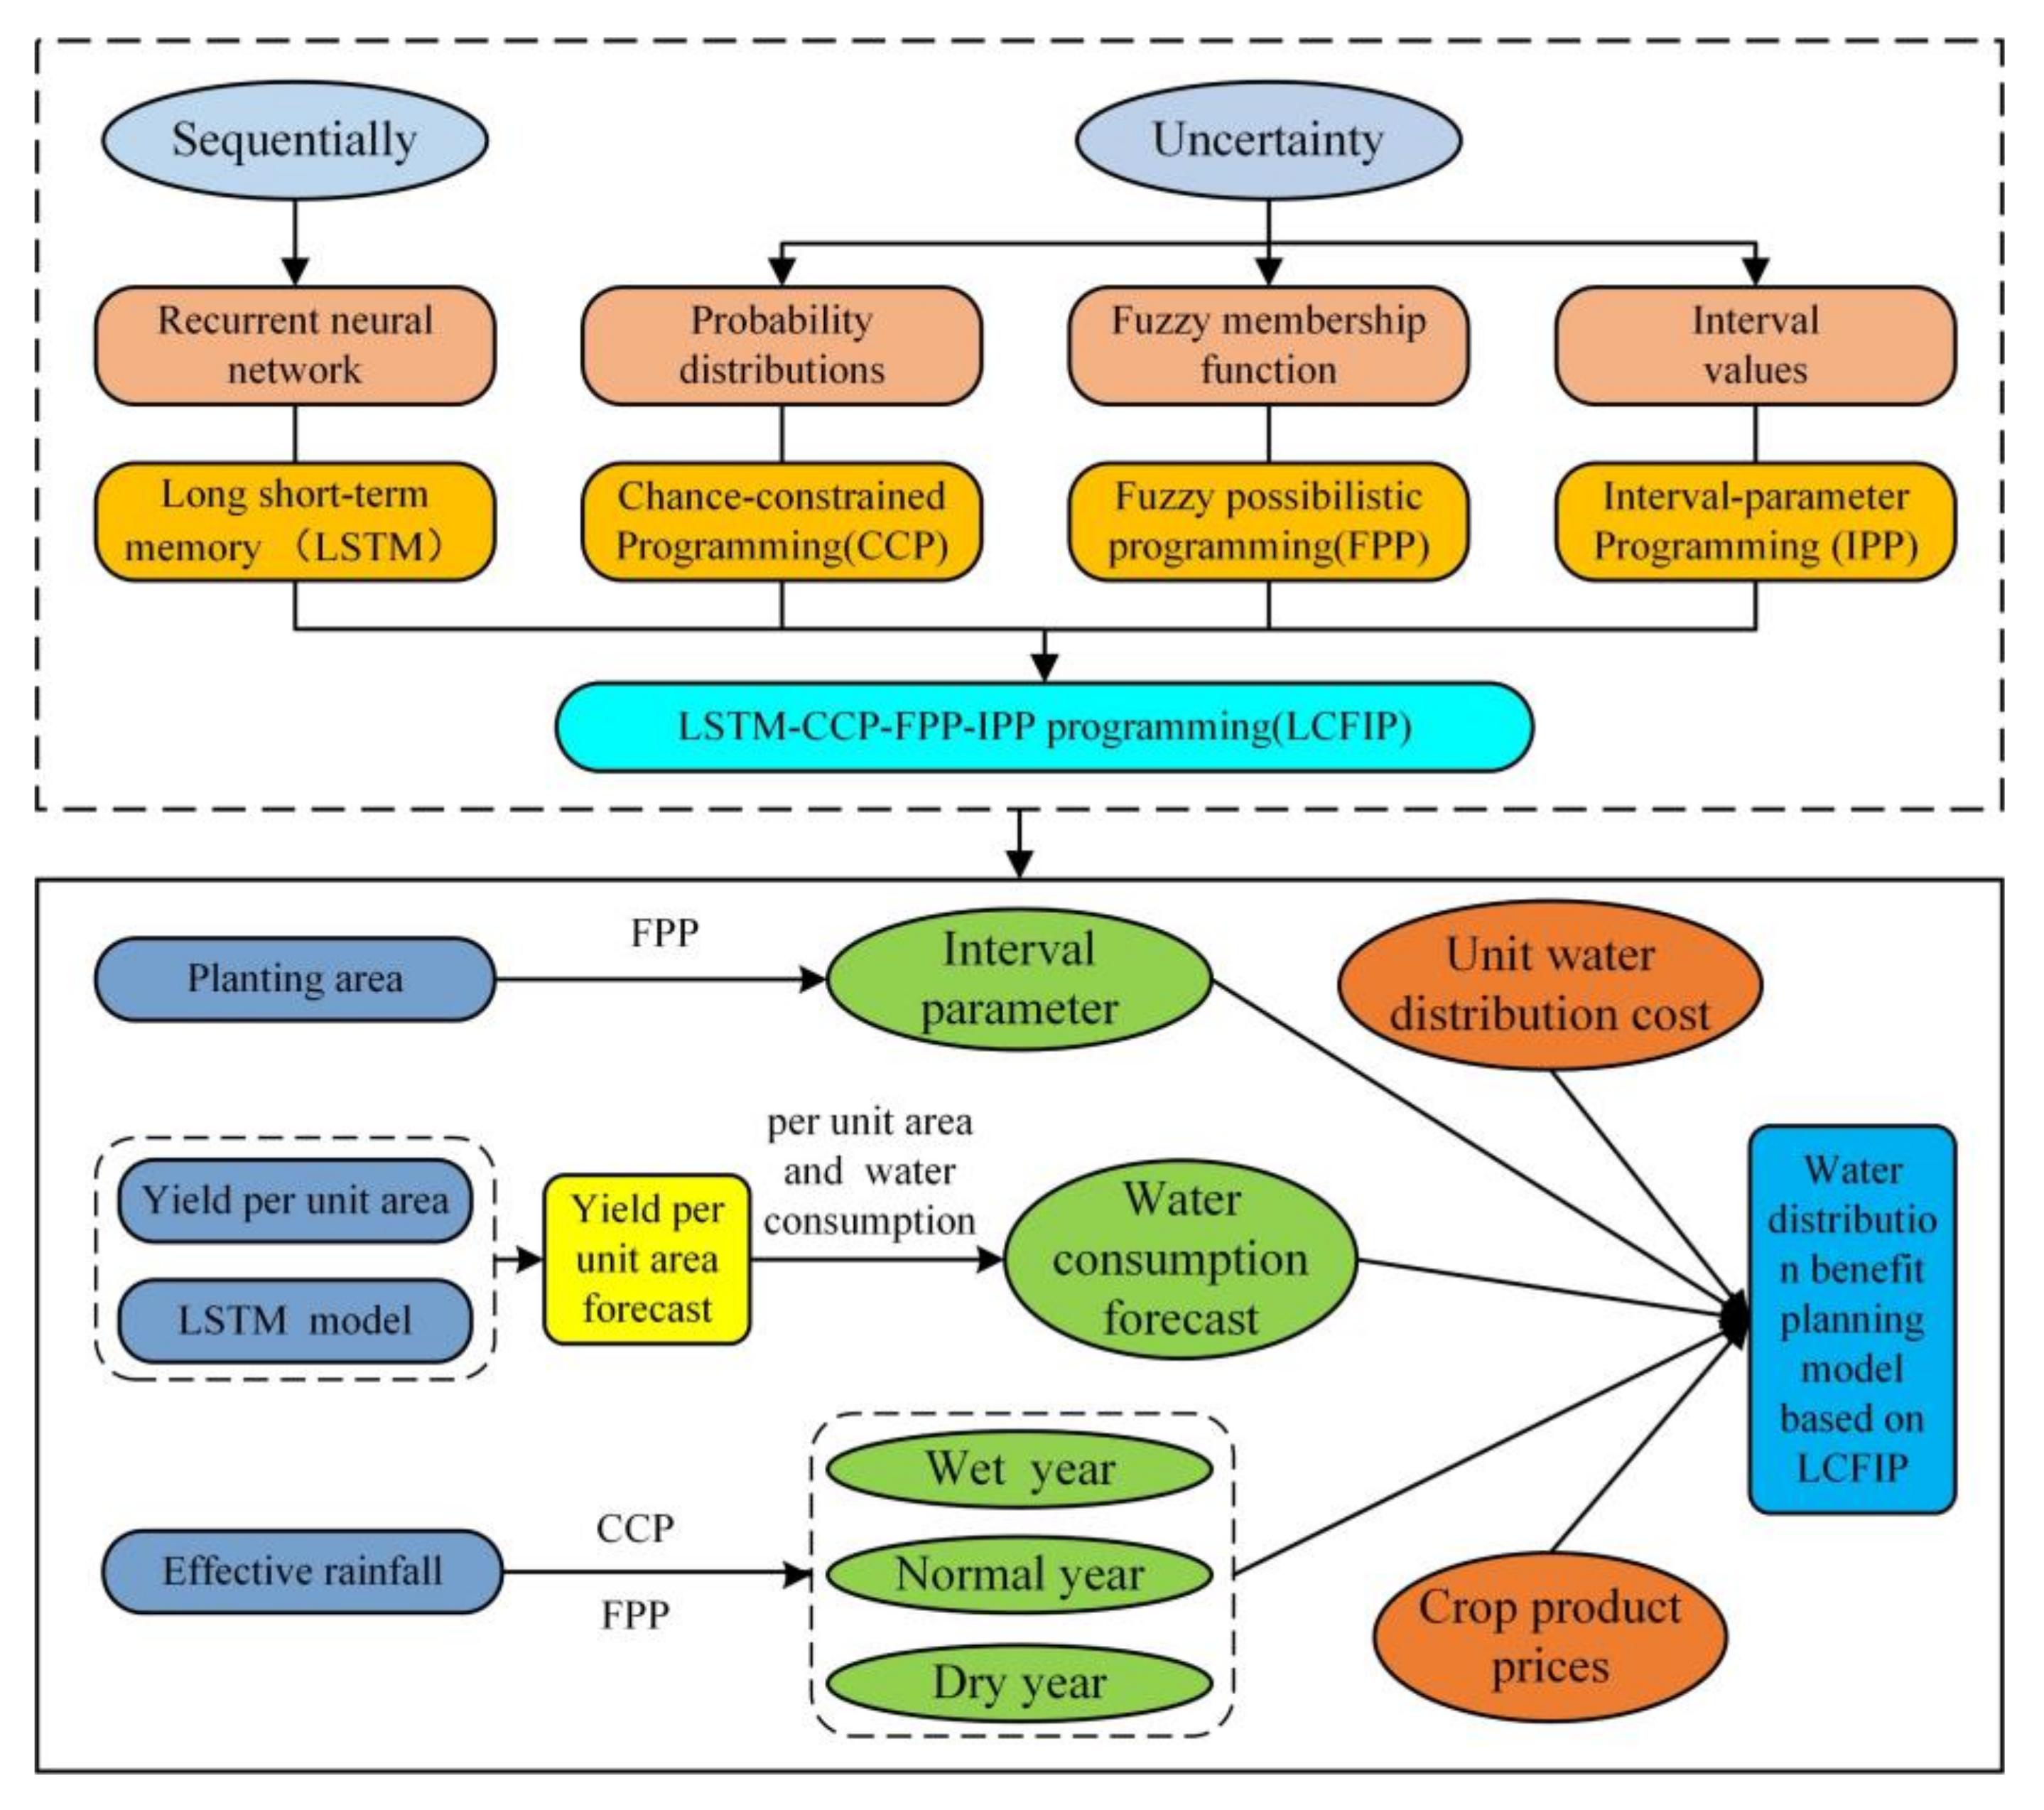
In this paper, uncertain crop area and irrigation water allocation costs are considered as interval parameters, randomly varying precipitation was treated as a chance-constrained variable, and the yield per unit area of the two crops were considered as time-series parameters. The fuzzy probability programming, opportunity-constrained programming, and LSTM model were used to describe the three uncertain parameters, respectively. Based on those planning methods, combined with the crop water production function and the price of crop products, an irrigation water distribution benefit prediction and planning model (LSTM-CCP-FPP-IPP) was constructed. The framework of the model is shown in Figure 3.
3. Methodology
3.1. LSTM Prediction Model
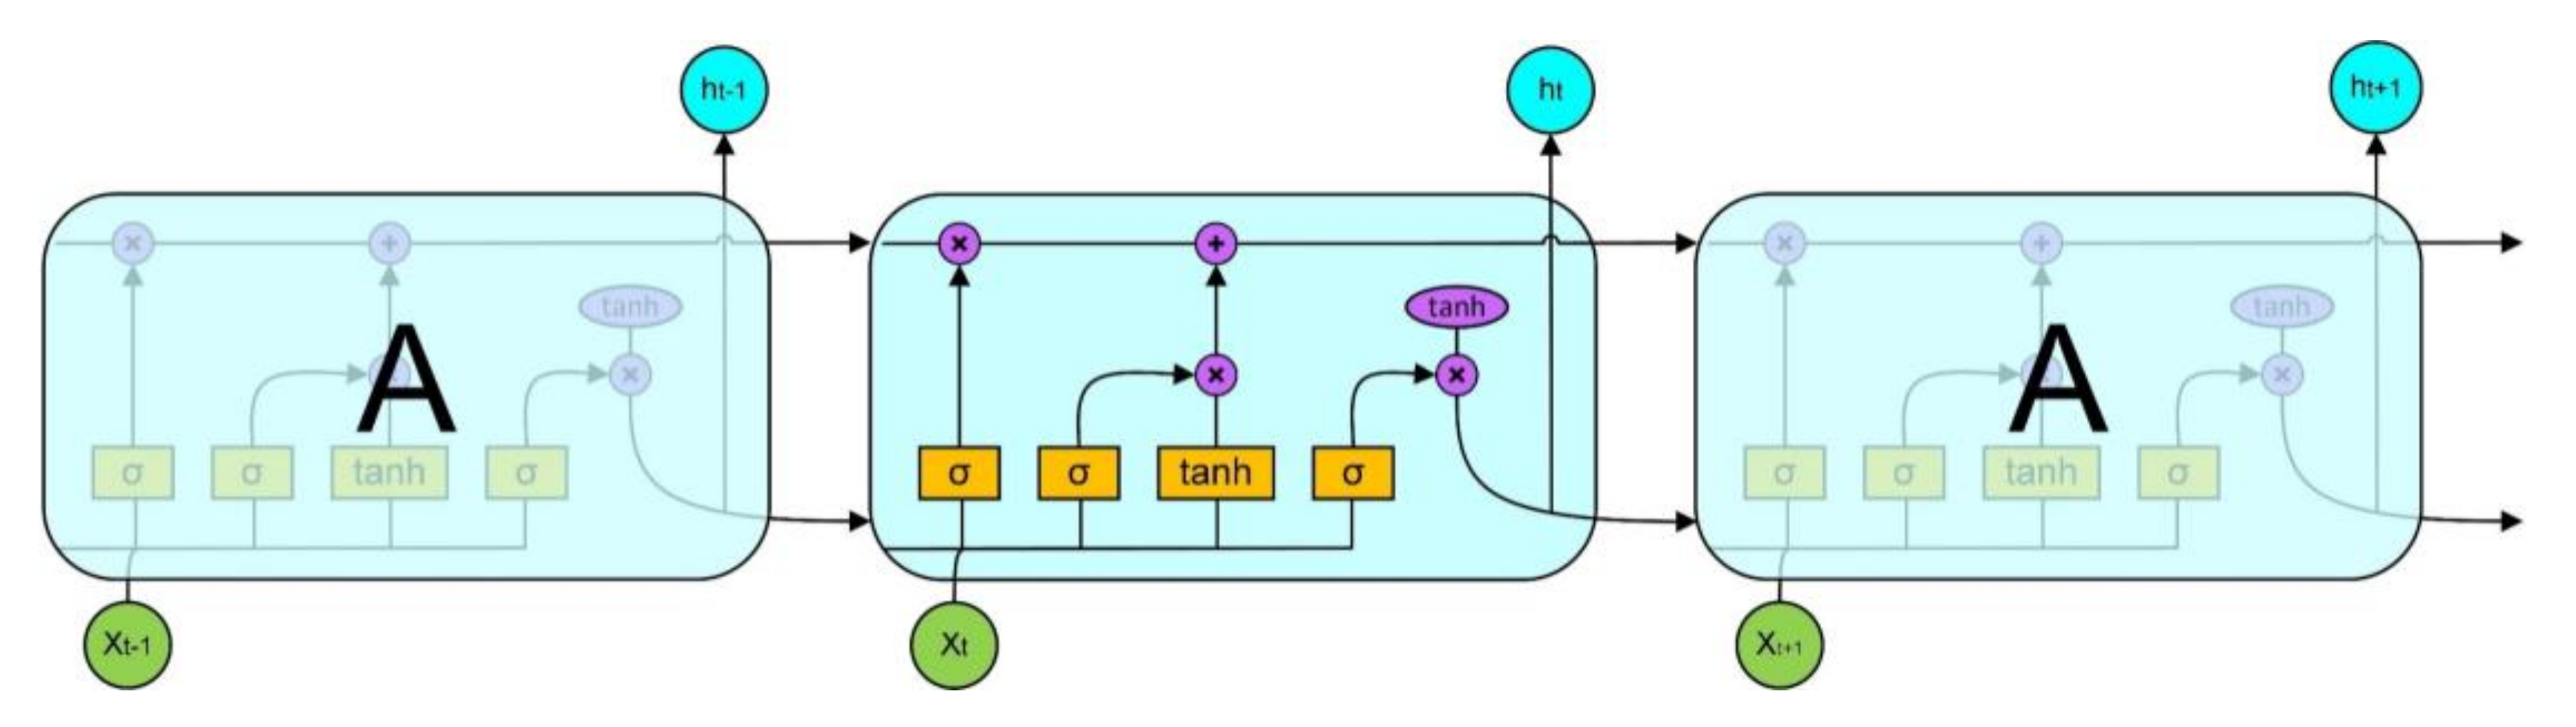
The LSTM-NN are now widely applied in various applications [37], the basic concept of LSTM-NN is proposed in Figure 4,. LSTMs are especially suitable for predicting sequence data because they address vanishing and exploding gradient problems of standard RNNs through incorporating gating functions and state dynamics. LSTM-NN architecture is based on gates, the function of which is to choose the data to keep and to discard. An LSTM-NN cell consists of three gates: input gate, output gate, and forget gate. The input gate gives new inputs to the cell, the output gate specifies the output of the cell, and the forget gate is responsible for specifying the prior values that need to be retained for future reference. The major components of a basic LSTM network consist of a sequence input layer that is employed to input a sequence (time-series data) to the LSTM network, and an LSTM model layer that is used for learning long-term reliance among the time-steps of sequence (time-series) data [38].
3.2. CCP-FFP-IPP Planning Programming
Fuzzy possibility planning can effectively characterize uncertain parameters with fuzzy possibility distribution [39]. The expression of the FPP model is as follows:
Subject to:
where represents a fuzzy parameter with fuzzy probability distribution. In agriculture irrigation water distribution planning, the planting area of crops changes within a certain range, which is an uncertain parameter. Although the FPP model can characterize the fuzzy probability distribution of this parameter, it is difficult to characterize the fuzzy probability distribution. The interval programming (IPP) method can solve the problem of unknown probability distribution and membership function of uncertain parameters. Therefore, IPP and FPP are combined to construct a quantile interval planning method:
Subject to:
where , , , . indicates the interval of related parameters, represents decision variables, and and represent the positive coefficients representing the model and constraints, respectively. and represent the negative coefficients of the model and constraints, respectively. represents the interval parameter that represents the fuzzy boundary. The boundary fuzzification of the interval parameter can be realized by the fuzzy membership function. This paper uses the most commonly used triangular fuzzy membership function, which can be determined by the center and the distance from the boundary to the center, so it is fuzzy under the linear condition. The parameters can be expressed as:
where represents the membership function representing fuzzy parameters. The model can be equivalently converted to:
Based on the possibility measurement theory, the quantile method is used to solve the objective of the smallest symmetrical triangular fuzzy parameter. Through the minimum probability measurement level, the above formula can be transformed into:
where λ represents the possibility measurement level [40], which reflects the attitude of decision makers on crop planting area, and the value is in the range of [0, 1]. The larger the value, the larger the range of the interval parameter, which means that the decision maker believes that the planting area is likely to fluctuate, and the smaller the value is, the decision maker believes that the planting area is less likely to fluctuate.
The hybrid model of IPP and FPP can solve the problem of uncertainty and uncertainty of the uncertain interval parameters, but it cannot deal with the precipitation and other random variables in the irrigation water distribution forecasting plan. This paper introduces the chance-constrained programming method (CPP) to solve the problem of probability distribution of random variables. Therefore, CPP is introduced into the IPP-FPP hybrid model, and the quantile interval chance-constrained programming model (IPP-FPP-CPP) is obtained. It can be expressed as:
Subject to:
Based on the interactive algorithm of the planning model, FICMP model customers can be split into two deterministic models.
The lower models can be expressed as:
Subject to:
The upper models can be expressed as:
Subject to:
3.3. Crop Water Production Function
The book “Water Requirements and Water Consumption Management of Main Crops in Northern China” has systematically expounded the methods, laws, applications and countermeasures of water requirements and the water consumption management of the main crops in Northern China [41]. According to the book, the relationship between crop yield and water consumption during the full growth period can be summarized into two categories. Formula (21) is suitable for areas with medium and low yields, and Formula (22) is suitable for areas with higher yields; in other words, the relationship between crop yield and water consumption presents a quadratic parabola, and the highest point of the parabola is the maximum yield of crops. The coefficients of the yield and water consumption of winter wheat and summer maize in the five regions are shown in Table 5. Based on the crop yield per unit area predicted by the LSTM model, the future water consumption per unit area of crops can be obtained by using the functional relationship between yield and water consumption, which provides parameter support for the water distribution benefit model.
where Y represents the crop yield, and the unit is kg per hectare; ET represents the water consumption, and the unit is mm. a0, b0, a1, b1 and c1 are the empirical coefficient.
4. Objective
Based on the hybrid prediction and planning model, and the complexity of the irrigation water allocation system and the uncertainty of the related parameters, an irrigation water allocation benefit objective function was developed. This function aims at maximizing the benefits of irrigation water allocation under uncertain parameters, including yield per unit area of the crop, prices of the crop products, irrigation water allocation, and the cost of water allocation and other parameters. The objective function is as follows:
Constraints:
- Crop planting area constraints,
- Water distribution restriction,
- Effective precipitation constraints,
- Variable non-negative constraints,where represents the water consumption of the i crop (mm); represents the interval parameter of the crop areas; and represent the maximum and minimum available planting area, respectively; and represent the maximum and minimum available irrigation water, respectively; Pe represents the effective precipitation; represents the daily precipitation; and represents the interval parameter of crop prices.
From 1 January 2006, the agricultural tax was repealed in China. The abolition of the agricultural tax has greatly promoted farmers’ willingness to plant crops. After 2006, the planting area of major crops increased to a certain extent in China. Since winter wheat is planted and harvested in different years, the time range of the area’s parameter analysis of winter wheat and summer maize in this paper was from 2007 to 2019. The maximum and minimum values in the dataset of the crop planting area were removed, and the maximum and minimum values in the remaining data were set as the upper and lower boundaries of the interval parameters, respectively. In order to better reflect the uncertainty of the model, the standard deviation of the data of winter wheat and summer corn planting areas was set as the distance between the center value and the boundary, and the fuzzy interval parameters of the areas with the two crops in five studied cities are shown in Table 6 and Table 7, respectively.
Generally, effective precipitation is a random variable, and random variables satisfy a certain mathematical distribution. The effective precipitation of the five studied cites in the past 40 years has been tested by Gaussian distribution, uniform distribution, and Pearson distribution. For the full growth period of winter wheat in Anyang, Zhengzhou, Weifang, Jinan, and Baoding, the significant indexes conforming to the Gaussian distribution of effective precipitation were 0.781, 0.747, 0.639, 0.735, and 0.40, respectively. For the full growth period of summer corn in Anyang, Zhengzhou, Weifang, Jinan, and Baoding, the significant indexes conforming to the Gaussian distribution of effective precipitation were 0.991, 0.621, 0.765, 0.845, and 0.454, respectively. It can be seen that the effective precipitation during the full growth period of the two crops in the five study cities in the past 40 years were more in line with the Gaussian distribution. Therefore, the expected value and standard deviation of the dataset can be used to construct a Gaussian distribution model of precipitation throughout the full growth period of the five studied cities. According to the amount of precipitation, Fu et al. [42] divided the years into dry years, normal years, and humid years. The probability of the occurrence of dry years and wet years also was 0.2, and the rate of normal years was approximately 0.6. Combining the Gaussian distribution of effective precipitation and the probability of three types of precipitation years, this paper calculates the range of the effective precipitation for the three types of years, and the results are shown in Table 8.
According to the statistical yearbooks of the five studied cities, the cost of agricultural irrigation and water allocation were basically controlled between USD 0.0314 per cubic meter and USD 0.0628 per cubic meter. The purchase price of crop products was stable in China, and there were no major fluctuations in prices, so the purchase price of winter wheat and summer corn were USD 796.97 per ton and USD 848.99 per ton [43]. Based on the above prediction model, planning method and objective function, crop area interval parameters, effective precipitation, irrigation water allocation costs, the prices of crop product, and the benefits of irrigation water allocation would be effectively planned.
5. Result Analysis
5.1. Forecast of Yield per Unit Area and Crop Water Consumption
Zhou et al. [44] proposed an LSTM model and applied it to the time-series forecast of tomato production in Xinjiang, China. Based on the research, this study conducted a time-series prediction model of the yield per unit of winter wheat and summer corn in the five studied cities. Yield per hectare of winter wheat and summer corn in the five cities for the years 2000 to 2019 were obtained from the statistics department, as shown in Figure 2, which constituted a dataset, with the number of datasets totaling 200. The dataset was divided into the training set and the validation set, with the training and validation sets accounting for 70 percent and 30 percent of the total dataset, respectively, and the crop yield per hectare was the test. According to the best parameters for RNN and LSTM-NN forecasting models [38], the look back of the time step in the model was set to two, the number of hidden layers was one, the number of neurons in the hidden layer was 200, the number of neurons in the input and output layer were both one, and the Adam optimization method was based on the principle of minimum root mean square error, solved to obtain the trained model. Moreover, the learn rate drop period was set to 20, the batch size was set to 1, and the model was trained 500 times. Since the 2020 statistical yearbooks of the four studied cities have been publicly released, and the statistical yearbooks of Baoding in 2020 and the five studied cities in 2021 and 2022 have not been publicly released, this paper uses the 2020 crop yield data of the four cities as the test set.
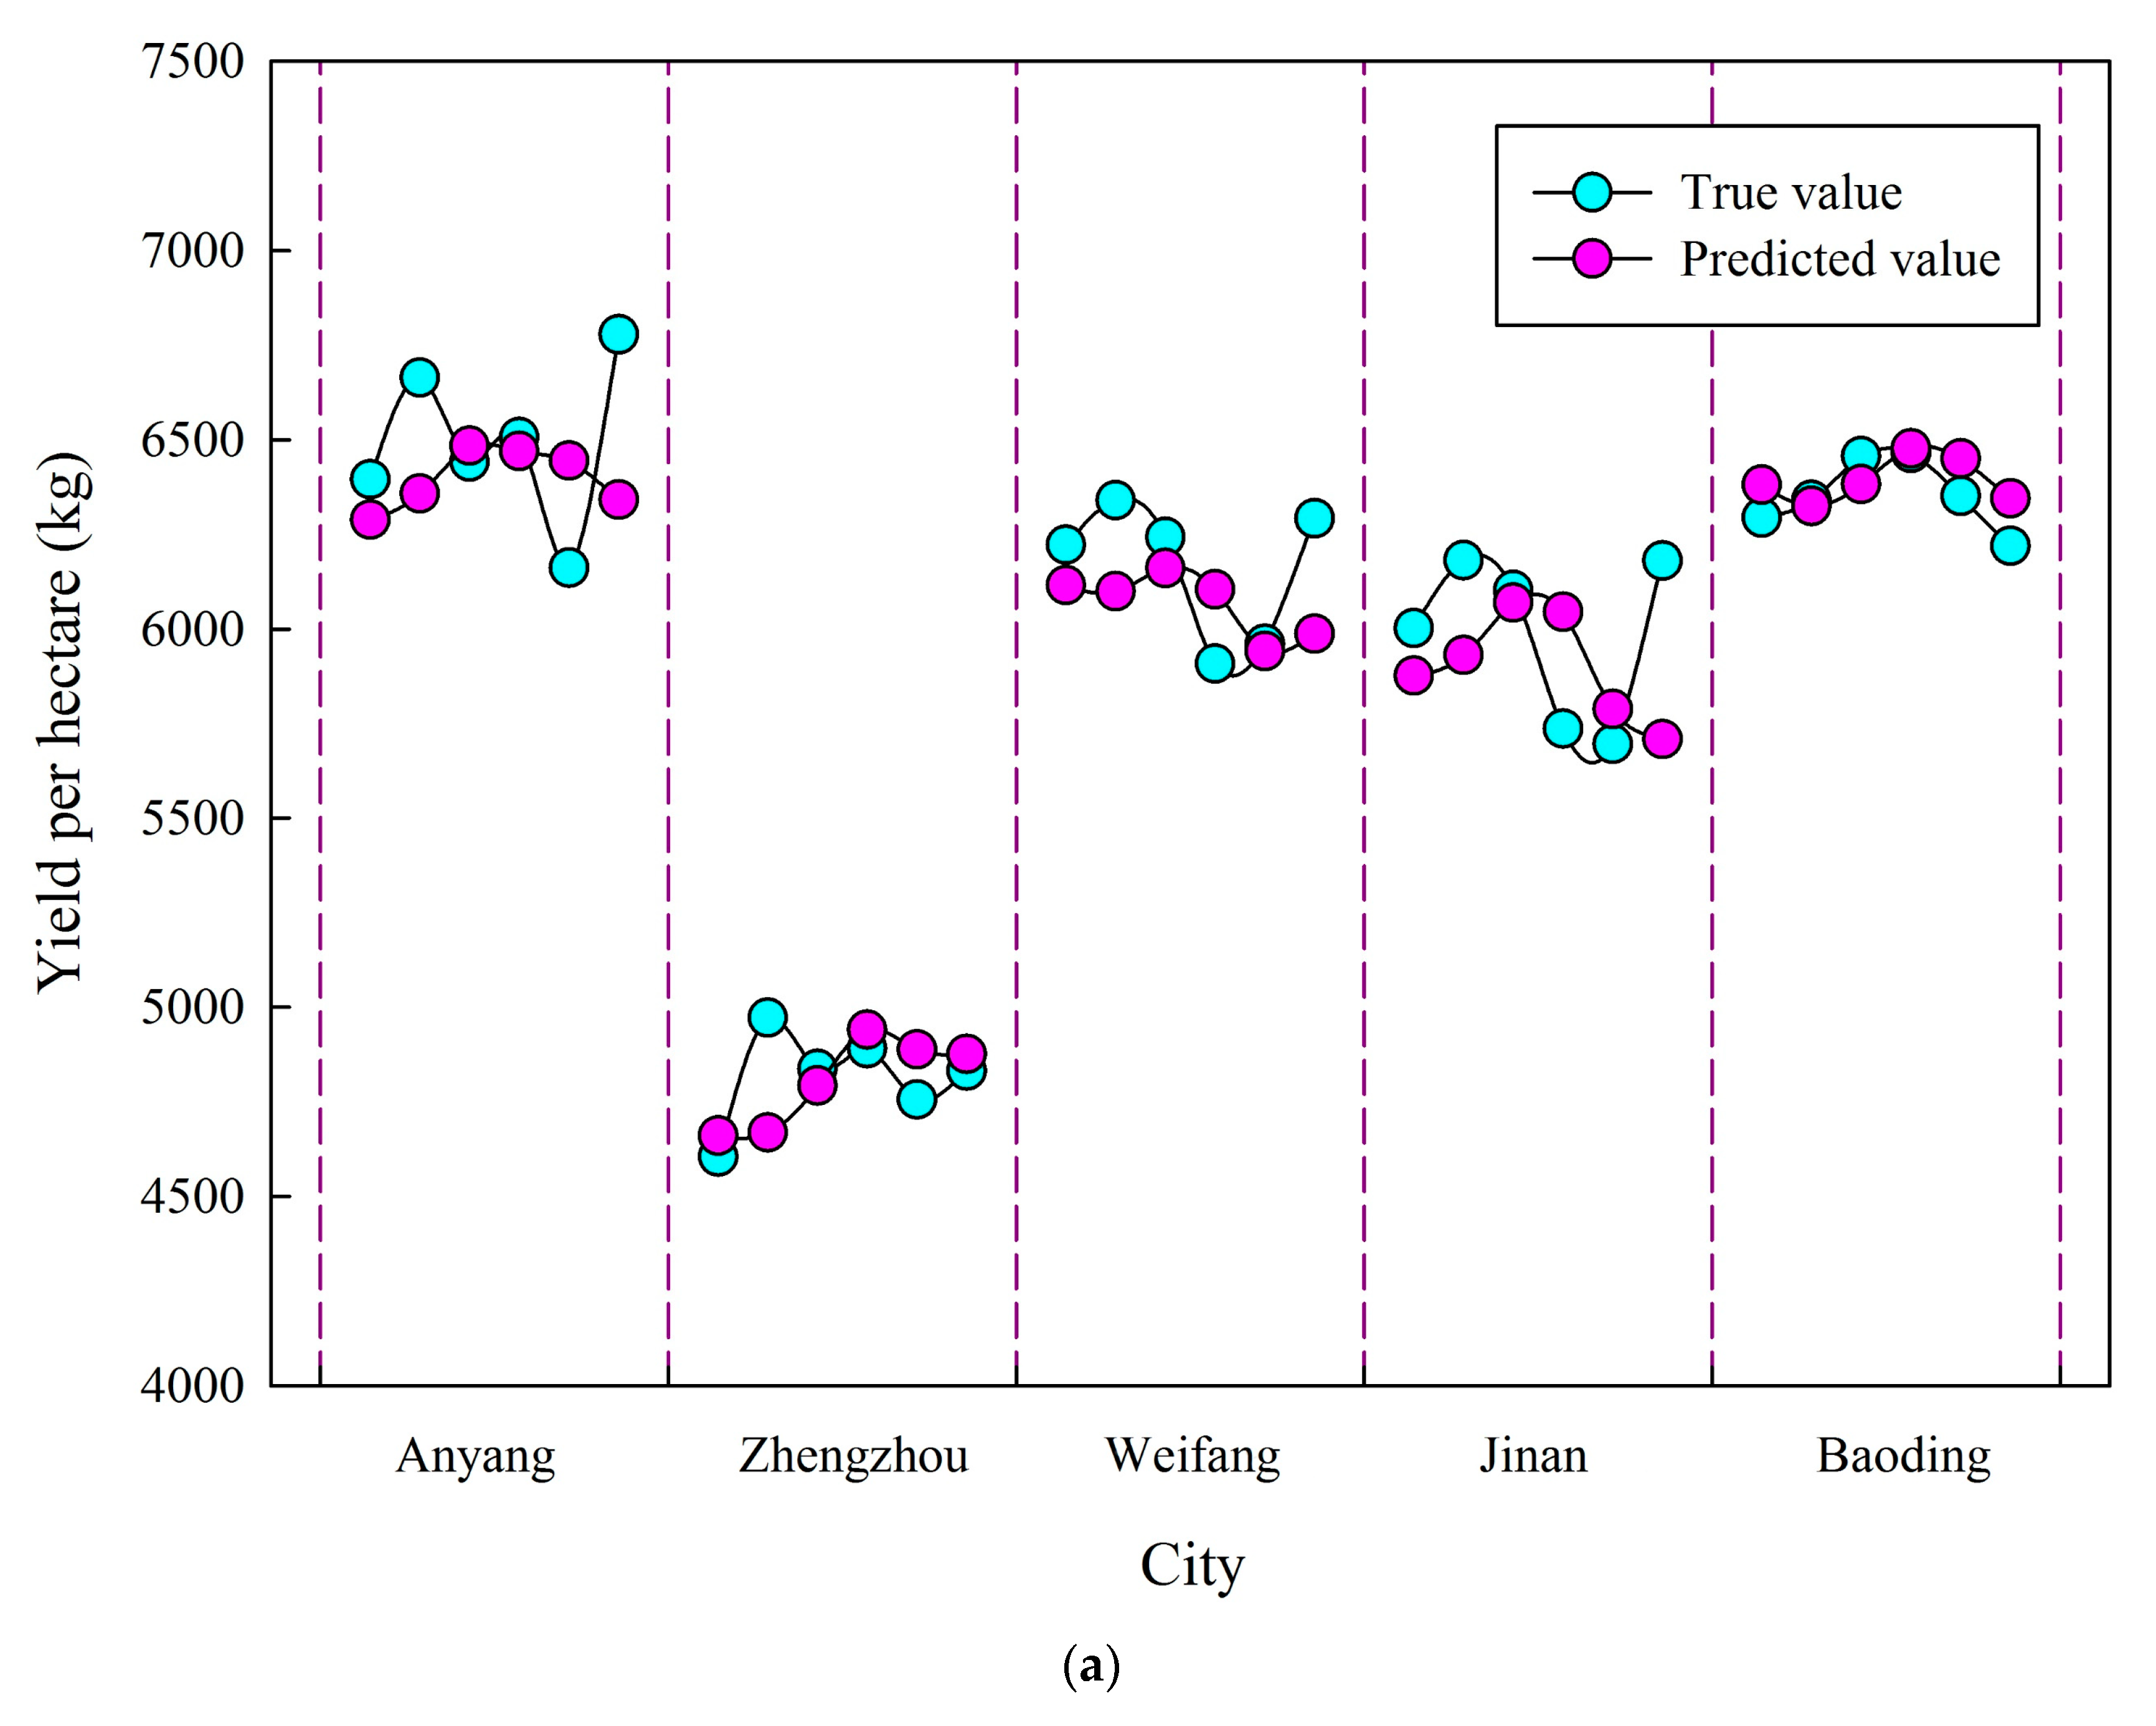
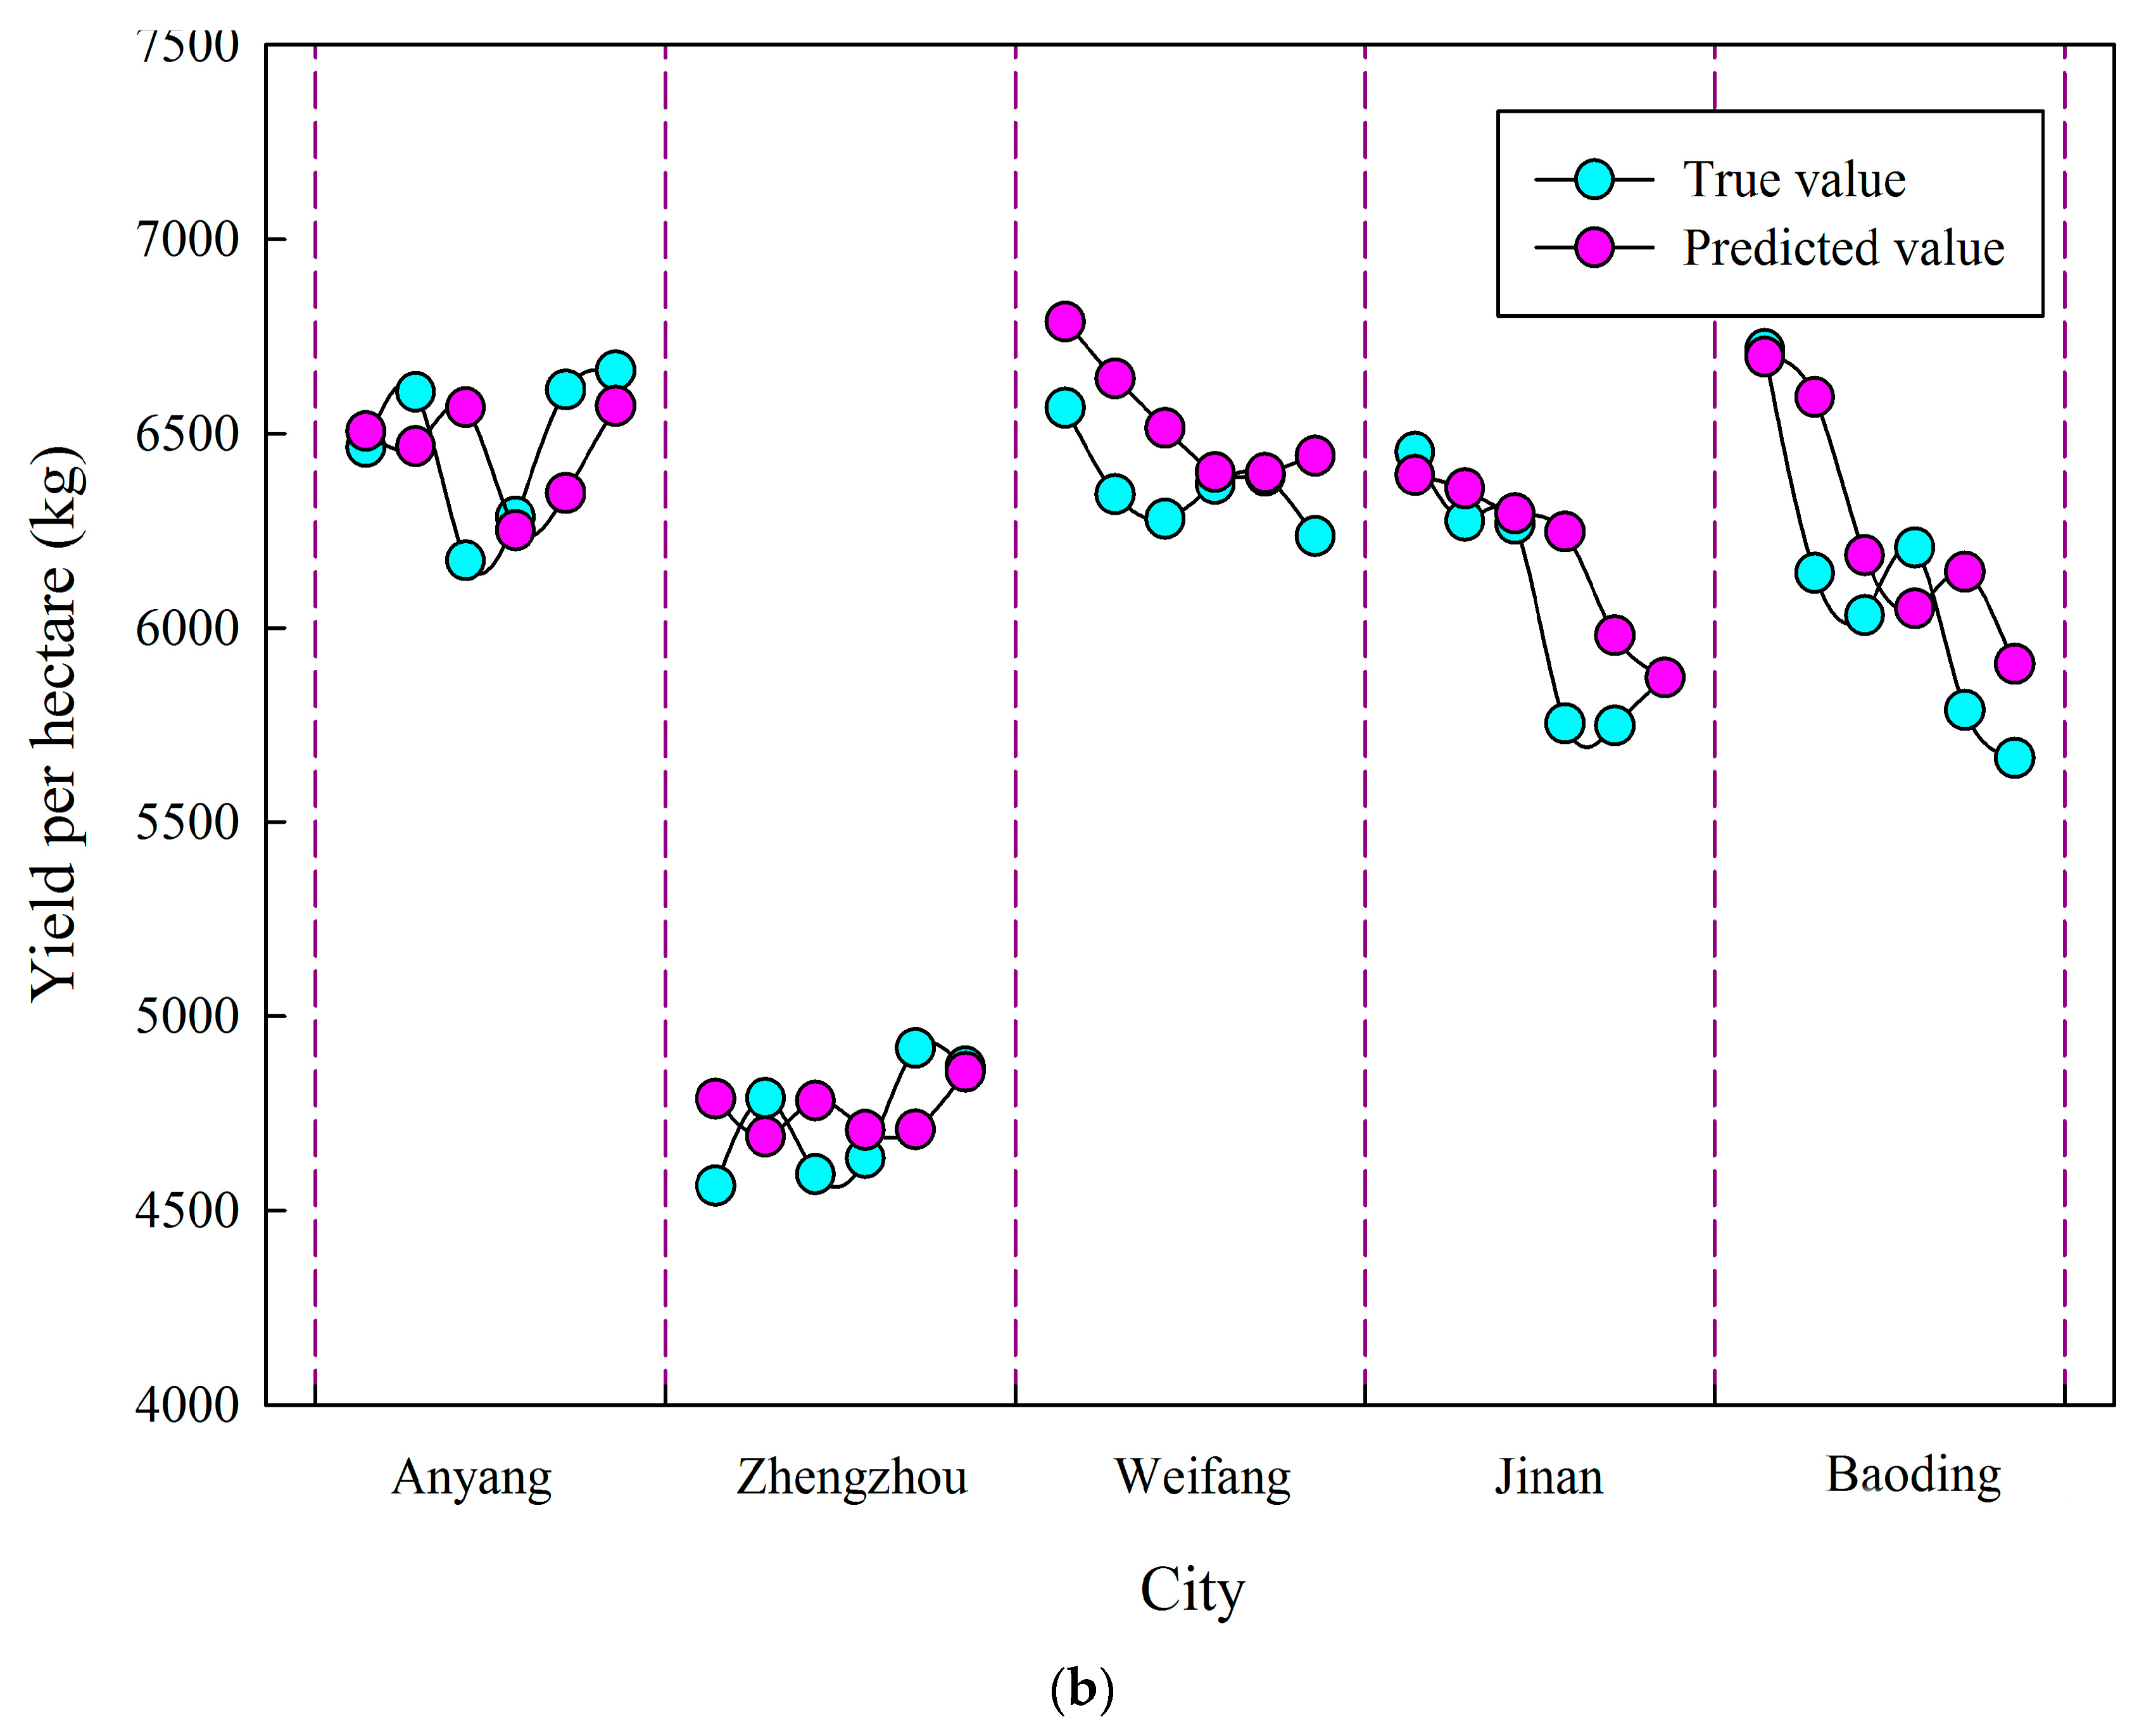
The comparison prediction value and the true value of crop yield per hectare in the five cities are shown in Figure 5. It can be seen from the figure that the trained prediction model can also accurately predict the change trend and value of the two crops’ yields per hectare in the five cities, so that the predicted value and the real value maintain a good consistency. The city with a large error between the predicted value and the actual value of winter wheat yield per unit area is Anyang City, and the city with a large error between the predicted value and the actual value of summer corn yield per unit area is Weifang City. At the same time, the mean absolute error (MAE) of the training set in the model is shown in Table 9. It can be seen from the table that the MAE of the model was from 61.56 kg per ha to 231.62 kg per ha, indicating that the model has high prediction accuracy and can meet the accuracy requirements of prediction and planning. Based on this model, the yield per unit area of winter wheat and summer maize in the five studied cities from 2020 to 2022 were predicted, and the MAE between the predicted value and the actual value of the validation set are shown in Table 9; it can be seen that the yield per unit hectare in a city has little difference in different years.
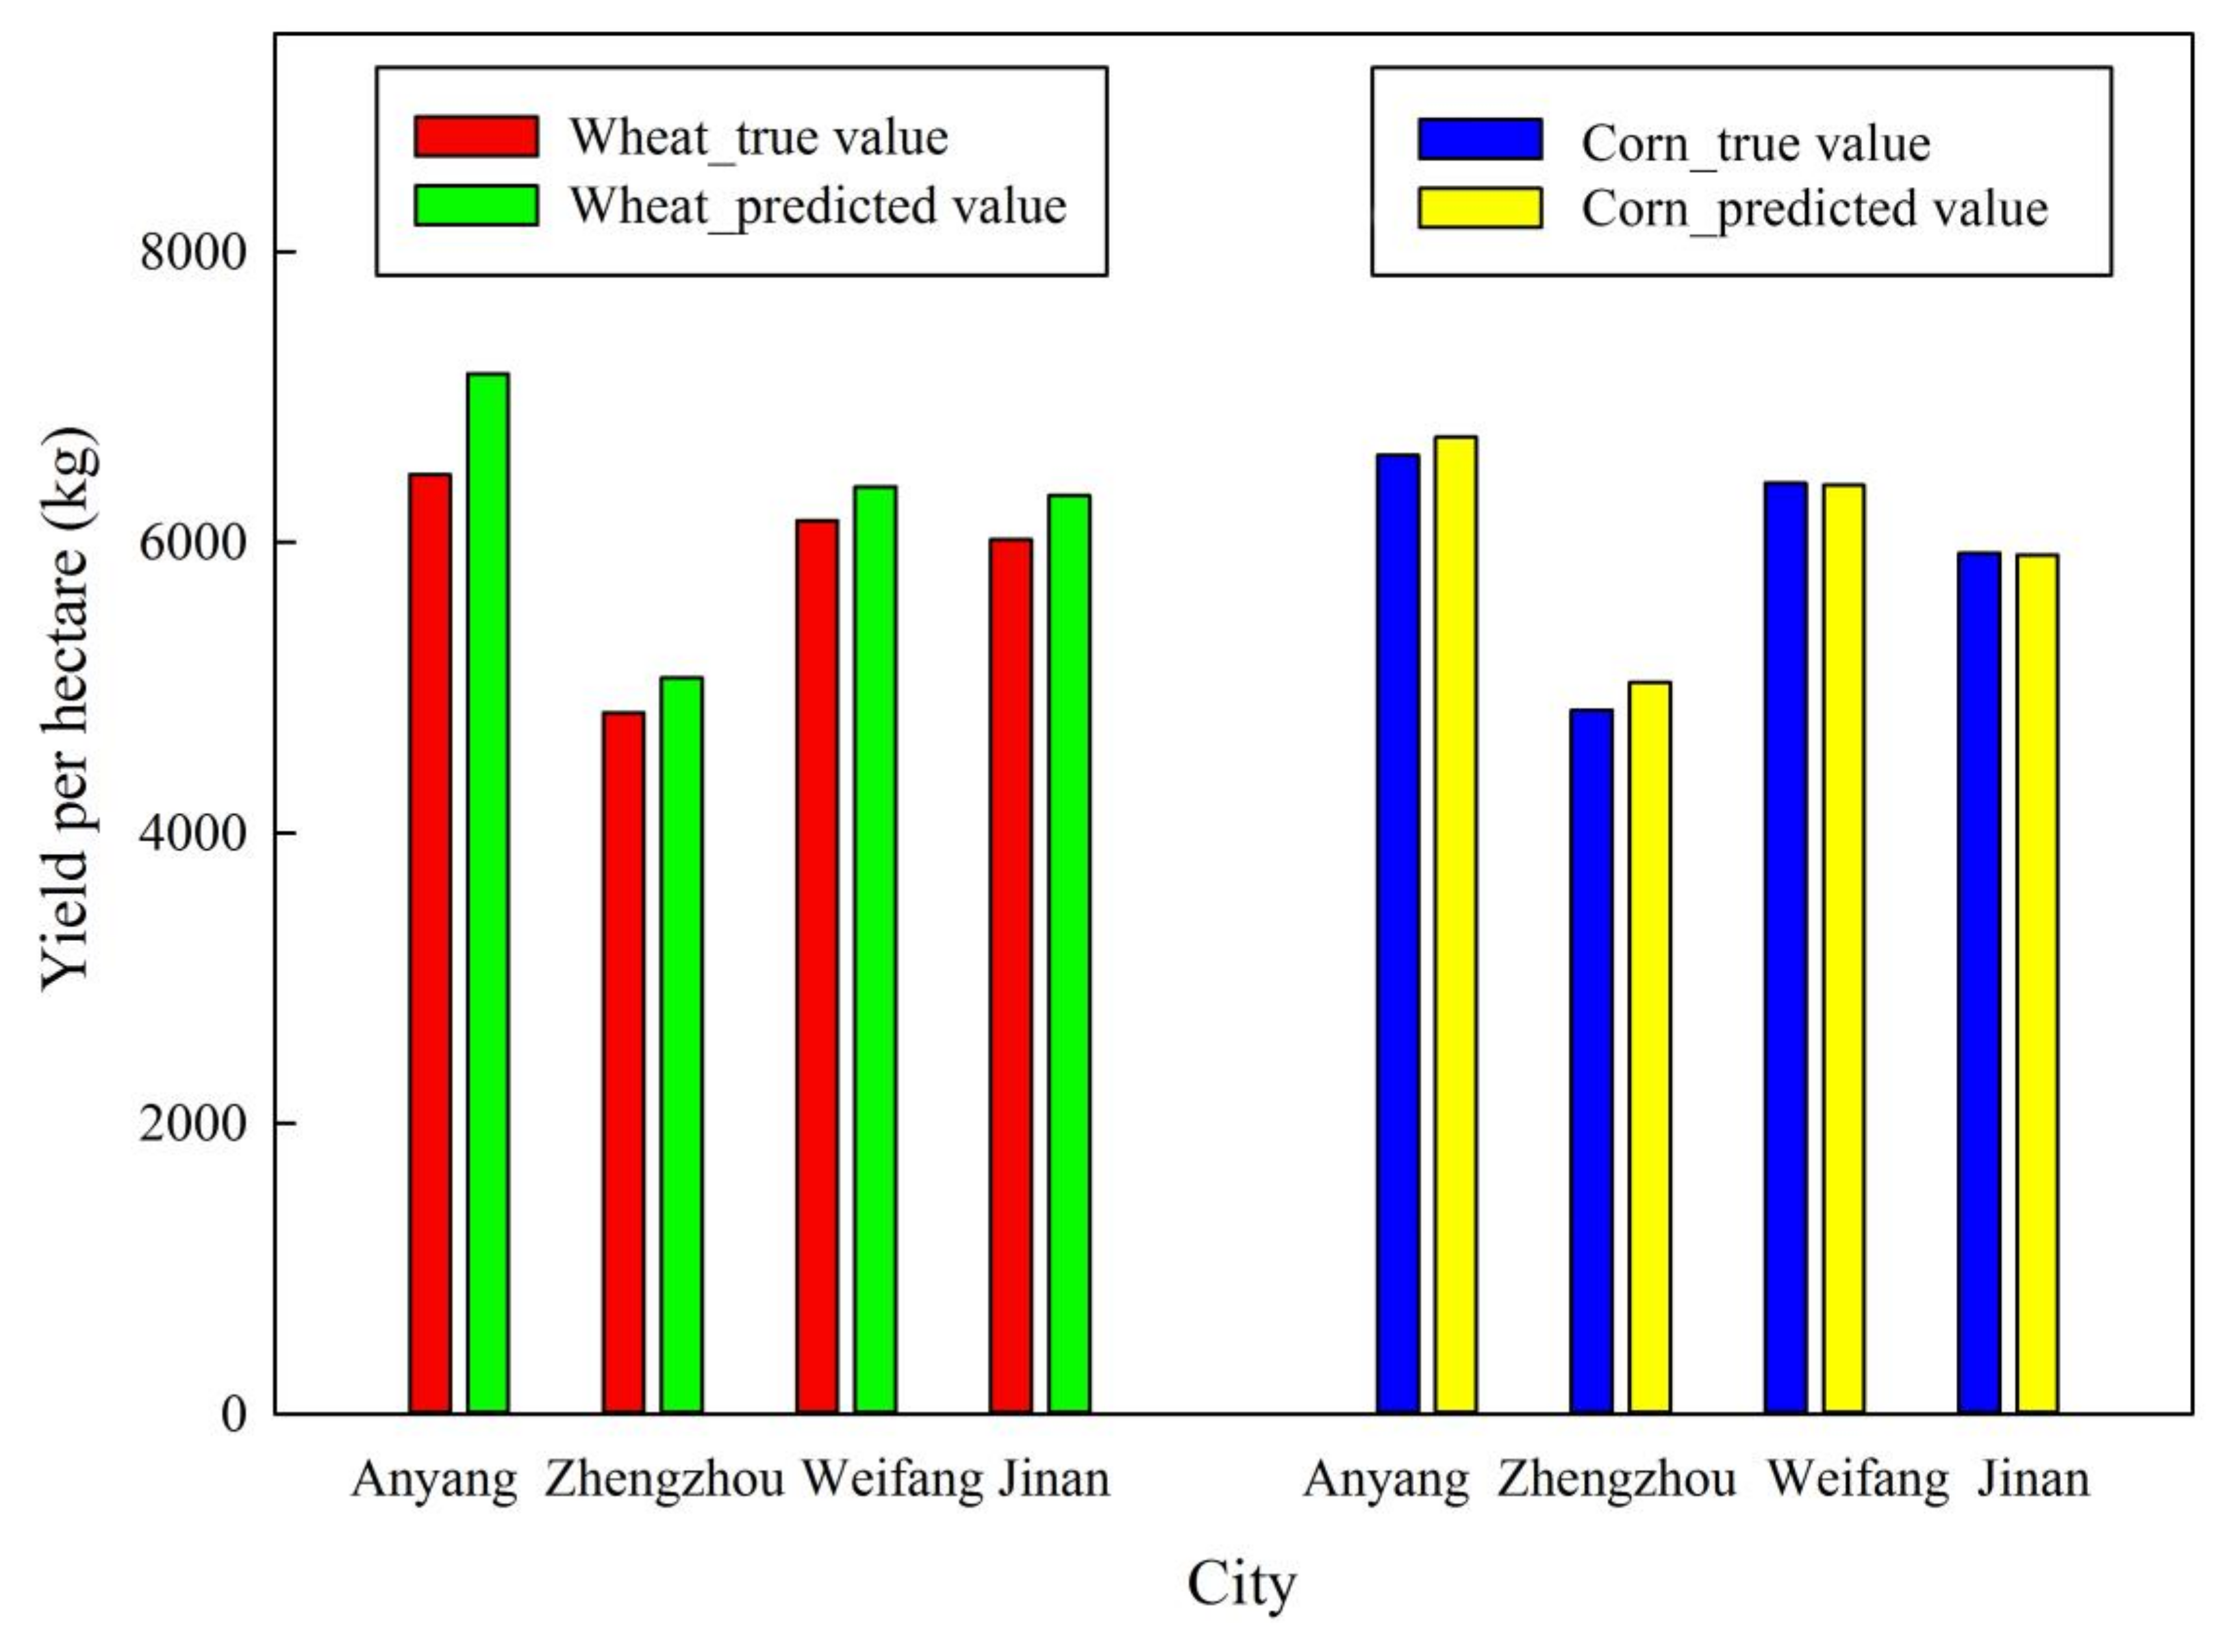
The 2020 Baoding Statistical Yearbook has not yet been released, so the study counted the predicted and actual values of the test set of the yield per unit area of the two crops in the remaining four cities. The comparison between the prediction value and true value of the crop yield per hectare in the four cities in 2020 is shown in Figure 6. It can be seen from the figure that the trained prediction model can also accurately predict the change trend and value of the two crops’ yields per hectare in the five cities. The MAEs of the predicted value and the actual value of winter wheat’s yield per unit area in four cities are 696.67, 238.05, 231.84, and 302.97, respectively. The MAE of the predicted value and the actual value of summer corn’s yield per unit area in four cities are 124.56, 193.57, 14.02, and 13.27, respectively. In the five cities, the yield per unit area of winter wheat did not increase year by year, and the yield per unit area of summer corn also showed the same characteristics. The order of cities according to yield per unit area of winter wheat from high to low are Anyang, Baoding, Weifang, Jinan and Zhengzhou, and the cities with yield per unit area of summer corn, in the order from high to low, are Anyang, Weifang, Jinan, Baoding and Zhengzhou. In general, Anyang is the city with the highest yield per unit area of winter wheat and summer maize.
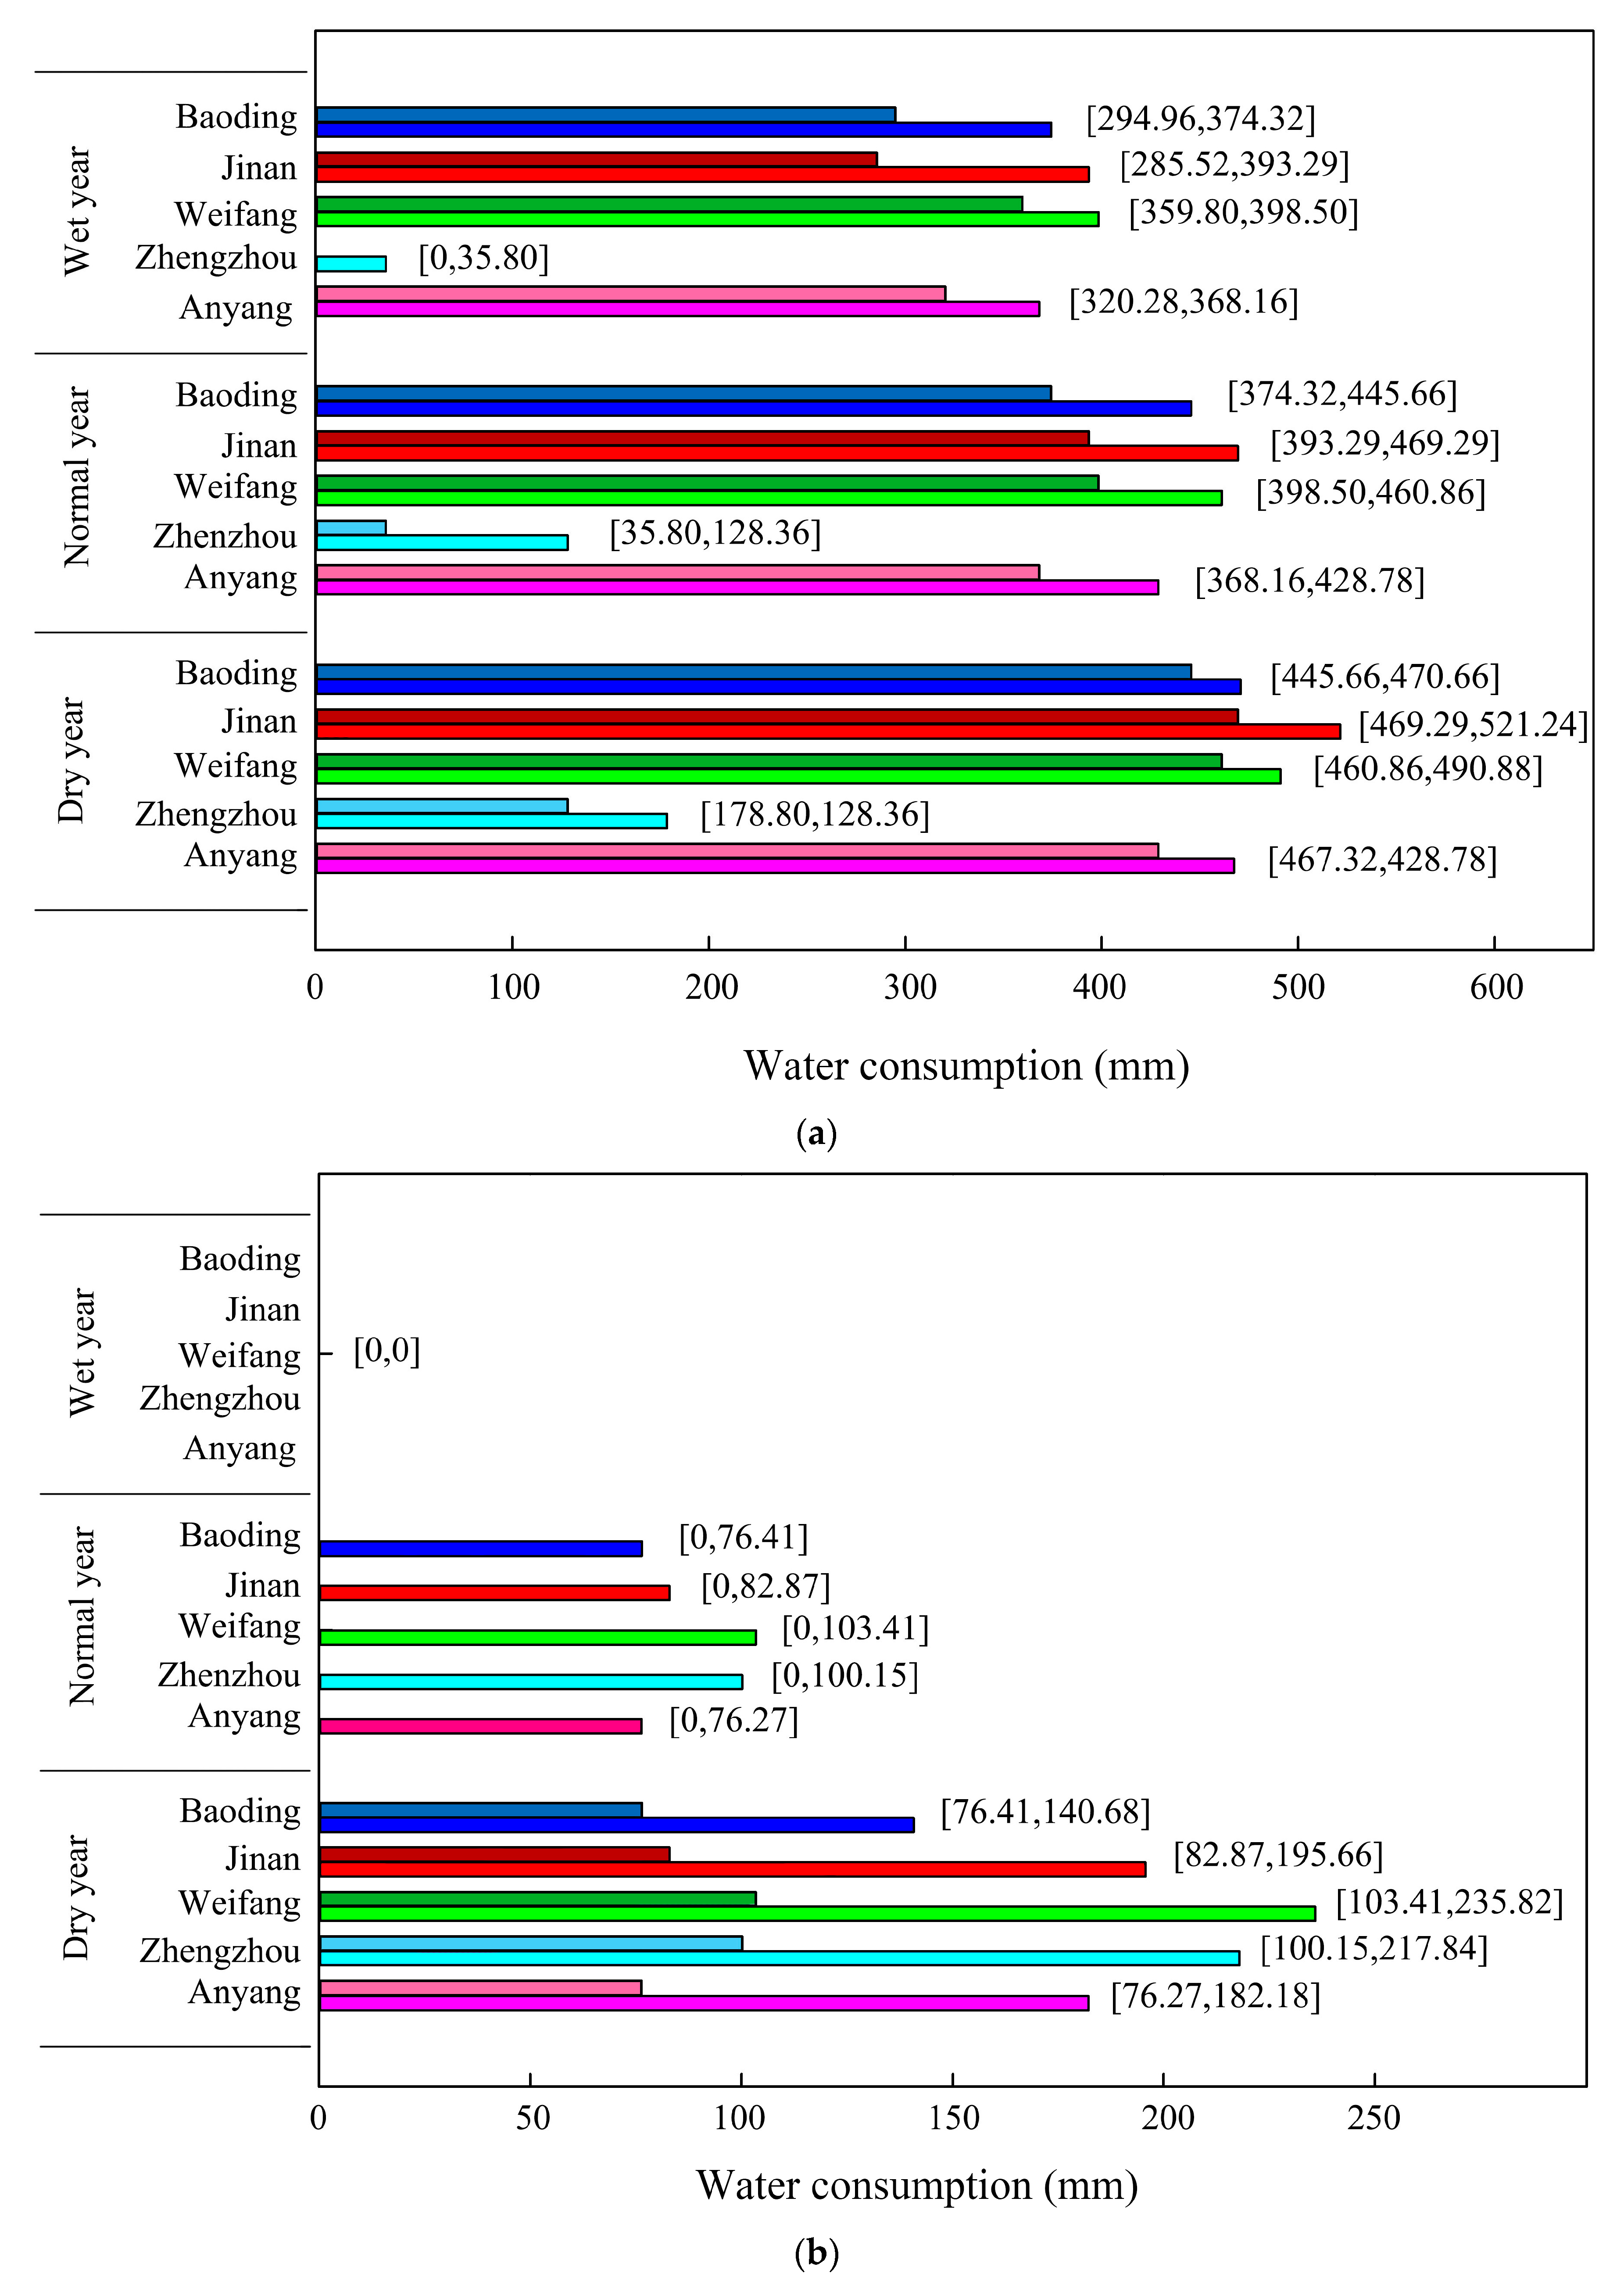
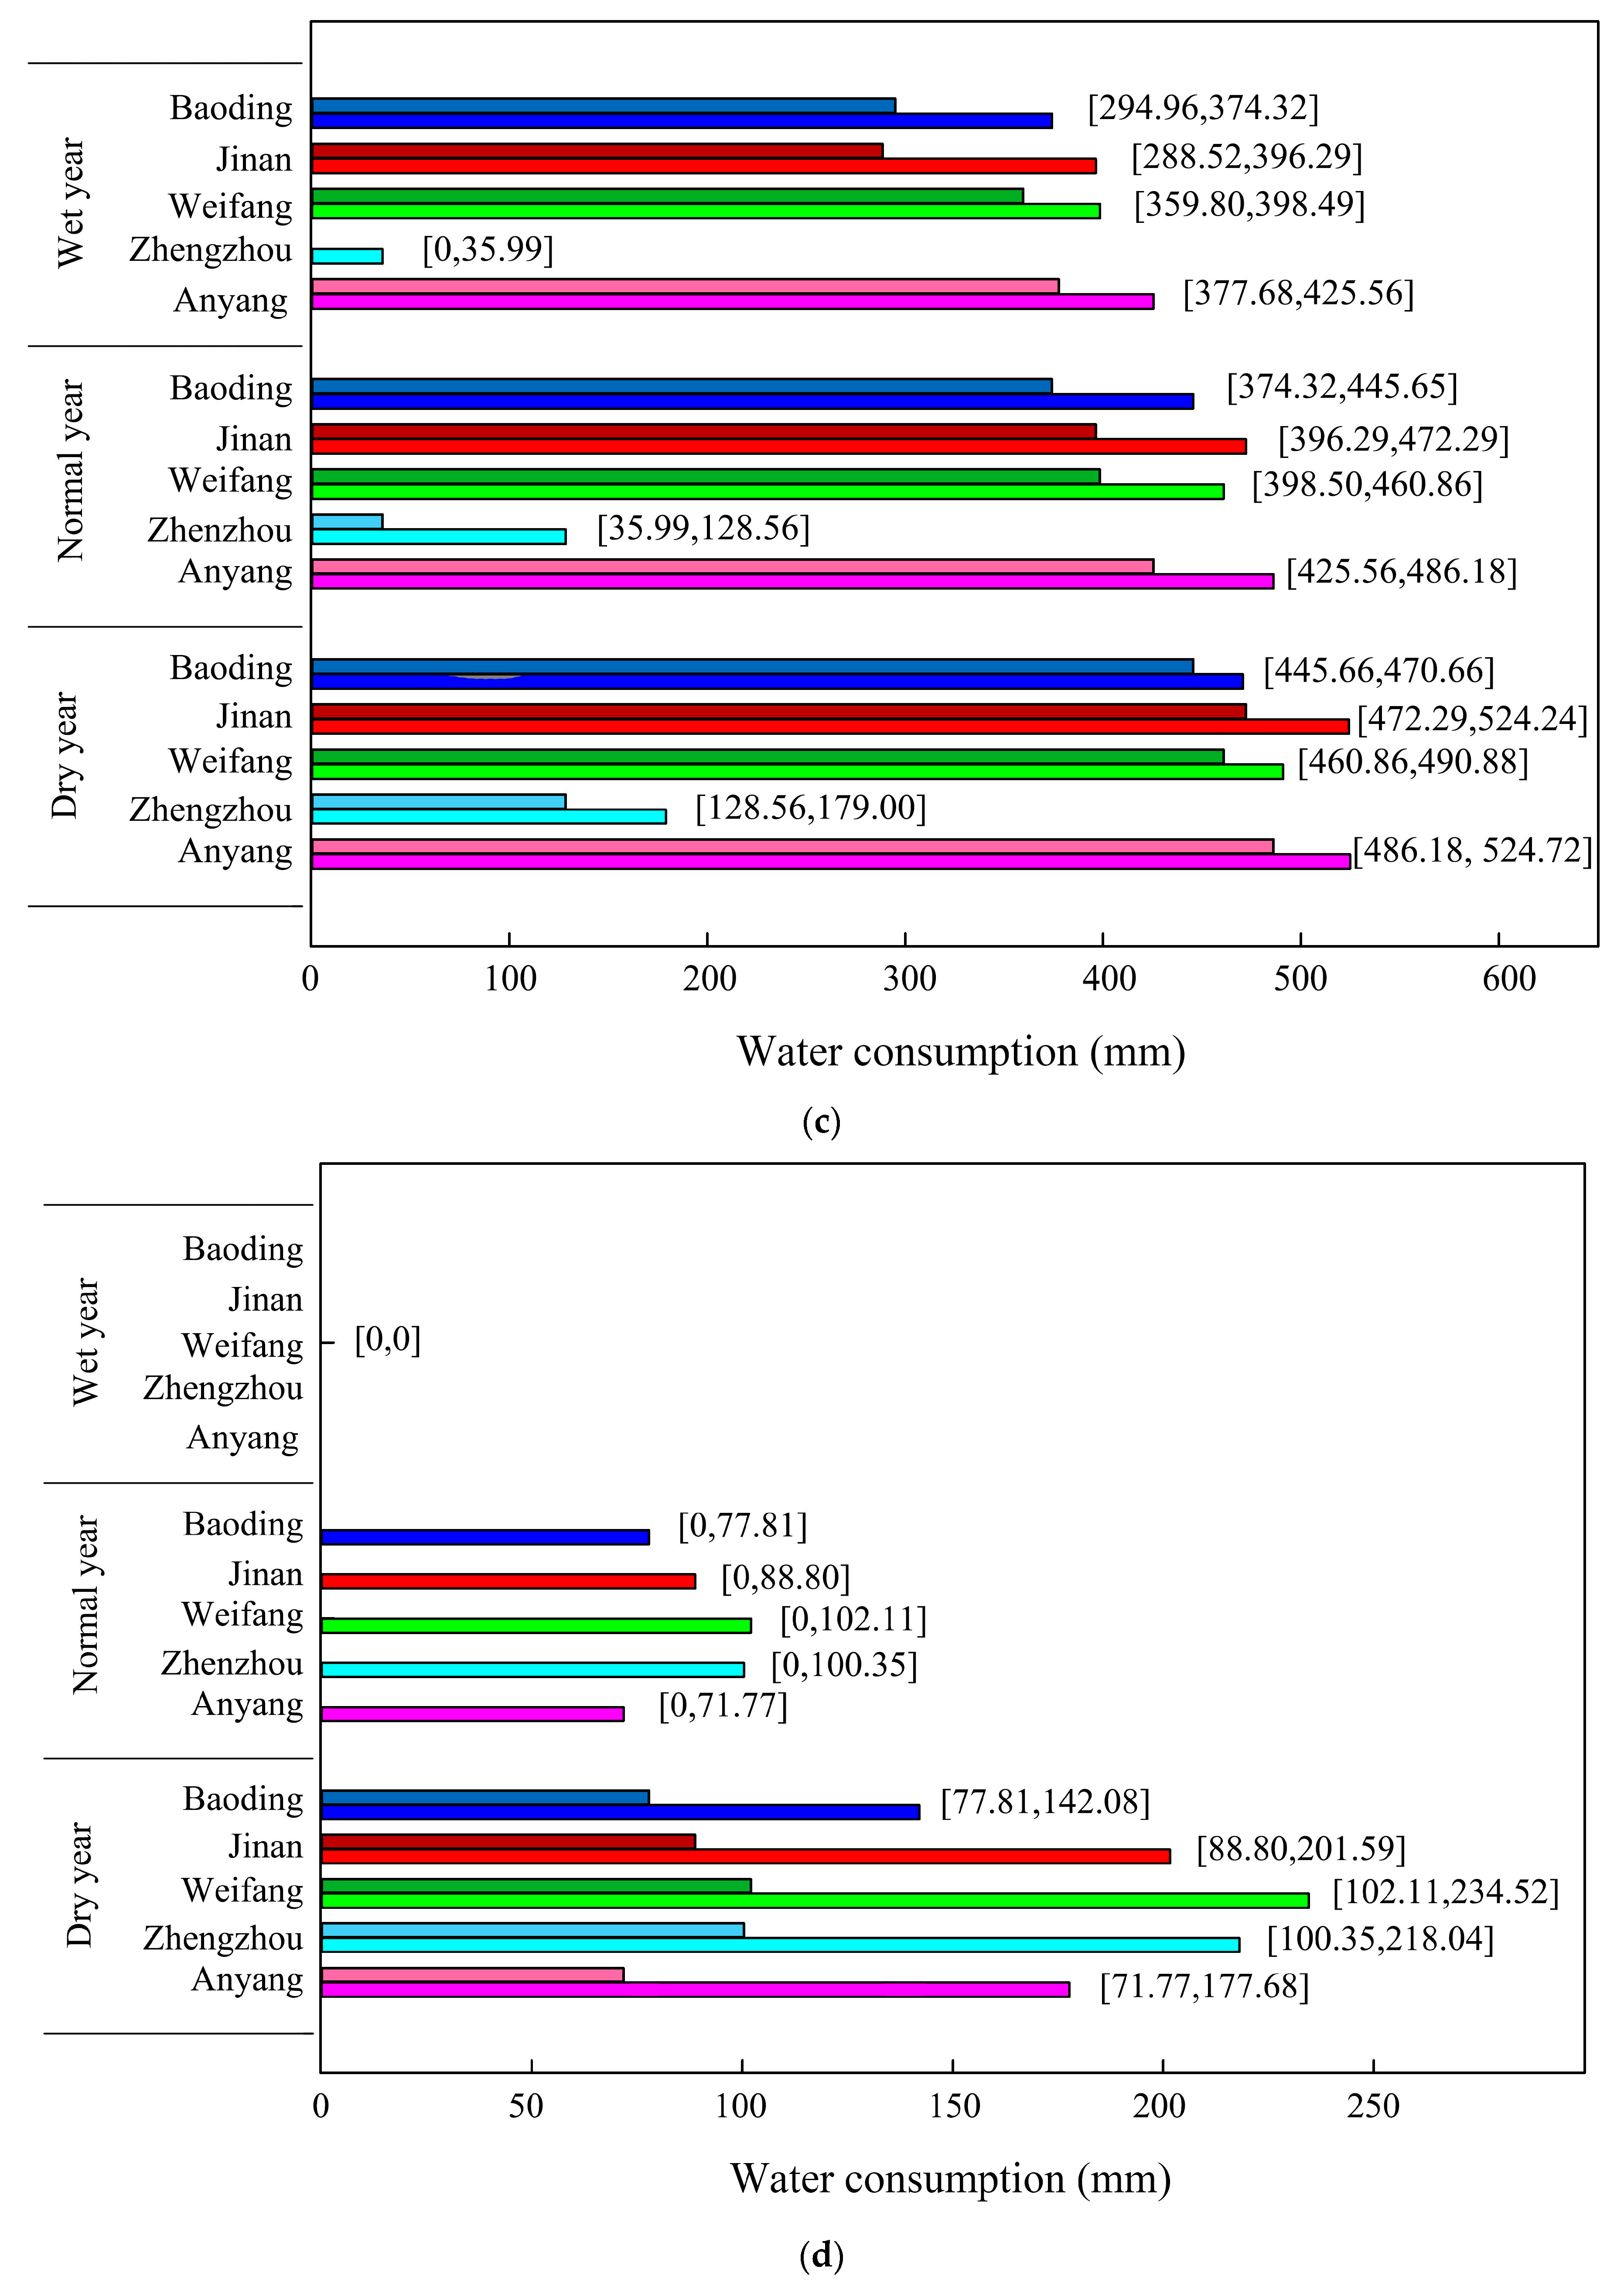
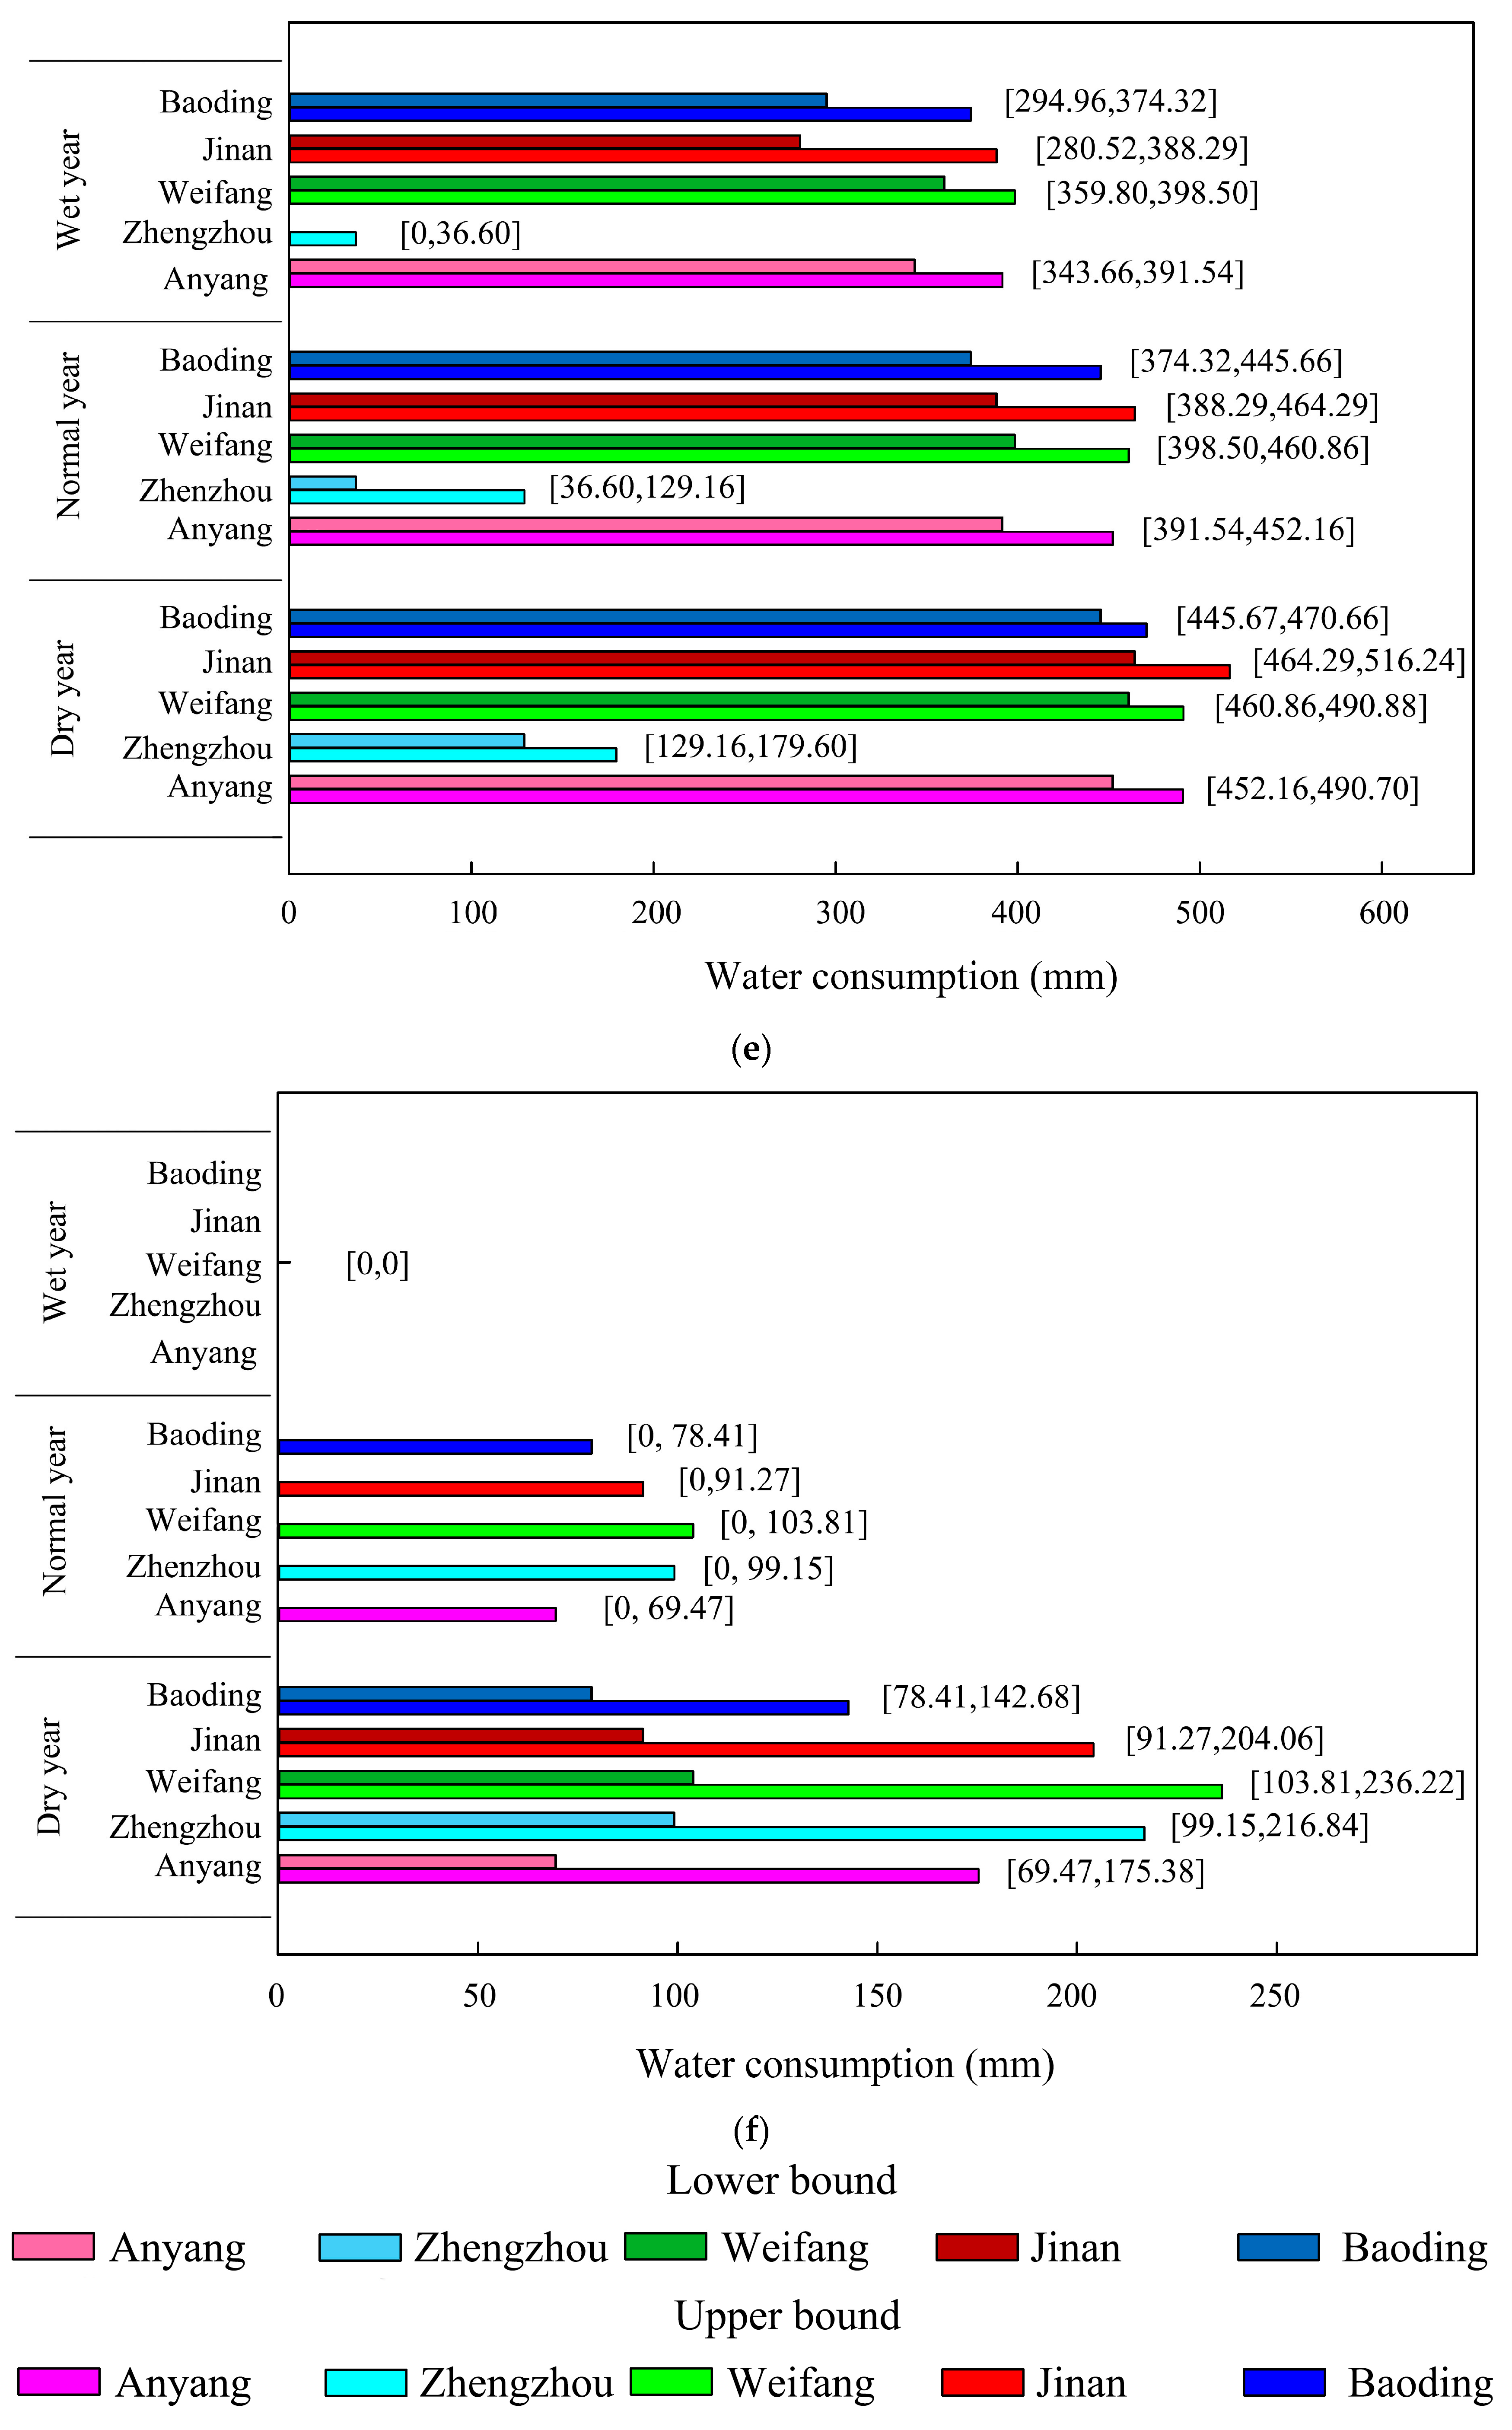
Based on the predicted yields per unit area of winter wheat and summer corn in the five studied cities, and the crop water production function, the water consumption per unit area of the crop could be calculated. At the same time, the probability distribution in different effective precipitation levels was considered. The amount of irrigation water required per unit area of crops under three different precipitation opportunity conditions is shown in Figure 7. It can be seen from the figure that the irrigation amount of winter wheat from 2020 to 2022 in the five studied cities was greater than that of summer corn. When the year was humid, the amount of irrigation water of summer corn in the five studied cities was very small, which means that natural precipitation in wet years can meet the water requirements of summer corn. In general, the variation range of the amount of summer corn irrigation water under the three probability conditions were, in descending order: Weifang, Zhengzhou, Jinan, Anyang, and Baoding. Predicting and planning the irrigation water volume of summer corn is more important for Weifang and Zhengzhou than other cities. It can be seen from the figure that for winter wheat, it is necessary to allocate irrigation water under three different types of years in five cities. There was little difference in the full irrigation amount of winter wheat under different probability conditions in the five cities. The variation range of the amount of winter wheat irrigation water under the three probability conditions was, in descending order: Jinan, Weifang, Baoding, Anyang, and Zhengzhou. The five studied cities all need to consider the planning of winter wheat irrigation and water allocation every year.
5.2. Production Value of the Two Crops
The production value of a crop can be obtained by multiplying the crop area, the yield per unit area, and the unit price of crop products. According to farmers’ willingness to plant crops and the theory of possibility measure, this paper sets four possibility levels, 1, 0.9, 0.8, and 0.7, which fuzzy the boundaries of the interval of the crop area. The production value of winter wheat and summer maize under different possibilities of planting areas in the five studies cities from 2021 to 2023 is shown in Table 10. In general, a higher probability level will lead to a larger range in production value. On the contrary, a lower probability level will lead to a smaller range in production value. The greater the probability, the less certainty the decision makers have about the future acreage.
The results show that there is a trade-off between the possibility level of crop area and crop production value. If decision-makers have more information about the crop planting area, the accuracy of the selection possibility level will be higher. In the case of insufficient information, the decision-makers need to choose a higher probability level so that the production value of the decision will be obtained. The smaller the error between the range and the actual output value range, the higher the accuracy of the planning and forecasting model.
5.3. Production Profit of Winter Wheat
Considering the crop production value under different possible crop areas, and the irrigation water allocation cost under different effective precipitation probabilities, the lower and upper parameters of winter wheat production’s profit in the five studied cities were calculated, and the results are shown in Table 11. The larger the probability value of the crop area, the smaller the lower boundary value of its winter wheat production profit, and the larger the upper boundary value. The lower and upper boundary values of winter wheat production’s profits were sorted by cities from small to large, as follows: Zhengzhou City, Jinan City, Anyang City, Weifang City, and Baoding City. When the planting area and effective precipitation were determined, the difference between the upper and lower bounds of winter wheat production’s profits in the five cities are, in descending order: Baoding City, Weifang City, Anyang City, Jinan City and Zhengzhou City. When the effective precipitation was determined, the change in the range of the lower and upper boundaries of winter wheat’s production profit between the possible values of adjacent crop areas are, in descending order: Baoding City, Weifang City, Anyang City, Zhengzhou City and Jinan City.
In general, under the conditions of a higher possibility level of a planting area and the effective precipitation probability in a year, the range between upper and lower boundaries of the production profit of winter wheat is larger. This is due to the large range of effective precipitation and crop area changes in the year. It can be seen from the figure that when the effective precipitation was the same, the upper and lower boundaries of the production profit of winter wheat were different with different conditions of crop area possibility. When the crop area possibility was the same, the upper and lower boundaries of the production profit of winter wheat were different with different conditions of effective precipitation. The larger the probability value of the effective precipitation, the larger the lower boundary value and the upper boundary value of its winter wheat production profit. Under the conditions of the same effective precipitation and crop planting area in different years, the correlation between winter wheat production profit and unit area yield is the greatest. For example, when the probability is 0.9, the profit range of winter wheat in the Anyang area is (44.31,50.56) if the normal precipitation year is 2022, and the profit range of the region in a drought year is (44.03,49.98) when the probability is 0.7, and the profit range has been reduced by 4.8%.
5.4. Production Profit of Summer Corn
Similarly, considering the crop production value under different possible crop areas, and the irrigation water allocation cost under different effective precipitation probabilities, the lower and upper margin parameters of summer corn production profit in the five studied cities were calculated, and the results are shown in Table 12. The larger the probability value of the crop area, the smaller the lower boundary value of its summer corn production profit, and the larger the upper boundary value. The lower and upper boundary values of summer corn’s production profit in the five cities, in order from small to large, are as follows: Zhengzhou City, Jinan City, Anyang City, Weifang City and Baoding City. When the planting area and effective precipitation were determined, the difference between the upper and lower bounds of summer corn’s production profit in the five cities are, in descending order: Weifang City, Baoding City, Anyang City, Jinan City and Zhengzhou City. When the effective precipitation was determined, the change range of summer corn’s lower boundary and upper boundary for production profit between the possible values of adjacent crop areas are, in descending order: Anyang City, Baoding City, Weifang City, Zhengzhou City and Jinan City.
In general, under the conditions of a higher planting area’s possibility level and the effective precipitation probability in a year, the range between upper and lower boundaries of the production profit of summer corn are larger. This is due to the large range of effective precipitation and crop area changes in the year. It can be seen from Table 7 that when the effective precipitation was the same, the upper and lower boundaries of the production profit of summer corn were different with different conditions of crop area possibility. When the crop area possibility was the same, the upper and lower boundaries of the production profit of summer corn were different with different conditions of effective precipitation. The larger the probability value of the effective precipitation, the larger the lower boundary value and the upper boundary value of its production profit for summer corn. Under the conditions of the same effective precipitation and crop planting area in different years, the correlation between summer corn’s production profit and unit area yield is the greatest.
5.5. Discussion and Analysis
The prediction model for the two main crop’s yields per hectare was developed, and the yield per unit area of the two crops from 2020 to 2022 was predicted by comparing the predicted value and the actual value in 2020. The results show that the prediction model has high prediction accuracy and can be used for two crops in five cities in the North China Plain. The irrigation water allocation benefits planning model based on hybrid uncertain programming was developed, and the production profits of winter wheat and summer corn in different scenarios were planned. The planning model and prediction model are linked through the crop water production function. Based on the predicted yield per unit area of winter wheat and summer maize from 2020 to 2022, this model generates interval parameters of production profits under three kinds of precipitation opportunities and four kinds of planting willingness.
According to the data of the 2020 Statistical Yearbook of the five cities, the planting areas of winter wheat in Anyang, Zhengzhou, and Weifang have all declined significantly, whereas the planting area of winter wheat in Jinan has not changed significantly. On the other hand, the planting area of summer maize in the four cities did not change much from previous years and remained basically stable. The main reason for this result is that the growth period of summer maize is shorter than that of winter wheat, the rainfall during the growth period of summer maize is sufficient, and the benefit of planting summer maize is higher than that of planting winter wheat, so the planting area of summer maize in the North China Plain has not dropped significantly. According to the possibility criterion, in the planning of winter wheat’s planting area in the North China Plain, the possibility value should be larger, and the possibility value of the planning of summer maize’s planting area should be smaller. In this study, the probability of a good intention for winter wheat planting was 1. The probability of a better intention for summer corn planting had a value of 0.8. The comparison of planned interval parameters and the true value of profit in 2020 are shown in Figure 8. According to the precipitation data, 2020 was a dry year. Based on the water consumption of the two crops, in order to obtain higher yields, more irrigation water needs to be allocated so the profit in production is smaller than that in normal years. The production profit value is near the lower boundary of the planning interval parameter.
Therefore, considering the probability of effective precipitation and crop area with different possibility conditions, different arrays of the objective profit can be calculated by decision makers. The two uncertainty parameters have become the keys to whether the prediction and planning model are effective in the future. Combined with the decision makers’ mastery of the crop planting area and the ability to select a reasonable probability distribution of effective precipitation, the decision makers can accurately seek the optimal irrigation water allocation and production profits.
6. Conclusions
Based on deep learning and the hybrid fuzzy uncertainty optimization method, this study developed a crop yield prediction model per unit area and an irrigation water distribution benefit planning model. Through the crop water production function, the combination of the two models can effectively deal with crop planting area and effective precipitation, and uncertain information such as irrigation water allocation costs. The model was applied to the forecast of yield per unit area of winter wheat and summer maize and the beneficial planning of irrigation water in five cities in the North China Plain.
The prediction accuracy of the prediction model for crop yield per unit area is high. The average absolute error between the model’s prediction value and the actual value of the unit area yield of winter wheat and summer maize in four cities in 2020 is controlled within the range of 14.02 to 696.66 kg/hectare. It shows that the model can more accurately predict the yield per unit area of crops. At the same time, the planning model for the benefit of irrigation water allocation planning model generated three scenarios of rainfall levels and four planting intentions, and compared the planned scenarios with the actual production benefits of the two crops in 2020. It was found that in drought years, the possibility of the winter wheat planting area is optimized. Out of the value of 1, the preferred value for the likelihood of summer corn acreage is 0.8.
However, the planning model for the benefit of irrigation water allocation in this study is an idealized scenario. Compared with the conventional deterministic planning method, the model takes into account the uncertain parameters, which helps decision makers seek better solutions in various scenarios. Appropriate planning schemes provide strong technical support for the planning of irrigation water distribution and crop area planning in the North China Plain. However, due to the large area considered in this study, the correlation and complexity of the irrigation distribution system within the region were not fully considered. Due to the limitation of the length of the article, this part of the content will continue to be carried out in the follow-up research.
Author Contributions
This study presented here was carried out by all authors collaboratively. W.J. and Z.W. conceived the idea; W.J. worked on an associated date and carried out the experimental work; W.J. and L.Z. drafted the manuscript; Z.W. and L.Z. provided their experience with W.J.; Z.W. supervised the study. All authors have read and agreed to the published version of the manuscript.
Funding
This study received no external funding.
Institutional Review Board Statement
Not applicable.
Informed Consent Statement
Not applicable.
Data Availability Statement
The data that support the findings of this study are available on request from the corresponding author.
Acknowledgments
This work is supported in part by the National Key Research and Development Project of the 13th five-year plan fertilizer-water source-equipment adaptation technology and control equipment (2017YFD0201504).
Conflicts of Interest
The authors declare that they have no known competing financial interest or personal relationships that could have appeared to influence the work reported in this paper.
References
- Wang, Y.; Zhang, Y.; Zhang, R.; Li, J.; Zhang, M.; Zhou, S.; Wang, Z. Reduced irrigation increases the water use efficiency and productivity of winter wheat-summer maize rotation on the North China Plain. Sci. Total Environ. 2018, 618, 112–120. [Google Scholar] [CrossRef]
- Zhai, L.-C.; Lü, L.-H.; Dong, Z.-Q.; Zhang, L.-H.; Zhang, J.-T.; Jia, X.-L.; Zhang, Z.-B. The water-saving potential of using micro-sprinkling irrigation for winter wheat production on the North China Plain. J. Integr. Agric. 2021, 20, 1687–1700. [Google Scholar] [CrossRef]
- Fu, J.; Zhong, P.-A.; Xu, B.; Zhu, F.; Chen, J.; Li, J. Comparison of Transboundary Water Resources Allocation Models Based on Game Theory and Multi-Objective Optimization. Water 2021, 13, 1421. [Google Scholar] [CrossRef]
- Rivera, A.; Gunda, T.; Hornberger, G.M. Minimizing irrigation water demand: An evaluation of shifting planting dates in Sri Lanka. Ambio 2018, 47, 466–476. [Google Scholar] [CrossRef] [PubMed]
- Feng, J. Optimal allocation of regional water resources based on multi-objective dynamic equilibrium strategy. Appl. Math. Modelling 2021, 90, 1183–1203. [Google Scholar] [CrossRef]
- Shen, X.; Wu, X.; Xie, X.; Wei, C.; Li, L.; Zhang, J. Synergetic Theory-Based Water Resource Allocation Model. Water Resour. Manag. 2021, 35, 2053–2078. [Google Scholar] [CrossRef]
- El Bilali, A.; Taleb, A. Prediction of irrigation water quality parameters using machine learning models in a semi-arid environment. J. Saudi Soc. Agric. Sci. 2020, 19, 439–451. [Google Scholar] [CrossRef]
- Sundararajan, K.; Garg, L.; Srinivasan, K.; Kashif Bashir, A.; Kaliappan, J.; Pattukandan Ganapathy, G.; Kumaran Selvaraj, S.; Meena, T. A Contemporary Review on Drought Modeling Using Machine Learning Approaches. Comput. Modeling Eng. Sci. 2021, 128, 447–487. [Google Scholar] [CrossRef]
- Peng, Y.; Xiao, Y.; Fu, Z.; Dong, Y.; Zheng, Y.; Yan, H.; Li, X. Precision irrigation perspectives on the sustainable water-saving of field crop production in China: Water demand prediction and irrigation scheme optimization. J. Clean. Prod. 2019, 230, 365–377. [Google Scholar] [CrossRef]
- Li, M.; Sun, H.; Liu, D.; Singh, V.P.; Fu, Q. Multi-scale modeling for irrigation water and cropland resources allocation considering uncertainties in water supply and demand. Agric. Water Manag. 2021, 246, 106687. [Google Scholar] [CrossRef]
- Li, J.; Shang, S.; Jiang, H.; Song, J.; Rahman, K.U.; Adeloye, A.J. Simulation-based optimization for spatiotemporal allocation of irrigation water in arid region. Agric. Water Manag. 2021, 254, 106952. [Google Scholar] [CrossRef]
- Hassan, W.; Manzoor, T.; Jaleel, H.; Muhammad, A. Demand-based water allocation in irrigation systems using mechanism design: A case study from Pakistan. Agric. Water Manag. 2021, 256, 107075. [Google Scholar] [CrossRef]
- Imron, F. Optimization of irrigation water allocation by using linear programming: Case study on Belitang irrigation system. In IOP Conference Series: Earth and Environmental Science; IOP Publishing: Bristol, UK, 2021; Volume 653, p. 012023. [Google Scholar] [CrossRef]
- Zhang, C.; Yue, Q.; Guo, P. A Nonlinear Inexact Two-Stage Management Model for Agricultural Water Allocation under Uncertainty Based on the Heihe River Water Diversion Plan. Int. J. Environ. Res. Public Health 2019, 16, 1884. [Google Scholar] [CrossRef] [PubMed] [Green Version]
- Zhang, C.; Li, X.; Guo, P.; Huo, Z. An improved interval-based fuzzy credibility-constrained programming approach for supporting optimal irrigation water management under uncertainty. Agric. Water Manag. 2020, 238, 106185. [Google Scholar] [CrossRef]
- Cheng, K.; Wei, S.; Ren, Y.; Fu, Q. Optimal allocation of agricultural water resources under the background of China’s agricultural water price reform-a case study of Heilongjiang province. Appl. Math. Model. 2021, 97, 636–649. [Google Scholar] [CrossRef]
- Gong, X.; Zhang, H.; Ren, C.; Sun, D.; Yang, J. Optimization allocation of irrigation water resources based on crop water requirement under considering effective precipitation and uncertainty. Agric. Water Manag. 2020, 239, 106264. [Google Scholar] [CrossRef]
- Yao, L.; Su, Z.; Hou, S. Robust programming for basin-level water allocation with uncertain water availability and policy-driven scenario analysis. Complex Intell. Syst. 2021, 1–21. [Google Scholar] [CrossRef]
- Xu, W.; Zhong, Z.; Proverbs, D.; Xiong, S.; Zhang, Y. Enhancing the Resilience of the Management of Water Resources in the Agricultural Supply Chain. Water 2021, 13, 1619. [Google Scholar] [CrossRef]
- Li, M.; Fu, Q.; Singh, V.P.; Liu, D.; Gong, X. Risk-based agricultural water allocation under multiple uncertainties. Agric. Water Manag. 2020, 233, 106105. [Google Scholar] [CrossRef]
- Zhang, W.J.; Tan, Q.; Zhang, T.Y. A risk-averse stochastic quadratic model with recourse for supporting irrigation water management in uncertain and nonlinear environments. Agric. Water Manag. 2021, 244, 106431. [Google Scholar] [CrossRef]
- Cai, Y.; Cai, J.; Chen, D.; Xie, Y.; Feng, J. Development of an integrated prediction-optimization modeling approach for coupled risk management of water and energy nexus systems. Sci. Total Environ. 2021, 781, 146744. [Google Scholar] [CrossRef]
- Khaki, S.; Wang, L.; Archontoulis, S.V. A CNN-RNN Framework for Crop Yield Prediction. Front. Plant Sci. 2019, 10, 1750. [Google Scholar] [CrossRef]
- VINCENT, D.E.A.P.M.D. Crop Yield Prediction Using Deep Reinforcement Learning Model for Sustainable Agrarian Applications. IEEE Access 2020, 8, 86886–86901. [Google Scholar] [CrossRef]
- Meng, L.; Liu, H.; Ustin, S.L.; Zhang, X. Predicting Maize Yield at the Plot Scale of Different Fertilizer Systems by Multi-Source Data and Machine Learning Methods. Remote Sens. 2021, 13, 3760. [Google Scholar] [CrossRef]
- Shahhosseini, M.; Hu, G.; Huber, I.; Archontoulis, S.V. Coupling machine learning and crop modeling improves crop yield prediction in the US Corn Belt. Sci. Rep. 2021, 11, 1606. [Google Scholar] [CrossRef]
- Tummala, S.; Pravallika, K.; Karuna, G.; Anuradha, K.; Srilakshmi, V.; Kosaraju, S.; Bobba, P.; Singh, S. Deep Neural Network Model for Proficient Crop Yield Prediction. E3S Web Conf. 2021, 309, 01031. [Google Scholar] [CrossRef]
- Sun, J.; Di, L.; Sun, Z.; Shen, Y.; Lai, Z. County-Level Soybean Yield Prediction Using Deep CNN-LSTM Model. Sensors 2019, 19, 4363. [Google Scholar] [CrossRef] [Green Version]
- Li, S.; Wu, J.; Wang, X.; Ma, L. Economic and environmental sustainability of maize-wheat rotation production when substituting mineral fertilizers with manure in the North China Plain. J. Clean. Prod. 2020, 271, 122683. [Google Scholar] [CrossRef]
- Anyang Statistival Yearbook. Available online: http://tjj.anyang.gov.cn/sjfx/tjsj/index_2.html (accessed on 15 June 2021).
- Baoding Statistical Yearbook. Available online: http://www.hetj.gov.cn/hetj/tjsj/jjnj/ (accessed on 15 June 2021).
- Jinan Statistival Yearbook. Available online: http://jntj.jinan.gov.cn/col/col18253/index.html (accessed on 15 June 2021).
- Weifang Statistival Yearbook. Available online: http://tjj.weifang.gov.cn/TJYW/TJSJ/ (accessed on 15 June 2021).
- Zhengzhou Statistival Yearbook. Available online: http://tjj.zhengzhou.gov.cn/tjyb/index.jhtml (accessed on 15 June 2021).
- Xurong Mei, Q.L.; Rongchang, Y. National Science and Technology Basic Work Special Project Atlas of Growth Periods of Major Crops in China; Hangzhou Science and Technology Press: Hangzhou, China, 2016; p. 145. [Google Scholar]
- Aboutalebi, M.; Torres-Rua, A.; Allen, N. Spatial and Temporal Analysis of Precipitation and Effective Rainfall Using Gauge Observations, Satellite, and Gridded Climate Data for Agricultural Water Management in the Upper Colorado River Basin. Remote Sens. 2018, 10, 2058. [Google Scholar] [CrossRef] [Green Version]
- Hochreiter, S.; Schmidhuber, J. Long Short-Term Memory. Neural Comput. 1997, 9, 1735–1780. [Google Scholar] [CrossRef] [PubMed]
- Haider, S.; Naqvi, S.; Akram, T.; Umar, G.; Shahzad, A.; Sial, M.; Khaliq, S.; Kamran, M. LSTM Neural Network Based Forecasting Model for Wheat Production in Pakistan. Agronomy 2019, 9, 72. [Google Scholar] [CrossRef] [Green Version]
- Yu, L.; Li, Y.P.; Huang, G.H. A fuzzy-stochastic simulation-optimization model for planning electric power systems with considering peak-electricity demand: A case study of Qingdao, China. Energy 2016, 98, 190–203. [Google Scholar] [CrossRef]
- Zhou, Y.; Li, Y.P.; Huang, G.H.; Zhou, Y. A robust approach for planning electric power systems associated with environmental policy analysis. Electr. Power Syst. Res. 2013, 95, 99–111. [Google Scholar] [CrossRef]
- Shaozhong Kang, J.S.; Xiying, Z.; Ling, T.; Jinglei, W.; Sien, L. Water Requirements and Water Consumption Management of Major Crops in Northern China; China Water Conservancy and Hydropower Press: Beijing, China, 2018. [Google Scholar]
- Yinhuan, F.; Ping, G.; Shiqi, F.; Mo, L. Optimal water resources planning based on interval-parameter two-stage stochastic programming. Trans. Chin. Soc. Agric. Eng. Trans. CSAE 2014, 30, 8. [Google Scholar] [CrossRef]
- Li, S. China Agricultural Product Price Survey Yearbook 2021; China Statistics Press: Beijing, China, 2021. [Google Scholar]
- Rui, Z.; Zhengying, W.; Yubin, Z. Time Series Prediction of Tomato Yield Based on LSTM Recurrent Neural Network Water. Sav. Irrig. 2018, 5, 5. [Google Scholar]
Figure 1.
Geographical location of five cities in China.

Figure 2.
Planting areas and yield per unit hectare of winter wheat and summer maize in five cities. (a) Winter wheat in Anyang; (b) summer corn in Anyang; (c) winter wheat in Zhengzhou; (d) summer corn in Zhengzhou; (e) winter wheat in Weifang; (f) summer corn in Weifang; (g) winter wheat in Jinan; (h) summer corn in Jinan; (i) winter wheat in Baoding; and (j) summer corn in Baoding.


Figure 3.
Schematic of the LSTM-CCP-FPP-IPP planning programming.

Figure 4.
A basic LSTM network architecture for regression problems.

Figure 5.
The comparison of predicted value and true value of validation set in the model. (a) Winter wheat and (b) summer corn.
Figure 5.
The comparison of predicted value and true value of validation set in the model. (a) Winter wheat and (b) summer corn.


Figure 6.
The comparison of predicted value and true value of test set in the model.

Figure 7.
Interval parameters for the prediction of irrigation water allocation in five cities. (a) Lower bound of irrigation water allocation in 2020; (b) upper bound of irrigation water allocation in 2020; (c) lower bound of irrigation water allocation in 2021; (d) upper bound of irrigation water allocation in 2021; (e) upper bound of irrigation water allocation in 2022; and (f) upper bound of irrigation water allocation in 2022.


Figure 8.
The comparison of planned interval parameters and true value of profit in 2020. (a) Winter wheat in 2020 and (b) summer corn in 2020.
Figure 8.
The comparison of planned interval parameters and true value of profit in 2020. (a) Winter wheat in 2020 and (b) summer corn in 2020.


Table 1.
Geographical and meteorological information of the five studied cities.
| Study City | Longitude (°) | Dimension (°) | Annual Average Temperature (°C) | Annual Precipitation (mm) |
|---|---|---|---|---|
| Anyang | 113°38′~114°59′ | 35°41′~36°21′ | 12.9 | 598.1 |
| Zhengzhou | 112°42′~114°14′ | 34°16′~34°58′ | 15.6 | 542.2 |
| Weifang | 118°10′~120°01′ | 35°41′~37°26′ | 12.9 | 605.8 |
| Jinan | 116°21′~117°93′ | 36°02′~37°54′ | 14.2 | 548.7 |
| Baoding | 113°40′~116°20′ | 38°10′~40°00′ | 13.4 | 498.9 |
Table 2.
The date and ordinal of winter wheat growing period planted in five cities.
| Study City | Sowing Date | Overwinter Date | Rejuvenation Date | Jointing Date | Flowering Date | Harvest Date |
|---|---|---|---|---|---|---|
| Anyang | 11 October (285) | 11 December (346) | 1 March (60) | 1 April (91) | 11 May (131) | 11 June (162) |
| Zhengzhou | 11 October (285) | 11 December (346) | 1 March (60) | 21 March (80) | 1 May (121) | 11 June (162) |
| Weifang | 11 October (285) | 11 December (346) | 11 March (70) | 1 April (91) | 11 May (131) | 11 June (162) |
| Jinan | 11 October (285) | 11 December (346) | 11 March (70) | 1 April (91) | 11 May (131) | 11 June (162) |
| Baoding | 1 October (275) | 11 December (346) | 11 March (70) | 11 April (101) | 21 May (141) | 21 June (162) |
Table 3.
The date and ordinal of summer corn growing period planted in five cities.
| Study City | Sowing Date | Jointing Date | Heading Date | Harvest Date |
|---|---|---|---|---|
| Anyang | 11 June (162) | 21 July (202) | 11 August (223) | 21 September (264) |
| Zhengzhou | 11 June (162) | 11 July (202) | 11 August (223) | 21 September (264) |
| Weifang | 21 June (172) | 21 July (202) | 11 August (223) | 1 October (274) |
| Jinan | 21 June (172) | 21 July (202) | 11 August (223) | 21 September (264) |
| Baoding | 21 June (172) | 1 August (213) | 11 August (223) | 1 October (274) |
Table 4.
Annual effective precipitation (mm) during the growth period of winter wheat and summer maize in the past 40 years.
Table 4.
Annual effective precipitation (mm) during the growth period of winter wheat and summer maize in the past 40 years.
| Year | Effective Precipitation from September to May | Effective Precipitation from June to September | ||||||||
|---|---|---|---|---|---|---|---|---|---|---|
| Anyang | Zhengzhou | Weifang | Jinan | Baoding | Anyang | Zhengzhou | Weifang | Jinan | Baoding | |
| 1981 | 36.7 | 69.2 | 82.6 | 87.5 | 31.7 | 300.6 | 256.5 | 202.7 | 144.5 | 198.9 |
| 1982 | 60. 6 | 131.3 | 87.5 | 106.4 | 24.2 | 389.4 | 287.0 | 301.9 | 269.8 | 332.2 |
| 1983 | 128.1 | 250.6 | 163.9 | 156.6 | 94.2 | 170.6 | 450.7 | 228.1 | 212.5 | 197.34 |
| 1984 | 153.3 | 105.9 | 144.6 | 107.7 | 70.3 | 363.2 | 420.7 | 285.7 | 184.8 | 143.2 |
| 1985 | 92.3 | 247.3 | 147.3 | 109.0 | 31.2 | 262.2 | 265.8 | 274.2 | 358.6 | 484.0 |
| 1986 | 99.0 | 138.9 | 87.4 | 65.1 | 43.2 | 100.5 | 122.6 | 175.1 | 177.5 | 180.2 |
| 1987 | 123.5 | 200.3 | 157.2 | 135.8 | 86.9 | 231.5 | 205.1 | 496.4 | 237.3 | 224.2 |
| 1988 | 153.4 | 144.1 | 105.7 | 99.5 | 120.3 | 292.4 | 209.2 | 337.4 | 253.4 | 472.6 |
| * | * | * | * | * | * | * | * | * | * | * |
| 2017 | 174.9 | 239.1 | 165.3 | 108.6 | 54.6 | 287.9 | 238.5 | 297.4 | 335.6 | 292.7 |
| 2018 | 129.4 | 163.2 | 145.3 | 165.2 | 162.4 | 338.2 | 244.9 | 477.3 | 464.6 | 219.2 |
| 2019 | 93.9 | 80.8 | 64.5 | 61.7 | 52.6 | 200.0 | 321.6 | 421.7 | 274.1 | 256.0 |
| Average Value | 105.5 | 151.6 | 131.7 | 112.3 | 82.7 | 286.5 | 283.3 | 350.3 | 278.3 | 267.0 |
| Standard Deviation | 36.08 | 55.10 | 45.24 | 37.12 | 42.46 | 95.35 | 87.49 | 120.96 | 93.95 | 112.24 |
* represent the omitted effective precipitation data, from 1989 to 2016 in five cities.
Table 5.
Crop water production function coefficients of winter wheat and summer maize in five cities.
Table 5.
Crop water production function coefficients of winter wheat and summer maize in five cities.
| Study City | Winter Wheat | Summer Corn | ||||
|---|---|---|---|---|---|---|
| a1 | b1 | c1 | a1 | b1 | c1 | |
| Anyang | −0.0293 | 32.9 | −2674.5 | −0.0657 | 53.6 | −3302.5 |
| Zhengzhou | −0.0607 | 53.5 | −4360.5 | −0.1740 | 138.6 | −21,426.0 |
| Weifang | −0.0333 | 36.1 | −4245.0 | −0.2293 | 186.0 | −28,890.0 |
| Jinan | −0.0553 | 65.9 | −1355.8 | −0.0640 | 54.0 | −4941.0 |
| Baoding | −0.0413 | 40.7 | −4521.0 | −0.1333 | 116.0 | −14,838.0 |
Table 6.
Fuzzy interval parameters and statistical description of winter wheat planting areas (105 hectares) in five studied cities.
Table 6.
Fuzzy interval parameters and statistical description of winter wheat planting areas (105 hectares) in five studied cities.
| Study City | Anyang | Zhengzhou | Weifang | Jinan | Baoding |
|---|---|---|---|---|---|
| Max value | 3.20 | 1.76 | 3.87 | 2.16 | 4.01 |
| Average value | 3.08 | 1.73 | 3.58 | 2.12 | 3.69 |
| Min value | 3.00 | 1.63 | 3.33 | 2.07 | 3.34 |
| Standard deviation | 0.06 | 0.04 | 0.17 | 0.03 | 0.27 |
| Interval parameter | [2.94, 3.00, 3.07] [3.14, 3.20, 3.27] | [1.58, 1.63, 1.67] [1.71, 1.76, 1.81] | [3.15, 3.32, 3.49] [3.69, 3.86, 4.03] | [2.04, 2.07, 2.10] [2.13, 2.16, 2.19] | [3.06, 3.34, 3.62] [3.73, 4.01, 4.29] |
Table 7.
Fuzzy interval parameters and statistical description of summer corn planting areas (105 hectares) in five studied cities.
Table 7.
Fuzzy interval parameters and statistical description of summer corn planting areas (105 hectares) in five studied cities.
| Study City | Anyang | Zhengzhou | Weifang | Jinan | Baoding |
|---|---|---|---|---|---|
| Max value | 2.44 | 1.58 | 3.90 | 2.11 | 4.61 |
| Average value | 2.29 | 1.49 | 3.64 | 2.05 | 4.40 |
| Min value | 2.01 | 1.35 | 3.44 | 1.92 | 4.16 |
| Standard deviation | 0.14 | 0.07 | 0.15 | 0.06 | 0.17 |
| Interval parameter | [1.87, 2.01, 2.15] [2.29, 2.43, 2.57] | [1.28, 1.35, 1.43] [1.51, 1.58, 1.66] | [3.28, 3.44, 3.59] [3.75, 3.90, 4.05] | [1.86, 1.92, 1.98] [2.05, 2.11, 2.17] | [4.00, 4.16, 4.33] [4.46, 4.61, 4.78] |
Table 8.
Chance-constrained interval parameter of effective precipitation in five study cities.
| Study City | Winter Wheat (mm) | Summer Corn (mm) | ||||
|---|---|---|---|---|---|---|
| Dry Year | Normal Year | Wet Year | Dry Year | Normal Year | Wet Year | |
| Anyang | [36.68, 75.22] | (75.22, 135.83) | [135.83, 183.72] | [100.52, 206.43] | (206.43, 366.61) | [366.14, 553.48] |
| Zhengzhou | [54.90, 105.34] | (105.34, 197.90) | [197.90, 279.66] | [92.16, 209.85] | (209.85, 356.83) | [356.83, 450.70] |
| Weifang | [51.12, 81.14] | (81.14, 143.50) | [143.50, 182.20] | [66.98, 199.39] | (199.39, 357.23) | [357.23, 522.24] |
| Jinan | [41.76, 93.71] | (93.71, 169.71) | [169.71, 277.48] | [135.94, 248.73] | (248.73, 451.94) | [451.94, 623.82] |
| Baoding | [22.04, 47.04] | (47.04, 118.38) | [118.38, 197.74] | [108.42, 172.69] | (172.69, 361.25) | [361.25, 533.66] |
Table 9.
Prediction accuracy and prediction results of yield per unit area (kg per hectare) in future.
Table 9.
Prediction accuracy and prediction results of yield per unit area (kg per hectare) in future.
| Year | Anyang | Zhengzhou | Weifang | Jinan | Baoding | |||||
|---|---|---|---|---|---|---|---|---|---|---|
| Wheat | Corn | Wheat | Corn | Wheat | Corn | Wheat | Corn | Wheat | Corn | |
| MAE | 121.09 | 231.62 | 75.27 | 83.92 | 99.04 | 98.05 | 145.19 | 185.03 | 61.56 | 189.26 |
| 2020 | 6464.75 | 6600.20 | 4828.50 | 4842.59 | 6150.17 | 6407.73 | 6018.43 | 5927.71 | 6252.85 | 5784.50 |
| 2021 | 6574.71 | 6523.99 | 4832.67 | 4824.77 | 6013.05 | 6344.41 | 6025.69 | 5994.35 | 6287.26 | 5855.43 |
| 2022 | 6527.11 | 6485.03 | 4846.65 | 4807.97 | 6038.37 | 6424.87 | 5997.88 | 6020.74 | 6295.11 | 5884.25 |
Table 10.
Interval parameters of production value of winter wheat and summer maize in five cities under different possibility conditions.
Table 10.
Interval parameters of production value of winter wheat and summer maize in five cities under different possibility conditions.
| Site | Year | Wheat ($ 108) | Corn ($ 108) | ||||||
|---|---|---|---|---|---|---|---|---|---|
| 1 | 0.9 | 0.8 | 0.7 | 1 | 0.9 | 0.8 | 0.7 | ||
| Anyang | 2021 | [7.74, 8.25] | [7.75, 8.23] | [7.77, 8.22] | [7.78, 8.20] | [5.63, 6.83] | [5.67, 6.79] | [5.71, 6.75] | [5.75, 6.71] |
| 2022 | [7.87, 8.39] | [7.89, 8.38] | [7.90, 8.36] | [7.92, 8.34] | [5.56, 6.75] | [5.60, 6.71] | [5.64, 6.67] | [5.68, 6.63] | |
| 2023 | [7.81, 8.33] | [7.83, 8.32] | [7.85, 8.30] | [7.86, 8.28] | [5.53, 6.71] | [5.57, 6.67] | [5.61, 6.63] | [5.65, 6.59] | |
| Zhengzhou | 2021 | [3.14, 3.39] | [3.15, 3.38] | [3.16, 3.37] | [3.16, 3.36] | [2.78, 3.25] | [2.80, 3.24] | [2.82, 3.22] | [2.83, 3.20] |
| 2022 | [3.14, 3.39] | [3.15, 3.39] | [3.16, 3.38] | [3.17, 3.37] | [2.77, 3.24] | [2.79, 3.23] | [2.80, 3.21] | [2.82, 3.20] | |
| 2023 | [3.15, 3.41] | [3.16, 3.40] | [3.17, 3.39] | [3.18, 3.38] | [2.77, 3.23] | [2.80, 3.22] | [2.80,3.20] | [2.81,3.19] | |
| Weifang | 2021 | [8.16, 9.47] | [8.20, 9.43] | [8.24, 9.39] | [8.28, 9.35] | [9.34, 10.62] | [9.38,10.57] | [9.43,10.53] | [9.47,10.49] |
| 2022 | [7.97, 9.26] | [8.02, 9.22] | [8.06, 9.18] | [8.10, 9.14] | [9.25, 10.51] | [9.29, 10.47] | [9.33, 10.43] | [9.37, 10.39] | |
| 2023 | [8.00, 9.30] | [8.05, 9.26] | [8.09, 9.22] | [8.13, 9.18] | [9.37, 10.64] | [9.41, 10.60] | [9.45, 10.56] | [9.49, 10.52] | |
| Jinan | 2021 | [4.96, 5.19] | [4.97, 5.18] | [4.98, 5.17] | [4.98, 5.17] | [4.84, 5.31] | [4.85, 5.30] | [4.87, 5.28] | [4.88, 5.27] |
| 2022 | [4.97, 5.19] | [4.97, 5.19] | [4.98, 5.18] | [4.99, 5.17] | [4.89, 5.37] | [4.91, 5.35] | [4.92, 5.34] | [4.93, 5.33] | |
| 2023 | [4.94, 5.17] | [4.95, 5.16] | [4.95, 5.16] | [4.97, 5.15] | [4.91, 5.40] | [4.92, 5.38] | [4.94, 5.37] | [4.96, 5.35] | |
| Baoding | 2021 | [8.33, 9.99] | [8.39, 9.92] | [8.47, 9.85] | [8.54, 9.78] | [10.23, 11.33] | [10.27, 11.29] | [10.31, 11.24] | [10.35, 11.20] |
| 2022 | [8.38, 10.04] | [8.44, 9.97] | [8.51, 9.90] | [8.58, 9.83] | [10.34, 11.47] | [10.39, 11.43] | [10.43, 11.38] | [10.48, 11.34] | |
| 2023 | [8.38, 10.05] | [8.45, 9.99] | [8.52, 9.91] | [8.59, 9.85] | [10.40, 11.52] | [10.44, 11.48] | [10.48, 11.44] | [10.53, 11.40] | |
Table 11.
Interval parameters of production value of winter wheat in five cities under different possibilities and precipitation.
Table 11.
Interval parameters of production value of winter wheat in five cities under different possibilities and precipitation.
| City | λ | 2020 ($ 108) | 2021 ($ 108) | 2022 ($ 108) | ||||||
|---|---|---|---|---|---|---|---|---|---|---|
| Dry Year | Normal Year | Wet Year | Dry Year | Normal Year | Wet Year | Dry Year | Normal Year | Wet Year | ||
| Anyang | 1 | [6.87, 7.83] | [6.94, 7.90] | [7.05, 7.94] | [6.89, 7.92] | [6.96, 7.98] | [7.08, 8.03] | [6.90, 7.89] | [6.97, 7.95] | [7.08, 8.00] |
| 0.9 | [6.88, 7.82] | [6.95, 7.88] | [7.07, 7.93] | [6.90, 7.90] | [6.98, 7.96] | [7.09, 8.01] | [6.91, 7.87] | [6.98, 7.93] | [7.10, 7.98] | |
| 0.8 | [6.89, 7.80] | [6.97, 7.86] | [7.08, 7.91] | [6.92, 7.88] | [6.99, 7.95] | [7.11, 7.99] | [6.93, 7.86] | [7.00, 7.92] | [7.11, 7.97] | |
| 0.7 | [6.91, 7.79] | [6.98, 7.85] | [7.10, 7.90] | [6.93, 7.87] | [7.01, 7.93] | [7.12, 7.98] | [6.94, 7.84] | [7.01, 7.90] | [7.13, 7.95] | |
| Zhengzhou | 1 | [2.96, 3.33] | [3.01, 3.38] | [3.11, 3.40] | [2.96, 3.33] | [3.01, 3.38] | [3.11, 3.40] | [2.97, 3.34] | [3.02, 3.39] | [3.12, 3.41] |
| 0.9 | [2.97, 3.32] | [3.02, 3.37] | [3.11, 3.39] | [2.97, 3.32] | [3.02, 3.37] | [3.12, 3.39] | [2.98, 3.33] | [3.03, 3.38] | [3.13, 3.40] | |
| 0.8 | [2.97, 3.31] | [3.03, 3.36] | [3.12, 3.38] | [2.98, 3.31] | [3.03, 3.36] | [3.13, 3.38] | [2.99, 3.32] | [3.04, 3.37] | [3.13, 3.39] | |
| 0.7 | [2.98, 3.30] | [3.04, 3.35] | [3.13, 3.37] | [2.99, 3.30] | [3.04, 3.35] | [3.13, 3.37] | [3.00, 3.31] | [3.05, 3.36] | [3.14, 3.38] | |
| Weifang | 1 | [7.14, 8.93] | [7.20, 9.00] | [7.33, 9.05] | [6.96, 8.72] | [7.02, 8.79] | [7.15, 8.84] | [6.99, 8.76] | [7.05, 8.83] | [7.19, 8.88] |
| 0.9 | [7.18, 8.89] | [7.24, 8.96] | [7.37, 9.01] | [6.99, 8.68] | [7.06, 8.75] | [7.19, 8.80] | [7.03, 8.72] | [7.09, 8.79] | [7.22, 8.84] | |
| 0.8 | [7.21, 8.85] | [7.28, 8.92] | [7.41, 8.97] | [7.03, 8.64] | [7.09, 8.71] | [7.22, 8.76] | [7.06, 8.68] | [7.13, 8.75] | [7.26, 8.80] | |
| 0.7 | [7.25, 8.81] | [7.31, 8.88] | [7.45, 8.93] | [7.07, 8.60] | [7.13, 8.67] | [7.26, 8.72] | [7.10, 8.64] | [7.16, 8.71] | [7.30, 8.76] | |
| Jinan | 1 | [4.29, 4.88] | [4.36, 4.93] | [4.46, 5.00] | [4.29, 4.88] | [4.36, 4.93] | [4.46, 5.01] | [4.28, 4.86] | [4.35, 4.91] | [4.45, 4.99] |
| 0.9 | [4.30, 4.87] | [4.36, 4.92] | [4.46, 4.99] | [4.30, 4.87] | [4.37, 4.93] | [4.46, 5.00] | [4.28, 4.86] | [4.35, 4.91] | [4.45, 4.98] | |
| 0.8 | [4.30, 4.86] | [4.37, 4.91] | [4.47, 4.99] | [4.31, 4.87] | [4.37, 4.92] | [4.47, 4.99] | [4.29, 4.85] | [4.36, 4.90] | [4.46, 4.97] | |
| 0.7 | [4.31, 4.86] | [4.38, 4.91] | [4.48, 4.98] | [4.31, 4.86] | [4.38, 4.91] | [4.48, 4.99] | [4.30, 4.84] | [4.37, 4.89] | [4.47, 4.97] | |
| Baoding | 1 | [7.35, 9.44] | [7.40, 9.53] | [7.55, 9.63] | [7.40, 9.50] | [7.45, 9.59] | [7.60, 9.69] | [7.41, 9.51] | [7.46, 9.60] | [7.61, 9.70] |
| 0.9 | [7.41, 9.37] | [7.47, 9.46] | [7.62, 9.56] | [7.46, 9.43] | [7.51, 9.52] | [7.66, 9.62] | [7.47, 9.44] | [7.52, 9.53] | [7.67, 9.63] | |
| 0.8 | [7.47, 9.31] | [7.53, 9.40] | [7.68, 9.50] | [7.52, 9.36] | [7.57, 9.45] | [7.73, 9.55] | [7.53, 9.38] | [7.58, 9.47] | [7.74, 9.56] | |
| 0.7 | [7.53, 9.24] | [7.59, 9.33] | [7.74, 9.43] | [7.58, 9.30] | [7.64, 9.39] | [7.79, 9.48] | [7.59, 9.31] | [7.65, 9.40] | [7.80, 9.50] | |
Table 12.
Interval parameters of production value of summer corn in five cities under different possibilities and precipitation.
Table 12.
Interval parameters of production value of summer corn in five cities under different possibilities and precipitation.
| City | λ | 2020 ($108) | 2021 ($108) | 2022 ($108) | ||||||
|---|---|---|---|---|---|---|---|---|---|---|
| Dry Year | Normal Year | Wet Year | Dry Year | Normal Year | Wet Year | Dry Year | Normal Year | Wet Year | ||
| Anyang | 1 | [5.41, 6.78] | [5.54, 6.84] | [5.64, 6.84] | [5.35, 6.70] | [5.48, 6.76] | [5.57, 6.76] | [5.32, 6.66] | [5.45, 6.72] | [5.54, 6.72] |
| 0.9 | [5.44, 6.74] | [5.58, 6.80] | [5.68, 6.80] | [5.38, 6.66] | [5.61, 6.72] | [5.61, 6.72] | [5.35, 6.63] | [5.49, 6.68] | [5.58, 6.68] | |
| 0.8 | [5.48, 6.70] | [5.62, 6.76] | [5.72, 6.76] | [5.42, 6.62] | [5.56, 6.68] | [5.65, 6.68] | [5.39, 6.59] | [5.53, 6.64] | [5.62, 6.64] | |
| 0.7 | [5.52, 6.66] | [5.66, 6.72] | [5.76, 6.72] | [5.46, 6.59] | [5.60, 6.64] | [5.69, 6.64] | [5.43, 6.55] | [5.56, 6.60] | [5.65, 6.60] | |
| Zhengzhou | 1 | [2.60, 3.21] | [2.70, 3.26] | [2.79, 3.26] | [2.59, 3.20] | [2.69, 3.25] | [2.78, 3.25] | [2.58, 3.19] | [2.68, 3.24] | [2.77, 3.24] |
| 0.9 | [2.62, 3.20] | [2.72, 3.24] | [2.80, 3.24] | [2.61, 3.18] | [2.71, 3.23] | [2.80, 3.23] | [2.60, 3.17] | [2.70, 3.22] | [2.78, 3.22] | |
| 0.8 | [2.63, 3.18] | [2.73, 3.23] | [2.82, 3.23] | [2.62, 3.17] | [2.72, 3.22] | [2.81, 3.22] | [2.61, 3.16] | [2.71, 3.21] | [2.80, 3.21] | |
| 0.7 | [2.65, 3.16] | [2.75, 3.21] | [2.84, 3.21] | [2.64, 3.15] | [2.74, 3.20] | [2.82, 3.20] | [2.63, 3.14] | [2.73, 3.19] | [2.82, 3.19] | |
| Weifang | 1 | [8.85, 10.50] | [9.13, 10.63] | [9.36, 10.63] | [8.76, 10.40] | [9.04, 10.53] | [9.27, 10.53] | [8.87, 10.53] | [9.16, 10.66] | [9.38, 10.66] |
| 0.9 | [8.89, 10.47] | [9.17, 10.59] | [9.40, 10.59] | [8.80, 10.36] | [9.08, 10.49] | [9.31, 10.49] | [8.91, 10.49] | [9.20, 10.62] | [9.42, 10.62] | |
| 0.8 | [8.93, 10.42] | [9.22, 10.55] | [9.44, 10.55] | [8.84, 10.32] | [9.12, 10.45] | [9.35, 10.45] | [8.95, 10.45] | [9.24, 10.58] | [9.47, 10.58] | |
| 0.7 | [8.96, 10.38] | [9.25, 10.51] | [9.48, 10.51] | [8.87, 10.28] | [9.16, 10.41] | [9.39, 10.41] | [8.99, 10.41] | [9.28, 10.54] | [9.51, 10.54] | |
| Jinan | 1 | [4.61, 5.27] | [4.74, 5.32] | [4.85, 5.32] | [4.65, 5.32] | [4.79,5.38] | [4.90, 5.38] | [4.67, 5.34] | [4.81, 5.41] | [4.92, 5.41] |
| 0.9 | [4.62, 5.25] | [4.76, 5.31] | [4.86, 5.31] | [4.67, 5.31] | [4.81, 5.37] | [4.91, 5.37] | [4.69, 5.33] | [4.82, 5.39] | [4.94, 5.39] | |
| 0.8 | [4.64, 5.24] | [4.77, 5.29] | [4.87, 5.29] | [4.68, 5.29] | [4.82, 5.35] | [4.93, 5.35] | [4.70, 5.32] | [4.84, 5.38] | [4.95, 5.38] | |
| 0.7 | [4.65, 5.22] | [4.79, 5.28] | [4.89, 5.28] | [4.70, 5.28] | [4.84, 5.34] | [4.94, 5.34] | [4.72, 5.30] | [4.85, 5.36] | [4.96, 5.36] | |
| Baoding | 1 | [9.87, 11.23] | [10.04, 11.35] | [10.24, 11.35] | [9.99, 11.37] | [10.16, 11.48] | [10.37, 11.48] | [10.04, 11.43] | [10.21, 11.54] | [10.42, 11.54] |
| 0.9 | [9.91, 11.19] | [10.08, 11.30] | [10.28, 11.30] | [10.03, 11.33] | [10.20, 11.44] | [10.41, 11.44] | [10.08, 11.38] | [10.25, 11.50] | [10.46, 11.50] | |
| 0.8 | [9.95, 11.15] | [10.12, 11.26] | [10.32, 11.26] | [10.07, 11.29] | [10.24, 11.40] | [10.45, 11.40] | [10.12, 11.34] | [10.29, 11.46] | [10.50, 11.46] | |
| 0.7 | [9.99, 11.11] | [10.16, 11.22] | [10.36, 11.22] | [10.11, 11.25] | [10.29, 11.36] | [10.49, 11.36] | [10.16, 11.30] | [10.33, 11.41] | [10.54, 11.41] | |
Publisher’s Note: MDPI stays neutral with regard to jurisdictional claims in published maps and institutional affiliations. |
© 2022 by the authors. Licensee MDPI, Basel, Switzerland. This article is an open access article distributed under the terms and conditions of the Creative Commons Attribution (CC BY) license (https://creativecommons.org/licenses/by/4.0/).
Share and Cite
MDPI and ACS Style
Jia, W.; Wei, Z.; Zhang, L. A Novel Prediction and Planning Model for the Benefit of Irrigation Water Allocation Based on Deep Learning and Uncertain Programming. Water 2022, 14, 689. https://doi.org/10.3390/w14050689
AMA Style
Jia W, Wei Z, Zhang L. A Novel Prediction and Planning Model for the Benefit of Irrigation Water Allocation Based on Deep Learning and Uncertain Programming. Water. 2022; 14(5):689. https://doi.org/10.3390/w14050689
Chicago/Turabian StyleJia, Weibing, Zhengying Wei, and Lei Zhang. 2022. "A Novel Prediction and Planning Model for the Benefit of Irrigation Water Allocation Based on Deep Learning and Uncertain Programming" Water 14, no. 5: 689. https://doi.org/10.3390/w14050689
Note that from the first issue of 2016, this journal uses article numbers instead of page numbers. See further details here.