Article

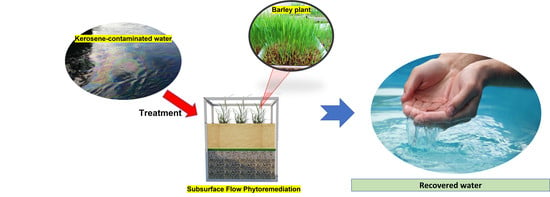
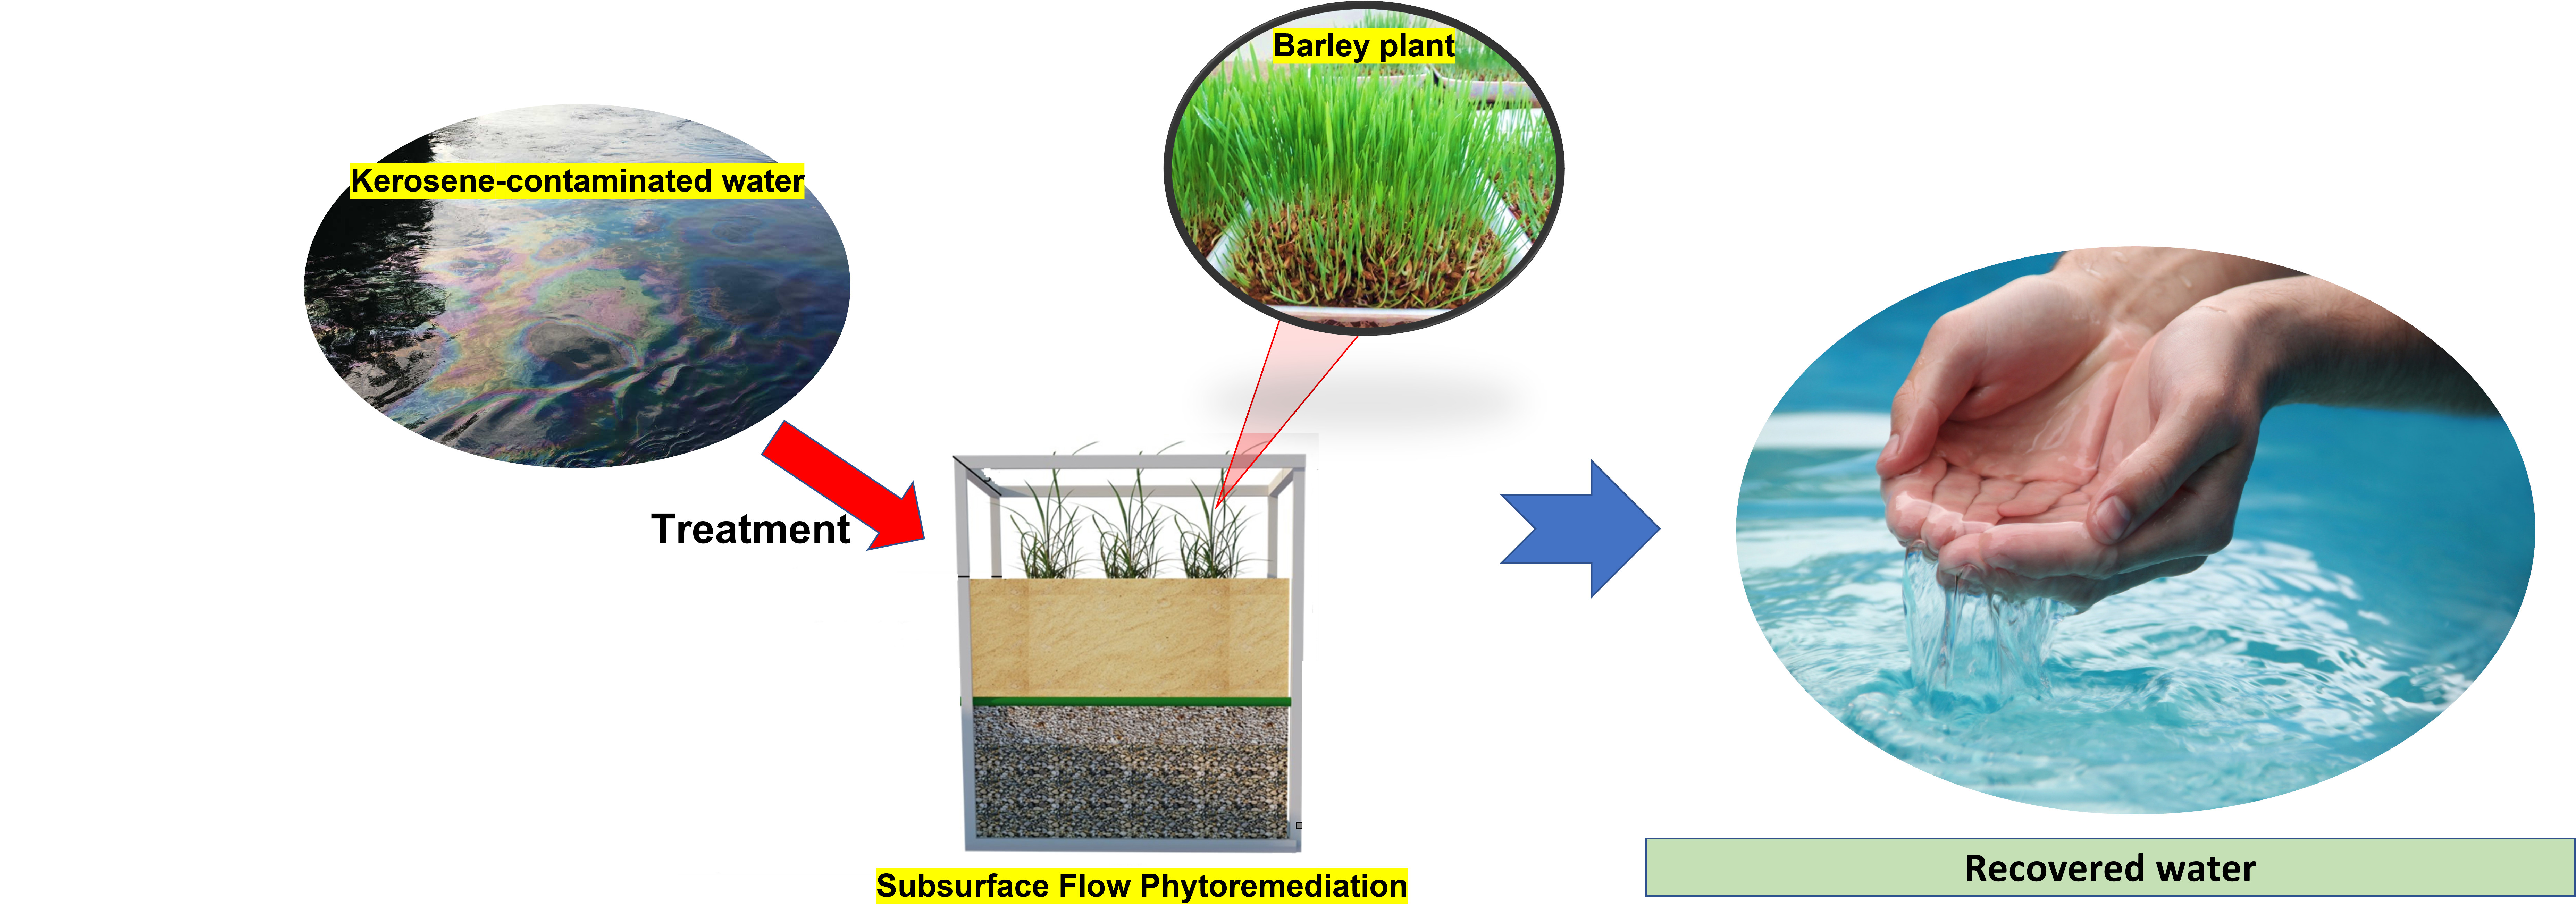
Subsurface Flow Phytoremediation Using Barley Plants for Water Recovery from Kerosene-Contaminated Water: Effect of Kerosene Concentration and Removal Kinetics

by
Mohanad J. M-Ridha
1,
Muna Faeq Ali
1,
Ahmed Hussein Taly
2,
Khalid M. Abed
3,4,
Sabah J. Mohammed
1,
Mohd Hafizuddin Muhamad
5,6 and
Hassimi Abu Hasan
5,6,*
1
Environmental Engineering Department, College of Engineering, University of Baghdad, Baghdad 10071, Iraq
2
College of Agriculture, University of Baghdad, Baghdad 10071, Iraq
3
Chemical Engineering Department, College of Engineering, University of Baghdad, Baghdad 10071, Iraq
4
Department of Chemical Engineering, Faculty of Engineering, University of Malaya, Kuala Lumpur 50603, Selangor, Malaysia
5
Department of Chemical and Process Engineering, Faculty of Engineering and Built Environment, Universiti Kebangsaan Malaysia, Bangi 43600, Selangor, Malaysia
6
Research Centre for Sustainable Process Technology (CESPRO), Faculty of Engineering and Built Environment, Universiti Kebangsaan Malaysia, Bangi 43600, Selangor, Malaysia
*
Author to whom correspondence should be addressed.
Water 2022, 14(5), 687; https://doi.org/10.3390/w14050687
Submission received: 27 December 2021 / Revised: 4 February 2022 / Accepted: 15 February 2022 / Published: 22 February 2022
(This article belongs to the Section Wastewater Treatment and Reuse)

Abstract

:
A phytoremediation experiment was carried out with kerosene as a model for total petroleum hydrocarbons. A constructed wetland of barley was exposed to kerosene pollutants at varying concentrations (1, 2, and 3% v/v) in a subsurface flow (SSF) system. After a period of 42 days of exposure, it was found that the average ability to eliminate kerosene ranged from 56.5% to 61.2%, with the highest removal obtained at a kerosene concentration of 1% v/v. The analysis of kerosene at varying initial concentrations allowed the kinetics of kerosene to be fitted with the Grau model, which was closer than that with the zero order, first order, or second order kinetic models. The experimental study showed that the barley plant designed in a subsurface flow phytoremediation system would have great potential for the reclamation of kerosene-contaminated water.

Graphical Abstract

1. Introduction

The most common causes of petroleum component exposure to the environment are accidental spills such as leakage from containers, pipes, joints, and land disposal of petroleum waste. In addition, the extraction, transportation, and refining of crude oil cause a great deal of pollution in the environment [1]. These contaminants are highly persistent in nature and hardly soluble in water. When exposed to soil, deterioration of soil could happen because of their toxicity, reduction of oxygen tension, and development of the anaerobic area, which is harmful to plant roots [2].
Upon reaching the soil surface, petroleum hydrocarbons (PHCs) degrade very slowly and eventually accumulate in the upper soil layer, thus creating an anaerobic environment and causing soil phytotoxicity. This phenomenon has attracted the attention of researchers to provide novel studies. To date, abundant studies of PHCs involving crude oil [2], diesel fuel, and mineral oil can be found. However, to our knowledge, kerosene, which is a typical petroleum product, was left aside, although Sharonova and Breus [3] reported that kerosene was 1.3 to 1.6 times more phytotoxic than diesel fuel and 1.3 to 1.4 times more toxic than crude oil.
To treat PHC’s exposure to soil and water, various physical and chemical methods such as advanced oxidation processes as ozonation (O3/H2O2), photocatalysis (UV/TiO2), photo-Fenton, coagulation/flocculation, filtration, chemical precipitation, and evaporation have been studied to curb these problems, but they are not environmentally friendly, not easy to implement, and usually high in cost, especially when the PHC concentration is very high (above 100 mg/L) [2,4,5,6]. Contamination treatment using biological methods is a safer option for environment, lower in cost, and causes no secondary pollution, especially in soil remediation [7,8]. Among the biological methods that can be applied are microbial remediation, plant-microbial remediation, and phytoremediation [9].
In comparison with the traditional physico-chemical methods for various reclaiming treatment methods, phytoremediation is considered the most economical and low-effort technique [10,11]. The implementation of potential biotechnologies such as phytodegradation and phytoextraction has resulted in significant progress in this sector [12]. Heavily contaminated industrial sites could be recovered using phytoremediation techniques [13]. Al-Baldawi et al., Abdullah et al. and Almansoory et al. [14,15,16] have successfully reported phytoremediation processes tested with total petroleum hydrocarbon (TPH) waste.
In the phytoremediation process, plants are one of the important components that affect the removal efficiency of contaminants such as PHCs. As a key biological component in this process, microphytes play a role in depuration reactions by optimizing various processes of removal and direct uptake of contaminants. According to Cheng et al. [17], rhizodegradation carried out by plant roots together with bacteria in the rhizosphere, such as rhizobacteria, is one of the major mechanisms contributing to the removal of PHCs during the phytoremediation process. Plant roots could transform PHCs into less toxic compounds and prevent the allelochemicals through oxidation through the use of enzymes [18]. Many studies have also reported the ability of most bacteria in the rhizosphere to use PHCs as a source of carbon and energy [17,19]. The unique interactions that exist between plant roots and rhizospheric bacteria not only ensure the prompt growth of plants and soil microbes, but also provide a suitable environment for PHC degradation [20]. In the case of the barley plant, several authors have demonstrated the important contribution of this macrophyte in the removal and uptake of organic compounds [21] and heavy metals [22,23].
Barley plants (Hordeum vulgare) that can be found abundantly in the arid and semi-arid regions of North Africa, the Middle East, and the Andean countries [24] have a unique root system architecture. Barley plants have been known to develop two types of roots, seminal and adventitious roots, which affect water and solute transport [25] and are adaptable in a wide range of environmental conditions with stress [24], making them a suitable candidate to be used in phytoremediation of kerosene.
The objective of this paper was to investigate the phytoremediation of kerosene-contaminated water at various concentrations (1–3%) using barley plants. To the best of our knowledge, phytoremediation using barley plants in treating kerosene-contaminated water is novel and unique since there is little information on this particular study. A preliminary test was conducted prior to the phytoremediation study to determine the maximum inhibition concentration by increasing the kerosene concentration. Phytoremediation was conducted in a glass aquarium for 42 days. The growth responses, such as wet and dry weight, and root and stem lengths, were monitored within the exposure period. The water and sand samples were collected at a periodical time for the analysis of kerosene (represented as TPH) and physical parameters. In addition, the TPH translocated to barley plants was also determined through the extraction method.

2. Materials and Methods

2.1. Preliminary Test

The selected barley plants used in this study were of equal number and size in each test pail. Barley was planted in 1.62 kg of fine sand with 0.5 L of synthetic wastewater in each pail. Synthetic wastewater was prepared by mixing water with kerosene at different concentrations (5–20%). Another pail without kerosene acted as a control. The plants were classified by physical observation as healthy, withered, yellow, or dead after exposure to kerosene.

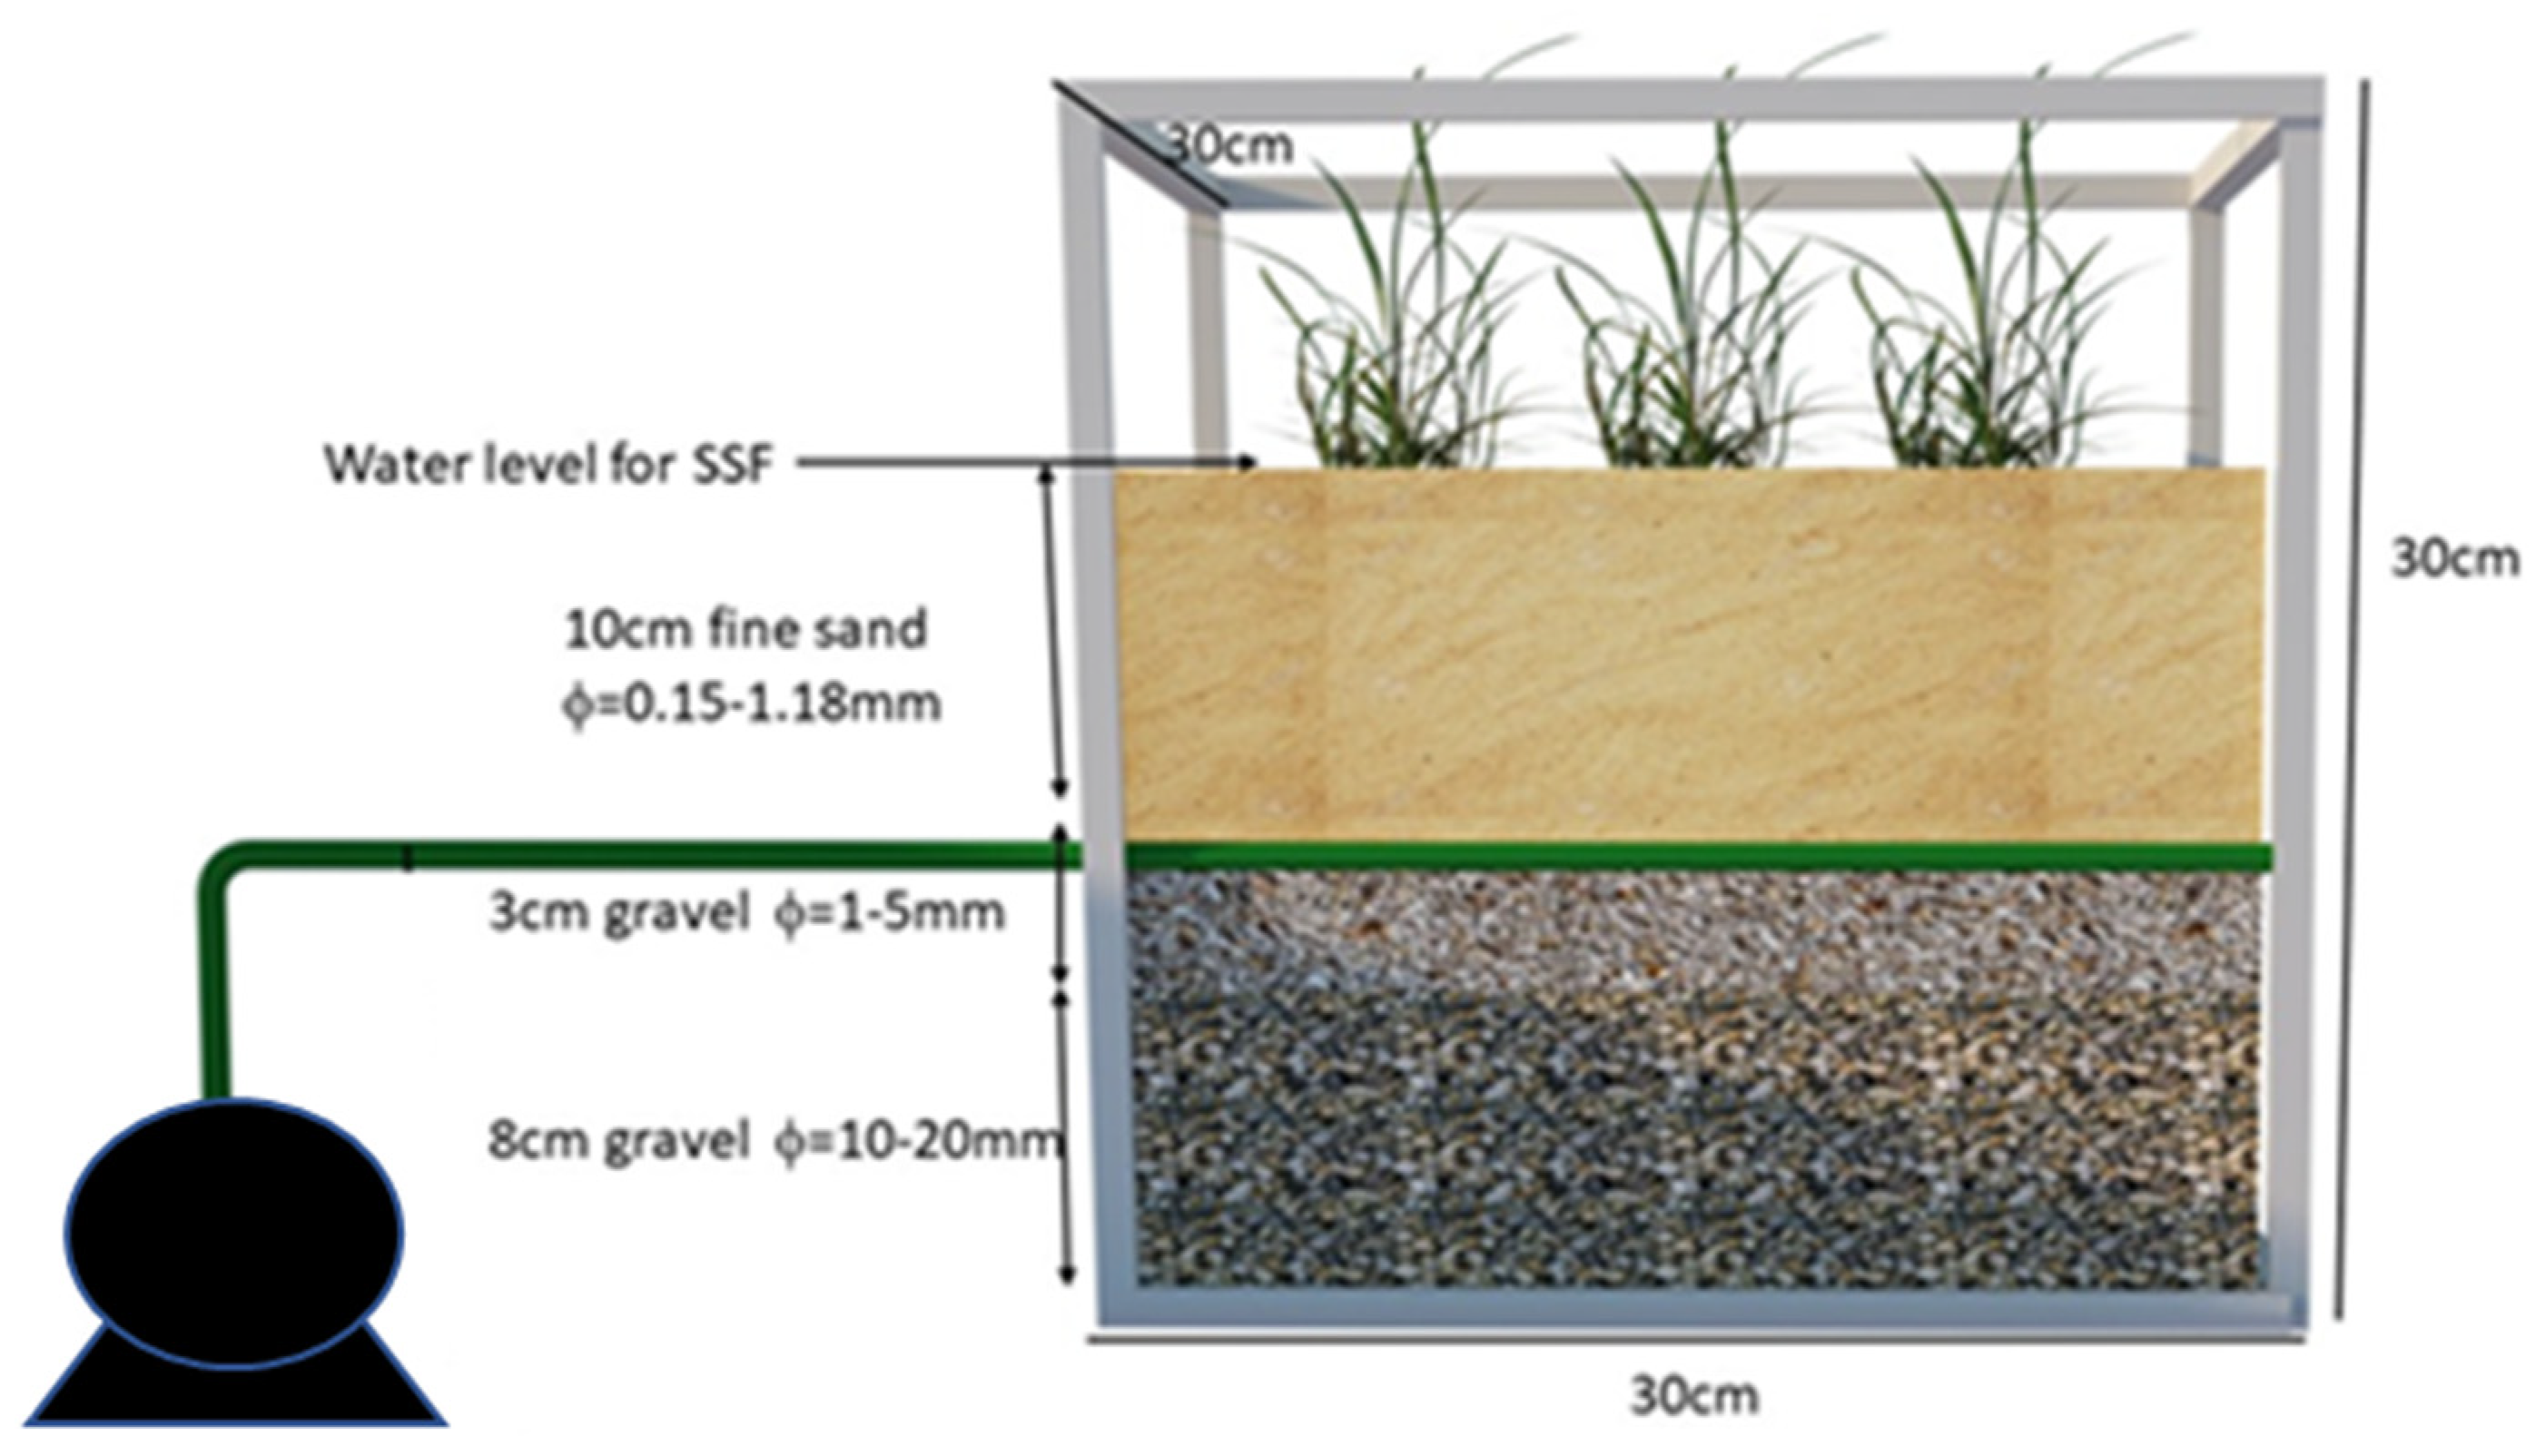
2.2. Setup of the Phytoremediation Experimental Test Procedure

The outdoor conditions were taken into consideration during the experimental work of phytoremediation. This work included seven glass aquariums to minimize the possibility of kerosene sticking to the walls. The experimental setup is shown in Figure 1. The aquariums were managed batch-wise in a single exposure, and every aquarium had the same dimensions of 30 cm × 30 cm × 30 cm and was filled with layers from the bottom to top; first, with an 80-mm layer of gravel with a grain size of 10–20 mm; second, with a 30-mm layer of gravel with a grain size of 1–5 mm; and finally, with a 100-mm layer of sieved, fine sand with a grain size of 0.15–1.18 mm. The aquariums were each filled with the following differing contents: one aquarium with the reference contaminant without any plants, and the other aquariums were filled with differing concentrations of contaminant together with the plants in each aquarium, except for one aquarium as a plant reference without the kerosene contaminant. The planting procedure was carried out in each aquarium with 6 L of synthetic wastewater, adjusted by mixing normal kerosene at various concentrations of 0, 1, 2, and 3% with water (VKerosene/VWater), which was obtained from the Al-Dora petrol station located in Baghdad city. The sand layer surface was used to maintain the water level to act as a subsurface flow system, as commonly applied in built-up wetlands (USEPA, 2000) [26]. In this study, observations were carried out throughout the 42 days, and the sampling times were on days 0, 7, 14, 21, 28, 35, and 42. The analysed parameters were the concentration of kerosene in the water and sand medium. The physical parameters of vegetation including dry and wet weights, root length, and stem height were also recorded.

2.3. The Measurement of Water Physicochemical Properties

The total experimental activity was carried out over 42 days of exposure, while sample performance was gathered on days 0, 7, 14, 21, 28, 35, and 42. The oxidation-reduction potential (ORP, mV), temperature (T, °C), and pH were recorded on an IQ150 multiprobe (IQ Scientific Instruments, California, USA).

2.4. Water Sampling

Clean containers were used to periodically gather the water samples (100 mL each) from the growth medium on the sampling days of each aquarium for all treatments to evaluate kerosene contamination. Following the Environmental Protection Agency Method 3510C (USEPA, 2011) [27], gas chromatography and liquid-liquid extraction methods were used to measure the kerosene concentration in the synthetic wastewater [28]. Twenty-five millilitres of dichloromethane were used as a solvent and was added to a 1 L separator funnel that contained a 100 mL sample of wastewater, which was then shaken for 2 min. Sodium sulfate was then used to dry the lower organic layer that was isolated from the bottom of the flask. The evaporation of the remaining water occurred over 3 to 4 days by putting the residuals in a 10 mL vial inside an overhead fume hood.

2.5. Sand Sampling

The percentage of kerosene absorption by the sand samples was calculated at the Ministry of Science and Technology, and the sand was extracted following the Environmental Protection Agency Method 3550C (USEPA, 2007) [29]. Ten grams of sand from each aquarium were collected and placed in clean containers on the sampling days to analyse the sand and obtain kerosene for all treatments. The ultrasonic method, according to Liu et al. [30], was implemented to detect kerosene using a solvent extraction method. First, the sand samples were dried by mixing them with sodium sulfate (Na2SO4). Second, 50 mL of dichloromethane in a 100 mL Schott bottle was used as the solvent. Subsequently, an ultrasonic cleaner was used to keep the Schott bottle for 30 min at a temperature of 50 °C (Kwun Wah International Ltd., Shenzhen, China). Finally, glass wool was used to filter the samples to evaporate any of the remaining dichloromethane and water, and the extracted solution was drained into a 15 mL vial and kept in a fume hood for 3–4 days.

2.6. Plant Growth

The growth of barley exposed to the various kerosene concentrations (0, 1, 2, and 3%, (% v/v)) was measured over 42 days on the respective sampling days (days 0, 7, 14, 21, 28, 35, and 42). On each of these sampling days, a single plant was collected from each of four aquariums (there were three aquariums for each of the kerosene concentrations (1, 2, and 3%, (% v/v)) and from another aquarium without the kerosene pollutant that acted as a plant control. To observe the root length, stem height, and wet weight, tap water was used to rinse each plant, and then normal tissue was used to absorb the remaining water. A constant weight was achieved by drying the plant samples in an oven at 70–72 °C to calculate the dry weight [31,32].

2.7. Analysis and Removal Percentage of Kerosene

Sand extracts were concentrated to 2 mL in GC vials and analysed by GC-FID utilizing capillary-column gas chromatography (Agilent Technologies, Model 7890A, GC System, Santa Clara, CA, USA) with an HP-5.5% phenyl methyl siloxane column (30 m × 0.32 mm i.d. × 0.25 microns) and helium as the carrier gas. The column temperature was kept at 50 °C for 1 min and then ramped up by 15 °C per min until 320 °C was reached for 10 min. The percentage of kerosene removal represented as TPH removal from each sampling day was calculated according to the following equation:
%   R e m o v a l = ( T P H 0 T P H t ) T P H 0 × 100
where TPH0 = total petroleum hydrocarbon on sampling day 0 and TPHt = total petroleum hydrocarbon on each sampling day.

3. Results and Discussion

3.1. Preliminary Test

According to the findings of the preliminary tests, it was clearly observed that the number of withered plants increased with an increase in the kerosene concentration. After two weeks of exposure of the barley to the kerosene, all the plants died at kerosene concentrations of 20%. The minimum percentage of withered plants was 0% at a 1% kerosene concentration, and 100% of the plants withered at a 20% kerosene concentration. Fifty percent of the withered plants were observed at a kerosene concentration of 4.45% after two weeks, as shown in Figure S1. Therefore, the concentration of kerosene should not exceed 4.45% in the phytoremediation test at the next stage of the phytoremediation process because 50% of the plants withered at this concentration, which is, therefore, too high for this species of plant.

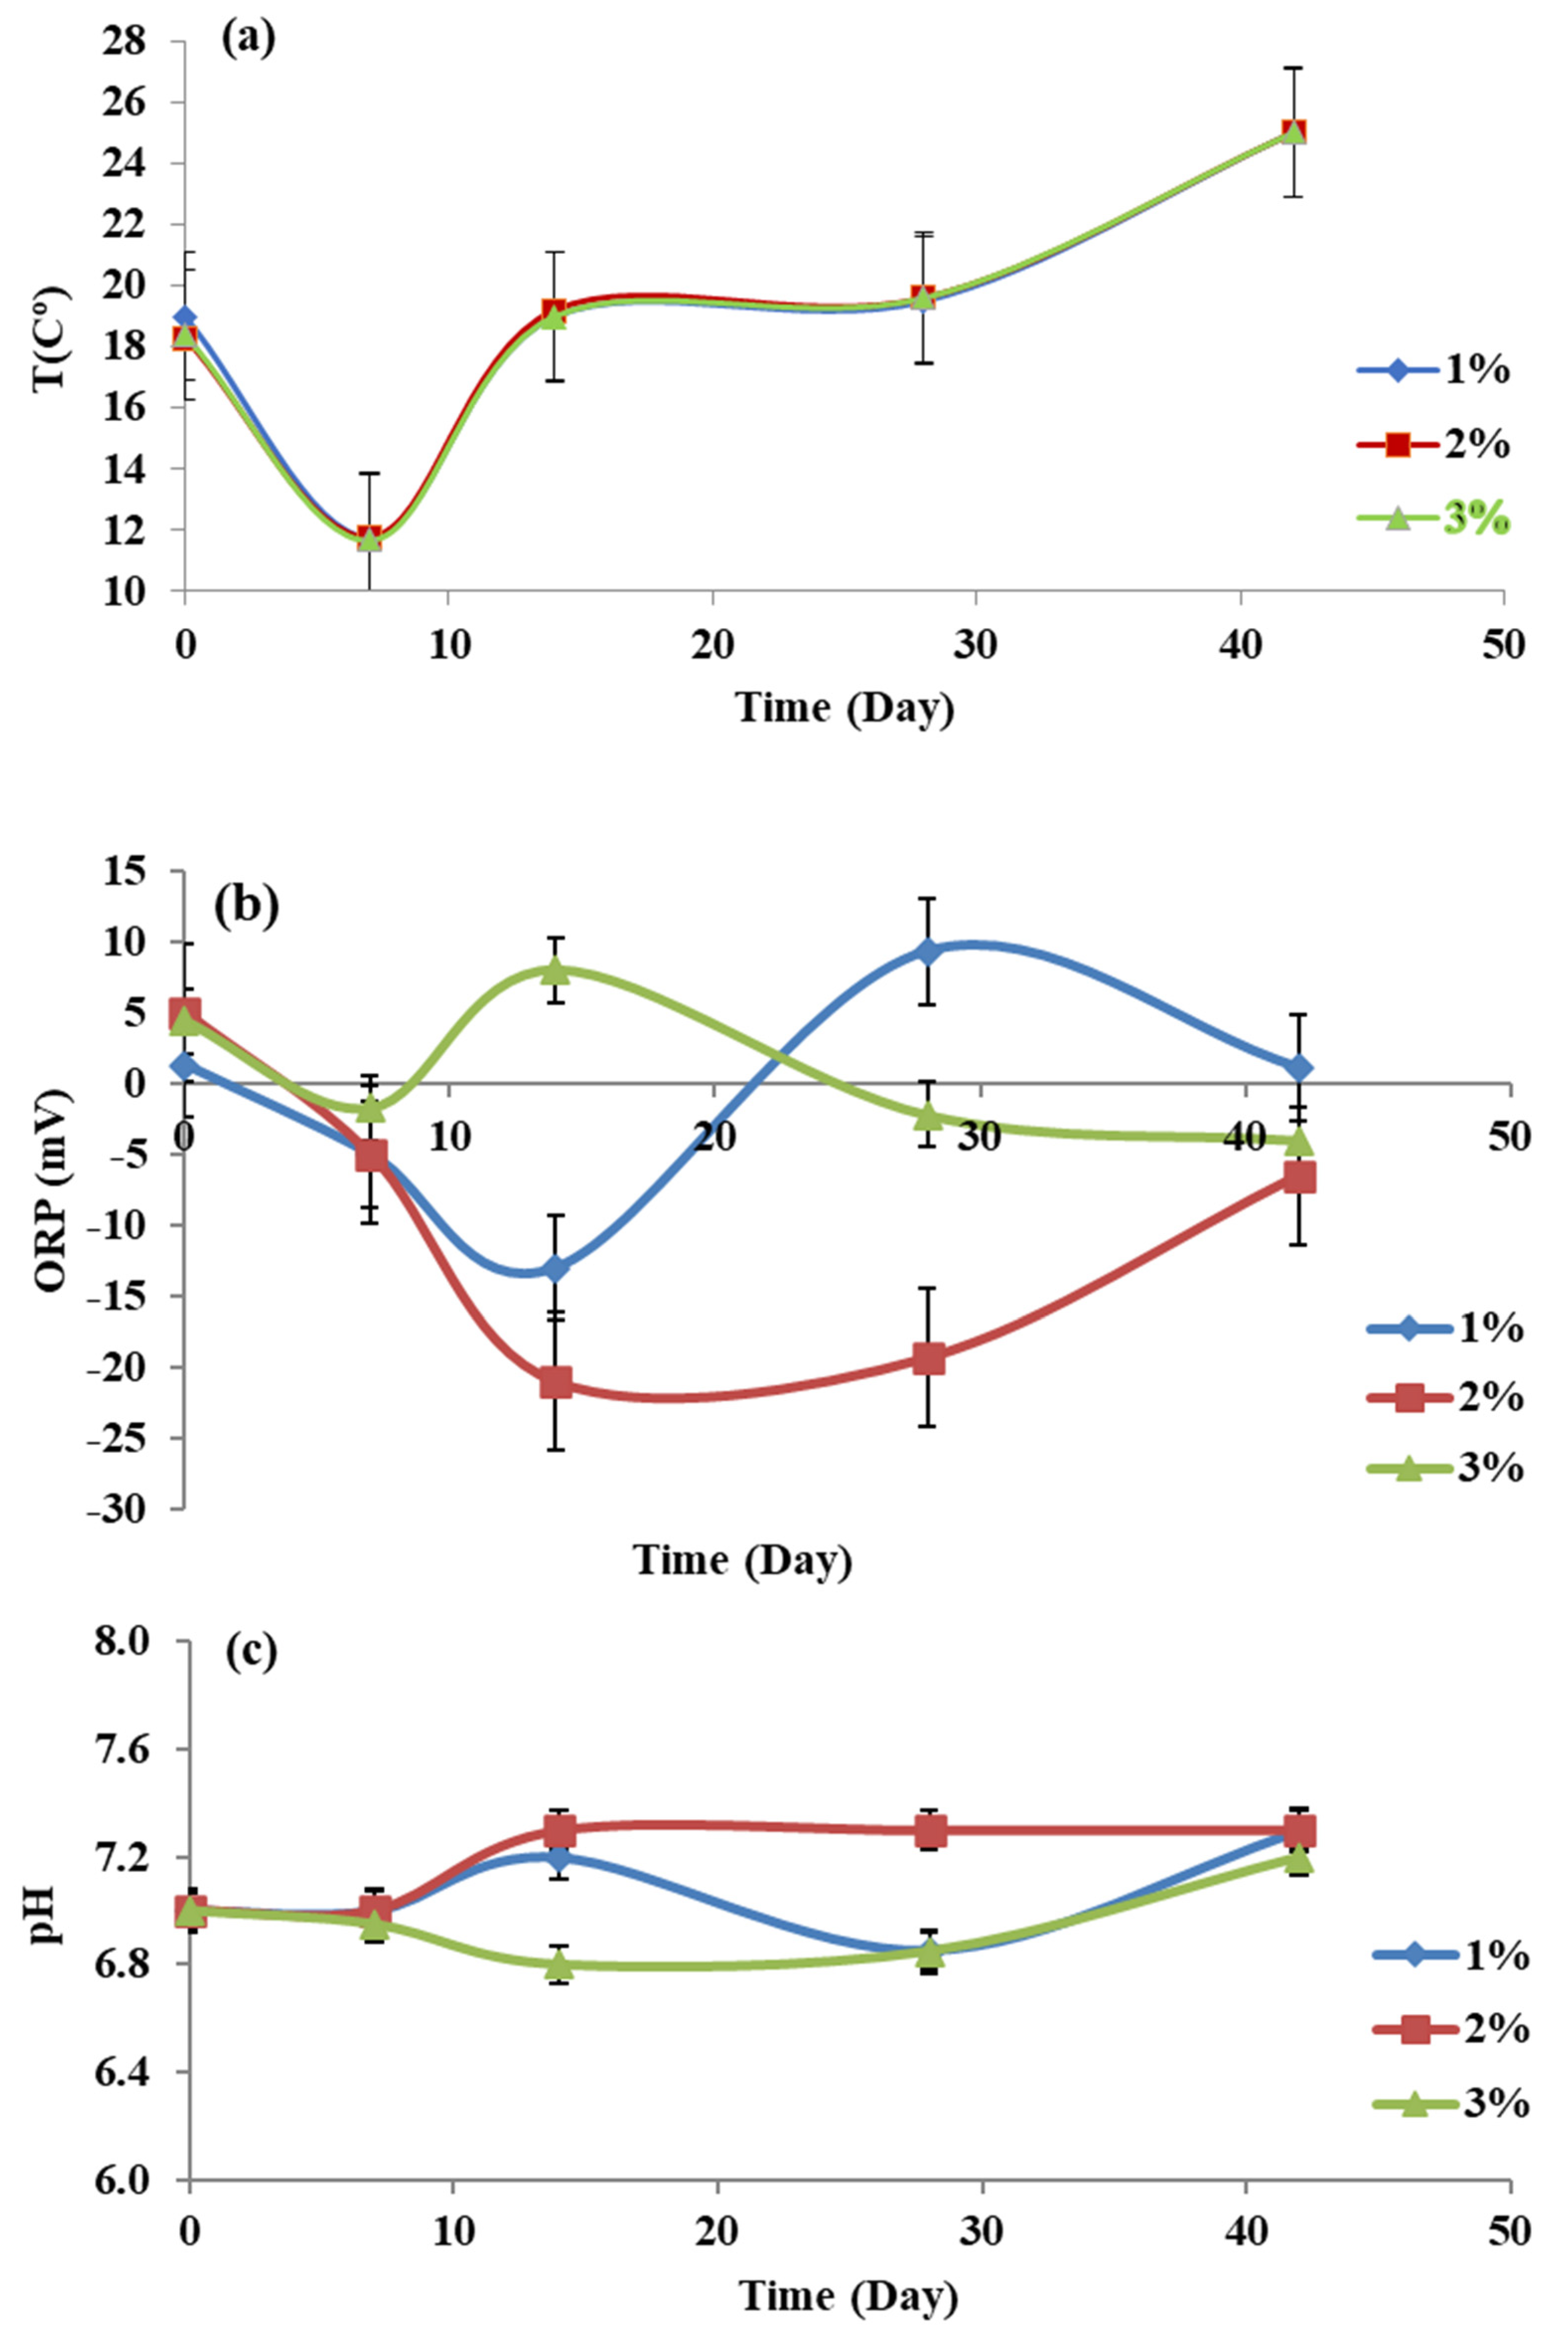
3.2. Monitoring of Physicochemical Parameters

The phytoremediation test was used to record the physical parameter variations in temperature, pH, and ORP (as described in Figure 2) at kerosene concentrations of 10,000, 20,000 and 30,000 mg/L for all the treatment variations used in our experiment tests, both with and without plants. The findings showed that the temperature mean values varied between 11 and 25 °C over the 42-day period [33]. The pH value is an essential aspect of water quality conditions, exerting a huge effect on aquatic systems. The average pH value that was measured for all the aquariums ranged from 6.8 to 7.3, which indicates that the pH did not change significantly among the treatments [34]. Dissolved oxygen (DO) and ORP measurements can be used to distinguish whether the conditions during the phytoremediation test were aerobic or anaerobic [35]. The research findings demonstrated that the treatment environment was aerobic. ORP oscillated between −21 and +10 mV, and kerosene influenced the rhizosphere treatment environment and caused a decrease in the ORP measurements, suggesting that the environment became more anaerobic with increased concentrations of kerosene.

3.3. Degradation and Removal of Kerosene from Water

Synthetic wastewater of various kerosene concentrations (1, 2, and 3%) was extracted to calculate the kerosene degradation ratio effect of barley with the corresponding reference contaminant with and without plants throughout the 42-day treatment period; the findings were under the detection limit.

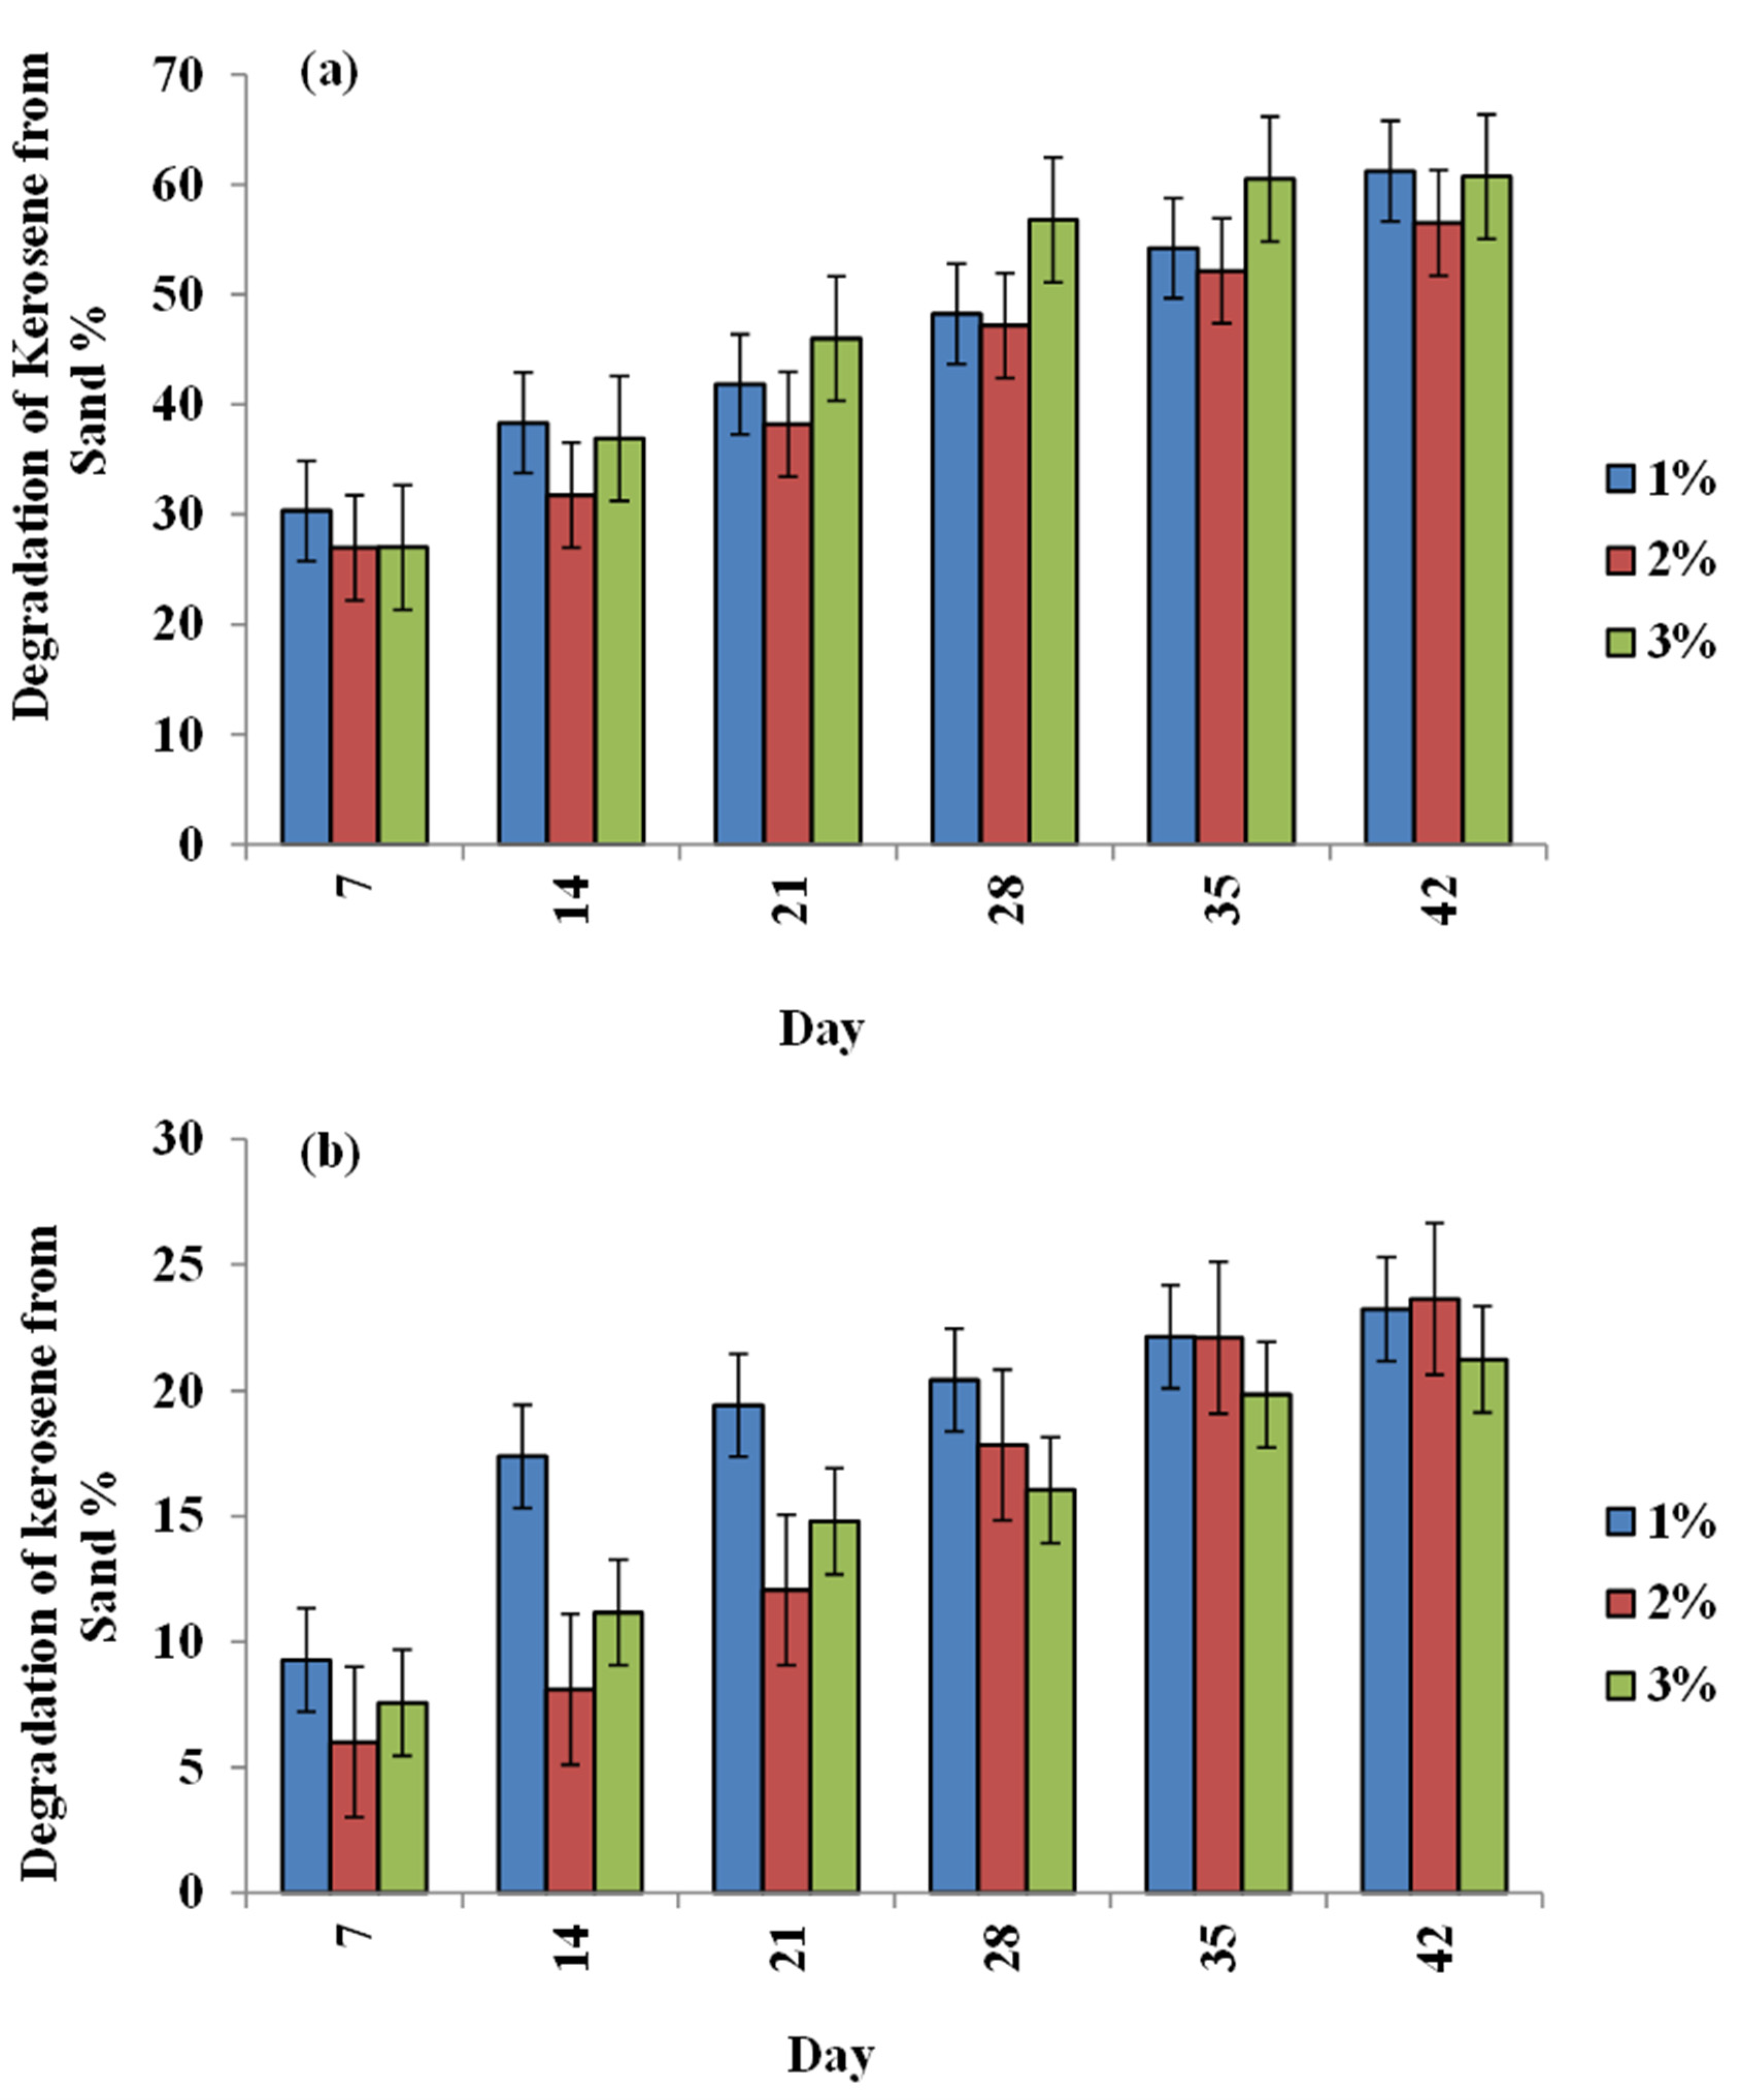
3.4. Removal of Kerosene in Sand

The sand extraction procedure was performed to obtain further information in the case of kerosene degradation in the sub-strata. Figure 3 shows three different kerosene concentration treatments of 1, 2, and 3% used both with and without plants that were observed over 42 days, while Figure S2 shows the GC chromatogram for kerosene concentrations in sand and plants. The elimination ability of kerosene pollutants in most treatments was highly divergent between the sample selection dates and the concentrations. The highest kerosene removal in sand of 61.2% occurred at a kerosene concentration of 1% when the duration of the treatment was completed, whereas the removal was only 23.2% in its respective control treatment. Correspondingly, the removal percentages with kerosene concentrations of 2 and 3% were 56.5 and 60.7%, respectively. However, the removals were 23.6 and 21.3%, in the respective control treatments. These findings, taken together, illustrate the capability of barley plants to survive at these three kerosene concentrations and to increase the removal of kerosene in a subsurface flow system. The hydrocarbons were metabolized as a result of the interaction between the rhizobacteria and the plants, while in the unplanted sand, kerosene was degraded by volatilization, eluviation, photolysis, and volatilization. According to Shirdam et al. [36], sorghum plants removed TPH levels in contaminated soil by 23.63 and 45.97%, respectively, compared to the reference treatment.

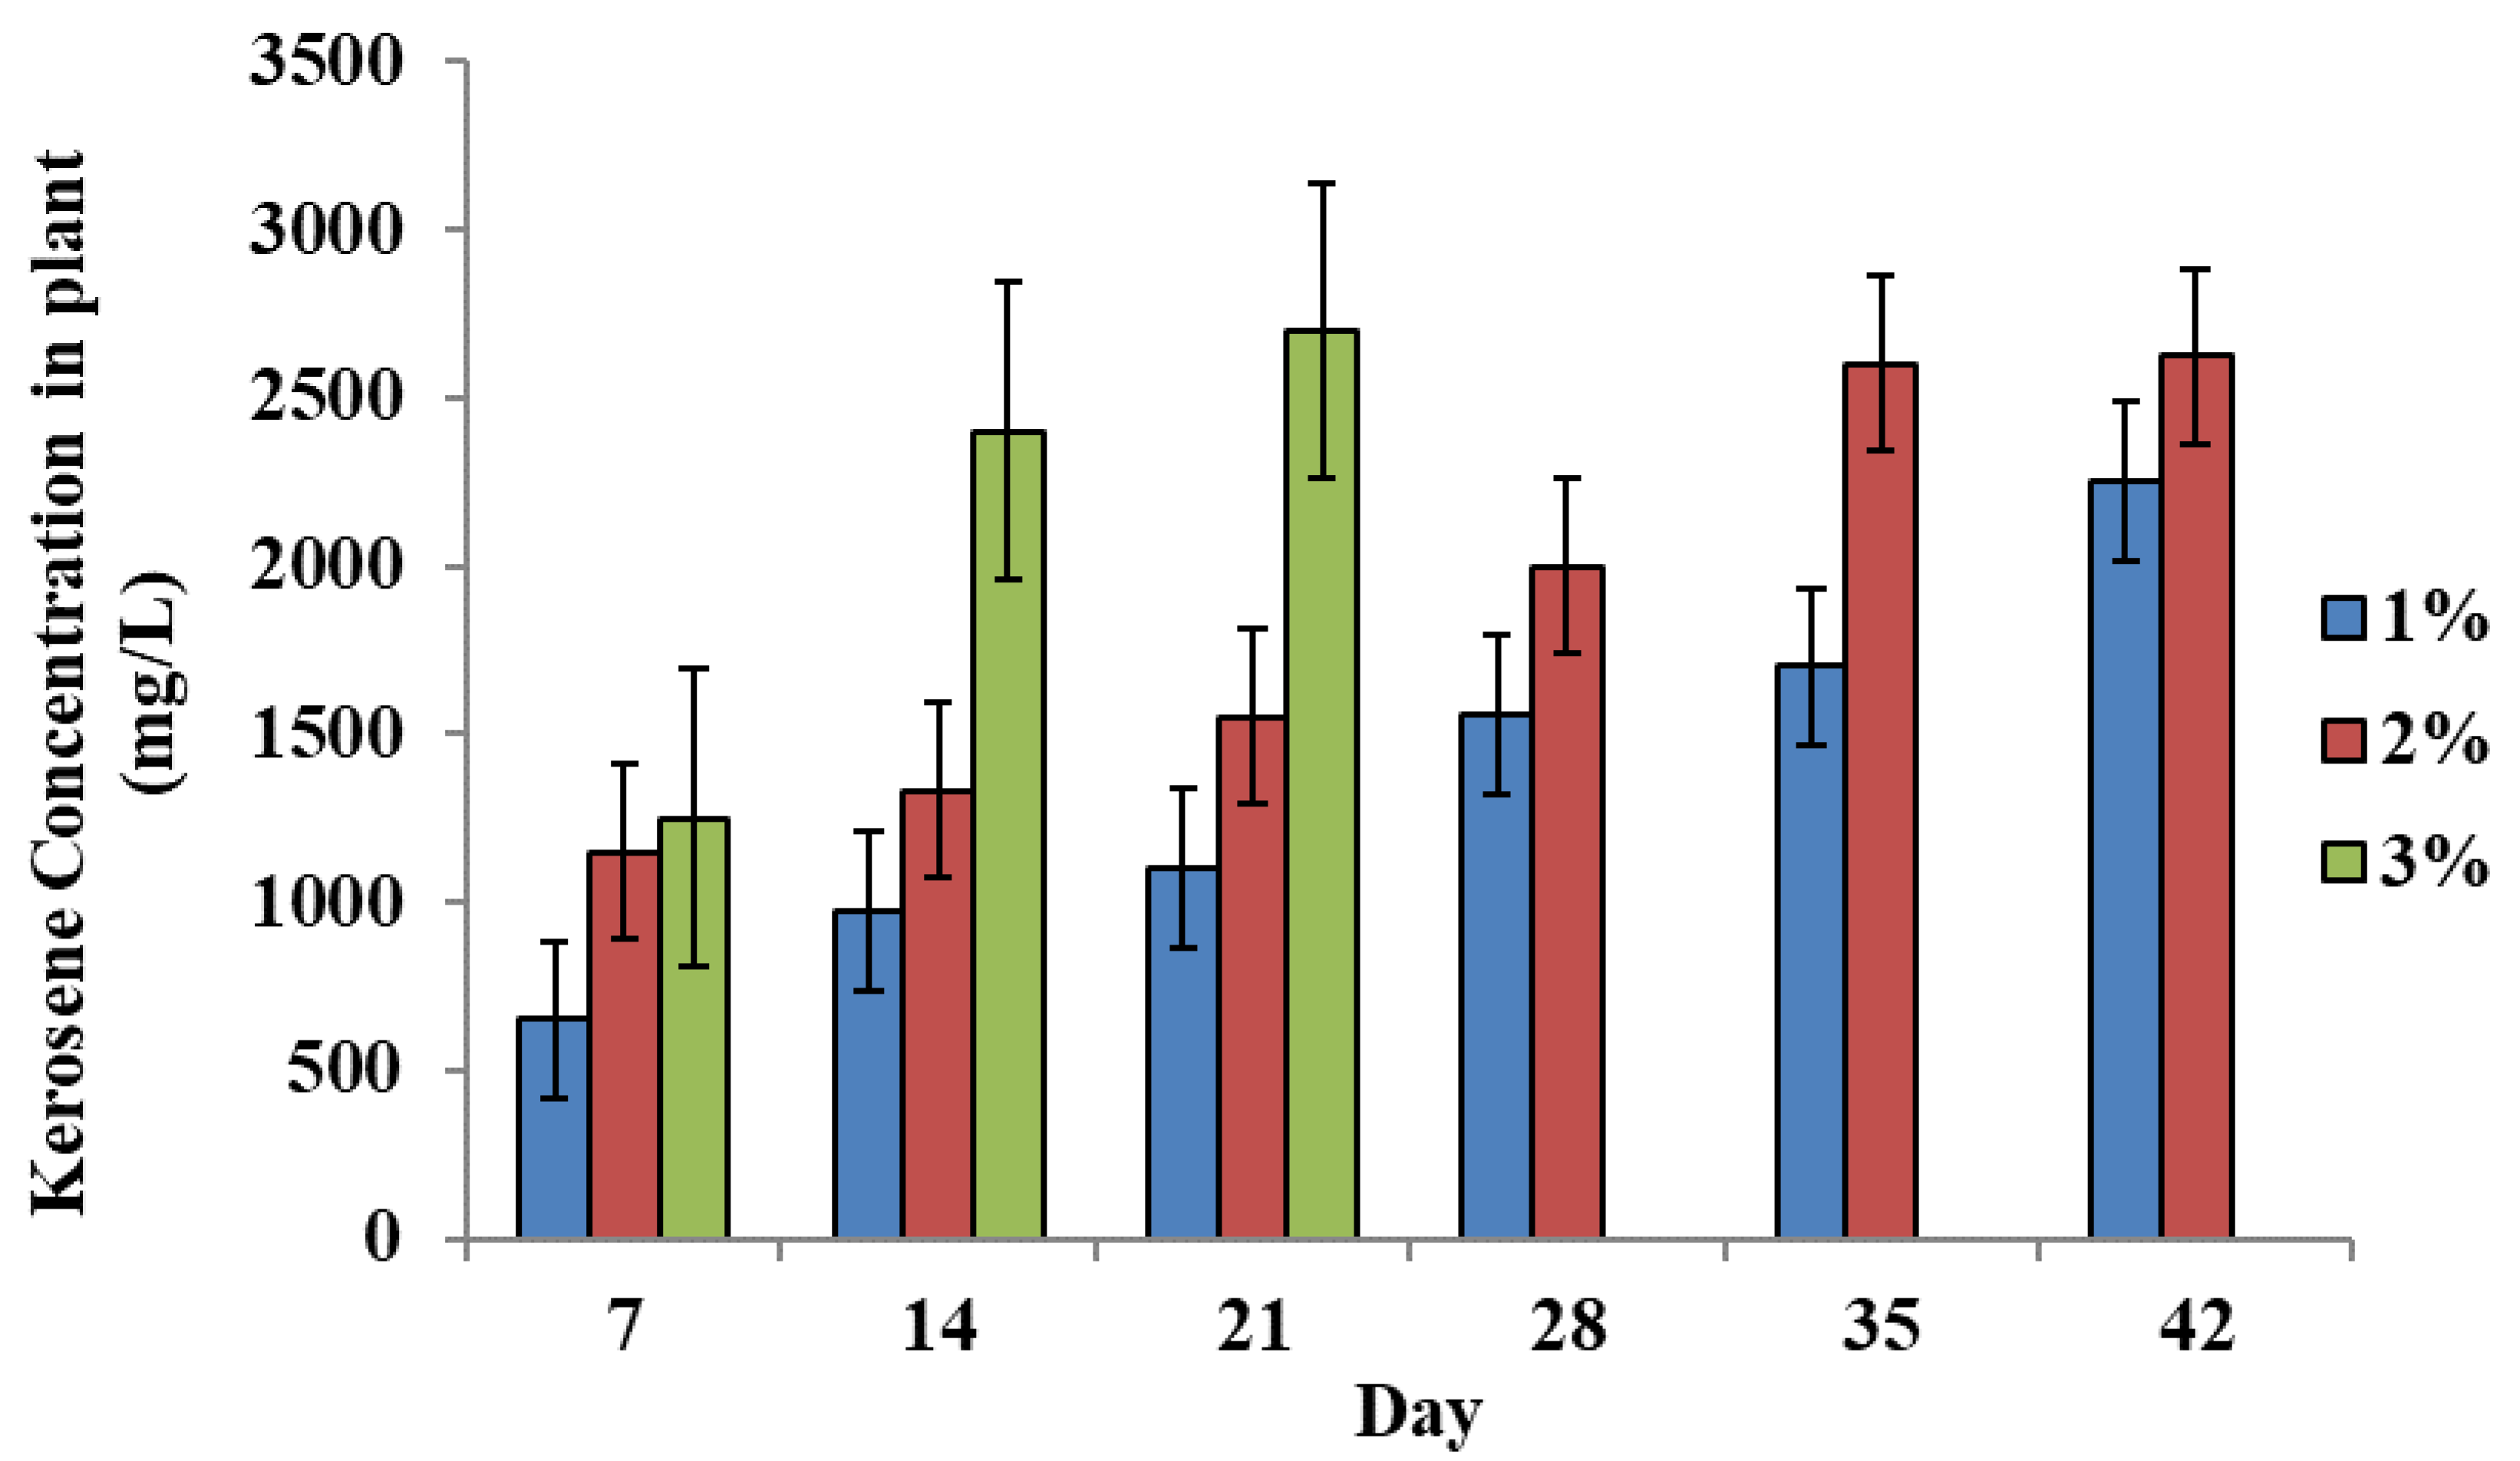
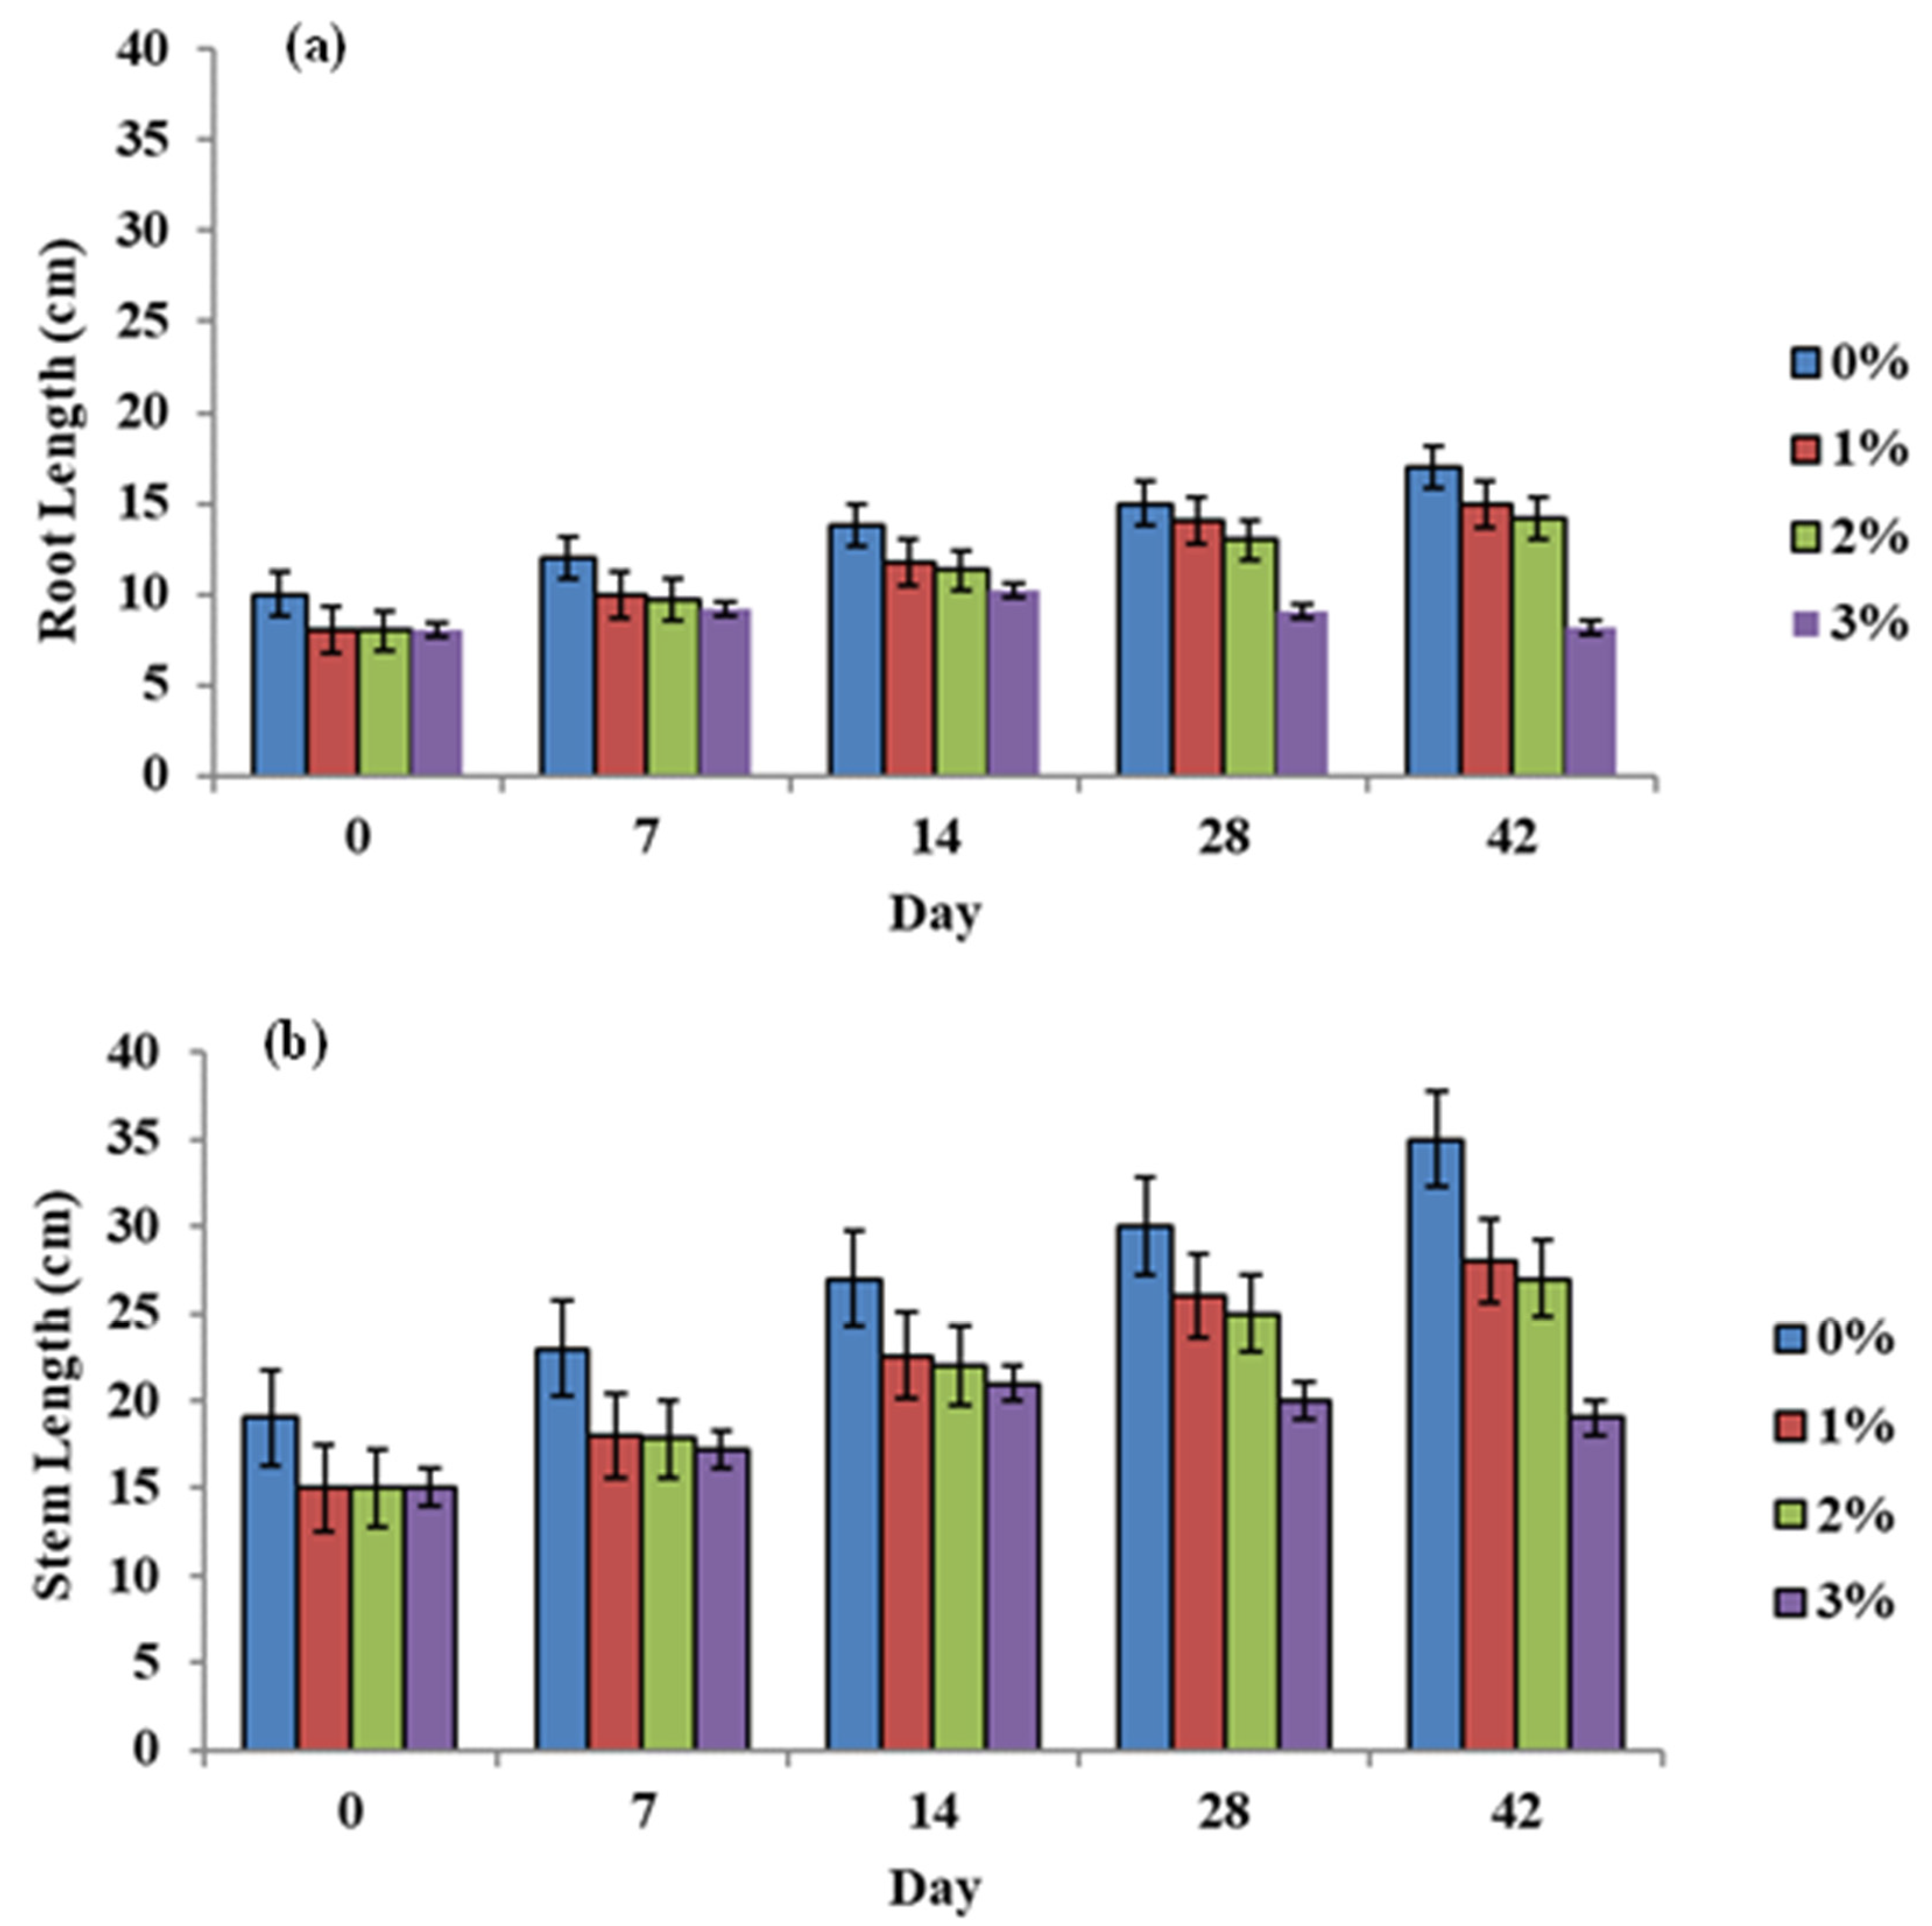
3.5. Plant Behaviour to the Kerosene Contaminant

Over the 42-day period of observing the progress of the plants exposed to the kerosene contaminant compared with plants growing in the corresponding reference (barley without the contaminant), it was noted that few of the plants grown in sand irrigated with kerosene-contaminated water presented a clear change in appearance, as shown in Figure 4. Usually, after 7 days of exposure to kerosene concentrations of 1, 2, and 3%, the growth of the plants increased. It was observed that the plants still survived at kerosene concentrations of 1 and 2%. After 21 days at a kerosene concentration of 3%, the growth of the plants decreased slightly in comparison to the plants in the sand without kerosene. No plant death was observed with kerosene concentrations of 1 and 2%, which means that the degree of plant adaptation increased in the sand contaminated with kerosene at these concentrations. At a kerosene concentration of 3%, the growth of the barley was affected, which means that there was an inhibition of plant growth.
A few of the plants showed several signs of phytotoxicity at this concentration, such as impaired growth, yellowing leaves, and plants dying in comparison with the corresponding reference in all conditions. These signs are approximately compatible with the findings of Barati et al. and Shirdam et al. [33,36]. The roots of the barley were able to uptake kerosene up to 2250 and 2625 mg/L at kerosene concentrations of 1 and 2%, respectively, after 42 days. However, at a kerosene concentration of 3%, the barley was able to uptake up to 2700 mg/L of kerosene after 21 days. For 1 and 2% kerosene concentrations, the wet and dry biomass increased with time, as shown in Figure 5, but for the 3% kerosene concentration after 21 days, the wet and dry biomass decreased. As reported by Aisabadi et al. [34], the comparison in terms of root and shoot dry weight between the contaminated and control treatments revealed approximately 22 and 30% root dry matter, and 51 and 42% shoot dry matter of sorghum and barley in contaminated soil, respectively.
Figure 6 shows the trend of an increase in stem and root length throughout the 42 days of kerosene exposure for 1 and 2% kerosene concentrations, but for the 3% kerosene concentration after 21 days, the stem and root length decreased. For all treatments, the increases in stem length and root length were similar to those of the control plants without contaminants. The largest root and shoot dry biomass, in addition to the long root length, were gained in the uncontaminated treatment. Merkl et al. [37] additionally observed an important shoot length decrease in the presence of 3 and 5% crude oil. Liste and Felgentreu [38] mentioned that a shoot biomass decrease of 38.9% was observed for rye grass cultivated in contaminated soil during a 95-day period, and root biomass further decreased by 52.6% in their research. The toxic composition of petroleum hydrocarbons can cause inhibition of plant growth, specifically low molecular weight hydrocarbons [36,37,39]. The best findings show the trend of increases in stem and root length, and in dry and wet biomass during the 42 days of kerosene exposure at a 1% kerosene concentration.

3.6. Kinetics of Removal

Kinetics are a key factor in understanding the removal process, measuring the rate of bioremediation, and developing an efficient clean-up method for contaminated environments. The kinetics of removal are a set of empirically derived rate laws. The three rate laws that suffice to describe most biological reactions are listed in Table 1, where C i is the influent contaminant concentration (mg/L), C is the effluent contaminant concentration (mg/L), a = C k 2 X (X) is the biomass concentration in the reactor, k2 is the second-order contaminant removal rate constant (per day), b is a constant greater than unity, and k is the rate constant (1/day) [40].
The removal data were described using zero order, first order, second order and Grau kinetic models. The final concentration to initial concentration of the kerosene in the sand was also plotted against time, as shown in the figure, to analyse the kinetics of the removal processes. The kinetics of kerosene removal with and without plants were plotted using the kinetic models (Table 1), and the results are shown in Figure 7, respectively. The data obtained separately for each of the kinetic models from the slopes of the plots show good agreement with the Grau kinetic model compared with the other models. All constants resulting from fitting with R2 and SSE are shown in Table 2. The cited figures and tables reveal that there is a satisfactory match between the experimental results and the model predictions, as is clear from the values of the SSE in combination with R2.

4. Conclusions

In this study of phytoremediation testing, barley plants were examined. The barley survived and contributed to excellent conditions for the rhizobacteria to degrade kerosene at concentrations of 1, 2, and 3% (% v/v). This caused plant inhibition because the kerosene was attached to the plant tissues and roots. The highest kerosene result of 61.2% was obtained at a kerosene concentration of 1%. The analysis of kerosene at varying initial concentrations of 1, 2, and 3% allowed the kinetics of kerosene to be better fitted with the Grau model than with the zero order, first order, or second order kinetic models, as shown by a high R2 of 0.99.

Supplementary Materials

The following supporting information can be downloaded at: https://www.mdpi.com/article/10.3390/w14050687/s1, Figure S1: Percentage of withered Barley in relation to kerosene concentrations; Figure S2: GC chromatograms at different concentration of kerosene.

Author Contributions

Conceptualization, M.J.M.-R. and M.F.A.; methodology, M.J.M.-R. and M.F.A.; software, M.F.A.; validation, M.J.M.-R., M.F.A. and H.A.H.; formal analysis, M.F.A. and A.H.T.; investigation, M.J.M.-R. and M.F.A.; resources, M.J.M.-R. and H.A.H.; data curation, M.J.M.-R., S.J.M. and H.A.H.; writing—original draft preparation, M.F.A.; writing—review and editing, M.J.M.-R., M.H.M. and H.A.H.; visualization, M.F.A. and K.M.A.; supervision, M.J.M.-R. and H.A.H.; project administration, M.J.M.-R. and H.A.H.; funding acquisition, H.A.H. All authors have read and agreed to the published version of the manuscript.

Funding

This research was funded by the Universiti Kebangsaan Malaysia, grant number DIP-2021-008 and The APC was waived as the corresponding author is Water Editorial Board Member.

Acknowledgments

The authors would like to thank the Universiti Kebangsaan Malaysia for financial support under grant DIP-2021-008.

Conflicts of Interest

The authors declare no conflict of interest.

References

  1. Moubasher, H.; Hegazy, A.; Mohamed, N.; Moustafa, Y.; Kabiel, H.; Hamad, A. Phytoremediation of soils polluted with crude petroleum oil using Bassia scoparia and its associated rhizosphere microorganisms. Int. Biodeterior. Biodegrad. 2015, 98, 113–120. [Google Scholar] [CrossRef]
  2. Ghoreishi, G.; Alemzadeh, A.; Mojarrad, M.; Djavaheri, M. Bioremediation capability and characterization of bacteria isolated from petroleum contaminated soils in Iran. Sustain. Environ. Res. 2017, 27, 195–202. [Google Scholar] [CrossRef]
  3. Sharonova, N.; Breus, I. Tolerance of cultivated and wild plants of different taxonomy to soil contamination by kerosene. Sci. Total Environ. 2012, 424, 121–129. [Google Scholar] [CrossRef] [PubMed]
  4. Aziz, K.H.H.; Miessner, H.; Mueller, S.; Mahyar, A.; Kalass, D.; Moeller, D.; Khorshid, I.; Rashid, M.A.M. Comparative study on 2,4-dichlorophenoxyacetic acid and 2,4-dichlorophenol removal from aqueous solutions via ozonation, photocatalysis and non-thermal plasma using a planar falling film reactor. J. Hazard. Mater. 2018, 343, 107–115. [Google Scholar] [CrossRef] [PubMed]
  5. Haan, T.Y.; Fen, C.S.; Radzi, M.F.; Ganasen, U. Comparative study for lake water remediation: Chemical coagulation and electrocoagulation. J. Kej. SI 2018, 1, 81–87. [Google Scholar]
  6. Tursi, A.; De Vietro, N.; Beneduci, A.; Milella, A.; Chidichimo, F.; Fracassi, F. Low pressure plasma functionalized cellulose fiber for the remediation of petroleum hydrocarbons polluted water. J. Hazard. Mater. 2019, 373, 773–782. [Google Scholar] [CrossRef]
  7. Ali, H.; Khan, E.; Sajad, M.A. Phytoremediation of heavy metals—Concepts and applications. Chemosphere 2013, 91, 869–881. [Google Scholar] [CrossRef]
  8. Al-Haleem, A.A.; Abed, K.M. Treating of oil-based drill cuttings by earthworms. Res. J. Pharm. Biol. Chem. Sci. 2016, 7, 2088–2094. [Google Scholar]
  9. Zahed, M.A.; Salehi, S.; Madadi, R.; Hejabi, F. Biochar as a sustainable product for remediation of petroleum contaminated soil. Curr. Res. Green Sustain. Chem. 2021, 4, 100055. [Google Scholar] [CrossRef]
  10. Yusoff, M.F.M.; Abdullah, S.R.S.; Hasan, H.A. Performance of continuous pilot subsurface constructed wetland using Scirpus grossus for removal of COD, colour and suspended solid in recycled pulp and paper effluent. Environ. Technol. Innov. 2019, 13, 346–352. [Google Scholar] [CrossRef]
  11. Ismail, N.I.; Abdullah, S.R.S.; Idris, M.; Kurniawan, S.B.; Effendi, M.I.; ALSbani, N.H.; Jehawi, O.H.; Hasan, H.A. Applying rhizobacteria consortium for the enhancement of Scirpus grossus growth and phytoaccumulation of Fe and Al in pilot constructed wetlands. J. Environ. Manag. 2020, 267, 110643. [Google Scholar] [CrossRef] [PubMed]
  12. Souza, E.C.; Vessoni-Penna, T.C.; de Souza Oliveira, R.P. Biosurfactant-enhanced hydrocarbon bioremediation: An overview. Int. Biodeterior. Biodegrad. 2014, 89, 88–94. [Google Scholar] [CrossRef]
  13. Zeki, S.L.; M-Ridha, M.J. Phytoremediation of synthetic wastewater containing copper by using native plant. Iraqi J. Agric. Sci. 2020, 51, 1601–1612. [Google Scholar]
  14. Al-Baldawi, I.; Abdullah, S.R.S.; Anuar, N.; Suja, F.; Mushrifah, I. Phytodegradation of total petroleum hydrocarbon (TPH) in diesel-contaminated water using Scirpus grossus. Ecol. Eng. 2015, 74, 463–473. [Google Scholar] [CrossRef]
  15. Abdullah, S.R.S.; Al-Baldawi, I.A.; Almansoory, A.F.; Purwanti, I.F.; Al-Sbani, N.H.; Sharuddin, S.S.N. Plant-assisted remediation of hydrocarbons in water and soil: Application, mechanisms, challenges and opportunities. Chemosphere 2020, 247, 125932. [Google Scholar] [CrossRef]
  16. Almansoory, A.F.; Idris, M.; Abdullah, S.R.S.; Anuar, N.; Kurniawan, S.B. Response and capability of Scirpus mucronatus (L.) in phytotreating petrol-contaminated soil. Chemosphere 2021, 269, 128760. [Google Scholar] [CrossRef]
  17. Cheng, L.; Zhou, Q.; Yu, B. Responses and roles of roots, microbes, and degrading genes in rhizosphere during phytoremediation of petroleum hydrocarbons contaminated soil. Int. J. Phytoremed. 2019, 21, 1161–1169. [Google Scholar] [CrossRef]
  18. Abhilash, P.C.; Powell, J.; Singh, H.B.; Singh, B. Plant–microbe interactions: Novel applications for exploitation in multipurpose remediation technologies. Trends Biotechnol. 2012, 30, 416–420. [Google Scholar] [CrossRef]
  19. Ali, M.F.; M-Ridha, M.J.; Taly, A.H. Optimization kerosene bio-degradation by a local soil bacterium isolate klebsiella pneumonia sp. pneumonia. J. Pure Appl. Microbiol. 2018, 12, 2019–2057. [Google Scholar]
  20. Wojtera-Kwiczor, J.; Zukowska, W.; Graj, W.; Małecka, A.; Piechalak, A.; Ciszewska, L.; Chrzanowski, Ł.; Lisiecki, P.; Ko-morowicz, I.; Barałkiewicz, D.; et al. Rhizoremediation of diesel-contaminated soil with two rapeseed variaties and petroleum degraders reveals different responses of the plant defense mechanisms. Int. J. Phytorem. 2014, 16, 770–789. [Google Scholar] [CrossRef]
  21. Sánchez, V.; López-Bellido, F.J.; Cañizares, P.; Rodríguez, L. Assessing the phytoremediation potential of crop and grass plants for atrazine-spiked soils. Chemosphere 2017, 185, 119–126. [Google Scholar] [CrossRef] [PubMed] [Green Version]
  22. Rathod, P.H.; Brackhage, C.; Van Der Meer, F.D.; Müller, I.; Noomen, M.; Rossiter, D.G.; Dudel, G.E. Spectral changes in the leaves of barley plant due to phytoremediation of metals—Results from a pot study. Eur. J. Remote Sens. 2015, 48, 283–302. [Google Scholar] [CrossRef]
  23. González, A.; Gil-Díaz, M.M.; Pinilla, P.; Lobo, M.C. Impact of Cr and Zn on Growth, Biochemical and Physiological Parameters, and Metal Accumulation by Wheat and Barley Plants. Water Air Soil Pollut. 2017, 228, 419. [Google Scholar] [CrossRef]
  24. Al-Magheer, H.A.M.; Aldahak, L.; Al-Sali, S.H.F. Evaluation of growth and productivity of barley (Hordeum vulgare L.) genotype under southern Iraq conditions. Int. J. Plant Res. 2020, 21, 132–136. [Google Scholar]
  25. Kreszies, T.; Schreiber, L.; Ranathunge, K. Suberized transport barriers in Arabidopsis, barley and rice roots: From the model plant to crop species. J. Plant Physiol. 2018, 227, 75–83. [Google Scholar] [CrossRef] [PubMed]
  26. United States Environmental Protection Agency. Introduction to Phytoremediation. EPA 600-R-99-107; 2000. Available online: http://cluin.org/download/remed/introphyto.pdf (accessed on 3 September 2010).
  27. United States Environmental Protection Agency. Method 3510C. Separatory Funnel Liquid-Liquid Extraction. 2011. Available online: http://www.caslab.com/EPA-Methods/PDF/EPA-Method-3510C.pdf (accessed on 5 June 2012).
  28. Lohi, A.; Cuenca, M.A.; Anania, G.; Upreti, S.; Wan, L. Biodegradation of diesel fuel-contaminated wastewater using a three-phase fluidized bed reactor. J. Hazard. Mater. 2008, 154, 105–111. [Google Scholar] [CrossRef] [PubMed]
  29. United States Environmental Protection Agency. Method 3550C, Ultrasonic Extraction, SW-846 Manual; U.S. Government Printing Office: Washington, DC, USA, 2007. Available online: http://www.epa.gov/osw/hazard/testmethods/sw846/pdfs/3550c.pdf (accessed on 11 May 2011).
  30. Liu, X.; Wang, Z.; Zhang, X.; Wang, J.; Xu, G.; Cao, Z.; Zhong, C.; Su, P. Degradation of diesel-originated pollutants in wetlands by Scirpus triqueter and microorganisms. Ecotoxicol. Environ. Saf. 2011, 74, 1967–1972. [Google Scholar] [CrossRef]
  31. Peng, S.; Zhou, Q.; Cai, Z.; Zhang, Z. Phytoremediation of petroleum contaminated soils by Mirabilis Jalapa L. in a greenhouse plot experiment. J. Hazard. Mater. 2009, 168, 1490–1496. [Google Scholar] [CrossRef]
  32. Zeki, S.L.; M-Ridha, M.J. Phytotoxicity of wastewater containing cadmium (Cd) using oleander. Iraqi J. Agric. Sci. 2020, 51, 1231–1238. [Google Scholar]
  33. Barati, M.; Bakhtiari, F.; Mowla, D.; Safarzadeh, S. Comparison of the effects of poultry manure and its biochar on barley growth in petroleum-contaminated soils. Int. J. Phytoremed. 2018, 20, 98–103. [Google Scholar] [CrossRef]
  34. Asiabadi, F.I.; Mirbagheri, S.A.; Najafi, P.; Moatar, F. Phytoremediation of Petroleum-Contaminated Soils around Isfahan Oil Refinery (Iran) by Sorghum and Barley. Curr. World Environ. 2014, 9, 65–72. [Google Scholar] [CrossRef] [Green Version]
  35. Ong, S.-A.; Uchiyama, K.; Inadama, D.; Ishida, Y.; Yamagiwa, K. Treatment of azo dye Acid Orange 7 containing wastewater using up-flow constructed wetland with and without supplementary aeration. Bioresour. Technol. 2010, 101, 9049–9057. [Google Scholar] [CrossRef] [PubMed]
  36. Shirdam, R.; Zand, A.D.; Bidhendi, G.N.; Mehrdadi, N. Phytoremediation of hydrocarbon-contaminated soils with emphasis on the effect of petroleum hydrocarbons on the growth of plant species. Phytoprotection 2009, 89, 21–29. [Google Scholar] [CrossRef] [Green Version]
  37. Merkl, N.; Schultze-Kraft, R.; Infante, C. Phytoremediation in the Tropics—The Effect of Crude Oil on the Growth of Tropical Plants. Bioremed. J. 2004, 8, 177–184. [Google Scholar] [CrossRef]
  38. Liste, H.-H.; Felgentreu, D. Crop growth, culturable bacteria, and degradation of petrol hydrocarbons (PHCs) in a long-term contaminated field soil. Appl. Soil Ecol. 2006, 31, 43–52. [Google Scholar] [CrossRef]
  39. Bossert, I.; Bartha, R. Plant growth in soils with a history of oily sludge disposal. Soil Sci. 1985, 140, 75–77. [Google Scholar] [CrossRef]
  40. Ekperusi, A.O.; Nwachukwu, E.O.; Sikoki, F.D. Assessing and modelling the efficacy of Lemna paucicostata for the phytoremediation of petroleum hydrocarbons in crude oil-contaminated wetlands. Sci. Rep. 2020, 10, 8489. [Google Scholar] [CrossRef]
Figure 1. Experimental setup of the phytoremediation test under subsurface flow.
Water 14 00687 g001
Figure 2. Physical parameter variations of (a) temperature, (b) pH, and (c) ORP in the barley experimental programme using kerosene as the contaminant.
Water 14 00687 g002
Figure 3. Degradation rate in sand extraction of barley exposed to kerosene contamination at 1%, 2%, and 3%, (a) with plants and (b) without plants.
Water 14 00687 g003
Figure 4. Kerosene concentration recorded in barley plants exposed to 1%, 2%, and 3% kerosene contaminant levels over 42 days.
Water 14 00687 g004
Figure 5. Growth response parameters (a) wet weight and (b) dry weight in the phytoremediation test of barley with kerosene concentrations of 1, 2 and 3%.
Water 14 00687 g005
Figure 6. Growth response of (a) root and (b) stem length in the phytoremediation test of barley with kerosene concentrations of 1, 2 and 3%.
Water 14 00687 g006
Figure 7. Kinetic model of the kerosene phytoremediation at the following different initial concentrations: without plant (a,c,e), with plant (b,d,f).
Water 14 00687 g007
Table 1. Mathematical equations of the kinetic model.
ModelMathematical Formula
Zero order C = C 0 k t
First order C = C 0 e k t
Second order C = C 0 1 + C 0 k t
Grau C = C 0 ( 1 1 b + a t )
Table 2. Parameters of the kinetic model with and without the plant system.
SystemModelParameterInitial Concentration
1%2%3%
PlantFirst order k 0.0490.1420.1535
R20.6870.9210.9407
RSME70311431713
MSE494,2181,307,4272,933,396
Second order k 0.0000330.0000150.000011
R20.9760.9720.9793
RSME445721790
MSE197,798520,046624,593
Zero order k 280.919555.142844.7689
R20.4680.4750.4754
RSME105517533170
MSE1,112,4763,073,78710,049,635
Grau a 1.0031.0791.1515
b 1.1371.1491.1274
R20.9980.9980.9989
RSME304558630
MSE92,426310,830396,557
Without plantFirst order k 0.0920.0810.0832
R20.7970.7770.7695
RSME438209683
MSE192,07543,871466,723
Second order k 0.0000200.0000090.000006
R20.9170.9120.9055
RSME38216184580
MSE145,6082,619,23020,976,788
Zero order k 252.831498.344745.9159
R20.4220.4440.4230
RSME499245798
MSE248,23860,013636,626
Grau a 0.6240.7840.5818
b 1.2791.2951.3044
R21.0000.9990.9996
RSME99205221
MSE983442,02649,030
Publisher’s Note: MDPI stays neutral with regard to jurisdictional claims in published maps and institutional affiliations.

