
Integrating Blue and Green Water to Identify Matching Characteristics of Agricultural Water and Land Resources in China


1
School of Geoscience and Technology, Zhengzhou University, Zhengzhou 450052, China
2
Joint Laboratory of Eco-Meteorology, Zhengzhou University, Zhengzhou 450052, China
*
Author to whom correspondence should be addressed.
Water 2022, 14(5), 685; https://doi.org/10.3390/w14050685
Submission received: 7 January 2022
/
Revised: 15 February 2022
/
Accepted: 21 February 2022
/
Published: 22 February 2022
(This article belongs to the Special Issue Water Use/Footprint for Agricultural Products during Production, Trade and Consumption Processes)
Abstract
:The uneven distribution and spatial mismatch between water and land resources (WLR) limit the utilization efficiency of agricultural water and land resources (AWLR), and then pose a threat to food production. There is a critical need to understand their matching characteristics for strategic resource allocation decisions and management. In this study, a holistic index (RSI) derived from resource equivalency analysis (REA) was developed which contributed to examine the abundance or deficiency of agricultural water and land resources (AWLR) based on the conception of generalized water resources (including blue water and green water). Results indicate that the matching degree of AWLR was the lowest in Northeast China, North China and Gansu in Northwest China, while the highest value was in Xinjiang due to the higher blue water use. In north China, other provinces suffered water scarcity except in Jilin, Liaoning, Henan, while all provinces in south China suffered land scarcity except in Tibet and Jiangsu. Meanwhile, the matching of AWLR was not exactly consistent with the distribution pattern of precipitation. The higher proportion of green water resources was not located in southeast China with rich precipitation; it had to do with water management. Too much or little water resources can result in the increasing of blue water use. The proposed approach can be a powerful instrument to implement public policies and management strategy as an attempt to improve the utilization efficiency and enhance the optimize-allocation of AWLR.
1. Introduction
Food security is not only related to the security of a country, but also to world peace and social stability. Thus, countries around the world always put food security on their high-priority political agenda [1]. Water resources and cultivated land resources are the basic resources of agricultural production, the core factors that affect agricultural production and the rigid constraints that determine grain output [2,3]. The quantity and utilization of water resources directly affect the production capacity of cultivated land resources, and the reclamation degree of cultivated land resources also restricts the development and utilization of water resources [4,5]. Therefore, the balanced utilization of agricultural water resources and land resources is particularly important for the sustainable development of agriculture and its region [6,7]. Water and land resources (WLR) greatly affect national food security. In China, as an agricultural country, agricultural water consumption accounts for more than 60% of total water consumption, of which irrigation water accounts for more than 90% of total agricultural water use, providing food for nearly 20% of the world’s population with only 7% of the world’s cultivated land resources [8]. According to the “China Rural Development Report 2020”, by the end of the 14th Five-Year Plan period, China will probably have a grain deficit of about 130 million tons. Addressing the issue of water and land use for agricultural production and ensuring food security is clearly high on China’s political agenda. Better water management is critical to ensuring food security and nutrition, as well as helping to achieve the Sustainable Development Goals (SDGs) [9].
However, some literature has indicated that the essential issue in WLR utilization in China is not the scarcity of resources, and the cause of food insecurity is also not the population growth, but the issues of unreasonable utilization structure, uneven distribution and spatial mismatching between water and land resources [10,11,12]. Planning and management of agricultural water and land resources (AWLR) without proper assessment of their matching status can lead to massive loss of resources without significant achievements [13]. Thus, it made a top priority of analyzing and understanding the current status of AWLR for China to serve the goal of food security. One essential and critical task is to identify matching characteristics of AWLR as a basis of developing integrated WLR management strategies. In terms of WLR matching, its basic meaning is the amount of water resources possessed by per unit land area. In current research, in general, the research methods adopted mainly include Gini coefficient, Data Envelopment Analysis (DEA), water resources per unit area, etc. The Gini coefficient is an index of the fairness of income distribution originally developed by Italian economist Roberto Gini. It is mainly used to estimate the gap between rich and poor, and is extended to the area of resource management to measure the balance between water and land resources [14,15,16]. The Gini coefficient is established by sorting the respective proportion of two resources in different geographical units based on setting the grading index, then measuring the difference among geographical regions. It can be known that it was a relative concept and suffered from a disadvantage when a negative value was included in the distribution [17,18]. That is, it was not appropriate to be employed when any of two resources may be deficient or there are no obvious differences among geographical units. Besides, Gini coefficient is based on the data from the next lower level of geographical units, which certainly increases the difficulty of availability of data and thus limits its application. DEA is a method for measuring relative efficiency at different spatial scales, first proposed by Charles Cooper and Rhodes in 1978. DEA has strong objectivity and can effectively measure the production efficiency of the decision making unit, and better reflect the utilization and matching of water and soil resources [19]. However, the DEA method cannot compare technical effective units and does not consider the influence of random factors in the system.
The model parameters of water resources per unit area are simple, the application is mature, and the study area involves a wide range [20]. It is a simple and straightforward exponent based on WLR matching definitions. In this method, the classification criteria are defined according to the collection and dispersion characteristics of matching indicators established to estimate WLR matching conditions. However, water resources have dual attributes of effectiveness and controllability. Traditionally, emphasis has been given to the concept of blue water by focusing on the “miracle” of irrigation systems [21]. It was derived from the understanding of controllability. Considering the effectiveness of water resources, evapotranspiration from non-irrigated cropland also is a water resource that is beneficial to society; it has been named “green water” [22]. Green water resource is not only an important part of agricultural crop production and terrestrial ecological environment, but also a potentially available fresh water consumption of human society [23]. Correspondingly, the concept of water resources has been extended to generalized water resources which include blue water and green water [24]. However, the current management and utilization of water resources tend to consider more “blue water” and ignore “green water”, which makes human measures to deal with water scarcity limited [25]. It is thus important to give special attention to the role of green water in WLR management. Besides, the focus of the previous method was on the amount of water resources. It is unavailable to understand the severity of resources scarcity. Therefore, further studies are necessary to comprehensively assess the matching characteristics and scarcity situation of AWLR.
The equivalent coefficient was found to be a tool indicating the relative depletion of a resource per unit extracted, which is intended to evaluate the resource depletion rate and the degree of scarcity [26,27]. Its basic principle is considering one of the factors and situations as the benchmark, then comparing it with other equal factors. It can finally obtain the effect degree of every factor relative to the benchmark. At present, the equivalent analysis method including Habitat Equivalency Analysis (HEA) and Resource Equivalence Analysis (REA) has become the habitat and resource damage assessment method promoted by the Natural Resource Damage Assessment (NRDA) program of the USA and the EU’s “REMEDE” project [28,29]. Therefore, many scientists have employed these two methods to quantify habitat and resource damage. For example, David et al. [30] developed a HEA framework to assess environmental damage costs and applied it to three case studies from the Brazilian Atlantic Rainforest (BAR). Li et al. [31] used REA to assess the damage of marine oil spill biological resources in the Penglai 19-3 oil field in Bohai Bay. In terms of the evaluation of AWLR scarcity, the equivalent coefficient can be referred to as the relative utilization degree and extraction condition of AWLR by comparing it with natural conditions.
This study analyzed matching characteristics of AWLR from the perspective of generalized water resources, and developed a holistic index to help to systematically understand the utilization and scarcity situation of AWLR as well. The final objective of the algorithm is to provide an auxiliary tool for integrated WLR management and planning so as to more objectively adopt technological and policy measures, then contribute to improving the comprehensive utilization efficiency of AWLR, as well as increasing grain production. Section 2 describes the method and data used in this study. The matching characteristics of generalized AWLR in China and scarcity situation of regional AWLR, including its implication, are presented in Section 3. Discussions and some concluding remarks are provided in Section 4 and Section 5, respectively.
2. Materials and Methods
2.1. Methods
The conception of green water was first introduction by Falkenmark (1995) [32] to distinguish it from blue water and to better assess the role of water in agricultural production. It was defined as the fraction of water used for evaporation and transpiration, that is, the part of rainfall that is stored in the soil and available to plants [33]. Green water is a direct water source used by crops or natural vegetation. Blue water refers to water flows in groundwater and surface water (river, lakes). It can be withdrawn and used for irrigation, drinking and other uses, but needs to be supported by engineering techniques, and thus, is an indirect water source. Conventional water resource assessments focus on the availability of blue water and its allocation for use in irrigation sectors, but the largest part of water use is green [34]. The water resources consumed by agricultural production can be divided into blue and green water, which contribute differently to agricultural production [35]. In fact, 80% of the world’s farmland is rainfed, which produces 60–80% of the world’s food, and only consumes green water; in other words, rainfed agriculture only consumes green water, while irrigated agriculture consumes both green and blue water [36]. Therefore, the matching of AWLR should be understood by integrating green water and blue water. Correspondingly, the formula was as follows:
where Bw is the volume of blue water used for irrigation (m3); Gw is the volume of green water used by agricultural vegetation (m3) (i.e., effective rainfall); Cfarm is the cultivated land area (hm2); Wf is AWLR matching degree (m3/hm2) in which volume per hectare can be expressed in terms of depth of water (mm) by multiplying with a factor of 0.1. Here, an assumption is that precipitation and irrigation uniformly distribute in a geographical unit.
Gw was calculated by the USDA SCS (USDA Soil Conservation Service) method in the CROPWAT model [37,38] (Chapagain and Orr 2009; FAO 1992). The specific calculation is:
where Pe is the monthly effective rainfall (mm); P is monthly precipitation (mm).
REA is a dominant method for calculating natural resource damages [39,40]. This method is to determine the scale of the restoration project to compensate the public by assuming that the ecological service function provided by the restoration project is equivalent to that of the damaged habitat or resources [41]. It is used to evaluate the scarcity degree and utilization situation of AWLR in this paper. Given that AWLR are strongly linked to nature and human activities, the amount of water resources per unit area under natural conditions was considered as the benchmark value, and the amount of irrigation water per unit cultivated land which characterizes exploitation and utilization status of AWLR as the analysis object according to two steps in REA. The first is to quantify the supply level of resources under natural conditions to provide the benchmark value of WLR. This employed the conception on the WLR matching. The second step is to identify the allocation situation of AWLR, then to compare it with the result from the first step. As a result, the scarcity index of AWLR (RSI) can be expressed as:
in which RSI is a dimensionless index; Ra is the irrigation water per unit cultivated land, (mm); Rt is the total water resources per unit area, (mm). That is,
where Wa is irrigation water use (m3); Lc is the cultivated land area (hm2); Wt is the total amount of water resources in a region (m3); Lt is the total land area (km2) (Here, volume per unit area has been converted and expressed in terms of depth of water (mm)).
When RSI > 1, it shows that the demand of agricultural water use per unit area exceeds water supply under natural conditions, so agricultural water use is in a restricted state. This situation can be eased by withdrawing more blue water by the support of advanced technology, but it often triggers over-exploitation of WLR, then gives rise to a set of eco-environment problems, such as the formation of regional groundwater funnels, land degradation and desertification [42], so that AWLR become unsustainable. Therefore, it is defined as water scarcity. When RSI < 1, it shows that water resources provided by nature are abundant. More agricultural water resources can be used to support food production, but it should be coordinated with more farmland area to avoid increasing agricultural water use per unit cultivated land so as to maintain the goal of agricultural water-saving. If it is difficult to gain more cultivated land, such as due to the non-agricultural uses tendency and inherent property of the land resource, it is considered as farmland deficiency. That is, the proposed method implicated an assumption: wherever there is more water, there should be more land. If humans appropriate excessively water or land resources from nature, it will bring about resource shortage. Therefore, for the case that RSI = 1, it indicates that the extraction proportion between agricultural water and land resources corresponds with the distribution characteristics of WLR under natural conditions, and exploitation and utilization of AWLR is in an absolutely balanced situation. Although Fan et al. [43] indicated that the increase in total crop production in China has arisen mainly as a result of increases in yield per unit area rather than from increases in the cultivated area, what exactly is utilization and development situation of AWLR in China? The proposed method will be used to detect and identify it.
2.2. Data Source
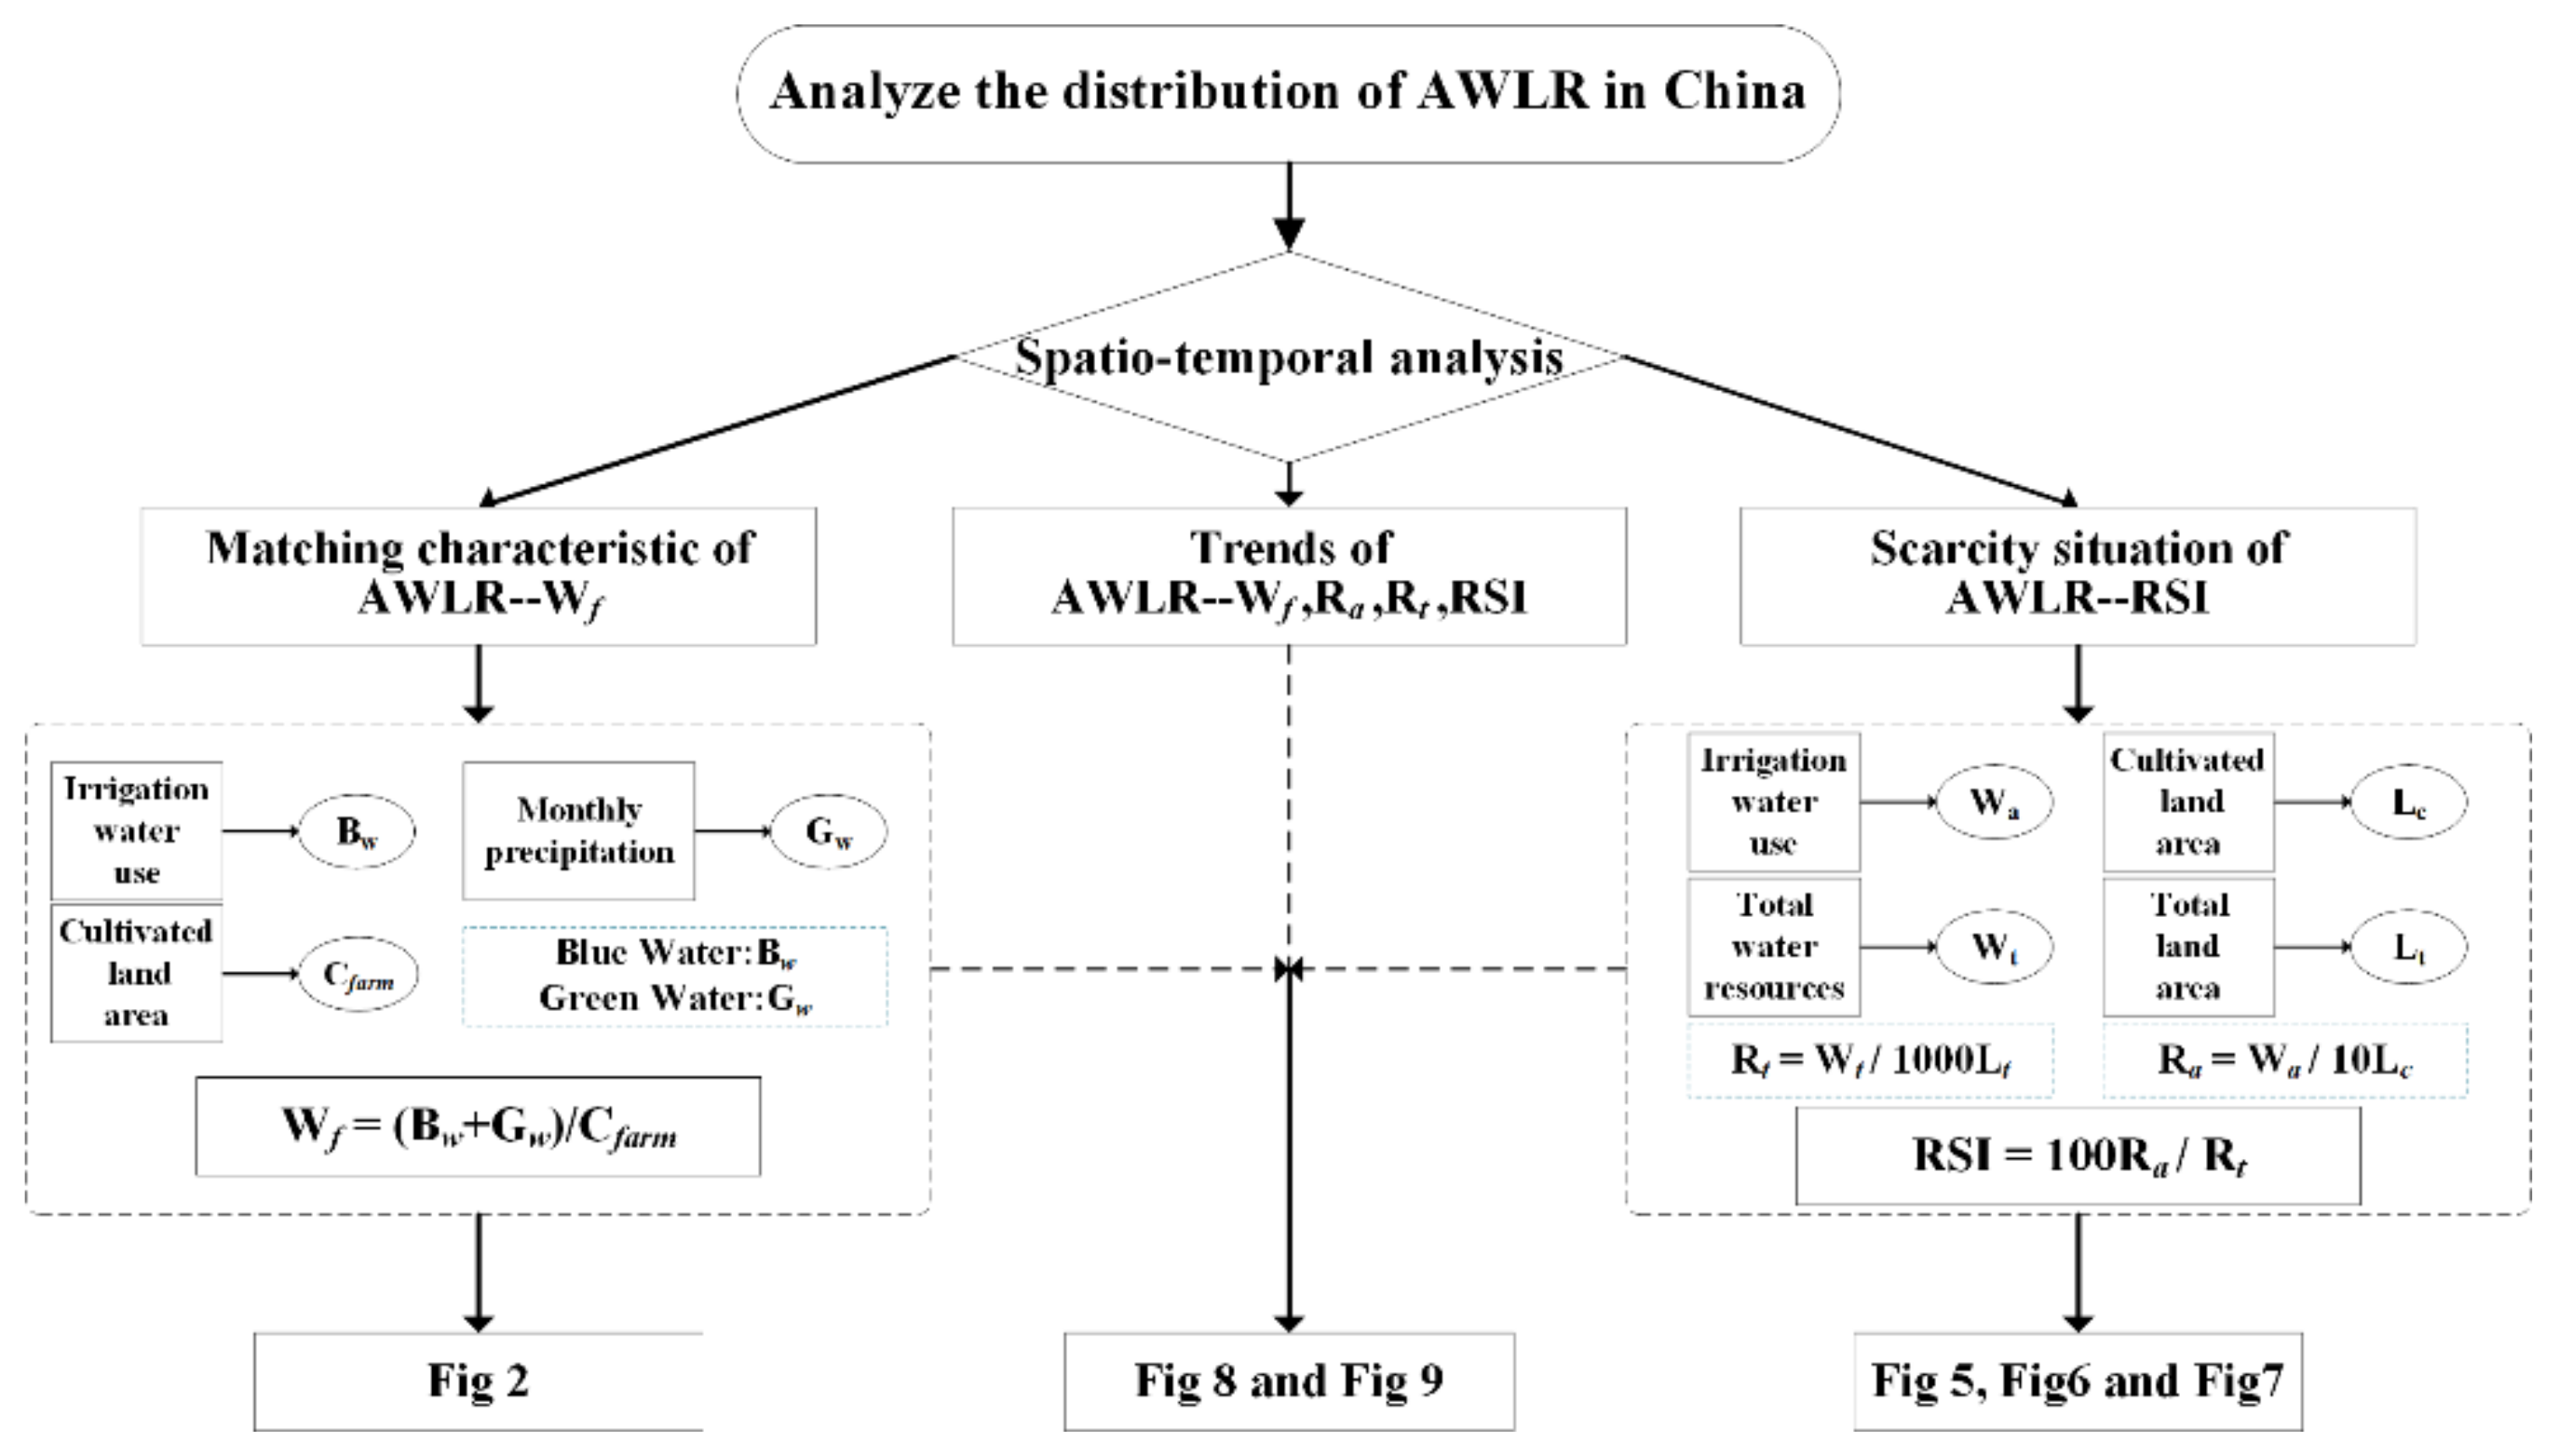
Statistics are the main source of data to support China’s economic and social development. These data are originally from the National Bureau of Statistics (http://stats.gov.cn, accessed on 10 July 2021) and provincial water resources bulletins, including total water resources, land area, cultivated area, agricultural water and the amount of irrigation water use of China’s 31 provinces. Considering the stability and accessibility, data of each administrative unit were obtained in the statistical yearbooks for the years 2010 to 2017. Monthly precipitation data from 2010 to 2017 at 707 meteorological stations in China were obtained from the China Meteorological Data Sharing Service System (http://cdc.cma.gov.cn, accessed on 8 July 2021). These data were mainly used to calculate the effective precipitation of each administrative unit in this study. Spatial distribution data of annual precipitation were obtained from Resources and Environment Science and Data Center of Chinese Academy of Sciences (https://www.resdc.cn/, accessed on 8 July 2021) Figure 1 is the framework of the analysis method in this study.
3. Results
3.1. Matching Characteristics of AWLR
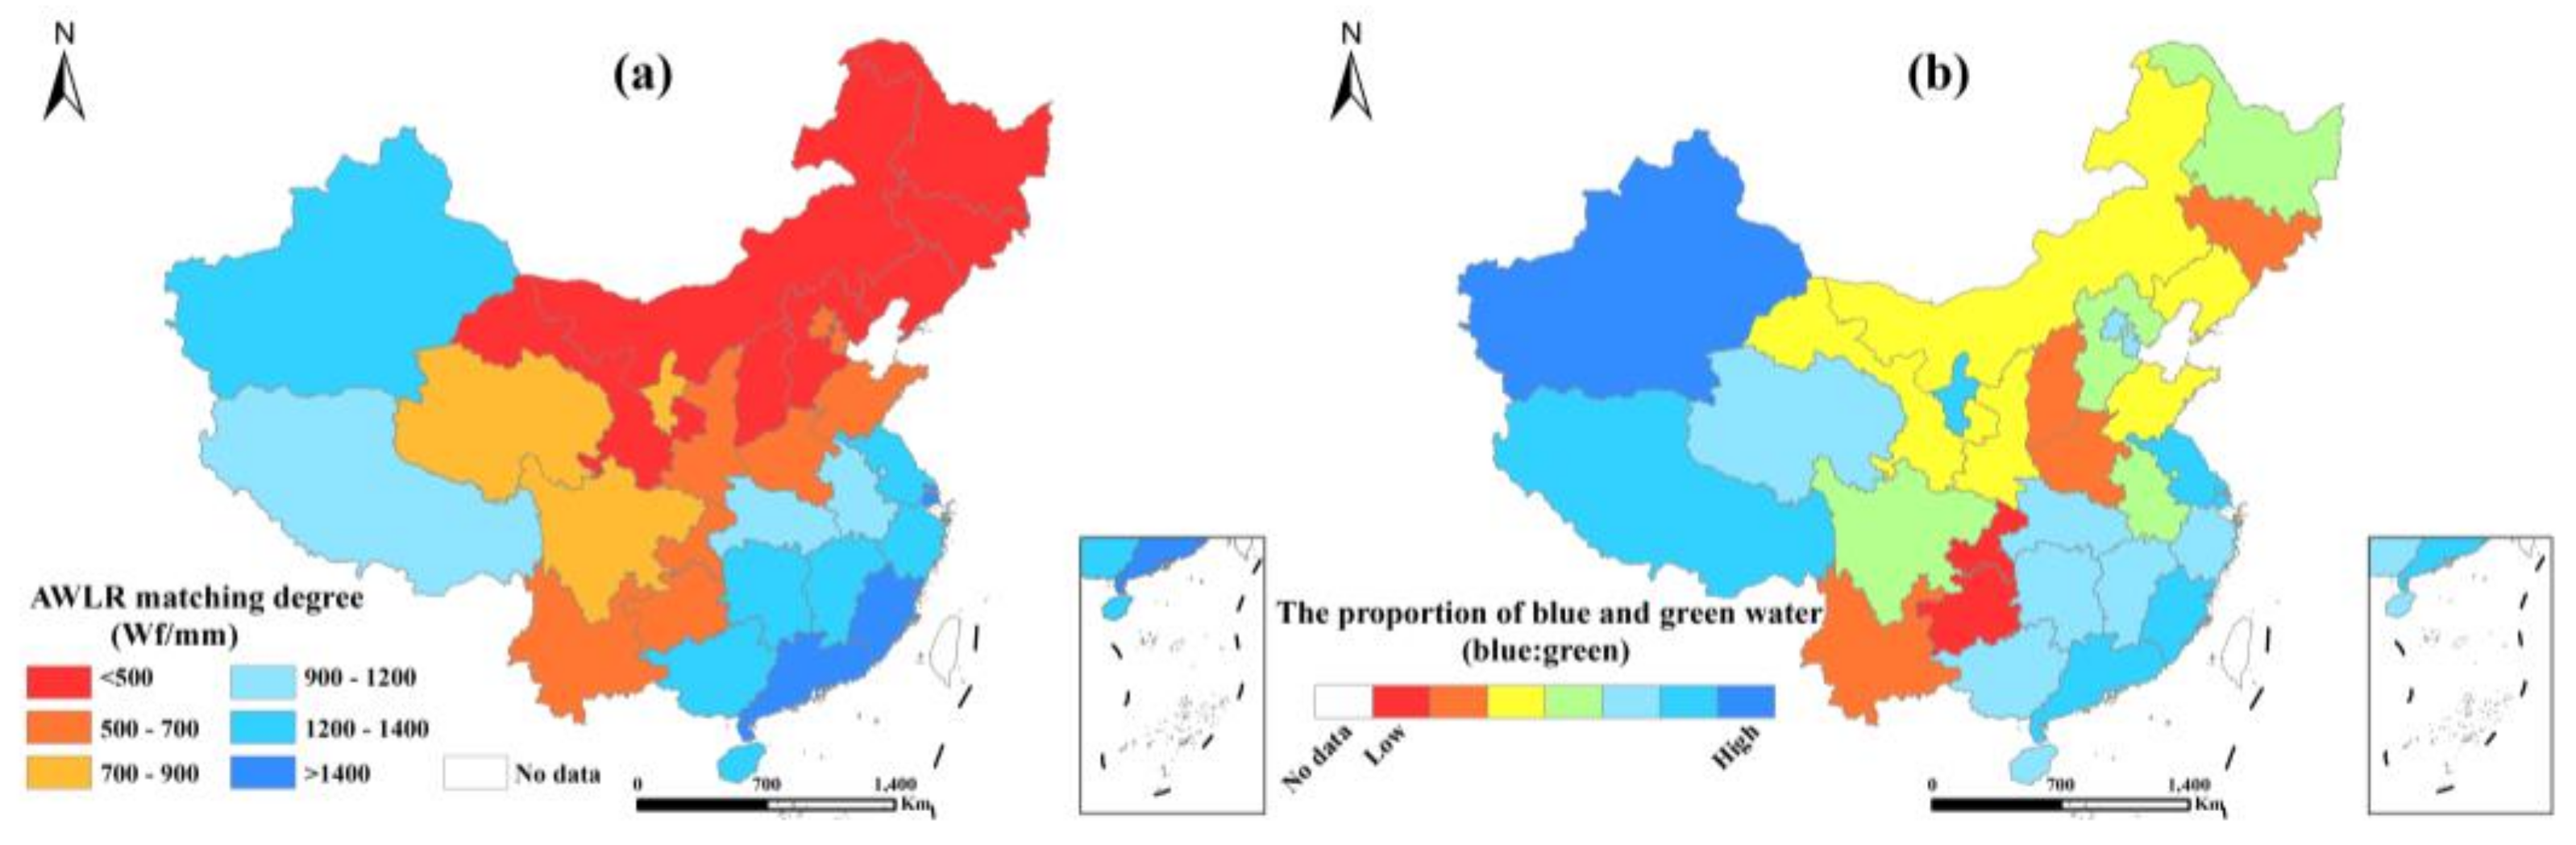
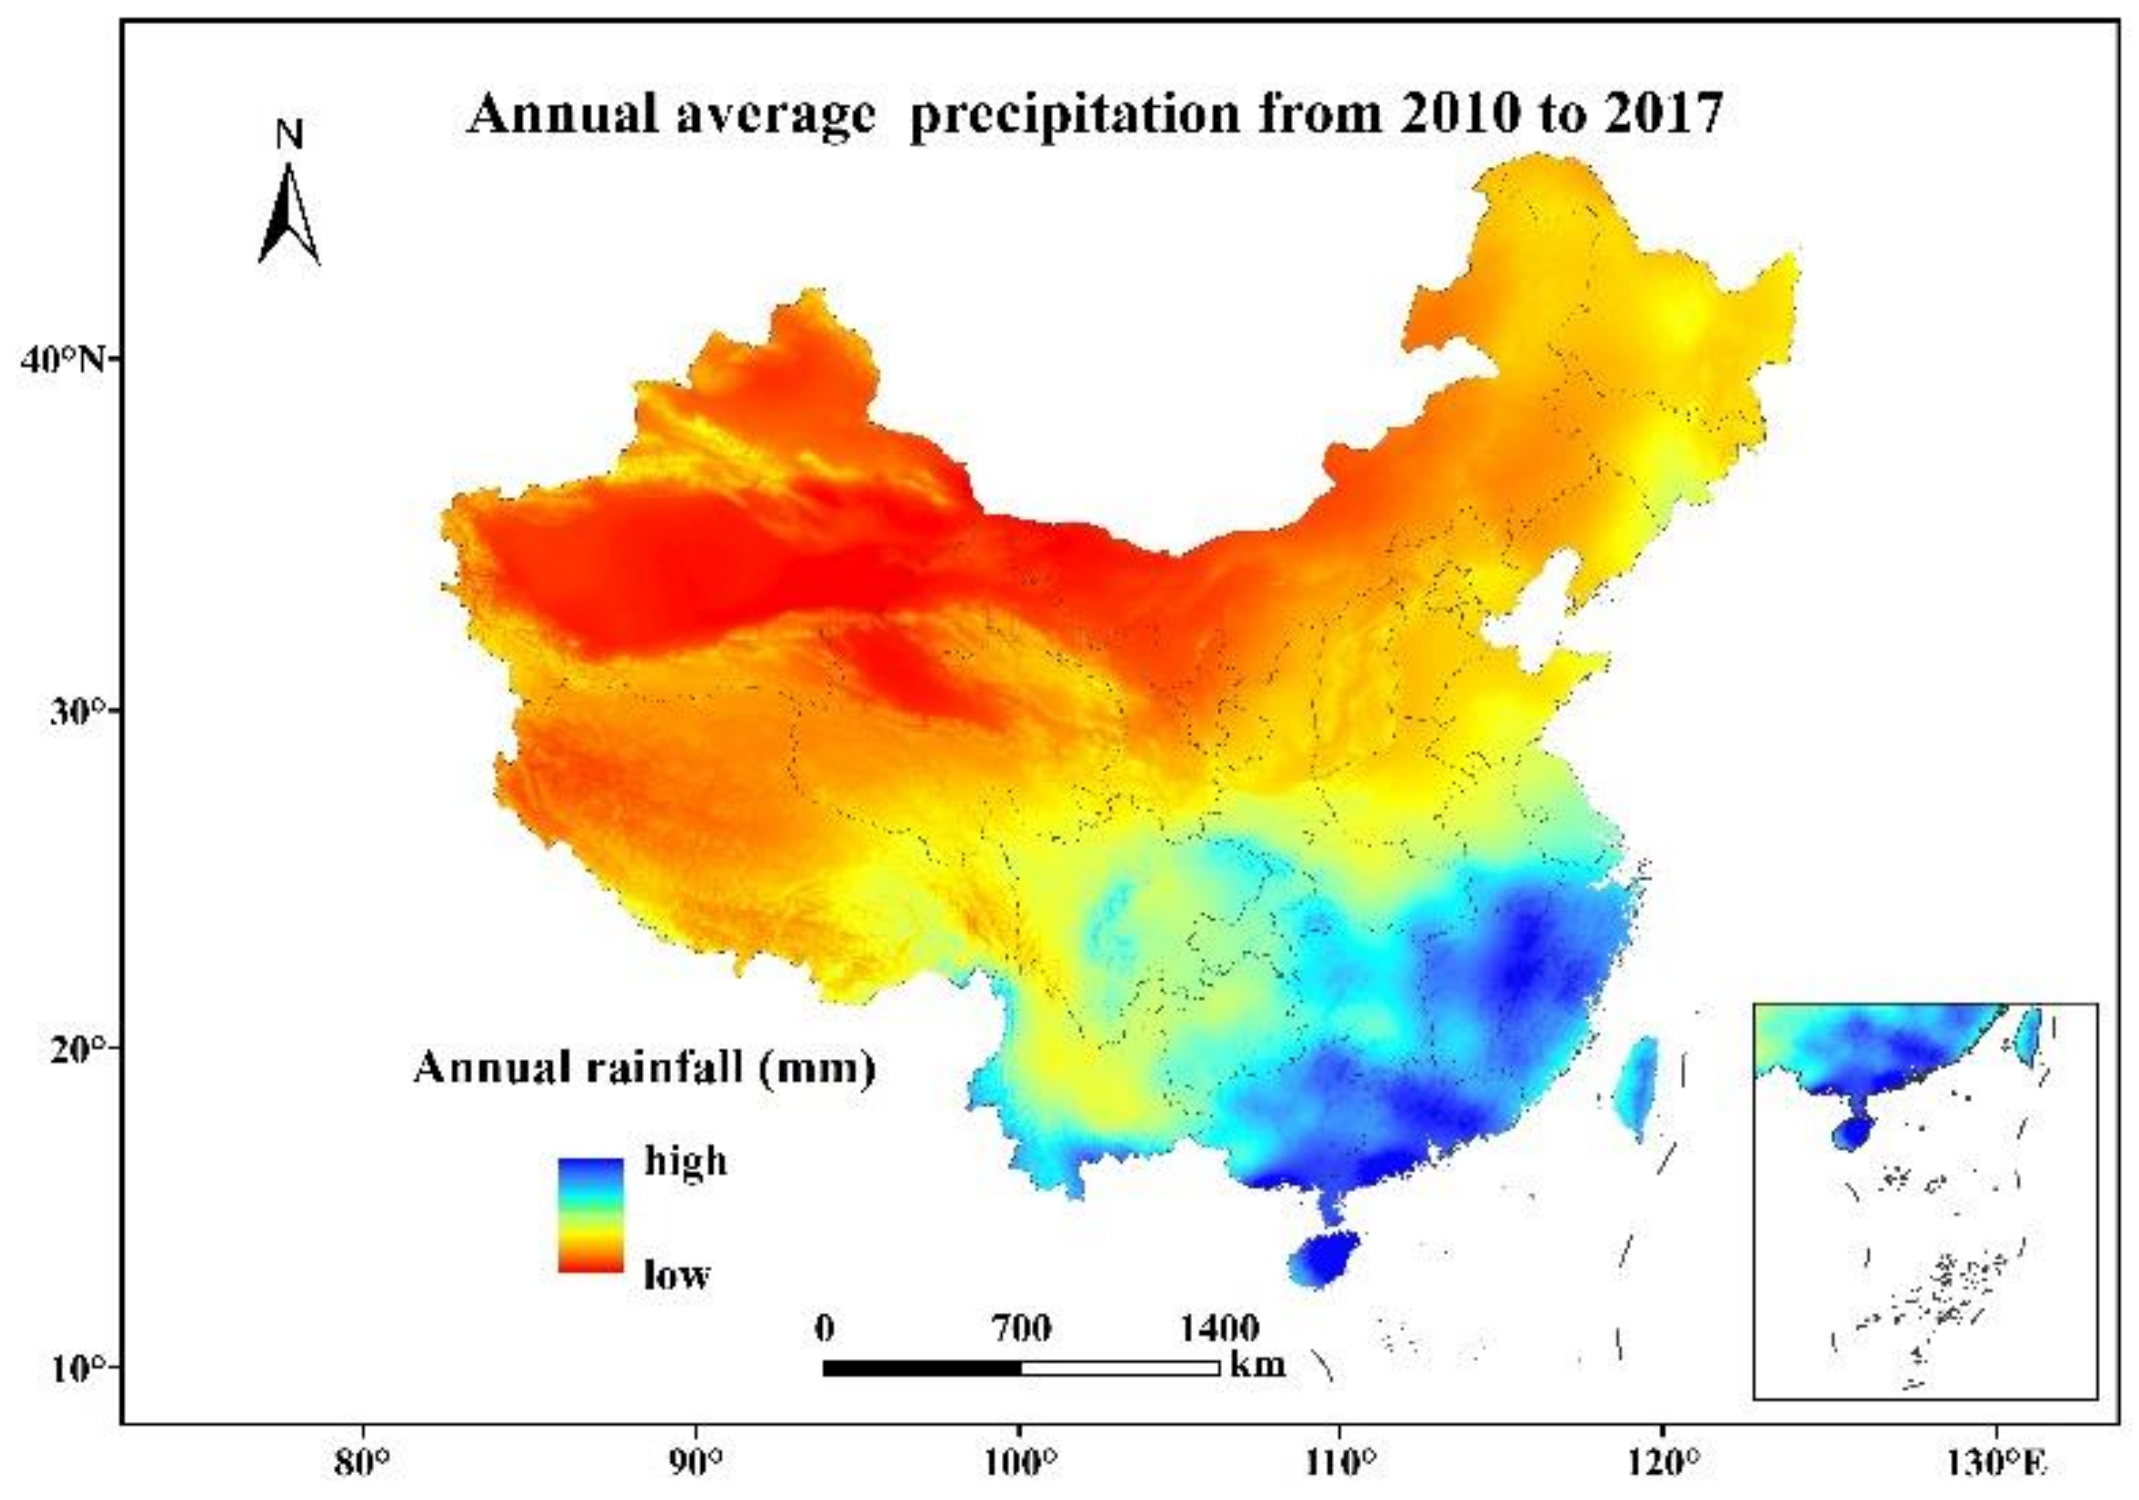
Figure 2 shows province-based distribution characteristics of AWLR matching in China. It was found that the threshold value where the matching degree of AWLR was 500–700 mm coincided with the division of north–south in China, but Xinjiang was an exception due to the higher proportion of blue water (82.1%). AWLR matching in Chinese provinces generally has a large gradient from north to south. Specifically, the lower value of the matching degree of AWLR was located in Northeast China, Inner Mongolia, Hebei, Shanxi and Gansu, which is below 500 mm. Then, it was Shaanxi, Henan, Shandong, Chongqing, Guizhou and Yunnan where the matching degree of AWLR was between 500 mm and 700 mm. The matching degree of AWLR was in the range of 700~900 mm in Qinghai, Ningxia, Sichuan. However, the higher matching degree of AWLR was mainly located in Southeast China and South China, especially in Guangdong and Fujian, where the matching degree of AWLR was more than 1400 mm. Comparing with the spatial distribution of precipitation (Figure A1), it can be found that there was a good consistency between precipitation and the matching degree of AWLR in eastern China. In western China, however, the matching degree of AWLR showed no clear trend.
The highest proportion of blue water was Xinjiang among all examined 31 provinces. It was also found that the higher proportion of blue water appeared in Tibet, Beijing and Tianjin. The lower proportion of blue water mainly appeared in Chongqing and Guizhou located in Southwest China. Besides, the proportion of blue water was higher in Southeast China.
3.2. Analysis on Scarcity Situation of AWLR
3.2.1. Regional Differences of Agricultural Water Use and Cultivated Land Area
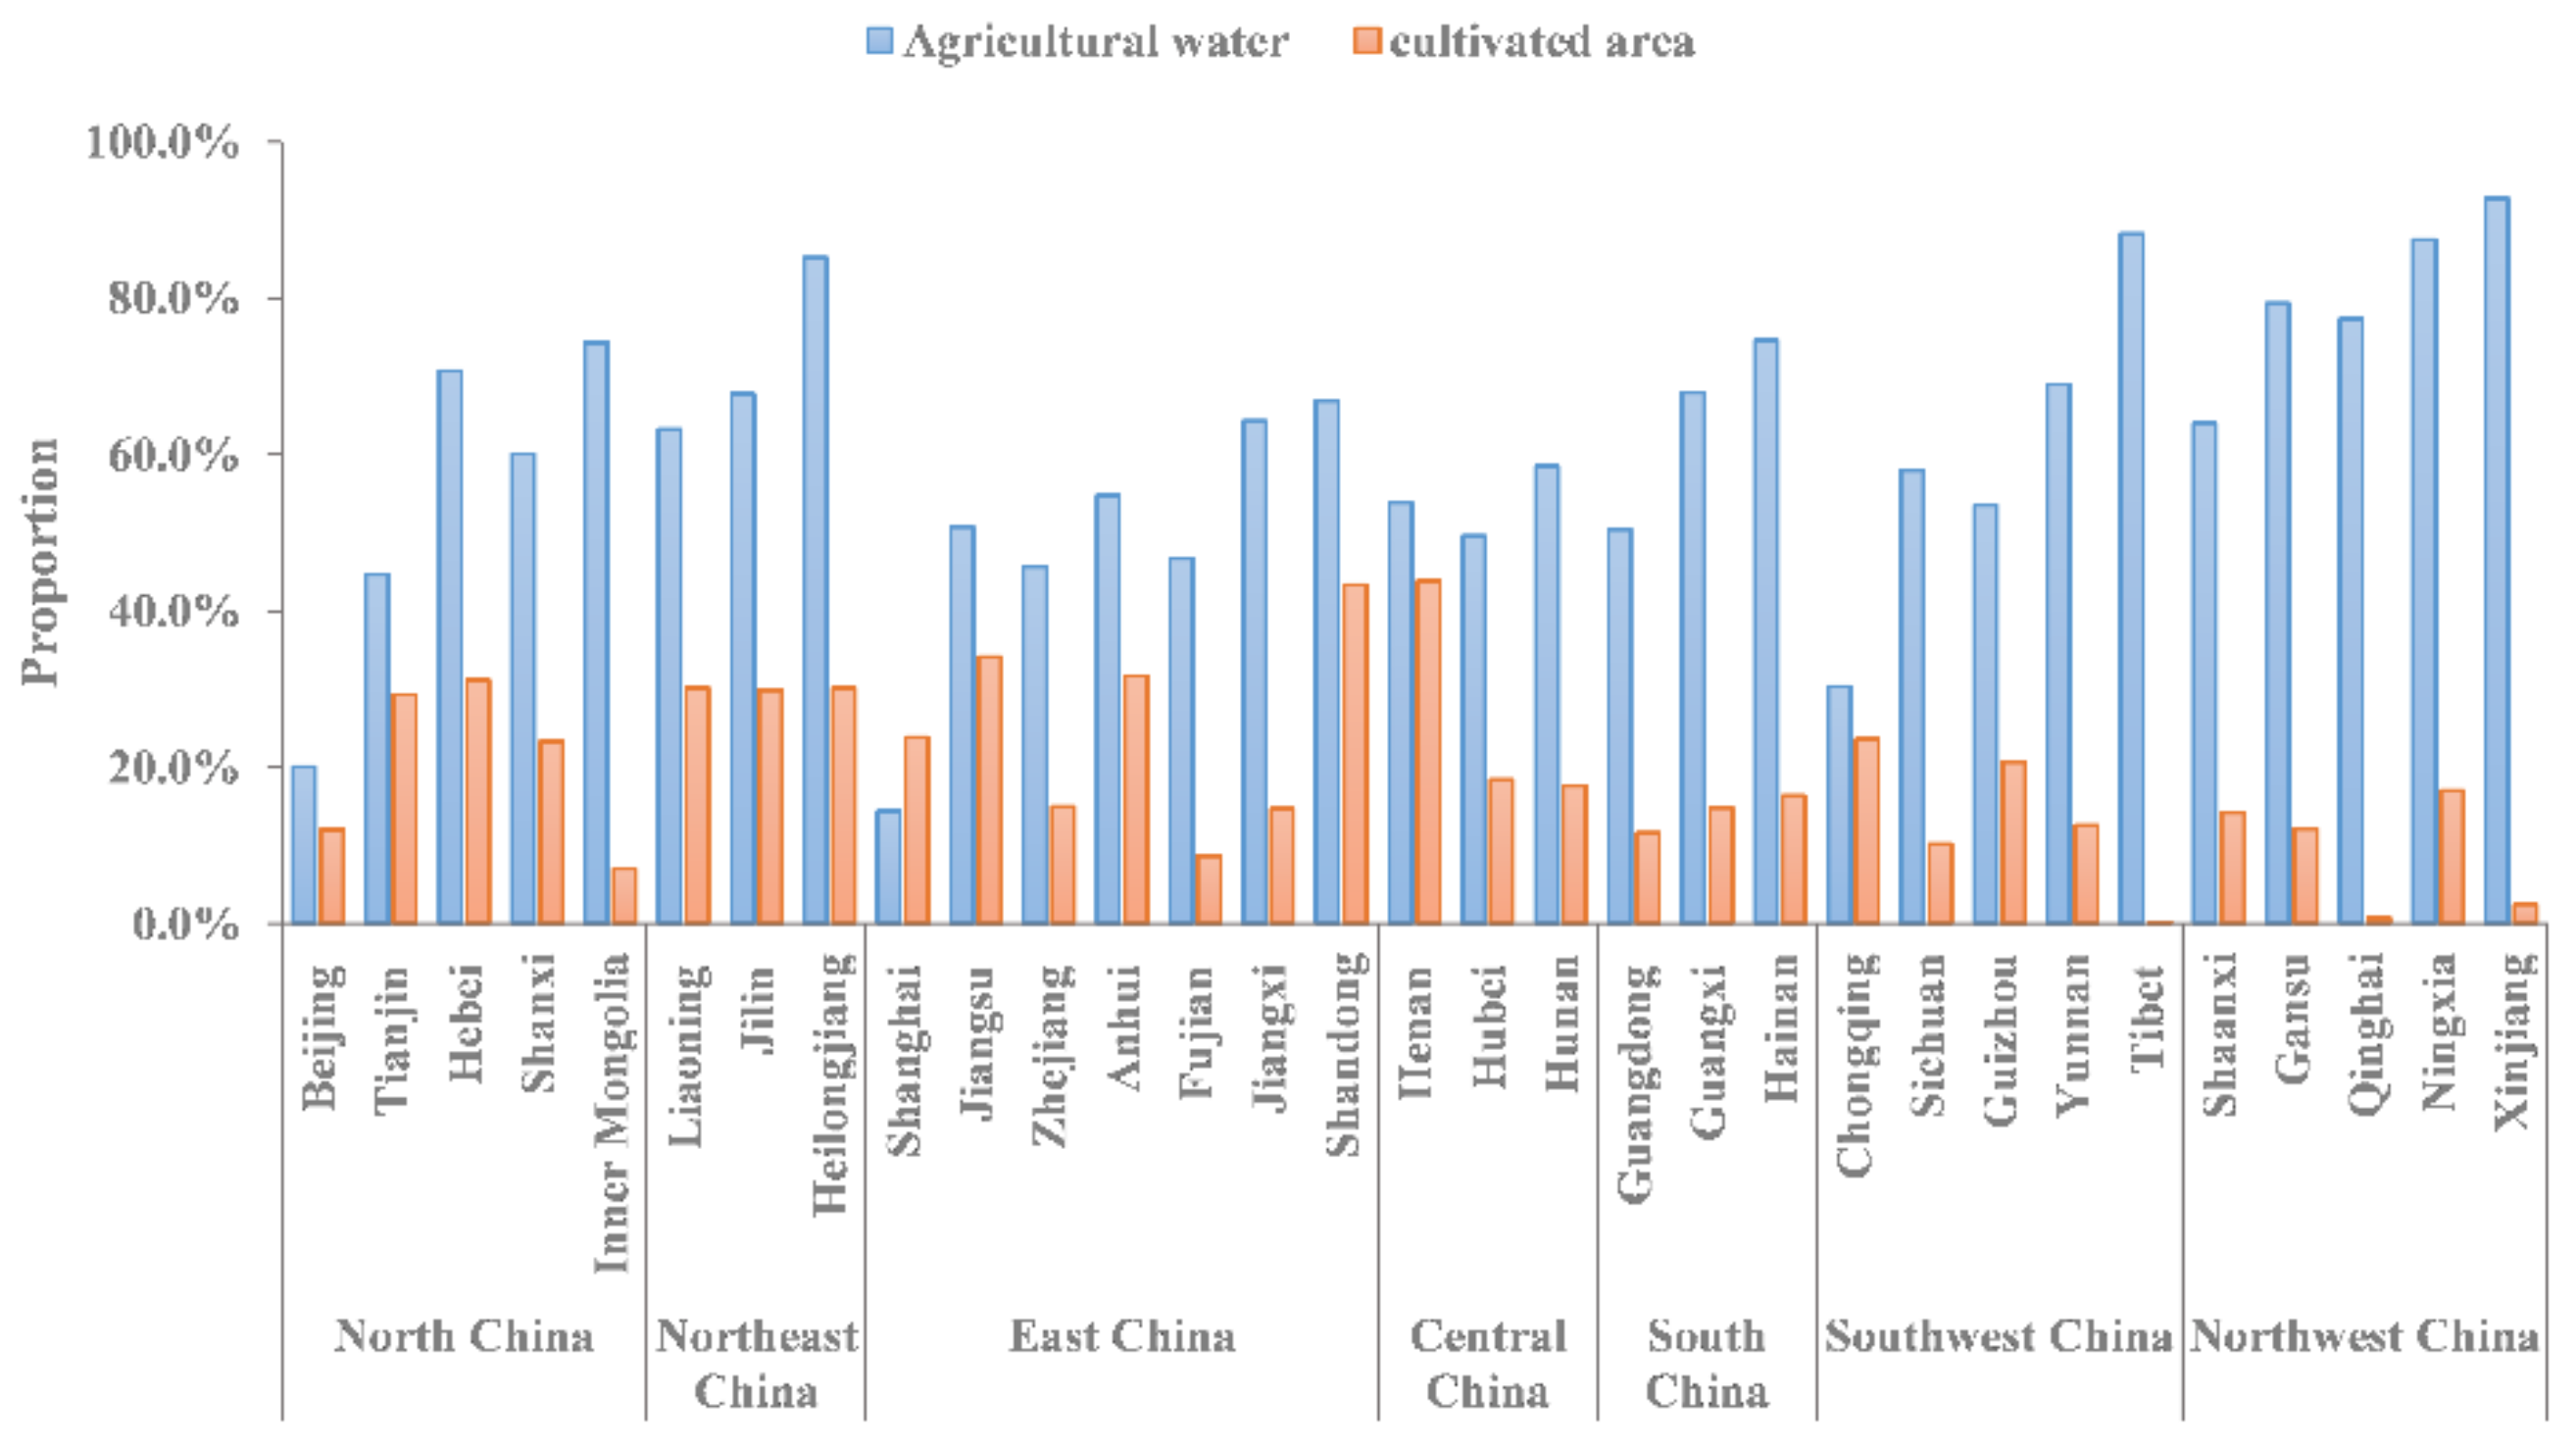
There are differences in agricultural water use and cultivated land area in most regions of China. As shown in Figure 3 and Figure 4, the proportion of agricultural water in total water consumption was the highest in Northwest China (80.2%); then, it was Northeast China (72.0%). The smallest value was in East China (49.1%). The proportion of cultivated land area to the total land area was as follows: Northeast China (30.1%), Central China (26.6%), East China (24.5%), North China (20.6%), South China (14.3%), Southwest China (13.5%), Northwest China (9.3%). Obviously, regions with high agricultural water consumption may not have large cultivated land area, and regions with large cultivated land area may not have large agricultural water consumption, so there was a problem of distribution and spatial mismatching between water and land resources.
3.2.2. Resource Allocation Characteristics under Two Conditions
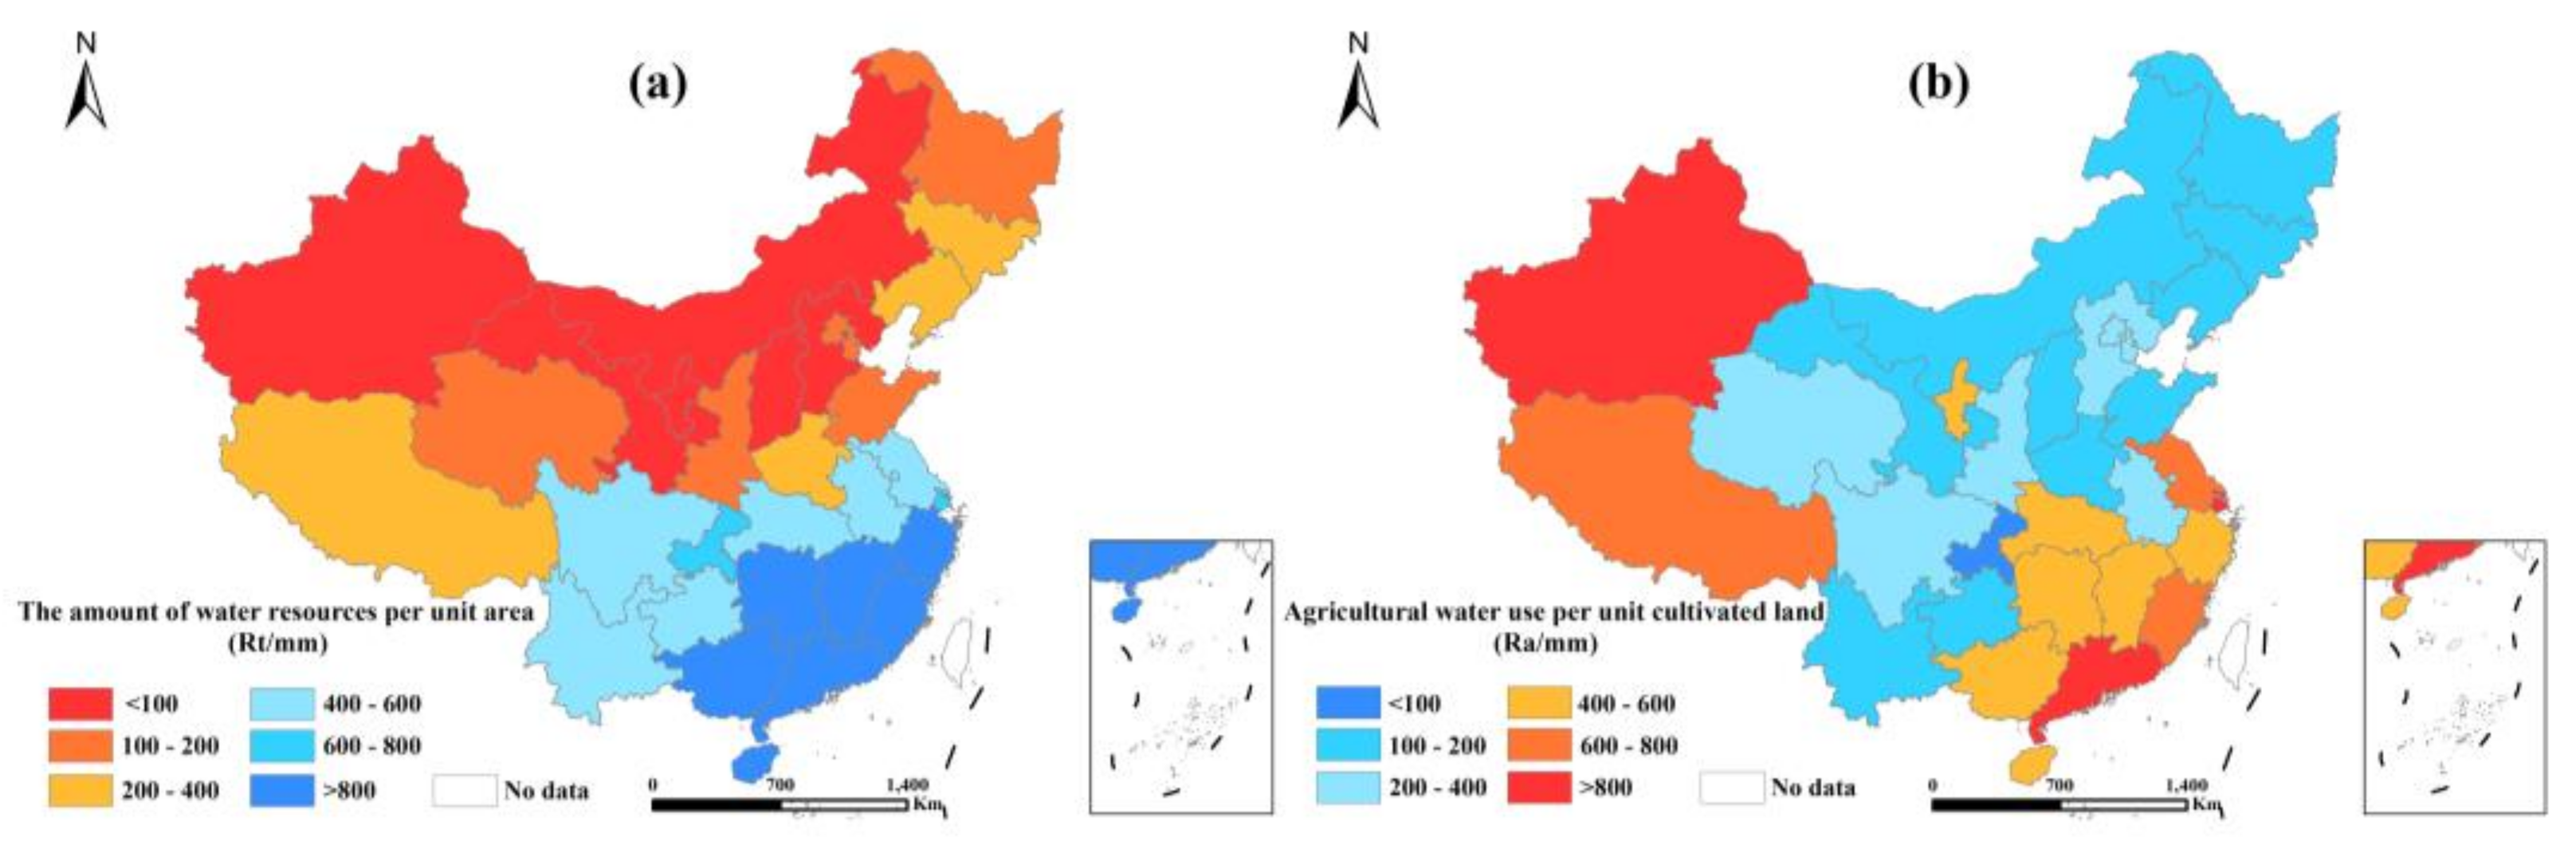
RSI was established by two sub-indices from the conception of resource matching, i.e., the amount of water resources per unit area (Rt) and agricultural blue water per unit cultivated land (Ra). According to Figure 5, Rt had a decreasing trend from southeast to northwest. It can be found that the distribution pattern of Rt agreed well with precipitation distribution. The high values of Rt went with high precipitation regions, whereas low values of Rt corresponded to regions with low precipitation. In northwest and north China, the Rt value was less than 200 mm, and the values of Rt in Xinjiang, Gansu, Ningxia, Inner Mongolia and other places were even less than 100 mm. The spatial distribution of Ra showed symmetrical characteristics on the basis of the line of northeast–southwest. Higher Ra was found in west areas of China (Xinjiang), and southeast areas of China (Guangdong and Shanghai), followed by in Tibet, Fujian and Jiangsu. The lower values for Ra were distributed mainly along the northeast–southwest line, including Heilongjiang, Jilin, Liaoning, Inner Mongolia, Shanxi, Henan, Shandong, Chongqing, Guizhou and Yunnan. The belt is approximately the demarcation between forests and grasslands that the annual precipitation is about 400 mm, and is also the important part of land farming in China. In addition, among 31 provinces in the Mainland China, the Ra value is the lowest in Shanxi due to the development of dry-farming where the proportion pf green water in agricultural water resources is up to 76.7%.
3.2.3. Identifying AWLR Scarcity Characteristics
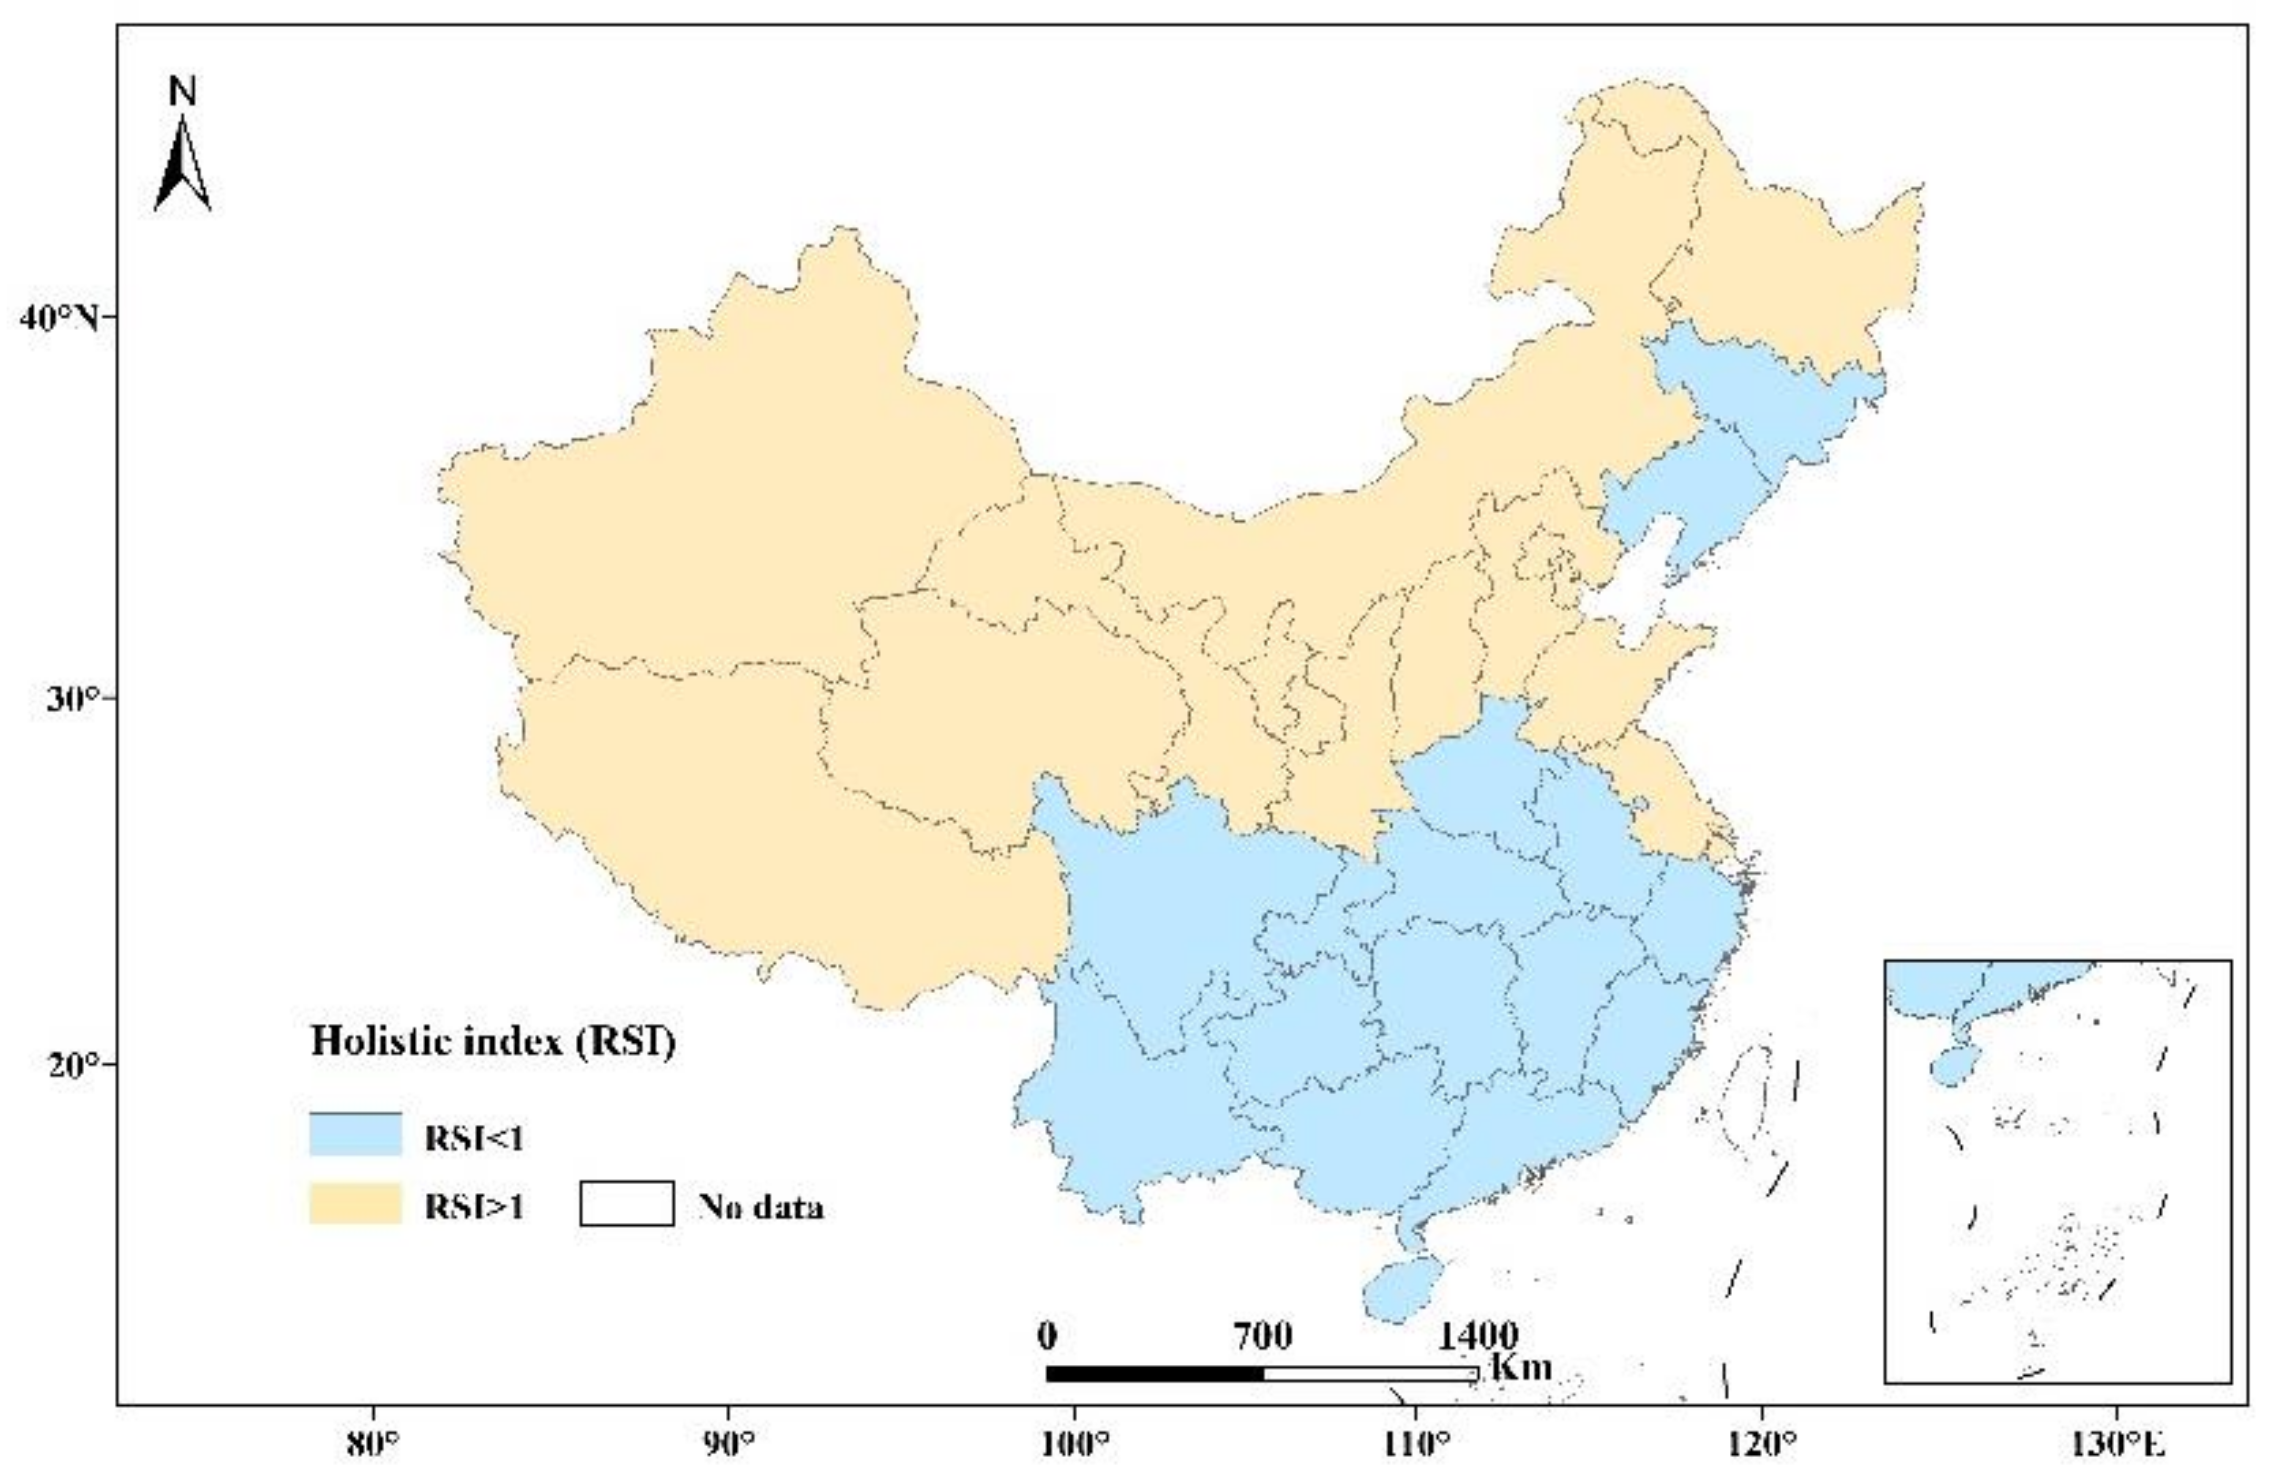
AWLR matching can be understood from two aspects, i.e., water scarcity and/or farmland deficiency. The threshold of 1.0 was taken to identify two types of resource scarcity characteristics. According to Figure 6, it can be found that the distribution of RSI also showed good consistency with the division of north–south in China, but there were some exceptions, including Jilin, Liaoning, Henan (Three important provinces of grain production), and Jiangsu, Shanghai. Regions with the RSI value over 1.0 were mainly located in the north, while RSI in most regions of Southern China was below 1.0. Besides, it can also be confirmed that the annual precipitation is low (<600~800 mm), and water resource is scarce in regions with RSI > 1. That is, the water condition is a major limiting factor for agricultural production in the case. In regions with RSI < 1, water resource is so plentiful that the annual precipitation is above 800 mm.
To understand scarcity characteristics of AWLR more completely, we further divided RSI into seven grades by selecting scarcity levels of 90%, 75% and 50% (Table 1).
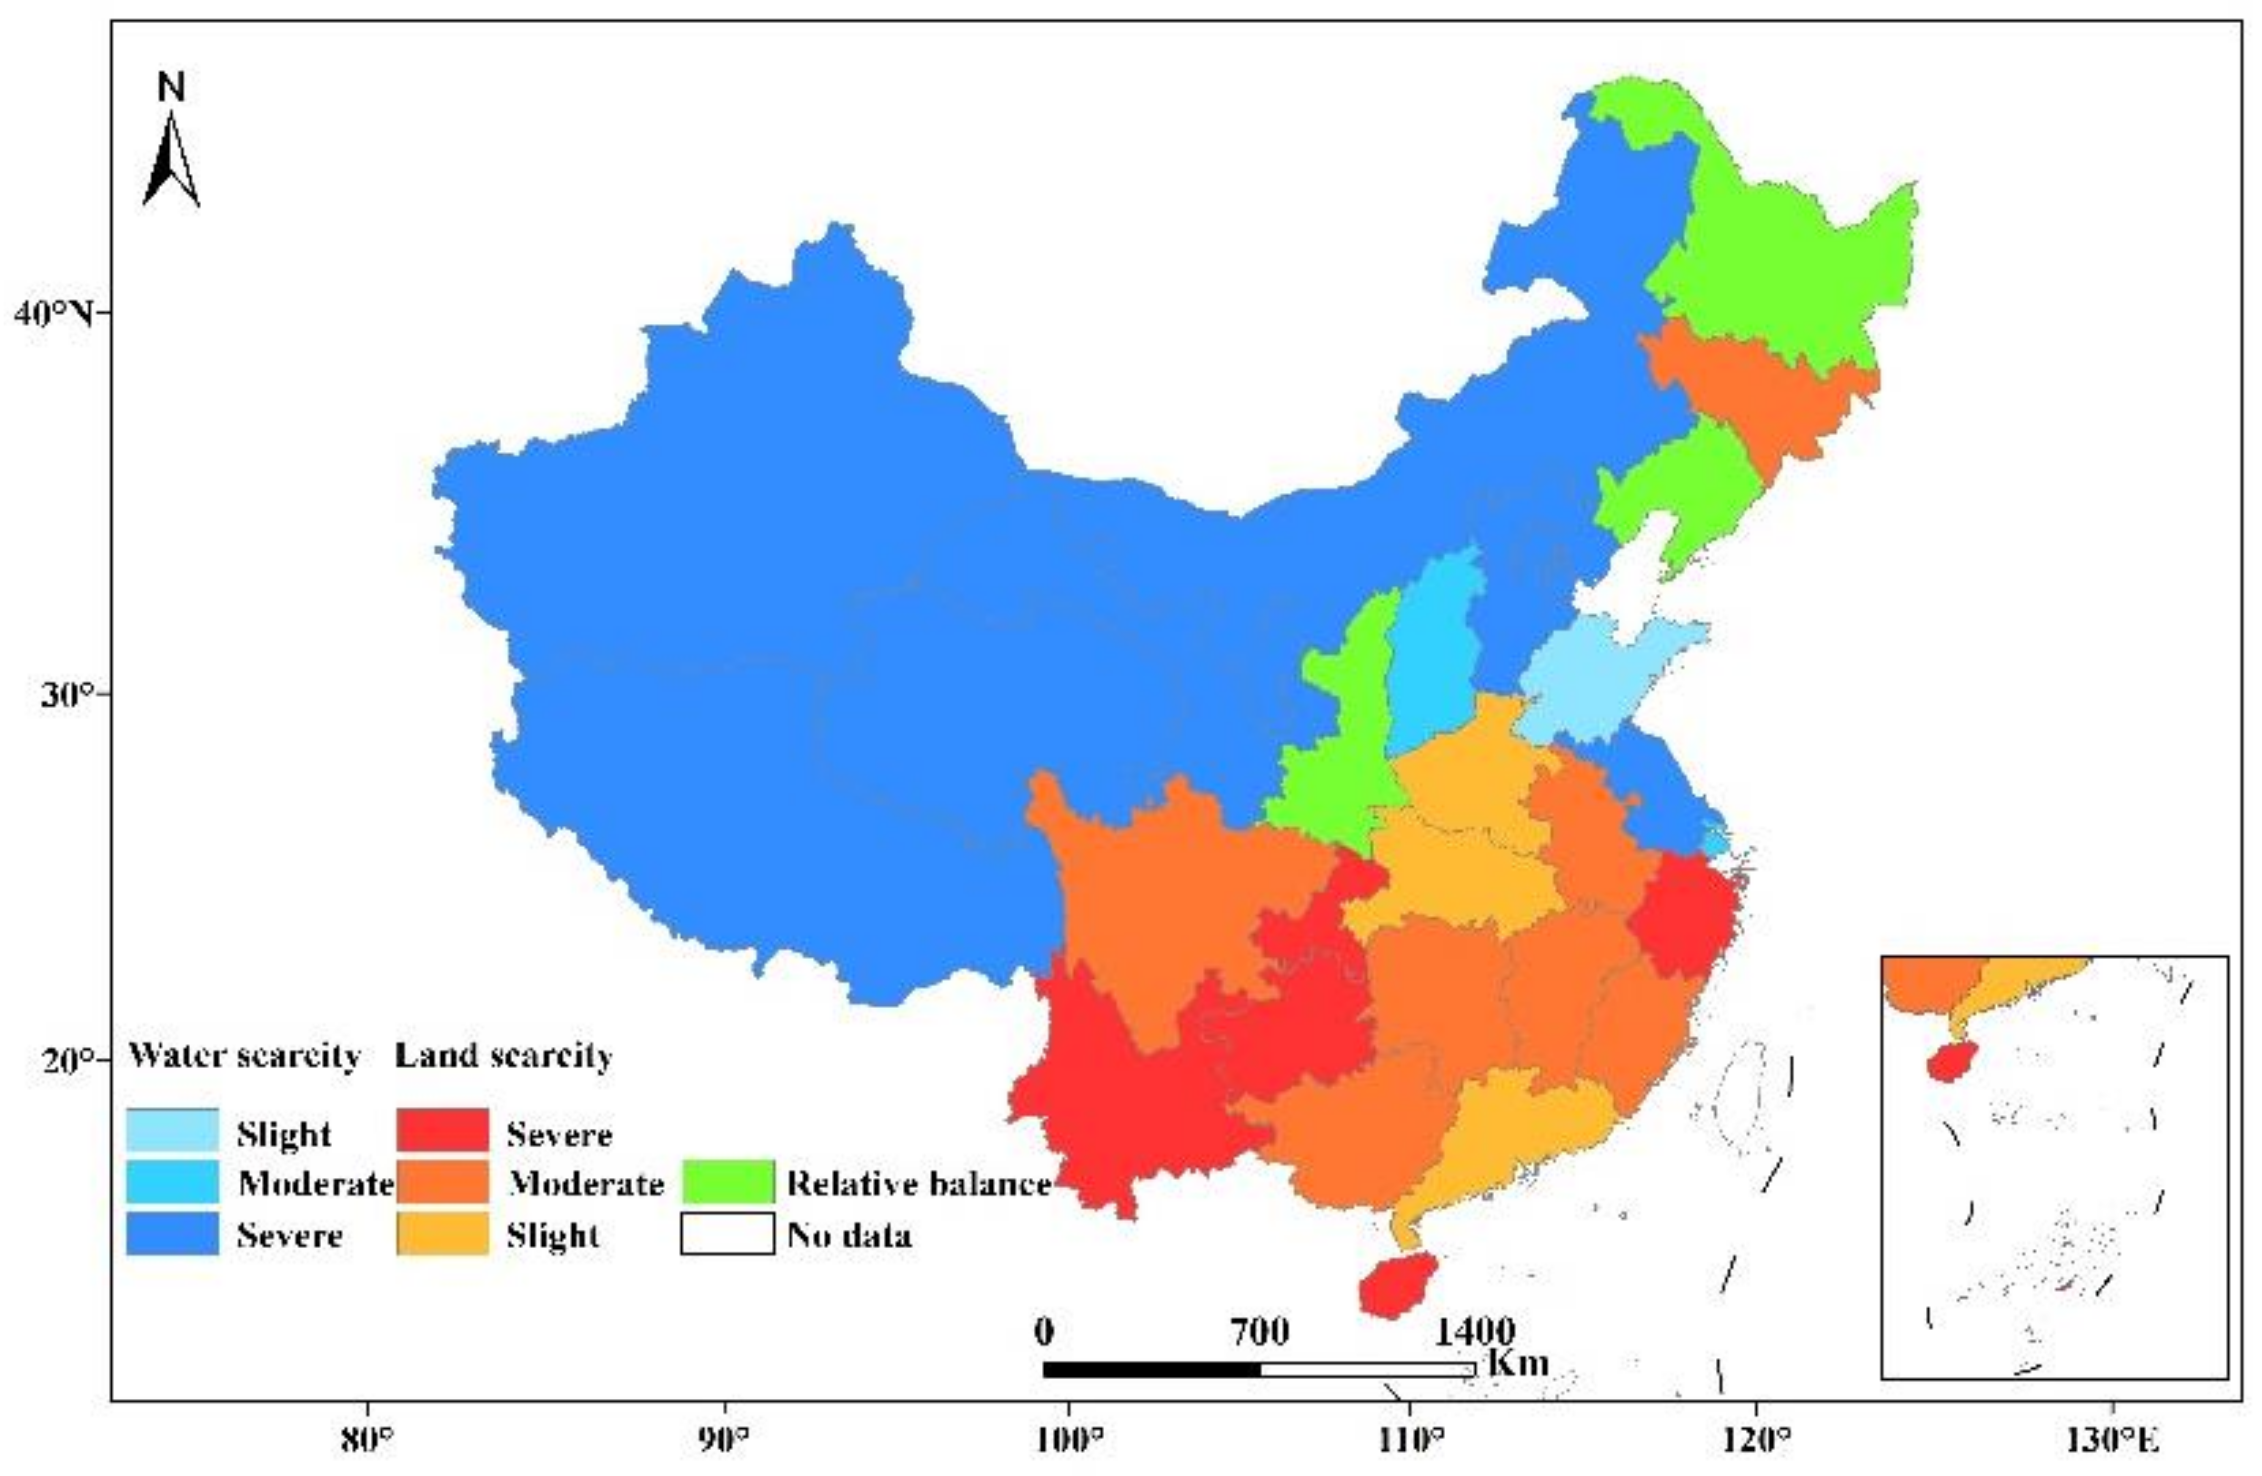
Several major divisions in China (Northwest China, North China, Central China, Southwest China, South China and Yellow-Huai-Hai plain) were highlighted and identified, as shown in Figure 7. Water resource is severely scarce in Northwest China, where the value of Ra is 50% higher than Rt. Southwest China has lower Rt relative to Ra, where water resource is sufficient, but cultivated land resources are relatively deficient due to the mountain areas. In South China, it had an adequate supply of water resources, but more water resources were used for serving demands of industries and urban water consumption because of high-speed economic development. As a result, the accessibility and availability of agricultural water resources was relatively low, so that farmland deficiency caused by non-agricultural uses was mitigated and neutralized, and the severity of farmland deficiency is slighter than Southwest China. The most primary food production bases, Yellow-Huai-Hai plains, showed the characteristics of the ladder that the value of RSI presented bigger differences between provinces, involving different grades and levels. The RSI value was close to 1 in Shaanxi, Heilongjiang and Liaoning. The utilization and matching conditions of AWLR in these three provinces were in the relative balanced state.
Combining with components of blue and green water, it can be found that the proportion of green water was overall low in regions with higher RSI, especially in Northwest China where it was below 50%, while it was higher, which is basically above 60%, in regions with lower RSI. In Southwest China, the proportion of green water was up to 80%. It confirmed that the available green water was little, and blue water played a significant role for AWLR utilization in water-starved regions. Although precipitation was rich in Southeast China, the proportion of green water did not show the higher value, and even was lower than that in Southwest China, Central China and Northeast China. It indicated that green water was not used effectively and fully in Southeast China. The use rate of green water was lower.
3.2.4. Trends of AWLR Matching
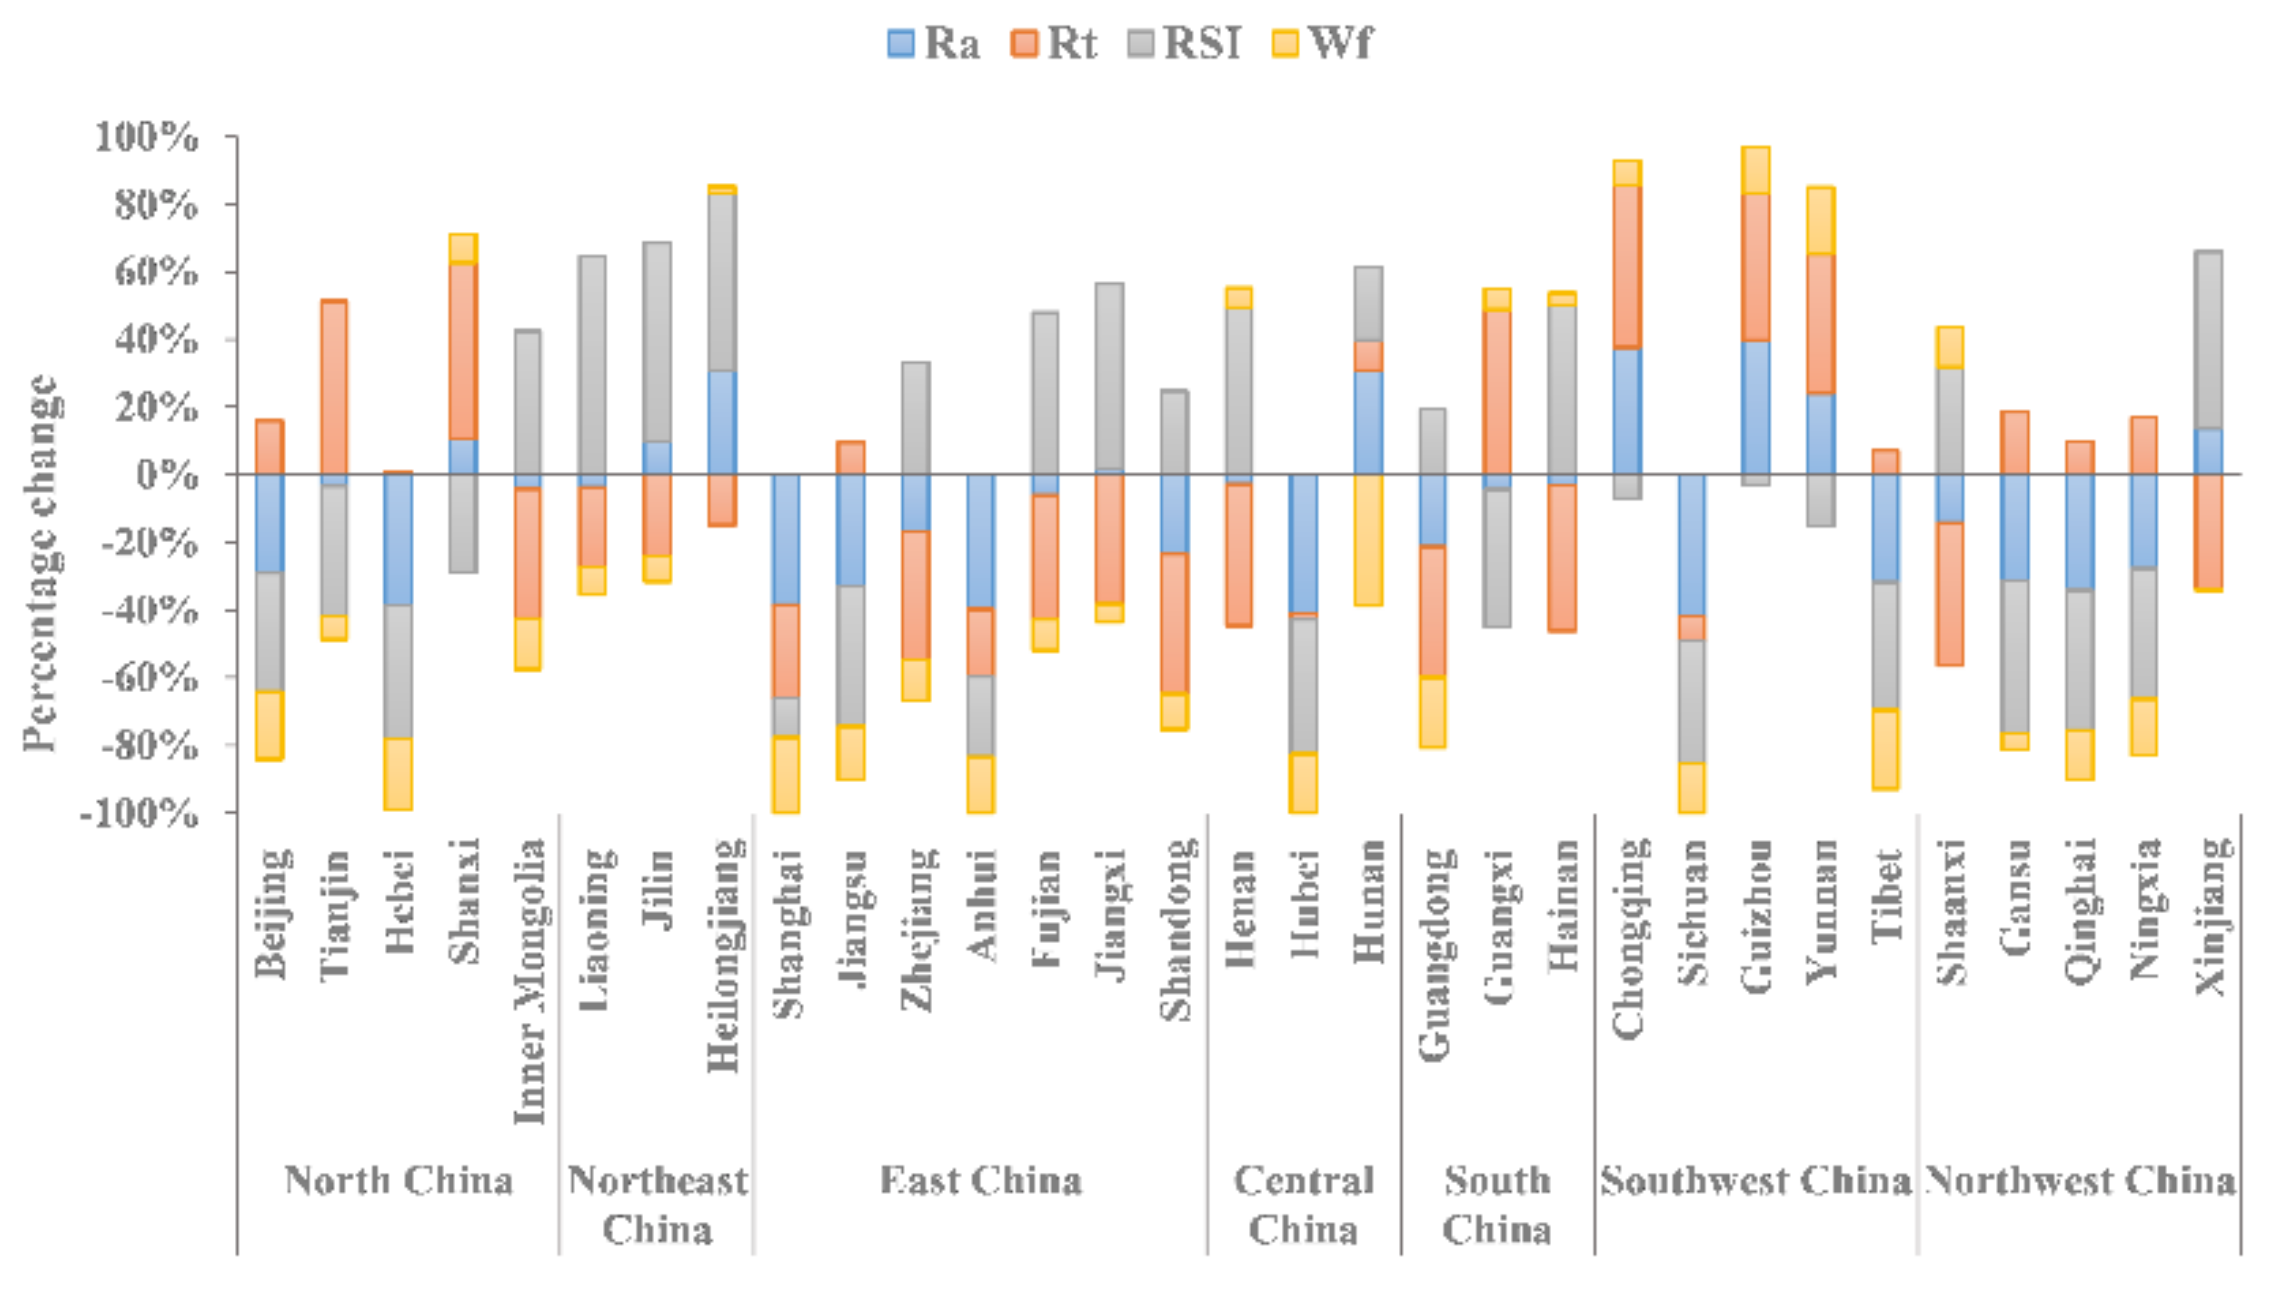
To further understand the temporal variation characteristics of AWLR matching, we analyzed the temporal variation trends of Wf, Ra, Rt and RSI in different provinces of China from 2010 to 2017.
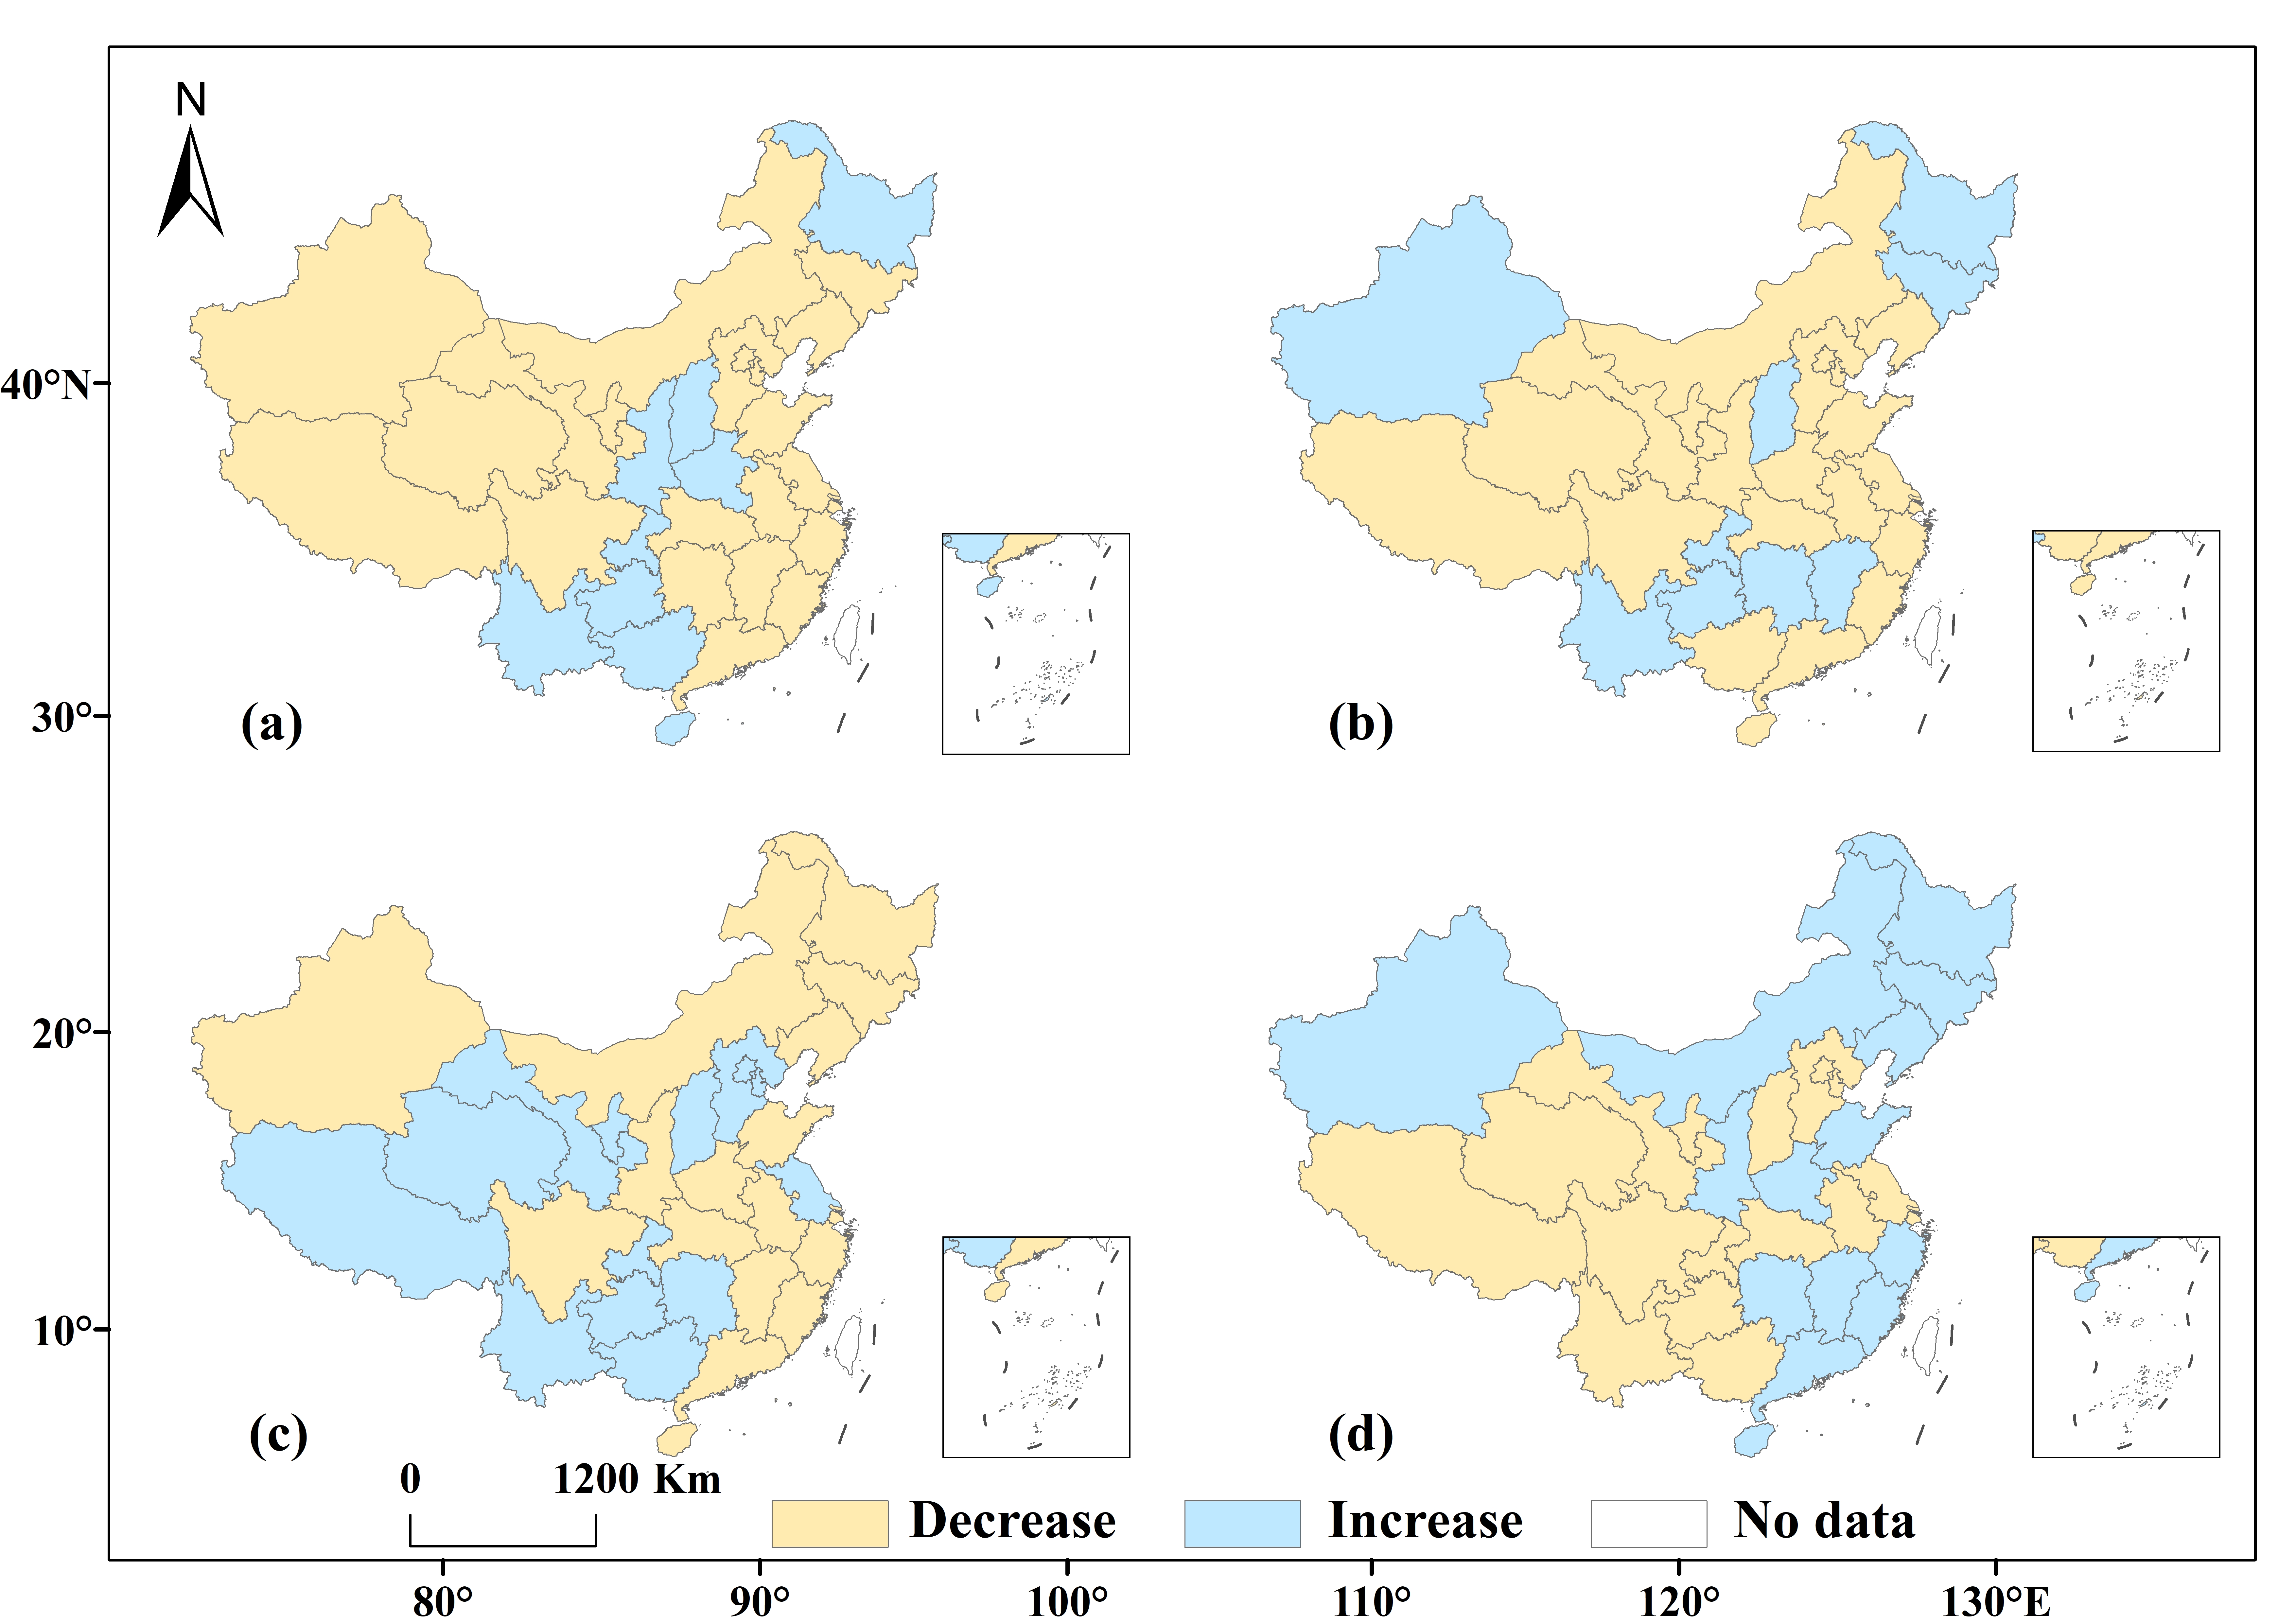
In terms of provincial distribution (Figure 8), Provinces with rising Wf are Heilongjiang, Shanxi, Shaanxi, Henan, Chongqing, Guizhou, Guangxi, Yunnan and Hainan, which were mostly located along the line of northeast–southwest. The increase of Wf means that the matching degree of AWLR has been improved. Ra showed a downward trend in other provinces except Xinjiang, Heilongjiang, Jilin, Shanxi, Yunnan, Guizhou, Chongqing, Hunan and Jiangxi. In Heilongjiang, Jilin, Yunnan, Guizhou, Chongqing and Jiangxi, Ra was originally at a low value, but now presents an upward trend, indicating that irrigation water consumption per unit of cultivated land was increased every year to relieve the water pressure of cultivated land. The rise and fall of Rt correspond to the increase or decrease of precipitation in various provinces, especially in Gansu, Ningxia, Shanxi, Beijing, Tianjin and Hebei, which means that the drought situation has been alleviated, which is conducive to the development of arid agriculture. Water resources are scarce in regions with RSI > 1, and cultivated land resources are scarce in regions with RSI < 1. Therefore, in Xinjiang, Inner Mongolia and Shandong, where water resources are scarce, the rise of RSI means the aggravation of water resources scarcity; in Jiangsu, Fujian, Jiangxi and Hunan, where cultivated land resources are scarce, the rise of RSI means the increase of cultivated land resources. In Yunnan, Guizhou, Chongqing, Sichuan and other provinces with scarce cultivated land resources, the decrease of RSI means the aggravation of the scarcity of cultivated land resources; in Tibet, Qinghai, Gansu, Ningxia, Hebei and other regions with scarce water resources, the decrease of RSI means the increase of water resources.
In terms of distribution in seven regions (Figure 9), Wf in all regions showed a downward trend, indicating that the AWLR matching in all regions showed a trend of deterioration, with the decreasing amplitude being as follows: Northeast (12.1%), North China (10.1%), East China (7.9%), Northwest China (4.9%), Central China (4.2%), Southwest China (0.8%), South China (0.1%). Ra showed an increasing trend in Northeast China and Southwest China, which were 11.0% and 1.8%, respectively. In other regions, Ra decreased in the following order: Northwest China (12.9%), North China (12.7%), East China (12.5%), Central China (11.5%), South China (3.4%). Rt increased in the following order: North China (18.6%), Southwest China (12.8%), Northwest China (2.2%), South China (0.1%); Rt decreased in the following order: Northeast China (41.6%), East China (21.1%), Central China (7.4%). RSI increased in the following order: Northeast China (113.2%), East China (14.3%), South China (0.9%); RSI decreased in the following order: North China (22.0%), Northwest China (12.7%), Southwest China (10.4%), Central China (2.5%).
Based on the time variation trend of Wf, Ra, Rt and RSI, it can be found that AWLR matching is deteriorating in almost all regions, so we should pay attention to reasonable planning and management of agricultural water and land resources. In Northwest China and the main grain production base in Northeast China, where water resources are severely scarce, Ra should be increased to meet the water demand of grain production due to the decrease of Rt. Since the proportion of green water in regions with higher RSI is generally lower, the utilization rate of green water should be improved, rational utilization of blue and green water to better realize agricultural water resources management.
4. Discussion
4.1. Implications for Agricultural Water Management in Different Regions
Proper management of water resources is an important means of ensuring food production. However, through the above research, it was found that there were some problems of unreasonable allocation of water resources in different regions of China. For example, water resources are seriously scarce in Northwest and North China, water resource per unit area was lower and less than 100 mm in most areas, such as Xin-jiang, Qinghai, Gansu and Ningxia, while water resources are abundant in South and Southwest China. Therefore, it was importance to improve water resources management to minimize the gap between regions and to ensure that regions with higher demand have enough water. Different suggestions were put forward for different regions. In regions where water resources are scarce, water condition was the main factor limiting agricultural production. Therefore, it is recommended to develop water-saving agriculture and increase investment in agricultural and water conservancy infrastructure, and further increase the combined use of groundwater and canal water to minimize irrigation-related problems in agroecosystems [44]. In salinized areas, we should pay attention to improving irrigation efficiency and practicing dry farming, so as to reduce irrigation water intake, improve the quality of salinized soil and conserve water resources. In North China, where groundwater was over-exploited, unconventional water resources (containing brine, treated wastewater and sewage) can be used as an alternative solution to partially meet the agricultural water demand in the region, and this method has been successfully applied to agriculture [45]. Rainwater harvesting was also considered an effective way to relieve pressure on groundwater [46]. In addition, the government should further implement water diversion plans to reduce agricultural water pressure in the North China Plain and Northeast China. In the regions with the most abundant water resources, irrigation areas should be expanded, irrigation equipment increased and irrigation efficiency improved, thus increasing grain yield and water productivity [47].
From the perspective of the water–food–land relationship, food production not only depends on the matching degree of the water–land relationship in agriculture, but also depends on the efficiency of water use, especially the efficiency of green water use. However, according to the results of blue and green water allocation (Figure 3), although precipitation is abundant in Southeast China, the proportion of green water does not show a high value, and is even lower than that in Southwest, Central and Northeast China. It shows that the green water in Southeast China is not being used effectively and adequately. Having abundant water resources has led to the arbitrary and unrestricted use of water and thus, a large amount of water resources are wasted; in contrast, the utilization efficiency of water resources in North China is high due to the limited water therein, which is consistent with the conclusion of He et al. [48]. Therefore, Southeast and South China should reduce the dependence on irrigation water (blue water), and strengthen the use of precipitation (green water), so as to achieve rational allocation and utilization of water resources.
4.2. Effects of Climate on Agriculture Water Use
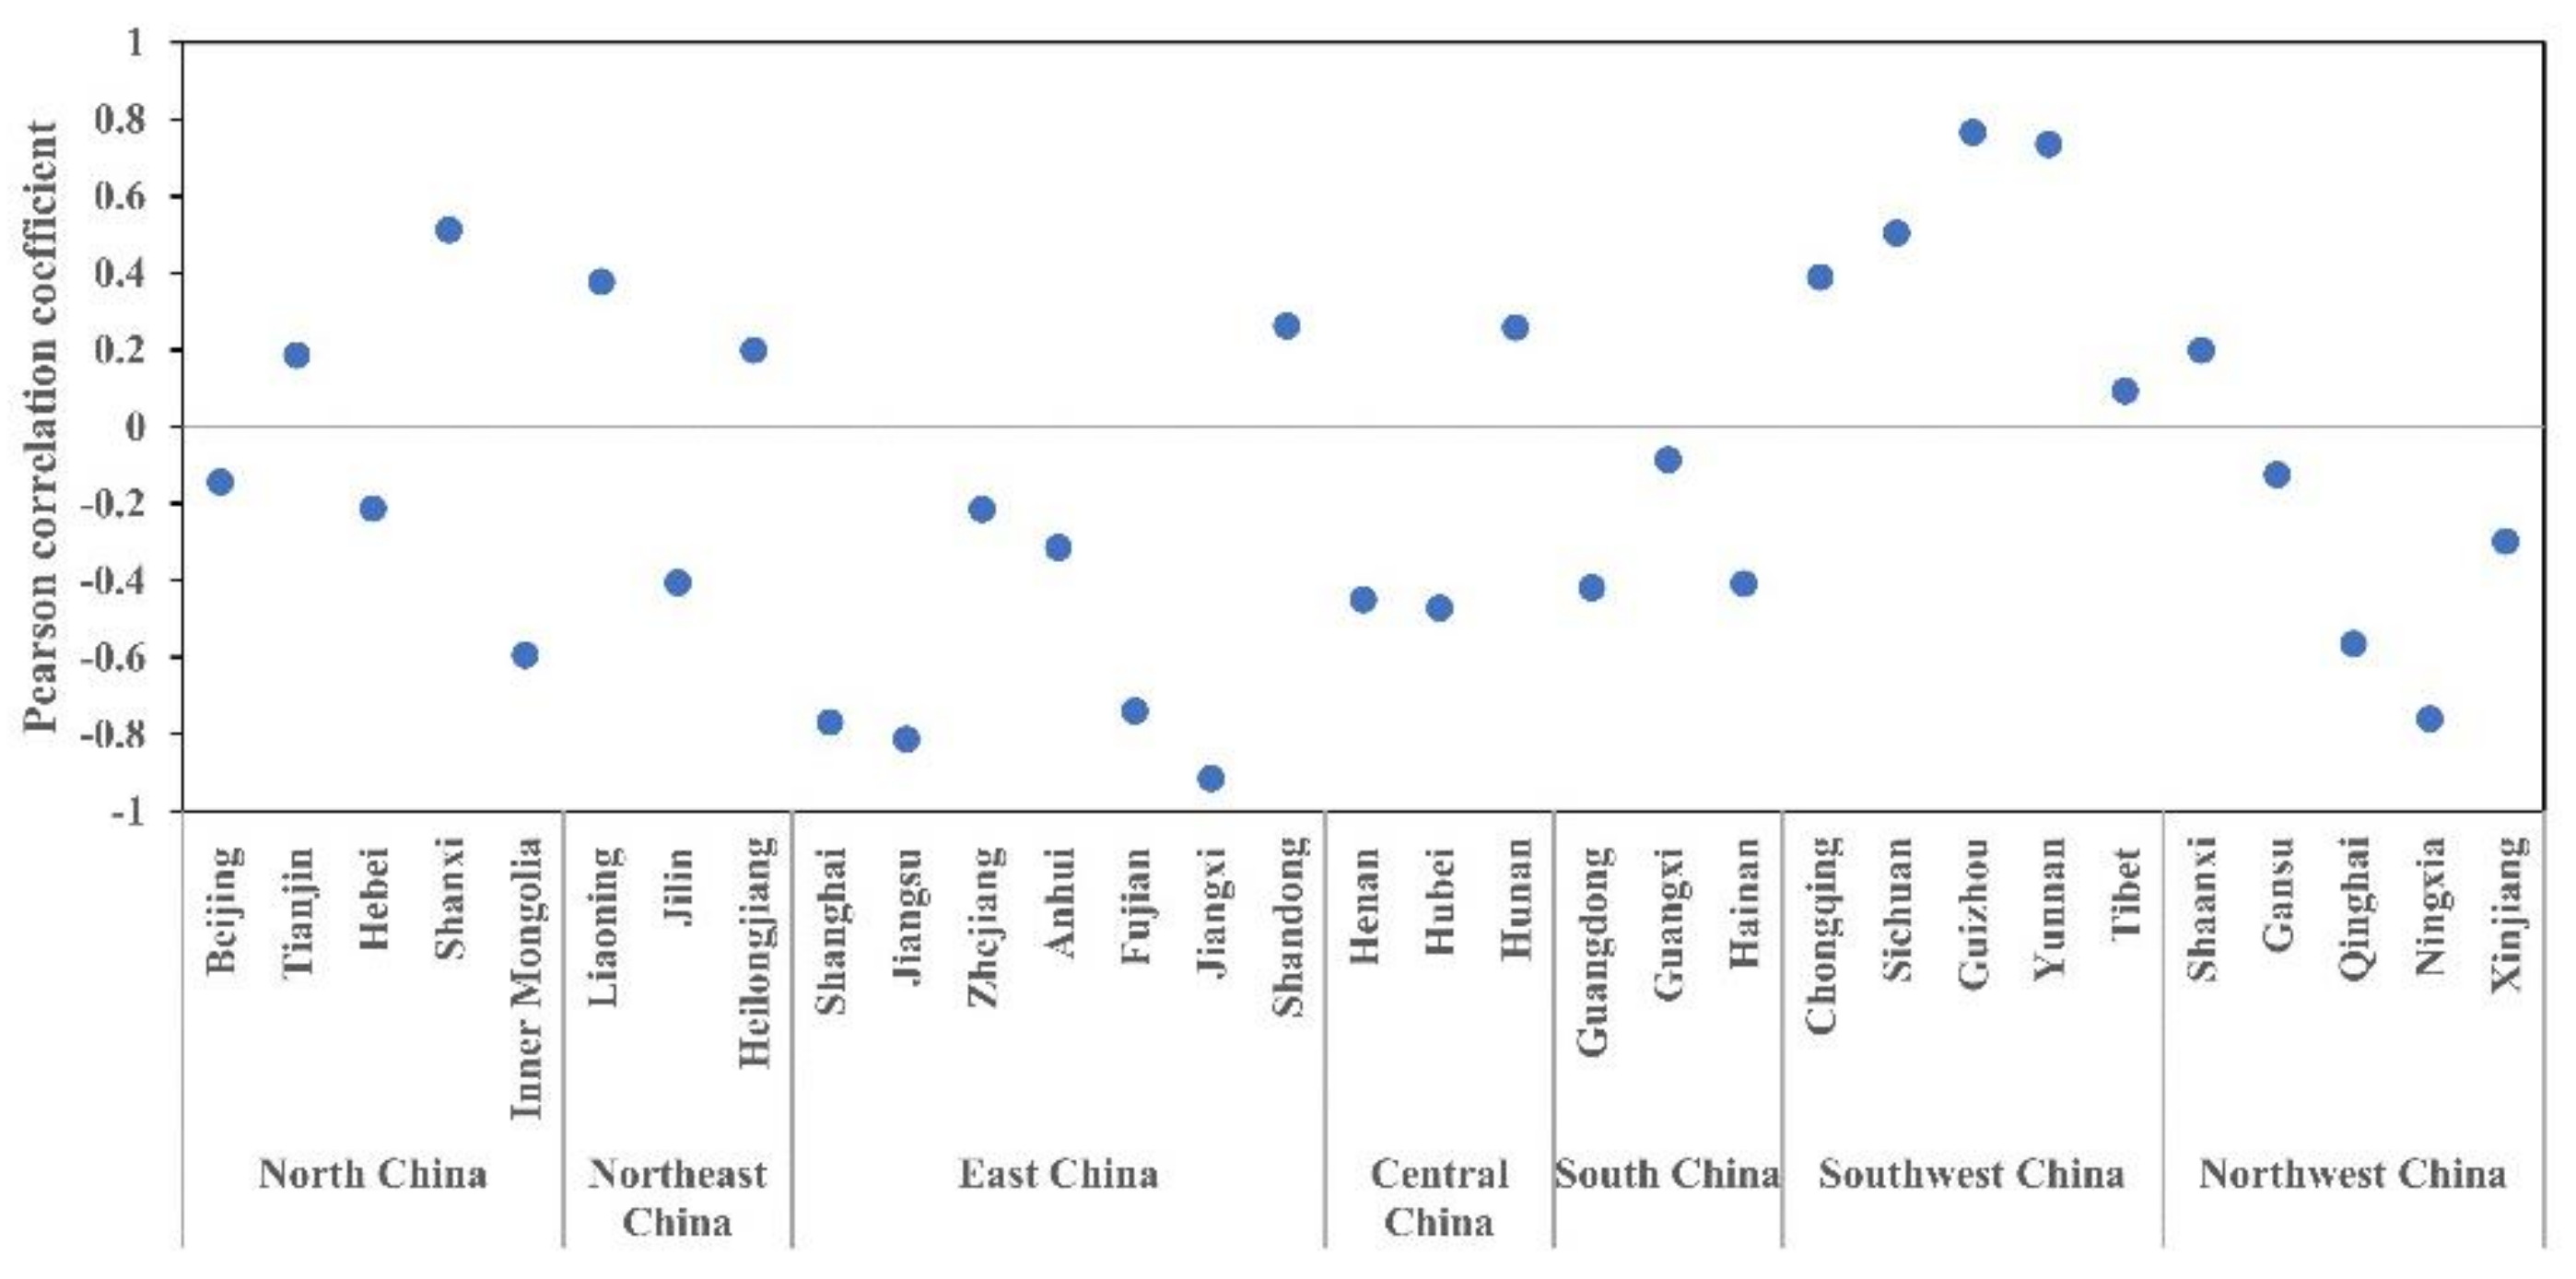
Climate change has an important effect on agricultural water use. Climate change generally exacerbates multiple threats to water resources by influencing the pattern, intensity, amount, timing and form of precipitation, thus affecting the value of agricultural water availability [49]. From the previous analysis, there was a good consistency between precipitation and the matching degree of AWLR (Wf). This indicates that precipitation had a great impact on agricultural water (including blue water and green water). The increase of precipitation can not only bring better AWLR matching, but also lead to the increase of blue water utilization due to the supply of water resources. On the contrary, the decrease of precipitation will make agriculture face the pressure of water shortage, thus threatening food production. However, the effect of precipitation on agricultural water use varied with regions (Figure 10). For example, there was a negative correlation between them in East China, South China and Northwest China, while precipitation showed a positive role in Southwest China, which was more related to the agricultural water use mode. In Southwest China, flood irrigation resulted in more agricultural water use. It is thus necessary to upgrade the water-saving irrigation technology, in order to save water and expand the irrigation scale of water resources.
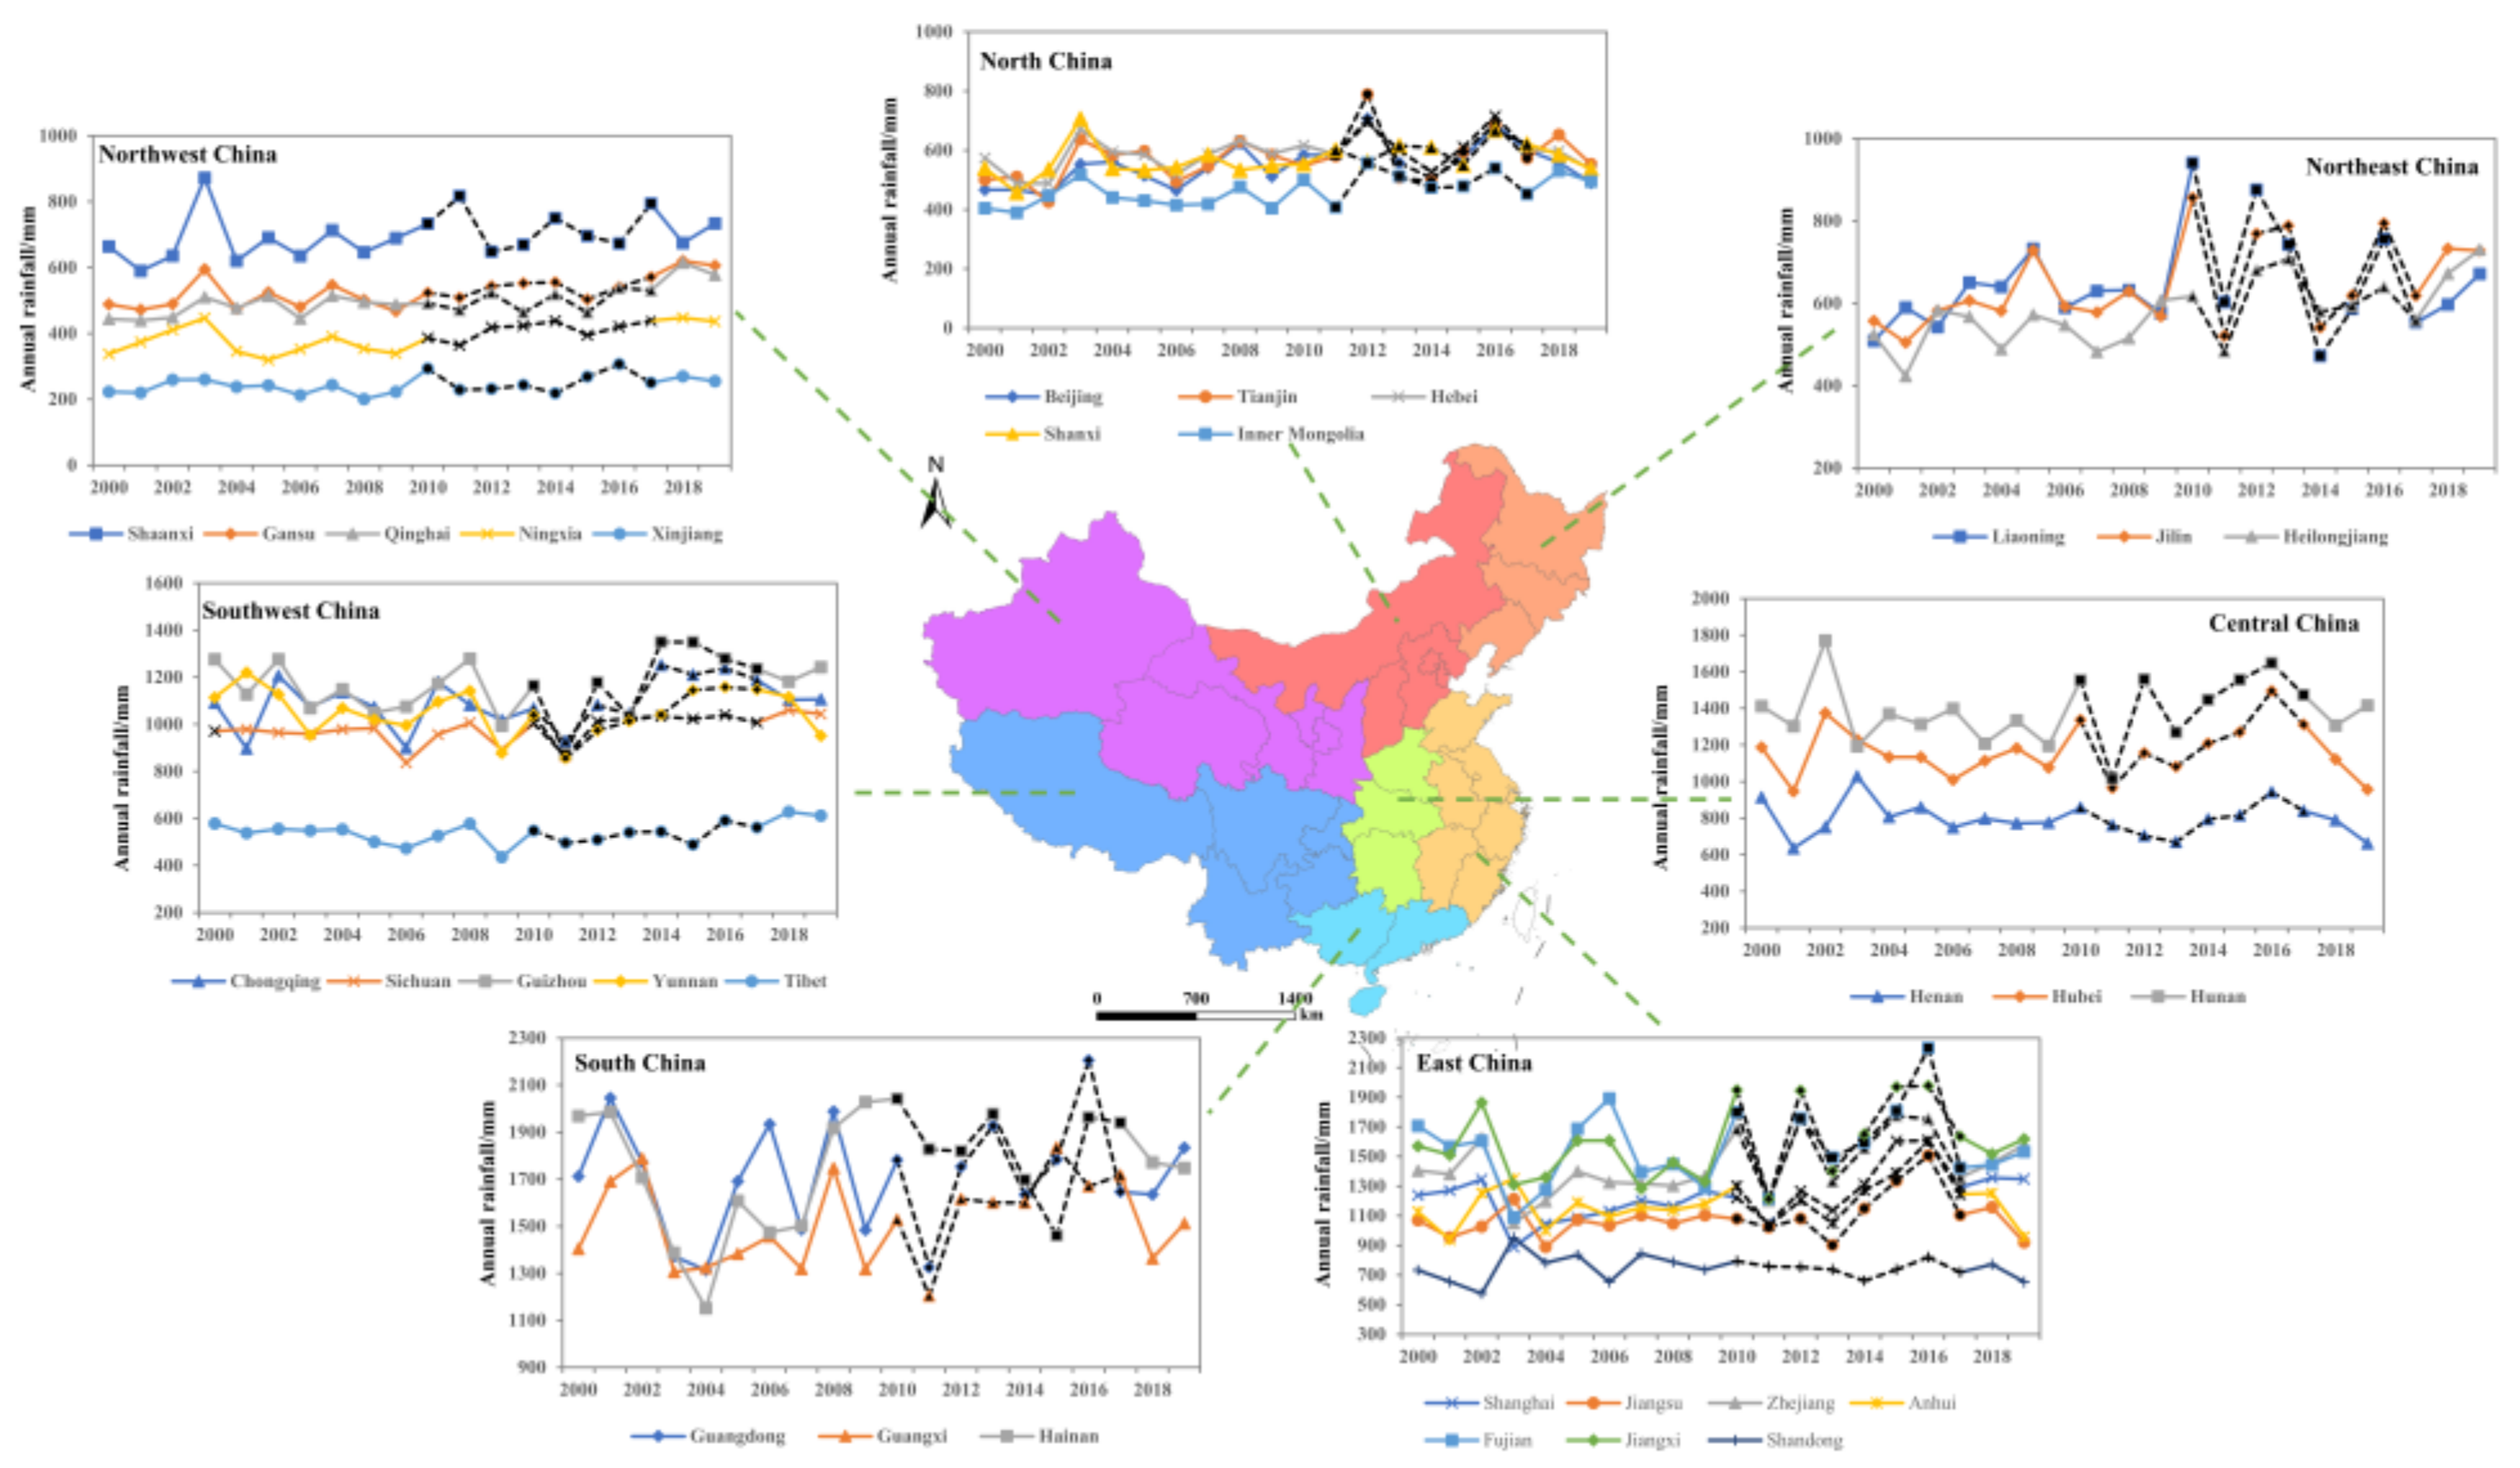
Besides, the annual precipitation exhibited a large inter-annual variation in the years analyzed (2010–2017) (Figure 11), which was also why we used the average value of muti-year data for our analysis. To better understand the trend of precipitation changes in the years analyzed, we extended the annual precipitation data for 2000–2019, in which it can be found that the inter-annual variation of precipitation in East and South China with more annual precipitation was larger than that in North China and Northwest China with less annual precipitation, which was consistent with the conclusion of Jin et al. [50]. As global climate change affected the redistribution of global precipitation, including significant changes in precipitation trend and its spatiotemporal differentiation, as well as shifts in frequency, intensity and duration of extreme precipitation [51], it may lead to frequent drought and flood disasters and threaten agricultural production. Therefore, water resources can be used effectively through the construction of reservoirs, so as to further improve the distribution of agricultural water resources in the dry and wet period.
5. Conclusions
In this paper, blue and green water were integrated to identify matching characteristics of AWLR, and a holistic index based (RSI) on REA was developed to understand the AWLR scarcity situation in China. The combination of the evaluation on the matching and scarcity of AWLR offers a robust methodology for the assessment and identification of resource scarcity. The matching of AWLR was not exactly consistent with precipitation, but to water use and environmental integrity. The matching of AWLR was the lowest in Northeast China, North China and Gansu in Northwest China, while the highest value was in Xinjiang due to the higher blue water use.
The higher values of RSI were found in west and north China, whereas the lower values of RSI mainly distributed in the south China. Several major divisions in China were highlighted and identified according to the severity of resource scarcity. Northwest China is a region with severe water shortage; Southwest China bears problems with farmland resources scarcity. Besides, the proportion of green water is generally low in South China, which is below 50%, while it is basically above 80% in Southwest China. Therefore, it is important to develop water-saving irrigation in Northwest China, while it is necessary to reasonably improve water conservancy facilities to ensure the stability of agriculture water use and avoid the potential threats from climate change. Above all, it is a basic premise to take full advantage of green water, but improving and ensuring blue water supply is essential.
Author Contributions
Conceptualization, Q.G.; methodology, Q.G.; formal analysis, Q.G. and H.L.; data curation, H.L.; writing—original draft preparation, Q.G. and H.L.; writing—review and editing, Q.G., X.H. and Z.T. All authors have read and agreed to the published version of the manuscript.
Funding
This work was supported by the National Natural Science Foundation of China (No. 41801085), The Second Tibetan Plateau Scientific Expedition and Research (STEP) program (No. 2019QZKK0106), Natural Science Foundation of Henan Project (No. 212300410292) and Scientific Research Starting Foundation for Young Teachers of Zhengzhou University.
Data Availability Statement
The data used in this study are available in 2.2 Data Sources of this Article.
Conflicts of Interest
The authors declare no conflict of interest.
Appendix A
Figure A1.
Spatial distribution of annual precipitation in China.

References
- Liu, Y.S.; Zhou, Y. Reflections on China’s food security and land use policy under rapid urbanization. Land Use Policy 2021, 109, 105699. [Google Scholar] [CrossRef]
- Yang, G.Y.; Wang, L.; Wang, H. Thinking of food security in China based on regional water resources and land cultivation. Trans. Chin. Soc. Agric. Eng. 2010, 26, 1–5. [Google Scholar]
- Zhang, Y.; Lei, G.P.; Zhang, H.Q.; Lin, J. Spatiotemporal dynamics of land and water resources matching of cultivated land use based on micro scale in Naoli River Basin. Trans. Chin. Soc. Agric. Eng. 2019, 35, 185–194. [Google Scholar]
- Yu, D.; Hu, S.G.; Tong, L.Y.; Xia, C. Spatiotemporal Dynamics of Cultivated Land and Its Influences on Grain Production Potential in Hunan Province, China. Land 2020, 9, 510. [Google Scholar] [CrossRef]
- Zarei, S.; Bozorg-Haddad, O.; Singh, V.P. Developing water, energy, and food sustainability performance indicators for agricultural systems. Sci. Rep. 2021, 11, 22831. [Google Scholar] [CrossRef]
- Yang, G.Y.; Li, S.Y.; Wang, H.; Wang, L. Study on agricultural cultivation development layout based on the matching characteristic of water and land resources in North China Plain. Agric. Water Manag. 2022, 259, 107272. [Google Scholar] [CrossRef]
- Liu, D.; Liu, C.L.; Fu, Q.; Li, M.; Faiz, M.A.; Khan, M.I.; Li, T.X.; Cui, S. Construction and application of a refined index for measuring the regional matching characteristics between water and land resources. Ecol. Indic. 2018, 91, 203–211. [Google Scholar] [CrossRef]
- Du, J.; Yang, Z.H.; Wang, H.; Yang, G.Y.; Li, S.Y. Spatial-Temporal Matching Characteristics between Agricultural Water and Land Resources in Ningxia, Northwest China. Water 2019, 11, 1460. [Google Scholar] [CrossRef] [Green Version]
- FAO. The State of Food and Agriculture; FAO: Rome, Italy, 2020. [Google Scholar]
- Li, T.T.; Long, H.L.; Zhang, Y.N.; Tu, S.S.; Ge, D.Z.; Li, Y.R.; Hu, B.Q. Analysis of the spatial mismatch of grain production and farmland resources in China based on the potential crop rotation system. Land Use Policy 2017, 60, 26–36. [Google Scholar] [CrossRef]
- Yao, L.M.; Li, Y.L.; Chen, X.D. A robust water-food-land nexus optimization model for sustainable agricultural development in the Yangtze River Basin. Agric. Water Manag. 2021, 256, 107103. [Google Scholar] [CrossRef]
- Sun, Z.; Jia, S.F.; Yan, J.B.; Zhu, W.B.; Liang, Y. Study on the Matching Pattern of Water and Potential Arable Land Resources in China. J. Nat. Resour. 2018, 33, 2057–2066. [Google Scholar]
- Manandhar, S.; Pandey, V.P.; Kazama, F. Application of water poverty index (WPI) in Nepalese context: A case study of Kali Gandaki River Basin (KGRB). Water Resour. Manag. 2012, 26, 89–107. [Google Scholar] [CrossRef]
- Tao, G.F.; Jiang, Z.H.; Qin, L.J. Analysis of balance between water and land resources in Tonghua region using Gini coefficient. Chin. J. Agric. Resour. Reg. Plan. 2012, 33, 67–71. [Google Scholar]
- Li, W.J.; Xu, W.Q.; Bao, A.M.; Lyu, Y. Analysis of cultivated land change and water-land matching characteristics in Amu Darya River Basin. Water Resour Prot. 2021, 37, 80–86, 107. [Google Scholar]
- Druckman, A.; Jackson, T. Measuring resource inequalities: The concepts and methodology for an area-based Gini coefficient. Ecol. Econ. 2008, 65, 242–252. [Google Scholar] [CrossRef] [Green Version]
- Yitzhaki, S. Relative deprivation and the Gini coefficient. Q. J. Econ. 1980, 93, 321–324. [Google Scholar] [CrossRef]
- Chen, C.N.; Tsaur, T.W.; Rhai, T.S. The Gini coefficient and negative income. Oxf. Econ. Pap. 1982, 34, 473–478. [Google Scholar] [CrossRef]
- Geng, Q.L.; Ren, Q.F.; Nolan, R.H.; Wu, P.T.; Yu, Q. Assessing China’s agricultural water use efficiency in a green-blue water perspective: A study based on data envelopment analysis. Ecol. Indic. 2019, 96, 329–335. [Google Scholar] [CrossRef]
- Nan, J.Q.; Wang, J.L.; Qin, A.Z.; Liu, Z.D.; Ning, D.F.; Zhao, B. Study on Utilization Potential of Agricultural Soil and Water Resources’ in Northwest Arid Area. J. Nat. Resour. 2017, 32, 292–300. [Google Scholar]
- Aldaya, M.M.; Hoekstra, A.Y.; Allan, J.A. Strategic importance of green water in international crop trade. Ecol. Econ. 2010, 69, 887–894. [Google Scholar] [CrossRef] [Green Version]
- Oki, T. Global hydrological cycles and world water resources. Oyo Buturi 2011, 80, 862–867. [Google Scholar] [CrossRef] [Green Version]
- Feng, C.; Mao, D.H.; Yang, L.; Zhou, H.; Hu, G.W. Research progress and commentary of green water resources. Chin. J. Agric. Resour. Reg. Plan. 2020, 41, 173–184. [Google Scholar]
- Cao, X.C.; Shao, G.C.; Wang, X.J.; Wang, Z.C.; He, X.; Yang, C.Y. Generalized water efficiency and strategic implications for food security and water management: A case study of grain production in China. Adv. Water Sci. 2017, 28, 14–21. [Google Scholar]
- Zang, C.F.; Liu, J.; van der Velde, M.; Kraxner, F. Assessment of spatial and temporal patterns of green and blue water flows under natural conditions in inland river basins in Northwest China. Hydrol. Earth Syst. Sci. 2012, 16, 2859–2870. [Google Scholar] [CrossRef] [Green Version]
- Cole, S. Environmental Compensation Using Resource Equivalency Analysis (REA) and Habitat Equivalency Analysis (HEA): Is It Just for the Birds? Master’s Thesis, Sveriges Lantbruksuniv, Umeå, Switzerland, 2010. [Google Scholar]
- Guinée, J.B.; Heijungs, R. A proposal for the definition of resource equivalency factors for use in product life-cycle assessment. Environ. Toxicol. Chem. 1995, 14, 917–925. [Google Scholar] [CrossRef]
- Li, J.M.; Li, Y.C. International research and application of habitat and resource equivalency analyses. Resour. Sci. 2019, 41, 2059–2070. [Google Scholar] [CrossRef]
- Duffield, J.; Neher, C.; Patterson, D. Estimating compensation ratios for tribal resources within a habitat equivalency framework. Ecol. Econ. 2021, 179, 106862. [Google Scholar] [CrossRef]
- Pavanelli, D.D.; Voulvoulis, N. Habitat Equivalency Analysis, a framework for forensic cost evaluation of environmental damage. Ecosyst. Serv. 2019, 38, 100953. [Google Scholar] [CrossRef]
- Li, J.M.; Hou, H.Z.; Yao, H.Y.; Wang, X.L. Marine biological damage assessment of oil spill based on resources equivalency analysis. Acta Ecol. Sin. 2014, 34, 3762–3770. [Google Scholar]
- Hoekstra, A.Y. Green-blue water accounting in a soil water balance. Adv. Water Resour. 2019, 129, 112–117. [Google Scholar] [CrossRef]
- Quinteiro, P.; Rafael, S.; Villanueva-Rey, P.; Ridoutt, B.; Lopes, M.; Arroja, L.; Dias, A.C. A characterisation model to address the environmental impact of green water flows for water scarcity footprints. Sci. Total Environ. 2018, 626, 1210–1218. [Google Scholar] [CrossRef] [PubMed]
- Schyns, J.F.; Hoekstra, A.Y.; Booij, M.J.; Hogeboom, R.J.; Mekonnen, M.M. Limits to the world’s green water resources for food, feed, fiber, timber, and bioenergy. Proc. Natl. Acad. Sci. USA 2019, 116, 4893–4898. [Google Scholar] [CrossRef] [PubMed] [Green Version]
- Shang, K.H.; Zhuo, L.; Yang, X.; Yue, Z.W.; Zhao, D.Y.; Wu, P.T. Emergy analysis of the blue and green water resources in crop production systems. J. Clean. Prod. 2021, 319, 128666. [Google Scholar] [CrossRef]
- Ma, W.J.; Wei, F.L.; Zhang, J.P.; Karthe, D.; Opp, C. Green water appropriation of the cropland ecosystem in China. Sci. Total Environ. 2019, 806, 150597. [Google Scholar] [CrossRef]
- FAO. CROPWAT, a Computer Program for Irrigation Planning and Management. In Irrigation and Drainage Paper 46; Smith, M., Ed.; FAO: Rome, Italy, 1992. [Google Scholar]
- Chapagain, A.K.; Orr, S. An improved water footprint methodology linking global consumption to local water resources: A case of Spanish tomatoes. J. Environ. Manag. 2009, 90, 1219–1228. [Google Scholar] [CrossRef]
- Zafonte, M.; Hampton, S. Exploring welfare implications of resource equivalency analysis in natural resource damage assessments. Ecol. Econ. 2007, 61, 134–145. [Google Scholar] [CrossRef]
- Desvousges, W.H.; Gard, N.; Michael, H.J.; Chance, A.D. Habitat and Resource Equivalency Analysis: A Critical Assessment. Ecol. Econ. 2018, 143, 74–89. [Google Scholar] [CrossRef]
- Dunford, R.W.; Ginn, T.C.; Desvousges, W.H. The use of habitat equivalency analysis in natural resource damage assessments. Ecol. Econ. 2004, 48, 49–70. [Google Scholar] [CrossRef]
- Mo, X.G.; Liu, S.X.; Lin, Z.H.; Guo, R.P. Regional crop yield, water consumption and water use efficiency and their responses to climate change in the North China Plain. Agric. Ecosyst. Environ. 2009, 134, 67–78. [Google Scholar] [CrossRef]
- Fan, M.S.; Shen, J.B.; Yuan, L.X.; Jiang, R.F.; Chen, X.P.; Davies, W.J.; Zhang, F.S. Improving crop productivity and resource use efficiency to ensure food security and environmental quality in China. J. Exp. Bot. 2012, 63, 13–24. [Google Scholar] [CrossRef] [PubMed]
- Singh, A. Judicious and optimal use of water and land resources for long-term agricultural sustainability. Resour. Conserv. Recycl. Adv. 2022, 13, 200067. [Google Scholar] [CrossRef]
- Hussain, M.I.; Muscolo, A.; Farooq, M.; Ahmad, W. Sustainable use and management of non-conventional water resources for rehabilitation of marginal lands in arid and semiarid environments. Agric. Water Manag. 2019, 221, 462–476. [Google Scholar] [CrossRef]
- Richards, S.; Rao, L.; Connelly, S.; Raj, A.; Raveendran, L.; Shirin, S.; Jamwal, P.; Helliwell, R. Sustainable water resources through harvesting rainwater and the effectiveness of a low-cost water treatment. J. Environ. Manag. 2021, 286, 112223. [Google Scholar] [CrossRef] [PubMed]
- Cao, X.C.; Wang, Y.B.; Wu, P.; Zhao, X.N.; Wang, J. An evaluation of the water utilization and grain production of irrigated and rain-fed croplands in China. Sci. Total Environ. 2015, 529, 10–20. [Google Scholar] [CrossRef] [PubMed]
- He, G.H.; Zhao, Y.; Wang, L.Z.; Jiang, S.; Zhu, Y.N. China’s food security challenge: Effects of food habit changes on requirements for arable land and water. J. Clean. Prod. 2019, 229, 739–750. [Google Scholar] [CrossRef]
- Li, M.; Cao, X.X.; Liu, D.; Fu, Q.; Li, T.X.; Shang, R.C. Sustainable management of agricultural water and land resources under changing climate and socio-economic conditions: A multi-dimensional optimization approach. Agric. Water Manag. 2022, 259, 107235. [Google Scholar] [CrossRef]
- Jin, H.Y.; Chen, X.H.; Wu, P.; Song, C.; Xia, W.J. Evaluation of spatial-temporal distribution of precipitation in mainland China by statistic and clustering methods. Atmos. Res. 2021, 262, 105772. [Google Scholar] [CrossRef]
- Wang, X.L.; Hou, X.Y.; Zhao, Y.J. Changes in consecutive dry/wet days and their relationships with local and remote climate drivers in the coastal area of China. Atmos. Res. 2021, 247, 105138. [Google Scholar] [CrossRef]
Figure 1.
The analytical framework and pathways producing results.

Figure 2.
Distribution characteristics of province-based AWLR matching in China (a); The proportion of blue and green water in agricultural water resources from 31 provinces in China (b).
Figure 2.
Distribution characteristics of province-based AWLR matching in China (a); The proportion of blue and green water in agricultural water resources from 31 provinces in China (b).

Figure 3.
The proportion of agricultural water use and cultivated land area in different regions of China.
Figure 3.
The proportion of agricultural water use and cultivated land area in different regions of China.

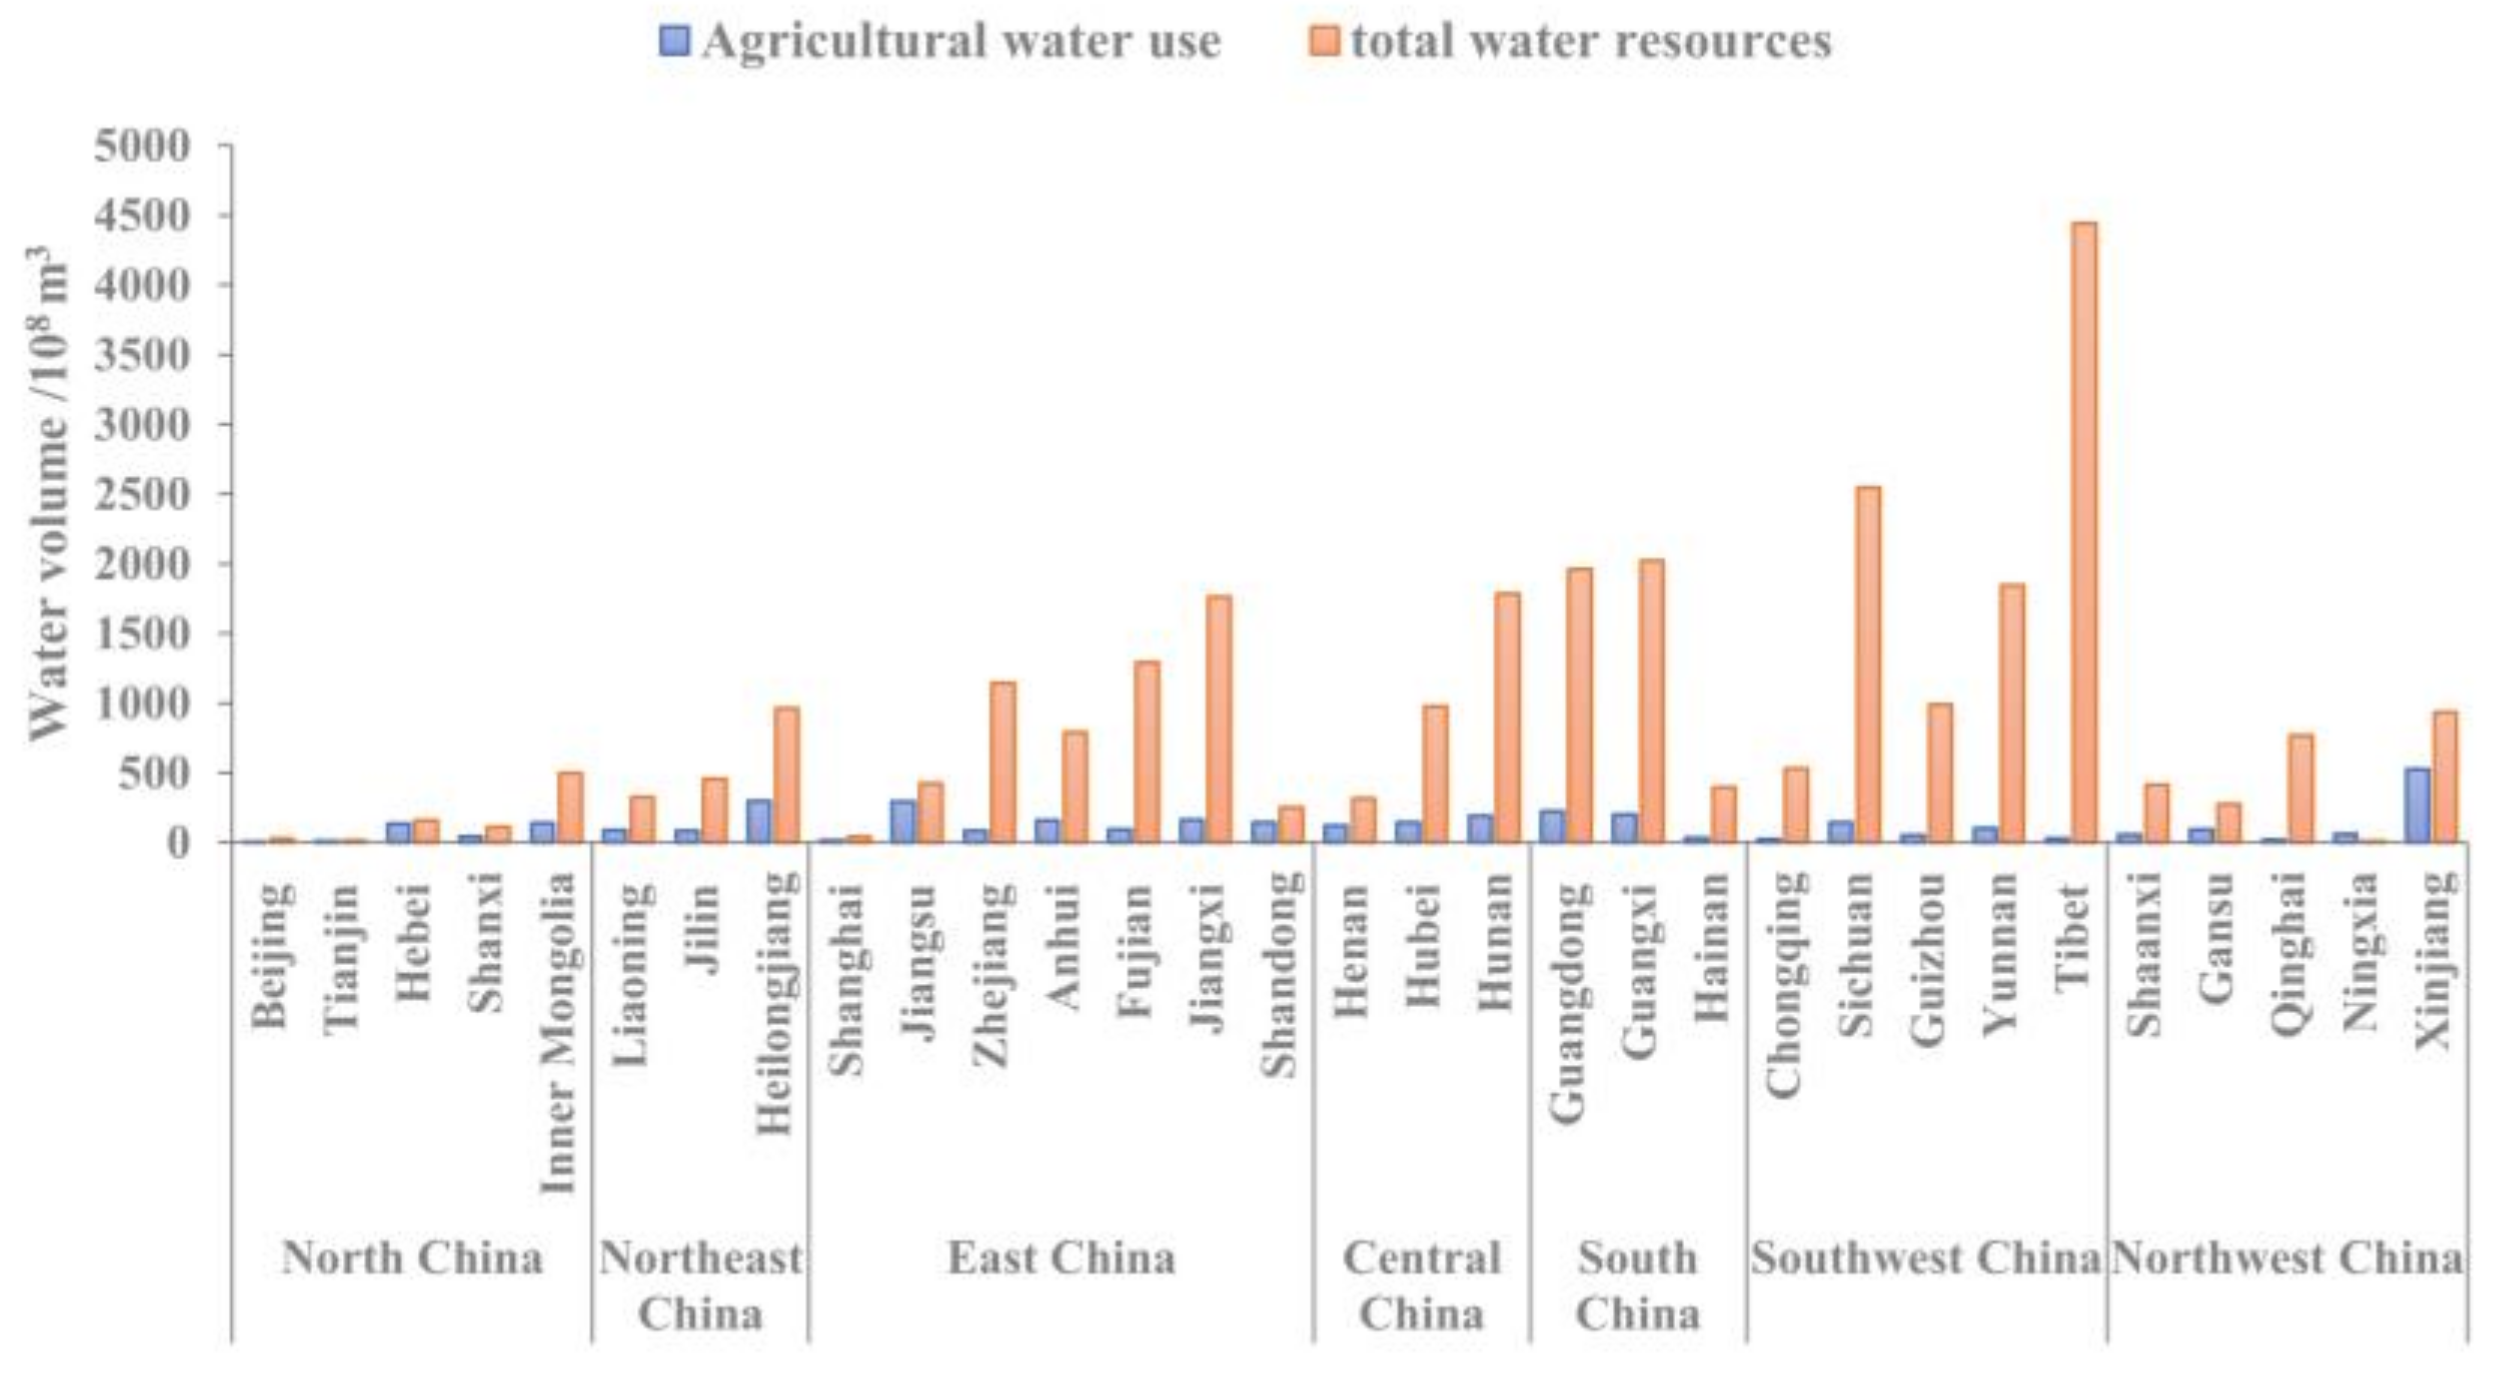
Figure 4.
Agricultural water use and total water resources in different regions of China.

Figure 5.
Spatial characteristics of allocation proportion of WLR in China (a); Distribution characteristics of agricultural blue water per unit cultivated land in China (b).
Figure 5.
Spatial characteristics of allocation proportion of WLR in China (a); Distribution characteristics of agricultural blue water per unit cultivated land in China (b).

Figure 6.
The basic division of AWLR scarcity situation in China.

Figure 7.
Spatial characteristics of scarcity situation of AWLR in China.

Figure 8.
Trends of province-based AWLR in China. Change of Wf from 2010–2017 (a); Change of Ra from 2010–2017 (b); Change of Rt from 2010–2017 (c); Change of RSI from 2010–2017 (d).
Figure 8.
Trends of province-based AWLR in China. Change of Wf from 2010–2017 (a); Change of Ra from 2010–2017 (b); Change of Rt from 2010–2017 (c); Change of RSI from 2010–2017 (d).

Figure 9.
Regional changes of Wf, Ra, Rt, RSI in China.

Figure 10.
Correlation analysis between precipitation and agricultural water use from 2010 to 2017.

Figure 11.
Trends of precipitation from 2000 to 2019; the dashed lines show precipitation changes from 2010 to 2017.
Figure 11.
Trends of precipitation from 2000 to 2019; the dashed lines show precipitation changes from 2010 to 2017.


Table 1.
Classes of scarcity index of AWLR in China (It is difficult to reach an absolute balance. Here, the equilibrium level which is above 90% between Rt and Ra was considered as the balanced state).
Table 1.
Classes of scarcity index of AWLR in China (It is difficult to reach an absolute balance. Here, the equilibrium level which is above 90% between Rt and Ra was considered as the balanced state).
| Balanced Levels | Land Deficiency | Relative Balance | Water Scarcity | ||||
|---|---|---|---|---|---|---|---|
| Severe | Moderate | Slight | Slight | Moderate | Severe | ||
| <50% | 50–75% | 75–90% | >90% | 75–90% | 50–75% | <50% | |
| RSI | <0.5 | 0.5~0.75 | 0.75~0.9 | 0.9~1.1 | 1.1~1.25 | 1.25~1.5 | >1.5 |
Publisher’s Note: MDPI stays neutral with regard to jurisdictional claims in published maps and institutional affiliations. |
© 2022 by the authors. Licensee MDPI, Basel, Switzerland. This article is an open access article distributed under the terms and conditions of the Creative Commons Attribution (CC BY) license (https://creativecommons.org/licenses/by/4.0/).
Share and Cite
MDPI and ACS Style
Geng, Q.; Liu, H.; He, X.; Tian, Z. Integrating Blue and Green Water to Identify Matching Characteristics of Agricultural Water and Land Resources in China. Water 2022, 14, 685. https://doi.org/10.3390/w14050685
AMA Style
Geng Q, Liu H, He X, Tian Z. Integrating Blue and Green Water to Identify Matching Characteristics of Agricultural Water and Land Resources in China. Water. 2022; 14(5):685. https://doi.org/10.3390/w14050685
Chicago/Turabian StyleGeng, Qingling, Hongling Liu, Xiaohui He, and Zhihui Tian. 2022. "Integrating Blue and Green Water to Identify Matching Characteristics of Agricultural Water and Land Resources in China" Water 14, no. 5: 685. https://doi.org/10.3390/w14050685
Note that from the first issue of 2016, this journal uses article numbers instead of page numbers. See further details here.