
Agricultural Water Utilization Efficiency in China: Evaluation, Spatial Differences, and Related Factors


1
College of Geography and Environment, Shandong Normal University, Jinan 250358, China
2
Collaborative Innovation Center of Human-Nature and Green Development in Universities of Shandong, Shandong Normal University, Jinan 250358, China
*
Author to whom correspondence should be addressed.
Water 2022, 14(5), 684; https://doi.org/10.3390/w14050684
Submission received: 15 December 2021
/
Revised: 15 February 2022
/
Accepted: 18 February 2022
/
Published: 22 February 2022
(This article belongs to the Special Issue Optimal Utilization and Management of Natural Resources)
Abstract
:Agricultural water utilization efficiency (AWUE) reflects the rational utilization of water resources in agricultural production. Improving AWUE is important for both improving the levels of agricultural production and reducing consumption of water resources, and it is significant to explore the spatial differences between different cities and regions and the various factors related to AWUE, both theoretically and practically. The AWUE of totally 281 cities at the prefecture level or above in China between 2003 and 2018 was evaluated using the super-efficiency slacks-based measure (SBM). The spatial differences in AWUE were simulated by exploratory spatial data analysis (ESDA), and the various factors affecting AWUE were simulated using the graphical statistical tool, Geodetector. The results of this study are as follows: (1) The mean value of AWUE across the country was merely 0.23 when it registered a record high in 2018, indicating that the AWUE in China was low; (2) AWUE showed significant spatial differences judging from the results of ESDA, and the low-low type was the principal spatial type, which was distributed mainly in the North China Plain and the Loess Plateau; and (3) agricultural technology was the main factor affecting AWUE.
1. Introduction
China is a developing country that has long faced many issues about water resources, such as water shortages, flood and drought, water pollution, and sustainable water ecology. The shortage of water resources in China has become a serious restrictive factor for sustainable development [1,2,3]. Agriculture accounts for 70% of China’s total water consumption [4,5,6]. The bottleneck constraint of water shortages on China’s agricultural production is becoming more prominent, whereas its mode of agricultural water use is relatively extensive, and the effective utilization coefficient of farmland irrigation is only 0.50, which is far below the level of 0.7–0.8 that pertains in advanced agricultural economies [7]. The high consumption and low efficiency lead to the overexploitation of water and soil resources and the low efficiency of agricultural production [8]. Global climate change will have a serious impact on agricultural water use in the coming decades, threatening the production and lives of rural populations, as well as the food security of urban populations, and severely impacting the vulnerable rural poor [9]. It is, therefore, necessary to optimize the utilization of agricultural water resources in order to maintain China’s water and food security.
Agricultural water utilization efficiency (AWUE) refers to the economic and social benefits that accrue from using unit water resources [10,11] and reflects the input-output relationship of those resources [12,13]. Improvements of AWUE mean greater economic output from fewer water resources and less pollution to the water environment by increased economic growth [14,15]. Improving AWUE helps to increase agricultural economic benefits and use water resources more effectively, thereby reducing pollution to the water environment by agricultural production. AWUE is an important topic in academic research and a practical problem that should concern many government departments and social organizations. Analyzing the spatial differences between different cities and regions as well as the factors affecting AWUE will provide a reference for the efficient management of agricultural water resources and the formulation and implementation of appropriate management policies.
In previous studies, different regions have been selected as the research objects to evaluate AWUE, and the spatial differences between various regions and the factors affecting AWUE have been further analyzed based on the results of the studies.
- (1)
- AWUE of counties and cities. Liu et al. [16] evaluated the AWUE of Zhangye City in northwestern China and concluded that improving AWUE could drive economic growth. Tan and Zhang [17] investigated the AWUE of Minqin County, also in northwestern China, and pointed out that planting vegetables there could improve its AWUE.
- (2)
- AWUE of provinces. Feng et al. [18] evaluated the AWUE in 81 counties of Gansu Province and divided the province into four agricultural water utilization regions: highest-value region, higher-value region, mid-value region, and low-value region. Zhang and Zhu [19] examined the AWUE of 13 prefecture-level cities in Heilongjiang Province and analyzed its regional differences and influencing factors. Song et al. [20] investigated the AWUE of 14 administrative regions in Xinjiang Uygur Autonomous Region, China, and demonstrated the highest AWUE in Hami and the lowest one in Kashgar.
- (3)
- AWUE of river basins. Wang et al. [21,22] examined the AWUE in counties of the Heihe River Basin and found that AWUE was low in the study area and that agricultural investment, economic growth, industrial structure, and planting structure had a significant impact on AWUE. Wei et al. [23] evaluated the AWUE in nine provinces of the Yellow River Basin and concluded that AWUE was highest in the lower reaches and lowest in the upper reaches of the river. The level of economic development and the water resource endowment conditions had a positive impact on AWUE.
- (4)
- AWUE across China. Wang et al. [24] evaluated the provincial-level AWUE in China and discovered that it was affected mainly by farmers’ incomes and education levels. Cao et al. [25] concluded that there were great differences between the AWUEs of different provinces and crop productions in China. Huang et al. [26] revealed that the AWUE was generally low across China and it was higher in coastal areas than in inland arid and semi-arid areas.
Existing studies have looked at agricultural production practice drawing on the theories and methods from economics, ecology, environmental science, resource science, and other disciplines, and have explored how to better evaluate AWUE by virtue of MATLAB, Stata, and other software packages. Four different methods have been used.
- (1)
- Ratio analysis. This is a simple and practical method for comparing agricultural output and water consumption. This method is applicable when the volume of water consumed is relatively easy to obtain and quantify, the objects to be evaluated are homogeneous, and the evaluation indicators constructed are comparable. The indicators employed in this method include water consumption per unit of gross domestic product (GDP), water consumption per unit of agricultural output, and water consumption per unit of irrigation area [27,28]. As these indicators are not inclusive, ratio analysis may not help find the factors restricting the development of resource potential.
- (2)
- Indicator system evaluation. This method adopts appropriate evaluation indicators based on the research objective and the correlation between indicators to form an orderly and comprehensive indicator system for evaluating AWUE. Song et al. [24] and Zhang et al. [29,30] applied this method to evaluate the AWUE in different regions. However, the intersection and correlation between indicators are often inevitable when using this method, thus affecting the objectivity of the evaluation results.
- (3)
- Water footprint. This is the volume of water required by the products and services consumed by a known population over a known period of time, which reflects the interaction between human activities and water resources [31]. Hai et al., Cao et al., and Fu et al. [32,33,34] adopted this method to investigate the AWUE of different research objects. Nevertheless, this method is inherently problematic, which is evidenced by its inability to reflect the impacts on the environment, inaccurate virtual water accounting, and its failure to consider the self-purification capacity of natural ecosystems.
- (4)
- Data envelopment analysis (DEA). This is a method used to evaluate the effectiveness of a decision-making unit (DMU) by a mathematical programming method that observes effective sample data. Using this method, some relative results can be obtained, and it can also be used for a comparison between departments of the same type or the same department over different time periods. Geng et al., Liao et al., and Ding et al. [35,36,37] employed this method in their studies. Because this method only pays attention to the expected outputs of economic activities and ignores the unexpected outputs, the results may deviate from the real situation. Thus, stochastic frontier analysis (SFA), the slacks-based measure (SBM), and the super-efficiency SBM were developed as alternative solutions in several studies [38,39,40,41,42].
The objects used to evaluate AWUE in existing studies include prefecture-level cities, counties, provinces, regions, and the entire country, which can inform policy-making for the management and use of agricultural water resources at different scales. Provinces have been taken as the basic units in research at the national scale, and their spatial differences and influencing factors of AWUE have been analyzed. Due to the large spatial scope of the provinces, the research results cannot reflect the spatial differences in AWUE more objectively and in detail. Prefecture-level cities are one level lower than the provinces in China’s system of administrative divisions, and their spatial scope is therefore much smaller than that of the provinces [43]. No scholars have attempted prefecture-level cities as the basic research unit to explore the overall AWUE across China. Hence, this paper attempts to evaluate the AWUE of 281 Chinese cities at the prefecture-level or above between 2003 and 2018 by the super-efficiency SBM based on unexpected output, analyze the spatial differences in AWUE by exploratory spatial data analysis (ESDA), and explore the factors affecting AWUE using the graphical statistical tool, Geodetector.
2. Data and Methods
2.1. Data
This paper draws on the experience of Chen et al.’s study [44] and uses the input, expected output, and unexpected output indicators to evaluate AWUE. The input indicators include the investment in water resources and agricultural machinery, which is closely related to water resource utilization and agricultural production. In addition, all cities at the prefecture level or above in China have complete data in terms of the two indicators, thereby ensuring the consistency and integrity of the statistical data. The added value of the primary industry is used to indicate expected output because the ultimate purpose of agricultural production that consumes water resources is to improve the value of agricultural output. Agricultural sewage discharge is employed as an indicator for unexpected output, namely, an undesirable outcome for agricultural production, economic development, and the lives of residents. All data on input, expected output, and unexpected output were obtained from China’s economic and social big data research platform [45]. Table 1 is the descriptive statistics of the indicators.
2.2. Methods
2.2.1. Super-Efficiency SBM
The DEA model, a traditional method to calculate efficiency, can neither effectively address the relaxation of variables, nor can it accurately measure the efficiency value when there is unexpected output. Tone [46] proposed the SBM based on unexpected output, which can effectively overcome the shortages of relaxation and unexpected output of the DEA model. However, the SBM still cannot effectively distinguish the evaluation units from efficiency values of 1, thus making it difficult to further identify the difference of each unit’s efficiency value. Therefore, Tone [47] proposed the super-efficiency SBM model, which combines the advantages of super-efficiency DEA and SBM, and can effectively distinguish the evaluation units located at the frontier (efficiency value > 1). In this paper, super-efficiency SBM was used to evaluate AWUE. Each city at the prefecture level or above was regarded as a DMU. It was assumed that each DMU has m kinds of inputs which are expressed as . It can produce n kinds of expected outputs which are expressed as . It can produce k kinds of unexpected outputs which are expressed as . represents the collection of different variables. The input and output values of city j in year t are expressed as (). The production possibility set of AWUE is expressed as:
Based on the production possibility set, the super-efficiency SBM incorporating unexpected output is expressed as:
The variables , , and represent the slack variables of input, expected output, and unexpected output, respectively; represents the weighted vector of input, expected output, and unexpected output; the variables , , and represent the values of input, expected output, and unexpected output in city j; the variables , , and represent the total values of input, expected output, and unexpected output in cities, respectively; and represents the efficiency value of DMU, that is the AWUE to be measured. The higher the value of , the higher the AWUE.
2.2.2. ESDA
ESDA uses statistical principles, graphics, and charts to analyze the data related to spatial information in order to determine the spatial distribution pattern governing the data and reveal the spatial dependence and heterogeneity of the data [48]. Spatial autocorrelation analysis is the core content of ESDA, which refers to the correlation between the observed data for a variable at different spatial locations.
Two spatial autocorrelation coefficients were used to identify the spatial differences in AWUE in cities at the prefecture-level or above in China. The first coefficient was global Moran’s I, which was used to measure the spatial distribution characteristics of AWUE in the whole study area. The second coefficient was local Moran’s I, which was used to determine the degree of correlation of AWUE between adjacent subregions. The spatial distributions of cold spots and hot spots can be identified by combining these factors with a Moran’s scatter map and a Lisa aggregation map, and the spatial pattern of local differences can be visualized with Geographical Information System (GIS). The formulas for calculating global Moran’s I and local Moran’s I are as follows:
The variable n represents the number of cities at the prefecture-level or above; and represent the AWUEs of cities i and j; is the mean value of AWUE in all the cities being studied; and represents the spatial weight matrix between cities i and j and is calculated using the distance function.
2.2.3. Geodetector
Geodetector is a graphical statistical tool developed by Wang and Xu [49] to detect the spatial differentiation between different indicators and the driving factors behind it, including factor detector, risk detector, ecological detector, and interaction detector. Because traditional statistical methods are based on numerous assumptions, which Geodetector does not employ, this tool can overcome the limitations of statistical methods in dealing with variables. Therefore, Geodetector has been widely used to explore the mechanisms underlying socioeconomic factors and natural environmental factors [50]. The core idea behind a factor detector is a comparison to determine whether a change in a factor and the research object have significant consistency in space. If there is consistency, it means that this factor has a decisive significance for the research object. The formula for calculating it is as follows:
The variable represents the explanatory power of one factor for AWUE [51]; D represents the factor affecting AWUE; n is the number of cities at the prefecture-level or above; represents the variance of cities at the prefecture-level or above; m is the number of categories of a factor; and refers to the number of factor D about category i. The value of ranges from 0 to 1. The larger the value, the stronger the explanatory power of the factor for AWUE.
3. Results
3.1. Evaluation of AWUE
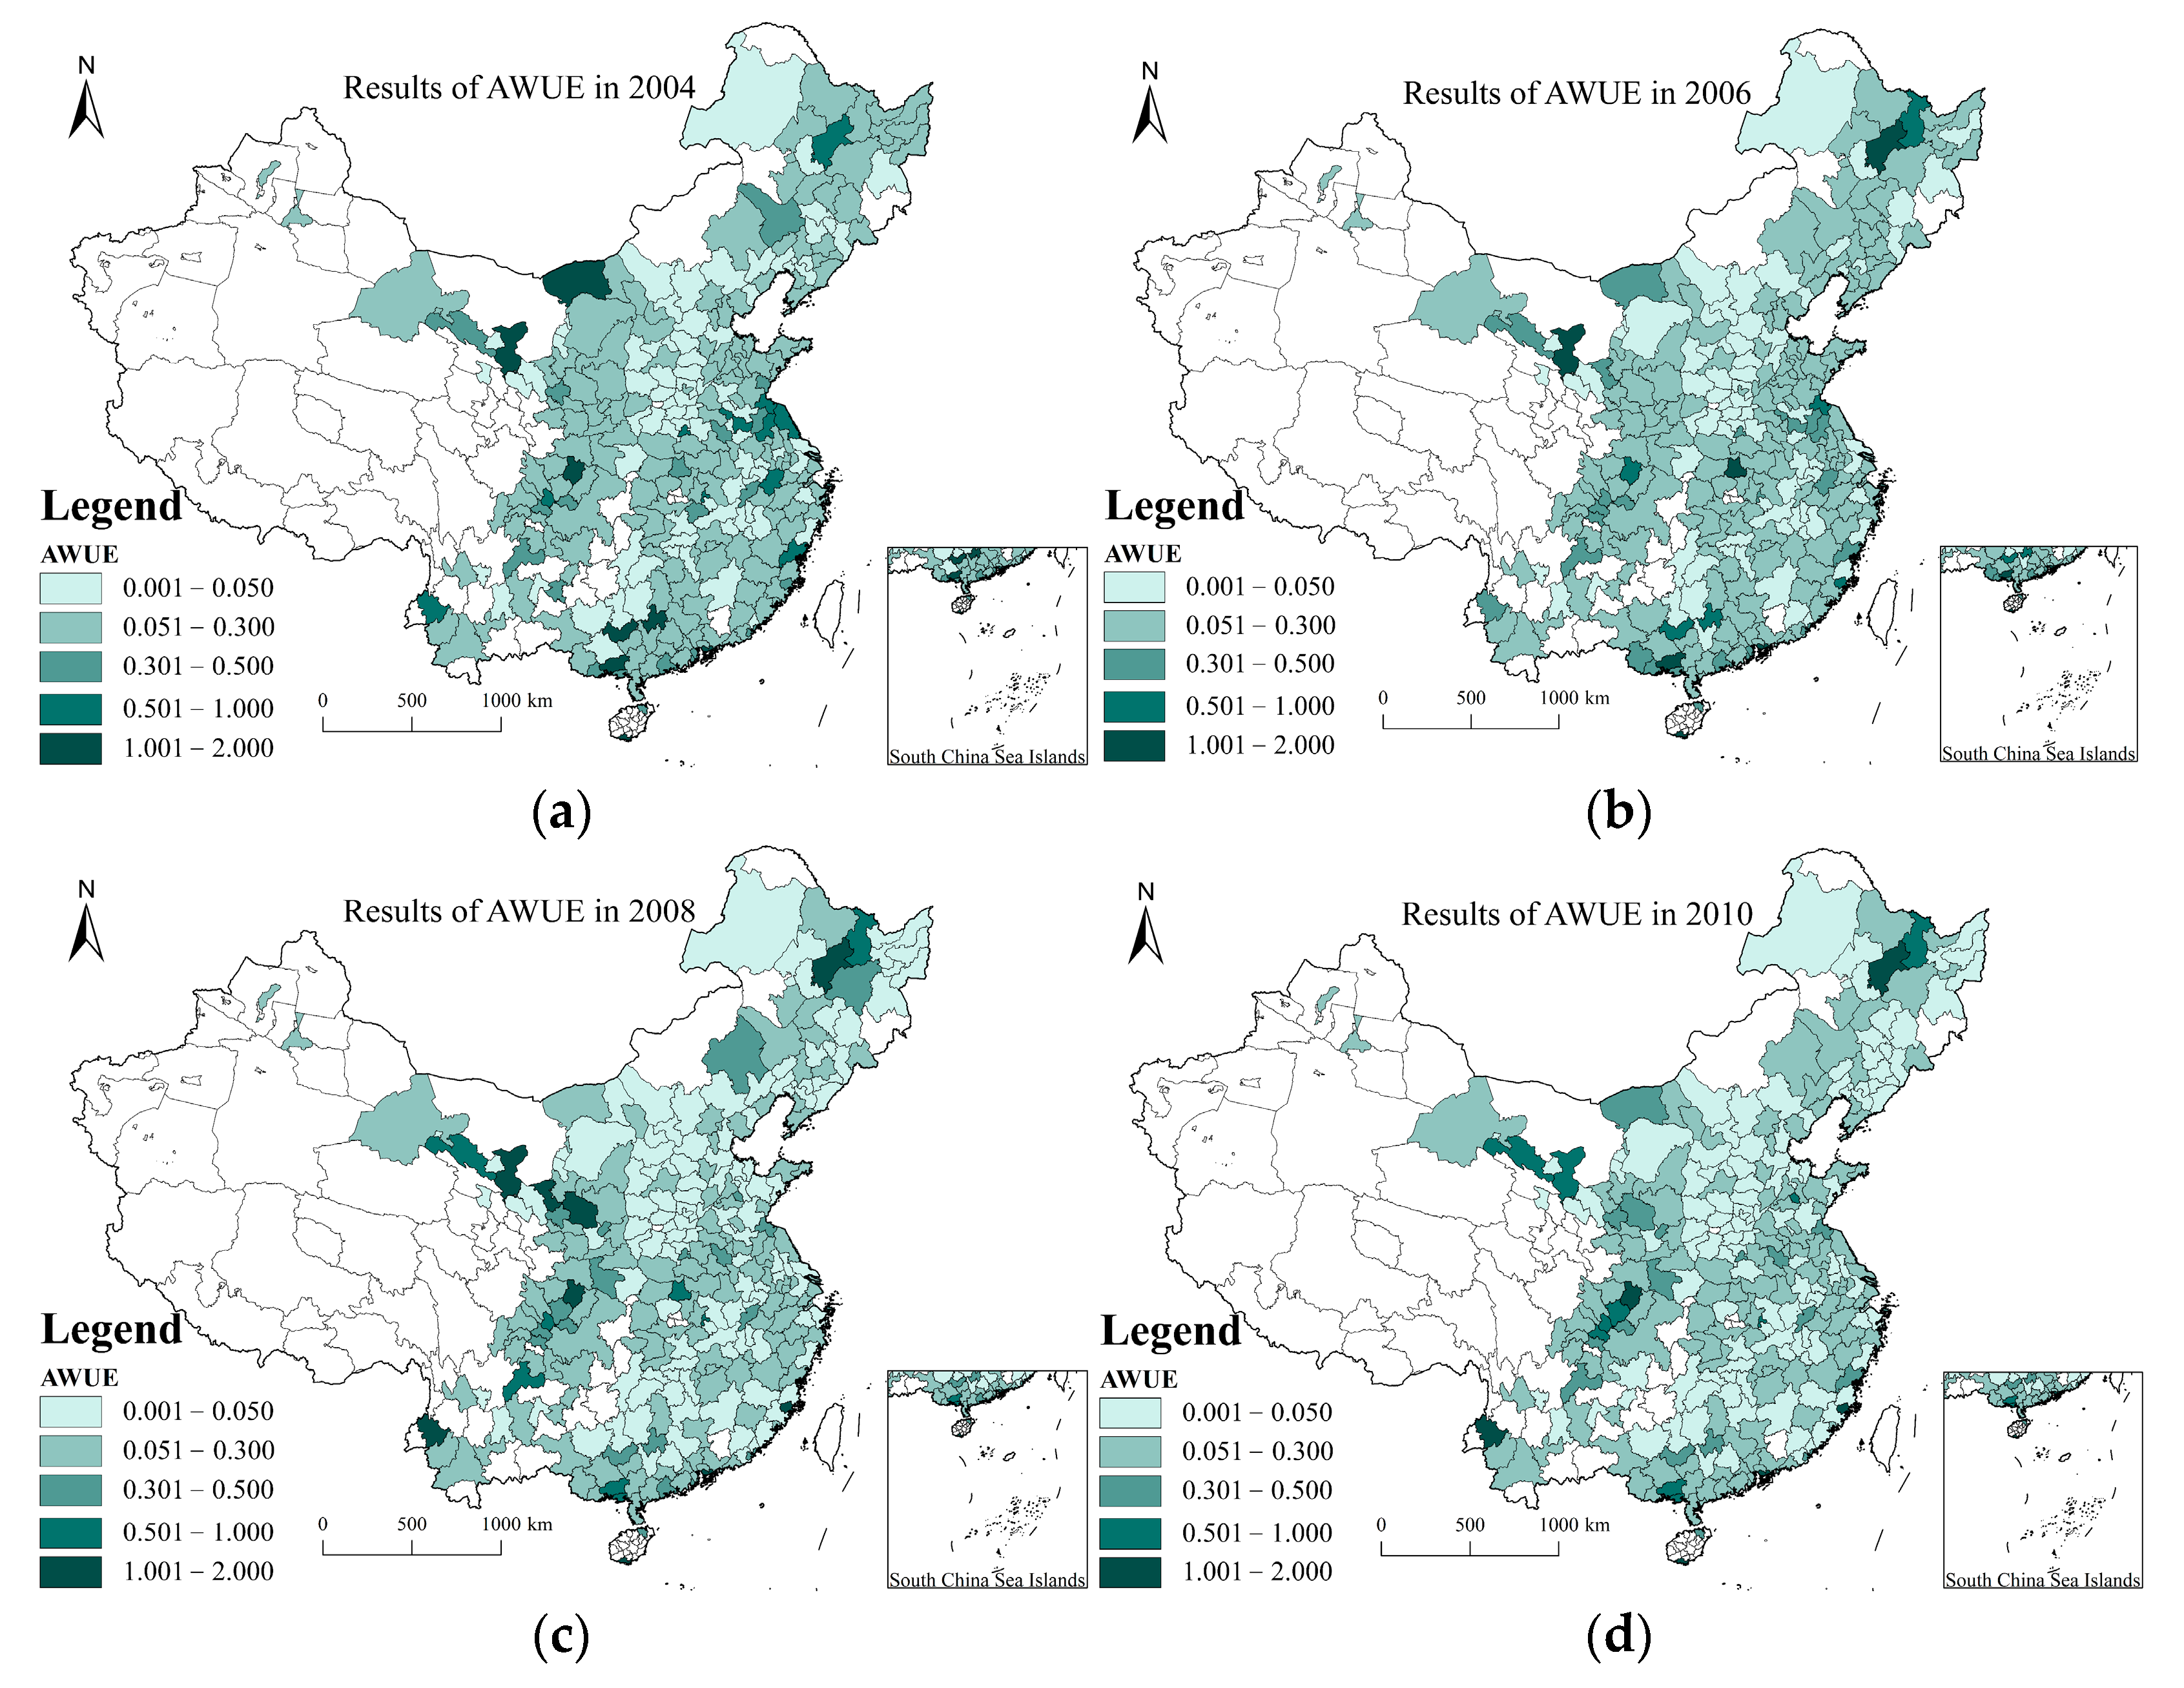
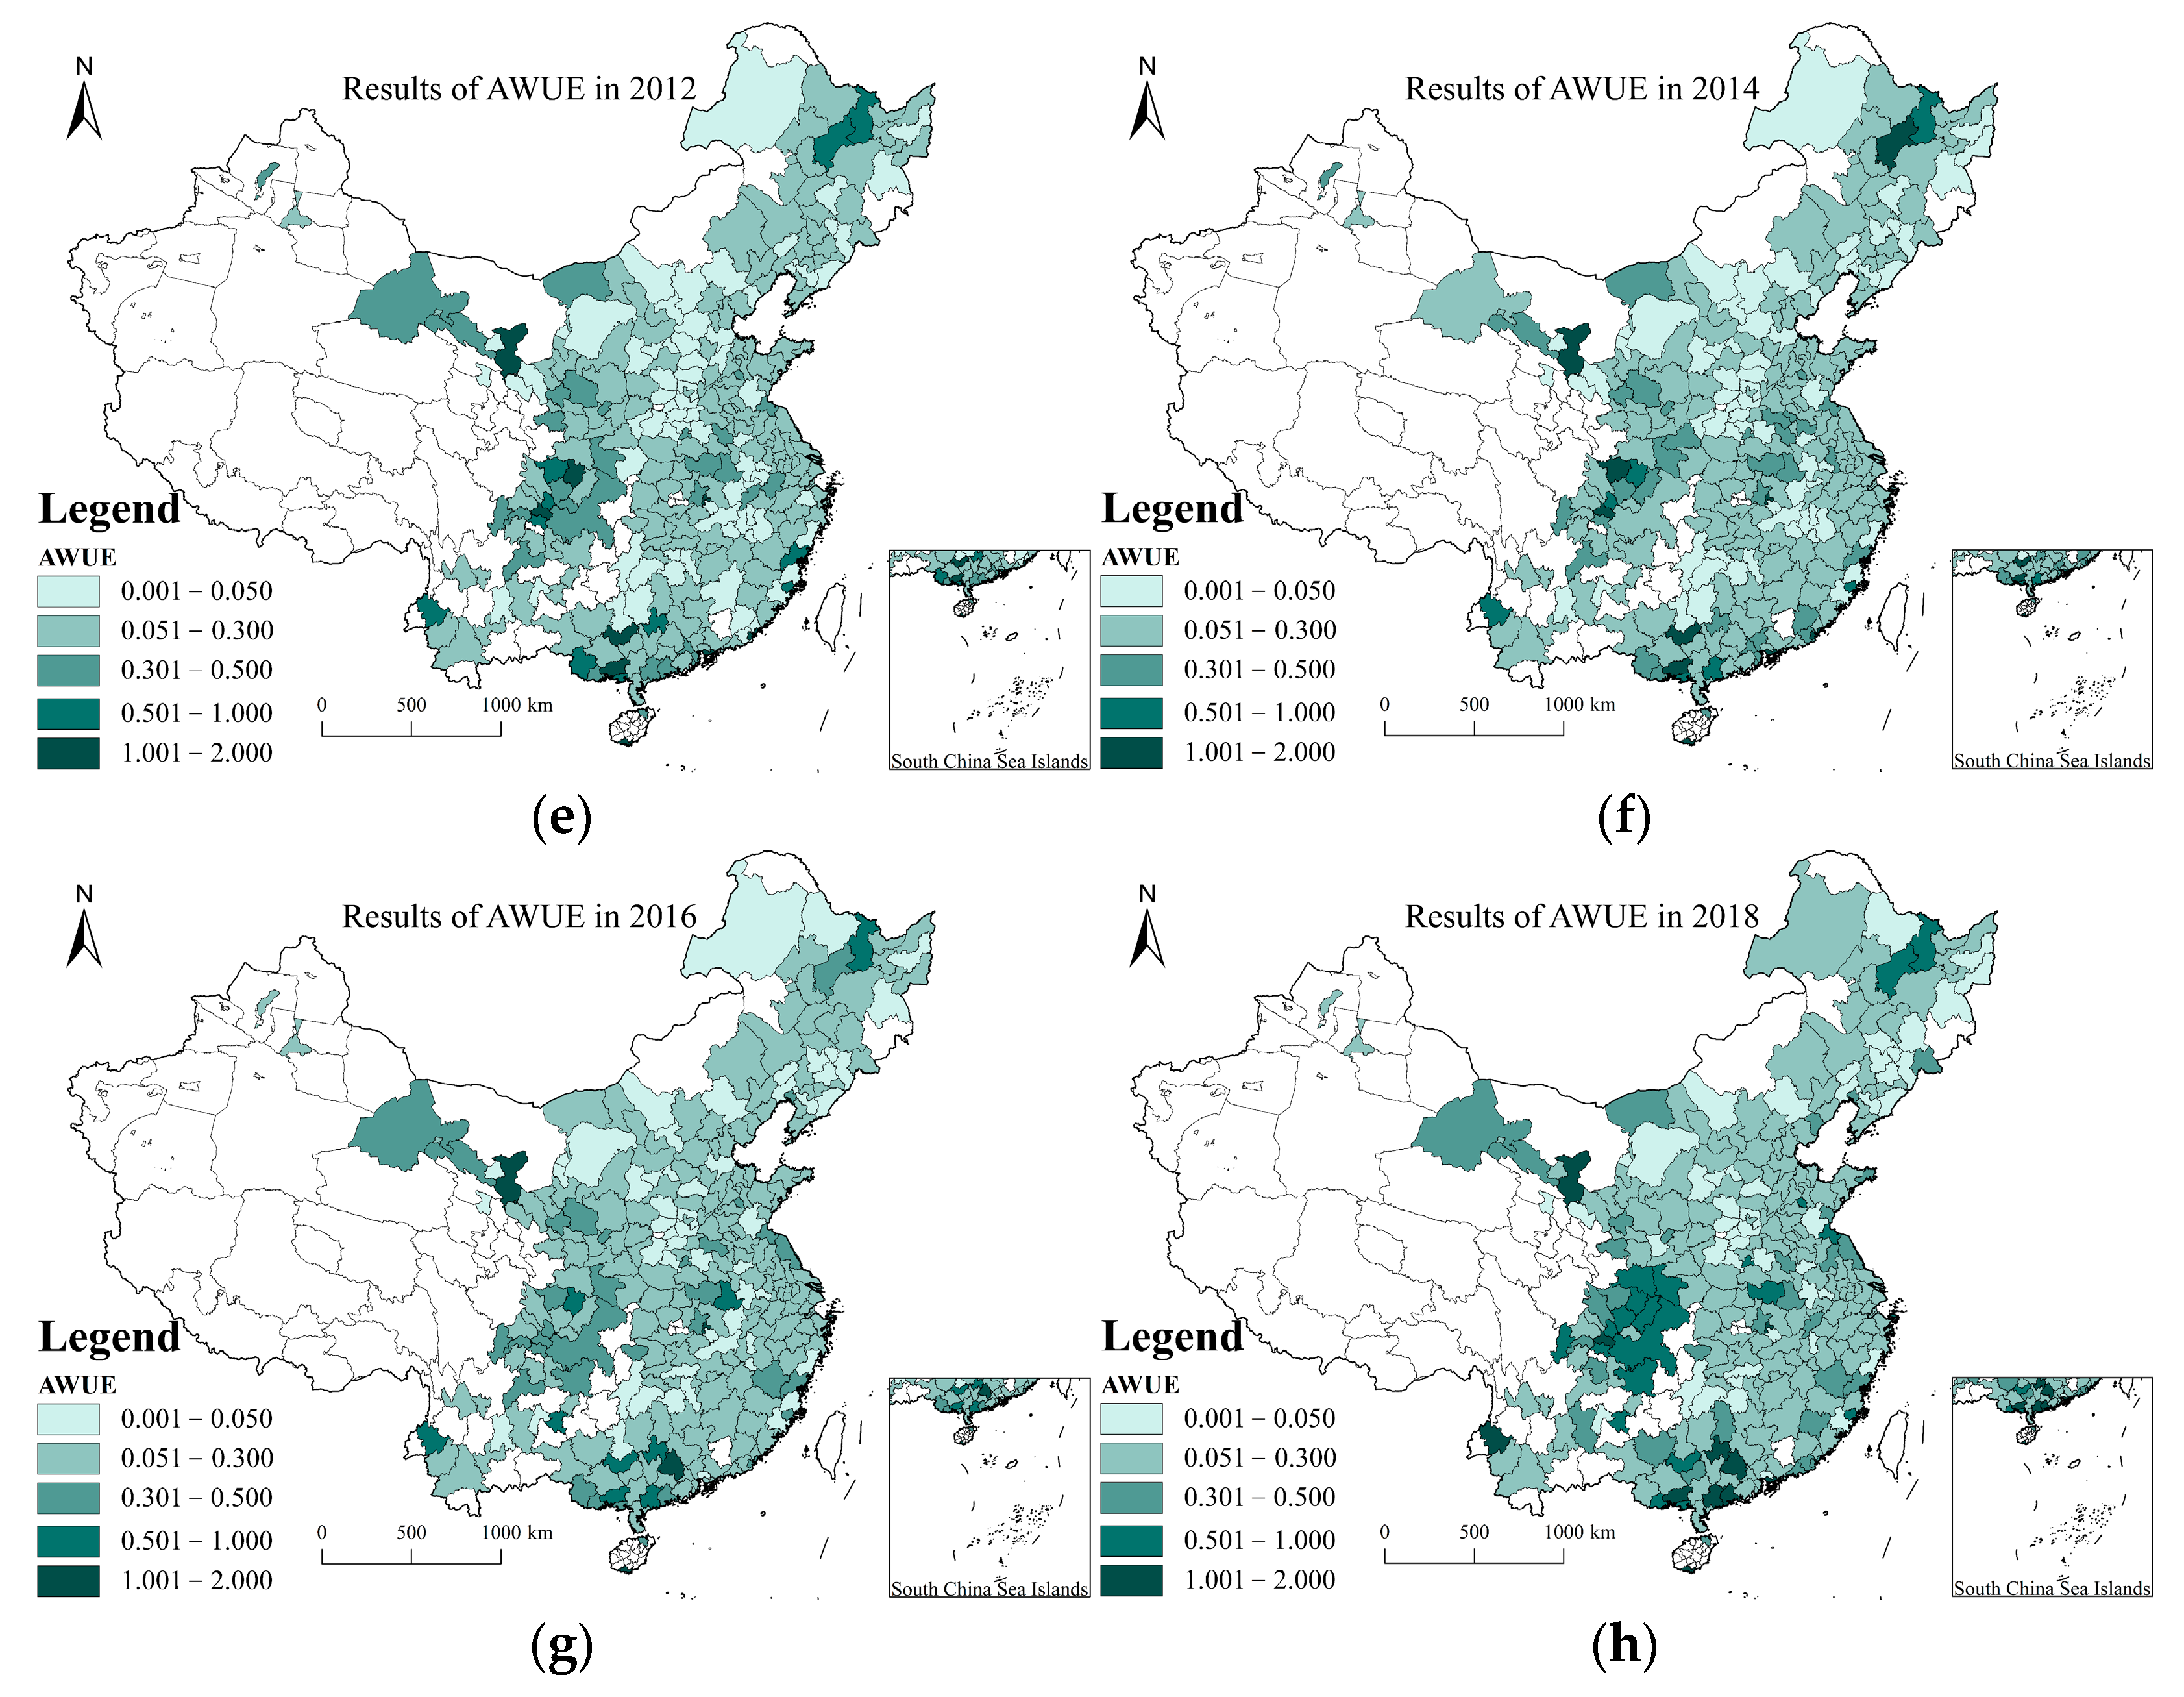
The evaluation results of AWUE using Formulas (1) and (2) are shown in Figure 1.
As Figure 1 shows, the overall AWUE across China between 2003 and 2018 was at a very low level. Wang et al. [51] adopted a value of 0.6 as the standard for evaluating resource utilization efficiency. The annual average value of AWUE in China was far lower than this standard, so were the values for both large-scale regions and specific small-scale cities. Figure 2 shows the average value of AWUE in the large-scale regions, where the AWUE between 2003 and 2018 did not exceed 0.6, whether across the country or in eastern China, central China, western China, and northeastern China. Table 2 lists the statistics for cities with an AWUE exceeding 0.6 over the same period, showing that the AWUE exceeded 0.6 in only a few cities, and the number of cities with an AWUE > 0.6 was greatest in 2018 but accounted for only 8.54% of the total number of cities. A possible account for China’s low AWUE is that the country’s extensive economic growth model relies heavily on the input of resource factors, which consume a large volume of water resources in the process. In addition, the output of the same unit of water resources is relatively small, in contrast to more sewage and wastewater discharges. The AWUE increased from 2003 to 2005 and then declined in 2006. From 2009 to 2016, it dropped from the benchmark (2003). The problem of insufficient agricultural water supply occurred in individual years, resulting in the decline of AWUE.
3.2. Spatial Differences in AWUE
Table 3 shows the results of global Moran’s I using Formula (3). The results passed the 1% significance test, which were positive with large values, indicating that the AWUE in China between 2003 and 2018 was characterized by spatial agglomeration. The increasing values over time indicated that the trend in spatial agglomeration of AWUE was becoming ever more obvious.
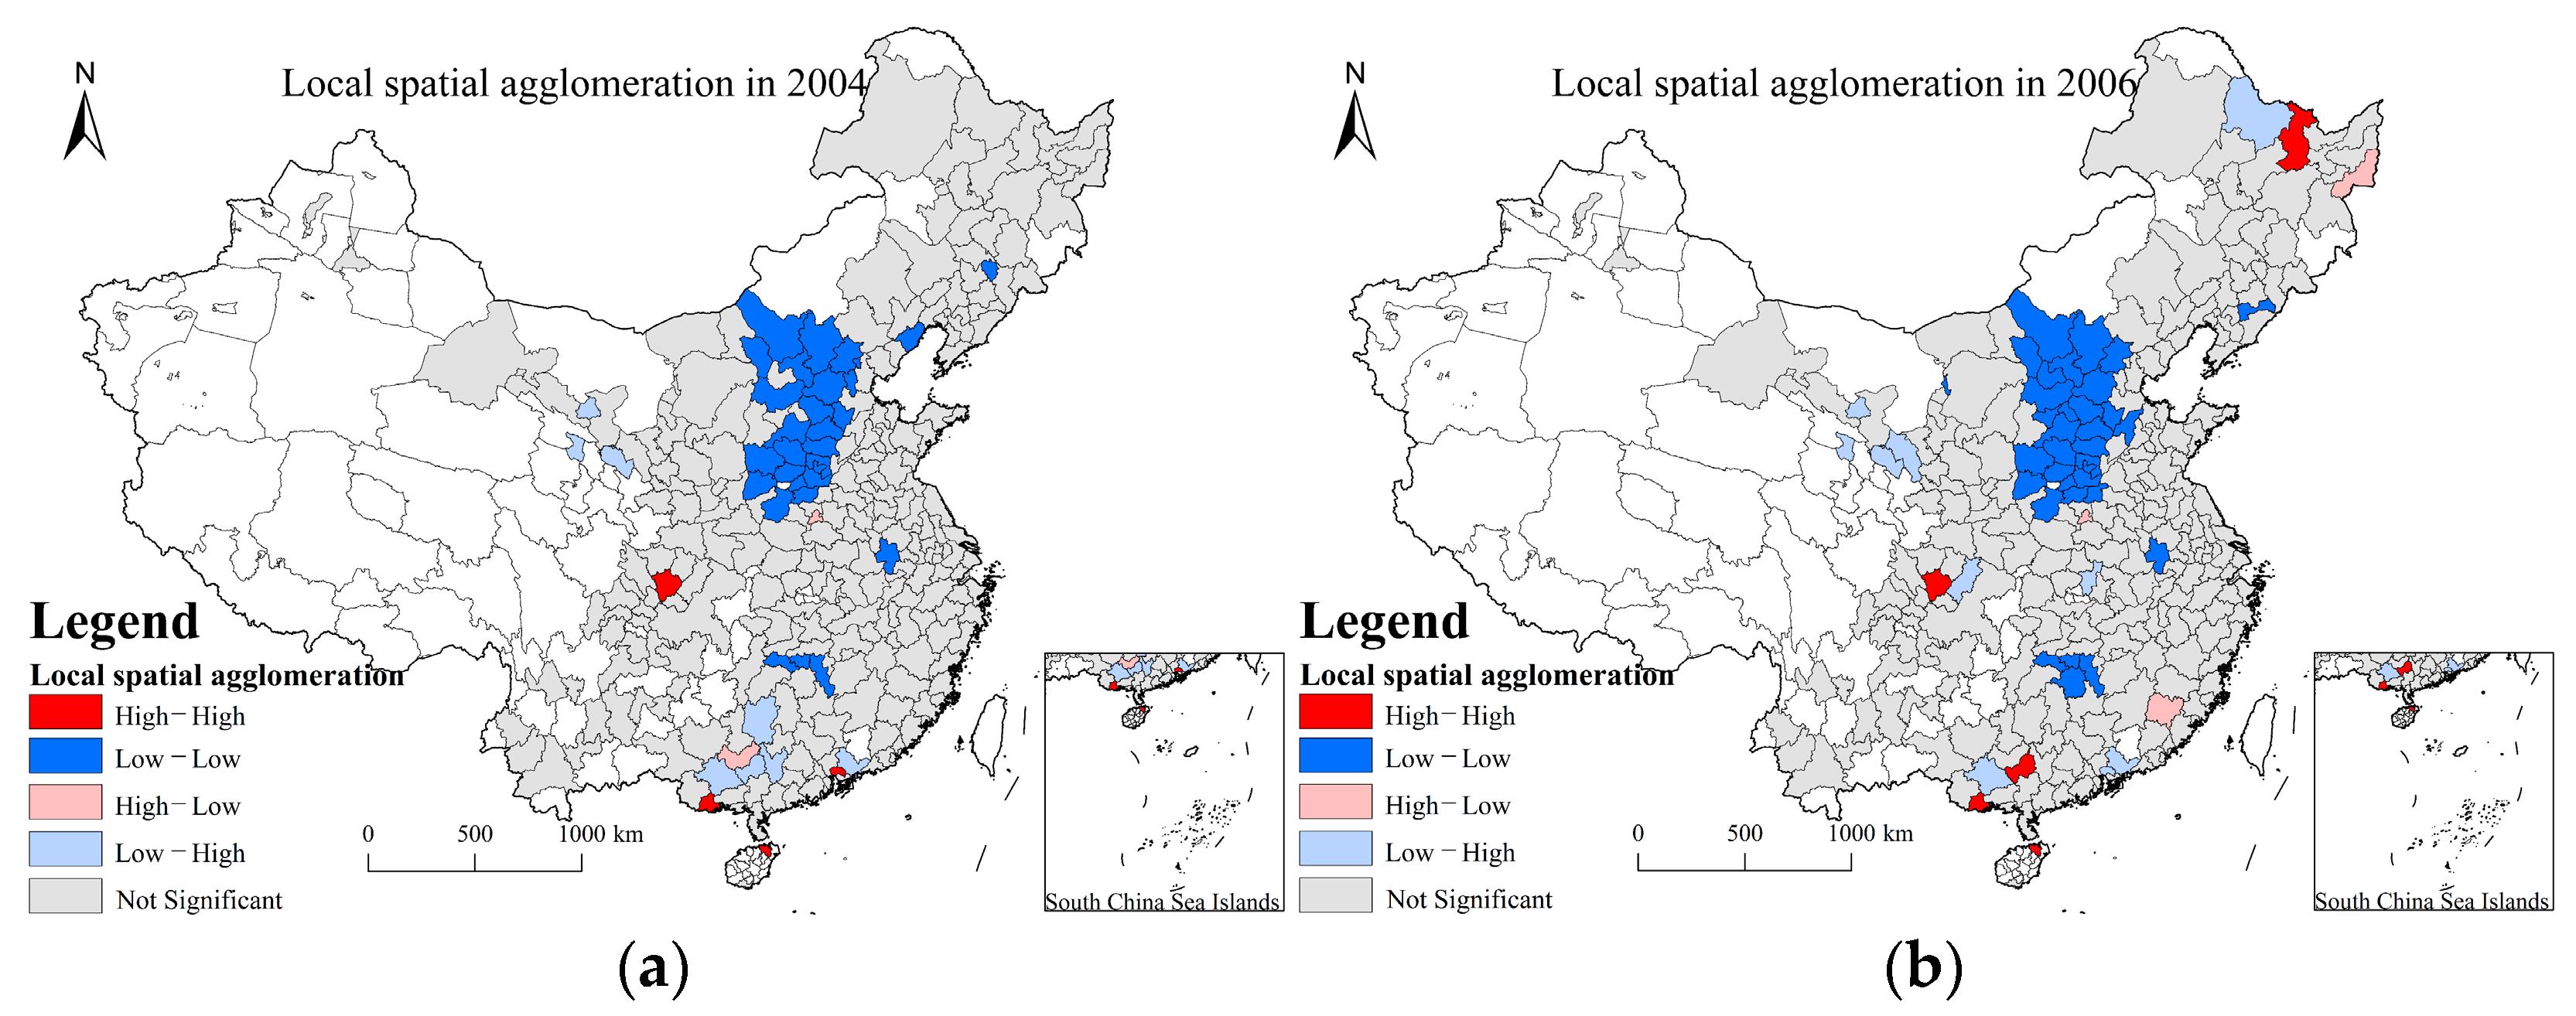
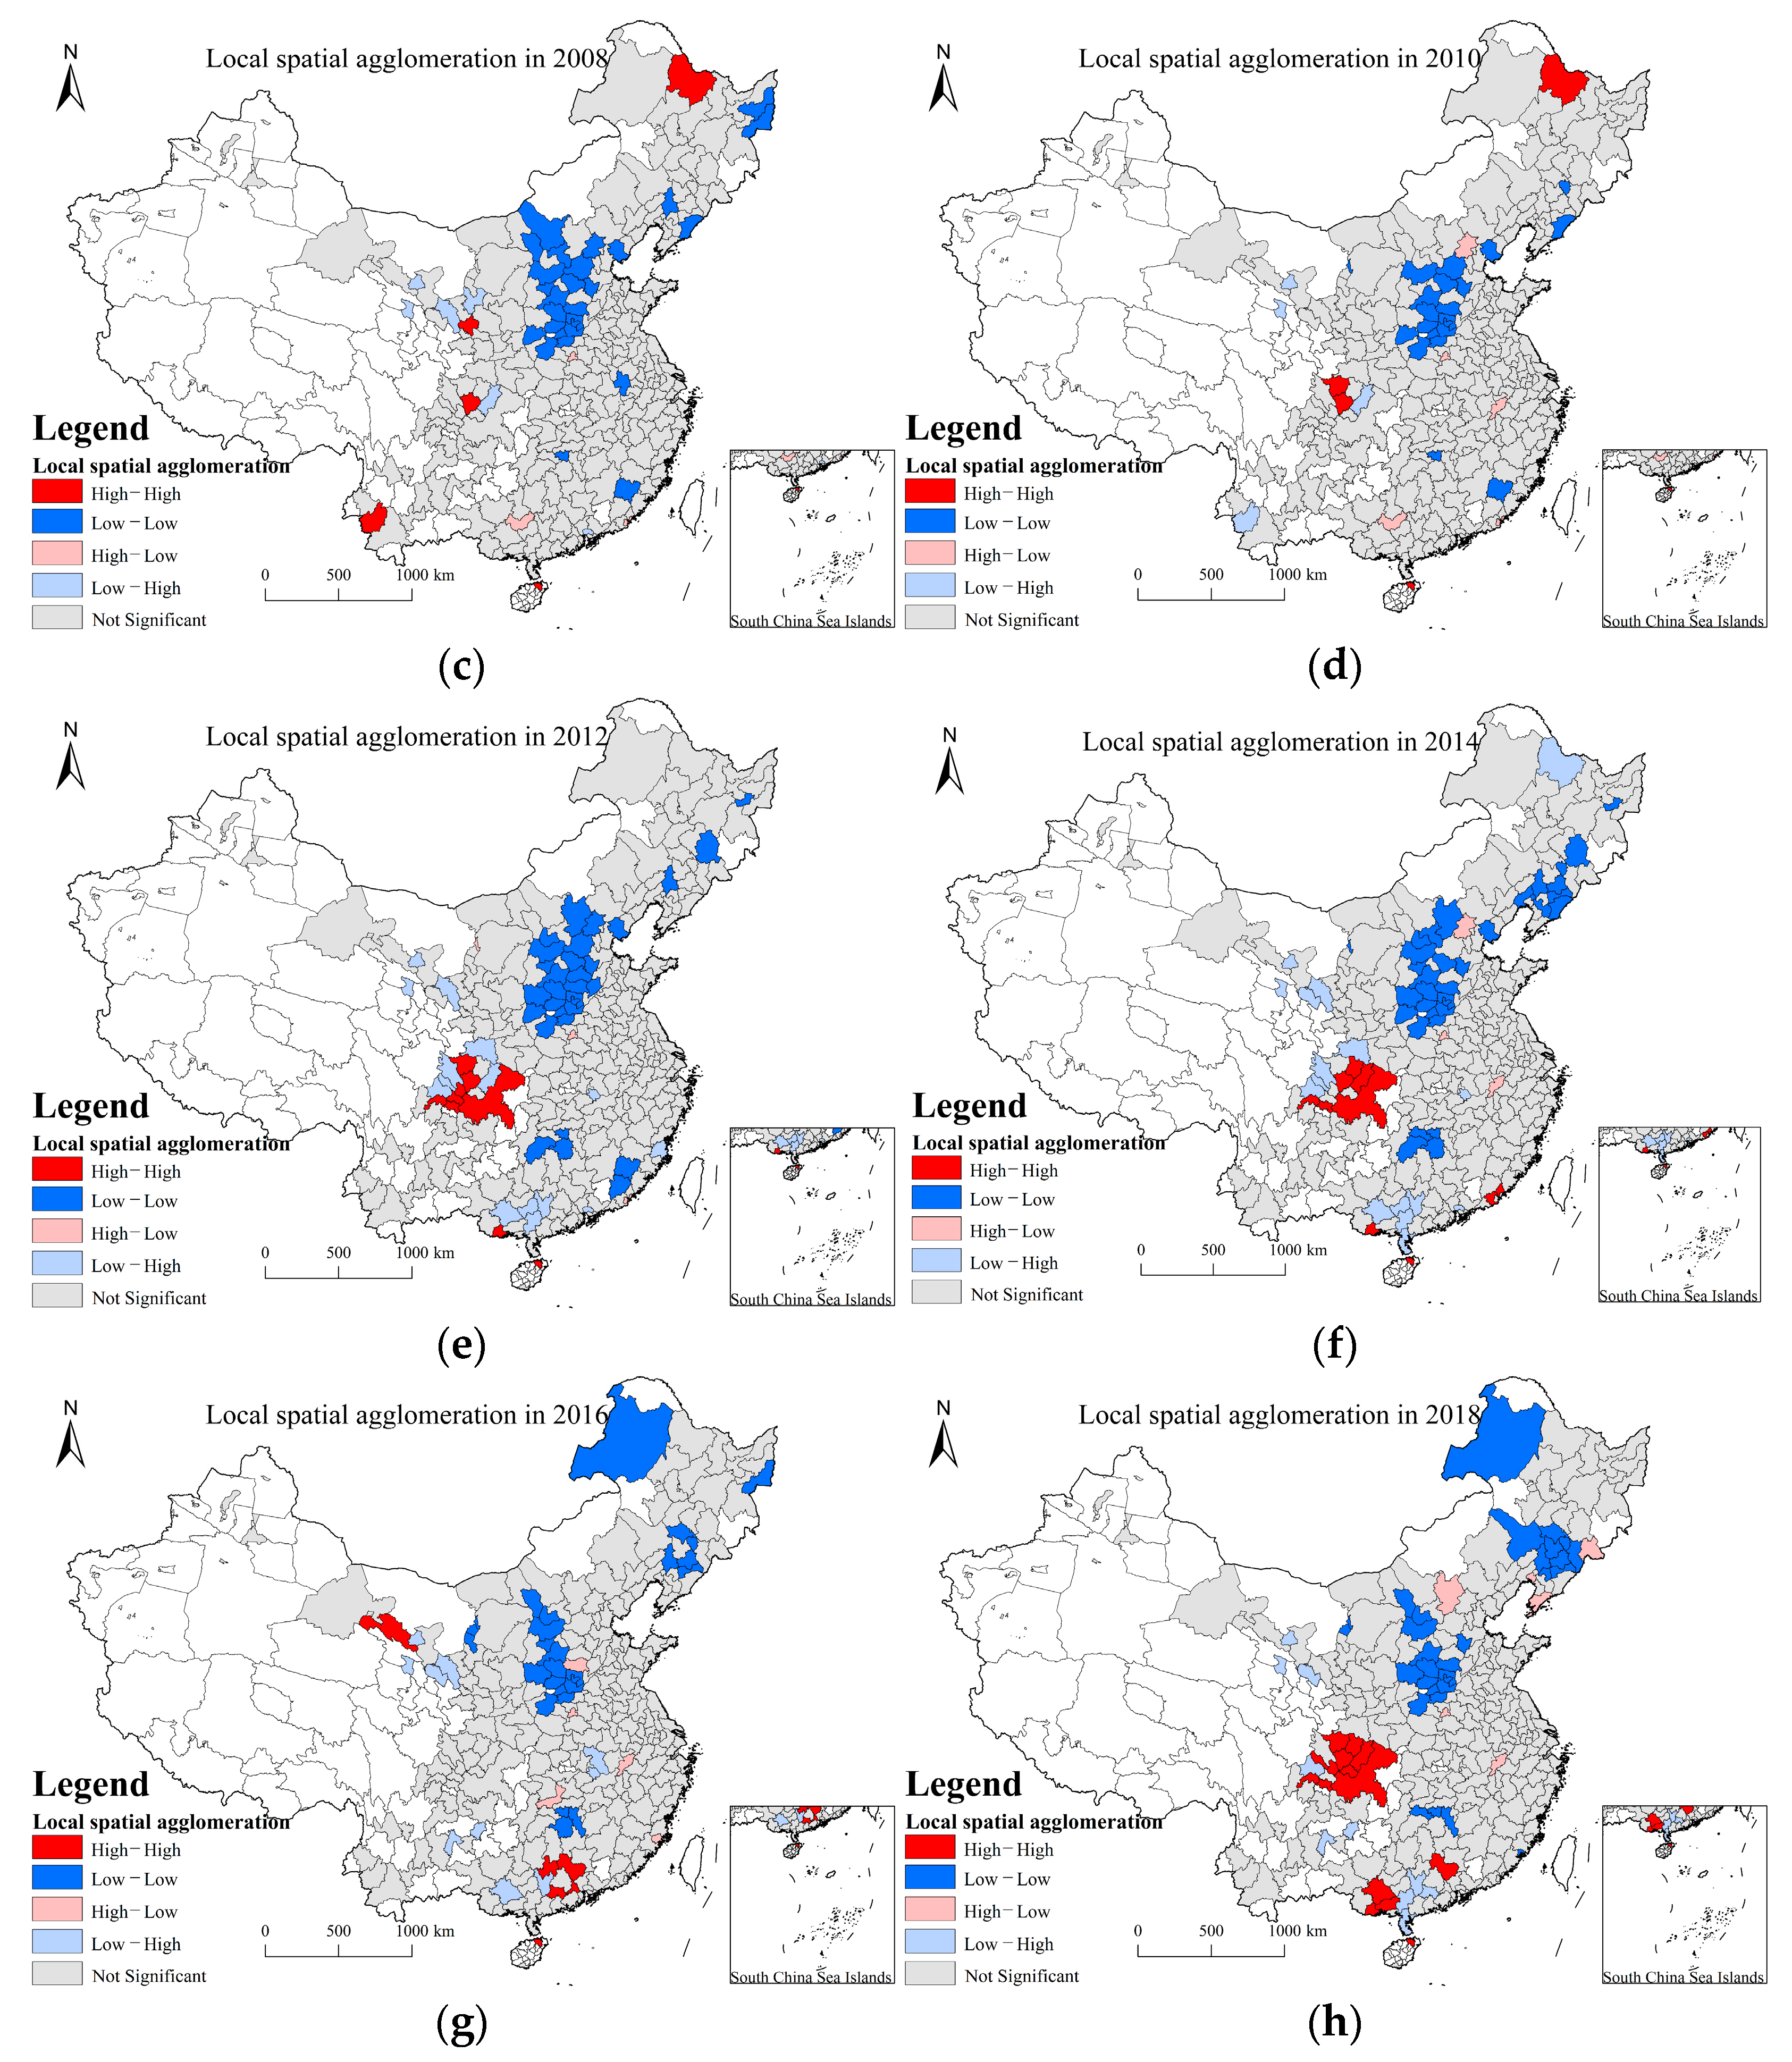
Figure 3 shows the results of local spatial agglomeration of AWUE using Formula (4), which is manifested in four types: high-high, high-low, low-low, and low-high. The high-high type was formed by the agglomeration of cities with high AWUE. For the high-low type, the AWUE in a city was high, but low in the surrounding cities. The low-low type was formed by the agglomeration of cities with low AWUE. For the low-high type, the AWUE in a city was low, but high in the surrounding cities. According to the results, the number of high-high, high-low, and low-high cities was small, while the low-low cities were predominant. The distribution of low-low cities was relatively stable from year to year, distributed mainly in the Huang-Huai-Hai Plain and the Loess Plateau, and tended to spread to northeastern China, the Yangtze River Basin, and some cities in Shandong Province.
3.3. Factors Affecting AWUE
AWUE is the result of a series of factors, such as input, expected output, and unexpected output, which is affected by a complex series of economic and environmental factors. To analyze these factors, we selected the indicators closely related to agriculture by drawing on Zhang et al.’s work [52] and analyzing the impact of these indicators on AWUE, which could provide a more direct reference for agricultural production and policy-making to improve AWUE. The selected factors included: the scale of the agricultural labor force, farmers’ incomes, agricultural technology, grain crop yields, cash crop yields, and agricultural policy. The scale of the agricultural labor force was represented by the number of employees in agriculture, forestry, animal husbandry, sideline occupations, and fisheries. Farmers’ incomes were represented by the per capita net income of rural residents. Agricultural technology was represented by the expenditure in agricultural research and development (R&D). Grain crop yields were represented by yields per unit area of the different grain crops cultivated, including wheat, rice, grain, corn, beans, and potatoes. Cash crop yields were represented by the yields per unit area of the cash crops cultivated, such as cotton, oil, sugar, hemp, and vegetables. These indicators were derived from China’s economic and social big data research platform (https://data.cnki.net, accessed on 10 December 2021). Content analysis was adopted to analyze the government work report for each prefecture-level city, and the frequency and proportion of agricultural-related words in the report were used to represent the level of policy support for agriculture. Table 4 lists the results for the six factors related to AWUE using Formula (5).
According to Table 3, the impact of agricultural technology on AWUE between 2003 and 2018 was much bigger than that of other factors, which is therefore considered to be the single most important factor affecting AWUE. The development of modern agriculture increasingly depends on agricultural technology, which can significantly promote the input, expected output, and unexpected output factors of AWUE. First, advances in agricultural technology improve mechanization and informatization and enhance the performance of agricultural machinery. Second, such advances improve agricultural productivity and economic growth. Investment in agricultural scientific and technological innovation has become the basis and power source for improving agricultural output, market supply, and economic growth. Third, such advances also promote the intensive and economical use of water resources and reduce water resource wastage and sewage discharge. Given a stable water supply, increasing the investment in agricultural technology will improve AWUE significantly.
4. Conclusions and Policy Recommendations
4.1. Conclusions
Improving AWUE is of great importance for improving the output of agricultural products and the intensive and economical utilization of water resources in agricultural production in the context of global climate change and water shortages. This paper evaluated the AWUE of 281 Chinese cities at the prefecture-level or above between 2003 and 2018 by the super-efficiency SBM based on unexpected output, analyzed the spatial differences in AWUE by exploratory spatial data analysis (ESDA), and explored the factors affecting AWUE using the graphical statistical tool, Geodetector. Judging from the evaluation results, the overall AWUE in China was low in this period, and it will likely continue to be so. According to the ESDA results, there were remarkable spatial differences in AWUE throughout China in this period, and the low-low type was the principal type. Based on the Geodetector results, agricultural technology was the most important factor affecting AWUE in China between 2003 and 2018. Precipitation is one of the free and variable input factors in the process of agricultural production, and the AWUE is largely affected by it. This paper evaluates the AWUE by choosing the input, expected output, and unexpected output indicators, without giving consideration to precipitation. Future research efforts may be devoted to simulating the AWUE by considering the precipitation, in order to provide planning and analysis tools for rational utilization of agricultural water resources as well as related research.
4.2. Policy Recommendations
Low AWUE is a common problem in Chinese cities. Improving AWUE is a key concern for Chinese governments at all levels. Each city administration needs to fully understand its input-output levels for agricultural water use and efficiency and make efforts to improve the utilization efficiency of these resources from two aspects: intensive and economical utilization of water resources and pollution control. First, a market mechanism to formulate water prices, improve the infrastructure of agricultural water resource utilization, and water-saving irrigation technologies need to be developed to improve the level of intensive and economical utilization of agricultural water resources. Second, non-point source pollution of the planting industry, pollution by livestock and poultry breeding, and pollution from aquaculture need to be dealt with to reduce the discharge of pollutants into water bodies. Joint action by multiple departments to control agricultural non-point source pollution needs to be orchestrated to strengthen the investigation and punishment of governments, organizations, and individuals who violate relevant laws and regulations and damage water resources and the environment.
Given the spatial differences in AWUE, it is necessary to establish a coordinated development mechanism between cities by strengthening the technical cooperation and forming contiguous areas with high AWUEs. Cities with high AWUEs need to make full use of capital and technological advantages and innovations to explore the creation of spatial spillover channels and play a leading role in advancing AWUE. In cities with low AWUEs, not only should the level of science and technology be improved, but environmental monitoring and government supervision also need to be strengthened. The Huang-Huai-Hai Plain, northeastern China, and Shandong Province are major crop-producing areas in China where it is especially necessary to take effective measures to address low utilization efficiency and agglomeration of agricultural water resources.
Since agricultural technology has a significant impact on AWUE, vigorous measures need to be taken to advance agricultural technology. First, farmers should be trained for additional professional skills, and their levels of production technology should be improved. Second, agricultural infrastructure should be strengthened to improve AWUE and pollution control, especially agricultural water conservancy facilities; the scientific planning and construction of such facilities also need to be more highly valued. Third, agricultural R&D and circular agriculture should be accelerated to reduce or recycle the planting and breeding wastes.
Author Contributions
Conceptualization, K.L.; methodology, K.L.; software, Y.X. and Y.L.; validation, K.L. and Y.F.; formal analysis, K.L. and Y.F.; investigation, Y.X. and Y.L.; resources, K.L.; data curation, Y.F. and Y.L.; writing—original draft preparation, K.L.; writing—review and editing, Y.X. and Y.L.; supervision, Y.X. and Y.L.; project administration, K.L. All authors have read and agreed to the published version of the manuscript.
Funding
This research was funded by the National Natural Science Foundation of China, Grant Nos. 72004124 and 71704097.
Institutional Review Board Statement
Not applicable.
Informed Consent Statement
Not applicable.
Data Availability Statement
The data presented in this study are available on request from the corresponding author. The data are not publicly available because research is ongoing.
Conflicts of Interest
The authors declare no conflict of interest.
References
- He, C.; Liu, Z.; Wu, J.; Pan, X.; Fang, Z.; Li, J.; Bryan, B. Future global urban water scarcity and potential solutions. Nat. Commun. 2021, 12, 4667. [Google Scholar] [CrossRef] [PubMed]
- Zhang, F.; Jin, G.; Liu, G. Evaluation of virtual water trade in the Yellow River Delta, China. Sci. Total Environ. 2021, 784, 147285. [Google Scholar] [CrossRef] [PubMed]
- Du, M.Z.; Liao, L.P.; Wang, B.; Chen, Z.F. Evaluating the effectiveness of the water-saving society construction in China: A quasi-natural experiment. J. Environ. Manag. 2021, 277, 111394. [Google Scholar] [CrossRef] [PubMed]
- Jin, G.; Chen, K.; Liao, T.; Zhang, L.; Najmuddin, O. Measuring ecosystem services based on government intentions for future land use in Hubei Province: Implications for sustainable landscape management. Landsc. Ecol. 2021, 36, 2025–2042. [Google Scholar] [CrossRef]
- Deng, X.P.; Shan, L.; Zhang, H.P.; Turner, N.C. Improving agricultural water use efficiency in arid and semiarid areas of China. Agric. Water Manag. 2006, 80, 23–40. [Google Scholar] [CrossRef]
- Xu, H.; Yang, R.; Song, J. Agricultural water use efficiency and rebound effect: A study for China. Int. J. Environ. Res. Public Health 2021, 18, 7151. [Google Scholar] [CrossRef]
- Yu, L.Y.; Zhao, X.N.; Gao, X.D.; Jia, R.H.; Yang, M.H.; Yang, X.L.; Wu, Y.; Siddique, K.H.M. Effect of natural factors and management practices on agricultural water use efficiency under drought: A meta-analysis of global drylands. J. Hydrol. 2021, 594, 125977. [Google Scholar] [CrossRef]
- Jin, G.; Li, Z.H.; Deng, X.Z.; Yang, J.; Chen, D.D.; Li, W.Q. An analysis of spatiotemporal patterns in Chinese agricultural productivity between 2004 and 2014. Ecol. Indic. 2019, 105, 591–600. [Google Scholar] [CrossRef]
- Pinto, I.; Rodrigues, S.; Antunes, S.C. Assessment of the benthic macroinvertebrate communities in the evaluation of the water quality of Portuguese reservoirs: An experimental approach. Water 2021, 13, 3391. [Google Scholar] [CrossRef]
- Zhao, L.S.; Sun, C.Z.; Zheng, D.F. Water resource utilization efficiency and its spatial spillover effects measure in China. Acta Geogr. Sin. 2014, 69, 121–133. [Google Scholar] [CrossRef]
- Zhao, L.S.; Sun, C.Z.; Liu, F.C. Interprovincial two-stage water resource utilization efficiency under environmental constraint and spatial spillover effects in China. J. Clean. Prod. 2017, 164, 715–725. [Google Scholar] [CrossRef]
- Wang, X.B.; Wang, Z.L. Research on the impact of environmental regulation on water resources utilization efficiency in China based on SYS-GMM model. Water Supply 2021, 21, 3643–3656. [Google Scholar] [CrossRef]
- Yang, Y. Evaluation of China’s water-resource utilization efficiency based on a DEA-Tobit two-stage model. Water Supply 2021, 21, 1764–1777. [Google Scholar] [CrossRef]
- Lu, W.; Liu, W.; Hou, M.; Deng, Y.; Deng, Y.; Zhou, B.; Zhao, K. Spatial–temporal evolution characteristics and influencing factors of agricultural water use efficiency in Northwest China—Based on a super-DEA model and a spatial panel econometric model. Water 2021, 13, 632. [Google Scholar] [CrossRef]
- Yang, S.; Wang, H.; Tong, J.; Ma, J.; Zhang, F.; Wu, S. Technical efficiency of China’s agriculture and output elasticity of factors based on water resources utilization. Water 2020, 12, 2691. [Google Scholar] [CrossRef]
- Liu, Y.; Hu, X.H.; Zhang, Q.; Zheng, M.B. Improving agricultural water use efficiency: A quantitative study of Zhangye city using the static CGE model with a CES water-land resources account. Sustainability 2017, 9, 308. [Google Scholar] [CrossRef] [Green Version]
- Tan, Q.; Zhang, T.Y. Robust fractional programming approach for improving agricultural water-use efficiency under uncertainty. J. Hydrol. 2018, 564, 1110–1119. [Google Scholar] [CrossRef]
- Feng, Z.; Zheng, H.; Liu, B. Comprehensive evaluation of agricultural water use efficiency based on genetic projection pursuit model. Trans. Chin. Soc. Agric. Eng. 2005, 21, 66–70. [Google Scholar] [CrossRef]
- Zhang, X.D.; Zhu, S. Spatial differences and influencing factors of regional agricultural water use efficiency in Heilongjiang Province, China. Water Supply 2019, 19, 545–552. [Google Scholar] [CrossRef]
- Song, P.B.; Wang, X.Y.; Wang, C.; Lu, M.T.; Chen, L.; Kong, L.Z.; Lei, X.H.; Wang, H. Analysis of agricultural water use efficiency based on analytic hierarchy process and fuzzy comprehensive evaluation in Xinjiang, China. Water 2020, 12, 3266. [Google Scholar] [CrossRef]
- Wang, G.F.; Chen, J.C.; Wu, F.; Li, Z.H. An integrated analysis of agricultural water-use efficiency: A case study in the Heihe River Basin in Northwest China. Phys. Chem. Earth 2015, 89, 3–9. [Google Scholar] [CrossRef]
- Wang, G.F.; Lin, N.; Zhou, X.X.; Li, Z.H.; Deng, X.Z. Three-stage data envelopment analysis of agricultural water use efficiency: A case study of the Heihe river basin. Sustainability 2018, 10, 568. [Google Scholar] [CrossRef] [Green Version]
- Wei, J.X.; Lei, Y.L.; Yao, H.J.; Ge, J.P.; Wu, S.M.; Liu, L.N. Estimation and influencing factors of agricultural water efficiency in the Yellow River basin, China. J. Clean. Prod. 2021, 308, 127249. [Google Scholar] [CrossRef]
- Wang, F.; Yu, C.; Xiong, L.; Chang, Y. How can agricultural water use efficiency be promoted in China? A spatial-temporal analysis. Resour. Conserv. Recycl. 2019, 145, 411–418. [Google Scholar] [CrossRef]
- Cao, X.C.; Zeng, W.; Wu, M.Y.; Guo, X.P.; Wang, W.G. Hybrid analytical framework for regional agricultural water resource utilization and efficiency evaluation. Agric. Water Manag. 2020, 231, 106027. [Google Scholar] [CrossRef]
- Huang, Y.J.; Huang, X.K.; Xie, M.N.; Cheng, W.; Shu, Q. A study on the effects of regional differences on agricultural water resource utilization efficiency using super-efficiency SBM model. Sci. Rep. 2021, 11, 9953. [Google Scholar] [CrossRef]
- Liu, Y.; Du, J.; Zhang, J. Estimation on utilization efficiency of agricultural water resource in Hubei Province. China Popul. Resour. Environ. 2007, 17, 60–65. [Google Scholar] [CrossRef]
- Li, S.; Cheng, J.; Wu, Q. Regional difference of the efficiency of water usage in China. China Popul. Resour. Environ. 2008, 18, 215–220. [Google Scholar] [CrossRef]
- Zhang, W.; Du, X.; Huang, A.; Yin, H. Analysis and comprehensive evaluation of water use efficiency in China. Water 2019, 11, 2620. [Google Scholar] [CrossRef] [Green Version]
- Zhang, G.; Wu, H.; Liu, Y.; Zhou, Z. Measurement and the spatial interaction analysis of the water resource comprehensive utilization efficiency in China. J. Quant. Tech. Econ. 2020, 37, 123–139. [Google Scholar] [CrossRef]
- Pang, Z.Q.; Yan, D.; Wang, T.Y.; Kong, Y. Disparities and drivers of the water footprint of food consumption in China. Environ. Sci. Pollut. Res. 2021, 28, 62461–62473. [Google Scholar] [CrossRef] [PubMed]
- Hai, Y.; Long, A.H.; Zhang, P.; Deng, X.Y.; Li, J.F.; Deng, M.J. Evaluating agricultural water-use efficiency based on water footprint of crop values: A case study in Xinjiang of China. J. Arid Land 2020, 12, 580–593. [Google Scholar] [CrossRef]
- Cao, X.C.; Xiao, J.F.; Wu, M.Y.; Zeng, W.; Huang, X. Agricultural water use efficiency and driving force assessment to improve regional productivity and effectiveness. Water Resour. Manag. 2021, 35, 2519–2535. [Google Scholar] [CrossRef]
- Fu, T.B.; Xu, C.X.; Yang, L.H.; Hou, S.Y.; Xia, Q. Measurement and driving factors of grey water footprint efficiency in Yangtze River Basin. Sci. Total Environ. 2021, 802, 149587. [Google Scholar] [CrossRef]
- Geng, Q.; Ren, Q.; Nolan, R.H.; Wu, P.; Yu, Q. Assessing China’s agricultural water use efficiency in a green-blue water perspective: A study based on data envelopment analysis. Ecol. Indic. 2019, 96, 329–335. [Google Scholar] [CrossRef]
- Liao, J.; Yu, C.; Feng, Z.; Zhao, H.; Wu, K.; Ma, X. Spatial differentiation characteristics and driving factors of agricultural eco-efficiency in Chinese provinces from the perspective of ecosystem services. J. Clean. Prod. 2021, 288, 125466. [Google Scholar] [CrossRef]
- Ding, X.H.; Cai, Z.Y.; Fu, Z. Does the new-type urbanization construction improve the efficiency of agricultural green water utilization in the Yangtze River Economic Belt? Environ. Sci. Pollut. Res. 2021, 28, 64103–64112. [Google Scholar] [CrossRef]
- Yang, Y.; Deng, X.Z. The Spatio-temporal evolutionary characteristics and regional differences in affecting factors analysis of China’s urban eco-efficiency. Sci. Geogr. Sin. 2019, 39, 1111–1118. [Google Scholar] [CrossRef]
- Deng, X.Z.; Gibson, J. Improving eco-efficiency for the sustainable agricultural production: A case study in Shandong, China. Technol. Forecast. Soc. Chang. 2019, 144, 394–400. [Google Scholar] [CrossRef]
- Dong, Y.; Jin, G.; Deng, X.Z. Dynamic interactive effects of urban land-use efficiency, industrial transformation, and carbon emissions. J. Clean. Prod. 2020, 270, 122547. [Google Scholar] [CrossRef]
- Xu, C.Z.; Wang, S.X. Industrial three-division network system in China: Efficiencies and their impact factors. Environ. Sci. Pollut. Res. 2021, 28, 47375–47394. [Google Scholar] [CrossRef] [PubMed]
- Du, Y.; Jiang, J.; Li, C. Ecological efficiency evaluation of marine ranching based on the Super-SBM model: A case study of Shandong. Ecol. Indic. 2021, 131, 108174. [Google Scholar] [CrossRef]
- Zhang, F.; Deng, X.Z.; Phillips, F.; Fang, C.L.; Wang, C. Impacts of industrial structure and technical progress on carbon emission intensity: Evidence from 281 cities in China. Technol. Forecast. Soc. Chang. 2020, 154, 119949. [Google Scholar] [CrossRef]
- Chen, Y.B.; Yin, G.W.; Liu, K. Regional differences in the industrial water use efficiency of China: The spatial spillover effect and relevant factors. Resour. Conserv. Recycl. 2021, 167, 105239. [Google Scholar] [CrossRef]
- Available online: https://data.cnki.net (accessed on 10 December 2021).
- Tone, K. A slacks-based measure of efficiency in data envelopment analysis. Eur. J. Oper. Res. 2001, 130, 498–509. [Google Scholar] [CrossRef] [Green Version]
- Tone, K. A slacks-based measure of super-efficiency in data envelopment analysis. Eur. J. Oper. Res. 2002, 143, 32–41. [Google Scholar] [CrossRef] [Green Version]
- Liu, K.; Wang, X.Y.; Zhang, Z.B. Assessing urban atmospheric environmental efficiency and factors influencing it in China. Environ. Sci. Pollut. Res. 2021, 29, 594–608. [Google Scholar] [CrossRef]
- Wang, J.F.; Xu, C.D. Geodetector: Principle and prospective. Acta Geogr. Sin. 2017, 72, 116–134. [Google Scholar] [CrossRef]
- Huang, C.H.; Liu, K.; Zhou, L. Spatio-temporal trends and influencing factors of PM2.5 concentrations in urban agglomerations in China between 2000 and 2016. Environ. Sci. Pollut. Res. 2021, 28, 10988–11000. [Google Scholar] [CrossRef]
- Wang, S.; Zhou, L.; Wang, H.; Li, X. Water use efficiency and its influencing factors in China: Based on the data envelopment analysis (DEA)-Tobit model. Water 2018, 10, 832. [Google Scholar] [CrossRef] [Green Version]
- Zhang, Y.; Xu, H.; Liu, H.; Zhou, B. The application of low impact development fa-cility chain on storm rainfall control: A case study in Shenzhen, China. Water 2021, 13, 3375. [Google Scholar] [CrossRef]
Figure 1.
Evaluation results of AWUE. Note: Only the results of even years are shown in this figure. (a) Results of AWUE in 2004; (b) Results of AWUE in 2006; (c) Results of AWUE in 2008; (d) Results of AWUE in 2010; (e) Results of AWUE in 2012; (f) Results of AWUE in 2014; (g) Results of AWUE in 2016; (h) Results of AWUE in 2018.


Figure 2.
Average values of AWUE in large-scale regions of China between 2003 and 2018.

Figure 3.
Results for local spatial agglomeration of AWUE. Note: Only the results of even years have been kept in this figure. (a) Local spatial agglomeration in 2004; (b) Local spatial agglomeration in 2006; (c) Local spatial agglomeration in 2008; (d) Local spatial agglomeration in 2010; (e) Local spatial agglomeration in 2012; (f) Local spatial agglomeration in 2014; (g) Local spatial agglomeration in 2016; (h) Local spatial agglomeration in 2018.


Table 1.
The descriptive statistics of the indicators.
| Indicator | Variable | Unit | Number of Samples | Mean | Median | Standard Deviation | Maximum | Minimum |
|---|---|---|---|---|---|---|---|---|
| Input indicator | Agricultural water supply | 10,000 tons | 4496 | 15,987.14 | 7000 | 30,923.15 | 320,400 | 349 |
| Total power of agricultural machinery | Kilowatt | 4496 | 2,924,470.04 | 2,011,900 | 3,951,390.88 | 195,972,700 | 9661 | |
| Expected output indicator | Added-value of primary industry | 10,000 Yuan | 4496 | 31.03 | 17.66 | 47.49 | 1006.50 | 0.29 |
| Unexpected output indicator | Agricultural sewage discharge | 10,000 tons | 4496 | 7110.95 | 4478.50 | 9250.21 | 93,814 | 7 |
Note: The results are calculated by the authors.
Table 2.
Statistics for cities in China with an AWUE > 0.6.
| Year | City | Proportion | Quantity |
|---|---|---|---|
| 2003 | Bayannur, Suzhou, Xuancheng, Ningde, Shenzhen, Qinzhou, Hezhou, Laibin, Sanya, Bazhong, Wuwei | 3.91 | 11 |
| 2004 | Bayannur, Suihua, Huaian, Suzhou, Xuancheng, Ningde, Shenzhen, Qinzhou, Hezhou, Laibin, Sanya, Bazhong, Baoshan, Wuwei | 4.98 | 14 |
| 2005 | Bayannur, Suihua, Lianyungang, Huaian, Suqian, Xuancheng, Ningde, Ezhou, Shenzhen, Qinzhou, Hezhou, Laibin, Sanya, Bazhong, Baoshan, Wuwei, Zhangye | 6.05 | 17 |
| 2006 | Suihua, Putian, Suizhou, Shenzhen, Qinzhou, Hezhou, Laibin, Sanya, Bazhong, Wuwei | 2.81 | 10 |
| 2007 | Bayannur, Suihua, Putian, Ezhou, Suzhou, Shenzhen, Zhuhai, Qinzhou, Hezhou, Laibin, Sanya, Suining, Bazhong, Baoshan, Wuwei, Zhangye | 5.69 | 16 |
| 2008 | Suihua, Putian, Ezhou, Suizhou, Shenzhen, Qinzhou, Sanya, Suining, Bazhong, Baoshan, Wuwei, Zhangye, Qingyang, Zhongwei | 4.98 | 14 |
| 2009 | Suihua, Putian, Ezhou, Shenzhen, Qinzhou, Sanya, Suining, Bazhong, Baoshan, Wuwei, Zhangye | 3.91 | 11 |
| 2010 | Yichun, Suihua, Putian, Ezhou, Shenzhen, Qinzhou, Sanya, Suining, Bazhong, Baoshan, Wuwei | 3.91 | 11 |
| 2011 | Yichun, Suihua, Putian, Ezhou, Shenzhen, Shantou, Qinzhou, Sanya, Suining, Bzhong, Ziyang, Baoshan, Wuwei | 4.63 | 13 |
| 2012 | Suihau, Putian, Ningde, Ezhou, Shenzhen, Shantou, Qinzhou, Hezhou, Laibin, Sanya, Suining, Bazhong, Ziyang, Baoshan, Wuwei | 5.34 | 15 |
| 2013 | Yichun, Suihua, Putian, Ezhou, Shenzhen, Shantou, Beihai, Qinzhou, Laibin, Sanya, Guangyuan, Suining, Bazhong, Ziyang, Wuwei | 5.34 | 15 |
| 2014 | Yichun, Suihau, Ezhou, Shenzhen, Shantou, Maoming, Beihai, Qinzhou, Laibin, Sanya, Guangyuan, Bazhong, Ziyang, Baoshan, Wuwei | 5.34 | 15 |
| 2015 | Luohe, Ezhou, Maoming, Zhaoqing, Qinzhou, Hezhou, Laibin, Sanya, Guangyuan, Bazhong, Ziyang, Baoshan, Wuwei, Guyuan | 4.98 | 14 |
| 2016 | Ezhou, Zhaoqing, Qinzhou, Laibin, Sanya, Anshun, Wuwei | 2.49 | 7 |
| 2017 | Haerbin, Yichun, Suihua, Ezhou, Shenzhen, Maoming, Zhaoqing, Yangjiang, Fangchenggang, Qinzhou, Laibin, Sanya, Bazhong, Ziyang, Anshun, Baoshan, Wuwei | 6.05 | 17 |
| 2018 | Yichun, Suihua, Lianyungang, Zhoushan, Laiwu, Luohe, Ezhou, Shenzhen, Maoming, Zhaoqing, Yangjiang, Beihai, Fangchenggang, Qinzhou, Hezhou, Sanya, Nanchong, Dazhou, Yaan, Bazhong, Ziyang, Anshun, Baoshan, Wuwei | 8.54 | 24 |
Note: This table is derived from the calculation results of AWUE.
Table 3.
Global Moran’s I of AWUE.
| Year | Moran’s I | Z | p |
|---|---|---|---|
| 2003 | 0.552 | 5.46 | 0.000000 |
| 2004 | 0.559 | 6.86 | 0.000000 |
| 2005 | 0.547 | 7.50 | 0.000000 |
| 2006 | 0.575 | 7.41 | 0.000000 |
| 2007 | 0.606 | 6.67 | 0.000000 |
| 2008 | 0.627 | 6.88 | 0.000000 |
| 2009 | 0.587 | 8.22 | 0.000000 |
| 2010 | 0.609 | 7.20 | 0.000000 |
| 2011 | 0.802 | 6.56 | 0.000000 |
| 2012 | 0.825 | 7.99 | 0.000000 |
| 2013 | 0.785 | 6.61 | 0.000000 |
| 2014 | 0.756 | 7.95 | 0.000000 |
| 2015 | 0.804 | 6.72 | 0.000000 |
| 2016 | 0.706 | 5.30 | 0.000000 |
| 2017 | 0.535 | 6.48 | 0.000000 |
| 2018 | 0.799 | 5.71 | 0.000000 |
Note: This table is derived from the results of global Moran’s I.
Table 4.
Measurement results for the six factors affecting AWUE.
| Year | Scale of Agricultural Labor Force | Farmers’ Incomes | Agricultural Technology | Grain Crop Yields | Cash Crop Yields | Agricultural Policy |
|---|---|---|---|---|---|---|
| 2003 | 0.0012 | 0.2110 | 0.3331 | 0.1132 | 0.1221 | 0.1042 |
| 2004 | 0.0009 | 0.3661 | 0.4882 | 0.1387 | 0.1476 | 0.1038 |
| 2005 | 0.0009 | 0.3562 | 0.4783 | 0.1442 | 0.1531 | 0.1038 |
| 2006 | 0.0004 | 0.4039 | 0.5250 | 0.1314 | 0.1403 | 0.1032 |
| 2007 | 0.0029 | 0.4616 | 0.5837 | 0.1592 | 0.1651 | 0.1059 |
| 2008 | 0.0019 | 0.4821 | 0.5942 | 0.1225 | 0.1214 | 0.1049 |
| 2009 | 0.0023 | 0.5405 | 0.6626 | 0.1285 | 0.1284 | 0.1053 |
| 2010 | 0.0018 | 0.5010 | 0.6231 | 0.1307 | 0.1305 | 0.1048 |
| 2011 | 0.0027 | 0.5781 | 0.6902 | 0.1448 | 0.1537 | 0.1057 |
| 2012 | 0.0031 | 0.5907 | 0.6938 | 0.1760 | 0.1850 | 0.1061 |
| 2013 | 0.0012 | 0.6204 | 0.7425 | 0.1697 | 0.1802 | 0.1042 |
| 2014 | 0.0017 | 0.6535 | 0.7756 | 0.1814 | 0.1903 | 0.1047 |
| 2015 | 0.0011 | 0.6778 | 0.7997 | 0.1057 | 0.1146 | 0.1041 |
| 2016 | 0.0020 | 0.6704 | 0.7925 | 0.1167 | 0.1156 | 0.1050 |
| 2017 | 0.0024 | 0.6833 | 0.7934 | 0.1245 | 0.1234 | 0.1054 |
| 2018 | 0.0027 | 0.6990 | 0.7983 | 0.1489 | 0.1478 | 0.1057 |
Note: All results passed the 1% significance test. This table is derived from the results of Geodetector.
Publisher’s Note: MDPI stays neutral with regard to jurisdictional claims in published maps and institutional affiliations. |
© 2022 by the authors. Licensee MDPI, Basel, Switzerland. This article is an open access article distributed under the terms and conditions of the Creative Commons Attribution (CC BY) license (https://creativecommons.org/licenses/by/4.0/).
Share and Cite
MDPI and ACS Style
Liu, K.; Xue, Y.; Lan, Y.; Fu, Y. Agricultural Water Utilization Efficiency in China: Evaluation, Spatial Differences, and Related Factors. Water 2022, 14, 684. https://doi.org/10.3390/w14050684
AMA Style
Liu K, Xue Y, Lan Y, Fu Y. Agricultural Water Utilization Efficiency in China: Evaluation, Spatial Differences, and Related Factors. Water. 2022; 14(5):684. https://doi.org/10.3390/w14050684
Chicago/Turabian StyleLiu, Kai, Yuting Xue, Yu Lan, and Yuxuan Fu. 2022. "Agricultural Water Utilization Efficiency in China: Evaluation, Spatial Differences, and Related Factors" Water 14, no. 5: 684. https://doi.org/10.3390/w14050684
Note that from the first issue of 2016, this journal uses article numbers instead of page numbers. See further details here.