Article

Practitioners’ Perspective on the Prevalent Water Quality Management Practices for Legionella Control in Large Buildings in the United States

1
Department of Civil Architectural and Environmental Engineering, Drexel University, 3141 Chestnut Str. Curtis 251, Philadelphia, PA 19104, USA
2
Dornsife School of Public Health, Drexel University, Philadelphia, PA 19104, USA
3
Department of Population Health Sciences & the Public Health Program, Virginia Polytechnic Institute & State University (Virginia Tech), Blacksburg, VA 24061, USA
*
Author to whom correspondence should be addressed.
These authors contributed equally to this work.
Water 2022, 14(4), 663; https://doi.org/10.3390/w14040663
Submission received: 15 December 2021 / Revised: 29 January 2022 / Accepted: 8 February 2022 / Published: 21 February 2022
(This article belongs to the Special Issue Water Quality in Buildings)

Abstract

:
Managing building water systems is complicated by the need to maintain hot water temperatures high enough to control the growth of Legionella spp. while minimizing the risk of scalding. This study assessed water quality management practices in large buildings in the United States. Surveys conducted with building water quality managers found that more than 85% of buildings have hot water temperatures that are consistent with scald risk mitigation guidelines (i.e., <122 °F/50 °C). However, nearly two thirds and three quarters of buildings do not comply with the common temperature guidance for opportunistic pathogen control, i.e., water heater setpoint > 140 °F (60 °C) and recirculation loop > 122 °F (50 °C), respectively; median values for both setpoint and recirculation loop temperatures are 10 °F (6 °C) or more below temperatures recommended for opportunistic pathogen control. These observations suggest that many buildings are prone to Legionella spp. risk. The study also found that 27% of buildings do not comply with guidelines for time to equilibrium hot water temperature, over 33% fail to monitor temperature in the recirculation loop, more than 70% fail to replace or disinfect showerheads, more than 40% lack a written management plan, and only a minority conduct any monitoring of residual disinfectant levels or microbiological quality. Given the rise in Legionellosis infections in recent years, coupled with highlighted water quality concerns because of prolonged water stagnation in plumbing, such as in buildings closed due to COVID-19, current management practices, which appear to be focused on scald risk, may need to be broadened to include greater attention to control of opportunistic pathogens. To accomplish this, there is a need for formal training and resources for facility managers.

Graphical Abstract

1. Introduction

Building plumbing systems often have the appropriate temperature, moisture, and nutrient conditions conducive to the growth of opportunistic premise plumbing pathogens (OPPPs), particularly Legionella spp. [1]. OPPPs cause significant human health risks, particularly for the elderly and immunocompromised [2]. For example, Legionnaires’ disease, caused by premise plumbing pathogens in the genus Legionella spp., accounts for approximately 2–15% of cases of community-acquired pneumonia worldwide [3]. In the United States, the Legionnaires’ disease cases have increased 5.5-fold in recent years, from 0.42 per 100,000 population in 2000 to 2.29 per 100,000 population in 2017, and the number of outbreaks nearly quadrupled during the period from 2009 to 2017 [4]. A more glaring example of building plumbing system failure is the public health crisis in Flint, Michigan in 2014, where aging plumbing infrastructure contributed to the public exposure to elevated lead concentrations, as well as a subsequent outbreak of Legionnaires’ disease [5]. Extended closures of buildings, such as those during the COVID-19 pandemic, have further exacerbated the water stagnation situation in building plumbing systems, which in turn has created conditions favorable for microbial growth and hence increased the risk of Legionella spp. contamination [6,7]. This emphasizes the critical need for appropriate water quality management strategies, whether implemented through advisory guidelines or regulatory control (i.e., standards and codes of practice) [8,9,10].
A large number of guidance documents are available for building water quality management in the United States (e.g., US EPA, 1985 [11]; OSHA, 1996 [12]; CDC, 2016 [13], 2017 [14]; Dept. of Veterans Affairs, 2008 [15], 2014 [16]; ASHRAE, 2018 [17]; NASEM, 2019 [18]) and worldwide (i.e., WHO 2007 [19], 2011 [20]; Govt. of Western Australia, 2010 [21]; EGWG, 2017 [22]; for an overview, see Singh et al., 2020 [9]). However, these guidance documents are inconsistent and sometimes lack a scientific basis [9].
The available regulations related to Legionella spp. control in the United States are limited to healthcare facilities and cooling towers in New York [23,24], healthcare facilities within the Veterans Health Administration [16], and hospitals and healthcare facilities receiving Medicare or Medicaid Funds [25]. The regulation for water quality management, including Legionella spp., in building plumbing systems for all other building types is expected to be maintained through building and plumbing codes [18]. The American National Standards Institute/American Society of Heating, Refrigerating and Air Conditioning Engineers (ANSI/ASHRAE) Standard 188-2015 (i.e., Legionellosis: risk management for building water systems) [17] is the first standard for Legionella spp. control in the United States. The standards provide Legionellosis management strategies for the design, construction, commissioning, operation, and maintenance of building plumbing systems. Among others, Board of Standards Review (BSR)/ASHRAE Standard 188P, “Prevention of legionellosis associated with building water systems” [26], provides guidance on hot and cold-water temperatures in plumbing, and the Centers for Disease Control and Prevention (CDC) provides a toolkit for Legionella spp. control in buildings [14].
Growth of Legionella spp. is the most common water quality concern in building plumbing systems. Detection of Legionella spp. is common in building plumbing systems in the United States and across the world [27,28,29,30,31], including in buildings with vulnerable populations, such as healthcare facilities [32,33,34,35,36,37]. Regular monitoring of Legionella spp. is usually recommended as one of the strategies to control and prevent exposure [19,20,26,38,39,40], though it is seldom performed on a regular basis, unless the building has been linked to legionellosis cases; questions have also been raised as to its cost-effectiveness [41]. Maintaining an appropriate hot water temperature, residual level, and flushing frequency are among the top strategies recommended for controlling Legionella spp./microbial growth in building plumbing systems. Temperature control in building plumbing is a tradeoff between Legionella spp. growth and scalding risk. While higher temperatures provide safety against Legionella spp. growth but cause risk of scalding, lower temperatures are favorable to Legionella spp. growth but are safe against scalding. The recommended minimum temperatures vary across the literature and guidance documents [9,42]. There is a tentative consensus on maintaining the water heater setpoint temperature at 140 °F (60 °C) [12,18,19,22,38] for preventing Legionella spp. risk, but there is less agreement on the recommended hot water temperature in the distribution system. The majority of guidance documents recommend keeping hot water, including in recirculation loops and distal taps, at higher than 122–124 °F (50–51 °C) [12,16,19,20,22,38], with others recommending higher than 131 °F (55 °C) [11,18]. Moreover, Rasheduzzaman et al. (2020) [42], in their meta-analysis of hotel plumbing systems, recommended 59 °C (138 °F) as the required temperature to keep the risk of detectable Legionella spp. below 10% (although limited data were consistent with 50 °C (122 °F) being sufficient to limit Legionella spp. to levels <1000 CFU/L). Similarly, for safety against scalding, temperatures below 122–124 °F (50–51 °C) are recommended by one set of guidance documents [16,22], while temperatures below 110 °F (43 °C) are recommended by another set of guidance documents that are applicable to buildings with vulnerable populations, such as in hospitals and long-term care facilities [20,43]. Regular monitoring of temperatures at water heaters, distal taps, return loops, and points of use is generally recommended for water quality control in building plumbing systems [10].
The time required for hot water to reach a stable temperature at the point of use, hereafter referred to as “time to tap”, is an important indicator of plumbing hydraulic performance [18]. Generally, a time-to-tap value of 60 s or less is an indicator of good plumbing hydraulics (i.e., short pipe runs and good balance of flow across the pipes) sufficient for control of OPPPs [18,22]; lower values between 10 and 30 s have been recommended in other guidance documents [44]. Employing in-building treatment, such as adding disinfectant, is also applied, though seldom, to reduce the risk of OPPP growth.
Certain devices and features of building plumbing systems are more prone to WQ contamination. These potential problem spots require special attention and guidance information is available, though no one source is comprehensive [9], for managing them. For example, thermostatic mixing valves (TMVs) have both favorable [16,18,22,38] and unfavorable [18,20,22] aspects associated with them and therefore are recommended not to be used in high-risk buildings [18]. The issues with TMVs include leaching from organic, synthetic, or metal-based manufacturing materials [18,20,22,45,46], design malfunction [18], and dead water volume at tepid temperatures [22]. Similar issues are noted for flexible shower hoses [18,19,20,22,47] and electronic faucets [18,48]. Other problematic spots include cooling towers [11,16,18,19,22]; hot tubs (spas) [13,17,18,19,22]; centralized automizers/misters/humidifiers [12,18,19,21]; decorative fountains [12,15,17,18,38]; dead ends [18,19,22], and low-flow fixtures [16,18,22].
One universally accepted guidance source applicable to different issues in building plumbing systems is not available [9]. In the United States, the source of guidance is various federal and state agencies (i.e., CDC, EPA, DVA) and professional societies (ASHRAE, National Standard Plumbing Code). Part of the reason for this scattered guidance information is that building plumbing systems are varied across different buildings, but it is also due to the lack of a definitive scientific evidence base for unanimously accepted guidance. Therefore, large, data-driven review studies in recent years that have focused on reconciling the diverging scientific evidence base through literature reviews and meta-analyses [6,7,8,9,42,49,50,51,52], and expert consultations [6,9,52] are critical to fill the knowledge gaps in guidance documents. Furthermore, extended building closures such as those during the COVID-19 pandemic have triggered the need to formulate consistent guidance for building water quality [6,7].
While developing scientific-based consensus guidance is one part of the problem in managing WQ issues in building plumbing systems, its effective translation to practitioners is another challenge. Studies have been conducted to understand practitioner perspectives on risk management for biosolids [53], bioterrorism [54], unconventional gas extraction [55], and the impact of COVID-19 on environmental and occupational health in buildings [56]. However, to the best of our knowledge, facility managers’ perspectives have not been considered yet in building water quality management research. In a previous study, we [9] investigated subject matter experts’ (SMEs) perspectives and available guidance information for water quality management in large buildings. In this study, we focus on existing water quality management practices in the United States through semi-structured and structured surveys of those managing building water systems. We intend to highlight the concerns of building water facility managers/practitioners regarding prevailing water quality management practices and compare them with the currently available guidance.

2. Methods

Semi-structured interviews and online surveys were conducted to collect information on critical issues of building water quality management. The information was then coded to develop a database on existing practices of water quality management in large buildings in the United States. The process is represented by a schematic shown in Figure 1.

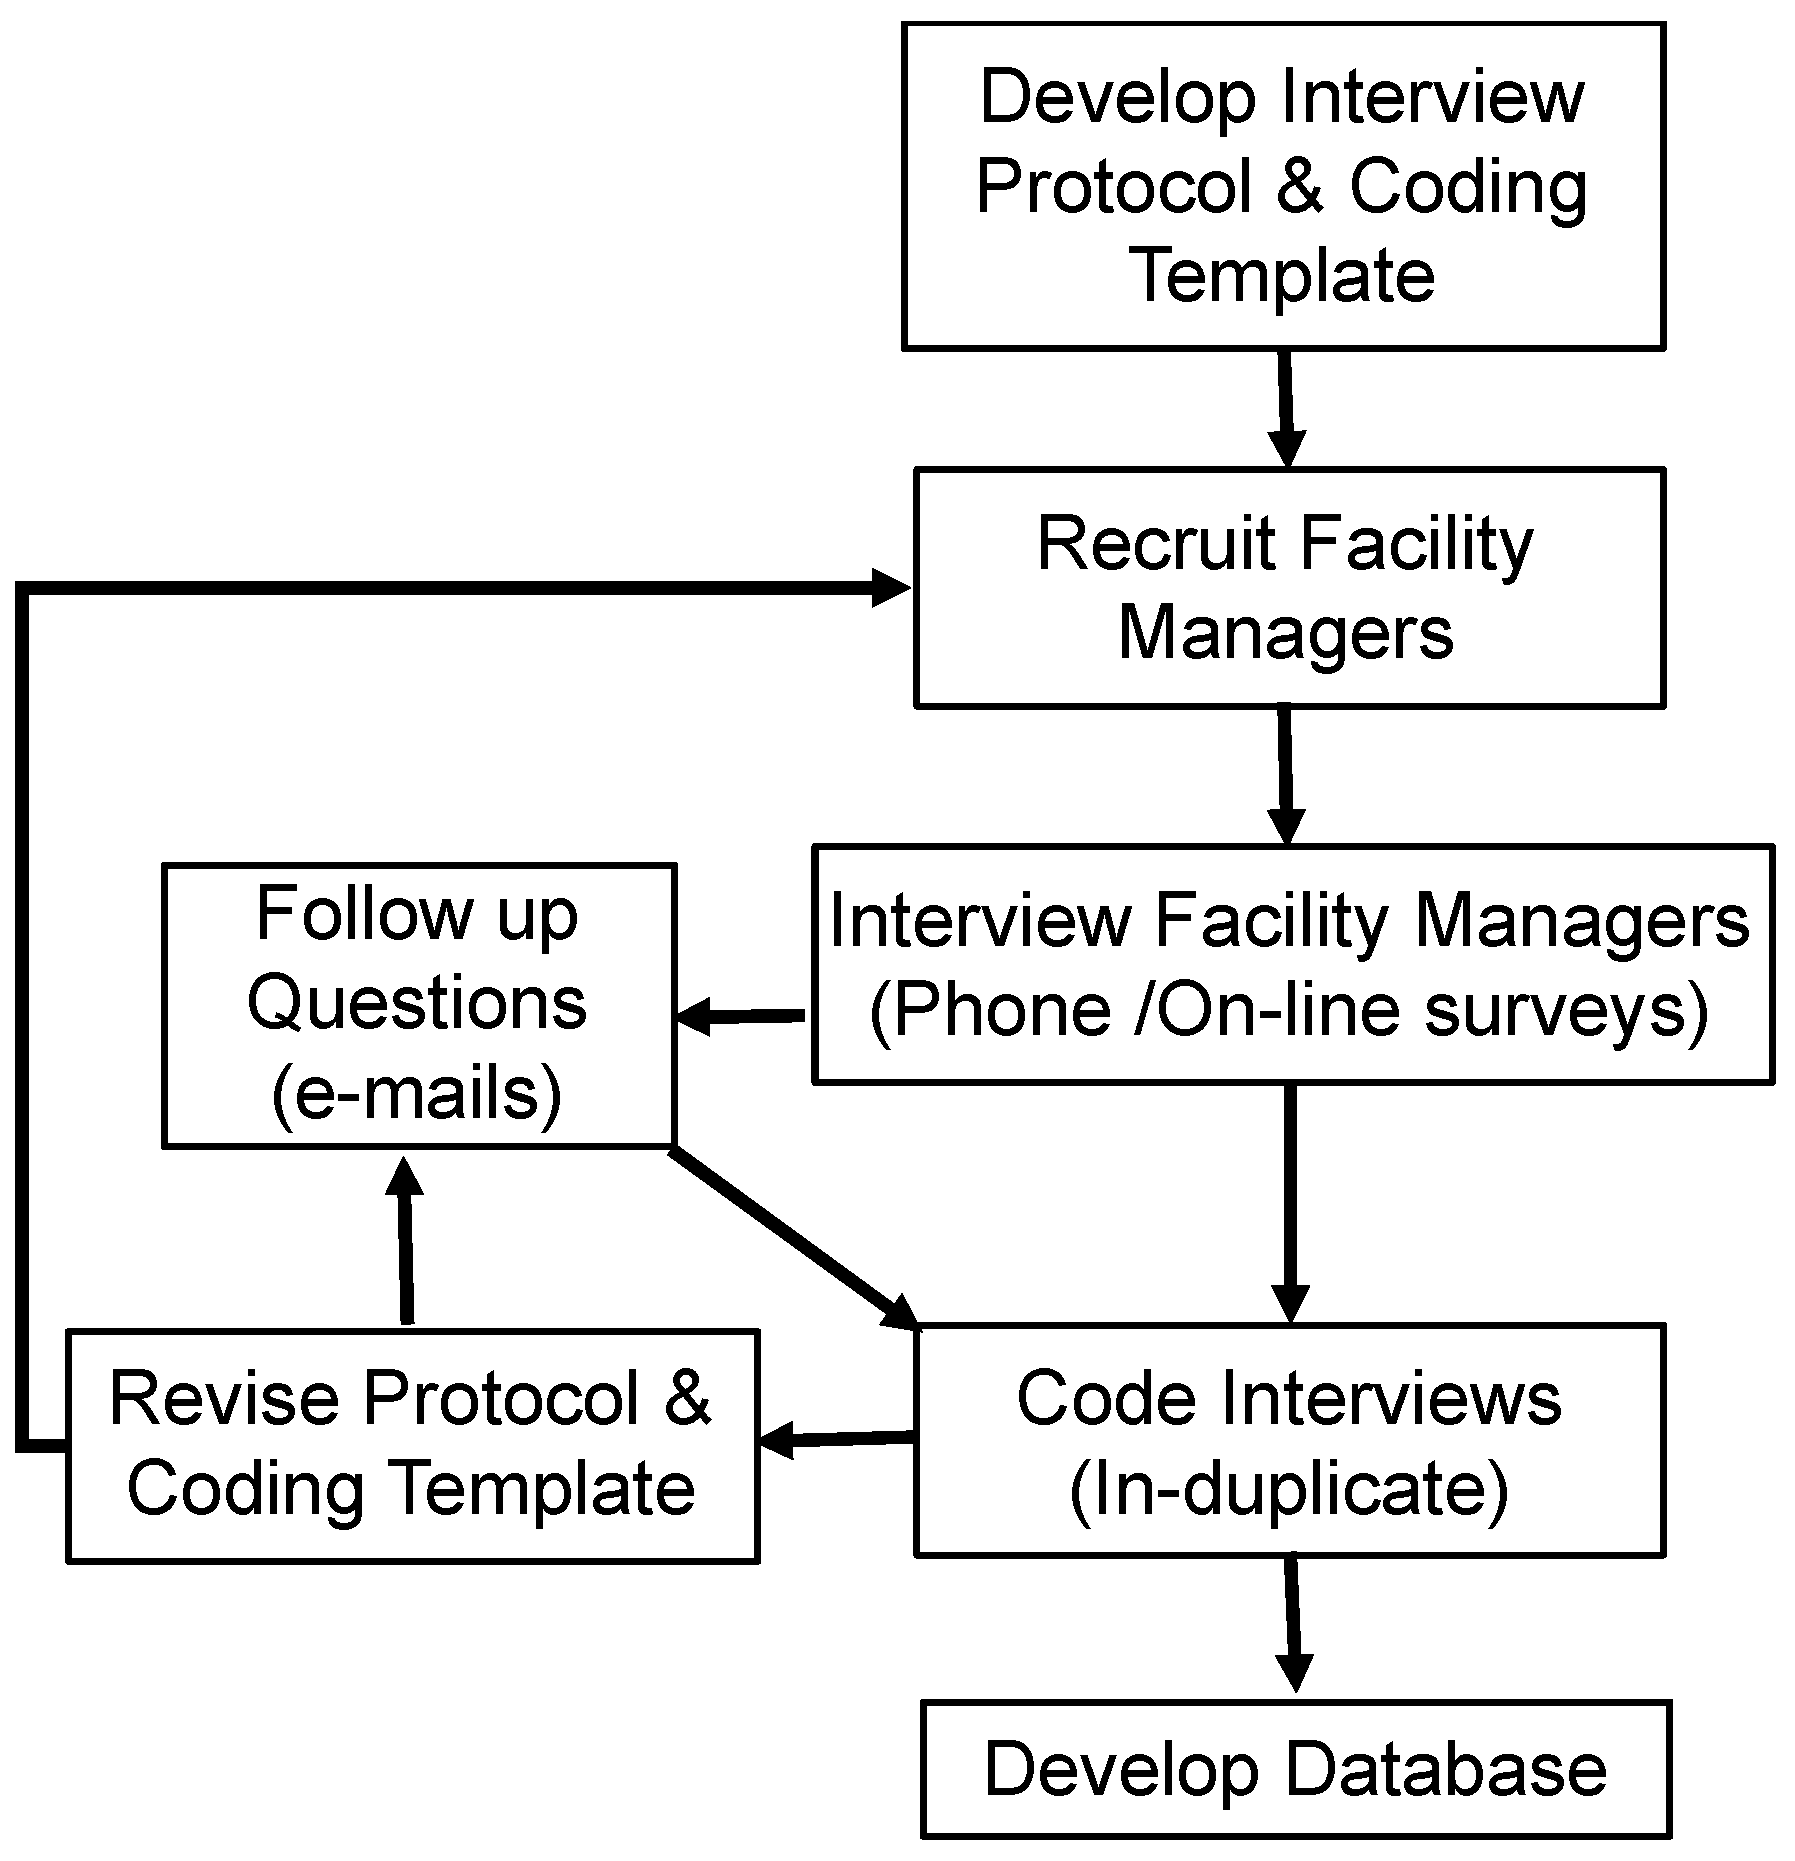
2.1. Interview Protocols

An interview protocol was developed based on critical issues identified during a previous study [9]. The protocol contained questions under the categories shown in Table 1. These categories included building characteristics, plumbing design, water quality monitoring parameters, problematic features, management programs, and control measures. The protocol was designed to carefully capture hot water temperature, one of the most critical and easily measured parameters for controlling Legionella spp. growth [9,10,42]. Temperature monitoring at three critical points in the plumbing system—heater setpoint, temperature in recirculation loop, and temperature at the faucet or point of use (POU)—were included in the protocol. Time to tap was also included to assess the plumbing hydraulic conditions [18]. The plumbing design-related issues included the presence of a recirculation loop, water heater type, and presence of specific plumbing features. In addition, building characteristics, interviewees’ backgrounds, guidance needs, etc., were included in the protocol. The protocol for the phone interviews was developed initially. A coding system was developed to categorize responses. Once several interviews were coded, a structured survey instrument was developed to capture the information that was being coded from the interviews. The structured survey was then used for subsequent data collection, as it was more time-efficient for both investigators and participants and greatly facilitated recruitment as participants did not need to schedule calls but could self-administer the survey. Follow-up emails were sent to participants to collect any missing information or clarification. A copy of the structured protocol is provided in the Supplementary Information.

2.2. Recruitment of Building Water Quality Managers

Approval for human research subjects for this study was provided by the Drexel Institutional Review Board (IRB ID# 1705005417). Building facility managers, superintendents, and other practitioners responsible for water quality management in large buildings were recruited and will be referred to as “facility managers” hereafter. The inclusion criteria included practitioners managing buildings in the United States with centralized hot water systems, including hospitals, retirement homes, rehabilitation centers, nursing homes, hotels, residential communities, and other businesses. The objective of the study was to identify common issues and approaches but not to seek to identify the precise frequency of different issues in the national population. For this reason, a convenience sampling approach was adopted. For semi-structured interviews, subjects were recruited via emails and phone calls to contacts obtained from an internet search, referral-based (snowball) recruitment, and queries of professional organizations of facility managers. For the online survey, recruitment was conducted via contacting potential recruits directly on LinkedIn. A small gift card (USD 25) was offered to participants who completed the survey.

2.3. Data Collection and Coding Responses

Interviews were conducted by telephone and lasted from 30 to 60 min. To establish the consistency of the interview process, two interviewers generated their own set of interview notes. The interviewers coded the two sets of interview notes individually, without consultation with the other set of notes, based on a pre-designed template. The coded responses were then compared, and points of disagreement were discussed between the two interviewers to reach a consensus and clarify how such instances would be coded in the future. If required, facility managers were contacted to resolve any confusion or clarification. After coding seven interviews with an inter-rater reliability of >80% on coding, a single interviewer then coded the rest of the interviews.
While the open-ended interview format was helpful in orienting the investigators to the general issues facing facility managers, a preliminary analysis of the results of the interviews indicated that the analysis and presentation of results would focus on responses to a number of structured questions, including monitoring practices, temperatures at different locations (heater, tap, end of recirculation loop), and the presence vs. absence of particular features (thermostatic mixing values, decorative fountains, etc.). Because this information was readily obtained by a structured survey instrument, the remainder of the data were collected using the online survey software program, Qualtrics (Provo, UT, USA). The survey data were collected between March and June 2020. The survey questions and options followed the coding template for phone interviews. These coded interviews and surveys will be collectively referred to as “interviews” from this point onward; they were stored in a database in a Microsoft Excel (v 16.33, Microsoft Corporation, Redmond, WA, USA) spreadsheet and used for different analyses, as discussed in the section below.

2.4. Database Processing

Over 100 contacts were made for semi-structured phone interviews via emails and phone calls, and 195 contacts were made for the structured online survey through LinkedIn and emails. A total of 15 facility managers participated in the semi-structured phone interviews and a total 34 facility managers responded to the Qualtrics survey. However, some Qualtrics survey participants did not respond to enough prompts to be included in the analysis. A threshold response level of 40% of the total questions was set for an online survey to be considered as complete. Six survey responses were below this threshold level, and hence were removed from the database.
Efforts were made to reconcile unrealistic or possibly erroneous responses by following up with responders via email. If a response was not received, logical decisions were made to address possible erroneous data points. Specifically, reported POU or recirculation temperatures higher than the heater setpoint temperature were removed from the database. Similarly, unrealistically low temperature values were thought to be reported in °C units (i.e., 60 °C for heater setpoint temperature or 50 °C for recirculation loop temperature). All such reported temperatures values below 70 were assumed in °C and were converted to °F for correct representation in the database. Wherever a range of temperatures was reported, it was replaced with the midpoint of the range. Decimal values that arose due to unit conversion were converted to the nearest whole number. U.S. customary unit °F for reporting temperature is generally popular among practitioners and used in guidance documents in the plumbing industry in the United States. For the convenience of readers, temperatures in both °F and standard °C units are reported after appropriate conversion to the nearest whole number.
The time-to-tap response was coded into three categories- 1 for 0–30 s, 2 for 30–60 s, and 3 for >60 s, corresponding to ranges that are recommended by different guidance documents. Responses such as no delays, instantaneous, immediately, or very quickly were coded as 1, while responses such as “takes not too long” were coded as 2. Buildings were classified as high and low vulnerability based on the population served in the buildings. Responses from hospitals and retirement homes/long-term care facilities were classified as having high-vulnerability occupants, while the rest of the buildings were classified as having low-vulnerability occupants. Buildings serving occupants of both vulnerability classes were considered as serving high-vulnerability occupants.

2.5. Statistical Analyses

Microsoft Excel was used for database management and summary statistic calculations. All other statistical analyses were performed in the R programming language, version 4.0.2. Statistical analyses were performed to determine the consistency of the data collected from the two different methods, phone interviews and online surveys. The Shapiro–Wilk test was performed to check the normality of the data. Independent-samples t-tests and non-parametric Mann–Whitney U tests were performed for normal and non-normal datasets, respectively. A p-value < 0.05 was considered statistically significant.

3. Results

3.1. Database Characteristics

The database included responses from 41 facility managers, 15 of them from telephonic interviews and 26 from online surveys. The participation level (i.e., number of respondents to the number of contacts made) in both methods of data collection was approximately 15%. The median of the number of questions responded to by participants for the combined database was 82%, with a median response value of 96% for the phone interview and 77% for the online surveys. Many participants (88%) were responsible either only for operations or both the design and operations of the building plumbing systems, while only 7% of the participants were responsible for design but not operations. The experience of the participants in their field ranged from 1 year to 45 years. Seventeen (17) out of 41 participants (42%) were from buildings with high-vulnerability residents. The majority of the buildings (93%) had centralized water heating systems and 85% had recirculation systems. The types of water heating systems included gas, electric, and steam.
Table 2 shows results from the statistical analyses performed for four critical parameters. The Shapiro–Wilk normality test shows that the setpoint temperature, recirculation loop temperature, and time to tap are not normally distributed for the online survey groups (p-values < 0.05). Only point-of-use temperature data have p-values > 0.05, and hence normality is not rejected for both online and phone responses. These observations are further supported by q-q plots (shown in Figure S1 in the Supplementary Information), where outliers on tails are clearly evident, except for point-of-use temperature. For the setpoint temperature dataset, the Mann–Whitney U test shows that the data from the phone interview and online survey do not differ significantly (p-value = 0.776). Similar observations were obtained for the recirculation loop temperature (p-value = 0.338) and time to tap (p-value = 0.890). These results indicate that the data from the two data collection methods for both these parameters are not significantly different.
On the contrary, the independent t-test results for point-of-use temperature for the two different data collection methods are statistically significant (p-value = 0.002, i.e., <0.05). These observations indicate that the data for the temperature at the faucet are significantly different between the two data collection methods. Given that the results are not intended as a representative sample, differences among methods of data collection are not fundamentally a concern. However, this does reinforce that the sample collection methodology may influence the results, and the percentages found here should not be interpreted as representative of all buildings.

3.2. Water Quality Monitoring, Management Plans, and Control Measures

Table 3 shows the percentages of the facility managers responses to questions related to building water quality monitoring, management plans, and control measures in buildings with low- and high-vulnerability occupants. The highest number of responses was recorded for temperature monitoring at different points of the plumbing. The results show that greater than 80% of the buildings were monitored for water heater setpoint temperature, temperature at faucet, and time to tap. The return loop temperature was relatively less frequently monitored (~60%) and the distal point temperatures were even less frequently monitored (only 20–35%). The chemical parameters, pH and hardness, were monitored in only ~20% of the buildings and, more surprisingly, residual disinfectant, one of the most critical parameters for microbial control, was monitored in a single-digit percentage of the buildings, i.e., 6% and 4% for high- and low-vulnerability buildings, respectively. On the other hand, microbial monitoring was reported in a higher percentage of the buildings (~40%). In general, the percentages of each parameter monitored in buildings with both low- and high-vulnerability occupants were similar, except for temperature at distal tap, where the percentage of high-vulnerability buildings monitored was significantly higher (Table 3).
A written management plan was available for 59% and 29% of the high- and low-vulnerability buildings, respectively, and only 47% and 21% of them in the respective category archived the results (Table 3). A variety of information sources were used by facility managers for managing their plumbing systems, including guidance from the CDC, ASHRAE, IPC, and city, state, and federal agencies. No one particular guidance was used predominantly, with ASHRE guidance used the most (25%) in low-vulnerability buildings and state guidance used the most (29%) in high-vulnerability buildings (Table 3). A little more than 50% of both types of buildings reported monitoring/flushing/treating their return loop. On-site treatment for sinks/showers, including adding softener and antimicrobial agents (chlorine, UV, etc.), was performed in only 33% of low-risk and 59% of high-risk buildings. More specifically, for showers, one of the most critical plumbing components for Legionella spp. proliferation, head replacement/disinfection were performed in 29% and 25% of high- and low-vulnerability buildings, respectively. Self-draining showers were present in 65% and 33% of high- and low-vulnerability buildings, respectively (Table 3).

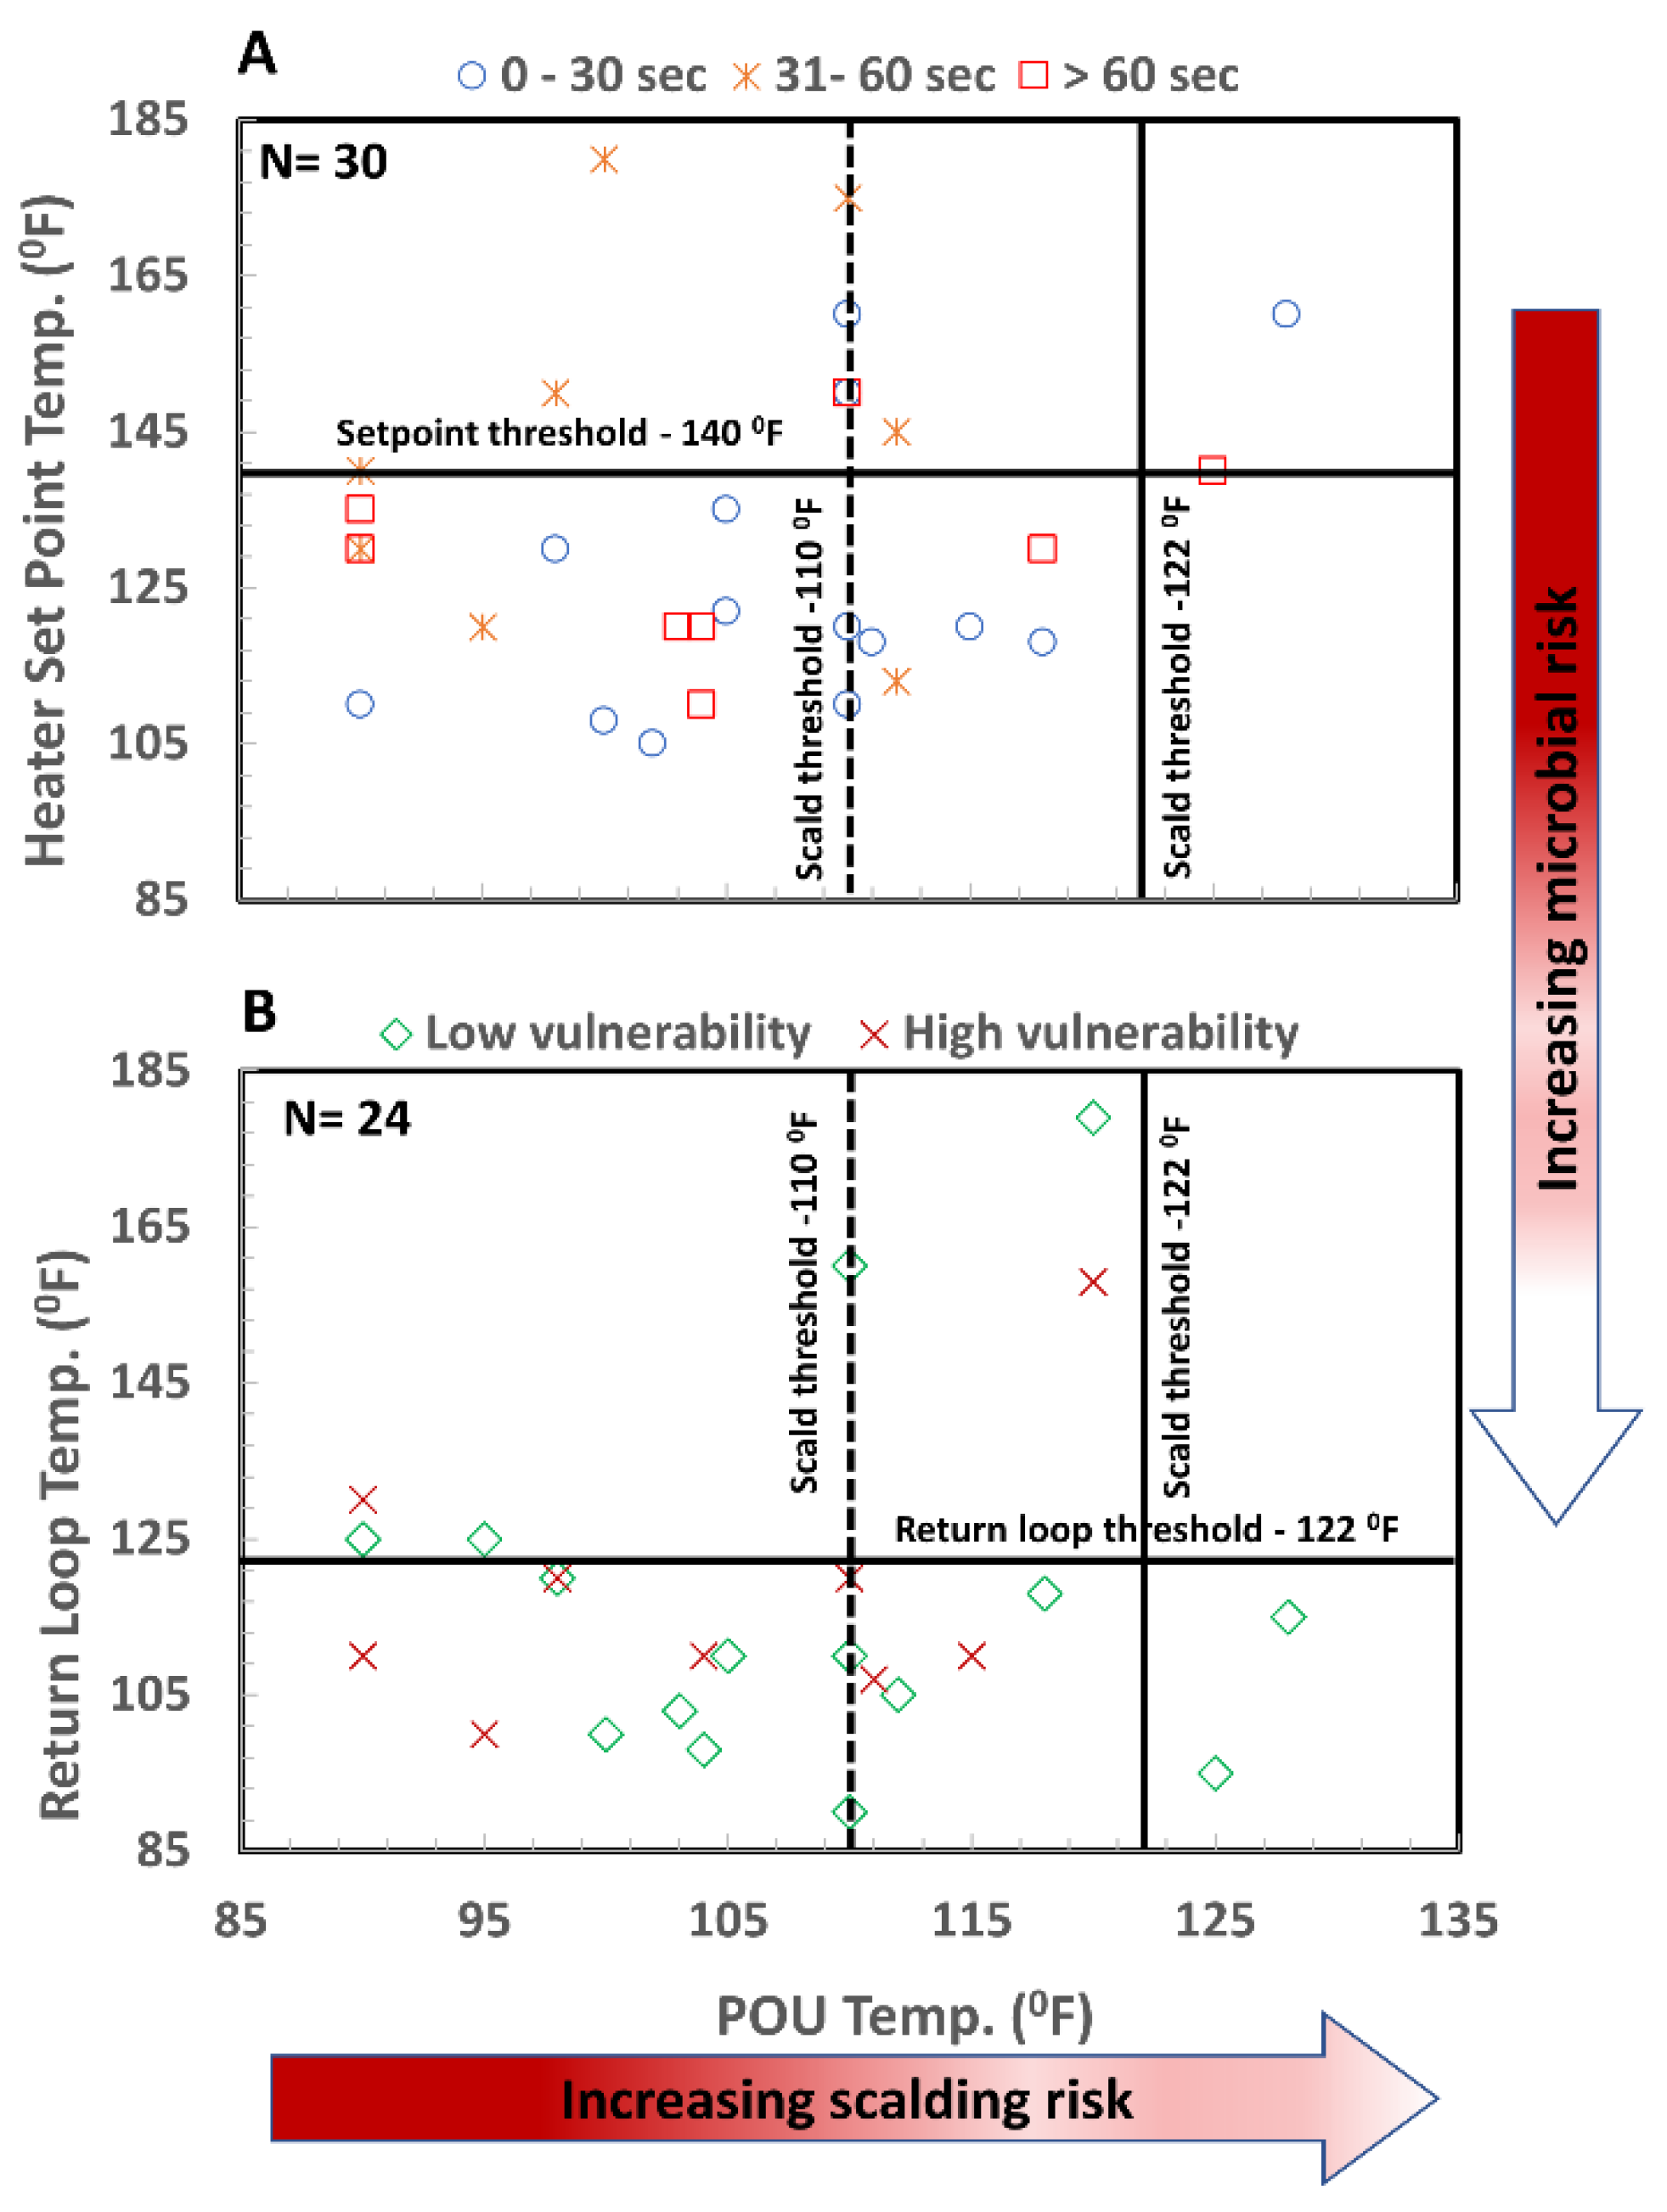
3.3. Temperature Monitoring

Among the completed interviews and surveys (N = 41), > 90% of the participants responded to at least one of the temperature questions. Temperatures for the water in premise plumbing were recorded at three locations—water heater setpoint temperature, hot water temperature at faucet or point of use (POU), and water temperature at the end of the recirculation loop. Summary statistics of these important temperature data from the interviews are shown in Table 4. The median water heater setpoint temperature was 130.0 ± 21 °F (55 ± 12 °C) (N = 35), with a range from 105 °F (41 °C) to 192 °F (90 °C). Follow-up with a facility manager from hospitals indicated that higher temperatures were used for appliances, such as in laboratories and dishwashers, and the temperatures of water for potable or other direct human contact purposes were controlled by thermostatic mixing valves. The median setpoint of 130 °F (55 °C) is lower than the recommended guidance value of 140 °F (60 °C) for OPPP control by five standard guidance documents [12,18,19,22,38] (Table 4). Similarly, the median POU temperature was 110 °F (43 °C) (N = 36, range of 90–128 °F (32–53 °C)), which closely matches the 110 °F recommendation for protection against scalding [19,43] but is more than 10 °F (6 °C) below the recommendations for OPPP control, i.e., 122–124 °F (50–51 °C) [16,22]. Finally, the median recirculation loop temperature was 110 °F (N = 24, range of 90–179 °F (32–82 °C)), which is again approximately 10 °F (6 °C) lower than the standard recommendation, i.e., 122 °F (50 °C) [16,22]. The median maximum temperature loss in building plumbing (i.e., the difference between setpoint temperature and recirculation loop temperature) was 13 °F (7 °C) (N = 22), which is more than the recommended guidance of <9 °F (5 °C) [57] (Table 4). However, the temperature losses ranged between 0 and 45 °F (0–25 °C), which is significantly outside the previously reported values between 6.5 and 29.3 °F (4–16 °C) by Bedard et al. (2015) [10] for a 10-storey children’s hospital building plumbing system.
Time to tap (an indicator of the flow hydraulics as discussed in the Introduction) was <30 s for 49% of the buildings (N = 37), which complies with all three guidance documents considered here [18,22,58]. Time to tap was between 30 and 60 s for 24% of buildings, which complies with two [18,22] of the three guidance documents. Therefore, a total 73% of buildings were in compliance with at least two of the three guidance documents (Table 4). The remaining buildings (27%) had a time to tap > 60 s, which exceeds the recommended value of all three guidance documents. The percentages of time-to-tap-compliant buildings were the same (73%) among the high- and low-vulnerability buildings as well.
Plots in Figure 2 show temperature data with reference to the recommended temperatures from guidance documents. The POU temperatures are plotted against the water heater setpoint temperature for different time-to-tap intervals for the points where observations for all three parameters were available (N = 30) (Figure 2A). Similarly, POU temperatures were also plotted against return loop temperatures for different vulnerability populations for the points where observations for those three parameters were available (N = 24) (Figure 2B). Each data point on these plots represents paired temperature values from the same plumbing system. For both plots, increasing values along the x-axes indicate an increase in scalding risk and increasing values along the y-axes indicate decreasing plumbing pathogen risk—in particular, Legionella spp. The solid vertical lines on both plots at 122 °F (50 °C) represent the risk threshold against scalding as per two guidance documents [16,22]. The dotted vertical lines at 110 °F (43 °C) represent the scalding threshold as per International Plumbing Code guidance [43] and one other guidance document [20], which are applicable to buildings including hospitals and long-term care facilities. The horizontal line on the left plot at 140 °F (60 °C) (Figure 2A) represents the recommended setpoint temperature, and the horizontal line on the right plot at 122 °F (50 °C) (Figure 2B) represents the recommended hot water temperature in the plumbing system/return loop for control of Legionella spp. growth.
The data points in the lower right quadrants of the plots in Figure 2 have the highest risks for both OPPPs and scalding (heater set point for Figure 2A/return loop temperature for Figure 2B are below recommended values for OPPP control, while POU temperature is above scald risk guideline). The data points in the upper left quadrants would have the most favorable situation, with lower risks for both scalding and OPPPs in the water system (POU temperature is below scald risk guideline and water temperature setpoint/return loop temperatures are above the level recommended for OPPP control). Sites in this quadrant (i.e., those that meet the guidance for OPPP control) might have OPPP growth downstream from the heater or recirculation loop, if temperature losses in the distribution system result in a temperature favorable to OPPP growth (roughly < 120 °F (49 °C)).
Only a small fraction of the data points in Figure 2A are in compliance with the recommended guidance for the setpoint temperature of 140 °F (60 °C), i.e., above the horizontal line (Figure 2A, Table 4). On the other hand, nearly all plumbing systems (94%) are in compliance with the less protective scalding guideline of <122 °F (50 °C), and a significant number of them (47%) are below the more protective guideline of 110 °F (50 °C), i.e., left of the corresponding vertical lines (Figure 2A, Table 4). More than two thirds (N = 30) of the data points in Figure 2A are in the lower left quadrant of the plot (i.e., left of the high-vulnerability scald threshold line and below the setpoint line), indicating that there is low to no scald risk in these building plumbing systems, but they are not in compliance with guidance for the water heater setpoint temperature and are therefore prone to Legionella spp. growth risk. Furthermore, the points with a shorter time to tap may be less prone to Legionella spp. growth owing to their short pipe runs and good hydraulic flow balance. In total, more than 60% of the buildings are in violation of the setpoint temperature guidance of > 140 °F (60 °C) and roughly 30% are in violation of the recommended flow hydraulics, i.e., time-to-tap values > 60 s (Table 4).
Data points in Figure 2B also show trends similar to those in Figure 2A, with the majority of data points in the lower left quadrant of the plot. Nearly three quarters (N = 24) of the plumbing systems have a return loop temperature below the recommended temperature of 122 °F (50 °C), and nearly 80% of high-vulnerability buildings were not in compliance (Table 4). Compliance with scald guidance was much better, with 90% and 100% in compliance with <122 °F (50 °C) scald guidance for buildings with low- and high-vulnerability occupants, respectively. The respective compliance values were 52% and 40% when compared with <110 °F (43 °C) scald guidance (Table 4, Figure 2).

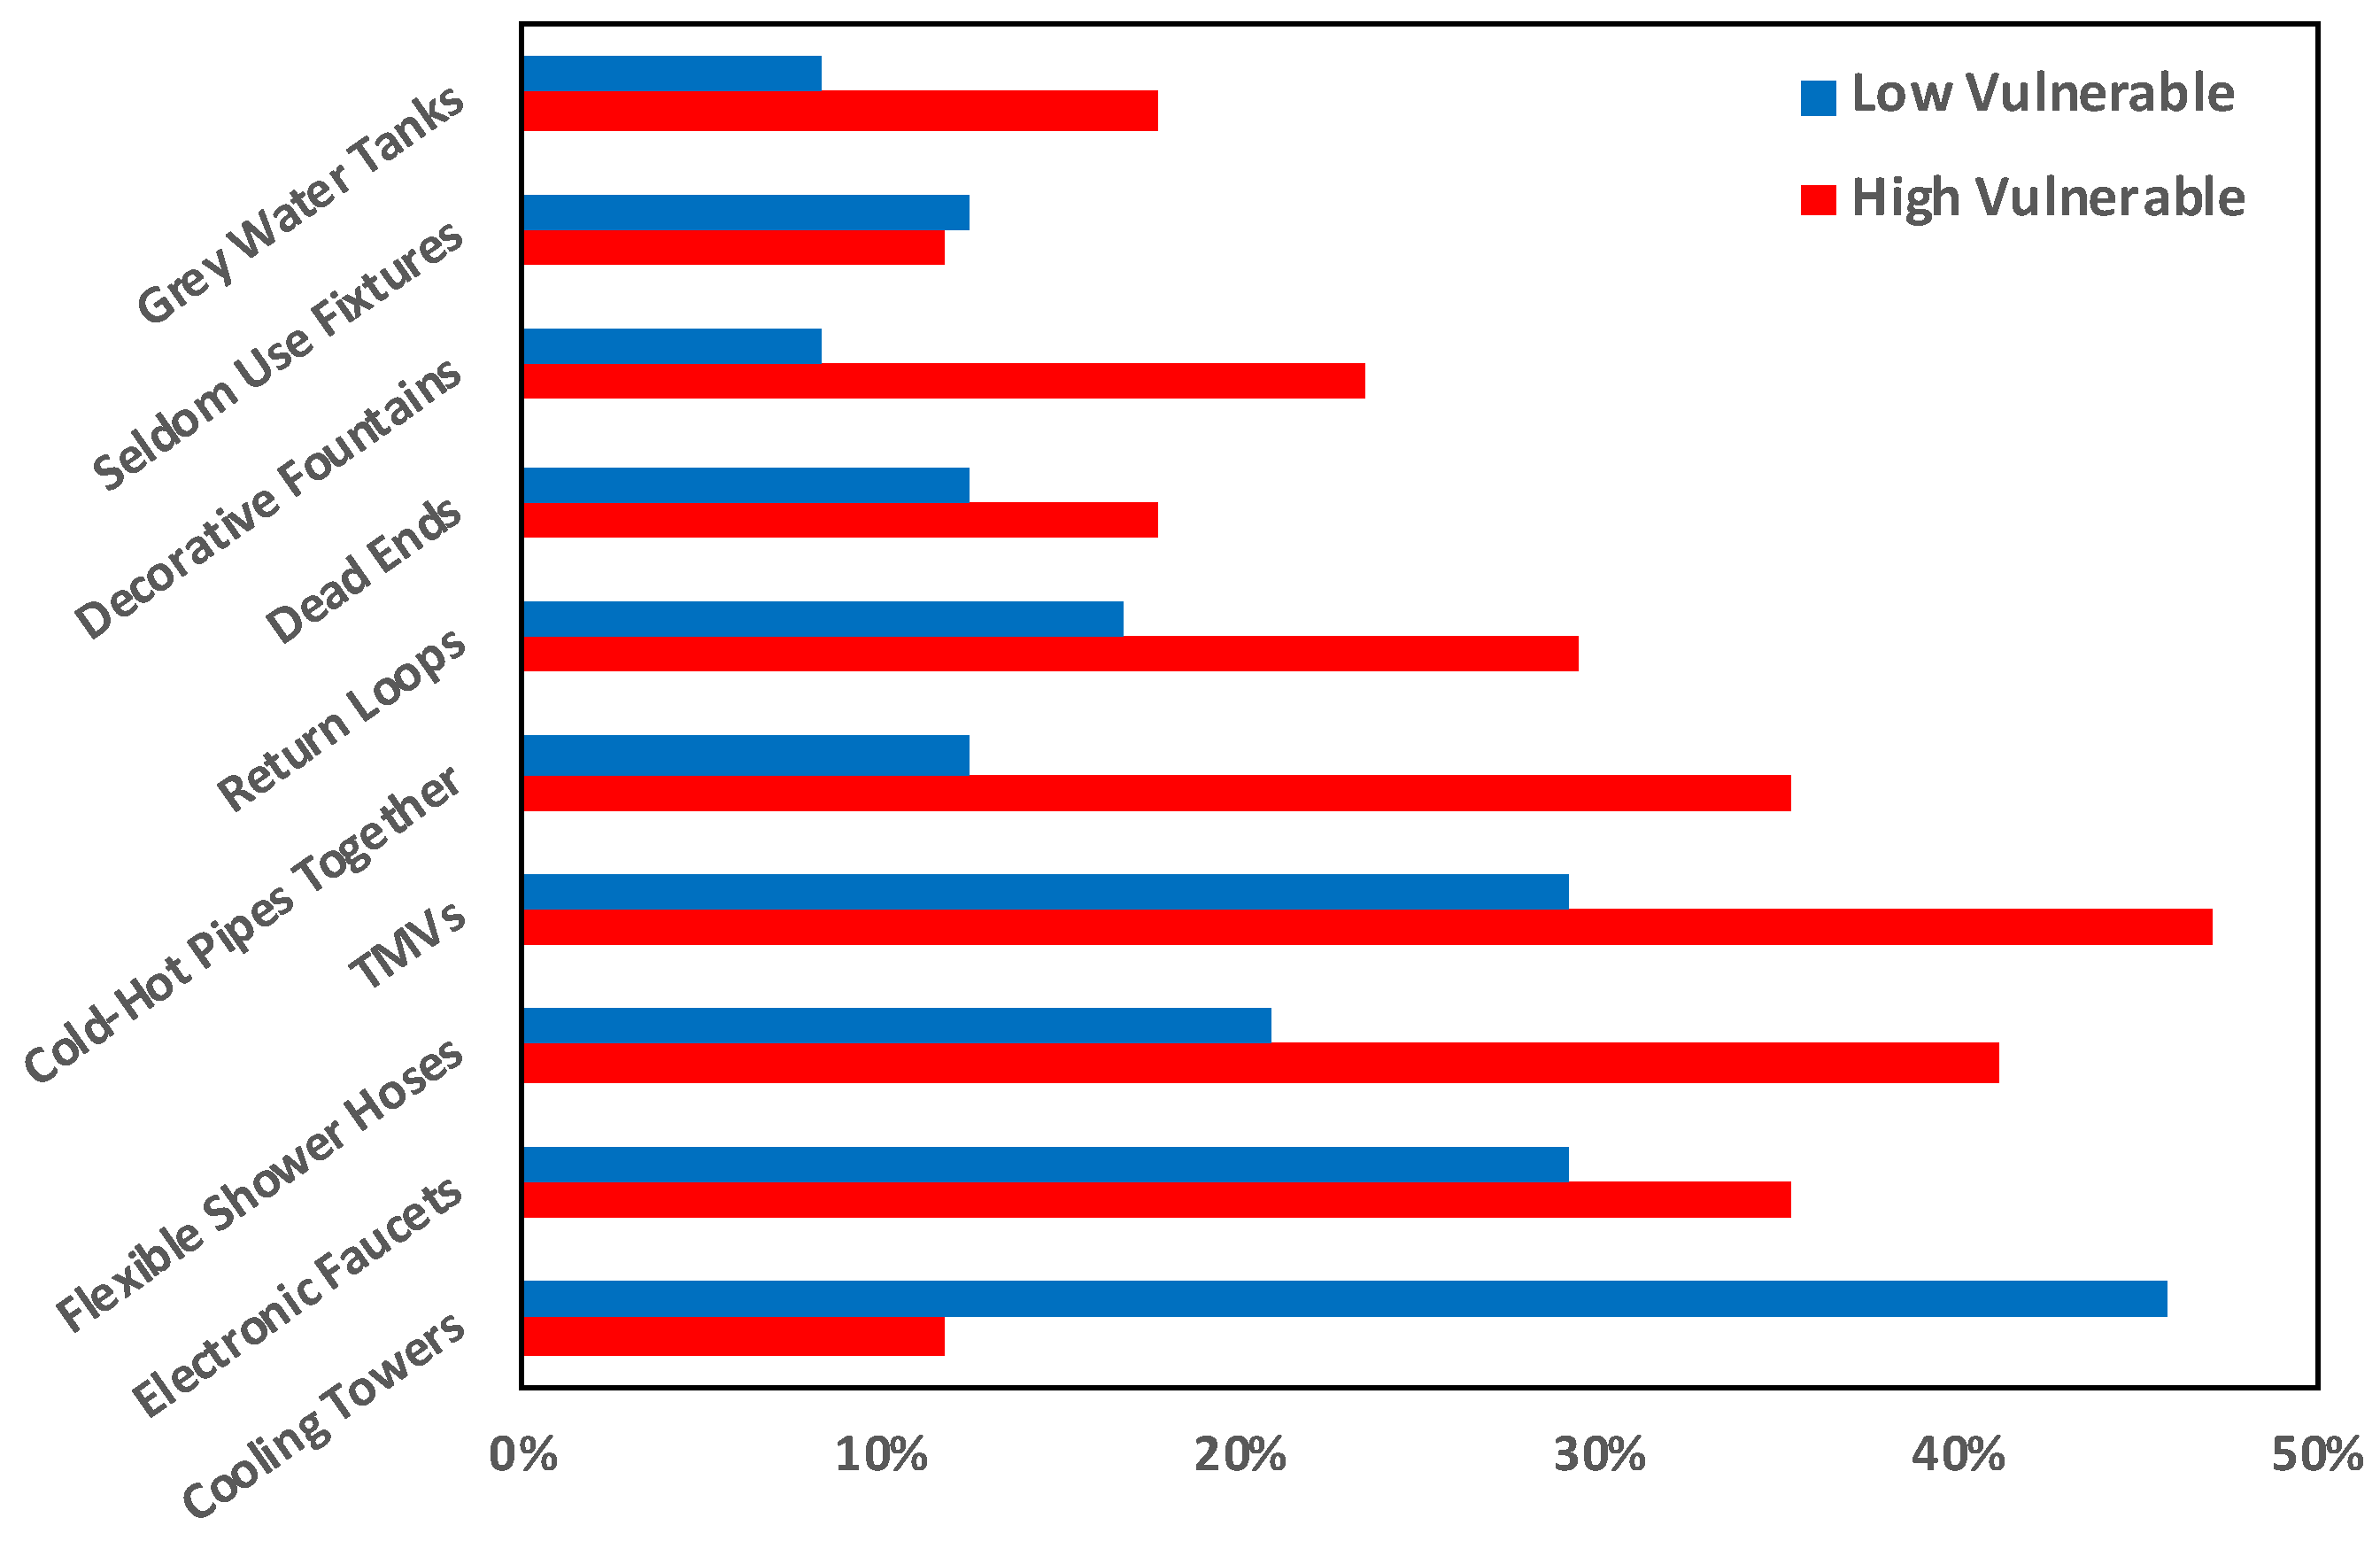
3.4. Potentially Problematic Features in Building Plumbing Systems

Figure 3 shows the frequency of 10 features identified as potentially problematic in previous research [9] for systems with high- and low-vulnerability occupants. TMVs, electronic faucets, flexible shower hoses, and hot and cold water running together (such that the hot water cools and the cold water warms until one or both reach favorable temperatures for OPPP growth) are some of the most sensitive spots for water quality, particularly for high-vulnerability buildings, where 35% or more have one of these features. The TMV percentage in Figure 3 shows the combined frequency of a single centralized TMV after the water heater and TMVs at individual fixtures. TMVs were more commonly reported to be at individual fixtures rather than a centralized TMV after the water heater. The TMVs at individual fixtures were reported at 41% and 17% of the high- and low-vulnerability buildings, respectively, and corresponding percentages for centralized TMVs were 6% and 13%. Other potentially problematic features included cooling towers and return loops. Furthermore, the frequencies of problematic spots were generally higher in buildings with high-vulnerability occupants compared to buildings with low-vulnerability occupants, except for cooling towers and seldom-used fixtures, which were reported more frequently for buildings with low-vulnerability occupants.

4. Discussion

Given the lack of definitive guidance on various issues in building plumbing systems and sometimes even a lack of scientific basis [6,9], it is challenging to select and effectively implement appropriate guidance. Results from this study indicate that the hot water temperatures in a large number of building plumbing systems are not in compliance with guidance for the control of Legionella spp. Both median temperature values for the heater setpoint (130 °F ± 21 °F (54 °C ± 12 °C)) and recirculation loop (110 °F ± 20 °F (43 °C ± 11 °C)) are at least 10 °F (6 °C) lower than the corresponding recommended values of ≥140 °F (60 °C) [12,18,19,22,38] and ≥122 °F (50 °C) [19,22], respectively (Table 4). The median POU/faucet temperatures (110 °F ± 11 °F (43 °C ± 6 °C)) do not provide protection against Legionella spp. growth but do protect against scalding, even for long-duration exposures, and are recommended by some of the guidance for buildings with vulnerable populations [20,43] (Table 4). However, this POU temperature is more than 12 °F (7 °C) below the guidance recommended for OPPP control [16,22].
Nearly two thirds of the buildings have a water heater setpoint temperature below the recommended value for OPPP control of 140 °F (60 °C), of which nearly one third are simultaneously in violation of time-to-tap guidance of < 60 s [18,22] (Figure 2A). Similarly, three quarters of the buildings do not comply with the required return loop temperature ≥122 °F (50 °C), and, even more worryingly, a higher percentage of high-vulnerability buildings (nearly 80%) are not in compliance (Table 4). On the contrary, significantly higher percentages of buildings (>85%) are in compliance with the general scalding risk guidance (<122 °F (50 °C)) [16,22] and nearly two thirds of the high-vulnerability buildings are in compliance with the more stringent scalding risk guidance of <110 °F (43 °C) [20,43] (Figure 2B).
The above observations indicate that the prioritization of scalding risk over Legionella spp. growth risk is common. As a result, there is potential for Legionella spp. growth in building plumbing systems in the US, particularly in free chlorine systems, where little residual persists in hot water systems [59]. This is confirmed by the high frequency of Legionella spp. detection in building plumbing systems [27,28,29,30,31], including hospitals and other high-vulnerability buildings, and increasing Legionnaires’ disease cases in the United States [18,51,60,61,62,63,64]. Considering the high risk associated with Legionnaires’ disease and other water-borne diseases due to contaminated building plumbing systems [65,66,67,68,69,70], which has become more pronounced in partial or complete shutdown scenarios such as during the COVID-19 pandemic [6,7,50,71], it is critical to develop better temperature management plans.
A recent National Academy of Science, Engineering, and Medicine report on Legionella spp. management in premise plumbing [18] summarizes the comparison of Legionella spp. and scalding risk at different temperatures. As per this report, 110 °F (43 °C) causes nearly no scald risk (i.e., several mins of exposure, >35 min, is required to cause first-degree burns [18]) but high Legionella spp. growth potential. In contrast, 120 °F (49 °C) may cause a low to moderate scald risk (i.e., first- and second-degree burns for exposures > 1 min and > 5 min, respectively [18]) and a moderate to very low Legionella spp. risk. Considering these factors, it may be argued that 110 °F (43 °C) at the point of use may be considered applicable only to buildings where occupants may not be able to remove themselves from scalding water. For all other types of buildings where occupants are capable and able to avoid prolonged exposure to hot water, 120 °F (49 °C) may be considered an acceptable temperature at the point of use. For buildings where the point-of-use temperatures must be kept below 110 °F (43 °C) to protect occupants against scalding, the risk of Legionella spp. and other pathogen growth should be mitigated by other controlling factors, such as maintaining the minimum residual concentration, low residence time (flushing), good hydraulics (low time to tap), use of appropriate plumbing materials, aerosol control, or combinations of these factors.
Regular monitoring of plumbing systems is recommended to ensure that water quality parameters are within the guidance limits, and it also helps in identifying unanticipated changes in plumbing systems that can be potentially hazardous for human health [18]. However, though direct Legionella spp. monitoring in building plumbing systems is one of the most essential parts of water quality management practices in Europe and elsewhere, no federal regulations are applicable for the US, and the available directives/standards are inconsistent [16,17,23,24]. Temperature monitoring is one of the most prevalent and effective ways of controlling Legionella spp. growth in premise plumbing in the US [2,9,22]. The monitoring data from this study show that while high percentages of buildings (>80%) were monitored for setpoint and faucet temperatures, significantly lower percentages of return loop (<67%) and distal tap (<35%) temperatures were monitored (Table 3). This indicates a lack of attention to monitoring critical plumbing points that make buildings vulnerable to Legionella spp. growth. Other than the temperature and microbes, the parameters recommended for monitoring for water quality control include disinfectant residual, pH, and hardness (although hardness is generally more relevant to the effectiveness of soaps and detergents than to health issues). These parameters were measured in even much lower percentages of buildings (25% or lower) (Table 3), which may have been because of the complexities of the methods/techniques required and/or a lack of training/skills among facility managers.
The problematic features in building plumbing systems are commonly characterized by one, or a combination, of the four common themes—high water age, lukewarm temperatures, materials that support microbial growth, and/or mist/droplet formation. The potential to produce lukewarm water is a concern for the top six problematic features identified in this study (Figure 3). Three of these top six problematic features, i.e., TMVs, electronic faucets, and flexible shower hoses, have another common problematic aspect, which is the potential for materials to be used that can promote microbial growth [18,20,45,46]. The benefits and risks associated with the use of thermostatic mixing valves (TMVs) are still unclear in guidance documents as well as the scientific literature. TMVs have been associated with the growth of Legionella spp. [46,72]. The use of TMVs and electronic faucets in high-risk buildings requires the use of microbial-growth-resistant materials for the internal parts of these plumbing elements [18,22,38]. Nonetheless, some of the high-vulnerability buildings, particularly hospitals, in this study have used them extensively and have demonstrated their effectiveness with negative Legionella spp. monitoring.
The CDC toolkit [73] recommends having a water management program for high-risk buildings. However, the results in this study show that a low percentage of high-vulnerability buildings have written management plans (59%), and this number is even lower for low-vulnerability buildings (29%). No one guidance document came across as a favorite in this study (Table 3). This may indicate that no one guidance document provides all the information that is applicable to all complex building plumbing scenarios. Instead, multiple documents need to be consulted. For example, ASHRAE 188 [74] does not provide details and specifics of managing building water quality (i.e., temperature, residual, monitoring frequency, etc.) but provides a general framework. The CDC’s toolkit [73] provides guidance on how to implement ASHRAE 188 standards. This highlights the necessity for developing an evidence-based guidance document that is free from gaps and resolves conflicts among the documents. An effort by the National Academy [18] was found to provide close to a comprehensive view on the management of Legionella spp. in building plumbing systems [9].
Considering that showers are one of the most high-risk spots for Legionella spp. because they enable water aerosolization and therefore contribute to transport of OPPPs to hosts, facility managers were specifically asked about preventive maintenance actions related to showers. For high-vulnerability buildings, 65% reported having self-draining hoses present and 29% reported frequent replacement/disinfection of shower heads. Only 29% did not have either of the two control measures for showers. For low-vulnerability-occupant buildings, these control measure percentages were even lower, as 54% did not implement either. Less than 60% reported any monitoring/flushing or treatment in place, although it is difficult to assess how many really need such actions (how many have stagnant zones in their systems). Only a small fraction of these buildings (13% high- and 12% low-vulnerability) simultaneously fail to have monitoring/flushing/treating and recirculation loop temperatures in compliance (>122 °F (50 °C)).
Even though two separate methods were used for data collection in this study, the non-parametric Mann–Whitney U test on the three temperature variables (i.e., heater setpoint temperature, recirculation loop temperature, and time to tap) indicated that the differences in the data collected from the two data collection methods were not statistically significant (p > 0.05). On the other hand, differences in the water temperature at the faucet did differ, with phone interview results being 11.3 °F (6 °C) higher than online survey results. Overall, both groups showed temperatures closer to protection from scalding rather than microbial growth (phone interview median = 114.4, online survey median = 103.1). Measuring the faucet temperature may have various sources of ambiguity, including faucet distance with respect to water heater, presence of TMVs, and the time elapsed between the faucet opening and temperature measurement. The phone interviews provided the opportunity to explain these ambiguities in more detail in comparison to on-line surveys. In addition, the difference in recruiting methods may have affected the type of respondent in some manner.
Recruiting a large number of participants in such a study that requires a certain level of technical expertise and experience is difficult and is one of the limitations of this study. One of the factors behind the lower participation of the facility managers in this study can be attributed to their concerns about identity disclosure, given the potential non-compliance of their buildings, even though they were assured of confidentiality. The time required (30 min or more), particularly for the phone interviews, may have been another reason for difficulties in recruiting. Therefore, an online survey method was adopted for the later part of the study, which was found to be a more effective approach for data collection because of the ease of reaching out to many potential participants in a shorter time-frame. At the same time, incomplete survey response was one of the issues discovered in the online surveys, which was mitigated by requiring responses to at least 40% of questions, including the critical temperature questions, for inclusion in the study. Another limitation of this study is the inability to verify some of the reported data with facility managers. Reasonable corrections were made in such cases, which are described in the Methods section in detail.
Research on managing water quality in large buildings has been receiving more and more attention in recent years, particularly because of extended closures due to COVID-19. Extended building closures have resulted in issues of enormously large water stagnation times in building plumbing systems and hence the risk of microbial contamination of the building water system. While attention is focused on studying improved strategies for flushing, pipe materials, etc. [75], studies focusing on the implementation of water quality measures by building facility managers and practitioners, such as in this study, are rare. More research on developing consistent accepted guidance that is based on scientific evidence and focuses more on monitoring problematic spots is required. Even more critical is evaluating and developing better training and resources for the professional development of the facility managers. Developing strategies for controlling Legionella spp. and other OPPPs’ growth should be prioritized via reducing stagnation times, maintaining residual concentrations, and ensuring balanced hydraulics. Developing guidelines specifically focusing on training and helping building facility managers, such as the recent frameworks developed by AWWA [76] and CDC [77] for responding to prolonged stagnation due to reduced or no water use, such as during COVID-19, or a decision support tool that provides on-demand tailored guidance as per building-specific needs [78], is very critical in handling water quality challenges in buildings.

5. Conclusions

This manuscript presents an assessment of the current water quality management practices in building plumbing systems in the United States through building facility manager interviews and thereby highlights the environmental and health risks related to water quality in buildings. The interview results indicate that the current hot water management practices are aligned more with preventing scald risk than controlling OPPPs, which may explain the constantly increasing Legionnaires’ disease burden in the United States. Nearly two thirds and three quarters of the buildings surveyed in this study do not comply with the common temperature guidance for opportunistic pathogens control for water heater setpoint (≥140 °F (60 °C)) and recirculation loop (≥122 °F (50 °C)), respectively, which are more than 10 °F (6 °C) below the recommended values, and the temperature loss from the water heater to the tap does not comply with the recommended guidance value (<9 °F (5 °C)) in three quarters of the buildings. Further, a large number of buildings lack critical management strategies for controlling opportunistic premise plumbing pathogens, e.g., 33% fail to monitor the recirculation loop temperature, 70% fail to disinfect or replace shower heads on an annual basis, 40% do not have a written management plan, and only less than 10% monitor for residual levels and microbial quality. Based on the poor state of building water quality management practices and lack of strategies to deal with them, coupled with highlighted concerns regarding water quality deteriorations due to extended closures of buildings, such as during the COVID-19 pandemic, this manuscript recommends developing formal training guidelines for facility managers. The areas of concern identified here can inform policy development by regulators and professional societies.

Supplementary Materials

The following supporting information can be downloaded at: https://www.mdpi.com/article/10.3390/w14040663/s1, Figure S1: Q-Q plots for facility managers interview data collected for setpoint temperature (top left), point of use temperature (top right), recirculation temperature (bottom left), and time to tap (bottom right).

Author Contributions

Conceptualization, A.F. and P.L.G.; methodology, R.S., D.C., A.F. and P.L.G.; formal analysis, R.S., D.C., A.F., M.R. and P.L.G.; investigation, R.S., D.C., A.F. and P.L.G.; resources, R.S. and P.L.G.; data curation, R.S., D.C., A.F. and M.R.; writing—original draft preparation, R.S. and D.C.; writing—review and editing, R.S., M.R. and P.L.G.; visualization, R.S. and D.C.; supervision, P.L.G.; project administration, R.S. and P.L.G.; funding acquisition, P.L.G. All authors have read and agreed to the published version of the manuscript.

Funding

This research was developed under Assistance Agreement No. R836880, awarded by the U.S. Environmental Protection Agency. It has not been formally reviewed by the EPA. The views expressed in this document are solely those of the authors and do not necessarily reflect those of the Agency. The EPA does not endorse any products or commercial services mentioned in this publication.

Institutional Review Board Statement

Approval for recruiting human research subjects was provided by the Drexel Institutional Review Board (IRB ID# 1705005417).

Informed Consent Statement

Informed consent was obtained from all facility managers involved in the study. Facility Managers were not personally identified in this work in accordance with the approved protocol.

Data Availability Statement

Data supporting results in this study can are presented in the test body of the manuscript or in the Supporting Information Material.

Conflicts of Interest

The authors declare no conflict of interest that could have appeared to influence the work reported in this manuscript.

References

  1. Bradley, T.C.; Haas, C.N.; Sales, C.M. Nitrification in Premise Plumbing: A Review. Water 2020, 12, 830. [Google Scholar] [CrossRef] [Green Version]
  2. Montagna, M.T.; De Giglio, O.; Napoli, C.; Diella, G.; Rutigliano, S.; Agodi, A.; Auxilia, F.; Baldovin, T.; Bisetto, F.; Arnoldo, L.; et al. Control and Prevention Measures for Legionellosis in Hospitals: A Cross-Sectional Survey in Italy. Environ. Res. 2018, 166, 55–60. [Google Scholar] [CrossRef]
  3. Haubitz, S.; Hitz, F.; Graedel, L.; Batschwaroff, M.; Wiemken, T.L.; Peyrani, P.; Ramirez, J.A.; Fux, C.A.; Mueller, B.; Schuetz, P. Ruling out Legionella in Community-Acquired Pneumonia. Am. J. Med. 2014, 127, 1010-e11. [Google Scholar] [CrossRef] [PubMed]
  4. Barskey, A.; Lackraj, D.; Tripathi, P.S.; Cooley, L.; Lee, S.; Smith, J.; Edens, C. Legionnaire’s Disease Surveillance Summary Report, United States 2016–2017; Centers for Disease Control and Prevention: Atlanta, GA, USA, 2020; p. 50.
  5. Pauli, B.J. The Flint Water Crisis. WIREs Water 2020, 7, e1420. [Google Scholar] [CrossRef]
  6. Julien, R.; Dreelin, E.; Whelton, A.J.; Lee, J.; Aw, T.G.; Dean, K.; Mitchell, J. Knowledge Gaps and Risks Associated with Premise Plumbing Drinking Water Quality. AWWA Water Sci. 2020, 2, e1177. [Google Scholar] [CrossRef]
  7. Proctor, C.R.; Rhoads, W.J.; Keane, T.; Salehi, M.; Hamilton, K.; Pieper, K.J.; Cwiertny, D.M.; Prévost, M.; Whelton, A.J. Considerations for Large Building Water Quality after Extended Stagnation. AWWA Water Sci. 2020, 2, e1186. [Google Scholar] [CrossRef] [PubMed]
  8. Van Kenhove, E.; Dinne, K.; Janssens, A.; Laverge, J. Overview and Comparison of Legionella Regulations Worldwide. Am. J. Infect. Control 2019, 47, 968–978. [Google Scholar] [CrossRef] [PubMed] [Green Version]
  9. Singh, R.; Hamilton, K.A.; Rasheduzzaman, M.; Yang, Z.; Kar, S.; Fasnacht, A.; Masters, S.V.; Gurian, P.L. Managing Water Quality in Premise Plumbing: Subject Matter Experts’ Perspectives and a Systematic Review of Guidance Documents. Water 2020, 12, 347. [Google Scholar] [CrossRef] [Green Version]
  10. Bédard, E.; Fey, S.; Charron, D.; Lalancette, C.; Cantin, P.; Dolcé, P.; Laferrière, C.; Déziel, E.; Prévost, M. Temperature Diagnostic to Identify High Risk Areas and Optimize Legionella pneumophila Surveillance in Hot Water Distribution Systems. Water Res. 2015, 71, 244–256. [Google Scholar] [CrossRef]
  11. U.S. EPA. Drinking Water Criteria Document For Legionella (Final Draft); Environmental Criteria and Assessment Office: Washington, DC, USA, 1985.
  12. OSHA. Legionnaires’ Disease: Section II: What Water Systems in Workplaces Are Potential Sources of Legionnaires’ Bacteria (LDB)? OSHA: Washington, DC, USA, 1996.
  13. CDC. Annex to the Model Aquatic Health Code: Scientific Rationale; Centers for Disease Control: Atlanta, GA, USA, 2016. Available online: https://www.cdc.gov/mahc/pdf/2016-mahc-annex-final.pdf (accessed on 7 February 2022).
  14. CDC. What Clinicians Need to Know about Legionnaires’ Disease; Centers for Disease Control and Prevention: Atlanta, GA, USA, 2017.
  15. Department of Veterans Affairs VHA. Directive 2008-010 Prevention of Legionella Disease; Department of Veterans Affairs: Washington, DC, USA, 2008.
  16. Department of Veterans Affairs VHA. Directive 1061: Prevention of Healthcare-Associated Legionella Disease and Scald Injury from Potable Water Distribution Systems; Department of Veterans Affairs: Washington, DC, USA, 2014.
  17. ASHRAE. ANSI/ASHRAE Standard 188-2018 Legionellosis: Risk Management for Building Water Systems; American Society of Heating, Refrigerating and Air-Conditioning Engineers: Peachtree Corners, GA, USA, 2018; p. 24. [Google Scholar]
  18. NASEM. Management of Legionella in Water Systems; The National Academies Press: Washington, DC, USA, 2019. [Google Scholar]
  19. Bartram, J.; Chartier, Y.; Lee, J.V.; Pond, K.; Surman-Lee, S. Legionella and the Prevention of Legionellosis; World Health Organization (WHO): Geneva, Switzerland, 2007; ISBN 92-4-156297-8. [Google Scholar]
  20. WHO. Water Safety in Buildings. Paper Presented at the World Health Organization (WHO), Geneva, Switzerland. Available online: http://apps.who.int/iris/bitstream/10665/76145/1/9789241548106_eng.pdf (accessed on 29 November 2017).
  21. Government of Western Australia, Department of Commerce, Department of Mines and Petroleum. Code of Practice Prevention and Control of Legionnaires’ Disease; Perth, Australia, 2010. Available online: https://www.commerce.wa.gov.au/sites/default/files/atoms/files/legionnaires-code.pdf (accessed on 7 February 2022).
  22. European Guidelines Working Group. European Technical Guidelines for the Prevention, Control and Investigation, of Infections Caused by Legionella Species; European Society of Clinical Microbiology and Infectious Disease: Basel, Switzerland, 2017. [Google Scholar]
  23. NYC. Health Cooling Tower Requirements: What Building Owners Should Know; New York City Department of Health and Mental Hygiene: New York, NY, USA, 2016.
  24. NYC. Heath Notice of Adoption of Chapter 8 (Cooling Towers) of Title 24 of the Rules of the City of New York; New York City Department of Health and Mental Hygiene: New York, NY, USA, 2016.
  25. Centers for Medicare & Medicaid Services (CMS). Memorandum to State Survey Agency Directors; Center for Medicare and Medicaid Service: Washington, DC, USA, 2017.
  26. ASHRAE. BSR/ASHRAE Standard 188P: Prevention of Legionellosis Associated With Building Water Systems (Second Public Review Draft); American Society of Heating, Refrigeration, and Air Conditioning Engineers: Atlanta, GA, USA, 2011. [Google Scholar]
  27. Codony, F.; Alvarez, J.; Oliva, J.M.; Ciurana, B.; Company, M.; Camps, N.; Torres, J.; Minguell, S.; Jové, N.; Cirera, E.; et al. Factors Promoting Colonization by Legionellae in Residential Water Distribution Systems: An Environmental Case-Control Survey. Eur. J. Clin. Microbiol. Infect. Dis. 2002, 21, 717–721. [Google Scholar] [CrossRef]
  28. O’Loughlin, R.E.; Kightlinger, L.; Werpy, M.C.; Brown, E.; Stevens, V.; Hepper, C.; Keane, T.; Benson, R.F.; Fields, B.S.; Moore, M.R. Restaurant Outbreak of Legionnaires’ Disease Associated with a Decorative Fountain: An Environmental and Case-Control Study. BMC Infect. Dis. 2007, 7, 93. [Google Scholar] [CrossRef] [PubMed] [Green Version]
  29. Wang, H.; Edwards, M.; Falkinham, J.O.; Pruden, A. Molecular Survey of the Occurrence of Legionella spp., Mycobacterium spp., Pseudomonas aeruginosa, and Amoeba Hosts in Two Chloraminated Drinking Water Distribution Systems. Appl. Environ. Microbiol. 2012, 78, 6285–6294. [Google Scholar] [CrossRef] [Green Version]
  30. Kuroki, T.; Watanabe, Y.; Teranishi, H.; Izumiyama, S.; Amemura-Maekawa, J.; Kura, F. Legionella Prevalence and Risk of Legionellosis in Japanese Households. Epidemiol. Infect. 2017, 145, 1398–1408. [Google Scholar] [CrossRef] [PubMed] [Green Version]
  31. Lu, J.; Struewing, I.; Vereen, E.; Kirby, A.E.; Levy, K.; Moe, C.; Ashbolt, N. Molecular Detection of Legionella spp. and Their Associations with Mycobacterium spp., Pseudomonas aeruginosa and Amoeba Hosts in a Drinking Water Distribution System. J. Appl. Microbiol. 2016, 120, 509–521. [Google Scholar] [CrossRef] [PubMed]
  32. Serrano-Suarez, A.; Araujo, R. Evaluation of Legionella Presence in the Water System of a Public Building by Semi-Nested Polymerase Chain Reaction as a Rapid Screening Method Complementary to Plate Count. Water Sci. Technol.-Water Supply 2013, 13, 1560–1568. [Google Scholar] [CrossRef]
  33. Bargellini, A.; Marchesi, I.; Righi, E.; Ferrari, A.; Cencetti, S.; Borella, P.; Rovesti, S. Parameters Predictive of Legionella Contamination in Hot Water Systems: Association with Trace Elements and Heterotrophic Plate Counts. Water Res. 2011, 45, 2315–2321. [Google Scholar] [CrossRef] [PubMed]
  34. Arvand, M.; Jungkind, K.; Hack, A. Contamination of the Cold Water Distribution System of Health Care Facilities by Legionella Pneumophila: Do We Know the True Dimension? Eurosurveillance 2011, 16, 19844. [Google Scholar] [CrossRef]
  35. Martinelli, F.; Caruso, A.; Moschini, L.; Turano, A.; Scarcella, C.; Speziani, F. A Comparison of Legionella Pneumophila Occurrence in Hot Water Tanks and Instantaneous Devices in Domestic, Nosocomial, and Community Environments. Curr. Microbiol. 2000, 41, 374–376. [Google Scholar] [CrossRef]
  36. Stout, J.E.; Muder, R.R.; Mietzner, S.; Wagener, M.M.; Perri, M.B.; DeRoos, K.; Goodrich, D.; Arnold, W.; Williamson, T.; Ruark, O.; et al. Role of Environmental Surveillance in Determining the Risk of Hospital-Acquired Legionellosis: A National Surveillance Study with Clinical Correlations. Infect. Control Hosp. Epidemiol. 2007, 28, 818–824. [Google Scholar] [CrossRef] [PubMed]
  37. Stout, J.; Yu, V.L.; Vickers, R.M.; Zuravleff, J.; Best, M.; Brown, A.; Yee, R.B.; Wadowsky, R. Ubiquitousness of Legionella Pneumophila in the Water Supply of a Hospital with Endemic Legionnaires’ Disease. N. Engl. J. Med. 1982, 306, 466–468. [Google Scholar] [CrossRef] [PubMed] [Green Version]
  38. CDC. Guidelines for Environmental Infection Control in Health-Care Facilities: Recommendations of CDC and the Healthcare Infection Control Practices Advisory Committee (HICPAC); CDC: Atlanta, GA, USA, 2003.
  39. HSE. Programme of Interventions for Controlling Legionella Risks in Workplaces 2013–14: Half-Year Report; Health and Safety Executive: London, UK, 2013.
  40. DH Estates and Facilities Division. HTM 04-01 The Control of Legionella, Hygiene, “Safe” Hot Water, Cold Water and Drinking Water Systems. Part B: Operational Management; National Health Service: London, UK, 2006.
  41. Whiley, H. Legionella Risk Management and Control in Potable Water Systems: Argument for the Abolishment of Routine Testing. Int. J. Environ. Res. Public Health 2017, 14, 12. [Google Scholar] [CrossRef] [PubMed] [Green Version]
  42. Rasheduzzaman, M.; Singh, R.; Haas, C.N.; Gurian, P.L. Required Water Temperature in Hotel Plumbing to Control Legionella Growth. Water Res. 2020, 182, 115943. [Google Scholar] [CrossRef]
  43. International Code Council. 2015 International Plumbing Code; The International Code Council: Washington, DC, USA, 2015. [Google Scholar]
  44. ASPE. Domestic Hot Water Systems: Continuing Education from the American Society of Plumbing Engineers; American Society of Plumbing Engineers: Rosemont, IL, USA, 2015. [Google Scholar]
  45. Niedeveld, C.J.; Pet, F.M.; Meenhorst, P.L. Effect of Rubbers and Their Constituents on Proliferation of Legionella Pneumophila in Naturally Contaminated Hot Water. Lancet 1986, 2, 180–184. [Google Scholar] [CrossRef]
  46. van der Lugt, W.; Euser, S.M.; Bruin, J.P.; Den Boer, J.W.; Walker, J.T.; Crespi, S. Growth of Legionella Anisa in a Model Drinking Water System to Evaluate Different Shower Outlets and the Impact of Cast Iron Rust. Int. J. Hyg. Environ. Health 2017, 220, 1295–1308. [Google Scholar] [CrossRef] [PubMed]
  47. Department of Health (DH). Health Technical Memorandum 04-01 Addendum: Pseudomonas aeruginosa–Advice for Augmented Care Units; Department of Health: London, UK, 2013.
  48. Sydnor, E.R.M.; Bova, G.; Gimburg, A.; Cosgrove, S.E.; Perl, T.M.; Maragakis, L.L. Electronic-Eye Faucets: Legionella Species Contamination in Healthcare Settings. Infect. Control Hosp. Epidemiol. 2012, 33, 235–240. [Google Scholar] [CrossRef] [PubMed]
  49. Cullom, A.C.; Martin, R.L.; Song, Y.; Williams, K.; Williams, A.; Pruden, A.; Edwards, M.A. Critical Review: Propensity of Premise Plumbing Pipe Materials to Enhance or Diminish Growth of Legionella and Other Opportunistic Pathogens. Pathogens 2020, 9, 957. [Google Scholar] [CrossRef] [PubMed]
  50. Falkinham, J.O. Living with Legionella and Other Waterborne Pathogens. Microorganisms 2020, 8, 2026. [Google Scholar] [CrossRef]
  51. Hamilton, K.A.; Prussin, A.J.; Ahmed, W.; Haas, C.N. Outbreaks of Legionnaires’ Disease and Pontiac Fever 2006–2017. Curr. Environ. Health Rep. 2018, 5, 263–271. [Google Scholar] [CrossRef] [PubMed]
  52. Rasheduzzaman, M. Managing Water Quality in Premise Plumbing: Application of Systematic Review, Meta-Analysis and the Delphi Method for Decision Making. Ph.D. Thesis, Drexel University, Philadelphia, PA, USA, 2021. [Google Scholar]
  53. Galada, H.C.; Gurian, P.L.; Olson, M.S.; Teng, J.; Kumar, A.; Wardell, M.; Eggers, S.; Casman, E. Development of Failure Scenarios for Biosolids Land Application Risk Assessment. Water Environ. Res. 2013, 85, 141–150. [Google Scholar] [CrossRef]
  54. Galada, H.C.; Gurian, P.L.; Hong, T. First Responder Knowledge and Training Needs for Bioterrorism. J. Homel. Secur. Emerg. Manag. 2013, 10, 631–660. [Google Scholar] [CrossRef]
  55. Abualfaraj, N.; Gurian, P.L.; Olson, M.S. Frequency Analysis of Failure Scenarios from Shale Gas Development. Int. J. Environ. Res. Public Health 2018, 15, 885. [Google Scholar] [CrossRef] [Green Version]
  56. Awada, M.; Becerik-Gerber, B.; White, E.; Hoque, S.; O’Neill, Z.; Pedrielli, G.; Wen, J.; Wu, T. Occupant Health in Buildings: Impact of the COVID-19 Pandemic on the Opinions of Building Professionals and Implications on Research. Build. Environ. 2022, 207, 108440. [Google Scholar] [CrossRef] [PubMed]
  57. ASPE. Plumbing Components and Equipment. In Plumbing Engineering Design Handbook—A Plumbing Engineer’s Guide to System Design and Specifications; American Society of Plumbing Engineers: Chicago, IL, USA, 2008; Volume 4. [Google Scholar]
  58. ASPE. Domestic Water Heating Design Manual, 2nd ed.; American Society of Plumbing Engineers: Rosemont, IL, USA, 2003. [Google Scholar]
  59. Tolofari, D.; Bartrand, T.; Masters, S.V.; Batista, M.D.; Haas, C.N.; Olson, M.S.; Gurian, P.L. Influence of Hot Water Temperature and Use Patterns on Microbial Water Quality in Building Plumbing System. Environ. Eng. Sci. 2021, 1–11. [Google Scholar] [CrossRef]
  60. Donohue, M.J.; O’Connell, K.; Vesper, S.J.; Mistry, J.H.; King, D.; Kostich, M.; Pfaller, S. Widespread Molecular Detection of Legionella Pneumophila Serogroup 1 in Cold Water Taps across the United States. Environ. Sci. Technol. 2014, 48, 3145–3152. [Google Scholar] [CrossRef]
  61. Hicks, L.A.; Garrison, L.E.; Nelson, G.E. Legionellosis--United States, 2000–2009. MMWR Morb. Mortal. Wkly. Rep. 2011, 60, 1083–1086. [Google Scholar]
  62. CDC. Legionella (Legionnaires’ Disease and Pontiac Fever). Available online: https://www.cdc.gov/Legionella/about/causes-transmission.html (accessed on 16 August 2017).
  63. CDC. Legionnaires’ Disease Surveillance Summary Report, 2014–2015; Centers for Disease Control and Prevention: Atlanta, GA, USA, 2018.
  64. CDC. Surveillance and Reporting Resources. Available online: https://www.cdc.gov/legionella/health-depts/surv-reporting/case-definitions.html (accessed on 29 August 2021).
  65. Amoueyan, E.; Ahmad, S.; Eisenberg, J.N.S.; Pecson, B.; Gerrity, D. Quantifying Pathogen Risks Associated with Potable Reuse: A Risk Assessment Case Study for Cryptosporidium. Water Res. 2017, 119, 252–266. [Google Scholar] [CrossRef] [PubMed]
  66. Hamilton, K.A.; Ahmed, W.; Toze, S.; Haas, C.N. Human Health Risks for Legionella and Mycobacterium avium Complex (MAC) from Potable and Non-Potable Uses of Roof-Harvested Rainwater. Water Res. 2017, 119, 288–303. [Google Scholar] [CrossRef]
  67. Hamilton, K.A.; Ahmed, W.; Palmer, A.; Smith, K.; Toze, S.; Haas, C.N. Seasonal Assessment of Opportunistic Premise Plumbing Pathogens in Roof-Harvested Rainwater Tanks. Environ. Sci. Technol. 2017, 51, 1742–1753. [Google Scholar] [CrossRef]
  68. Hamilton, K.A.; Hamilton, M.T.; Johnson, W.; Jjemba, P.; Bukhari, Z.; LeChevallier, M.; Haas, C.N.; Gurian, P.L. Risk-Based Critical Concentrations of Legionella Pneumophila for Indoor Residential Water Uses. Environ. Sci. Technol. 2019, 53, 4528–4541. [Google Scholar] [CrossRef] [Green Version]
  69. Rasheduzzaman, M.; Singh, R.; Haas, C.N.; Tolofari, D.; Yassaghi, H.; Hamilton, K.A.; Yang, Z.; Gurian, P.L. Reverse QMRA as a Decision Support Tool: Setting Acceptable Concentration Limits for Pseudomonas Aeruginosa and Naegleria Fowleri. Water 2019, 11, 1850. [Google Scholar] [CrossRef] [Green Version]
  70. Dean, K.; Mitchell, J. Reverse QMRA for Pseudomonas Aeruginosa in Premise Plumbing to Inform Risk Management. J. Environ. Eng. 2020, 146, 04019120. [Google Scholar] [CrossRef]
  71. Hozalski, R.M.; LaPara, T.M.; Zhao, X.; Kim, T.; Waak, M.B.; Burch, T.; McCarty, M. Flushing of Stagnant Premise Water Systems after the COVID-19 Shutdown Can Reduce Infection Risk by Legionella and Mycobacterium spp. Environ. Sci. Technol. 2020, 54, 15914–15924. [Google Scholar] [CrossRef] [PubMed]
  72. van Hoof, J.; Hornstra, L.M.; van der Blom, E.; Nuijten, O.W.; van der Wielen, P.W. The Presence and Growth of Legionella Species in Thermostatic Shower Mixer Taps: An Exploratory Field Study. Build. Serv. Eng. Res. Technol. 2014, 35, 600–612. [Google Scholar] [CrossRef]
  73. Centers for Disease Control and Prevention. Developing a Water Management Program to Reduce Legionella Growth & Spread in Buildings: A Practical Guide to Implementing Industry Standards; US Department of Health and Human Services: Atlanta, GA, USA, 2017.
  74. ANSI/ASHRAE. ANSI/ASHRAE Standard 188-2015 Legionellosis: Risk Management for Building Water Systems; American Society of Heating Refrigeration and Air Conditioning Engineers: Peachtree Corners, GA, USA, 2015. [Google Scholar]
  75. Tolofari, D.L.; Masters, S.V.; Bartrand, T.; Hamilton, K.A.; Haas, C.N.; Olson, M.; Summers, R.S.; Rasheduzzaman, M.; Young, A.; Singh, R.; et al. Full factorial study of pipe characteristics, stagnation times, and water quality. AWWA Water Sci. 2020, 2, e1204. [Google Scholar] [CrossRef]
  76. Rhoads, W.J.; Prévost, M.; Pieper, K.J.; Keane, T.; Whelton, A.J.; Rölli, F.; Proctor, C.R.; Grimard-Conea, M. Responding to Water Stagnation in Buildings with Reduced or No Water Use: A Framework for Facility Managers; American Water Works Association: Denver, CO, USA, 2020. [Google Scholar]
  77. CDC. Reopening Buildings after Prolonged Shutdown or Reduced Operation. 2021. Available online: https://www.cdc.gov/nceh/ehs/water/legionella/building-water-system.html (accessed on 8 November 2021).
  78. Rasheduzzaman, M.; Singh, R.; Annapoorna Madireddy, L.; Gurian, P.L. Conceptualization to Development of a Decision Support Tool to Manage Building Water Quality. World Environ. Water Resour. Congr. U. S. 2021, 925–936. [Google Scholar] [CrossRef]
Figure 1. Schematic of workflow for building water management practitioner phone interviews and online surveys.
Water 14 00663 g001
Figure 2. POU temperature plotted against (A) water heater setpoint temperature (marker type shows time to tap) and (B) return loop temperature (marker type shows occupant vulnerability). The vertical lines represent temperature threshold lines for safety against scalding at 110 °F (43 °C) (dotted) and 122 °F (50 °C) (solid). The horizontal lines correspond to temperature guidance for control of premise plumbing pathogens (i.e., Legionella spp.) at 140 °F (60 °C) for setpoint (A) and 122 °F (50 °C) for return loop (B).
Water 14 00663 g002
Figure 3. Frequency of different features in building plumbing systems identified in facility managers’ survey.
Water 14 00663 g003
Table 1. Major concerns regarding water quality management in buildings, and topics covered within each of them, in the interview protocol.
Areas of Concern for Plumbing WQTopics Covered
Building characteristics Building types (hospital, retirement homes/assisted living facilities, high rise apartments, hotels, academic institutions, commercial buildings, others); Greater or less than 10 stories; Centralized hot water system present or absent; Heater types (gas, electric, steam, others); Return loop present or absent
Monitoring parametersTemperature at heater, faucet, return loop, distal tap; Time to tap; Hardness; pH; Microbes; Disinfectant residual; Others *
Problematic features Dead ends; Cold and hot water pipes running together; TMVs; Grey water tanks; Cooling towers; Centralized atomizers/misters; Seldom used areas; Decorative fountains; Other water features; Hot tubs (spas); Flexible shower hoses; Electronic faucets; Return loop system; Heat recovery systems *; Solar water heater *; Manifold system *; Splashing faucets *; Laminar flow devices *; Other *
Control measures Return loop monitor/flush/treat; Water treatment at sink or shower (softening, antimicrobial—UV, chlorine, chlorine dioxide, copper/silver); Shower head replaced/disinfected; Hoses drain to empty between usages; Flushing performed in laminar flow devices *
Management plansWritten plan for monitoring? Results archived? Challenges in managing monitoring record? * Support needed in managing records *
Guidance source Guidance from CDC, ASHRAE, EPA, State, City, Utility, IPC, others (LEED, USGBC); Is additional information source required? * Type of information? *
Demographic informationBackground—operation, design, or both; Years of experience
* Topics elicited no responses from the online survey part of the interview, probably due to the technical nature of these topics, and therefore were not considered for any further analyses.
Table 2. Results of Shapiro–Wilk test for normality and independent-samples t-test and Mann–Whitney U test of difference between phone and online survey results.
FactorsShapiro–Wilk Normality TestMann–Whitney U Test/t-Test *
PhoneOnline SurveyW/t *sig.
(Two-Tailed, α = 0.05)
Difference in Median/Mean * (in °F/°C)
W Statssig.
(α = 0.05)
W-Statssig.
(α = 0.05)
Setpoint Temp0.9100.1380.8990.03891410.7760.0
POU Temp *0.9470.5500.9180.06122432.00 × 10−311.3/6
Recirculation Loop Temp0.9560.7820.8890.044744.00.338−10.0/−6
Time to Tap0.7208.89 × 10−40.7721.06 × 10−41520.890−1.0/−1
* Mann–Whitney U test used for all except POU temperature, for which a t-test was used. Value shown is phone survey minus online survey.
Table 3. Percentage responses of facility managers to building water quality monitoring, management plan, and control measure issues.
Monitoring ParametersManagement PlanControl Measures
Parameters Low vuln.High vuln.Parameters Low vuln.High vuln.ParametersLow vuln.High vuln.
Temp. at heater setpoint88%82%Written plan29%59%Return loop monitoring/flush/treat54%59%
Temp. at faucet/POU88%94%Results archived21%47%
Temp. at return loop67%59%Information sourceCDC4%18%Water treatment at sink/shower33%59%
Temp. at distal tap21%35%ASHRAE25%6%
Time to Tap92%88%EPA guidance4%18%Shower head replaced/disinfected25%29%
Hardness25%24%State guidance13%29%
pH25%24%City guidance21%12%Self-draining showers33%65%
Microbes38%41%Utility guideline0%6%
Residual disinfectant 4%6%IPC21%12%
Others13%12%None8%0%
Table 4. Summary statistics of the temperatures recorded during interviews at different locations in premise plumbing.
ParametersInterview Response
°F (°C)
Buildings in Compliance
Total (Low Vuln., High Vuln.)
Guidance for Microbial Control (Except as Noted) °F (°C) or Seconds.References
Water Heater Set Point TempN = 3537% (33%, 43%)≥140 (≥60)OSHA, 1996 [12] CDC, 2003 [38] WHO, 2007 [20] EGWG, 2017 [22] NASEM, 2020 [18]
Median = 130 (54)
Range = 105–192 (41–89)
St. Dev. = 21 (12)
Point-of-Use or Faucet TemperatureN = 3647% (52%, 40%)<110 (<43)
(To control scald risk)
WHO, 2011
IPC, 2015 [43]
Median = 110 (43)
Range = 90–128 (32–53)94% (90%, 100%)<122–124 (<50–51)
To control scald risk
DVA, 2014 [16]
EGWG, 2017 [22]
St. Dev. = 11 (6)
Recirculation Loop TemperatureN = 2425% (27%, 22%)≥122 (≥50)WHO 2007 [19]
EGWG 2017 [22]
Median = 110 (43)
Range = 90–179 (32–82)
St. Dev. = 20 (11)
Temperature Loss in Plumbing (Set Point—Recirculation Loop)N = 2226% (39%, 15%)<9 (<5)ASPE, 2008 [57]
Median = 13 (7)
St. Dev. = 12 (7)
Hot Water Temperature Time to Tap0–30 s
31–60 s
>60 s
(N = 18; 49%)
(N = 9; 24%)
(N = 10; 27%)
73% (73%, 73%)122–131 °F (50–55 °C) at POU in 60 SecEGWG, 2017 [22]
≥131 °F (≥55 °C) at distal point in 60 SecNASEM, 2020 [18]
Publisher’s Note: MDPI stays neutral with regard to jurisdictional claims in published maps and institutional affiliations.

