Article

Experimental and Numerical Study to Investigate the Impact of Changing the Boundary Water Levels on Saltwater Intrusion in Coastal Aquifers

1
Water and Water Structures Engineering Department, Faculty of Engineering, Zagazig University, Zagazig 44519, Egypt
2
Center for Research and Innovation in Construction, Faculty of Civil Engineering, Technical University of Kosice, 040 01 Košice, Slovakia
3
Civil and Environmental Engineering Department, College of Engineering, United Arab Emirates University, Al-Ain P.O. Box 15551, United Arab Emirates
4
National Water and Energy Center, United Arab Emirates University, Al-Ain P.O. Box 15551, United Arab Emirates
5
Department of Environmental Engineering, Faculty of Civil Engineering, Technical University of Kosice, 040 01 Košice, Slovakia
*
Author to whom correspondence should be addressed.
Water 2022, 14(4), 631; https://doi.org/10.3390/w14040631
Submission received: 17 January 2022 / Revised: 10 February 2022 / Accepted: 15 February 2022 / Published: 18 February 2022
(This article belongs to the Special Issue Assessment and Management of Hydrological Risks Due to Climate Change)

Abstract

:
Experimental and numerical models can be used to investigate saltwater intrusion (SWI) in coastal aquifers. Sea level rise (SLR) and decline of freshwater heads due to climate change are the two key variables that may affect saltwater intrusion. This study aims to give a better understanding of the impact of increasing seawater levels and decreasing freshwater heads due to climate change and increasing abstraction rates due to overpopulation using experimental and numerical models on SWI. The experimental model was conducted using a flow tank and the SEAWAT code was used for the numerical simulation. Different scenarios were examined to assess the effect of seawater rise and landside groundwater level decline. The experimental and numerical studies were conducted on three scenarios: increasing seawater head by 25%, 50% and 75% from the difference between seawater and freshwater heads, decreasing freshwater head by 75%, 50% and 25% from the difference between seawater and freshwater heads, and a combination of these two scenarios. Good agreement was attained between experimental and numerical results. The results showed that increasing the seawater level and decreasing freshwater head increased saltwater intrusion, but the combination of these two scenarios had a severe effect on saltwater intrusion. The numerical model was then applied to a real case study, the Biscayne aquifer, Florida, USA. The results indicated that the Biscayne aquifer is highly vulnerable to SWI under the possible consequences of climate change. A 25 cm seawater rise and 28% reduction in the freshwater flux would cause a loss of 0.833 million m3 of freshwater storage per each kilometer width of the Biscayne aquifer. This study provides a better understanding and a quantitative assessment for the impacts of changing water levels’ boundaries on intrusion of seawater in coastal aquifers.

1. Introduction

The lack of natural recharging due to the scarcity of rainfall, associated with overpumping from coastal aquifers to meet increasing water demands, has upset the dynamic balance between seawater and freshwater bodies in coastal aquifers. Seawater intrusion problems have been reported in many coastal aquifers around the globe. Depending on many natural and manmade parameters, the degree of the seawater intrusion may vary from less than 500 m in small, undisturbed aquifers to more than 100 km in large, overexploited aquifers [1,2]. Previous studies estimated that the sea level will increase between 18 cm and 59 cm by the end of this century [3]. Several investigations indicated that climate change may have undesirable impacts on groundwater systems [1]. Chang et al. [4] showed how rising sea levels and changes in freshwater fluxes could affect both confined and unconfined aquifers. Kuan et al. [5] presented the effect of changes in regional fresh water influx and tidal conditions on saltwater intrusion in unconfined coastal aquifers.
Masterson and Garabedian [6] used a 3D model to investigate the effects of rising sea levels on the movement of the freshwater/saline water interface. The results proved that the fresh water/saline water interface decreased due to sea level rise. Sefelnasr and Sherif [7] concluded that sea level rise by 0.5 and 1.0 m could submerge about 19 and 32%, respectively, of the total area of the Nile Delta with seawater. Ketabchi et al. [8] presented a review of sea level rise impacts on seawater intrusion in coastal aquifers. They evaluated the change in saline water toe considering different parameters, including sea level rise, recharge rate changes, land surface inundation, variation of aquifer bed slope and changes in the landward boundary conditions. They concluded that land surface inundation due to sea level rise has a significant impact on the saline water toe location. The results of this study were very much consistent with the results of [7].
Numerical models and field investigation have provided indications that climate change could decrease freshwater flow to groundwater aquifers [6,9,10]. These studies confirmed the importance of understanding the effects of groundwater fluxes on seawater intrusion. Due to density variability, modeling of seawater intrusion problems requires numerical models that incorporate variable density effects. The performance of such models is frequently validated with benchmark cases. A number of numerical models were used to investigate the effect of rising sea levels on seawater intrusion in coastal aquifers. Sherif and Singh [11] were the first to predict the effect of seawater level rise on seawater intrusion. Werner and Simmons [12] studied the impact of sea level rise on seawater intrusion in coastal unconfined aquifers. The study emphasized the importance of inland boundary conditions’ impact on saline water intrusion.
Abd-Elhamid and Javadi [13] developed a finite element model to simulate seawater intrusion in coastal aquifers. The study also investigated the impact of sea level rise combined with groundwater overpumping on seawater intrusion. Sefelnasr and Sherif [7] quantitatively assessed the saline water intrusion in the Nile Delta aquifer under the effects of sea level rise and reduction of the recharge. A 1 m rise in the sea level and a 2.3 reduction in the net groundwater recharge reduced the freshwater volume from 883 billion m3/year to 513 billion m3/year. Morgan et al. [14] carried out numerical modeling to study the occurrence of seawater intrusion overshoot and demonstrated that it can occur on the field scale in unconfined aquifers. Abd-Elaty et al. [15] developed an analytical solution and numerical model to identify SWI in the Middle Nile Delta aquifer, Egypt, due to a change in boundary conditions. The analytical model gave good results compared to the numerical one and was recommended for similar studies. Yang et al. [16] investigated the effect of rising sea level and storm surge in a 2D aquifer at the North German coast. They investigated the effect of heterogeneity on the movement of salt plumes in the aquifer. The results showed that a 1 m sea level rise has moved the fresh water/saline water interface up to 1250 m landward, and the salinized zone has expanded up to 2050 m landward. Abd-Elaty et al. [17,18,19] simulated SWI in a coastal aquifer considering overpumping due to population growth and sea level rise; the results indicated that the aquifer salinity is sensitive to the future impacts.
Despite its usefulness in the verification of numerical models when field data are not available, a limited number of experimental studies for simulating seawater intrusion problems have been reported. As compared to analytical and numerical studies, variable density experimental simulations are not only time consuming and cumbersome but also require special settings, laboratory training and skills that may not always be available. Roger et al. [20] implemented experimental and numerical models to investigate the dynamics of residual saltwater trapped in the storage area upon installation of cutoff walls. The study demonstrated that short walls achieve a faster removal rate of residual saltwater than long walls. Roger et al. [21] developed a physical model to investigate the effects of surface recharge, injection and installation of a cutoff wall in repulsing seawater intrusion. Repulsion of about 5% and 6% were achieved by surface recharge and injection, respectively. Doubling the recharge flux increased the repulsion to about 8% and 12%. Goswami and Clement [22] used a laboratory scale porous media tank to study the transport patterns of a saltwater wedge in a freshwater aquifer. They investigated a number of cases, including a steady state salt-wedge under different hydraulic gradient conditions, a transient salt wedge under intruding wedge conditions, and a transient salt wedge under receding wedge conditions. Chang and Clement [23] conducted a laboratory and numerical study to investigate the transport processes occurring above and within a saltwater wedge. Laboratory data showed that the transport rates within the wedge are almost two orders of magnitude slower than the transport rates above the wedge for the small-scale experimental system, which is characterized by a very low level of mixing.
Tanapol et al. [24] studied the effectiveness of different intrusion controlling methods in unconfined aquifers using scaled down physical models. The investigated methods included injection of freshwater, extraction of saltwater and a subsurface barrier. They concluded that injection of freshwater is more effective than the extraction of saltwater and a subsurface barrier. Morgan et al. [25] used physical sand tank and numerical modeling to assess sea level rise and seawater intrusion in an unconfined aquifer. The results of both physical and numerical models confirmed the occurrence of overshoot. The magnitude of the overshoot was 24% of the change in steady-state interface position. Acosta and Donado [26] conducted a laboratory simulation by using barriers in confined aquifers to consider the effects of stratification. The best barrier performance was observed at the extreme point of the wedge, where 17.8% of intrusion reduction in homogeneous media and 78.9% in stratified media were observed. The highest reduction of seawater intrusion was achieved with the highest injection rate applied at one location. Stratification affected the performance of the hydraulic barrier. Smaller injection rates were essential to decrease the intrusion of saline water in a stratified medium. Abd-Elhamid et al. [27] simulated the SWI in coastal waters using coastal earth fill and considering future sea level rise. The results showed that using coastal earth fill is effective in controlling SWI.
This paper presents experimental and numerical investigations to assess the possible impacts of changing seawater level and landside groundwater level on SWI in coastal aquifers under different scenarios. The numerical model scenarios are verified by the experimental work and then applied to a real case study, the Biscayne aquifer, Florida, USA, to investigate the effect of increasing seawater level and decreasing freshwater heads on seawater intrusion into the aquifer.

2. Materials and Methods

Experimental and numerical models are used to simulate saltwater intrusion in coastal aquifers considering different boundary conditions.

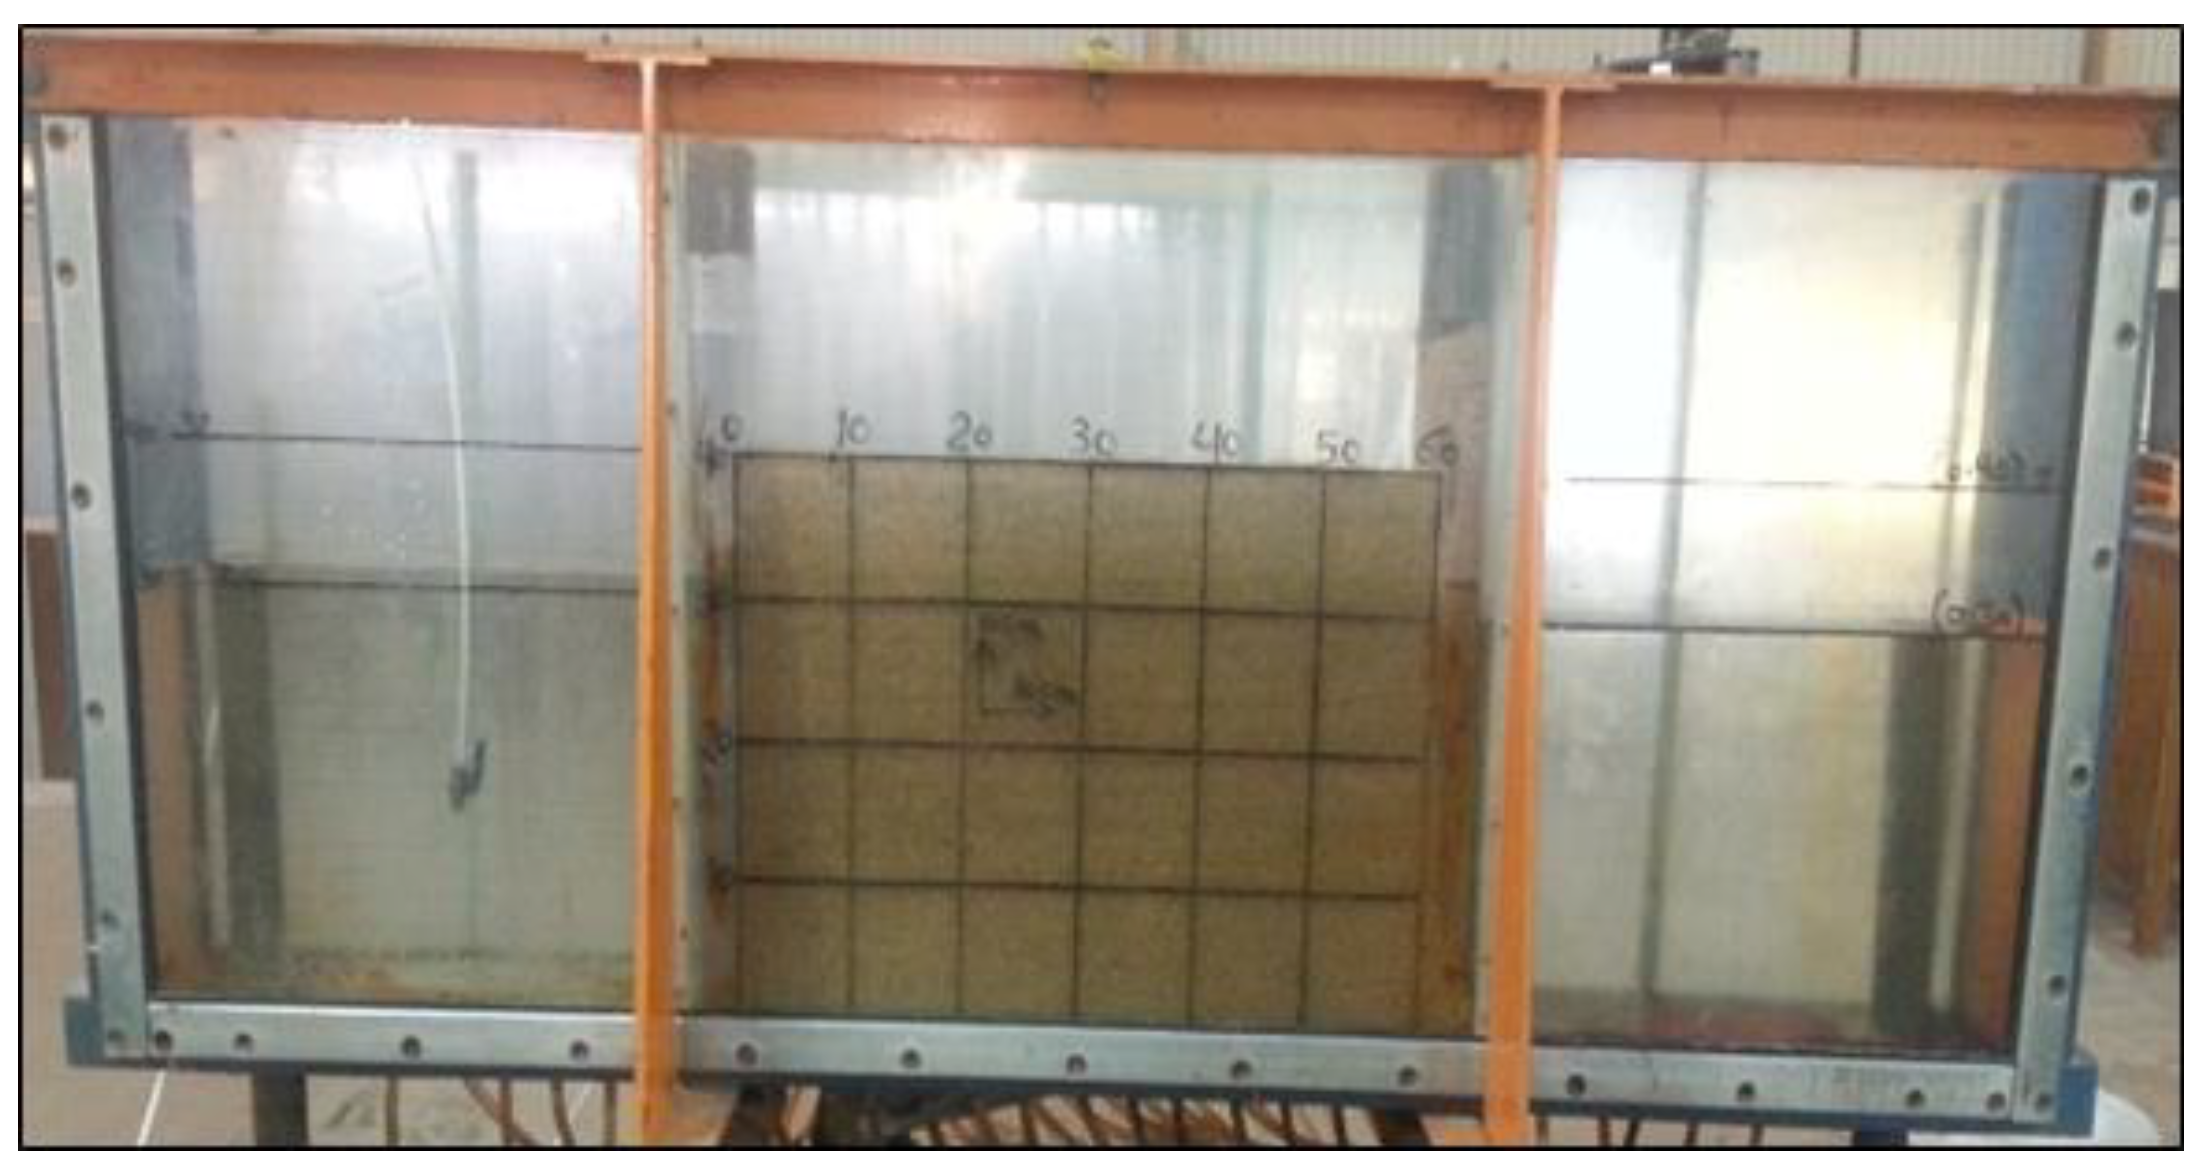
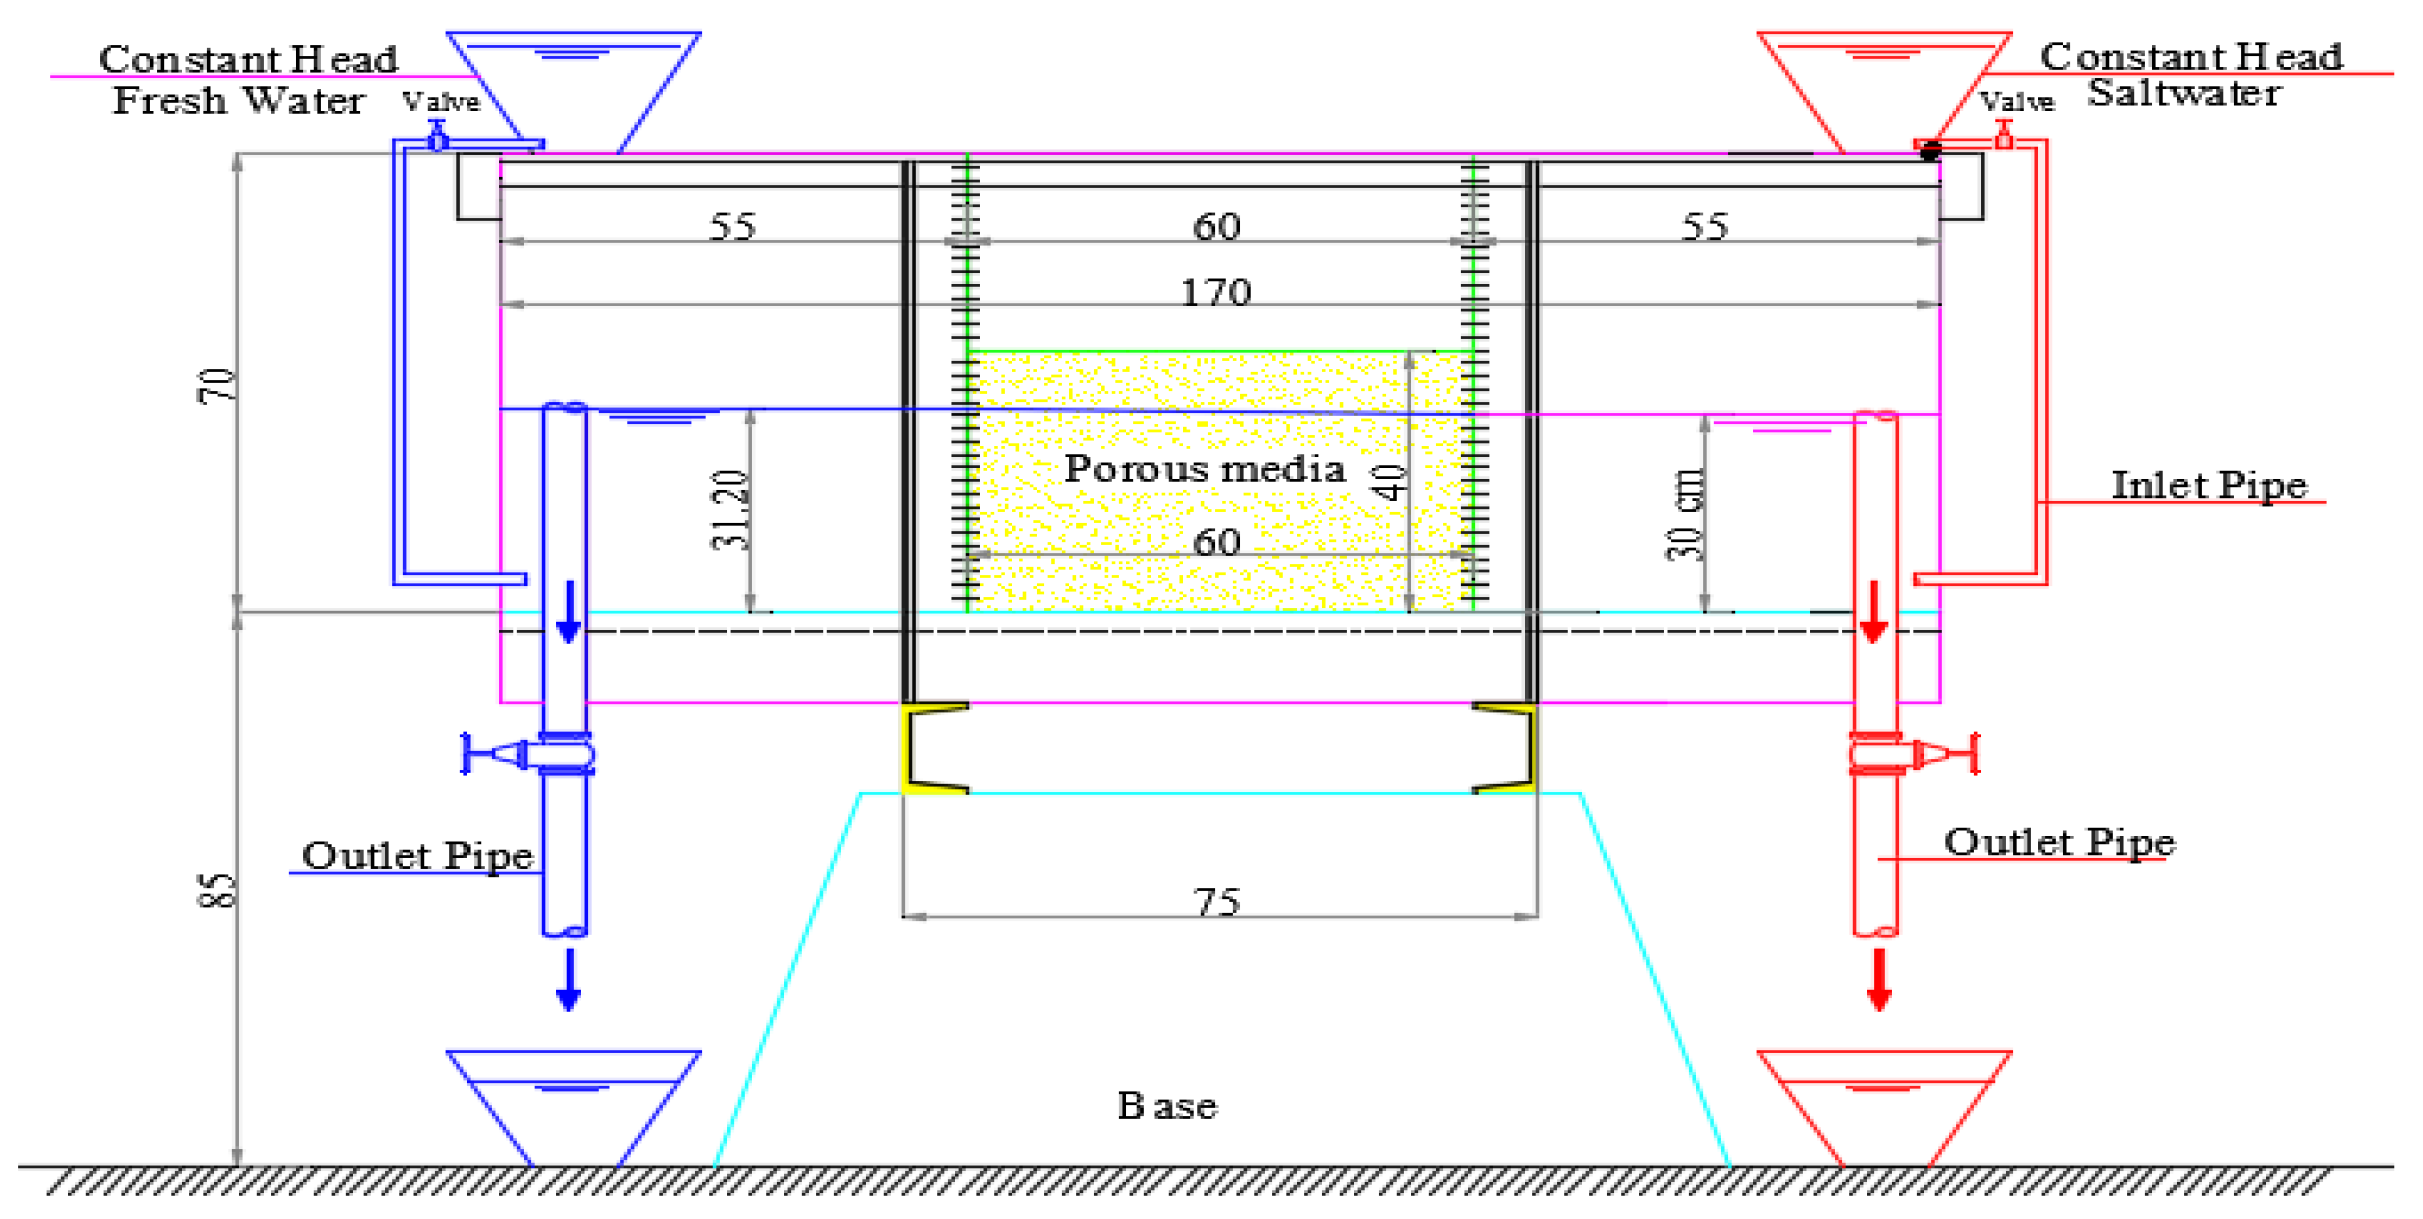
2.1. Experimental Model

The experimental study was conducted using a sand tank physical model. The dimensions of the model were selected based on Henry problem with a 2 (horizontal) to 1 (vertical) ratio [28]. The physical model consists of a rectangular sand tank with two vertical sides of glass (6 mm thickness), as shown in Figure 1. The internal dimensions of the physical model are 60 cm (length), 40 cm (height) and 4 cm (width). Two water tanks were used to feed the sand tank with freshwater and saline water. Two drainage pipes were installed at the two sides to release excess water and control the water level on both sides. The porous medium was contained between two strainers to allow for the water flux. The schematic diagram of the experimental model and dimensions are given in Figure 2.
The setup of the experimental model was done in three steps. First, the sand was deposited in the tank between the two strainers on four horizontal layers, each 10 cm thick. The effective diameter of the sand particles varied between 1.18 and 2.36 mm and their hydraulic conductivity was calculated under the steady-state conditions using Darcy’s law as 28.50 m/day. The porosity of the porous media was determined by laboratory methods as equal to 30%. The saline water was prepared in a 40 L barrel by dissolving an amount of salt in freshwater to reach a concentration of 35,000 ppm. The saline water was dyed with red color to distinguish it from freshwater. The land-side reservoir was filled with freshwater with a concentration of 200 ppm. Second, the freshwater valve was adjusted to keep the freshwater head fixed until the flow reached steady- state conditions. The saline water valve was then released to allow for the intrusion process. Third, different levels of saline water and freshwater heads were considered. The time required to collect a certain volume (50 L) was measured and the discharge was calculated by dividing the collected volume by the time.
In the Base Case, Scenario 1, the freshwater head was maintained at a level of 31.20 cm, while the saline water head was maintained as 30.00 cm, above the base of the tank. The water flux and solute transport were allowed to reach the steady-state conditions (after approximately one hour). Figure 4a shows the steady-state conditions for the Base Case (Scenario 1), in which the seawater intrusion reached a length of 14.25 cm, measured at the sand tank bottom. Three other cases were performed to evaluate the effect of rising sea levels and freshwater head decline on the intrusion length.

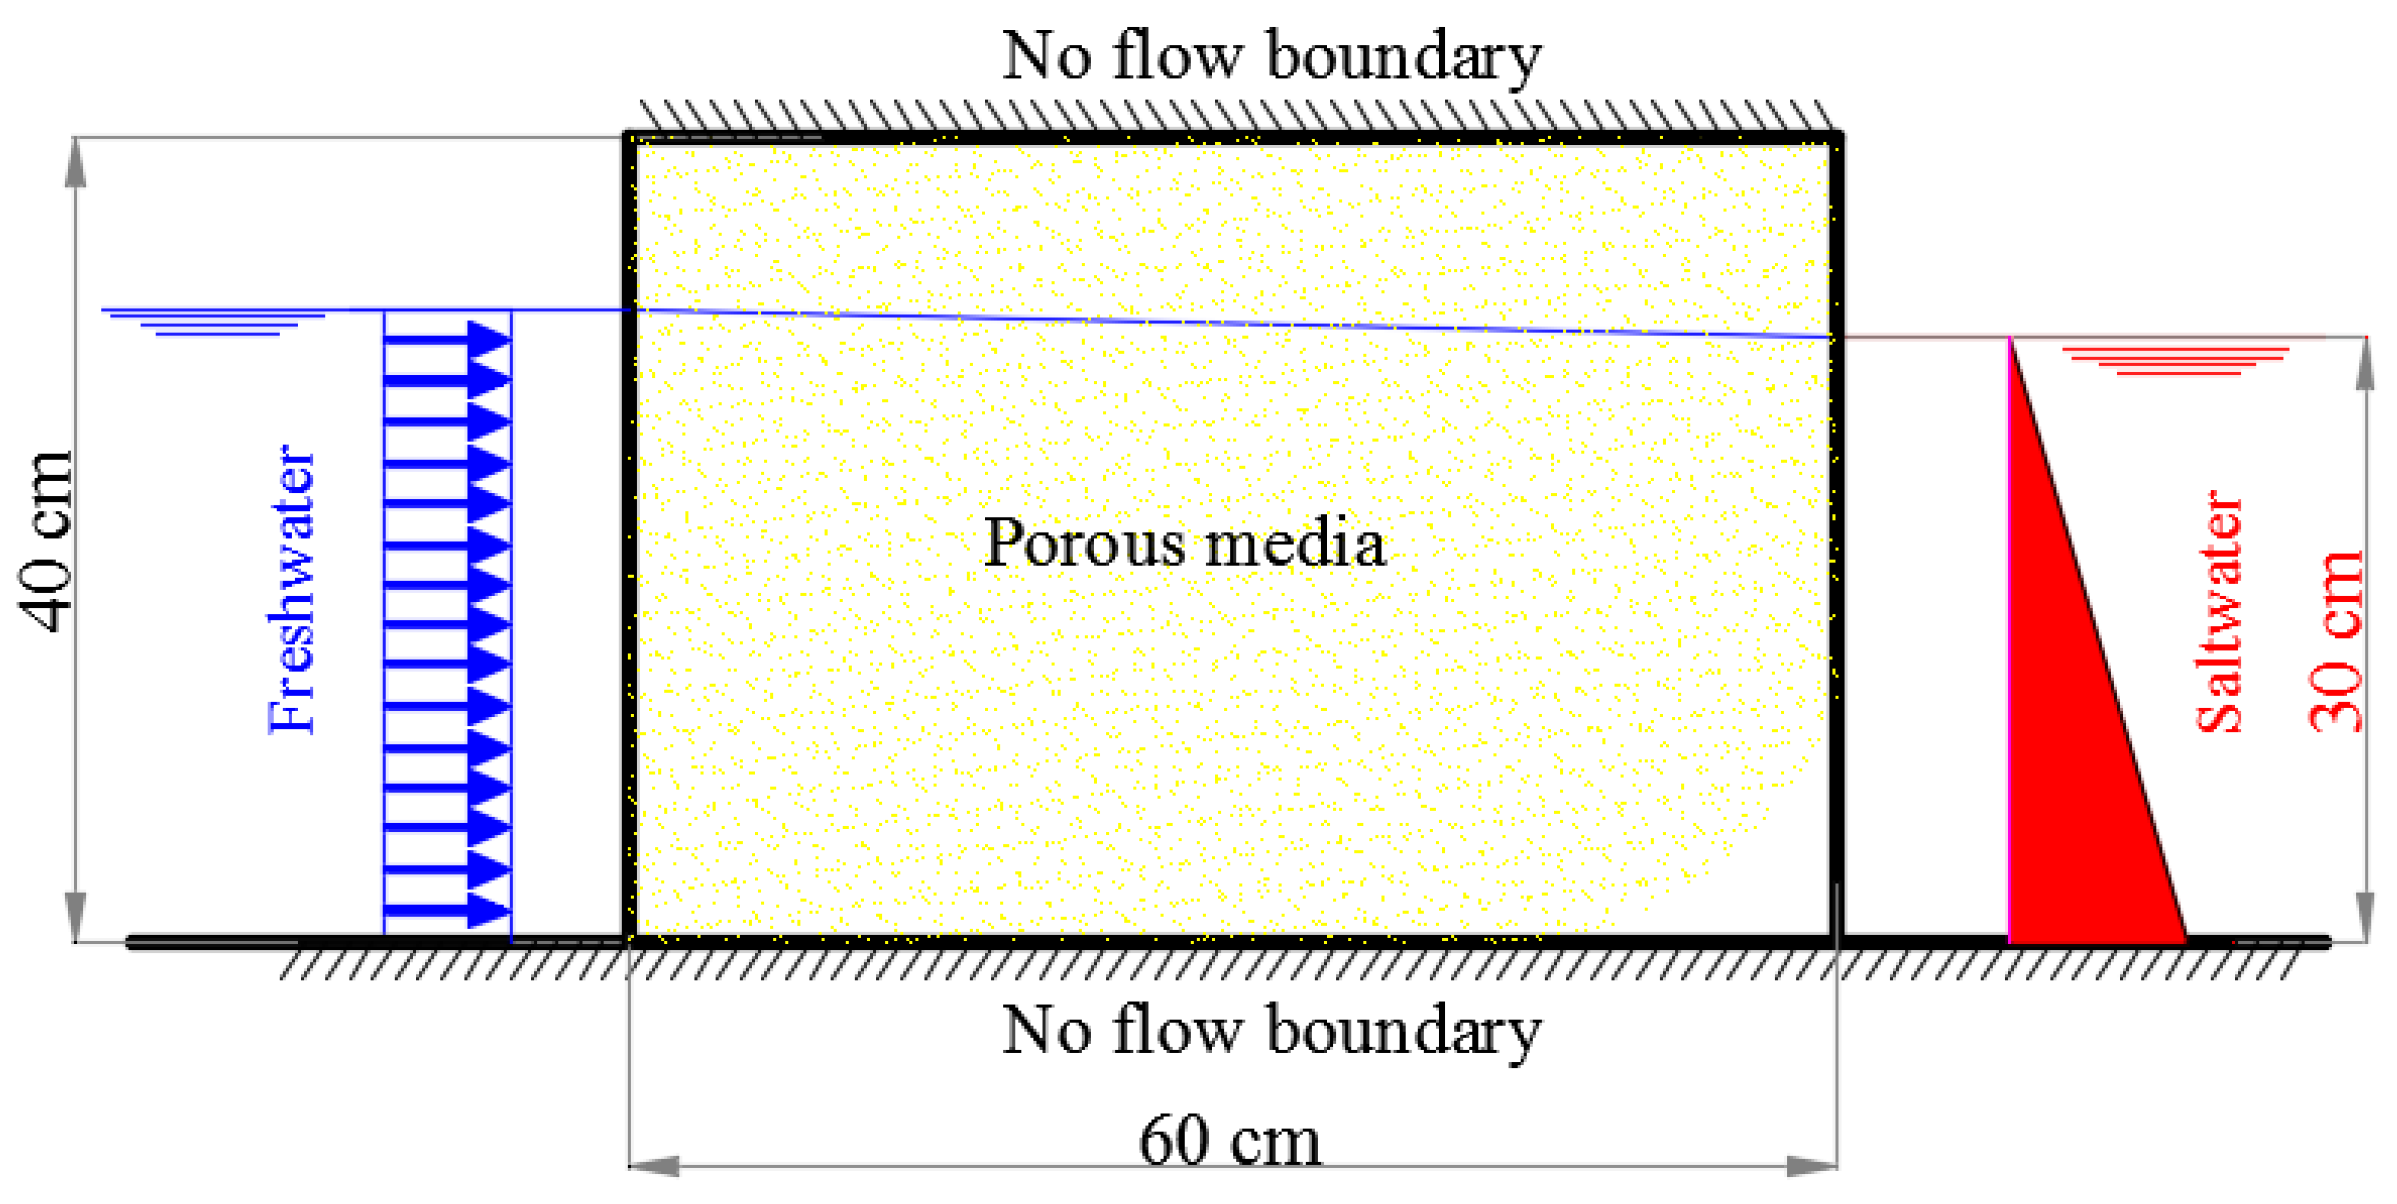
2.2. Numerical Model

SEAWAT code is used in this study, following Langevin et al. [29]. The code combines the modified MODFLOW and MT3DMS into a single program that solves coupled groundwater flow and solute transport equations. The initial code (Guo and Bennett, 1998) [30] and the earlier versions of SEAWAT (Guo and Langevin, [31] and Langevin et al. [32]) were developed for isothermal conditions and, hence, did not solve the problem of simultaneous solute and heat transport with the combined effects of concentration and temperature on variable density flow. SEAWAT has been tested and verified against benchmark problems involving variable density groundwater flow, including the Henry problem, Elder problem and HYDROCOIN problem [31]. The Variable-Density Flow process of SEAWAT uses MODFLOW methodology to solve the variable density groundwater flow equation [32]. The MT3DMS part of SEAWAT solves the solute transport equation. The variable density groundwater flow equation can be written as follows [29]:
[ ρ * μ o μ * K o ( * h 0 + ρ ρ f ρ f * Z ) ] = ρ * S , S , 0 ( h O t ) + θ * ( ρ C ) ( C t ) ρ S * q \ S
where, ρo: is the fluid density (ML−3) at the reference concentration and reference temperature; ρ: is density of saline ground water (ML−3); μo: is dynamic viscosity of the fresh ground water (ML−1 T−1); μ: is dynamic viscosity of saline ground water (ML−1 T−1); K0: is the hydraulic conductivity tensor of material saturated with the reference fluid (LT−1); h0: is the hydraulic head (L) measured in terms of the reference fluid of a specified concentration and temperature (as the reference fluid is commonly freshwater); Ss,0: is the specific storage (L−1), defined as the volume of water released from storage per unit volume per unit decline of h0; t: is time (T); θ: is porosity; C: is salt concentration (ML−3); and q’s:is a source or sink (T−1) of fluid with density ρs.
The solute transport equation can be written as follows [24]:
( 1 + ρ b * K d k θ ) ( θ * C ) t = ( θ D * C k ) ( q * C k ) ( q \ s * C s k )
where ρb: is the bulk density (mass of the solids divided by the total volume) (ML−3); Kdk: is the distribution coefficient of species k (L3 M−1); Ck: is the concentration of species k (ML−3); D: is the hydrodynamic dispersion coefficient tensor (L2 T−1); q: is specific discharge (LT−1); and Csk: is the source or sink concentration (ML−3) of species k.
The boundary conditions and hydraulic parameters play important roles in groundwater modelling [33]. The same domain of the physical model was considered in the numerical study. A study domain of 60 cm in length, 4 cm in width and 40 cm in height was considered. Figure 3 provides a definition sketch of the numerical model. The domain was subdivided into 4 rows, 62 columns and 40 layers. Therefore, cubical cells were generated with a unified length of 1 cm. Only the dimensions of the first and last column cells were taken as 0.4 cm × 0.4 cm × 1.0 cm to represent the freshwater and saltwater heads. The freshwater head at the left side (land boundary) was set as 31.20 cm and the head at the right side (sea boundary) was set as 30.0 cm. The water concentrations at the left and right boundaries were set as 200 ppm and 35,000 ppm, respectively. Table 1 presents the different parameters that have been considered in both the physical and numerical models.
The numerical model was employed to simulate the different scenarios considered in the physical model. Figure 4b provides the results of the numerical model for the Base Case (Scenario 1).

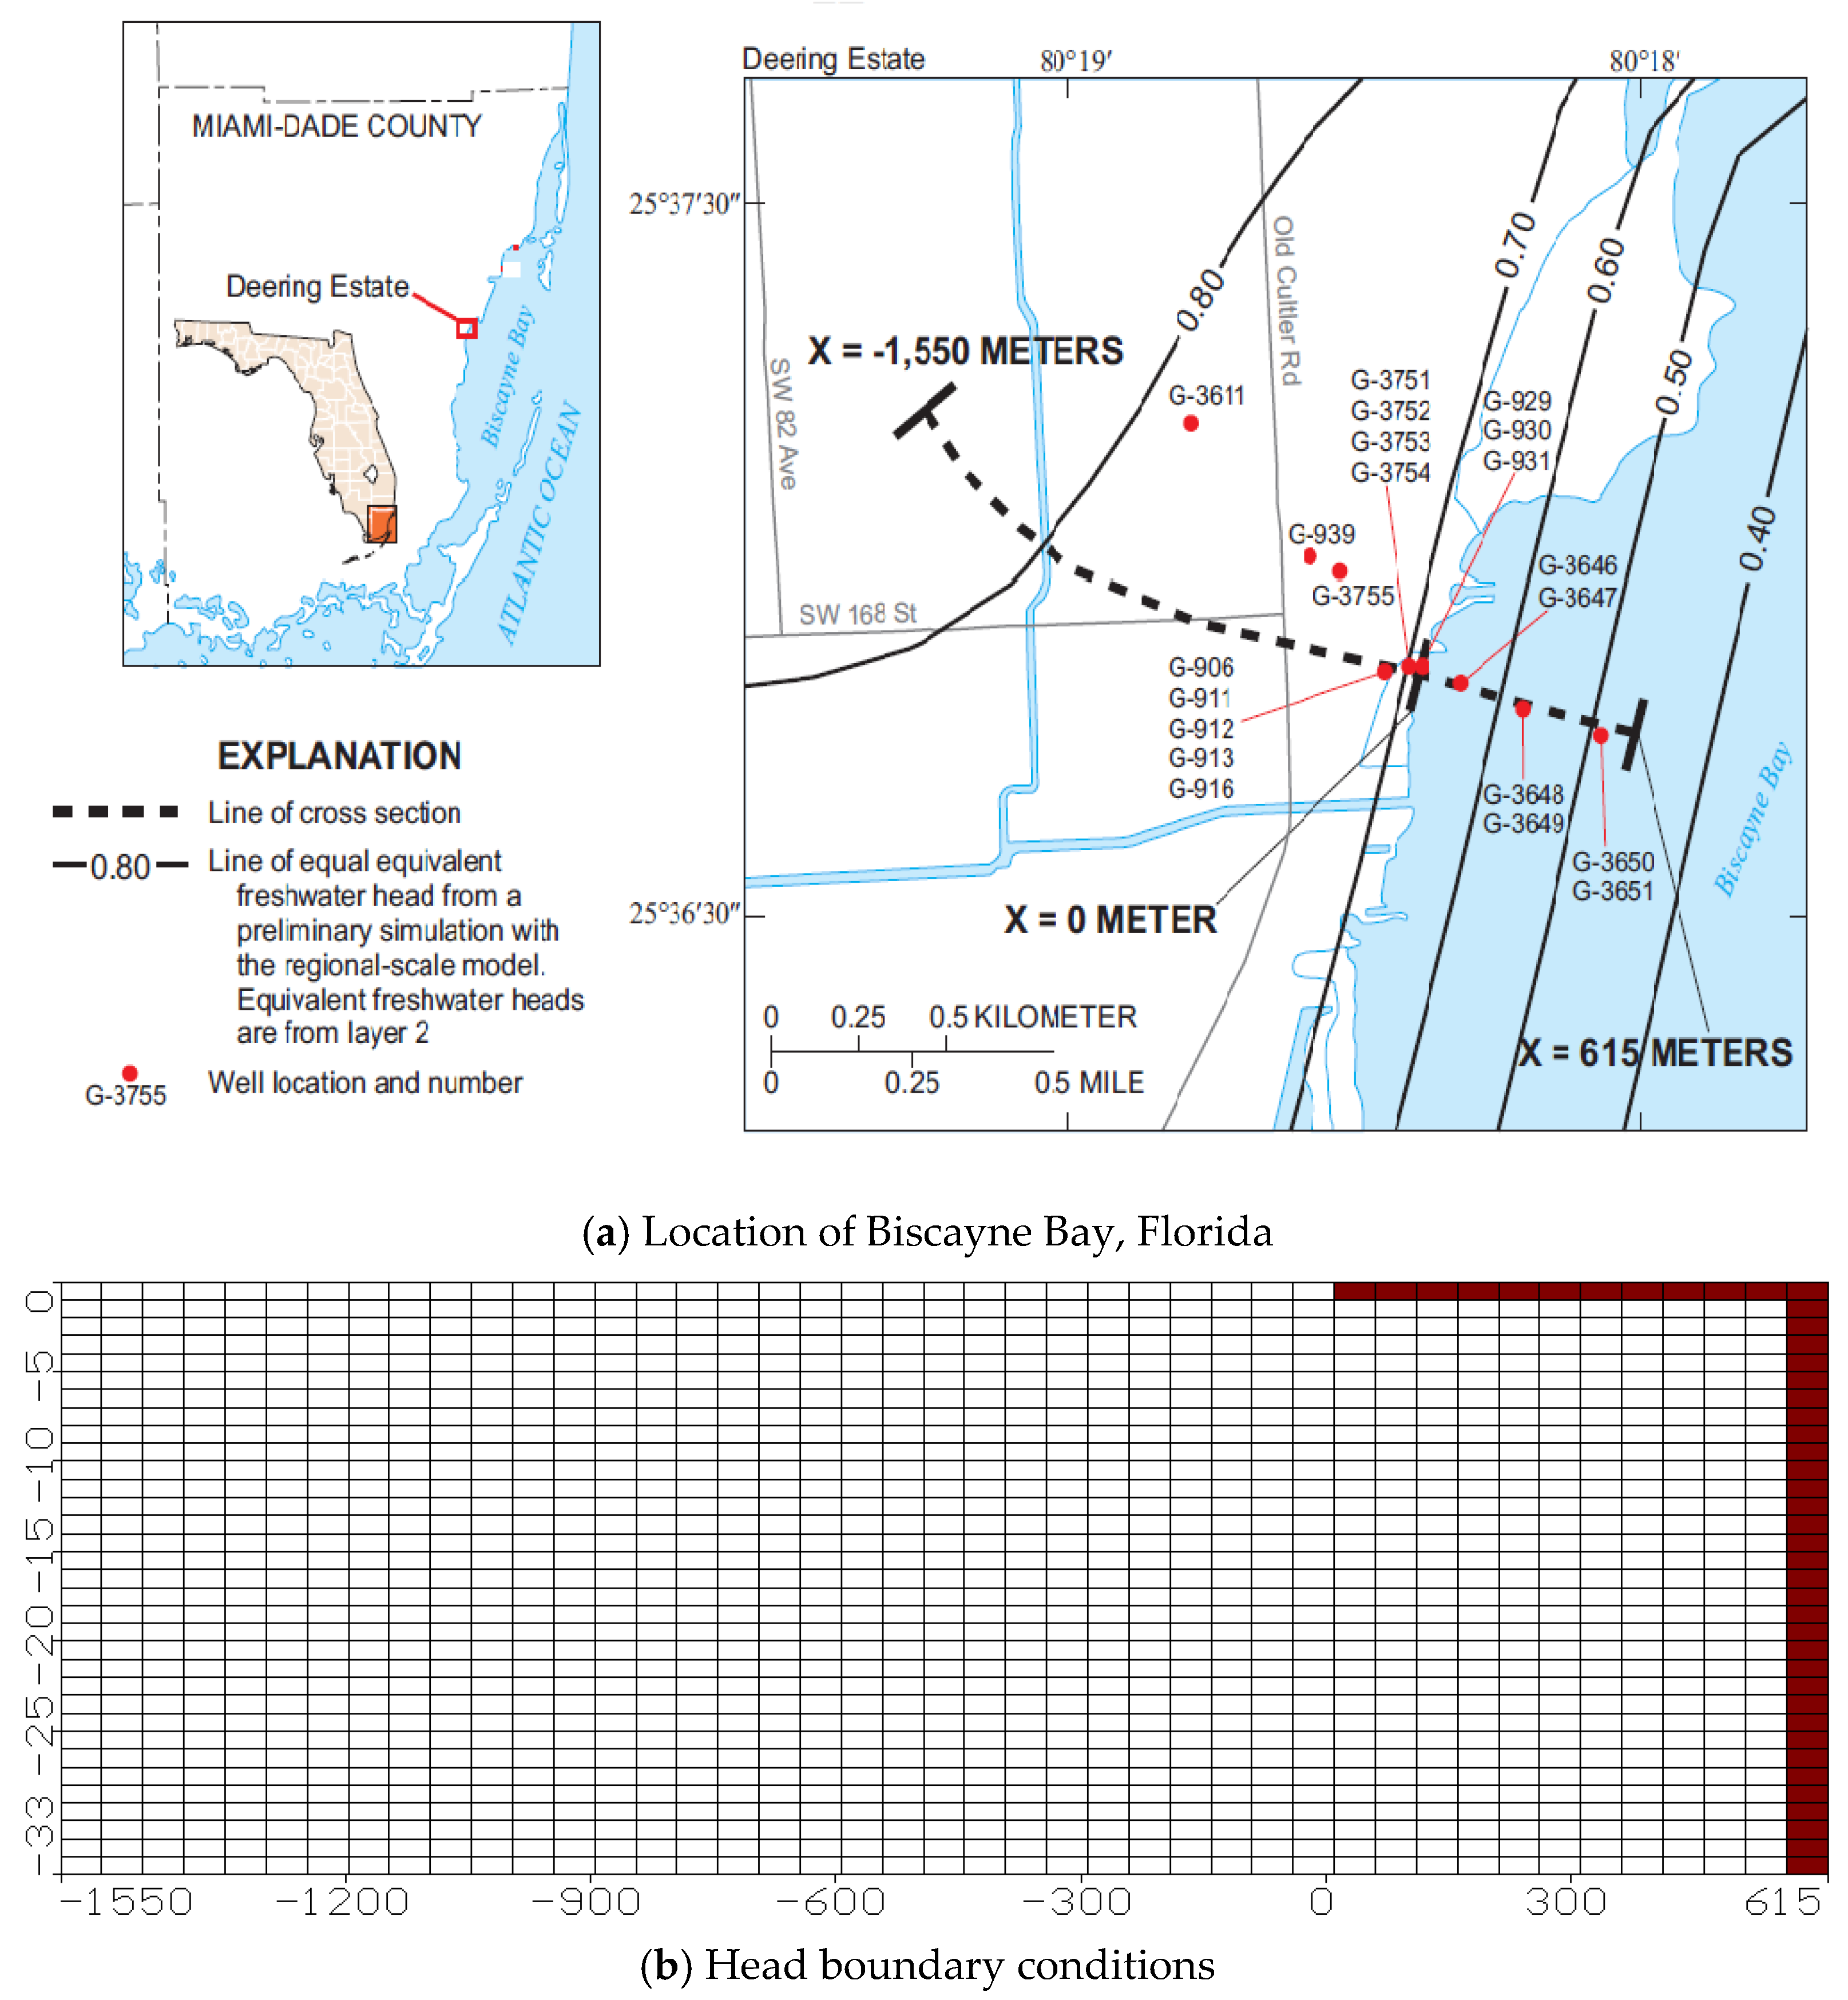
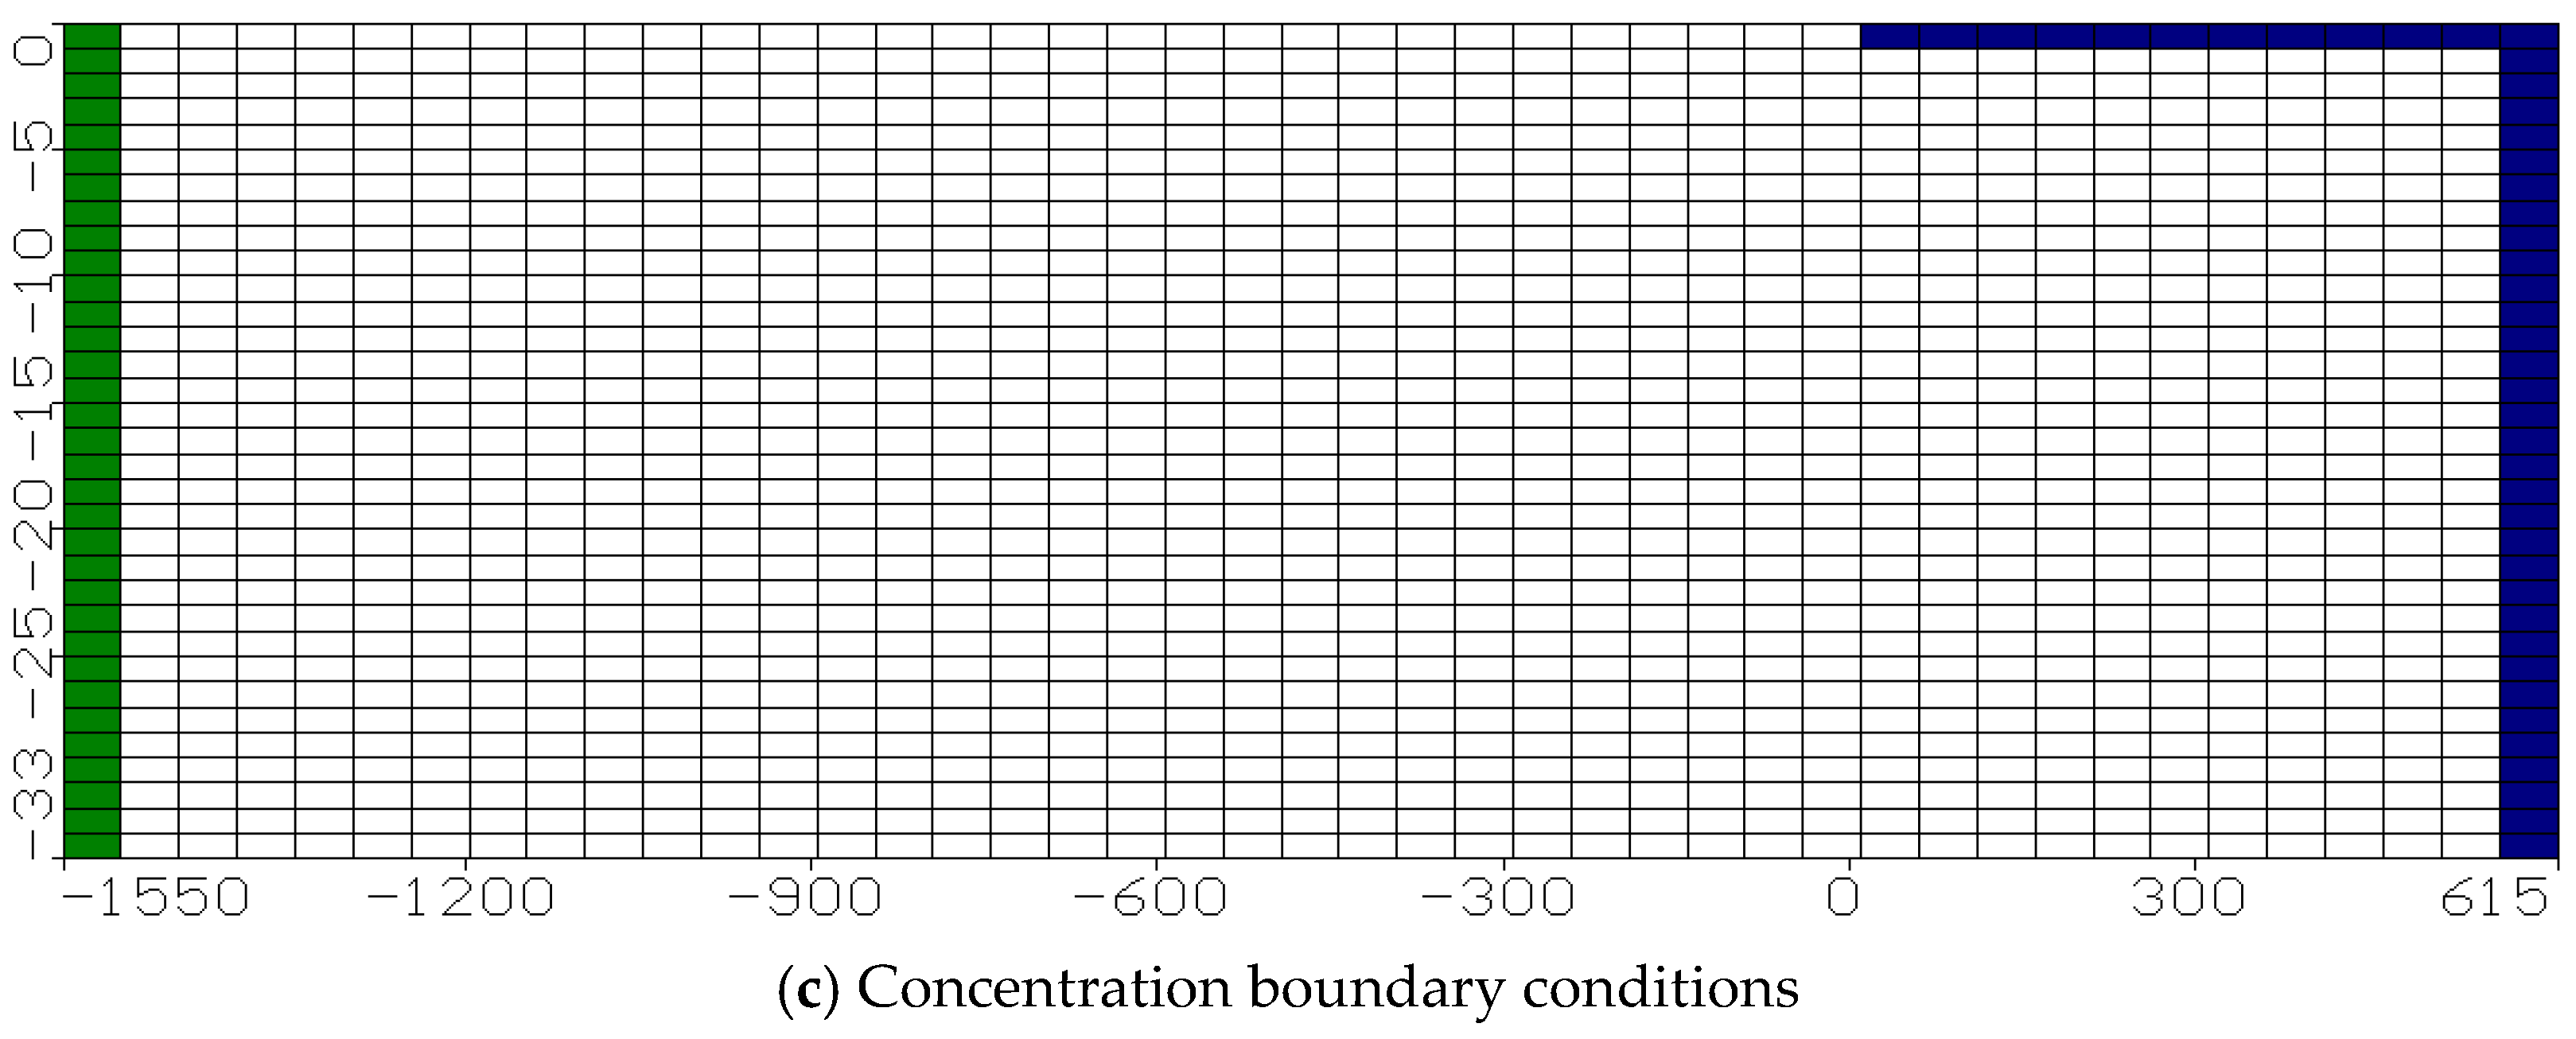
2.3. Real Case Study (Biscayne Aquifer, Florida, USA)

The numerical model was applied to the Biscayne aquifer, Florida, USA. All geometric, hydraulic and hydrological parameters were deduced from Langevin [34]. The study area consists of a length equal to 2165 m and a depth of 33 m (Figure 5a). Detailed information and other relevant data related to geologic and hydraulic aspects of the aquifer were reported by Langevin (2001) [34]. The hydraulic conductivities in the horizontal and vertical directions were taken as 1000 and 100 m/day, respectively, and the porosity was set equal to 0.20. Longitudinal and transverse dispersivities, αL and αT, were taken as 10 and 1 m, respectively, and the dispersion coefficient in the x-direction, Dx, and the y-direction, Dy, were considered to be velocity dependent. Based on the reported data, the flux from the land side was 15 m3 day−1 (per meter length of shoreline) and the annual recharge from rainfall was 380 mm. The densities of fresh water ρf and seawater ρs were set as 1000 and 1025 kg/m3, respectively (Langevin) [34].
The model domain was discretized into 21 columns, 33 layers, and one row, with a cell dimension of 100 m × 1 m × 1 m. At the land side (x = −1550 m), a specified flux boundary condition was considered and concentration was set equal to the freshwater concentration. At the sea side, 0 ≤ x ≤ 615 m, a specified head (sea level) boundary condition was considered and the concentration was set equal to the seawater concentration. Figure 5b,c presents the discretization of the study domain and boundary conditions. The simulation was performed under steady-state conditions. A comparison between results of Langevin [34] and the results of the current simulation is presented in Figure 6a,b. A good agreement between the two models was observed. The intrusion length of equi-concentration line 17,500 reached 461 m from the shore line, which is very much consistent with Langevin [34].

3. Results and Discussion

The results of the current study for the two cases are presented for the possible impacts of changing boundary water levels on saline water intrusion in coastal aquifers. The first is the hypothetical case study using experimental and numerical models, and the second is the real case of the Biscayne aquifer.

3.1. Future Scenarios for the Hypothetical Experimental Model

In Case One, three scenarios (2, 3, and 4) were considered in which the saline water head was raised to 30.3, 30.6 and 30.9 cm, respectively, while the freshwater head remained unchanged at the level of 31.20 m, as in the Base Case (Scenario 1). As compared to the basic run, the intrusion length increased from 14.25 cm to 21.75, 30.75 and 40.50 cm for the three levels of saline water, respectively, as shown in Figure 7a–c. An increase in the saline water head by 3 mm (Scenario 2) caused an additional intrusion of 7.50 cm. The same increment of saline water head (3 mm) to the levels of 30.60 and 30.90 cm (Scenarios 3 and 4), provided an additional intrusion of 9.00 cm and 9.75 cm, respectively, indicating the nonlinear nature of the relationship between the saline water head and total seawater intrusion length.
Case Two represents the decline of groundwater levels at the land side due to overpumping from groundwater, while seawater level remained constant, as in the Base Case (Scenario 1). Three scenarios (5, 6 and 7) were considered in which the freshwater head was lowered to 30.90, 30.60 and 30.30 cm, respectively. As compared to the Base Case, the intrusion length increased from 14.25 cm to 21.25, 30.00 and 39.50 cm, respectively, as shown in Figure 7d–f. Decreasing the freshwater head by 3 mm (Scenario 5) caused an additional intrusion of 7.00 cm. The same additional decline (3 mm) of the freshwater level to the levels of 30.60 and 30.30 cm (Scenarios 6 and 7) caused an additional intrusion of 8.75 and 9.50 cm, respectively. The results of Cases One and Two reveal that increasing the seawater level would cause more saline water intrusion as compared to decreasing the freshwater level at the land side by the same value. Although the hydraulic gradient in both cases remains the same, the higher density of the seawater may have caused additional intrusion.
In Case Three, three additional scenarios (8, 9, and 10) were considered in which the saline water head was raised to 30.30, 30.60 and 30.90 cm and the freshwater head was reduced to 30.90, 30.60 and 30.30 cm, respectively. These runs represent the worst conditions, where the increase of seawater level, due to climate change, is associated with an equal decline in the groundwater levels, due to excessive pumping. The intrusion lengths for Scenarios 8, 9 and 10, were measured as 30.5, 54.50 and 60.00 cm, respectively, as given in Figure 7g–i. It is clear, however, that the length of the sand tank was not enough and the freshwater boundary limited the advancement of the saline water.

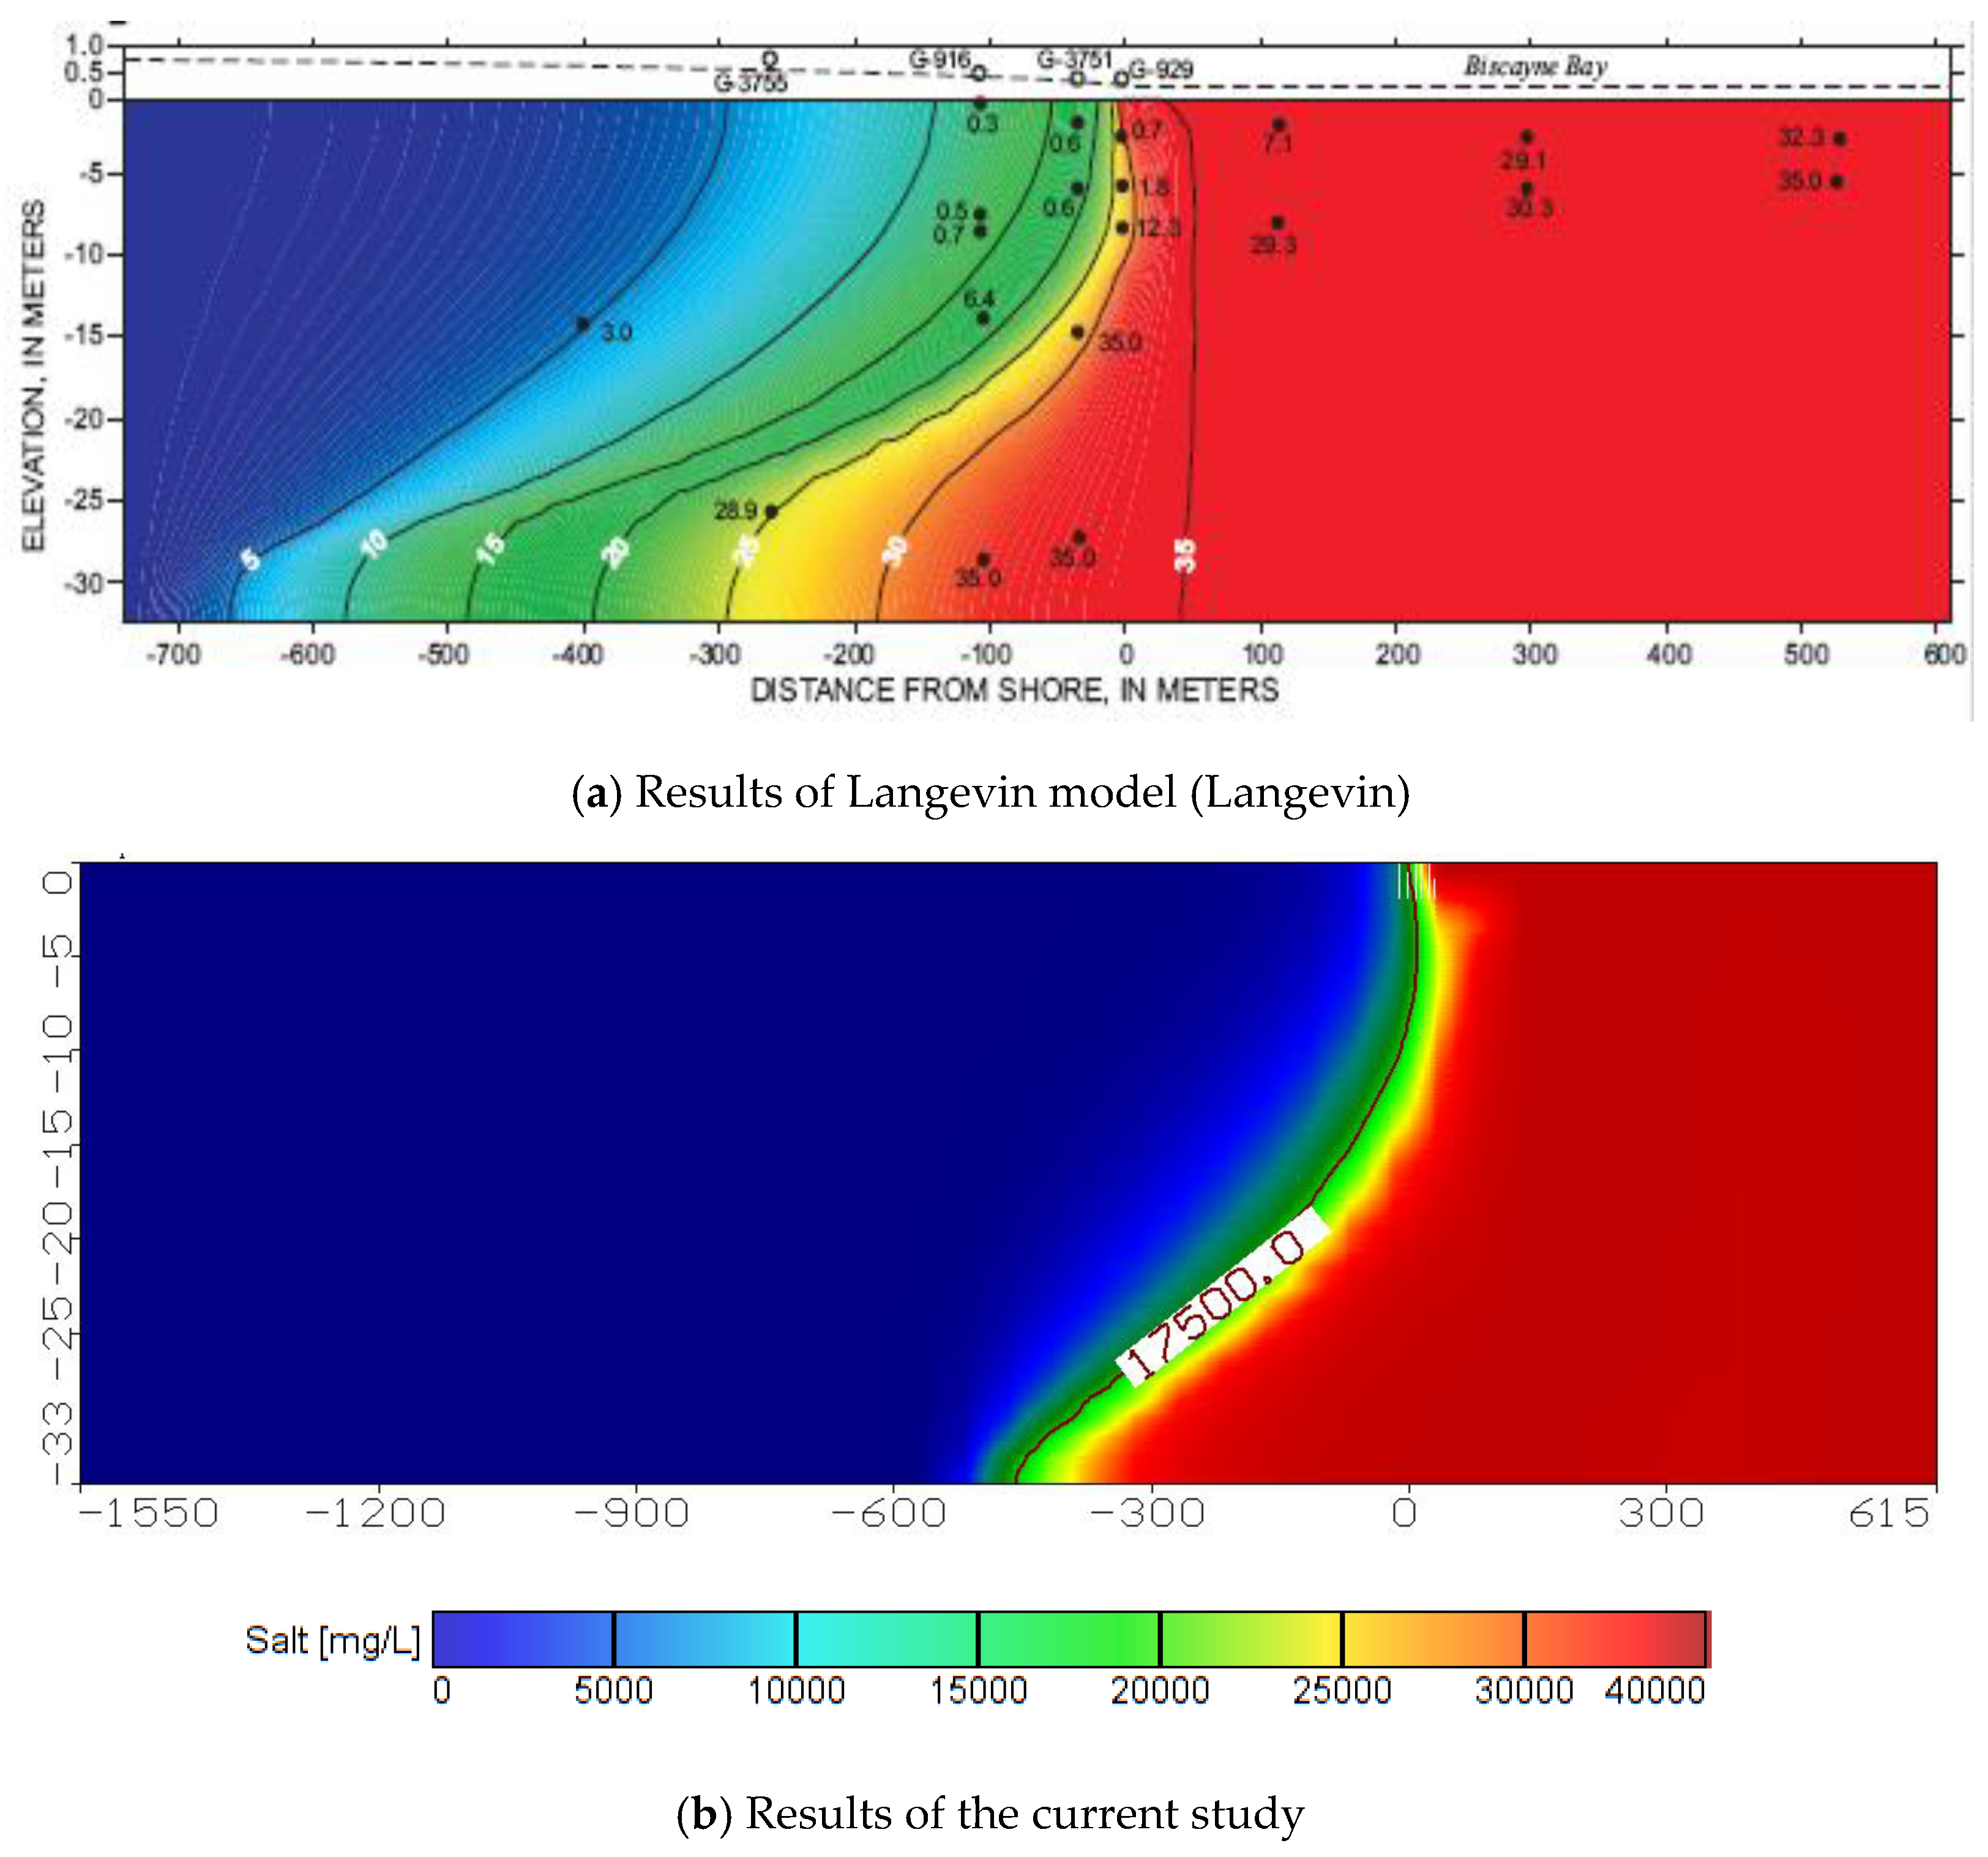
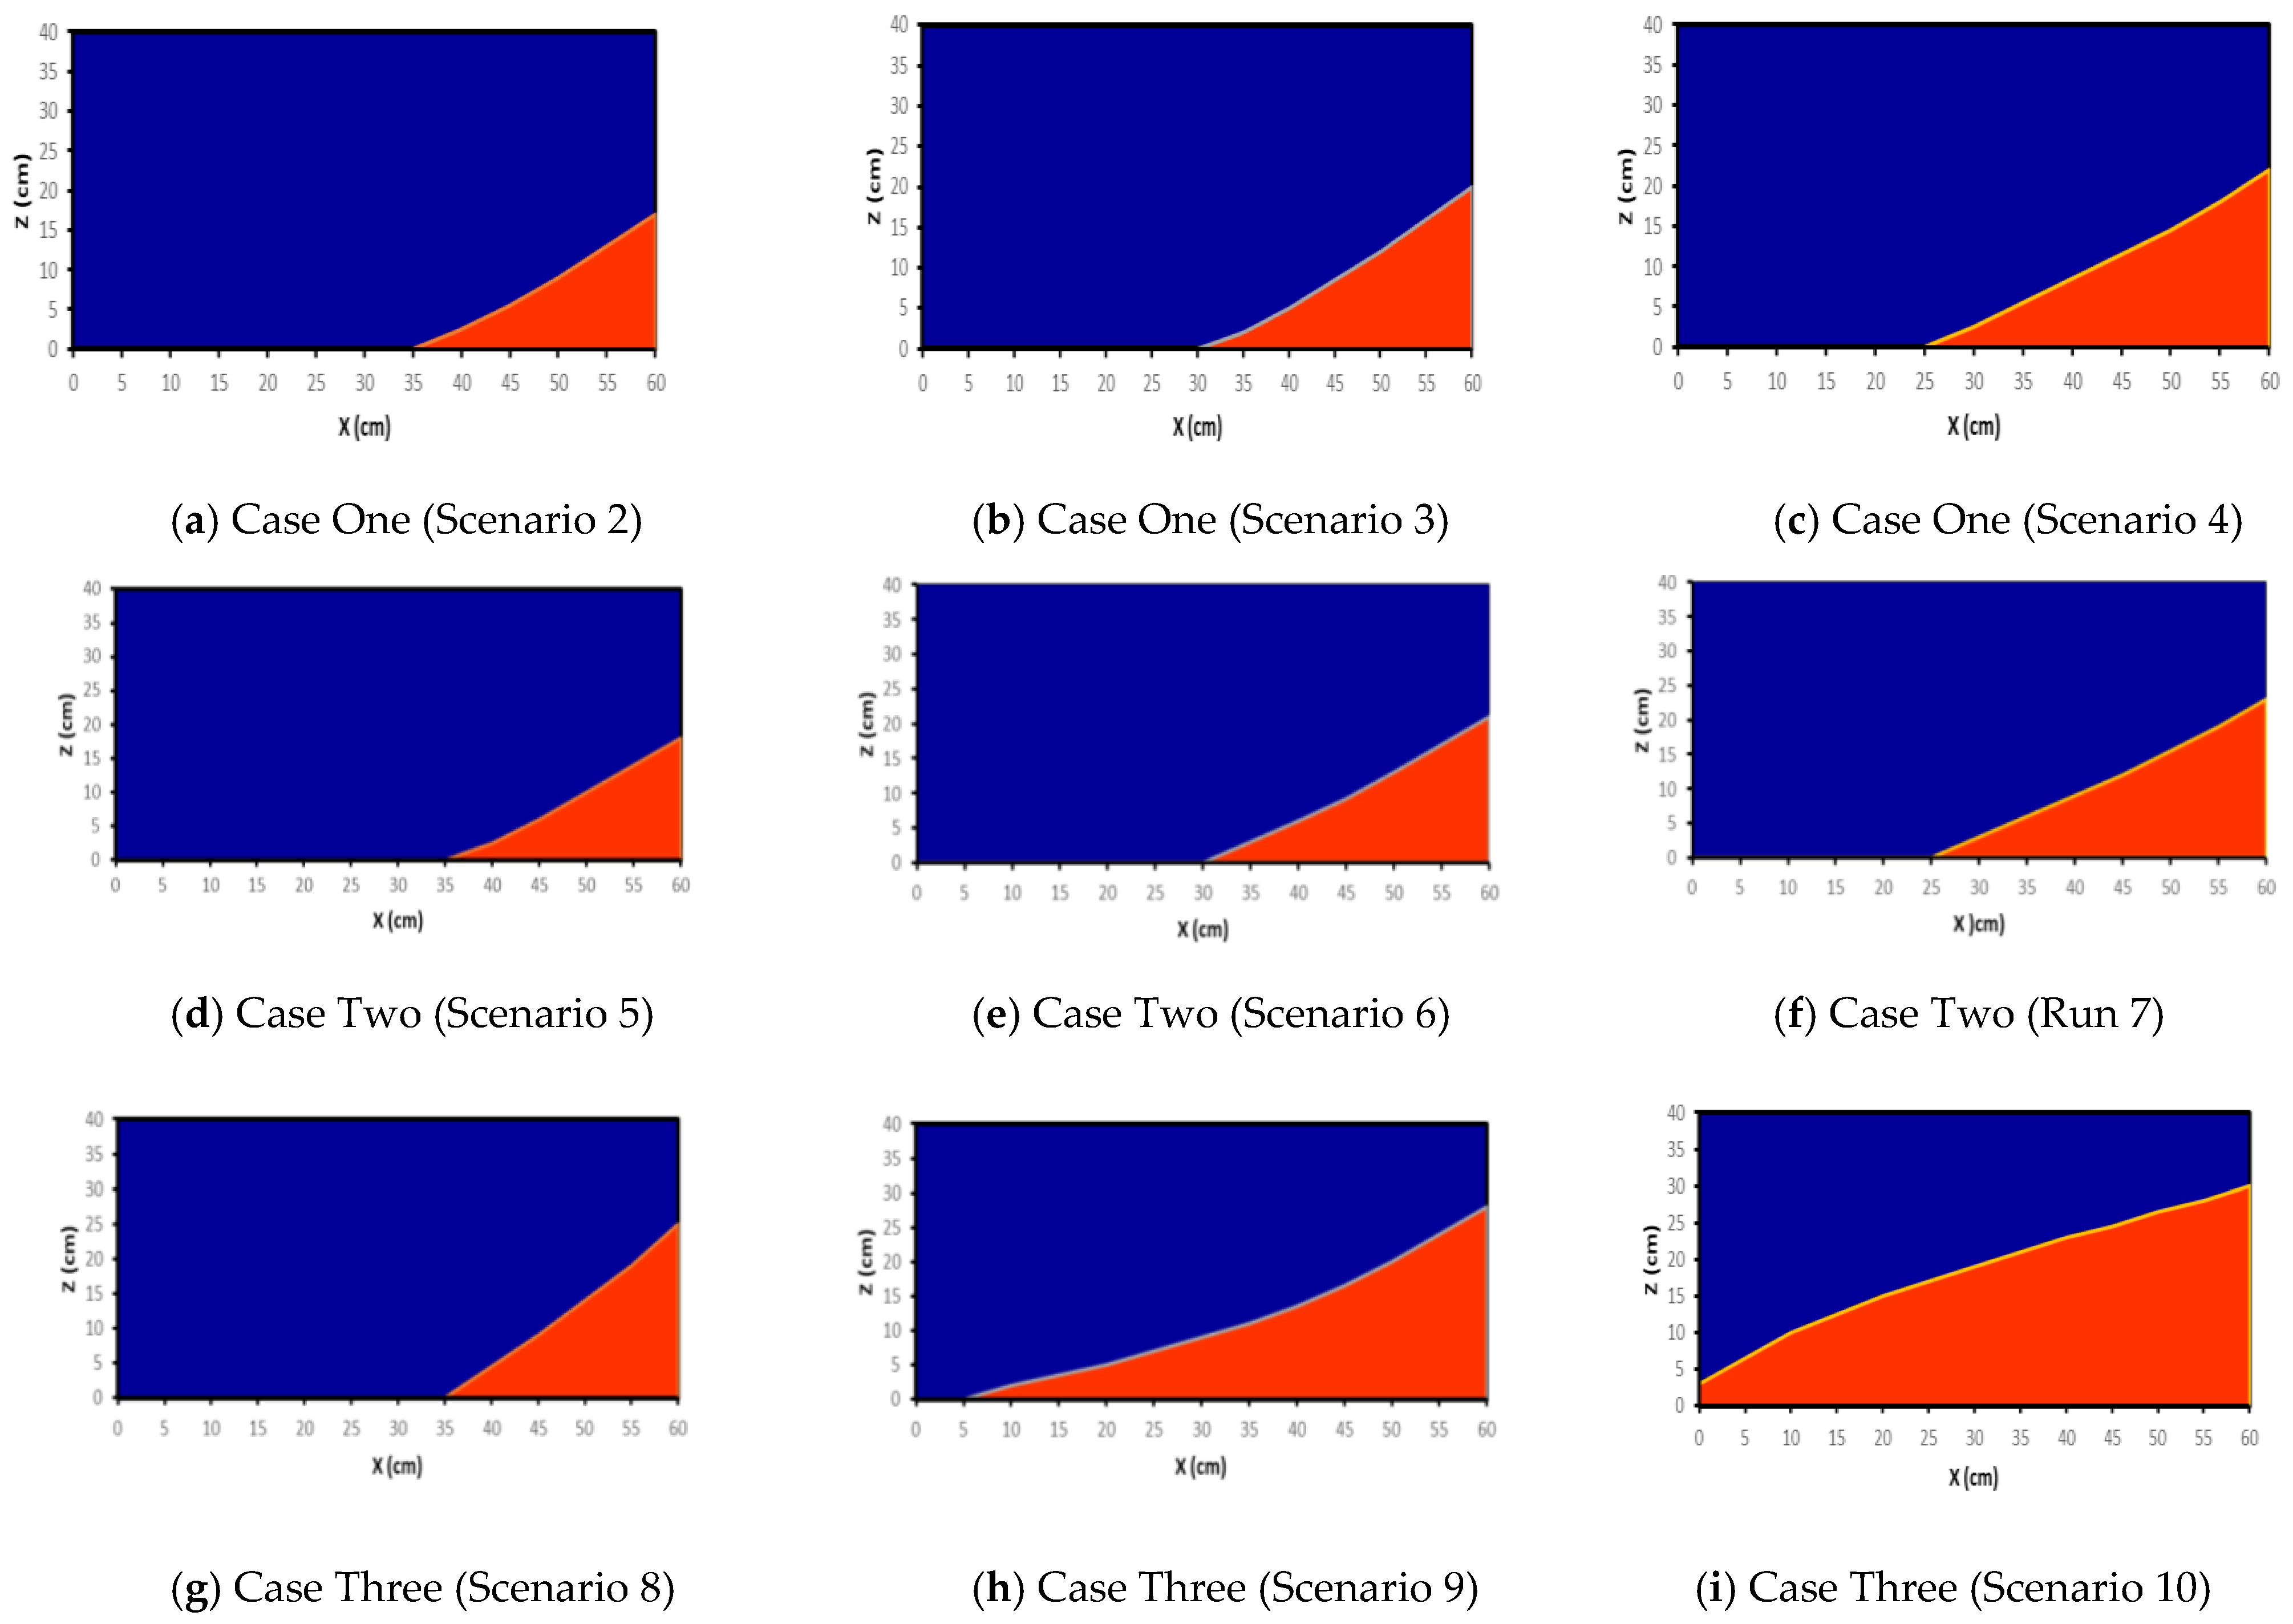
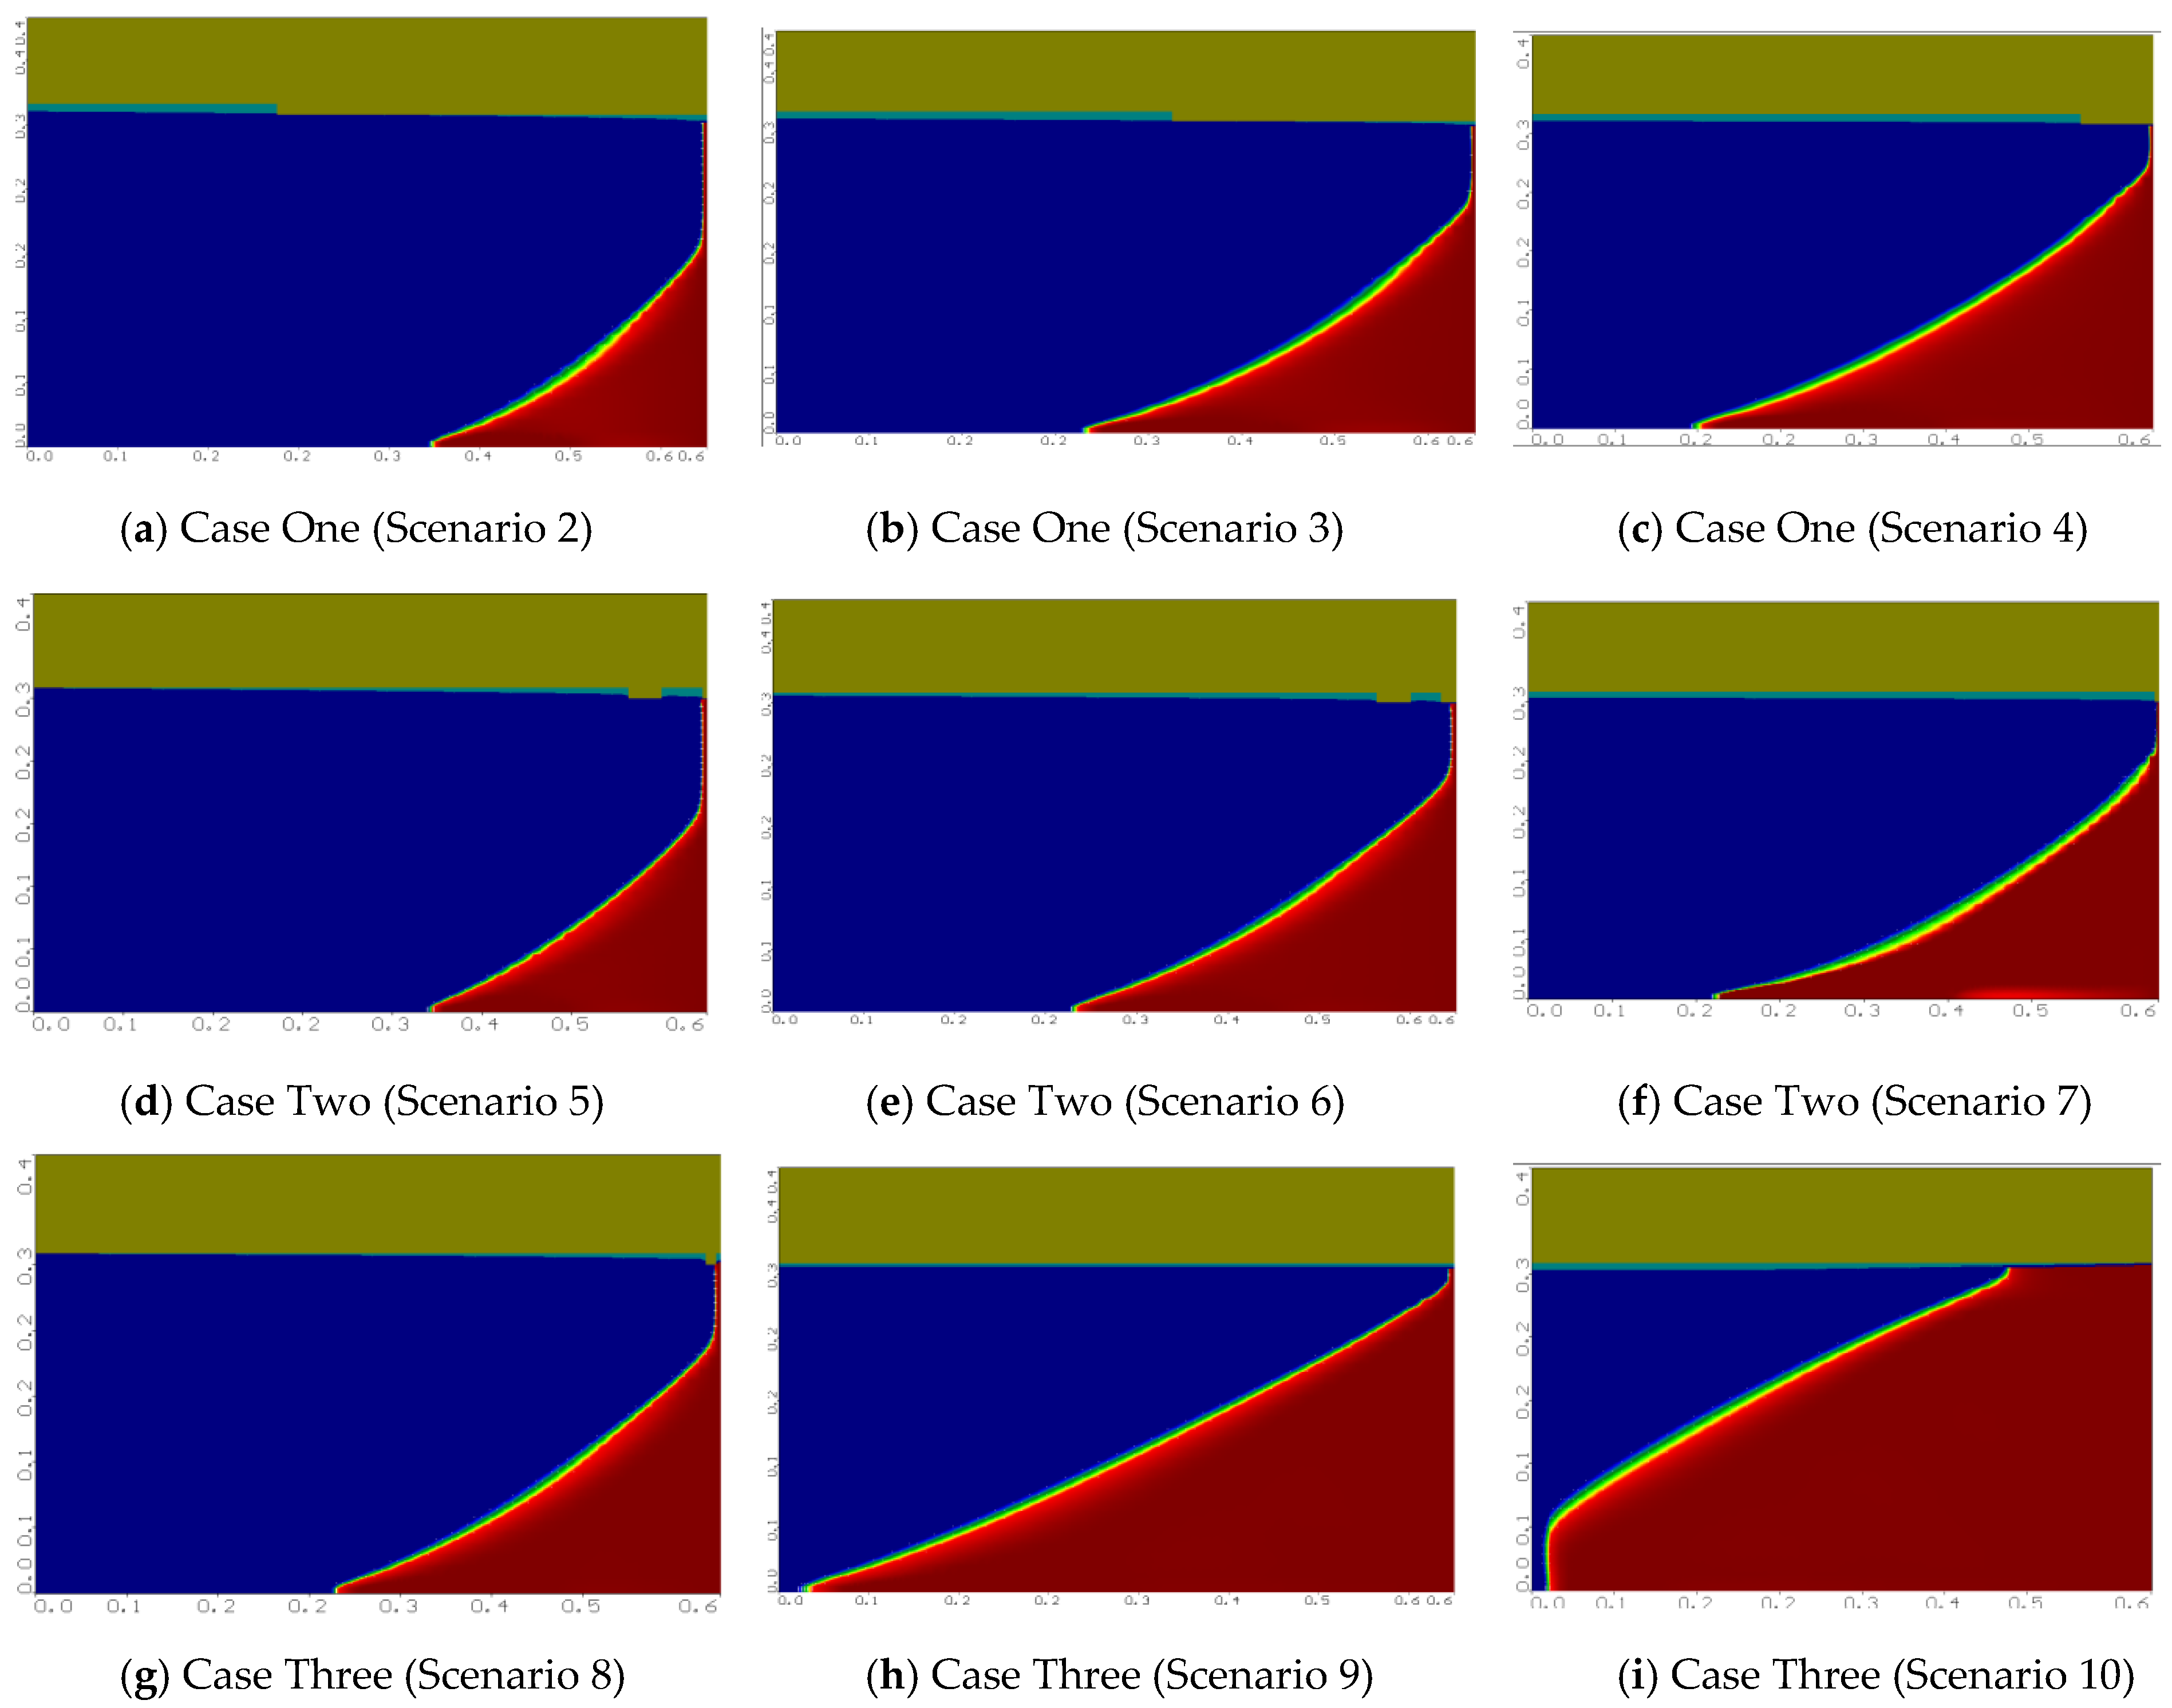
3.2. Future Scenarios for the Hypothetical Numerical Model

The numerical model results of the other three cases (Scenarios 2–10) for the rise in the saline water head at the sea side, decline of groundwater levels at the aquifer side and combination of the two cases were compared to the results of the physical model under the same conditions. Figure 8a–i shows the distribution of aquifer salinity for the three cases. Also, the results of the two models were compared, as explained in the following section.

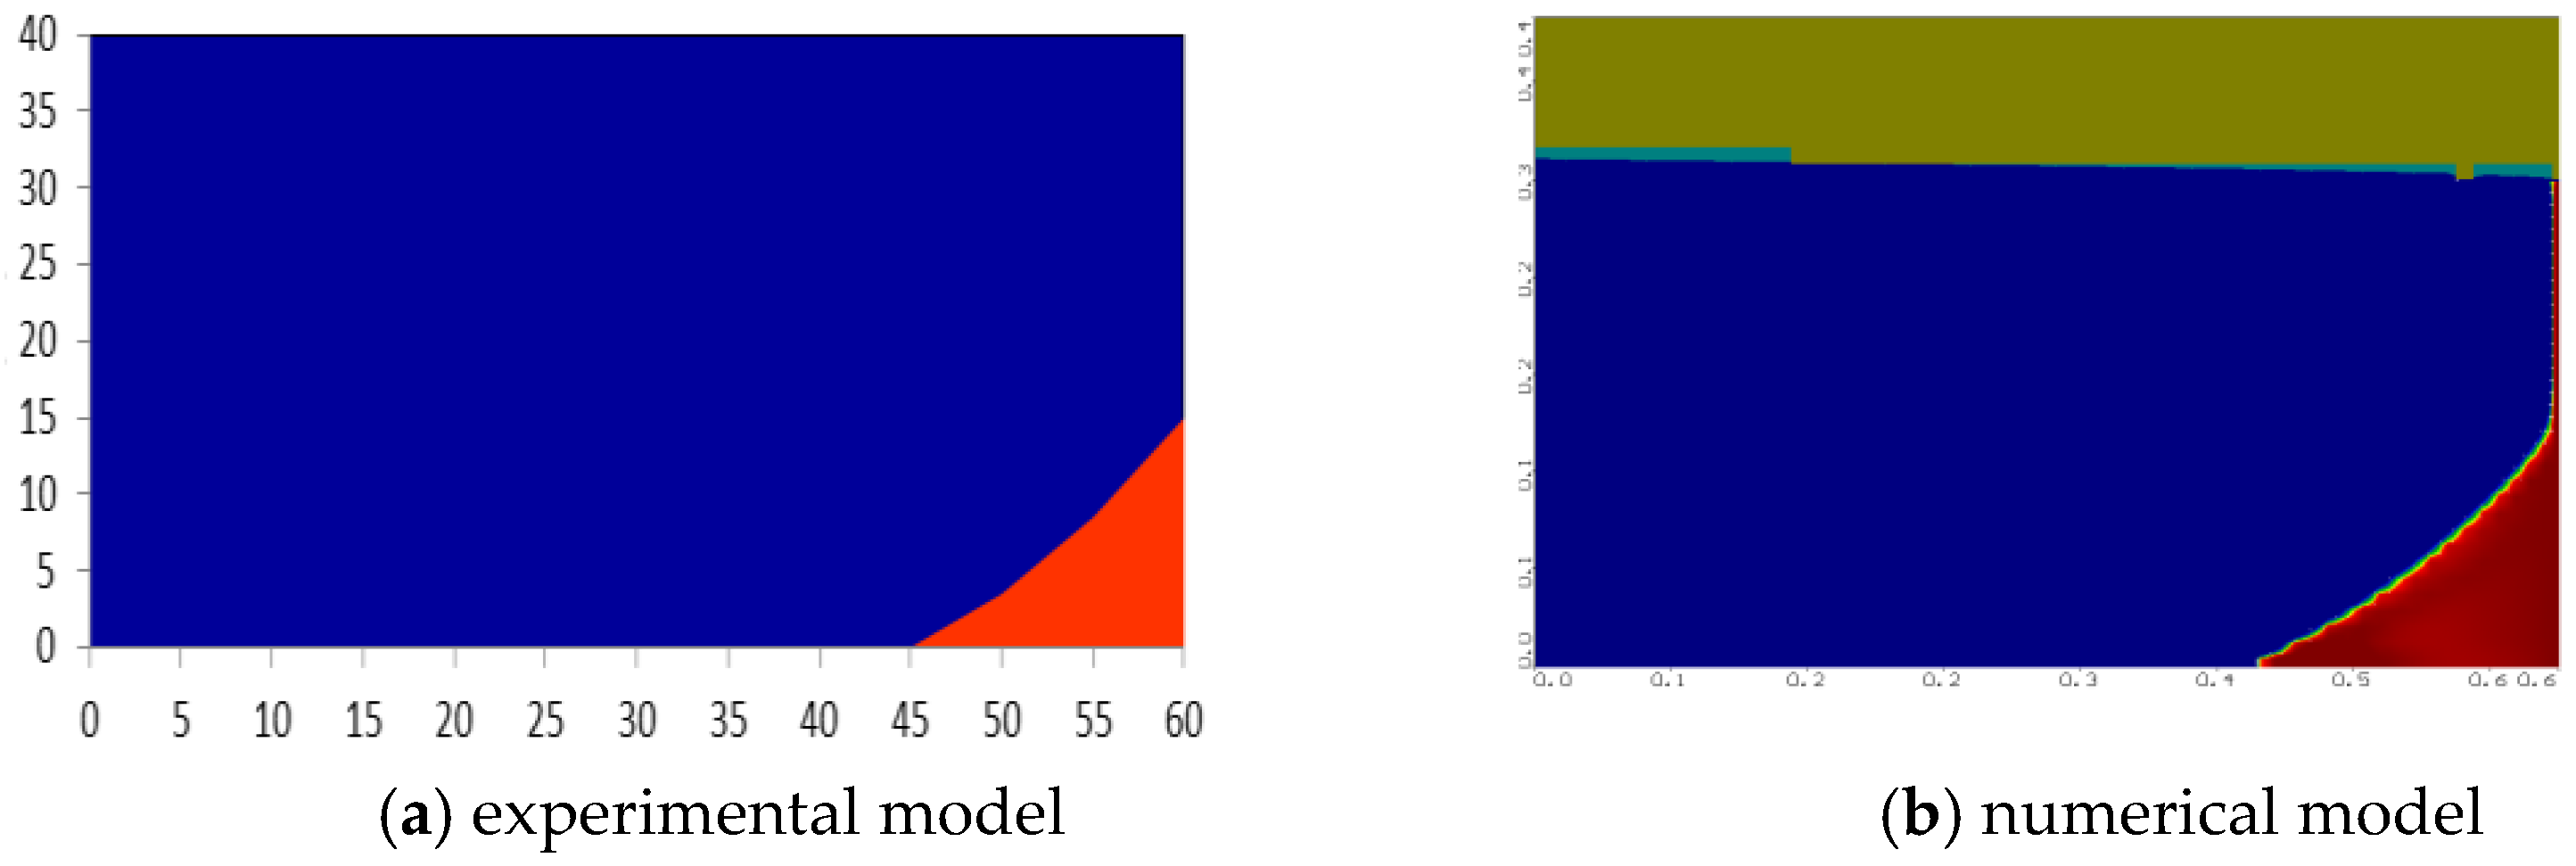
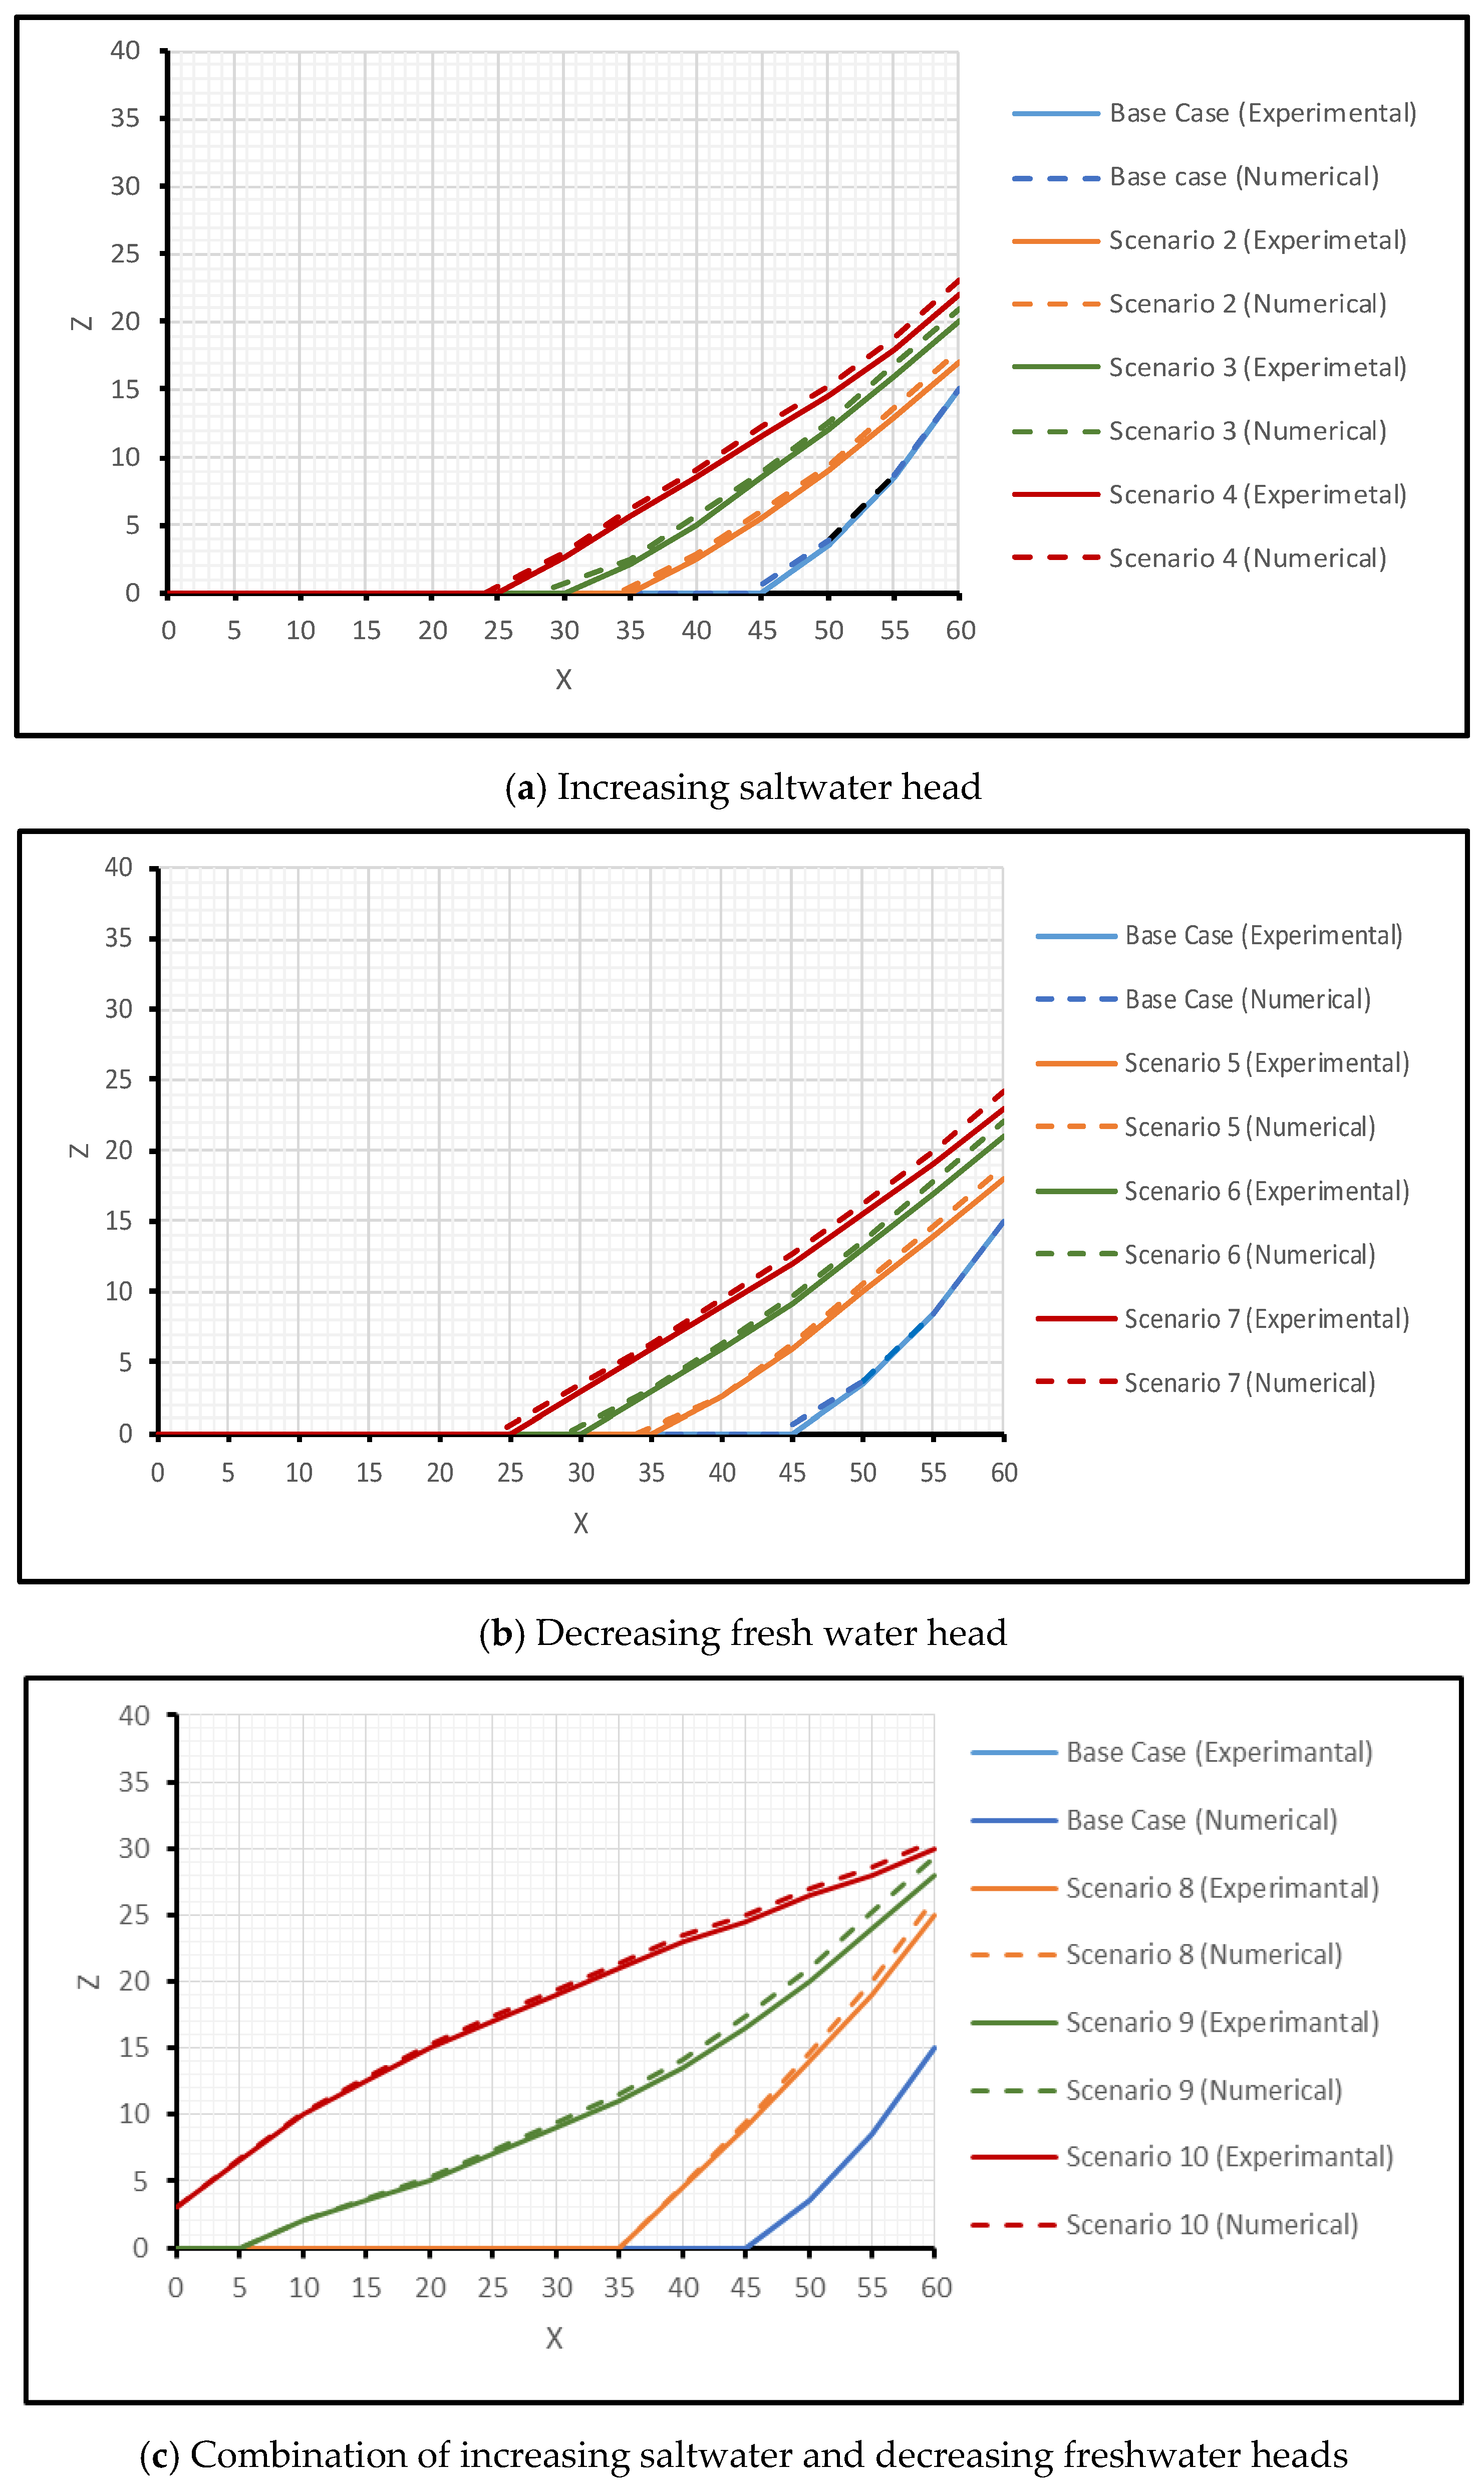
3.3. Analysis of Experimental and Numerical Results

In this section, comparisons between the results obtained from experimental and numerical models for different levels of saltwater and freshwater heads are presented. Table 2 gives a summary of the results of the experimental and numerical models. In the Base Case, saltwater intrusion in the experimental model reached 14.25 cm. However, in the numerical model, it reached 15.50 cm. A comparison of the results from experimental and numerical models for the three cases (Scenarios 2–10) is shown in Figure 9. Figure 9a represents comparison of the results from Case One (Scenarios 2, 3 and 4). Figure 9b represents comparison of the results from Case Two (Scenarios 5, 6 and 7). Figure 9c shows a comparison of the results from the three cases (Scenarios 8, 9 and 10).
The results indicate good agreement between the experimental and numerical models. The discrepancy between the experimental and numerical results is within the range of 5%. This limited discrepancy might be attributed to rounding of the different parameters, including porosity and hydraulic conductivity. It is also observed that the numerical model has consistently provided a slight overestimation of the intrusion length (within the range of 0.5–2.00 cm). Again, this might be attributed to the accuracy of the assumed parameters. However, in Scenario 10 (Figure 9), the numerical model revealed less intrusion length, which might be attributed to the imposed freshwater boundary condition. As expected, Case Three, where the increase in seawater level is combined with the reduction in groundwater levels at the land side, represents the critical case, and Scenario 10 represents the worst condition where the entire aquifer is intruded.

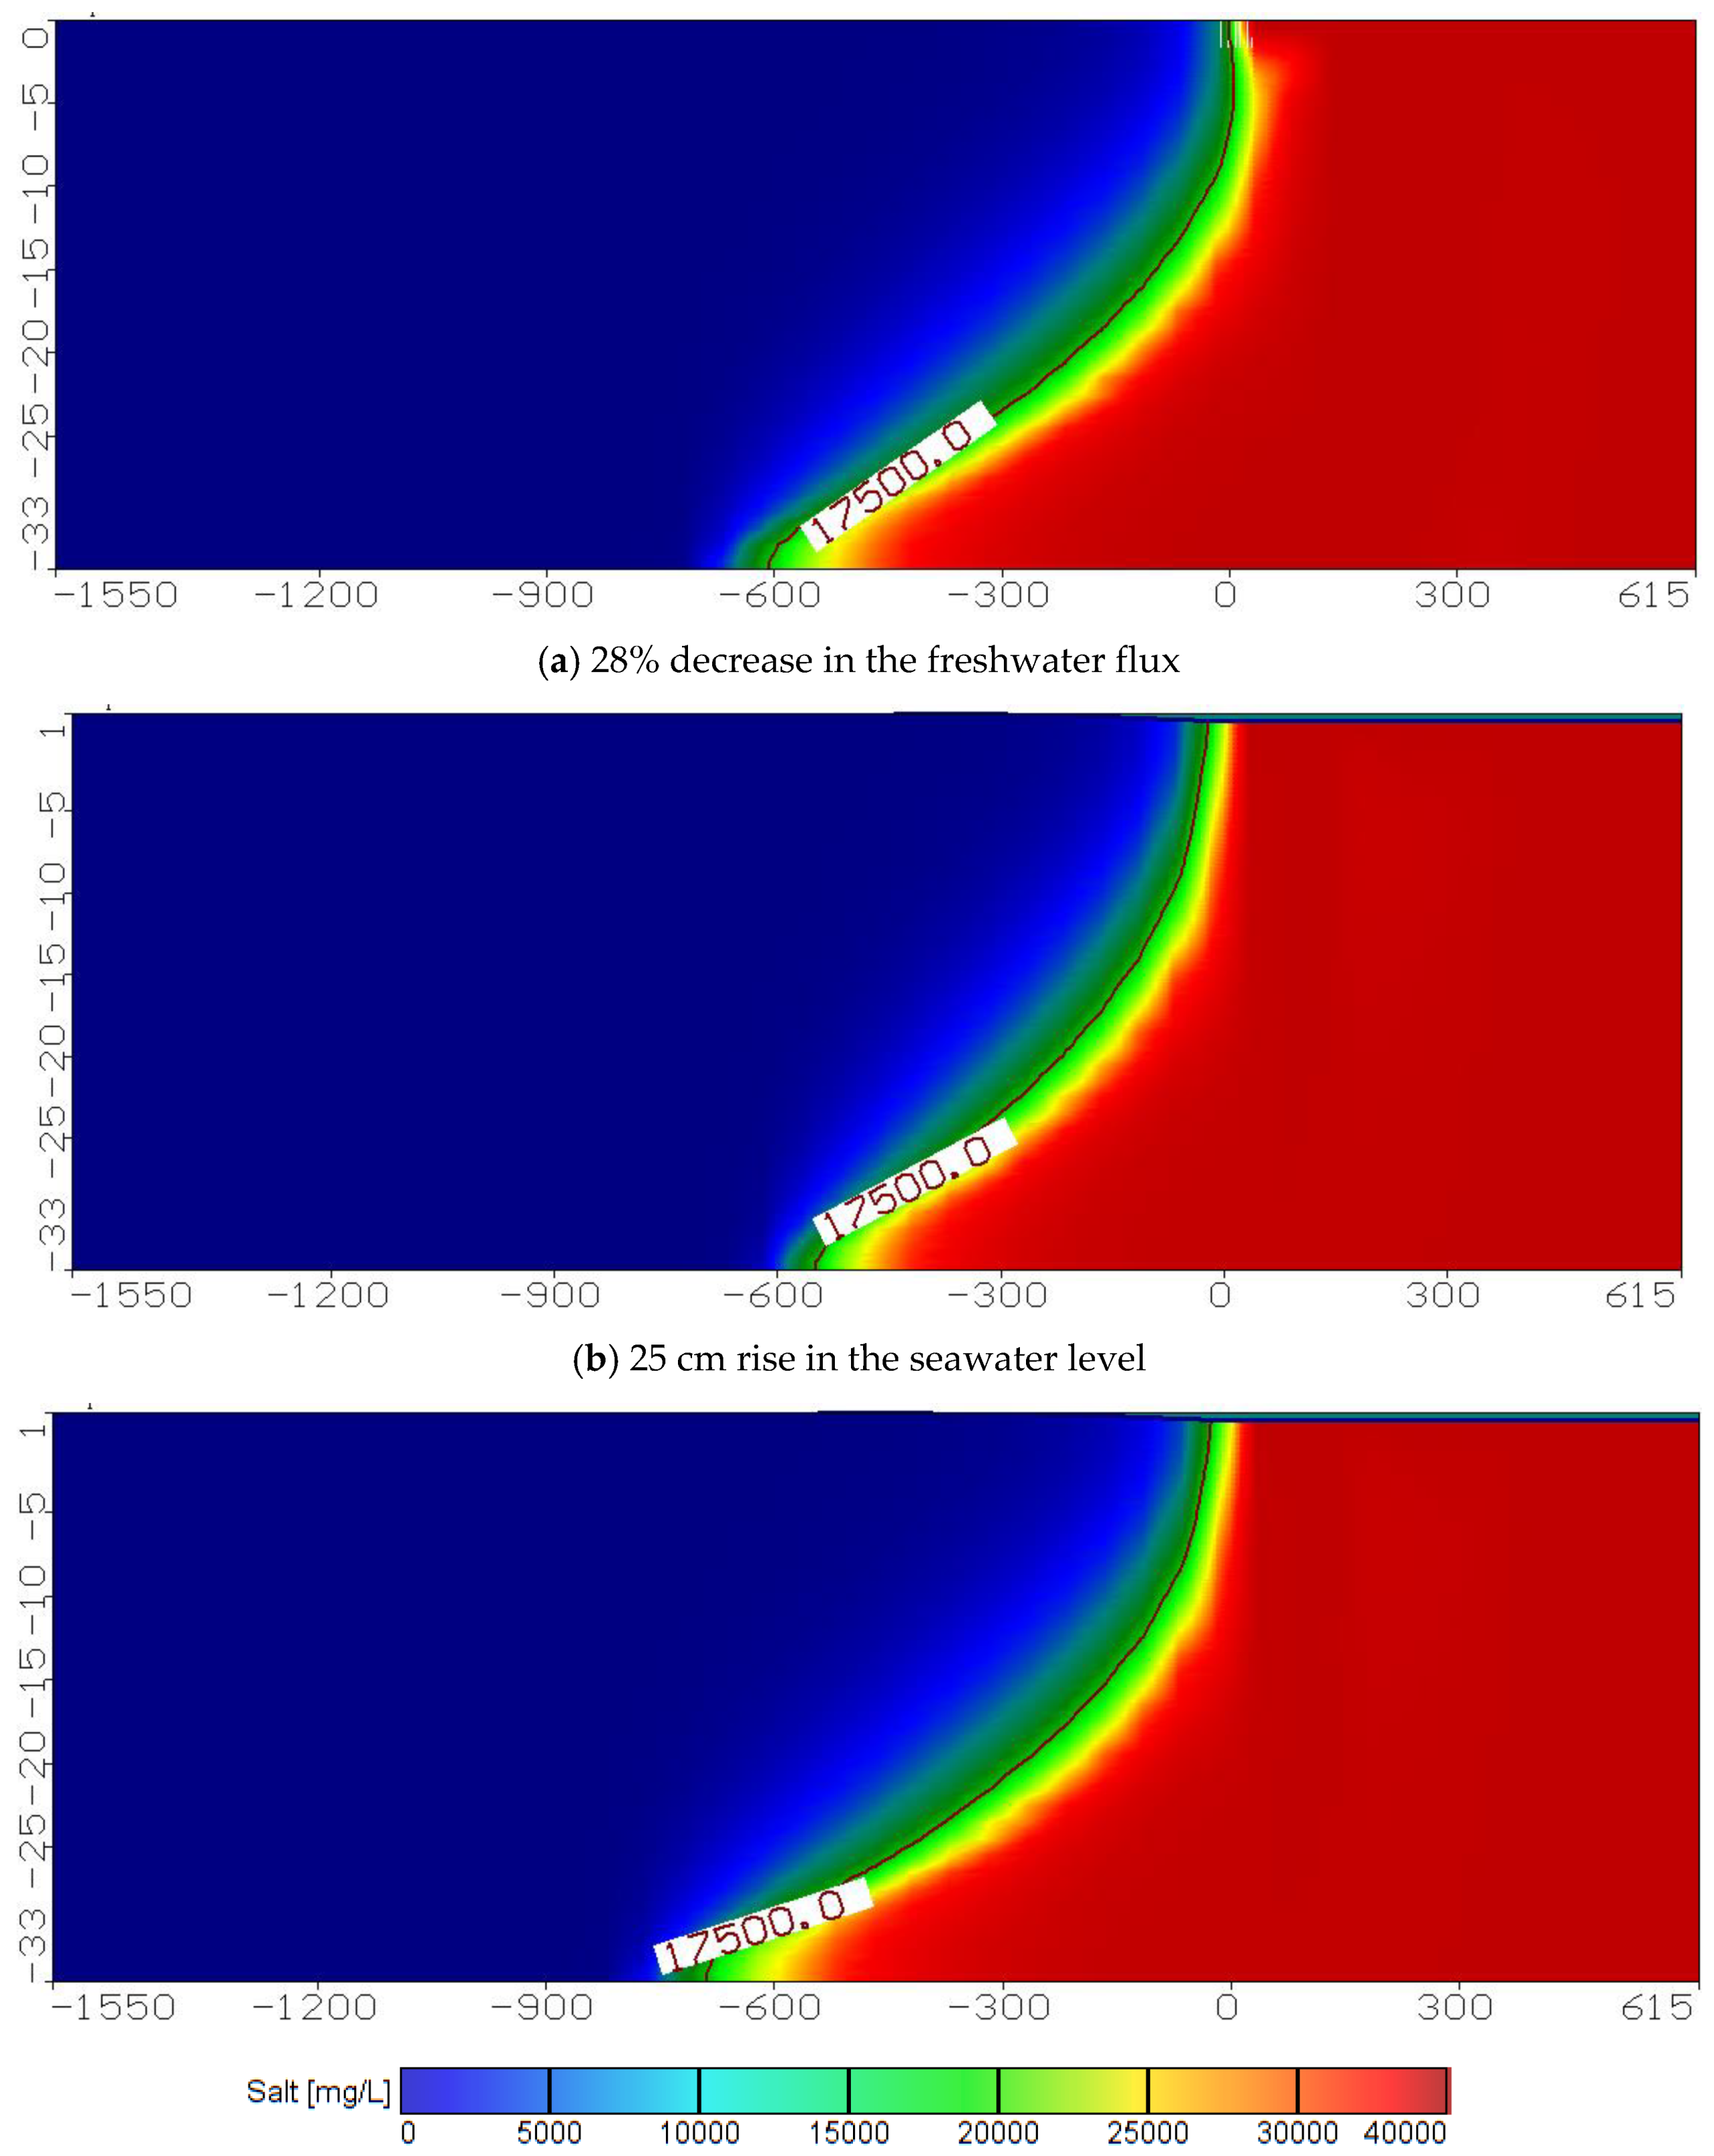
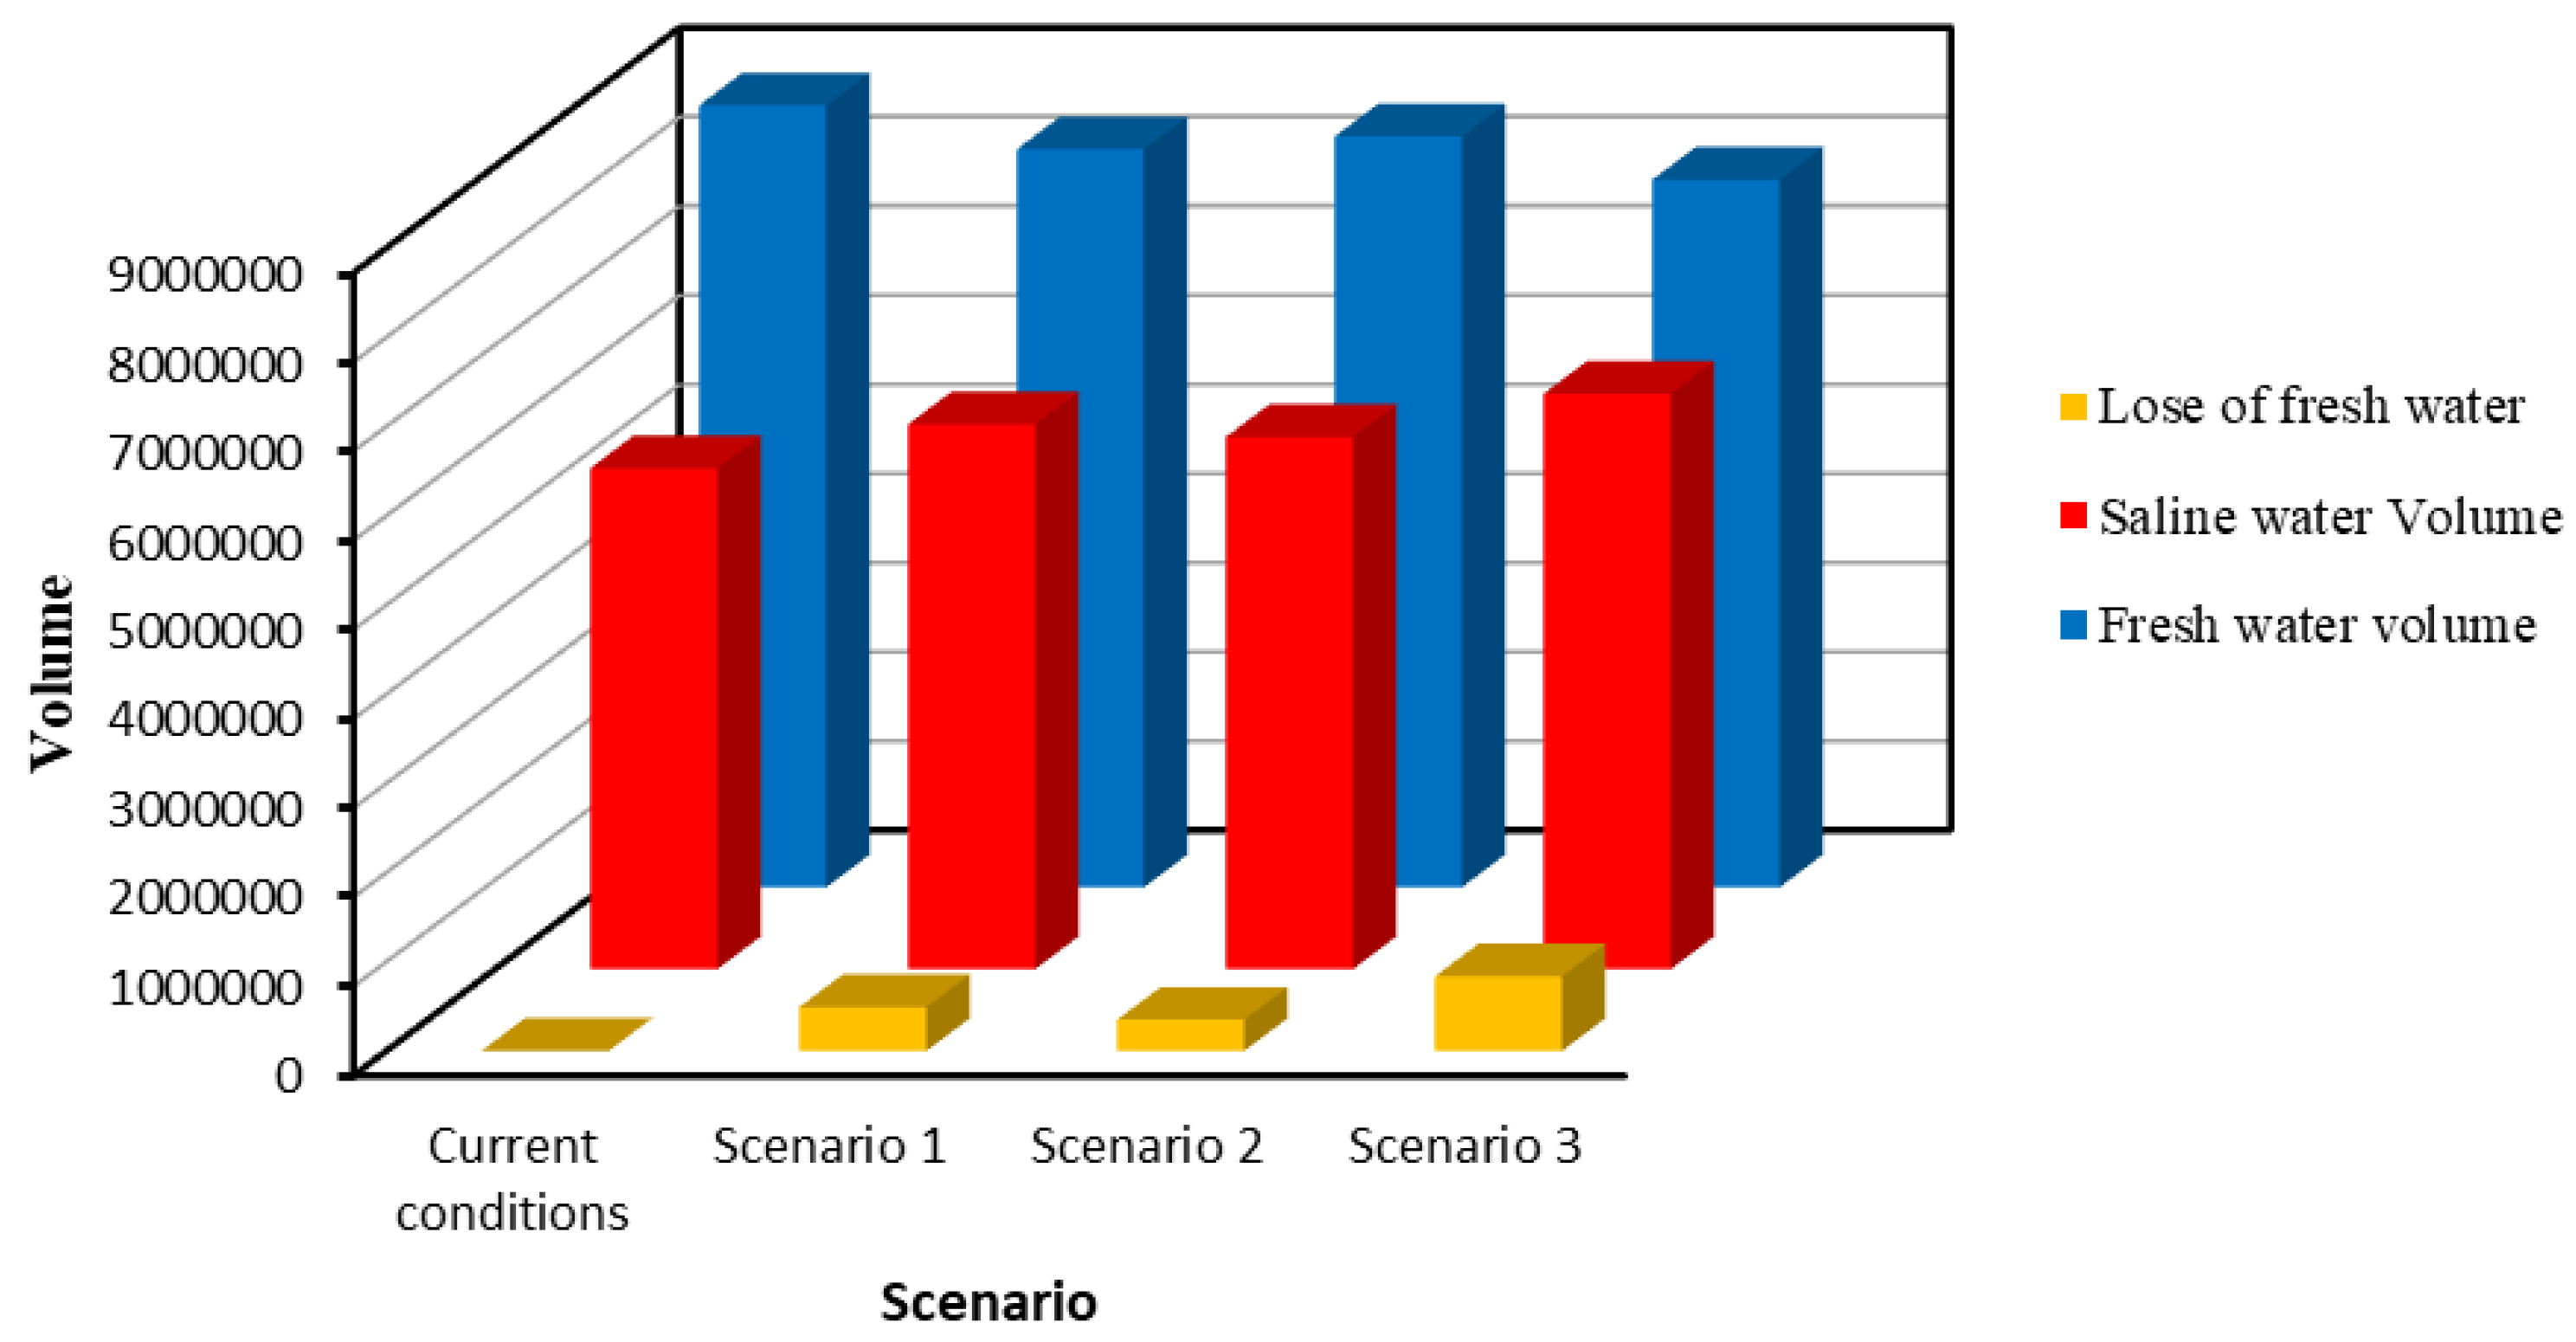
3.4. Future Scenarios for Biscayne Aquifer Model

Three scenarios were considered to identify the interface between freshwater and seawater under the effect of reducing the freshwater flux at the landside due to overpumping, increasing seawater level due to the impacts of climate change, and the combination of the above two scenarios. In Scenario One, the freshwater flux at the landside was reduced to 10.75 m3/day per meter length of the shoreline. All other parameters remained unchanged. As compared to the current conditions, an additional intrusion of 144 m, measured at the bottom of the aquifer for equi-concentration line 17,500 ppm, was observed (Figure 10a). The intrusion length was 605 m, measured at the bottom. In Scenario Two, the seawater level was raised by 25 cm. The freshwater flux at the landside (15 m3/day per meter length) and all other parameters were kept at their original values.
Figure 10b represents the results where the intrusion of equi-concentration line 17,500 ppm reached 548 m, measured along the bottom boundary with an additional intrusion of 87 m. In Scenario Three, in which the conditions of Scenarios One and Two were combined, the intrusion length, as measured by equi-concentration line 17,500 ppm, reached 690 m, with an additional intrusion of 229 m (Figure 10c). Table 3 shows freshwater and saline water volume and the losses in the freshwater volume per km width of the Biscayne aquifer. The volume of saline water and freshwater and losses of freshwater are shown in Figure 11. The figure revealed that under Scenario Three, around 0.833 million m3 of freshwater will be lost per each km width of the aquifer. It is therefore concluded that the Biscayne aquifer is highly vulnerable to additional seawater intrusion due to climate change and rising sea levels.

4. Conclusions

A physical model was developed to evaluate the effect of lowering groundwater level on the landside and raising saline water level at the sea side on seawater intrusion due to the possible impacts of changing boundary water levels in coastal aquifers. The dimensions of the physical model were selected based on the well-known Henry problem. SEAWAT code was used to simulate the intrusion of saline water under the same conditions that were considered in the physical model. Ten different cases were simulated to provide a better understanding of the process. In addition to the Basic Scenario, where the difference between freshwater level at the landside and seawater level was 1.2 cm, three other scenarios were considered in which the seawater level was raised, the groundwater level on the landside was reduced, and finally the decline of the groundwater level at the landside was associated with an increase of the seawater level. Under the worst conditions (Scenario 10), the intrusion reached the landside boundary. The model was applied to the Biscayne aquifer, Florida, USA. The experimental results agree with the numerical results for the hypothetical case. For the Base Case saline and fresh groundwater heads of 30 and 31.20 cm, the difference between the two models reached 1.25 cm. For the increase of sea water heads by 30.30, 30.60, and 30.90 cm, the differences between the two models reached 0.75, 1.75, and 0.75 cm, respectively. For the decline in the fresh groundwater heads by 30.90, 30.60, and 30.30, the differences between the two models were 0.50, 1.50, and 1.25 cm, respectively. For the combination between the two cases, the differences between the models reached 1.25, 2 and −1.50 cm.
The results were consistent with the available literature and confirmed that the Biscayne aquifer is highly vulnerable to extra seawater intrusion due to seawater level rise and overexploitation of the fresh groundwater resources. A 25 cm increase in the seawater level led to loss of fresh groundwater by 0.49 million m3 per each kilometer width of the Biscayne aquifer; a 28% reduction in freshwater flux from the landside caused a loss of 0.35 million m3 of fresh groundwater; and a combination of the two cases increased the loss in fresh groundwater by 0.83 million m3. Using both an experimental and numerical model, this study provides a better understanding of the future possible impacts of changing boundary water levels on saline water intrusion in coastal aquifers, including rising sea levels due to climate change.

Author Contributions

Conceptualization, M.Z.; methodology, I.A.-E., H.F.A.-E., M.S, G.M.A.-A.; validation, I.A.-E., H.F.A.-E., M.S.; formal analysis, I.A.-E., M.F., G.M.A.-A.; investigation, I.A.-E., M.F.; data curation, I.A.-E., M.S., H.F.A.-E.; writing—original draft preparation, I.A.-E., H.F.A.-E., M.F.; writing—review and editing, I.A.-E., M.S., H.F.A.-E., M.Z., M.F., G.M.A.-A.; supervision, G.M.A.-A., M.Z.; project administration, M.Z.; funding acquisition, M.Z. All authors have read and agreed to the published version of the manuscript.

Funding

This research received no external funding.

Institutional Review Board Statement

Not applicable.

Informed Consent Statement

Not applicable.

Data Availability Statement

The data are not publicly available due to institutional property rights.

Acknowledgments

The authors are thankful to the Department of Water and Water Structures Engineering, Faculty of Engineering, Zagazig University, Zagazig 44519, Egypt, for constant support during the study. This work was supported by the Slovak Research and Development Agency under the Contract no. APVV-20-0281, and a project funded by the Ministry of Education of the Slovak Republic VEGA1/0308/20 “Mitigation of hydrological hazards, floods, and droughts by exploring extreme hydroclimatic phenomena in river basins”.

Conflicts of Interest

The authors declare no conflict of interest.

References

  1. Abd-Elhamid, H.F.; Abd-Elaty, I.M.; Sherif, M.M. Evaluation of potential impact of Grand Ethiopian Renaissance Dam on Seawater Intrusion in the Nile Delta Aquifer. Int. J. Environ. Sci. Technol. 2019, 16, 2321–2332. [Google Scholar] [CrossRef]
  2. Sherif, M.M.; Sefelnasr AEbraheem, A.; Javad, A. Quantitative and qualitative assessment of seawater intrusion in Wadi Ham under different pumping scenarios. J. Hydrol. Eng. 2014, 9, 855–866. [Google Scholar] [CrossRef]
  3. IPCC (Intergovernmental Panel on Climate Change). Climate Change 2007: Impacts, Adaptation and Vulnerability, Contribution of Working Group II to the Fourth Assessment Report of the Intergovern-Mental Panel on Climate Change; Parry, M.L., Canziani, O.F., Palutikof, J.P., van der Linden, P.J., Hanson, C.E., Eds.; Cambridge University Press: Cambridge, UK, 2007. [Google Scholar]
  4. Chang, S.W.; Clement, T.P.; Simpson, M.J.; Lee, K.K. Does sea-level rise have an impact on saltwater intrusion? Av. Water Resour. 2011, 34, 1283–1291. [Google Scholar] [CrossRef] [Green Version]
  5. Kuan, W.K.; Jin, G.; Xin, P.; Robinson, C.; Gibbes, B.; Li, L. Tidal influence on seawater intrusion in unconfined coastal aquifers. Water Resour. Res. 2012, 48, 1–11. [Google Scholar] [CrossRef] [Green Version]
  6. Masterson, J.P.; Garabedian, S.P. Effects of sea-level rise on groundwater flow in a coastal aquifer system. Ground Water 2007, 45, 209–217. [Google Scholar] [CrossRef] [PubMed]
  7. Sefelnasr, A.; Sherif, M.M. Impacts of seawater rise on seawater intrusion in the Nile Delta Aquifer, Egypt. Groundwater 2014, 52, 264–276. [Google Scholar] [CrossRef]
  8. Ketabchi, H.; Mahmoodzadeh, D.; Ataie-Ashtiani, B.; Simmons, C.T. Sea-level rise impacts on seawater intrusion in coastal aquifers: Review and integration. J. Hydrol. 2016, 535, 235–255. [Google Scholar] [CrossRef]
  9. Oude Essink, G.H.P.; van Baaren, E.S.; de Louw, P.G.B. Effects of climate change on coastal groundwater systems: A modeling study in the Netherlands. Water Recourses Res. 2010, 46, 1–16. [Google Scholar] [CrossRef]
  10. Rozell, D.J.; Wong, T.-F. Effects of climate change on ground-water resources at Shelter Island, New York State, USA. Hydrogeol. J. 2010, 18, 1657–1665. [Google Scholar] [CrossRef]
  11. Sherif, M.M.; Singh, V.P. Groundwater Development and Sustainability in the Nile Delta Aquifer. Final. Rep. Submitt. Binatl. Fulbright Comm. Egypt 1997. [Google Scholar]
  12. Werner, A.D.; Simmons, C.T. Impact of sea-level rise on sea water intrusion in coastal aquifers. Ground Water 2009, 47, 197–204. [Google Scholar] [CrossRef]
  13. Abd-Elhamid, H.F.; Javadi, A.A. Impact of Sea Level Rise and Over-pumping on Seawater Intrusion in Coastal Aquifers. J. Water Clim. Chang. 2011, 2, 19–28. [Google Scholar] [CrossRef]
  14. Morgan, L.K.; Bakker, M.; Werner, A.D. Occurrence of seawater intrusion overshoot. Water Resour. Research. 2015, 51, 1989–1999. [Google Scholar] [CrossRef] [Green Version]
  15. Abd-Elaty, I.; Zeleňáková, M.; Krajníková, K.; Abd-Elhamid, H.F. Analytical Solution of Saltwater Intrusion in Costal Aquifers Considering Climate Changes and Different Boundary Conditions. Water 2021, 13, 995. [Google Scholar] [CrossRef]
  16. Yang, J.; Graf, T.; Ptak, T. Sea level rise and storm surge effects in a coastal heterogeneous aquifer: A 2D modelling study in northern Germany. Groundwater 2015, 20, 39–51. [Google Scholar] [CrossRef]
  17. Abd-Elaty, I.; Abd-Elhamid, H.F.; Qahman, K. Coastal Aquifer Protection from Saltwater Intrusion Using Abstraction of Brackish Water and Recharge of Treated Wastewater: Case Study of the Gaza Aquifer. J. Hydrol. Eng. 2020, 25, 05020012. [Google Scholar] [CrossRef]
  18. Abd-Elaty, I.; Javadi, A.; Abd-Elhamid, H. Management of saltwater intrusion in coastal aquifers using different wells systems: A case study of the Nile Delta aquifer in Egypt. Hydrogeol. J. 2021, 29, 1767–1783. [Google Scholar] [CrossRef]
  19. Abd-Elaty, I.; Straface, S.; Kuriqi, A. Sustainable Saltwater Intrusion Management in Coastal Aquifers under Climatic Changes for Humid and Hyper-Arid Regions. Ecol. Eng. 2021, 171, 106382. [Google Scholar] [CrossRef]
  20. Roger, L.J.; Kazuro, M.; Kei, N. Laboratory-scale saltwater behavior due to subsurface cutoff wall. J. Hydrol. 2009, 377, 227–236. [Google Scholar]
  21. Roger, L.J.; Kazuro, M.; Kei, N. Effects of artificial recharge and flow barrier on seawater intrusion. Ground Water 2010, 49, 239–249. [Google Scholar]
  22. Goswami, R.; Clement, T.P. Laboratory Scale Investigation of Saltwater Intrusion Dynamics. Water Resour. Res. 2007, 43, 1–11. [Google Scholar] [CrossRef]
  23. Chang, S.W.; Clement, T.P. Laboratory and Numerical Investigation of Transport Processes Occurring Above and within a Saltwater wedge. J. Contam. Hydrol. 2013, 147, 14–24. [Google Scholar] [CrossRef] [PubMed]
  24. Tanapol, S.; Chaowarin, W.; Decho, P.; Kittitep, F. Physical model simulations of seawater intrusion in unconfined aquifer. J. Sci. Technol. 2012, 34, 679–687. [Google Scholar]
  25. Morgan, L.K.; Stoeckl, L.; Werner, A.D.; Post, V.E. An assessment of seawater intrusion overshoot using physical and numerical modeling. Water Resour. Res. 2013, 49, 6522–6526. [Google Scholar] [CrossRef]
  26. Acosta, A.B.; Donado, L.D. Laboratory scale simulation of hydraulic barriers to seawater intrusion in confined coastal aquifers considering the effects of stratification, The 7th Groundwater Symposium of the International Association for Hydro-Environment Engineering and Research (IAHR). Proc. Environ. Sci. 2015, 25, 36–43. [Google Scholar]
  27. Abd-Elhamid, H.F.; Abd-Elaty, I.; Hussain, M.S. Mitigation of seawater intrusion in coastal aquifers using coastal earth fill considering future sea level rise. Environ. Sci. Pollut. Res. 2020, 27, 23234–23245. [Google Scholar] [CrossRef] [PubMed]
  28. Abd-Elaty, I.; Said, A.M.; Abdelaal, G.M.; Zeleňáková, M.; Jandora, J.; Abd-Elhamid, H.F. Assessing the Impact of Lining Polluted Streams on Groundwater Quality: A Case Study of the Eastern Nile Delta Aquifer, Egypt. Water 2021, 13, 1705. [Google Scholar] [CrossRef]
  29. Langevin, C.D.; Thorne, D.T.; Dausman, A.M., Jr.; Sukop, M.C.; Guo, W. SEAWAT Version 4: A Computer Program for Simulation of Multi-Species Solute and Heat Transport; U.S. Geological Survey Techniques and Methods: Tallahassee, FL, USA, 2008; Book 6, Chapter A22; p. 39.
  30. Guo, W.; Bennett, G.D. Simulation of Saline/Fresh Water Flows Using Modflow; Poeter, E., Ed.; MODFLOW ’98 Conference, Golden, Colorado, Proceedings; Missimer International, Inc.: Golden, CO, USA, 1998; Volume 1, pp. 267–274. [Google Scholar]
  31. Guo, W.; Langevin, C.D. User’s Guide to SEAWAT: A Computer Program for Simulation of Three-Dimensional Variable-Density Groundwater Flow. In US Geological Survey Techniques of Water Resources Investigations 6-A7; US Geological Survey: Tallahassee, FL, USA, 2002. [Google Scholar]
  32. Langevin, C.D.; Shoemaker, W.B.; Guo, W. MOD FLOW-2000, the U.S. In Geological Survey Modular Ground-Water Model–Documentationof the SEAWAT-2000 Version with the Variable-Density Flow Process (VDF) and the Integrated MT3DMS Transport Process (IMT), USGS Open File Report 03-426; US Geological Survey: Tallahassee, FL, USA, 2003. [Google Scholar]
  33. Abd-Elaty, I.; Ghanayem, H.M.; Zeleňáková, M.; Mésároš, P.; Saleh, O.K. Numerical Investigation for Riverbank Filtration Sustainability Considering Climatic Changes in Arid and Semi-Arid Regions; Case Study of RBF Site at Embaba, Nile Delta, Egypt. Sustainability 2021, 13, 1897. [Google Scholar] [CrossRef]
  34. Langevin, C.D. Simulation of Ground-Water Discharge to Biscayne Bay, Southeastern Florida. In U.S. Geological Survey, Water-Resources Investigations Report 00-4251; US Geological Survey: Tallahassee, FL, USA, 2001. [Google Scholar]
Figure 1. The flow tank used in the experimental study.
Water 14 00631 g001
Figure 2. Schematic diagram of the experimental model.
Water 14 00631 g002
Figure 3. Definition sketch of the numerical model.
Water 14 00631 g003
Figure 4. Results of base case (scenario 1) for (a) experimental model and (b) the numerical model.
Water 14 00631 g004
Figure 5. Location and cross section of Biscayne aquifer with boundary conditions for head and concentration [34].
Water 14 00631 g005aWater 14 00631 g005b
Figure 6. Concentration distribution in Biscayne aquifer [30].
Water 14 00631 g006
Figure 7. Results of the experimental model for the different scenarios.
Water 14 00631 g007
Figure 8. Results of the numerical model for different scenarios.
Water 14 00631 g008
Figure 9. Comparison between experimental and numerical results.
Water 14 00631 g009
Figure 10. Equi-concentration line 17,500 ppm under different conditions.
Water 14 00631 g010
Figure 11. Change in freshwater and saline water volume at the Biscayne aquifer.
Water 14 00631 g011
Table 1. Hydraulic parameters used in the numerical model.
ParameterValuesUnits
Porosity (n)0.30Dimensionless
Inland Freshwater head 0.312(m)
Saltwater head (hs)0.30(m)
Freshwater density (ρf)1000(kg/m3)
Saltwater density (ρs)1025(kg/m3)
Freshwater concentration (Cf)200(mg/L)
Saltwater concentration (Cs)35,000(mg/L)
Hydraulic conductivity (k)28.50(m/day)
Specific Storage1 × 10−5(1/m)
Longitudinal dispersivity (αL)0.50(cm)
Transverse dispersivity (αT)0.05(cm)
Molecular diffusion coefficient (D*)0(m2/day)
Table 2. Comparison between experimental and numerical results.
CaseScenarioFreshwater Level (cm)Seawater Level (cm)Intrusion LengthDifference (cm)
ExperimentalNumerical
Base131.203014.2515.501.25
One231.2030.3021.7522.500.75
331.2030.6030.7532.501.75
431.2030.9040.5041.250.75
Two530.903021.2521.750.50
630.60303031.501.50
730.303039.5040.751.25
Three830.9030.3030.5031.751.25
930.6030.6054.5056.502.00
1030.3030.906058.50−1.50
Table 3. Freshwater and saline water volume per km width of Biscayne aquifer.
ScenarioSaline Water Volume (m3/km\)Freshwater Water Volume (m3/km\)Losses of Freshwater Volume (m3/km\)
Current conditions5,617,5028,766,758-
One6,109,1588,275,102491,656
Two5,966,3128,417,948348,810
Three6,451,3247,932,936833,822
Publisher’s Note: MDPI stays neutral with regard to jurisdictional claims in published maps and institutional affiliations.

